summary of vital statistics 2018 the city ... - new …
TRANSCRIPT

SUMMARY OF VITAL STATISTICS 2018THE CITY OF NEW YORK
Bureau of Vital Statistics, New York City Department of Health and Mental Hygiene125 Worth Street, CN 7, New York, New York, 10013
010
2030
4050
60
1800
1810
1820
1830
1840
1850
1860
1870
1880
1890
1900
1910
1920
1930
1940
1950
1960
1970
1980
1990
2000
2010
2018
Deat
hs p
er 1
,000
Pop
ulat
ion
119,734 242,278 696,115 1,478,103 2,507,414 4,766,883 6,930,446 7,891,957 7,894,862 7,322,564 8,175,133FORMER CITIES OF NEW YORK & BROOKLYN GREATER CITY OF NEW YORK
1805 YELLOW FEVER270
66.5
77.5
88.5
9
1999
2000
2001
2002
2003
2004
2005
2006
2007
THE IMPACT OF WTC DISASTER DEATHS ON NEW YORK CITY'S DEATH RATE
The Conquest of Pestilence in New York City ...As Shown by the Death Rate as Recorded in the Official Records of the Department of Health and Mental Hygiene.
POPULATION OLD CITY OF NEW YORK
1866 BOARD OF HEALTH
and present
HEALTH DEPARTMENT ESTABLISHED
1842 CROTON AQUEDUCT OPENED
1804 SMALL POX
169
1822 YELLOW FEVER 166
1824 SMALL POX 394
1832 CHOLERA
3513
1836-1837 MEASLES
443 SCARLET FEVER
579
1834 SMALL POX
233 CHOLERA
971
1849 CHOLERA 5071
1907 CONTROL OF TYPHOID CARRIERS
1910 CHLORINATION OF WATER
1911 MILK STATIONS FOR BABIES INAUGURATED
1912 PASTEURIZATION OF MILK
1854 CHOLERA 2509
1865 SMALL POX 664
1866 CHOLERA 1137
1851 SMALL POX 562
1870 YELLOW FEVER
9 1872 SMALL POX 1666
1875 SMALL POX 1899
1887 DIPHTHERIA 4509
1892 TYPHUS FEVER
200 SMALL POX
302 CHOLERA
9
1901 - 1902 SMALL POX 410 AND 310 LAST EPIDEMIC
1904 MENINGITIS 2219
1918 INFLUENZA 12,562
1994 HIV 7102
2001 WORLD TRADE CENTER DISASTER 2747
1881 SMALL POX 503
ALL DEATHS
EXCLUDING 2,747 WTC DEATHS

Bill de Blasio, Mayor Dave A. Chokshi, MD, MSc, Commissioner
SUMMARY OF VITAL STATISTICS 2018THE CITY OF NEW YORK
New York City Department of Health and Mental Hygiene
Division of EpidemiologyCharon Gwynn, PhD, Deputy Commissioner
Bureau of Vital StatisticsGretchen Van Wye, PhD, MA, Assistant Commissioner, Registrar
Flor Betancourt, MA, Director, Office of Vital Records DocumentationJessica Borrelli, MPH, Director, Office of Integrated Electronic Records
Mary Huynh, PhD, Director, Office of Vital StatisticsMilton Mino, Director, Office of Vital Records Services
Wenhui Li, PhD, Director, Statistical Analysis and Reporting UnitMuriel Silin, MPH, Director, Quality Improvement Unit
December 2020
This reporT was prepared by The deparTmenT of healTh and menTal hygiene, office of ViTal sTaTisTics sTaff under The direcTion of wenhui li, phd and mary huynh, phd.
suggesTed ciTaTion: li w, onyebeke c, huynh m, casTro a, falci l, gurung s, leVy d, kennedy J, maduro g, sun y, and Van wye g. Summary of Vital StatiSticS, 2018. new york, ny: new york ciTy deparTmenT of healTh and menTal hygiene, bureau of ViTal sTaTisTics, 2020.
This publicaTion is aVailable online aT hTTps://www1.nyc.goV/asseTs/doh/downloads/pdf/Vs/2018sum.pdf.

TABLE OF CONTENTS
3
Page(s) Letter from the Commissioner ......................................................................................................................................................... 7
Key Findings ................................................................................................................................................................................... 8
life expecTancy ...................................................................................................................................................................... 9-10 Figure 1. Life Expectancy at Birth, Overall and by Sex, New York City, 2009-2018 ...................................................................... 9 Figure 2. Life Expectancy at Birth by Racial/Ethnic Group, New York City, 2009-2018 ................................................................. 9 Figure 3. Life Expectancy at Birth by Neighborhood Poverty, New York City, 2009 and 2018 ...................................................... 9 Figure 4. Life Expectancy at Birth by Community District, New York City, 2009-2018 ............................................................... 10
morTaliTy .............................................................................................................................................................................. 11-23ciTywide/neighborhood morTaliTy ........................................................................................................................................ 11-12 Figure 5. Age-adjusted Death Rates, Overall and by Sex, New York City, 2009-2018 ................................................................. 11 Figure 6. Age-adjusted Death Rates by Racial/Ethnic Group, New York City, 2009-2018 ............................................................ 11 Figure 7. Age-adjusted Death Rates by Neighborhood Poverty, New York City Residents, 2009 and 2018 ................................. 11 Figure 8. Age-adjusted Death Rates by Community District of Residence, New York City, 2018 ................................................ 12leading causes of deaTh .......................................................................................................................................................... 13-15 Figure 9. Leading Causes of Death, New York City, 2000, 2009, and 2018 ................................................................................ 13 Table 1. Leading Causes of Death by Sex, New York City, 2018 ............................................................................................... 14 Table 2. Leading Causes of Death by Racial/Ethnic Group, New York City, 2018 ...................................................................... 15premaTure deaTh .........................................................................................................................................................................16-21 Figure 10. Leading Causes of Premature Death (Age <65 years), New York City, 2000, 2009, and 2018 .................................................................................................................. 16 Table 3. Leading Causes of Premature Death (Age <65 years) by Sex, New York City, 2018 ................................................... 17 Table 4. Leading Causes of Premature Death (Age <65 years) by Racial/Ethnic Group, New York City, 2018 ......................... 18 Figure 11. Age-adjusted Premature Death (Age <65 years) Rates, Overall and by Sex, New York City, 2009-2018 ..................... 19 Figure 12. Age-adjusted Premature Death (Age <65 years) Rates by Racial/Ethnic Group, New York City, 2009-2018 ................ 19 Figure 13. Age-adjusted Premature Death (Age <65 years) Rates by Neighborhood Poverty, New York City Residents, 2009 and 2018 ...................................................................................................................................................... 19 Figure 14. Age-adjusted Premature Death (Age <65 years) Rates by Community District of Residence, New York City, 2018 ..... 20 Figure 15. Leading Causes of Premature Death (Age <65 years), New York City, 2009-2018 ...................................................... 21 Figure 16. Leading Causes of Premature Cancer Deaths (Age <65 years), New York City, 2009-2018 ......................................... 21 Figure 17. Leading Causes of Premature Heart Disease Deaths (Age <65 years), New York City, 2009-2018 ............................... 21
exTernal causes of deaTh ........................................................................................................................................................ 22-23 Figure 18. Crude Death Rates for External Causes of Death, New York City, 2009-2018............................................................... 22 Figure 19. Crude Death Rates for Selected Accidental Causes of Death, New York City, 2009-2018............................................ 22 Figure 20. Age-specific Suicide Death Rates, New York City, 2009-2018 ...................................................................................... 22 Figure 21. Age-adjusted Homicide Death Rates (Five-Year Averages) by Community District of Residence, New York City, 2014-2018 ................................................................................................................................. 23
special secTion..................................................................................................................................................................... 24-28 Overview...................................................................................................................................................................................... 24 Figure S1. Age-adjusted Drug-related Death Rates, Overall and by Sex, New York City, 2009-2018.............................................. 25 Figure S2. Age-adjusted Drug-related Death Rates by Racial/Ethnic Group, New York City, 2009-2018......................................... 25 Figure S3. Age-adjusted Drug-related Death Rates by Neighborhood Poverty, New York City, 2009 and 2018.............................. 26 Figure S4. Age-adjusted Drug-related Death Rates by Borough of Residence, New York City, 2009-2018...................................... 26 Figure S5. Age-specific Drug-related Death Rates, Ages 18-64, New York City, 2009-2018........................................................... 27 Figure S6. Age-adjusted Drug-related Death Rates (Three-Year Averages) by Community District of Residence, New York City, 2016-2018 ................................................................................................................................ 28
infanT morTaliTy............................................................................................................................................................... 29-34 Figure 1. Infant Mortality Rate, New York City and the United States, 2009-2018 ...................................................................... 29 Figure 2. Infant Mortality Rate by Mother’s Racial/Ethnic Group, New York City, 2009-2018 .................................................... 30 Figure 3. Infant Mortality Rate by Neighborhood Poverty, New York City Residents, 2009 and 2018 ........................................ 30
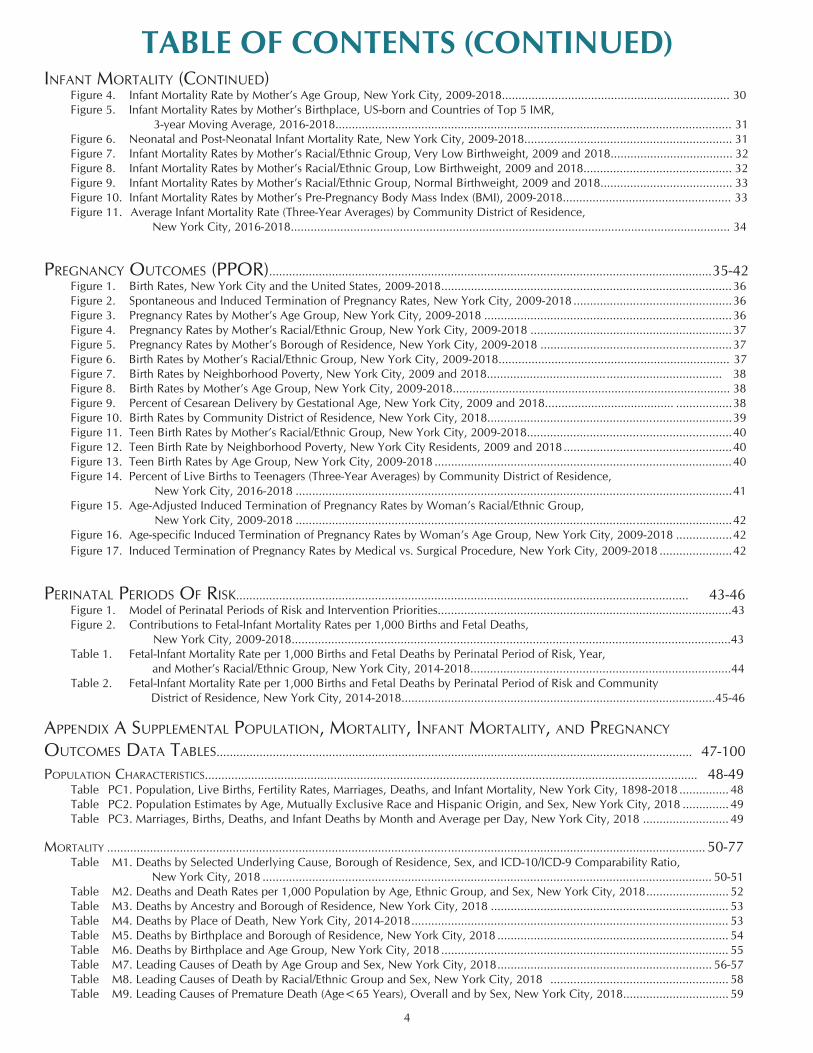
4
TABLE OF CONTENTS (CONTINUED)infanT morTaliTy (conTinued) Figure 4. Infant Mortality Rate by Mother’s Age Group, New York City, 2009-2018..................................................................... 30 Figure 5. Infant Mortality Rates by Mother’s Birthplace, US-born and Countries of Top 5 IMR, 3-year Moving Average, 2016-2018........................................................................................................................ 31 Figure 6. Neonatal and Post-Neonatal Infant Mortality Rate, New York City, 2009-2018............................................................... 31 Figure 7. Infant Mortality Rates by Mother’s Racial/Ethnic Group, Very Low Birthweight, 2009 and 2018..................................... 32 Figure 8. Infant Mortality Rates by Mother’s Racial/Ethnic Group, Low Birthweight, 2009 and 2018............................................. 32 Figure 9. Infant Mortality Rates by Mother’s Racial/Ethnic Group, Normal Birthweight, 2009 and 2018........................................ 33 Figure 10. Infant Mortality Rates by Mother’s Pre-Pregnancy Body Mass Index (BMI), 2009-2018................................................... 33 Figure 11. Average Infant Mortality Rate (Three-Year Averages) by Community District of Residence, New York City, 2016-2018..................................................................................................................................... 34
pregnancy ouTcomes (ppor)......................................................................................................................................35-42 Figure 1. Birth Rates, New York City and the United States, 2009-2018 ........................................................................................36 Figure 2. Spontaneous and Induced Termination of Pregnancy Rates, New York City, 2009-2018 ................................................36 Figure 3. Pregnancy Rates by Mother’s Age Group, New York City, 2009-2018 ...........................................................................36 Figure 4. Pregnancy Rates by Mother’s Racial/Ethnic Group, New York City, 2009-2018 .............................................................37 Figure 5. Pregnancy Rates by Mother’s Borough of Residence, New York City, 2009-2018 ..........................................................37 Figure 6. Birth Rates by Mother’s Racial/Ethnic Group, New York City, 2009-2018...................................................................... 37 Figure 7. Birth Rates by Neighborhood Poverty, New York City, 2009 and 2018.................................... ................................... 38 Figure 8. Birth Rates by Mother’s Age Group, New York City, 2009-2018.................................................................................... 38 Figure 9. Percent of Cesarean Delivery by Gestational Age, New York City, 2009 and 2018....................................... .................38 Figure 10. Birth Rates by Community District of Residence, New York City, 2018..........................................................................39 Figure 11. Teen Birth Rates by Mother’s Racial/Ethnic Group, New York City, 2009-2018..............................................................40 Figure 12. Teen Birth Rate by Neighborhood Poverty, New York City Residents, 2009 and 2018 ...................................................40 Figure 13. Teen Birth Rates by Age Group, New York City, 2009-2018 ..........................................................................................40 Figure 14. Percent of Live Births to Teenagers (Three-Year Averages) by Community District of Residence, New York City, 2016-2018 ....................................................................................................................................41 Figure 15. Age-Adjusted Induced Termination of Pregnancy Rates by Woman’s Racial/Ethnic Group, New York City, 2009-2018 ....................................................................................................................................42 Figure 16. Age-specific Induced Termination of Pregnancy Rates by Woman’s Age Group, New York City, 2009-2018 .................42 Figure 17. Induced Termination of Pregnancy Rates by Medical vs. Surgical Procedure, New York City, 2009-2018 ......................42
perinaTal periods of risk......................................................................................................................................... 43-46 Figure 1. Model of Perinatal Periods of Risk and Intervention Priorities.........................................................................................43 Figure 2. Contributions to Fetal-Infant Mortality Rates per 1,000 Births and Fetal Deaths, New York City, 2009-2018.....................................................................................................................................43 Table 1. Fetal-Infant Mortality Rate per 1,000 Births and Fetal Deaths by Perinatal Period of Risk, Year, and Mother’s Racial/Ethnic Group, New York City, 2014-2018...............................................................................44 Table 2. Fetal-Infant Mortality Rate per 1,000 Births and Fetal Deaths by Perinatal Period of Risk and Community District of Residence, New York City, 2014-2018...............................................................................................45-46
appendix a supplemenTal populaTion, morTaliTy, infanT morTaliTy, and pregnancy ouTcomes daTa Tables................................................................................................................................................ 47-100
populaTion characTerisTics..................................................................................................................................................... 48-49 Table PC1. Population, Live Births, Fertility Rates, Marriages, Deaths, and Infant Mortality, New York City, 1898-2018 ............... 48 Table PC2. Population Estimates by Age, Mutually Exclusive Race and Hispanic Origin, and Sex, New York City, 2018 .............. 49 Table PC3. Marriages, Births, Deaths, and Infant Deaths by Month and Average per Day, New York City, 2018 .......................... 49
morTaliTy ..................................................................................................................................................................................... 50-77 Table M1. Deaths by Selected Underlying Cause, Borough of Residence, Sex, and ICD-10/ICD-9 Comparability Ratio, New York City, 2018 ........................................................................................................................................ 50-51 Table M2. Deaths and Death Rates per 1,000 Population by Age, Ethnic Group, and Sex, New York City, 2018 ......................... 52 Table M3. Deaths by Ancestry and Borough of Residence, New York City, 2018 ........................................................................ 53 Table M4. Deaths by Place of Death, New York City, 2014-2018 ................................................................................................ 53 Table M5. Deaths by Birthplace and Borough of Residence, New York City, 2018 ...................................................................... 54 Table M6. Deaths by Birthplace and Age Group, New York City, 2018 ....................................................................................... 55 Table M7. Leading Causes of Death by Age Group and Sex, New York City, 2018 ................................................................. 56-57 Table M8. Leading Causes of Death by Racial/Ethnic Group and Sex, New York City, 2018 ...................................................... 58 Table M9. Leading Causes of Premature Death (Age<65 Years), Overall and by Sex, New York City, 2018 ................................ 59

5
TABLE OF CONTENTS (CONTINUED)morTaliTy (conTinued) Table M10. Leading Causes of Premature Death (Age <65 Years) by Racial/Ethnic Group and Sex, New York City, 2018 ........ 60 Table M11. Deaths and Death Rates per 100,000 Population from Selected Underlying Causes, Overall and by Ethnic Group and Sex, New York City, 2018. ............................................................................................... 61 Table M12. Deaths and Death Rates per 100,000 Population from Selected Underlying Causes by Community District of Residence, New York City, 2018 .......................................................................... 62-63 Table M13. Deaths and Crude Death Rates per 100,000 Population for Selected Causes, New York City, 1901-2018 .......... 64-65 Table M14. Alcohol-attributable Deaths Due to Excessive Alcohol Use, Age ≥ 20 Years, New York City, 2016-2018 .............. 66 Table M15. Smoking-attributable Deaths and Age-adjusted Death Rates, Age ≥ 35 Years, New York City, 2015-2018 ........................................................................................................................... 67 Table M16. Deaths From HIV Disease, Overall and by Sex, Age Group, and Racial/Ethnic Group, New York City, 1983-2018 ...................................................................................................................... 68-69 Table M17. Selected Characteristics of Deaths Due to Fatal Occupational Injuries, New York City, 2018 .................................. 70 Table M18. Deaths Due to Accidents, Overall and by Age Group and Sex, New York City, 2018 .............................................. 71 Table M19. Deaths Due to Intentional Self-harm (Suicide), Overall and by Age Group and Sex, New York City, 2018 .............. 72 Table M20. Deaths Due to Assault (Homicide) and Legal Intervention, Overall and by Age Group and Sex, New York City, 2018 .................................................................................................................................. ..72 Table M21. Deaths Due to Events of Undetermined Intent, Overall and by Age Group and Sex, New York City, 2018 ........... ..73 Table M22. Deaths Due to Complications of Medical and Surgical Care, Overall and by Age Group and Sex, New York City, 2018 ................................................................................................................................... 73 Table M23. Deaths Due to Firearms (All Causes), Overall and by Age Group and Sex, New York City, 2018 ............................ 73 Table M24. Life Expectancy at Specified Ages, Overall and by Sex and Racial/Ethnic Group, New York City, 1999-2001 and 2009-2011 ........................................................................................................................... 74 Table M25. Life Expectancy at Specified Ages, Overall and by Sex, New York City, 2009-2018 ................................................ 75 Table M26. Years of Potential Life Lost (YPLL) Before Age 75, Overall and by Sex and Selected Causes of Death, New York City, 2018 .................................................................................................................................... 76 Table M27. Death Rates by Poverty Level Indicator, New York City, 2009 and 2018 ................................................................ 76 Table M28. Leading Causes of Death, New York City, 2009, 2017, and 2018 ........................................................................... 77
infanT morTaliTy ............................................................................................................................................. 78-83 Table IM1. Infant Deaths by Cause, Sex, and Age, New York City, 2018 ................................................................................... 78 Table IM2. Live Births and Infant Deaths by Mother’s Racial/Ethnic Group and Characteristics of Infant, New York City, 2018 .................................................................................................................................... 79 Table IM3. Infant Mortality Rate by Mother’s Racial/Ethnic Group and Characteristics of Infant, New York City, 2018 .............. 79 Table IM4. Live Births and Infant Mortality, Overall and by Mother’s Racial/Ethnic Group, New York City, 2014-2018 ............ 80 Table IM5. Infant Mortality Rate by Mother’s Birthplace, New York City, 2012-2018 ................................................................ 81 Table IM6. Infant and Neonatal Mortality Rates by Community District of Residence, New York City, 2014-2018 .................... 82 Table IM7. Live Births and Infant Mortality Rate by Characteristics of Mother and Infant, New York City, 2018 ........................ 83
pregnancy ouTcomes .................................................................................................................................................................84-100 Table PO1. Live Births by Borough of Birth and Institution, New York City, 2018 ...................................................................... 84 Table PO2. Live Births by Mother’s Ancestry and Borough of Residence, New York City, 2018 ................................................. 85 Table PO3. Live Births by Mother’s Racial/Ethnic Group and Age Group, New York City, 2018 ................................................ 85 Table PO4. Selected Characteristics of Live Births, Overall and by Mother’s Age Group, New York City, 2018 ......................... 86 Table PO5. Selected Characteristics of Live Births by Mother’s Racial/Ethnic Group, New York City, 2018 ............................... 87 Table PO6. Live Births by Selected Characteristics and Mother’s Ancestry, New York City, 2018 .............................................. 88 Table PO7. Live Births by Selected Characteristics and Community District of Residence, New York City, 2018 ....................... 89 Table PO8. Live Births by Mother’s Birthplace and Borough of Residence, New York City, 2018 .............................................. 90 Table PO9. Live Births by Mother’s Birthplace and Age Group, New York City, 2018 ............................................................... 90 Table PO10. Live Births and Pregnancy Rates to Teenagers (Age 15-19 Years) by Racial/Ethnic Group and Borough of Residence, New York City, 2018 .................................................................................................................................... 91 Table PO11. Live Births to Teenagers (Age<20 Years), Overall and by Selected Characteristics, New York City, 2014-2018 ...... 92 Table PO12. Live Births to Teenagers (Age<20 Years) by Selected Characteristics and by Community District of Residence, New York City, 2016-2018 ........................................................................................................................... 93 Table PO13. Live Births, Spontaneous Terminations, and Induced Terminations of Pregnancy, Overall and by Borough of Residence and Woman’s Age Group, New York City, 2018 ....................................................... 94 Table PO14 Spontaneous Terminations of Pregnancy by Gestational Age and Woman’s Age Group, New York City, 2018 ........ 95 Table PO15. Selected Characteristics of Spontaneous Terminations of Pregnancy, ≥28 Weeks Gestation, Overall and by Woman’s Age Group, New York City, 2018 ................................................................................................. 95 Table PO16. Selected Characteristics of Spontaneous Terminations of Pregnancy, ≥28 Weeks Gestation, Overall and by Woman’s Racial/Ethnic Group, New York City, 2018 ................................................................................... 96 Table PO17. Live Births, Spontaneous Terminations of ≥ 28 Weeks Gestation, and Induced Terminations of Pregnancy by Borough of Residence and Occurrence, New York City, 2018 ...................................................................... 96

6
TABLE OF CONTENTS (CONTINUED)pregnancy ouTcomes (conTinued) Table PO18. Induced Terminations of Pregnancy by Selected Characteristics and Woman’s Age Group, New York City, 2018 .................................................................................................................................... 97 Table PO19. Induced Terminations of Pregnancy by Woman’s Marital Status, Age Group, and Racial/Ethnic Group, New York City, 2014-2018 ........................................................................................................................... 97 Table PO20. Characteristics of Birth and Pregnancy Outcomes by Neighborhood Poverty, New York City, 2009 and 2018 ........ 98 Table PO21. Pregnancy Outcomes, Pregnancy Outcome Rates, and Pregnancy Rates by Woman’s Age Group, Racial/Ethnic Group, and Borough of Residence, New York City, 2018 ........................................................ 99 Table PO22. Most Popular Baby Names by Sex, New York City, Selected Years ........................................................................ 100 Table PO23. Most Popular Baby Names by Sex and Mother’s Racial/Ethnic Group, New York City, 2018 ................................. 100
appendix b Technical noTes and new york ciTy ViTal eVenT cerTificaTes .................................101-128 Technical Notes, 2018 ............................................................................................................................................................ 102-117 Map of Community Districts and Boroughs, New York City ............................................................................................................ 105 Certificates .............................................................................................................................................................................118-128
7
NEW YORK CITY DEPARTMENT OF
HEALTH AND MENTAL HYGIENE
Dave A. Chokshi, MD, MSc
Commissioner
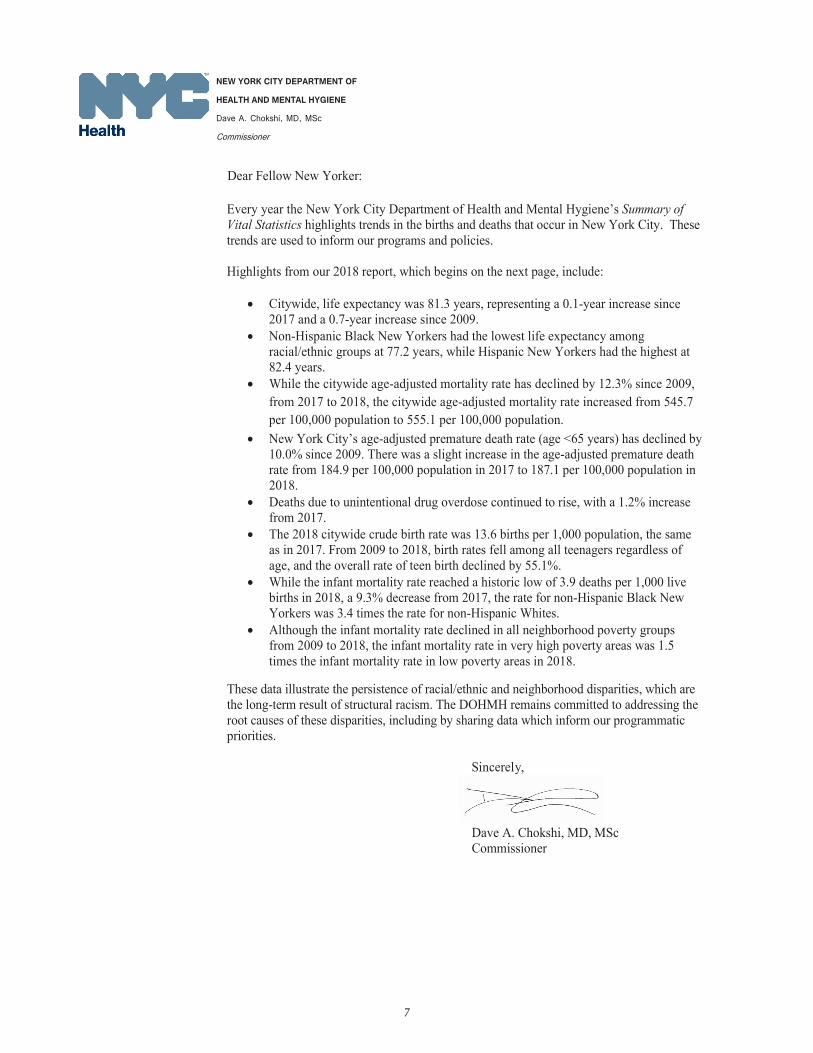
Dear Fellow New Yorker: Every year the New York City Department of Health and Mental Hygiene’s Summary of Vital Statistics highlights trends in the births and deaths that occur in New York City. These trends are used to inform our programs and policies.
Highlights from our 2018 report, which begins on the next page, include:
• Citywide, life expectancy was 81.3 years, representing a 0.1-year increase since 2017 and a 0.7-year increase since 2009.
• Non-Hispanic Black New Yorkers had the lowest life expectancy among racial/ethnic groups at 77.2 years, while Hispanic New Yorkers had the highest at 82.4 years.
• While the citywide age-adjusted mortality rate has declined by 12.3% since 2009, from 2017 to 2018, the citywide age-adjusted mortality rate increased from 545.7 per 100,000 population to 555.1 per 100,000 population.
• New York City’s age-adjusted premature death rate (age <65 years) has declined by 10.0% since 2009. There was a slight increase in the age-adjusted premature death rate from 184.9 per 100,000 population in 2017 to 187.1 per 100,000 population in 2018.
• Deaths due to unintentional drug overdose continued to rise, with a 1.2% increase from 2017.
• The 2018 citywide crude birth rate was 13.6 births per 1,000 population, the same as in 2017. From 2009 to 2018, birth rates fell among all teenagers regardless of age, and the overall rate of teen birth declined by 55.1%.
• While the infant mortality rate reached a historic low of 3.9 deaths per 1,000 live births in 2018, a 9.3% decrease from 2017, the rate for non-Hispanic Black New Yorkers was 3.4 times the rate for non-Hispanic Whites.
• Although the infant mortality rate declined in all neighborhood poverty groups from 2009 to 2018, the infant mortality rate in very high poverty areas was 1.5 times the infant mortality rate in low poverty areas in 2018.
These data illustrate the persistence of racial/ethnic and neighborhood disparities, which are the long-term result of structural racism. The DOHMH remains committed to addressing the root causes of these disparities, including by sharing data which inform our programmatic priorities.
Sincerely,
Dave A. Chokshi, MD, MSc Commissioner

8
KEY FINDINGSLife Expectancy at Birth
• New York City’s life expectancy at birth in 2018 was 81.3 years, increasing by 0.1 years since 2017, and increasing by 0.7 years since 2009.
• The New York City 2018 life expectancy at birth was 82.4 years among Hispanics, 81.3 years among non-Hispanic Whites, and 77.2 years among non-Hispanic Blacks. From 2009 to 2018, life expectancy increased by 0.7 years among Hispanics, 0.4 years among non-Hispanic Whites, and 0.6 years among non-Hispanic Blacks.
Mortality• The citywide age-adjusted death rate increased over the past year, from 545.7 per 100,000 population in
2017, to 555.1 in 2018 (a 1.7% increase). From 2017 to 2018, the age-adjusted death rate increased among Hispanics by 2.2%, among non-Hispanic Blacks by 3.1%, among non-Hispanic Whites by 0.3%, and among Asians and Pacific Islanders by 1.4%. The increase of rates was partially due to the 2.6% population decrease from 2017 to 2018.
• Over the past ten years, the citywide age-adjusted death rate decreased by 12.3%. Between 2009 and 2018, the age-adjusted death rates decreased by 9.1% among non-Hispanic Blacks, by 11.4% among Hispanics, by 13.8% among non-Hispanic Whites, and by 5.6% among Asians and Pacific Islanders.
• The citywide age-adjusted premature mortality rate increased over the past year, from 184.9 per 100,000 population in 2017 to 187.1 in 2018 (1.2% increase), an increase that was partially due to the 3.2% population decrease among those under the age of 65, from 2017 to 2018. From 2017 to 2018, the age-adjusted premature mortality rate increased among Hispanics by 2.6%, and among non-Hispanic Blacks by 2.0%, yet decreased among non-Hispanic Whites by 1.5%, and among Asians and Pacific Islanders by 1.9%.
• The age-adjusted premature mortality rate declined by 10.0% citywide over the past ten years. From 2009 to 2018, age-adjusted premature death (age<65 years) rates declined by 10.9% among non-Hispanic Blacks, 11.6% among Hispanics, 10.8% among non-Hispanic Whites, and increased by 4.1% among Asians and Pacific Islanders.
• The opioid epidemic has resulted in an increase in drug-related deaths across New York City. Drug-related deaths include both unintentional drug overdoses and deaths due to chronic drug use. The age-adjusted drug-related death rate was 16.6 per 100,000 population in 2018, remaining the same since 2017, and a 107.5% increase since 2009.
Infant Mortality• In 2018, New York City’s infant mortality rate reached a historic low of 3.9 infant deaths per 1,000 live
births, a decrease since 2017 (4.3 per 1,000 live births). Due to the small number of deaths, the rate will fluctuate from year to year.
• The infant mortality rate declined by 26.4% since 2009. • The infant mortality rate disparity between non-Hispanic Blacks and non-Hispanic Whites increased slightly
from 3.3 in 2017 to 3.4 in 2018. The disparity in infant mortality rates between Puerto Ricans and non-Hispanic Whites decreased from 2.6 in 2017 to 2.3 in 2018. These changes may be due to small counts from year to year.
Pregnancy Outcomes• The 2018 citywide crude birth rate was 13.6 births per 1,000 population. New York City’s birth rate
remained the same as 2017 and decreased by 12.3% since 2009.• In 2018, the birth rate was highest among Asians and Pacific Islanders at 15.4 births per 1,000 population,
followed by 15.0 among non-Hispanic Whites, 12.9 among Hispanics, and 11.4 among non-Hispanic Blacks.• For 2018, the community district with the highest crude birth rate was Borough Park with 24.9 births per
1,000 population; the community district with the lowest crude birth rate was Bayside with 4.8 births per 1,000 population.
• From 2009 to 2018, birth rates fell among all teenagers regardless of age, and the overall rate of teen birth (births to women <20) declined by 55.1%. Among teens less than 18 years of age, the birth rate declined over that period by 62.4%; among women 18-19, it declined by 52.4%.
• From 2009 to 2018, teen birth rates declined for all racial/ethnic groups: by 54.9% among Hispanics, 55.8% among non-Hispanic Blacks, 33.3% among non-Hispanic Whites, and 47.1% among Asians and Pacific Islanders.
• Induced and spontaneous terminations of pregnancy both continued to decline from 2017 to 2018, decreasing by 5.0% and 6.8%, respectively.

8 9
LIFE EXPECTANCY
• New York City’s life expectancy at birth in 2018 was 81.3 years, increasing by 0.1 years since 2017, and increasing by 0.7 years since 2009.
• The life expectancy among males was 78.6 years, a 0.1-year increase since 2017, and a 0.8-year increase since 2009.
• The life expectancy among females was 83.6 years, remaining the same since 2017, and a 0.6-year increase since 2009.
Figure 1. Life Expectancy at Birth, Overall and by Sex, New York City, 2009–2018
Figure 2. Life Expectancy at Birth by Racial/Ethnic* Group, New York City, 2009–2018
• The New York City 2018 life expectancy at birth was 82.4 years among Hispanics, 81.3 years among non-Hispanic Whites, and 77.2 years among non-Hispanic Blacks.
• Life expectancy increased across all racial/ethnic groups from 2009 to 2018: 0.7 years among Hispanics, 0.4 years among non-Hispanic Whites, and 0.6 years among non-Hispanic Blacks. From 2017 to 2018, life expectancy decreased 0.1 years among non-Hispanic Blacks, and remained the same among Hispanics and non-Hispanic Whites.
• The life expectancy estimate for Asians and Pacific Islanders is not displayed due to small single year age population denominators.
*Life expectancy among Asians and Pacific Islanders is not displayed be-cause the required single-year age population denominators are too small to produce reliable estimates (Appendix B, Technical Notes: Population, LifeExpectancy).
Figure 3. Life Expectancy at Birth by Neighbor-hood Poverty*, New York City, 2009 and 2018
• Life expectancy increased across all categories of neighborhood poverty between 2009 and 2018. For very high poverty areas, life expectancy increased by 1.8 years, compared to 1.9 years for low poverty areas.
• The difference in life expectancy between very high and low poverty areas in 2018 was 5.6 years, compared to 5.5 years in 2009.
70
74
78
82
86
90
Overall
Female
Male
'18'17'16'15'14'13'12'11'10'09
Year
Life
Exp
ecta
ncy
at B
irth
(Yea
rs)
83.6
78.6
81.3
70
74
78
82
86
90
Overall (81.3)
NH-Black
NH-White (81.3)
Hispanic
'18'17'16'15'14'13'12'11'10'09Year
Life
Exp
ecta
ncy
at B
irth
(Yea
rs)
82.4
77.2
70
74
78
82
86
90
20182009
Neighborhood Poverty and Year
78.1
85.5
83.684.2
79.981.1
83.182.3
Low (<10%)
Medium(10 to <20%)
High (20 to <30%)
Very High (≥30%)
Life
Exp
ecta
ncy
at B
irth
(Yea
rs)
*Neighborhood poverty (based on mother’s residential census tract) is defined as per-cent of residents with incomes below 100% of the Federal Poverty Level, per the American Community Survey (ACS) 2005-2009 for 2009 data and per ACS 2013-2017 for 2018 data.*Mortality data are based on NYC residents, including New York State occurrence.

10
LIFE EXPECTANCY
Figure 4. Life Expectancy at Birth by Community District, New York City, 2009-2018
Life Expectancy at Birth by Community District (CD) of Residence, New York City, 2009-2018
• For 2009-2018, New York City’s life expectancy at birth was highest in Greenwich Village/SOHO (87.2), Sunnyside/Woodside (86.9), Murray Hill, the Upper East Side, and Elmhurst/Corona (86.6), Battery Park/Tribeca and the Midtown Business District (86.2); and Jackson Heights (85.9).
• For 2009-2018, life expectancy at birth was lowest in Brownsville (75.8), the Rockaways (76.9), Central Harlem (77.1), Morrisania (77.2), and East Tremont (77.9).
Life Expectancy at BirthNeighborhood Health Action CenterParks & Airports75.8 - 80.080.1 - 81.781.8 - 83.283.3 - 84.884.9 - 87.2
Source: Bureau of Vital Statistics, based on events occurring in 2009-2018.
Bronx
Queens
Brooklyn
Staten Island
Manhattan
CD MANHATTANLife
ExpectancyCD BRONX
Life Expectancy
CD BROOKLYNLife
ExpectancyCD QUEENS
Life Expectancy
MN01 Battery Park, Tribeca 86.2 BX01 Mott Haven 78.3 BK01 Williamsburg, Greenpoint 82.7 QN01 Astoria, Long Island City 83.7MN02 Greenwich Village, SOHO 87.2 BX02 Hunts Point 80.1 BK02 Fort Greene, Brooklyn Heights 82.3 QN02 Sunnyside, Woodside 86.9MN03 Lower East Side 83.8 BX03 Morrisania 77.2 BK03 Bedford Stuyvesant 78.7 QN03 Jackson Heights 85.9MN04 Chelsea, Clinton 84.8 BX04 Concourse, Highbridge 80.0 BK04 Bushwick 81.7 QN04 Elmhurst, Corona 86.6MN05 Midtown Business District 86.2 BX05 University, Morris Heights 80.5 BK05 East New York 79.2 QN05 Ridgewood, Glendale 81.9MN06 Murray Hill 86.6 BX06 East Tremont 77.9 BK06 Park Slope 82.5 QN06 Rego Park, Forest Hills 85.2MN07 Upper West Side 85.5 BX07 Fordham 80.0 BK07 Sunset Park 83.7 QN07 Flushing 85.0MN08 Upper East Side 86.6 BX08 Riverdale 81.6 BK08 Crown Heights North 80.6 QN08 Fresh Meadows, Briarwood 84.7MN09 Manhattanville 82.4 BX09 Unionport, Soundview 80.7 BK09 Crown Heights South 82.3 QN09 Woodhaven 83.4MN10 Central Harlem 77.1 BX10 Throgs Neck 81.6 BK10 Bay Ridge 84.0 QN10 Howard Beach 82.0MN11 East Harlem 78.2 BX11 Pelham Parkway 80.4 BK11 Bensonhurst 84.5 QN11 Bayside 84.8MN12 Washington Heights 84.7 BX12 Williamsbridge 81.6 BK12 Borough Park 84.7 QN12 Jamaica, St. Albans 81.3
BK13 Coney Island 80.6 QN13 Queens Village 83.2CD STATEN ISLAND BK14 Flatbush, Midwood 82.7 QN14 The Rockaways 76.9
SI01 Port Richmond 79.7 BK15 Sheepshead Bay 83.9SI02 Willowbrook, South Beach 81.9 BK16 Brownsville 75.8SI03 Tottenville 81.4 BK17 East Flatbush 82.8
BK18 Canarsie 82.2
See Map of Community Districts and Boroughs, New York City on page 105.

11
CITYWIDE MORTALITYFigure 5. Age-adjusted Death Rates, Overall and
by Sex, New York City, 2009–2018• Over the past ten years, the citywide age-
adjusted death rate decreased by 12.3%.The age-adjusted death rate increased over the past year, from 545.7 per 100,000 population in 2017, to 555.1 in 2018.
• From 2009 to 2018, age-adjusted death rates decreased by 12.9% among males, and by 12.7% among females.
• The increase of rates was partially due to the 2.6% population decrease from 2017 to 2018.
Figure 6. Age-adjusted Death Rates by Racial/Ethnic Group, New York City, 2009–2018
• Between 2009 and 2018, age-adjusted death rates decreased by 9.1% among non-Hispanic Blacks, by 11.4% among Hispanics, by 13.8% among non-Hispanic Whites, and by 5.6% among Asians and Pacific Islanders.
• From 2017 to 2018, the age-adjusted death rate increased among Hispanics by 2.2%, among non-Hispanic Blacks by 3.1%, among non-Hispanic Whites by 0.3%, and among Asians and Pacific Islanders by 1.4%.
• In 2018, the death rate for non-Hispanic Blacks was 21.0% higher than the rate for non-Hispanic Whites. The death rate has continued to be higher among non-Hispanic Blacks compared to non-Hispanic Whites over time, and the gap has slightly increased since 2017 (the death rate for non-Hispanic Blacks was 18.0% higher than the rate for non-Hispanic Whites in 2017).
•
Figure 7. Age-adjusted Death Rates by Neighborhood Poverty*, New York City Residents, 2009 and 2018
• Since 2009, age-adjusted death rates decreased across all categories of neighborhood poverty. Over that period, the rate decreased by 9.7% in very high poverty areas and by 16.1% in low poverty areas.
• The age-adjusted death rate in areas with very high poverty was 1.6 times the rate in areas with low poverty in 2018, an increase in dispar-ity since 2009 (1.5 times the rate).
0
100
200
300
400
500
600
700
800
900
Female
Male
Citywide
'18'17'16'15'14'13'12'11'10'09
Year
Age
-adj
uste
d D
eath
Rat
epe
r 10
0,00
0 Po
pula
tion
555.1
672.1
463.1
0
200
400
600
800
1000
Citywide
NH-Black
NH-White
Asian & P.I.
Hispanic
'18'17'16'15'14'13'12'11'10'09Year
Age
-adj
uste
d D
eath
Rat
epe
r 10
0,00
0 Po
pula
tion
687.7
483.0
353.1
568.3555.1
0100
200
300
400
500
600
700
800
900
1000
20182009
Neighborhood Poverty and Year
746.8
421.3
502.3 475.1
674.0620.6
539.6561.0507.4
586.9
Citywide†Low (<10%)
Medium(10 to <20%)
High (20 to <30%)
Very High (≥30%)
Age
-adj
uste
d D
eath
Rat
e pe
r 10
0,00
0 Po
pula
tion
*Neighborhood poverty (based on decedent’s residential census tract) is defined as percent of residents with incomes below 100% of the Federal Poverty Level, per the American Community Survey (ACS) 2005-2009 for 2009 data and per ACS 2013-2017 for 2018 data. †The citywide estimate is restricted to NYC residents.
12
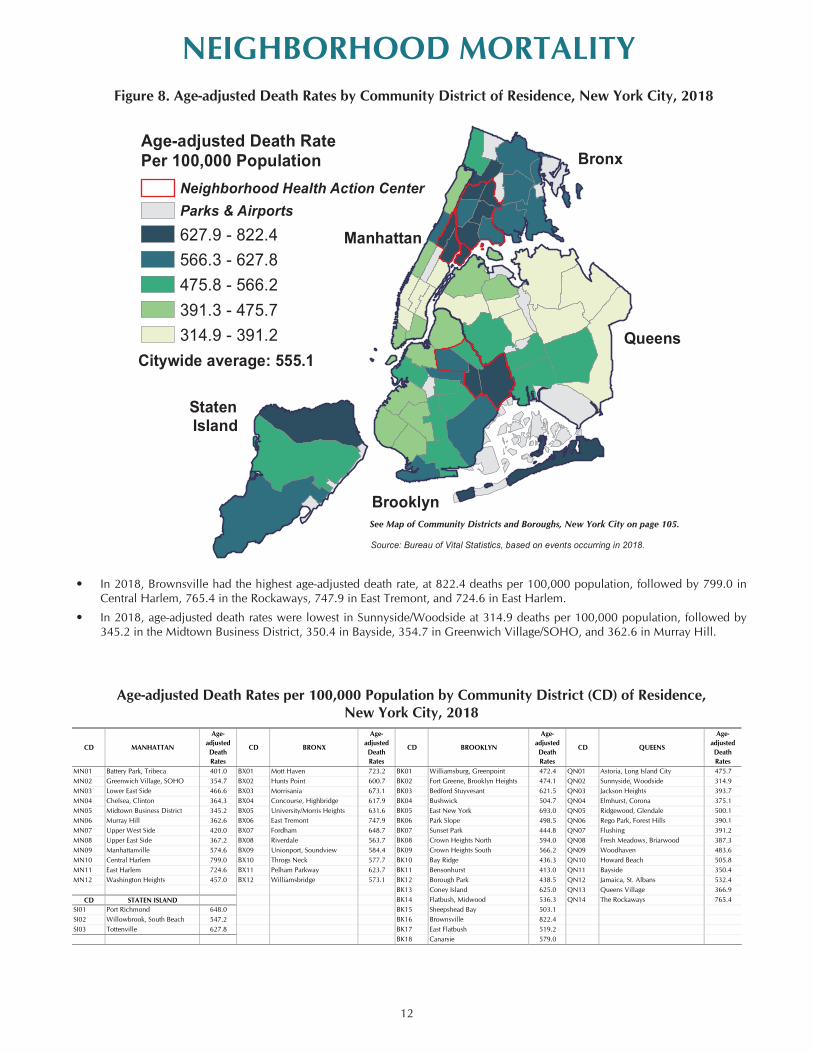
NEIGHBORHOOD MORTALITYFigure 8. Age-adjusted Death Rates by Community District of Residence, New York City, 2018
Age-adjusted Death Rates per 100,000 Population by Community District (CD) of Residence, New York City, 2018
• In 2018, Brownsville had the highest age-adjusted death rate, at 822.4 deaths per 100,000 population, followed by 799.0 in Central Harlem, 765.4 in the Rockaways, 747.9 in East Tremont, and 724.6 in East Harlem.
• In 2018, age-adjusted death rates were lowest in Sunnyside/Woodside at 314.9 deaths per 100,000 population, followed by 345.2 in the Midtown Business District, 350.4 in Bayside, 354.7 in Greenwich Village/SOHO, and 362.6 in Murray Hill.
Age-adjusted Death RatePer 100,000 Population
Neighborhood Health Action CenterParks & Airports627.9 - 822.4566.3 - 627.8475.8 - 566.2391.3 - 475.7314.9 - 391.2
Source: Bureau of Vital Statistics, based on events occurring in 2018.
Bronx
Queens
Brooklyn
Staten Island
Manhattan
Citywide average: 555.1
CD MANHATTAN
Age-adjusted Death Rates
CD BRONX
Age-adjusted Death Rates
CD BROOKLYN
Age-adjusted Death Rates
CD QUEENS
Age-adjusted Death Rates
MN01 Battery Park, Tribeca 401.0 BX01 Mott Haven 723.2 BK01 Williamsburg, Greenpoint 472.4 QN01 Astoria, Long Island City 475.7MN02 Greenwich Village, SOHO 354.7 BX02 Hunts Point 600.7 BK02 Fort Greene, Brooklyn Heights 474.1 QN02 Sunnyside, Woodside 314.9MN03 Lower East Side 466.6 BX03 Morrisania 673.1 BK03 Bedford Stuyvesant 621.5 QN03 Jackson Heights 393.7MN04 Chelsea, Clinton 364.3 BX04 Concourse, Highbridge 617.9 BK04 Bushwick 504.7 QN04 Elmhurst, Corona 375.1MN05 Midtown Business District 345.2 BX05 University/Morris Heights 631.6 BK05 East New York 693.0 QN05 Ridgewood, Glendale 500.1MN06 Murray Hill 362.6 BX06 East Tremont 747.9 BK06 Park Slope 498.5 QN06 Rego Park, Forest Hills 390.1MN07 Upper West Side 420.0 BX07 Fordham 648.7 BK07 Sunset Park 444.8 QN07 Flushing 391.2MN08 Upper East Side 367.2 BX08 Riverdale 563.7 BK08 Crown Heights North 594.0 QN08 Fresh Meadows, Briarwood 387.3MN09 Manhattanville 574.6 BX09 Unionport, Soundview 584.4 BK09 Crown Heights South 566.2 QN09 Woodhaven 483.6MN10 Central Harlem 799.0 BX10 Throgs Neck 577.7 BK10 Bay Ridge 436.3 QN10 Howard Beach 505.8MN11 East Harlem 724.6 BX11 Pelham Parkway 623.7 BK11 Bensonhurst 413.0 QN11 Bayside 350.4MN12 Washington Heights 457.0 BX12 Williamsbridge 573.1 BK12 Borough Park 438.5 QN12 Jamaica, St. Albans 532.4
BK13 Coney Island 625.0 QN13 Queens Village 366.9CD STATEN ISLAND BK14 Flatbush, Midwood 536.3 QN14 The Rockaways 765.4
SI01 Port Richmond 648.0 BK15 Sheepshead Bay 503.1SI02 Willowbrook, South Beach 547.2 BK16 Brownsville 822.4SI03 Tottenville 627.8 BK17 East Flatbush 519.2
BK18 Canarsie 579.0
See Map of Community Districts and Boroughs, New York City on page 105.

13
LEADING CAUSES OF DEATH
• Heart disease and malignant neoplasms (cancer) continue to rank as the top leading causes of death.
• HIV disease has dropped from the 4th leading cause in 2000, and the 9th leading cause in 2009, to the 16th in 2018.
• Nephritis, nephrotic syndrome and nephrosis dropped from the 10th leading cause in 2000 to the 16th in 2009, then rose to the 13th in 2018.
• Alzheimer’s disease has risen from the 21st leading cause in 2000, and the 11th leading cause in 2009, to the 9th in 2018. Although this change in ranking reflects the aging of the population, sharp increases in Alzheimer’s disease observed since 2009 may be partly attributed to efforts to improve cause of death reporting.
Figure 9. Leading Causes of Death, New York City, 2000, 2009, and 2018
1 1 1
2 2 2
3 3 3
6
4 4
5
6
5
7
5
6
9
10
7
11
8 8
21
11
9
8
7
1010
16
13
4
9
16
2000 2009 2018
Diseases of Heart*
Malignant Neoplasms
Influenza and Pneumonia
Diabetes Mellitus
Cerebrovascular Diseases
Chronic Lower Respiratory Diseases
Use of or Poisoning by Psychoactive Substance†
Essential Hypertension and RenalDiseases
Alzheimer's Disease
Accidents Except Drug Poisoning
Nephritis, Nephrotic Syndrome andNephrosis
HIV Disease
* See the 2010 Summary of Vital Statistics: Mortality - Special Section: Cause of Death Quality Improvement Initiative for information on the recent trends in cause of death reporting, particularly heart disease.†Appendix B Technical Notes: Drug-Related Deaths.

14
LEADING CAUSES OF DEATH
Table 1. Leading Causes of Death by Sex, New York City, 2018*
Rank Male Female
1 Diseases of Heart Diseases of Heart
2 Malignant Neoplasms Malignant Neoplasms
3Use of or Poisoning by Psychoactive Substance
Cerebrovascular Diseases
4 Diabetes Mellitus Chronic Lower Respiratory Diseases
5 Influenza and Pneumonia Influenza and Pneumonia
6 Cerebrovascular Diseases Diabetes Mellitus
7 Chronic Lower Respiratory Diseases Alzheimer's Disease
8Accidents Except Poisoning by Psychoactive Substance
Essential Hypertension and Hypertensive Renal Disease
9Essential Hypertension and Hypertensive Renal Disease
Use of or Poisoning by Psychoactive Substance
10 Intentional Self-harm (Suicide)Accidents Except Poisoning by Psychoactive Substance
* Counts and percentages for this table can be found in Table M7.
34
• Heart disease and malignant neoplasms (cancer) are the leading causes of death among both males and females. • Use of or poisoning by psychoactive substance is the 3rd leading cause of death among males but ranks 9th among females. • Cerebrovascular disease is the 3rd leading cause of death among females but ranks 6th among males. • Intentional self-harm (suicide) is a leading cause of death among males only (10th). • Alzheimer’s disease is ranked as a leading cause of death among females only (7th).
15
LEADING CAUSES OF DEATH
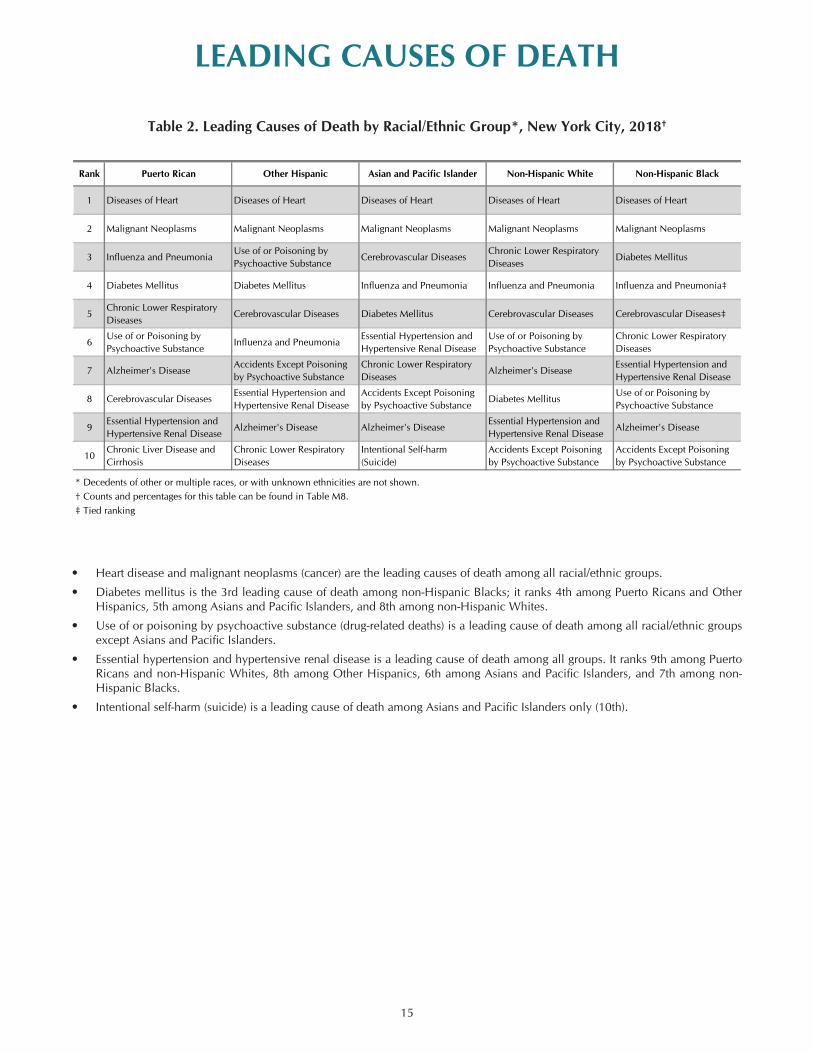
Table 2. Leading Causes of Death by Racial/Ethnic Group*, New York City, 2018†
Rank Puerto Rican Other Hispanic Asian and Pacific Islander Non-Hispanic White Non-Hispanic Black
1 Diseases of Heart Diseases of Heart Diseases of Heart Diseases of Heart Diseases of Heart
2 Malignant Neoplasms Malignant Neoplasms Malignant Neoplasms Malignant Neoplasms Malignant Neoplasms
3 Influenza and PneumoniaUse of or Poisoning by Psychoactive Substance
Cerebrovascular DiseasesChronic Lower Respiratory Diseases
Diabetes Mellitus
4 Diabetes Mellitus Diabetes Mellitus Influenza and Pneumonia Influenza and Pneumonia Influenza and Pneumonia‡
5Chronic Lower Respiratory Diseases
Cerebrovascular Diseases Diabetes Mellitus Cerebrovascular Diseases Cerebrovascular Diseases‡
6Use of or Poisoning by Psychoactive Substance
Influenza and PneumoniaEssential Hypertension and Hypertensive Renal Disease
Use of or Poisoning by Psychoactive Substance
Chronic Lower Respiratory Diseases
7 Alzheimer's DiseaseAccidents Except Poisoning by Psychoactive Substance
Chronic Lower Respiratory Diseases
Alzheimer's DiseaseEssential Hypertension and Hypertensive Renal Disease
8 Cerebrovascular DiseasesEssential Hypertension and Hypertensive Renal Disease
Accidents Except Poisoning by Psychoactive Substance
Diabetes MellitusUse of or Poisoning by Psychoactive Substance
9Essential Hypertension and Hypertensive Renal Disease
Alzheimer's Disease Alzheimer's DiseaseEssential Hypertension and Hypertensive Renal Disease
Alzheimer's Disease
10Chronic Liver Disease and Cirrhosis
Chronic Lower Respiratory Diseases
Intentional Self-harm (Suicide)
Accidents Except Poisoning by Psychoactive Substance
Accidents Except Poisoning by Psychoactive Substance
* Decedents of other or multiple races, or with unknown ethnicities are not shown.† Counts and percentages for this table can be found in Table M8.‡ Tied ranking
34
• Heart disease and malignant neoplasms (cancer) are the leading causes of death among all racial/ethnic groups.
• Diabetes mellitus is the 3rd leading cause of death among non-Hispanic Blacks; it ranks 4th among Puerto Ricans and Other Hispanics, 5th among Asians and Pacific Islanders, and 8th among non-Hispanic Whites.
• Use of or poisoning by psychoactive substance (drug-related deaths) is a leading cause of death among all racial/ethnic groups except Asians and Pacific Islanders.
• Essential hypertension and hypertensive renal disease is a leading cause of death among all groups. It ranks 9th among Puerto Ricans and non-Hispanic Whites, 8th among Other Hispanics, 6th among Asians and Pacific Islanders, and 7th among non-Hispanic Blacks.
• Intentional self-harm (suicide) is a leading cause of death among Asians and Pacific Islanders only (10th).
16
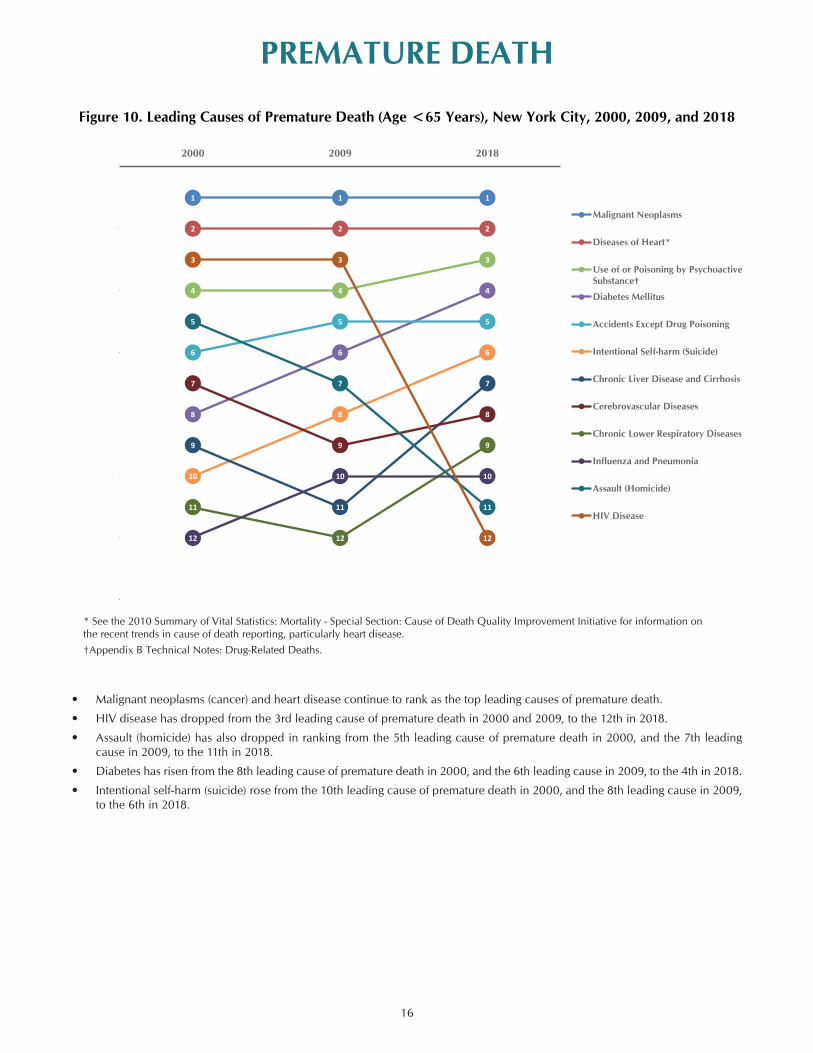
PREMATURE DEATH
Figure 10. Leading Causes of Premature Death (Age <65 Years), New York City, 2000, 2009, and 2018
• Malignant neoplasms (cancer) and heart disease continue to rank as the top leading causes of premature death.
• HIV disease has dropped from the 3rd leading cause of premature death in 2000 and 2009, to the 12th in 2018.
• Assault (homicide) has also dropped in ranking from the 5th leading cause of premature death in 2000, and the 7th leading cause in 2009, to the 11th in 2018.
• Diabetes has risen from the 8th leading cause of premature death in 2000, and the 6th leading cause in 2009, to the 4th in 2018.
• Intentional self-harm (suicide) rose from the 10th leading cause of premature death in 2000, and the 8th leading cause in 2009, to the 6th in 2018.
1 1 1
2 2 2
4 4
3
8
6
4
6
5 5
10
8
6
9
11
77
9
8
11
12
9
12
10 10
5
7
11
3 3
12
2000 2009 2018
Malignant Neoplasms
Diseases of Heart*
Use of or Poisoning by Psychoactive Substance†
Diabetes Mellitus
Accidents Except Drug Poisoning
Intentional Self-harm (Suicide)
Chronic Liver Disease and Cirrhosis
Cerebrovascular Diseases
Chronic Lower Respiratory Diseases
Influenza and Pneumonia
Assault (Homicide)
HIV Disease
* See the 2010 Summary of Vital Statistics: Mortality - Special Section: Cause of Death Quality Improvement Initiative for information on the recent trends in cause of death reporting, particularly heart disease.†Appendix B Technical Notes: Drug-Related Deaths.
17
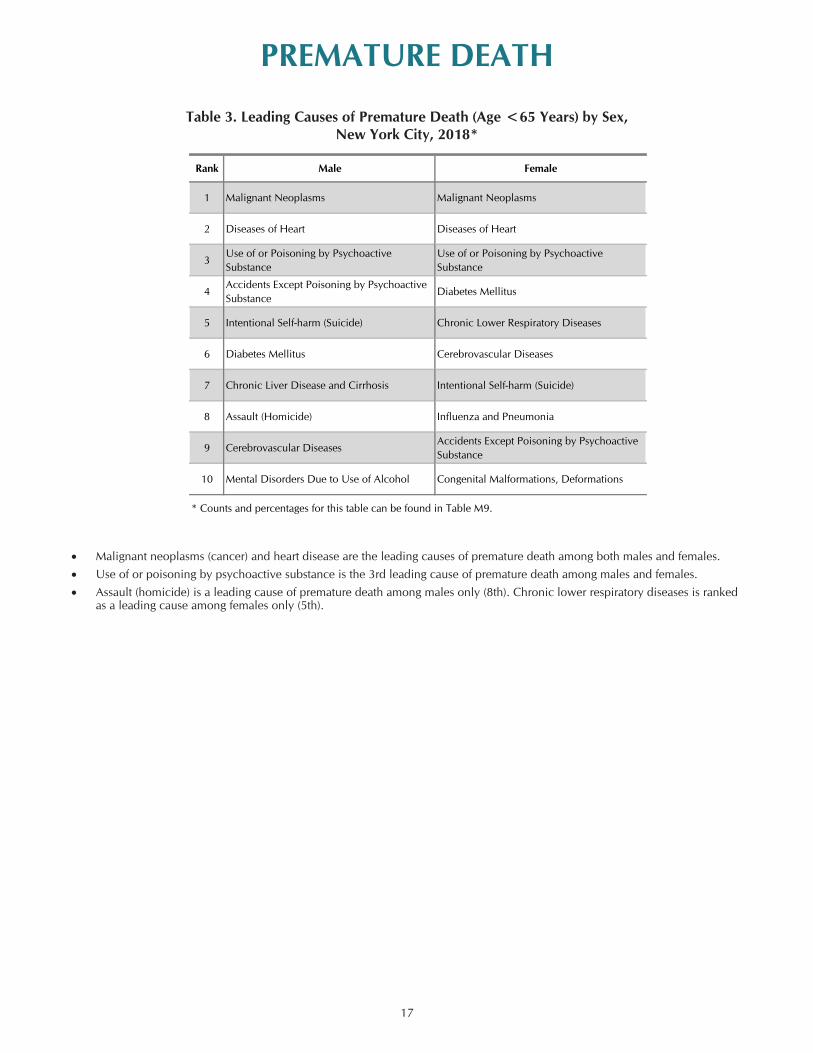
PREMATURE DEATH
Table 3. Leading Causes of Premature Death (Age <65 Years) by Sex, New York City, 2018*
Rank Male Female
1 Malignant Neoplasms Malignant Neoplasms
2 Diseases of Heart Diseases of Heart
3Use of or Poisoning by Psychoactive Substance
Use of or Poisoning by Psychoactive Substance
4Accidents Except Poisoning by Psychoactive Substance
Diabetes Mellitus
5 Intentional Self-harm (Suicide) Chronic Lower Respiratory Diseases
6 Diabetes Mellitus Cerebrovascular Diseases
7 Chronic Liver Disease and Cirrhosis Intentional Self-harm (Suicide)
8 Assault (Homicide) Influenza and Pneumonia
9 Cerebrovascular DiseasesAccidents Except Poisoning by Psychoactive Substance
10 Mental Disorders Due to Use of Alcohol Congenital Malformations, Deformations
* Counts and percentages for this table can be found in Table M9.
34
• Malignant neoplasms (cancer) and heart disease are the leading causes of premature death among both males and females.• Use of or poisoning by psychoactive substance is the 3rd leading cause of premature death among males and females. • Assault (homicide) is a leading cause of premature death among males only (8th). Chronic lower respiratory diseases is ranked
as a leading cause among females only (5th).

18
PREMATURE DEATHTable 4. Leading Causes of Premature Death (Age <65 Years) by Racial/Ethnic Group*,
New York City, 2018†
Rank Puerto Rican Other Hispanic Asian and Pacific Islander Non-Hispanic White Non-Hispanic Black
1 Malignant Neoplasms Malignant Neoplasms Malignant Neoplasms Malignant Neoplasms Diseases of Heart
2 Diseases of Heart Diseases of Heart Diseases of Heart Diseases of Heart Malignant Neoplasms
3Use of or Poisoning by Psychoactive Substance
Use of or Poisoning by Psychoactive Substance
Intentional Self-harm (Suicide)
Use of or Poisoning by Psychoactive Substance
Use of or Poisoning by Psychoactive Substance
4 Diabetes MellitusAccidents Except Poisoning by Psychoactive Substance
Accidents Except Poisoning by Psychoactive Substance
Intentional Self-harm (Suicide)
Diabetes Mellitus
5Chronic Lower Respiratory Diseases
Diabetes Mellitus‡ Diabetes MellitusChronic Liver Disease and Cirrhosis
Assault (Homicide)
6Chronic Liver Disease and Cirrhosis
Chronic Liver Disease and Cirrhosis‡
Cerebrovascular DiseasesAccidents Except Poisoning by Psychoactive Substance
Human Immunodeficiency Virus (HIV) Disease
7 Influenza and Pneumonia Cerebrovascular DiseasesUse of or Poisoning by Psychoactive Substance
Diabetes MellitusChronic Lower Respiratory Diseases
8Accidents Except Poisoning by Psychoactive Substance
Intentional Self-harm (Suicide)
Certain Conditions Originating in the Perinatal Period
Chronic Lower Respiratory Diseases
Cerebrovascular Diseases
9Human Immunodeficiency Virus (HIV) Disease
Assault (Homicide) Influenza and PneumoniaMental Disorders Due to Use of Alcohol
Accidents Except Poisoning by Psychoactive Substance
10 Cerebrovascular DiseasesMental Disorders Due to Use of Alcohol
Mental Disorders Due to Use of Alcohol
Congenital Malformations,Deformations
Influenza and Pneumonia
* Decedents of other or multiple races, or with unknown ethnicities are not shown.† Counts and percentages for this table can be found in Table M10.‡ Tied ranking
34
• Malignant neoplasms (cancer) and heart disease are the leading causes of premature death among all racial/ethnic groups.• Use of or poisoning by psychoactive substance (drug-related deaths) is the 3rd leading cause of premature death among all
racial/ethnic groups except Asians and Pacific Islanders (7th). • Intentional self-harm (suicide) is the 3rd leading cause of premature death for Asians and Pacific Islanders; it ranks 8th among
Other Hispanics, and 4th among non-Hispanic Whites. It is not ranked as a leading cause of premature death among Puerto Ricans and non-Hispanic Blacks.
• HIV disease is a leading cause of premature death among Puerto Ricans (9th), and non-Hispanic Blacks (6th). It is not ranked as a leading cause of premature death among Asians and Pacific Islanders, Other Hispanics, and non-Hispanic Whites.
• Assault (homicide) is a leading cause of premature death among Other Hispanics (9th) and non-Hispanic Blacks (5th), but is not a leading cause among other racial/ethnic groups.

19
PREMATURE DEATH
Figure 12. Age-adjusted Premature Death (Age <65 years) Rates by Racial/Ethnic Group,
New York City, 2009–2018• From 2009 to 2018, age-adjusted premature death
rates declined by 10.9% among non-Hispanic Blacks, 11.6% among Hispanics, 10.8% among non-Hispanic Whites, and increased by 4.1% among Asians and Pacific Islanders.
• From 2017 to 2018, the age-adjusted premature mor-tality rate increased among Hispanics by 2.6%, and among non-Hispanic Blacks by 2.0%, yet decreased among non-Hispanic Whites by 1.5%, and among Asians and Pacific Islanders by 1.9%.
• Non-Hispanic Blacks had the highest age-adjusted premature death rate (57.4% higher than non-His-panic Whites), and were the only racial/ethnic group above the citywide average.
Figure 13. Age-adjusted Premature Death (Age <65 years) Rates by Neighborhood Poverty*,
New York City Residents, 2009 and 2018• The age-adjusted premature mortality rate de-
creased across all categories of neighborhood pov-erty between 2009 and 2018. Over that time, it decreased by 15.3% in low poverty neighborhoods, 14.3% in medium poverty neighborhoods, 12.4% in high poverty neighborhoods, and 9.0% in very high poverty neighborhoods.
• Despite declines, the gap between very high and low poverty neighborhoods remains pronounced. Very high poverty neighborhoods experienced an age-adjusted premature mortality rate that was 2.4 times that of low poverty neighborhoods in 2018. This disparity has increased slightly from 2017 (2.1 times in 2017).
Figure 11. Age-adjusted Premature Death (Age <65 years) Rates, Overall and by Sex, New York
City, 2009–2018• The age-adjusted premature death rate was 187.1
per 100,000 population in 2018, a 1.2% increase since 2017, and a 10.0% decrease since 2009.
• The increase in the premature death rate was partially due to the 3.2% population decrease among those under the age of 65, from 2017 to 2018.
• The age-adjusted premature death rate for females has been consistently lower than the rate for males.
50
100
150
200
250
300
350
Citywide
NH-White
Hispanic
NH-Black
Asian
'18'17'16'15'14'13'12'11'10'09
Year
Age
-adj
uste
d D
eath
Rat
e pe
r 10
0,00
0 Po
pula
tion
278.2
165.5
95.7
176.7187.1
0
50
100
150
200
250
300
350
400
20182009
Neighborhood Poverty and Year
Age
-adj
uste
d D
eath
Rat
epe
r 10
0,00
0 Po
pula
tion
263.7
289.7
182.2208.1
141.9165.6
111.5131.6
164.3186.5
Citywide† Low (<10%)
Medium(10 to <20%)
High (20 to <30%)
Very High (≥30%)
*Neighborhood poverty (based on decedent’s residential census tract) is defined as percent of residents with incomes below 100% of the Federal Poverty Level, per the American Community Survey (ACS) 2005-2009 for 2009 data and per ACS 2013-2017 for 2018 data. †The citywide estimate is restricted to NYC residents.
0
50
100
150
200
250
300
350
Citywide
Male
Female
'18'17'16'15'14'13'12'11'10'09
Year
Age
-adj
uste
d D
eath
Rat
epe
r 10
0,00
0 Po
pula
tion
187.1
242.8
136.1

20
PREMATURE DEATHFigure 14. Age-adjusted Premature Death (Age <65 years) Rates by Community District of Residence,
New York City, 2018
Age-adjusted Premature Death Rates per 100,000 Population by Community District (CD) of Residence, New York City, 2018
• In 2018, New York City age-adjusted premature death rates were highest in Brownsville at 383.8 deaths per 100,000 population, followed by 351.5 in East Tremont, 328.8 in Mott Haven, 292.7 in East Harlem, and 292.1 in Morrisania.
• In 2018, age-adjusted premature death rates were lowest in Battery Park/Tribeca at 61.7 deaths per 100,000 population, followed by 65.9 in Greenwich Village/SOHO, 72.1 in the Upper East Side, 86.3 in Sunnyside/Woodside, and 89.1 in Bayside.
Age-adjusted Premature Death RatePer 100,000 Population
Neighborhood Health Action CenterParks & Airports230.7 - 383.8184.8 - 230.6139.5 - 184.7110.3 - 139.461.7 - 110.2
Source: Bureau of Vital Statistics, based on events occurring in 2018.
Bronx
Queens
Brooklyn
Staten Island
Manhattan
Citywide average: 187.1
CD MANHATTAN
Age-adjusted
Premature Death Rate
CD BRONX
Age-adjusted
Premature Death Rate
CD BROOKLYN
Age-adjusted
Premature Death Rate
CD QUEENS
Age-adjusted
Premature Death Rate
MN01 Battery Park, Tribeca 61.7 BX01 Mott Haven 328.8 BK01 Williamsburg, Greenpoint 149.1 QN01 Astoria, Long Island City 139.4MN02 Greenwich Village, SOHO 65.9 BX02 Hunts Point 256.7 BK02 Fort Greene, Brooklyn Heights 138.6 QN02 Sunnyside, Woodside 86.3MN03 Lower East Side 140.3 BX03 Morrisania 292.1 BK03 Bedford Stuyvesant 264.9 QN03 Jackson Heights 113.3MN04 Chelsea, Clinton 107.5 BX04 Concourse, Highbridge 228.9 BK04 Bushwick 167.7 QN04 Elmhurst, Corona 107.3MN05 Midtown Business District 111.0 BX05 University, Morris Heights 264.4 BK05 East New York 290.7 QN05 Ridgewood, Glendale 143.0MN06 Murray Hill 93.0 BX06 East Tremont 351.5 BK06 Park Slope 132.2 QN06 Rego Park, Forest Hills 94.3MN07 Upper West Side 95.3 BX07 Fordham 230.6 BK07 Sunset Park 112.0 QN07 Flushing 113.5MN08 Upper East Side 72.1 BX08 Riverdale 161.0 BK08 Crown Heights North 197.3 QN08 Fresh Meadows, Briarwood 109.0MN09 Manhattanville 190.7 BX09 Unionport, Soundview 215.0 BK09 Crown Heights South 195.1 QN09 Woodhaven 138.6MN10 Central Harlem 286.1 BX10 Throgs Neck 184.4 BK10 Bay Ridge 118.4 QN10 Howard Beach 154.2MN11 East Harlem 292.7 BX11 Pelham Parkway 223.1 BK11 Bensonhurst 114.5 QN11 Bayside 89.1MN12 Washington Heights 130.4 BX12 Williamsbridge 218.5 BK12 Borough Park 110.2 QN12 Jamaica, St. Albans 190.2
BK13 Coney Island 197.6 QN13 Queens Village 118.9
CD STATEN ISLAND BK14 Flatbush, Midwood 149.1 QN14 The Rockaways 261.8SI01 Port Richmond 212.9 BK15 Sheepshead Bay 155.5SI02 Willowbrook, South Beach 152.0 BK16 Brownsville 383.8SI03 Tottenville 163.0 BK17 East Flatbush 184.7
BK18 Canarsie 192.7
See Map of Community Districts and Boroughs, New York City on page 105.

21
PREMATURE DEATHFigure 15. Leading Causes of Premature Death (Age<65 years), New York City, 2009–2018
• In 2018, cancer and heart disease premature death rates were higher than rates for any other causes (55.7 and 40.6 per 100,000 population, respectively). Over the past ten years, rates have declined for both (by 10.5% and 12.5%, respectively). The sharper decline in heart disease death rates from 2009 to 2011 was partly due to improved cause of death reporting*.
• Use of or poisoning by psychoactive substance, diabetes, and accidents except poisoning accounted for the 3rd, 4th and 5th leading causes of premature death, respectively, in 2018.
• The rate of premature drug-related deaths (use of or poisoning by psychoactive substance) decreased by 1.5% from 2017 to 2018, yet increased by 104.3% since 2009. These trends are consistent with national reports.
• Other accident deaths (accidents except poisoning)declined from 2009 to 2018 (19.5%) and declined slightly since 2017 (4.3%). Rates for diabetes deaths increased since 2009 (14.9%) and increased slightly over the past year by 8.5%.
Figure 16. Leading Causes of Premature Cancer Deaths (Age <65 years), New York City,
2009–2018
Figure 17. Leading Causes of Premature Heart Disease Deaths (Age <65 years), New York
City, 2009–2018
• Breast (female) and lung cancers account for the highest cancer death rates in New York City, at 12.3 and 9.0 deaths per 100,000 population, respectively. Breast (female) cancer and lung cancer death rates declined by 8.2% and 23.1%, respectively, since 2009. The breast (female) cancer rate increased 15.0% from 2017 to 2018.
• Lymphoid and blood, colon, and liver cancers account for the 3rd, 4th, and 5th highest rates of cancer deaths, at 5.9, 5.5, and 3.3 deaths per 100,000 population, respectively. Death rates for these cancers have declined since 2009, except for colon cancer, which has remained the same.
• The crude rate of the leading cause of premature heart disease deaths, chronic ischemic heart disease, has decreased 17.1% since 2009. The sharper decline from 2009 to 2011 was partly due to efforts to improve the accuracy of cause of death reporting*.
• Since 2009, hypertensive heart disease decreased by 5.7%, acute myocardial infarction decreased by 9.6%, and essential hypertension and hypertensive renal disease decreased by 6.9%. The rate for cardiomyopathy remained the same since 2009.
*See the 2010 Summary of Vital Statistics: Mortality – Special Section: Cause of Death Quality Improvement Initiative.
*See the 2010 Summary of Vital Statistics: Mortality – Special Section: Cause of Death Quality Improvement Initiative.
0
10
20
30
40
50
60
70
Diabetes
Accidents except poisoning
Use of or poisoning by psychoactive substance
Heart Diseases
Cancer
'18'17'16'15'14'13'12'11'10'09
Year
55.7
19.2
7.7
40.6
6.6
Cru
de D
eath
Rat
e p
er 1
00,0
00 P
opul
atio
n
0
2
4
6
8
10
12
14
16
Liver and Intrahepatic Bile Ducts CancerColon, Rectum, and Anus Cancer
Lymphoid, Hematopoietic, and Related Tissue Cancer
Breast Cancer
Trachea, Bronchus, and Lung Cancer
'18'17'16'15'14'13'12'11'10'09
Year
Cru
de D
eath
Rat
e p
er 1
00,0
00 P
opul
atio
n
9.0
5.5
3.3
5.9
12.3
0
5
10
15
20
25
30
Essential (Primary) Hypertension and Hypertensive Renal Disease
Cardiomyopathy
Acute Myocardial InfarctionHypertensive Heart Disease
Chronic Ischemic Heart Disease
'18'17'16'15'14'13'12'11'10'09
Year
Cru
de D
eath
Rat
e pe
r 10
0,00
0 Po
pula
tion
22.3
4.7
2.7
8.3
1.0

22
EXTERNAL CAUSES OF DEATH
Figure 19. Crude Death Rates for Selected Accidental Causes of Death, New York City,
2009–2018
• The unintentional drug overdose* rate increased by 1.2% from 2017 (16.2 per 100,000 population in 2017 vs. 16.4 per 100,000 population in 2018), and by 137.7% from 2009 (6.9 per 100,000 population in 2009).
• Unintentional drug overdose exceeds all other causes, with a crude rate in 2018 that was 6.3 times that of mo-tor vehicle accidents, and 2.8 times that of fall-related deaths.
• The crude death rate due to motor vehicle accidents declined over the past ten years, from 3.6 deaths per 100,000 population in 2009, to 2.6 per 100,000 popula-tion in 2018, a decrease of 27.8%. The falls-related crude death rate has increased by 23.4% since 2009 (5.8 per 100,000 population in 2018 vs. 4.7 per 100,000 popula-tion in 2009).
• Death rates due to accidental suffocation and accidental exposure to smoke, fire, and flames increased over the past ten years by 20.0% and 14.3%, respectively. The death rate due to accidental drowning and submersion increased by 50.0%.
*Appendix B. Technical Notes: Drug-Related Deaths.
• Deaths due to accidents continued to account for the largest share of deaths due to external causes. In 2018, the accident death rate exceeded the rate from ten years ago (28.8 per 100,000 population in 2018 vs. 19.0 per 100,000 population in 2009), primarily due to the increase of drug-related deaths.
• The rate of deaths due to assault (homicide) declined over the past ten years by 39.3%.
• The suicide rate has risen over the past ten years from 5.8 per 100,000 population in 2009, to 6.7 per 100,000 population in 2018. The rate has increased slightly since 2017.
• The death rate due to all other external causes combined was higher in 2018 (4.0 per 100,000 population) than ten years ago (2.0 per 100,000 population)†. The rate has been between 3.2 and 4.0 per 100,000 population since 2011.
Figure 18. Crude Death Rates for External Causes of Death*, New York City, 2009–2018
*Appendix B. Technical Notes: Deaths, Cause of Death International Clas-sification of Disease (ICD) Coding†Other external causes include medical and/or surgical care complications and deaths due to undetermined intent.
Figure 20. Age-specific Suicide Death Rates, New York City, 2009–2018
• Death rates due to suicide were highest among the age group 45 to 64, at 10.7 deaths per 100,000 population in 2018.
• The rate of suicide deaths among adults aged 25-44 was 7.1 per 100,000 population in 2018, 10.9% higher than the rate in 2009. Compared to 2009, rates increased by 18.9% among the age group 45-64, and decreased by 2.9% among the age group 65-84.
0
2
4
6
8
10
12
65 to 84
45 to 64
25 to 44
'18'17'16'15'14'13'12'11'10'09
Year
Age
-spe
cific
Rat
epe
r 10
0,00
0 Po
pula
tion
10.7
7.16.7
0
5
10
15
20
25
30
Other External Causes*
Intentional Self-Harm (Suicide)Assault (Homicide)
Accidents (Unintentional Injuries)
'18'17'16'15'14'13'12'11'10'09
Year
Cru
de D
eath
Rat
epe
r 10
0,00
0 Po
pula
tion
3.74.0
28.8
6.7
0
5
10
15
20
Unintentional Drug Overdose
Accidental Su�ocation (0.6)
Accidental Exposure to Smoke, Fire and Flames (0.8)
Accidental Drowning and Submersion (0.3)
Motor Vehicle Accidents Falls
'18'17'16'15'14'13'12'11'10'09
Year
Cru
de D
eath
Rat
epe
r 10
0,00
0 Po
pula
tion
5.8
2.6
16.4

23
EXTERNAL CAUSES OF DEATHFigure 21. Age-adjusted Homicide Death Rates (Five-Year Averages) by Community District of Residence,
New York City, 2014-2018
Age-adjusted Homicide Death Rates (Five-Year Averages) per 100,000 Population by Community District (CD) of Residence, New York City, 2014-2018
• The five-year average age-adjusted homicide rate was highest in Brownsville with 16.9 deaths per 100,000 population, followed by University/Morris Heights at 10.1, Mott Haven at 9.8, Morrisania at 9.6, and East New York at 9.4.
• In nine community districts, five-year average rates were less than 1.0 per 100,000 population: Battery Park/Tribeca, Greenwich Village/SOHO, Murray Hill, Upper East Side, Bensonhurst, Borough Park, Rego Park/Forest Hills, Bayside, and Tottenville.
• This figure uses five years of data due to the small number of homicide deaths in each community district per year.
Age-adjusted Homicide RatePer 100,000 Population
Neighborhood Health Action CenterParks & Airports6.2 - 16.94.5 - 6.12.5 - 4.41.2 - 2.40.3 - 1.1
Source: Bureau of Vital Statistics, based on events occurring in 2014-2018.
Bronx
Queens
Brooklyn
Staten Island
Manhattan
Citywide average: 3.7
CD MANHATTAN
Age-adjusted
Homicide Death Rates
CD BRONX
Age-adjusted
Homicide Death Rates
CD BROOKLYN
Age-adjusted
Homicide Death Rates
CD QUEENS
Age-adjusted
Homicide Death Rates
MN01 Battery Park, Tribeca 0.8 BX01 Mott Haven 9.8 BK01 Williamsburg, Greenpoint 2.5 QN01 Astoria, Long Island City 1.9MN02 Greenwich Village, SOHO 0.8 BX02 Hunts Point 5.7 BK02 Fort Greene, Brooklyn Heights 3.4 QN02 Sunnyside, Woodside 1.1MN03 Lower East Side 2.4 BX03 Morrisania 9.6 BK03 Bedford Stuyvesant 9.2 QN03 Jackson Heights 1.3MN04 Chelsea, Clinton 1.1 BX04 Concourse, Highbridge 7.7 BK04 Bushwick 5.1 QN04 Elmhurst, Corona 1.9MN05 Midtown Business District 1.3 BX05 University, Morris Heights 10.1 BK05 East New York 9.4 QN05 Ridgewood, Glendale 1.0MN06 Murray Hill 0.8 BX06 East Tremont 9.3 BK06 Park Slope 2.4 QN06 Rego Park, Forest Hills 0.3MN07 Upper West Side 1.0 BX07 Fordham 4.1 BK07 Sunset Park 1.2 QN07 Flushing 1.6MN08 Upper East Side 0.4 BX08 Riverdale 2.8 BK08 Crown Heights North 7.9 QN08 Fresh Meadows, Briarwood 1.9MN09 Manhattanville 3.6 BX09 Unionport, Soundview 6.1 BK09 Crown Heights South 5.0 QN09 Woodhaven 2.5MN10 Central Harlem 4.8 BX10 Throgs Neck 2.8 BK10 Bay Ridge 1.3 QN10 Howard Beach 3.3MN11 East Harlem 6.0 BX11 Pelham Parkway 3.8 BK11 Bensonhurst 0.8 QN11 Bayside 0.6MN12 Washington Heights 1.9 BX12 Williamsbridge 4.8 BK12 Borough Park 0.6 QN12 Jamaica, St. Albans 5.9
BK13 Coney Island 5.3 QN13 Queens Village 4.4CD STATEN ISLAND BK14 Flatbush, Midwood 4.0 QN14 The Rockaways 5.3
SI01 Port Richmond 4.8 BK15 Sheepshead Bay 2.2SI02 Willowbrook, South Beach 1.9 BK16 Brownsville 16.9SI03 Tottenville 0.8 BK17 East Flatbush 8.9
BK18 Canarsie 6.1
See Map of Community Districts and Boroughs, New York City on page 105.

24
SPECIAL SECTION DRUG-RELATED MORTALITY
• The special section focuses on drug-related (use of or poisoning by psychoactive substance) deaths, which include deaths due to chronic substance use and drug overdose. All manners of death are included in drug-related deaths. The National Center for Health Statistics uses this definition for categorizing the leading causes of death.
• Drug-related deaths were the 7th leading cause of mortality, and the 3rd leading cause of premature mortality (age < 65 years) in 2018.
• The age-adjusted mortality rate of drug-related deaths remained the same since 2017, and increased by 107.5% since 2009.
• Unintentional drug overdose deaths account for 92% of drug-related deaths. The crude mortality rate for unintentional drug overdose has risen by 1.2% since 2017.
0
5
10
15
20
25
30
'18'17'16'15'14'13'12'11'10'09'08'07'06'05'04'03'02'01'00
Year
Age-
Adju
sted
Dru
g-Re
late
d D
eath
Rat
e pe
r 100
,000
Pop
ulat
ion
16.6
11.28.0
16.6
Overview

25
SPECIAL SECTION DRUG-RELATED MORTALITY
0
5
10
15
20
25
30Male
Female
Citywide
'18'17'16'15'14'13'12'11'10'09
Year
Age-
Adju
sted
Rat
epe
r 100
,000
Pop
ulat
ion
26.5
16.6
7.7
Figure S1. Age-adjusted Drug-related Death Rates, Overall and by Sex, New York City, 2009-2018
• The age-adjusted drug-related death rate was 16.6 per 100,000 population in 2018, remaining the same since 2017, and a 107.5% increase since 2009.
• The age-adjusted drug-related death rate for males decreased to 26.5 per 100,000 population in 2018, a 2.9% decrease since 2017, yet a 122.7% increase since 2009. The age-adjusted drug-related death rate for females increased to 7.7 per 100,000 population in 2018, a 11.6% increase since 2017 and a 71.1% increase since 2009.
Figure S2. Age-adjusted Drug-related Death Rates by Racial/Ethnic Group New York City, 2009-2018
0
5
10
15
20
25
30
Asian & P.I.
NH-Black (18.5 in 2018)
NH-White (18.5 in 2018)
Hispanic
'18'17'16'15'14'13'12'11'10'09Year
Age
-adj
uste
d D
eath
Rat
epe
r 10
0,00
0 Po
pula
tion
20.0
2.6
• Between 2009 and 2018, age-adjusted drug-related death rates increased by 105.6% among non-Hispanic Blacks, by 127.3% among Hispanics, by 85.0% among non-Hispanic Whites, and by 550.0% among Asians and Pacific Islanders.
• In 2018, the drug-related death rate among non-Hispanic Blacks was the same as the rate for non-Hispanic Whites, a change from previous years in which the death rate for non-Hispanic Whites was higher than that for non-Hispanic Blacks (except in 2017).

26
SPECIAL SECTION DRUG-RELATED MORTALITY
Figure S3. Age-adjusted Drug-related Death Rates by Neighborhood Poverty*, New York City, 2009 and 2018
0
5
10
15
20
25
30
35
20182009
Neighborhood Poverty and Year
Age
-adj
uste
d D
eath
Rat
epe
r 10
0,00
0 Po
pula
tion 27.9
7.0
13.4
16.6
7.6
11.2
5.8
8.3
4.8
14.5
7.2
Citywide† Low (<10%)
Medium(10 to <20%)
High (20 to <30%)
Very High (≥30%)
*Neighborhood poverty (based on mother’s residential census tract) is defined as percent of residents with incomes below 100% of the Federal Poverty Level, per the American Community Survey (ACS) 2005-2009 for 2009 data and per ACS 2013-2017 for 2018 data.†The citywide estimate is restricted to NYC residents.
• Since 2009, age-adjusted drug-related death rates in-creased across all categories of neighborhood poverty. Over that period, the rate increased by 108.2% in very high poverty areas and by 72.9% in low poverty areas.
• The age-adjusted drug-related death rate in areas with very high poverty was 3.4 times the rate in areas with low poverty in 2018. In 2009, the rate in areas with very high poverty was 2.8 times the rate of areas with low poverty.
Figure S4. Age-adjusted Drug-related Death Rates by Borough of Residence, New York City, 2009-2018
0
5
10
15
20
25
30
Staten Island
Queens
Brooklyn
Bronx
Manhattan
'18'17'16'15'14'13'12'11'10'09Year
Age
-adj
uste
d D
eath
Rat
epe
r 10
0,00
0 Po
pula
tion
28.0
15.6
9.1
24.1
10.4
• Since 2009, age-adjusted drug-related death rates have increased across all boroughs.
• Over that period, age-adjusted drug-related death rates increased by 119.7% in Manhattan, by 124.0% in the Bronx, by 60.0% in Brooklyn, by 116.7% in Queens, and by 92.8% in Staten Island.
• From 2009 to 2018, the Bronx and Staten Island have consistently had higher age-adjusted drug-related death rates, compared to the other three boroughs.

27
SPECIAL SECTION DRUG-RELATED MORTALITY
Figure S5. Age-specific Drug-related Death Rates, Ages 18-64, New York City, 2009-2018
• Between 2009 and 2018, age-adjusted drug-related death rates increased for all age groups: by 225.0% for 18-24 year olds, by 151.4% for 25-34 year olds, by 57.9% for 35-44 year olds, by 72.8% for 45-54 year olds, and by 138.3% for 55-64 year olds.
• Since 2009, the drug-related death rate for 45-54 year olds remained consistently higher than all other age groups. However, the drug-related death rate increased most dramatically for 18-24 year olds during this 10-year period.
• 91.6% of drug-related deaths were premature (<65 year olds) in 2018.
0
5
10
15
20
25
30
35
40
55-64
45-54
35-44
25-34
18-24
'18'17'16'15'14'13'12'11'10'09Year
Age
-Spe
cific
Dea
th R
ate
per
100,
000
Popu
latio
n
39.4
22.1
9.1
36.7
18.1

28
SPECIAL SECTION DRUG-RELATED MORTALITY
Figure S6. Age-adjusted Drug-related Death Rates (Three-Year Averages) by Community District of Residence,New York City, 2016-2018
Age-adjusted Drug-Related Death Rates (Three-Year Averages) by Community District (CD) of Residence, New York City, 2016-2018
• The three-year average age-adjusted drug-related death rate was highest in Mott Haven with 44.3 deaths per 100,000 population, followed by East Tremont at 39.7, University/Morris Heights at 34.4, East Harlem at 34.1, and Morrisania at 32.2.
• Age-adjusted drug-related death rates were lowest in Sunnyside/Woodside at 4.9 deaths per 100,000 population, followed by 5.2 in Borough Park, 5.5 in Greenwich Village/SOHO, 5.6 in Battery Park/Tribeca, and 5.8 in the Upper East Side.
CD MANHATTAN
Age-Adjusted
Drug-Related
Death Rate
CD BRONX
Age-Adjusted
Drug-Related
Death Rate
CD BROOKLYN
Age-Adjusted
Drug-Related
Death Rate
CD QUEENS
Age-Adjusted
Drug-Related
Death Rate
MN01 Battery Park, Tribeca 5.6 BX01 Mott Haven 44.3 BK01 Williamsburg, Greenpoint 12.3 QN01 Astoria, Long Island City 11.9
MN02 Greenwich Village, SOHO 5.5 BX02 Hunts Point 31.6 BK02 Fort Greene, Brooklyn Heights 12.1 QN02 Sunnyside, Woodside 4.9
MN03 Lower East Side 16.1 BX03 Morrisania 32.2 BK03 Bedford Stuyvesant 17.2 QN03 Jackson Heights 7.2
MN04 Chelsea, Clinton 13.2 BX04 Concourse, Highbridge 24.9 BK04 Bushwick 16.3 QN04 Elmhurst, Corona 6.2
MN05 Midtown Business District 12.2 BX05 University, Morris Heights 34.4 BK05 East New York 20.3 QN05 Ridgewood, Glendale 15.7
MN06 Murray Hill 9.4 BX06 East Tremont 39.7 BK06 Park Slope 12.7 QN06 Rego Park, Forest Hills 9.2
MN07 Upper West Side 8.9 BX07 Fordham 28.0 BK07 Sunset Park 8.9 QN07 Flushing 9.8
MN08 Upper East Side 5.8 BX08 Riverdale 14.9 BK08 Crown Heights North 13.9 QN08 Fresh Meadows, Briarwood 7.1
MN09 Manhattanville 21.9 BX09 Unionport, Soundview 19.2 BK09 Crown Heights South 12.4 QN09 Woodhaven 11.5
MN10 Central Harlem 28.6 BX10 Throgs Neck 21.9 BK10 Bay Ridge 11.0 QN10 Howard Beach 9.1
MN11 East Harlem 34.1 BX11 Pelham Parkway 16.0 BK11 Bensonhurst 10.7 QN11 Bayside 10.1
MN12 Washington Heights 16.9 BX12 Williamsbridge 18.7 BK12 Borough Park 5.2 QN12 Jamaica, St. Albans 13.9
BK13 Coney Island 20.4 QN13 Queens Village 6.8CD STATEN ISLAND BK14 Flatbush, Midwood 7.7 QN14 The Rockaways 19.5
SI01 Port Richmond 24.2 BK15 Sheepshead Bay 10.8
SI02 Willowbrook, South Beach 21.2 BK16 Brownsville 25.4
SI03 Tottenville 26.4 BK17 East Flatbush 6.3
BK18 Canarsie 8.7
Age-adjusted Drug-related Death RatePer 100,000 Population
Neighborhood Health Action CenterParks & Airports24.3 - 44.316.2 - 24.212.0 - 16.18.8 - 11.94.9 - 8.7
Source: Bureau of Vital Statistics, based on events occurring in 2016-2018.
Bronx
Queens
Brooklyn
Staten Island
Manhattan
Citywide average: 14.4
See Map of Community Districts and Boroughs, New York City on page 105.
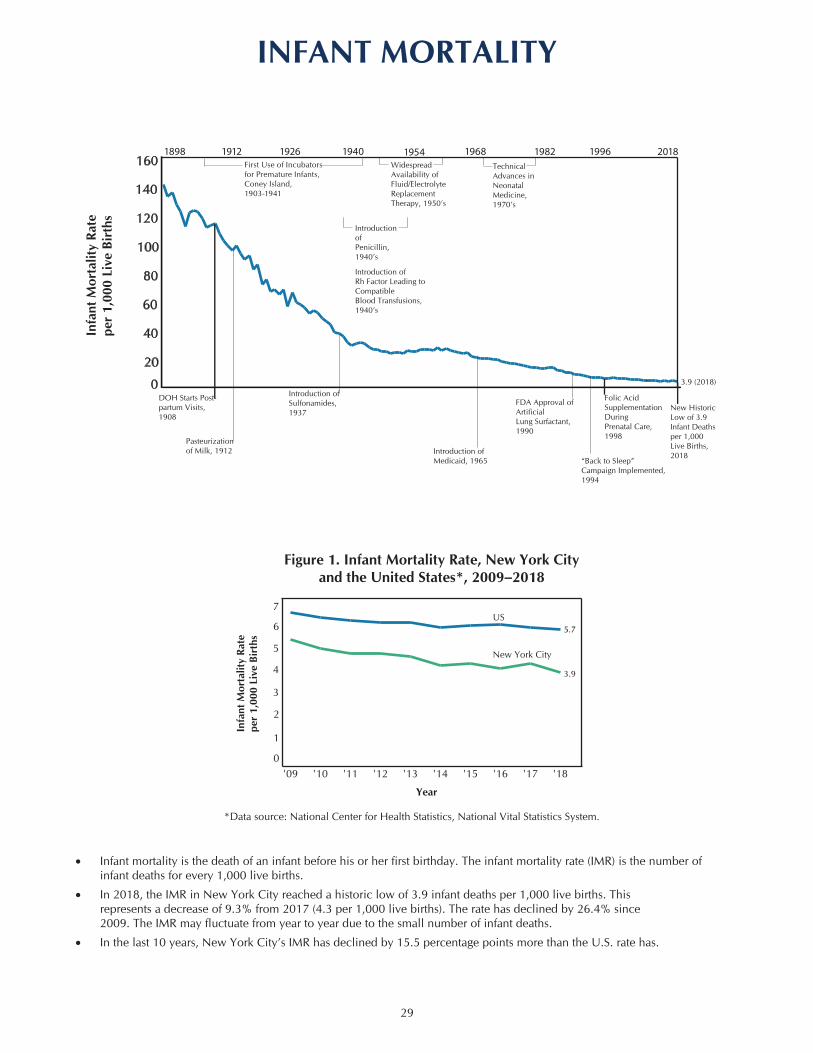
29
INFANT MORTALITYIn
fant
Mor
talit
y Ra
tepe
r 1,
000
Live
Bir
ths
0
20
40
60
80
100
120
140
160
Pasteurization of Milk, 1912
20181898 1912 1926 1940 1954 1968 1982 1996First Use of Incubators for Premature Infants, Coney Island, 1903-1941
DOH Starts Post-partum Visits, 1908
Introduction of Sulfonamides, 1937
Introduction of Penicillin, 1940’s
Introduction ofRh Factor Leading to Compatible Blood Transfusions, 1940’s
Widespread Availability of Fluid/Electrolyte Replacement Therapy, 1950’s
Introduction of Medicaid, 1965
Technical Advances in Neonatal Medicine, 1970’s
FDA Approval of Artificial Lung Surfactant, 1990
Folic Acid Supplementation During Prenatal Care, 1998
3.9 (2018)
New Historic Low of 3.9 Infant Deaths per 1,000Live Births, 2018
“Back to Sleep”Campaign Implemented, 1994
Figure 1. Infant Mortality Rate, New York City and the United States*, 2009–2018
• Infant mortality is the death of an infant before his or her first birthday. The infant mortality rate (IMR) is the number of infant deaths for every 1,000 live births.
• In 2018, the IMR in New York City reached a historic low of 3.9 infant deaths per 1,000 live births. This represents a decrease of 9.3% from 2017 (4.3 per 1,000 live births). The rate has declined by 26.4% since 2009. The IMR may fluctuate from year to year due to the small number of infant deaths.
• In the last 10 years, New York City’s IMR has declined by 15.5 percentage points more than the U.S. rate has.
0
1
2
3
4
5
6
7
'18'17'16'15'14'13'12'11'10'09
Year
Infa
nt M
orta
lity
Rate
per
1,00
0 Li
ve B
irth
s
3.9
New York City
US5.7
*Data source: National Center for Health Statistics, National Vital Statistics System.

30
INFANT MORTALITY
Figure 4. Infant Mortality Rate by Mother’s Age Group*, New York City, 2009–2018
• Infant mortality rates have decreased among infants born to women in all age groups since 2009.
• The infant mortality rate in New York City was highest among infants born to the youngest women (<20 years of age). In 2018, the rate among this group was 4.1 infant deaths per 1,000 live births. In 2018, the infant mortality rate for women in the ≥40 age group was 3.9 infant deaths per 1,000 live births. The small number of infant deaths may result in fluctuating rates from year to year.
Figure 2. Infant Mortality Rate by Mother’s Racial/Ethnic Group, New York City,
2009–2018• Infant mortality rates declined from 2017 to 2018 among
all racial/ethnic groups, except for non-Hispanic Blacks, for which the rate slightly increased from 7.8 infant deaths per 1,000 in 2017, to 7.9 in 2018.
• Although rates fluctuate due to small numbers, they are consistently higher among some groups: the rate for non-Hispanic Blacks was 3.4 times the rate for non-Hispanic Whites in 2018; the rate for Puerto Ricans was 2.3 times the rate for non-Hispanic Whites in 2018.
*The fluctuation in the infant mortality rate among infants born to women age <20 and ≥40 is likely due to small numbers.
Figure 3. Infant Mortality Rate by Neighborhood Poverty*, New York City
Residents, 2009 and 2018
• From 2009 to 2018, the infant mortality rate de-clined in all poverty groups: by 20.0% in both low and medium poverty areas, by 39.2% in high pov-erty areas, and by 33.8% in very high poverty areas.
• In spite of these gains, the infant mortality rate in very high poverty areas was 1.5 times the infant mortality rate in low poverty areas in 2018.
*Neighborhood poverty (based on woman’s residential census tract) is de-fined as percent of residents with incomes below 100% of the Federal Pov-erty Level, per the American Community Survey (ACS) 2005-2009 for 2009 data and per ACS 2013-2017 for 2018 data.†The citywide estimate is restricted to NYC residents.
0
2
4
6
8
10
12
Citywide
NH-Black
NH-White Asian & P.I.
Other Hispanic
Puerto Rican
'18'17'16'15'14'13'12'11'10'09
Year
Infa
nt M
orta
lity
Rate
per
1,00
0 Li
ve B
irth
s
7.9
5.3
3.9
2.72.3
3.4
0
2
4
6
8
10
12
Citywide†Low (<10%)
Medium (10 to <20%)
High (20 to <30%)
Very High (≥30%)
20182009
Infa
nt M
orta
lity
Rate
per
1,00
0 Li
ve B
irth
s
2.8
5.14.3
3.6
6.5
3.5
4.5
3.1
Neighborhood Poverty and Year
3.5
5.0
0
2
4
6
8
10
12
Citywide (3.9)
≥40 (3.9)
30-39
20-29 (3.7)
<20
'18'17'16'15'14'13'12'11'10'09
Year
Infa
nt M
orta
lity
Rate
per
1,00
0 Li
ve B
irth
s
4.1
3.3

31
INFANT MORTALITY
Figure 5. Infant Mortality Rates by Mother’s Birthplace, US-born and Countries of Top 5 IMR, 3-year
Moving Average, 2016-2018
0
2
4
6
8
10
12
PakistanGhanaEl SalvadorHaitiJamaicaPuerto RicoUS-born (excl. Puerto
Rico)
US-born
Infa
nt M
orta
lity
Rate
per
1,00
0 Li
ve B
irth
s
7.3
5.16.0
5.24.2
5.9
7.6
4.1
Birthplace
• From 2016 to 2018, the infant mortality rate among US-born women (excluding Puerto Rico) was 4.1 infant deaths per 1,000 live births. For the same time period, the infant mortality rate for US-born women (including Puerto Rico) was 4.2 infant deaths per 1,000 live births, and for Puerto Rico-born women, the rate was 5.2 infant deaths per 1,000 live births.
• The infant mortality rate was highest among women born in Jamaica at 7.6 infant deaths per 1,000 live births.
• Women born in Haiti had the second highest infant mortality rate at 7.3 per 1,000 births, followed by El Salvador-born women (6.0), Ghana-born women (5.9), and Pakistan-born women at 5.1 infant deaths per 1,000 live births.
Figure 6. Neonatal and Post-Neonatal Infant Mortality Rate, New York City, 2009-2018
0
1
2
3
4
5
6Post-Neonatal IMR
'18'17'16'15'14'13'12'11'10'09
Year
R
ate
per
1,00
0 Li
ve B
irth
s
Infant health
Post-Neonatal IMR
Neonatal IMR
• In 2018, the neonatal (infants who are less than 28 days old) infant mortality rate was 2.4 infant deaths per 1,000 live births, and the post-neonatal (infants 28 days to less than 1 year old) IMR was 1.5 infant deaths per 1,000 live births.
• Figure 6 illustrates the share of the IMR that is attributable to neonatal and post-neonatal deaths. The share of the IMR attributable to neonatal deaths decreased from 66.0% in 2009 to 61.5% in 2018. The share of the IMR attributable to post-neonatal deaths increased from 34.0% in 2009 to 38.5% in 2018.
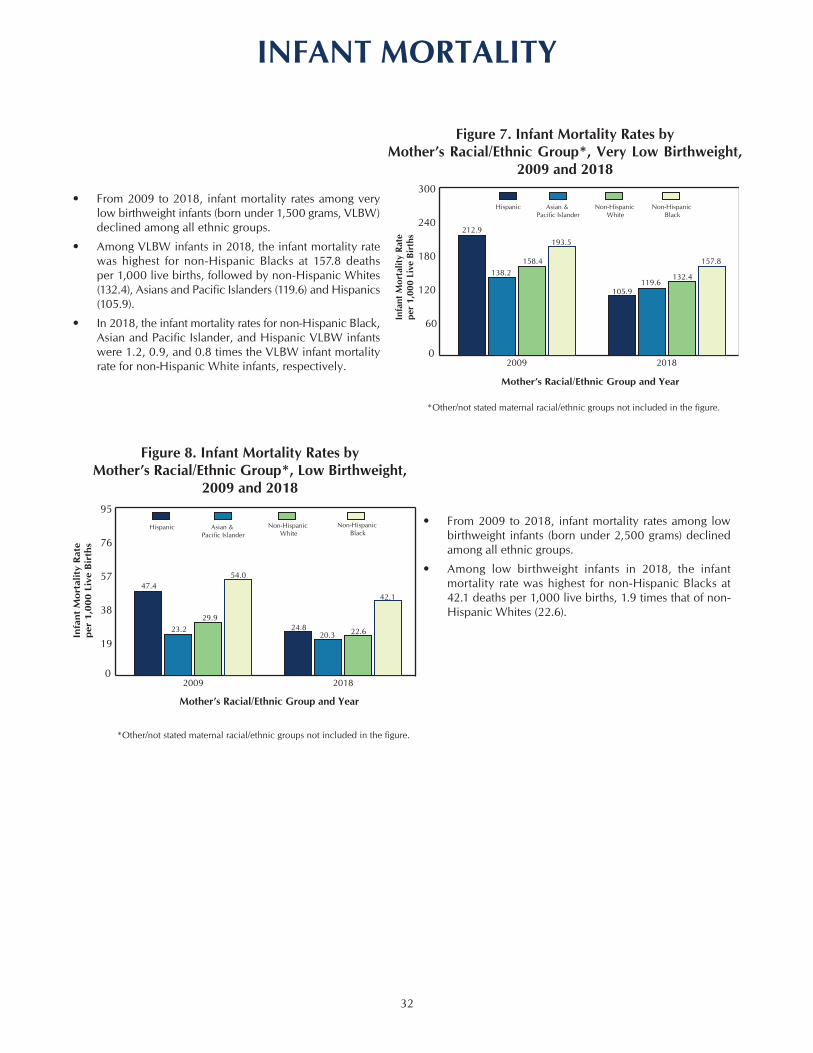
32
INFANT MORTALITY
Figure 7. Infant Mortality Rates by Mother’s Racial/Ethnic Group*, Very Low Birthweight,
2009 and 2018
• From 2009 to 2018, infant mortality rates among very low birthweight infants (born under 1,500 grams, VLBW) declined among all ethnic groups.
• Among VLBW infants in 2018, the infant mortality rate was highest for non-Hispanic Blacks at 157.8 deaths per 1,000 live births, followed by non-Hispanic Whites (132.4), Asians and Pacific Islanders (119.6) and Hispanics (105.9).
• In 2018, the infant mortality rates for non-Hispanic Black, Asian and Pacific Islander, and Hispanic VLBW infants were 1.2, 0.9, and 0.8 times the VLBW infant mortality rate for non-Hispanic White infants, respectively.
0
60
120
180
240
300
Non-Hispanic Black
Non-Hispanic White
Asian & Pacific Islander
Hispanic
20182009
Infa
nt M
orta
lity
Rate
per
1,00
0 Li
ve B
irth
s
132.4
157.8
119.6105.9
Mother’s Racial/Ethnic Group and Year
212.9
138.2158.4
193.5
Figure 8. Infant Mortality Rates by Mother’s Racial/Ethnic Group*, Low Birthweight,
2009 and 2018
0
19
38
57
76
95Non-Hispanic
BlackNon-Hispanic
WhiteAsian &
Pacific IslanderHispanic
20182009
Infa
nt M
orta
lity
Rat
epe
r 1,
000
Live
Bir
ths
22.6
42.1
20.324.8
Mother’s Racial/Ethnic Group and Year
23.2
47.4 54.0
29.9
• From 2009 to 2018, infant mortality rates among low birthweight infants (born under 2,500 grams) declined among all ethnic groups.
• Among low birthweight infants in 2018, the infant mortality rate was highest for non-Hispanic Blacks at 42.1 deaths per 1,000 live births, 1.9 times that of non-Hispanic Whites (22.6).
*Other/not stated maternal racial/ethnic groups not included in the figure.
*Other/not stated maternal racial/ethnic groups not included in the figure.
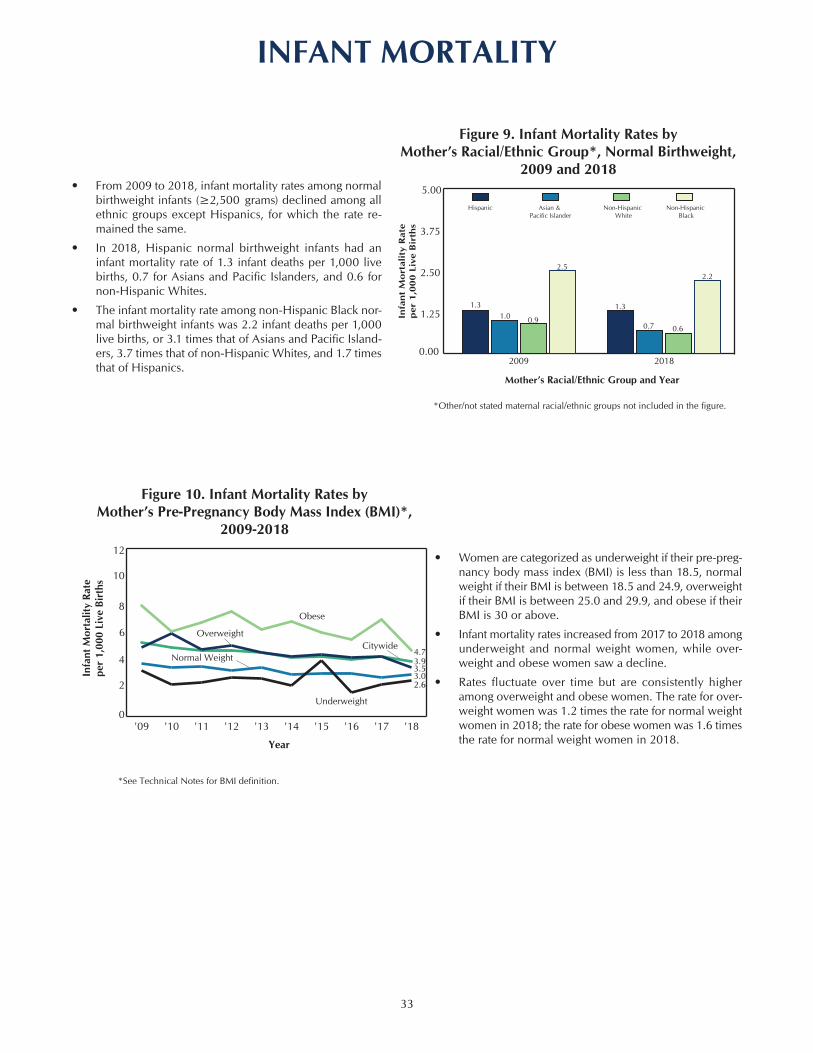
32 33
INFANT MORTALITY
Figure 10. Infant Mortality Rates by Mother’s Pre-Pregnancy Body Mass Index (BMI)*,
2009-2018
0
2
4
6
8
10
12
Citywide
Obese
Overweight
Normal Weight
Underweight
'18'17'16'15'14'13'12'11'10'09
Year
Infa
nt M
orta
lity
Rate
per
1,00
0 Li
ve B
irth
s
3.0
4.7
2.6
3.53.9
Figure 9. Infant Mortality Rates by Mother’s Racial/Ethnic Group*, Normal Birthweight,
2009 and 2018
0.00
1.25
2.50
3.75
5.00
Non-Hispanic Black
Non-Hispanic White
Asian & Pacific Islander
Hispanic
20182009
Infa
nt
Mo
rtal
ity
Rat
ep
er 1
,00
0 L
ive
Bir
ths
2.2
1.3
Mother’s Racial/Ethnic Group and Year
2.5
0.9
1.3
0.7 0.6
1.0
• From 2009 to 2018, infant mortality rates among normal birthweight infants (≥2,500 grams) declined among all ethnic groups except Hispanics, for which the rate re-mained the same.
• In 2018, Hispanic normal birthweight infants had an infant mortality rate of 1.3 infant deaths per 1,000 live births, 0.7 for Asians and Pacific Islanders, and 0.6 for non-Hispanic Whites.
• The infant mortality rate among non-Hispanic Black nor-mal birthweight infants was 2.2 infant deaths per 1,000 live births, or 3.1 times that of Asians and Pacific Island-ers, 3.7 times that of non-Hispanic Whites, and 1.7 times that of Hispanics.
*Other/not stated maternal racial/ethnic groups not included in the figure.
*See Technical Notes for BMI definition.
• Women are categorized as underweight if their pre-preg-nancy body mass index (BMI) is less than 18.5, normal weight if their BMI is between 18.5 and 24.9, overweight if their BMI is between 25.0 and 29.9, and obese if their BMI is 30 or above.
• Infant mortality rates increased from 2017 to 2018 among underweight and normal weight women, while over-weight and obese women saw a decline.
• Rates fluctuate over time but are consistently higher among overweight and obese women. The rate for over-weight women was 1.2 times the rate for normal weight women in 2018; the rate for obese women was 1.6 times the rate for normal weight women in 2018.
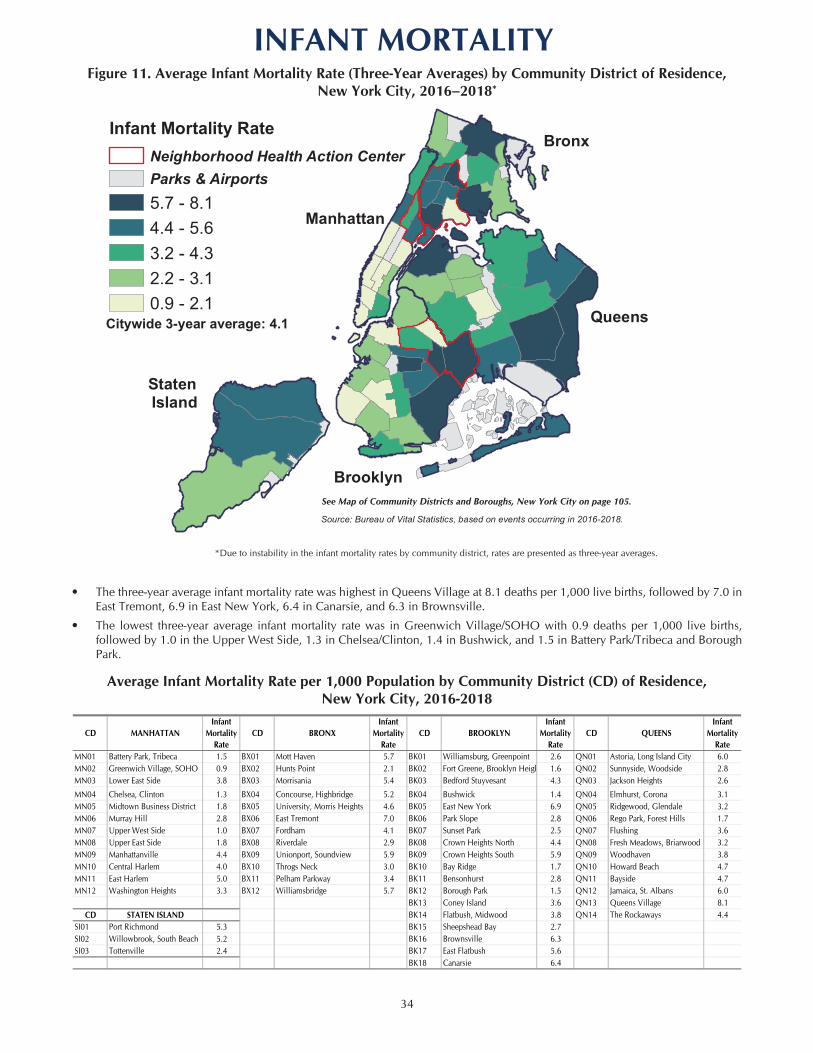
34
INFANT MORTALITYFigure 11. Average Infant Mortality Rate (Three-Year Averages) by Community District of Residence,
New York City, 2016–2018*
*Due to instability in the infant mortality rates by community district, rates are presented as three-year averages.
• The three-year average infant mortality rate was highest in Queens Village at 8.1 deaths per 1,000 live births, followed by 7.0 in East Tremont, 6.9 in East New York, 6.4 in Canarsie, and 6.3 in Brownsville.
• The lowest three-year average infant mortality rate was in Greenwich Village/SOHO with 0.9 deaths per 1,000 live births, followed by 1.0 in the Upper West Side, 1.3 in Chelsea/Clinton, 1.4 in Bushwick, and 1.5 in Battery Park/Tribeca and Borough Park.
Infant Mortality RateNeighborhood Health Action CenterParks & Airports5.7 - 8.14.4 - 5.63.2 - 4.32.2 - 3.10.9 - 2.1
Source: Bureau of Vital Statistics, based on events occurring in 2016-2018.
Bronx
Queens
Brooklyn
Staten Island
Manhattan
Citywide 3-year average: 4.1
Average Infant Mortality Rate per 1,000 Population by Community District (CD) of Residence, New York City, 2016-2018
CD MANHATTANInfant
Mortality Rate
CD BRONXInfant
Mortality Rate
CD BROOKLYNInfant
Mortality Rate
CD QUEENSInfant
Mortality Rate
MN01 Battery Park, Tribeca 1.5 BX01 Mott Haven 5.7 BK01 Williamsburg, Greenpoint 2.6 QN01 Astoria, Long Island City 6.0MN02 Greenwich Village, SOHO 0.9 BX02 Hunts Point 2.1 BK02 Fort Greene, Brooklyn Heights 1.6 QN02 Sunnyside, Woodside 2.8MN03 Lower East Side 3.8 BX03 Morrisania 5.4 BK03 Bedford Stuyvesant 4.3 QN03 Jackson Heights 2.6
MN04 Chelsea, Clinton 1.3 BX04 Concourse, Highbridge 5.2 BK04 Bushwick 1.4 QN04 Elmhurst, Corona 3.1MN05 Midtown Business District 1.8 BX05 University, Morris Heights 4.6 BK05 East New York 6.9 QN05 Ridgewood, Glendale 3.2MN06 Murray Hill 2.8 BX06 East Tremont 7.0 BK06 Park Slope 2.8 QN06 Rego Park, Forest Hills 1.7MN07 Upper West Side 1.0 BX07 Fordham 4.1 BK07 Sunset Park 2.5 QN07 Flushing 3.6MN08 Upper East Side 1.8 BX08 Riverdale 2.9 BK08 Crown Heights North 4.4 QN08 Fresh Meadows, Briarwood 3.2MN09 Manhattanville 4.4 BX09 Unionport, Soundview 5.9 BK09 Crown Heights South 5.9 QN09 Woodhaven 3.8MN10 Central Harlem 4.0 BX10 Throgs Neck 3.0 BK10 Bay Ridge 1.7 QN10 Howard Beach 4.7MN11 East Harlem 5.0 BX11 Pelham Parkway 3.4 BK11 Bensonhurst 2.8 QN11 Bayside 4.7MN12 Washington Heights 3.3 BX12 Williamsbridge 5.7 BK12 Borough Park 1.5 QN12 Jamaica, St. Albans 6.0
BK13 Coney Island 3.6 QN13 Queens Village 8.1CD STATEN ISLAND BK14 Flatbush, Midwood 3.8 QN14 The Rockaways 4.4
SI01 Port Richmond 5.3 BK15 Sheepshead Bay 2.7SI02 Willowbrook, South Beach 5.2 BK16 Brownsville 6.3SI03 Tottenville 2.4 BK17 East Flatbush 5.6
BK18 Canarsie 6.4
See Map of Community Districts and Boroughs, New York City on page 105.

35
PREGNANCY OUTCOMESBi
rth
Rate
per
1,00
0 Po
pula
tion
0
5
10
15
20
25
30
35
40
13.6 Birthsper 1,000 Population, 2018
20181898* 1913* 1926 1940 1954 1968 1982 1996
*1898-1913 birth counts are estimated, as numbers reported were determined to be incomplete.
First Birth Control Clinic Established in Brooklyn, NY byMargaret Sanger, 1916
DOH Establishes 12 Prenatal Care Clinics Across NYC, 1924
DOH Opens 5 MaternalCare Clinics Offering Birth Control Services, 1965
Roe v. Wade Abortion LegalizedDuring First Trimester,1973
FDA Approval of MedicalAbortion,2000
Widespread Condom Use by Returning GIs, 1920’s
AMA Recommends Contraception be part of Core Medical Training,1937
Contraception Covered as Required Preventive Service for Women Under the Affordable Care Act (signedinto law, 2010)
FDA Approval forOral Contraceptives, 1960
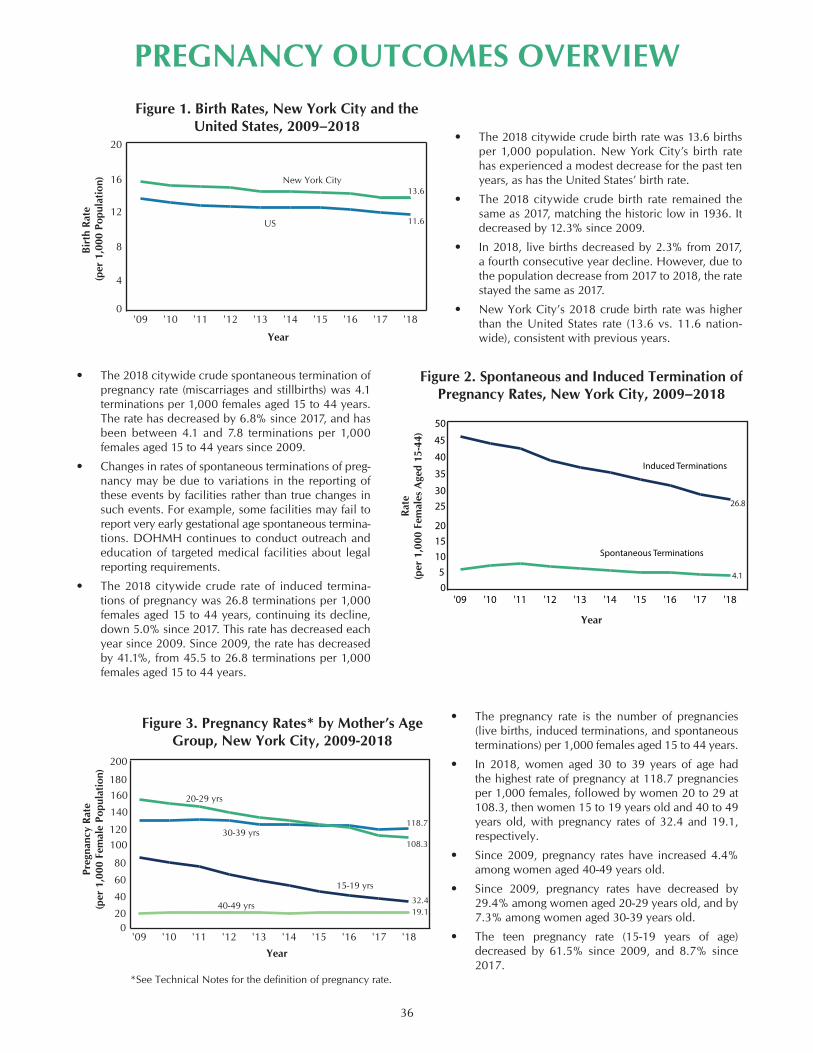
36
PREGNANCY OUTCOMES OVERVIEWFigure 1. Birth Rates, New York City and the
United States, 2009–2018
Figure 2. Spontaneous and Induced Termination of Pregnancy Rates, New York City, 2009–2018
Figure 3. Pregnancy Rates* by Mother’s Age Group, New York City, 2009-2018
• The 2018 citywide crude birth rate was 13.6 births per 1,000 population. New York City’s birth rate has experienced a modest decrease for the past ten years, as has the United States’ birth rate.
• The 2018 citywide crude birth rate remained the same as 2017, matching the historic low in 1936. It decreased by 12.3% since 2009.
• In 2018, live births decreased by 2.3% from 2017, a fourth consecutive year decline. However, due to the population decrease from 2017 to 2018, the rate stayed the same as 2017.
• New York City’s 2018 crude birth rate was higher than the United States rate (13.6 vs. 11.6 nation-wide), consistent with previous years.
• The 2018 citywide crude spontaneous termination of pregnancy rate (miscarriages and stillbirths) was 4.1 terminations per 1,000 females aged 15 to 44 years. The rate has decreased by 6.8% since 2017, and has been between 4.1 and 7.8 terminations per 1,000 females aged 15 to 44 years since 2009.
• Changes in rates of spontaneous terminations of preg-nancy may be due to variations in the reporting of these events by facilities rather than true changes in such events. For example, some facilities may fail to report very early gestational age spontaneous termina-tions. DOHMH continues to conduct outreach and education of targeted medical facilities about legal reporting requirements.
• The 2018 citywide crude rate of induced termina-tions of pregnancy was 26.8 terminations per 1,000 females aged 15 to 44 years, continuing its decline, down 5.0% since 2017. This rate has decreased each year since 2009. Since 2009, the rate has decreased by 41.1%, from 45.5 to 26.8 terminations per 1,000 females aged 15 to 44 years.
• The pregnancy rate is the number of pregnancies (live births, induced terminations, and spontaneous terminations) per 1,000 females aged 15 to 44 years.
• In 2018, women aged 30 to 39 years of age had the highest rate of pregnancy at 118.7 pregnancies per 1,000 females, followed by women 20 to 29 at 108.3, then women 15 to 19 years old and 40 to 49 years old, with pregnancy rates of 32.4 and 19.1, respectively.
• Since 2009, pregnancy rates have increased 4.4% among women aged 40-49 years old.
• Since 2009, pregnancy rates have decreased by 29.4% among women aged 20-29 years old, and by 7.3% among women aged 30-39 years old.
• The teen pregnancy rate (15-19 years of age) decreased by 61.5% since 2009, and 8.7% since 2017.
0
4
8
12
16
20
US
New York City
'18'17'16'15'14'13'12'11'10'09
Year
Birt
h Ra
te
(per
1,0
00 P
opul
atio
n)
13.6
11.6
05
101520
2530
35
40
45
50
Induced Terminations
Spontaneous Terminations
'18'17'16'15'14'13'12'11'10'09
Year
Rate
(per
1,0
00 F
emal
es A
ged
15-4
4)
26.8
4.1
020
40
60
80
100120
140
160180
200
'18'17'16'15'14'13'12'11'10'09
Year
108.3
118.7
32.419.1
Pre
gnan
cy R
ate
(per
1,0
00 F
emal
e Po
pula
tion)
40-49 yrs
30-39 yrs
20-29 yrs
15-19 yrs
*See Technical Notes for the definition of pregnancy rate.

36 37
PREGNANCY OUTCOMES OVERVIEWFigure 4. Pregnancy Rates by Mother’s Racial/
Ethnic Group, New York City, 2009-2018
Figure 5. Pregnancy Rates by Mother’s Borough of Residence, New York City, 2009-2018
Figure 6. Birth Rates by Mother’s Racial/Ethnic Group, New York City, 2009-2018
• Since 2009, the citywide pregnancy rate has declined by 21.3%, from 117.6 pregnancies per 1,000 females aged 15-44 to 92.6.
• In 2018, the pregnancy rate was highest among non-Hispanic Blacks at 99.5 pregnancies per 1,000 females aged 15-44, followed by 87.1 among Hispanics, 85.0 among non-Hispanic Whites, and 77.3 among Asians and Pacific Islanders.
• From 2009 to 2018, the pregnancy rate decreased among all groups, except for non-Hispanic Whites, for which the rate remained the same. Over the ten year period, non-Hispanic Blacks experienced a 37.7% decline; Hispanics, a 32.1% decline; and Asians and Pacific Islanders, a 13.0% decline.
• In 2018, the pregnancy rate in the Bronx continued to be the highest, at 98.8 pregnancies per 1,000 females aged 15-44, followed by Brooklyn at 90.2, Queens at 80.4, Staten Island at 73.5, and Manhattan at 67.5.
• Since 2009, pregnancy rates have declined in all boroughs. Rates have decreased by 27.5% in the Bronx, by 27.1% in Brooklyn, by 17.0% in Manhattan, by 16.0% in Queens, and by 23.4% in Staten Island.
• In 2018, the birth rate was highest among Asians and Pacific Islanders at 15.4 births per 1,000 population, followed by 15.0 among non-Hispanic Whites, 12.9 among Hispanics, and 11.4 among non-Hispanic Blacks.
• From 2009 to 2018, the birth rate increased among non-Hispanic Whites by 8.7%, and decreased among all other groups. Over the ten year period, non-Hispanic Blacks experienced a 21.4% decline; Hispanics, a 25.9% decline; and Asians and Pacific Islanders, a 7.8% decline.
020
40
60
80
100
120
140
160
180
200
Citywide NH-Black
NH-White (85.0)
Asian & P.I.
Hispanic (87.1)
'18'17'16'15'14'13'12'11'10'09
Year
Preg
nanc
y Ra
te
(per
1,0
00 F
emal
es A
ged
15-4
4)
92.6
77.3
99.5
015
3045
60
75
90105120
135
150
Staten Island
Citywide (92.6)
Queens
Brooklyn (90.2)
Bronx
Manhattan
'18'17'16'15'14'13'12'11'10'09
Year
Pre
gnan
cy R
ate
(per
1,0
00 F
emal
es A
ged
15-4
4)
67.5
80.4
98.8
73.5
10
12
14
16
18
20
Citywide
NH-Black
NH-White
Asian & P.I.
Hispanic
'18'17'16'15'14'13'12'11'10'09
Year
Bir
th R
ate
(per
1,0
00 P
opul
atio
n)
15.415.0
13.612.9
11.4
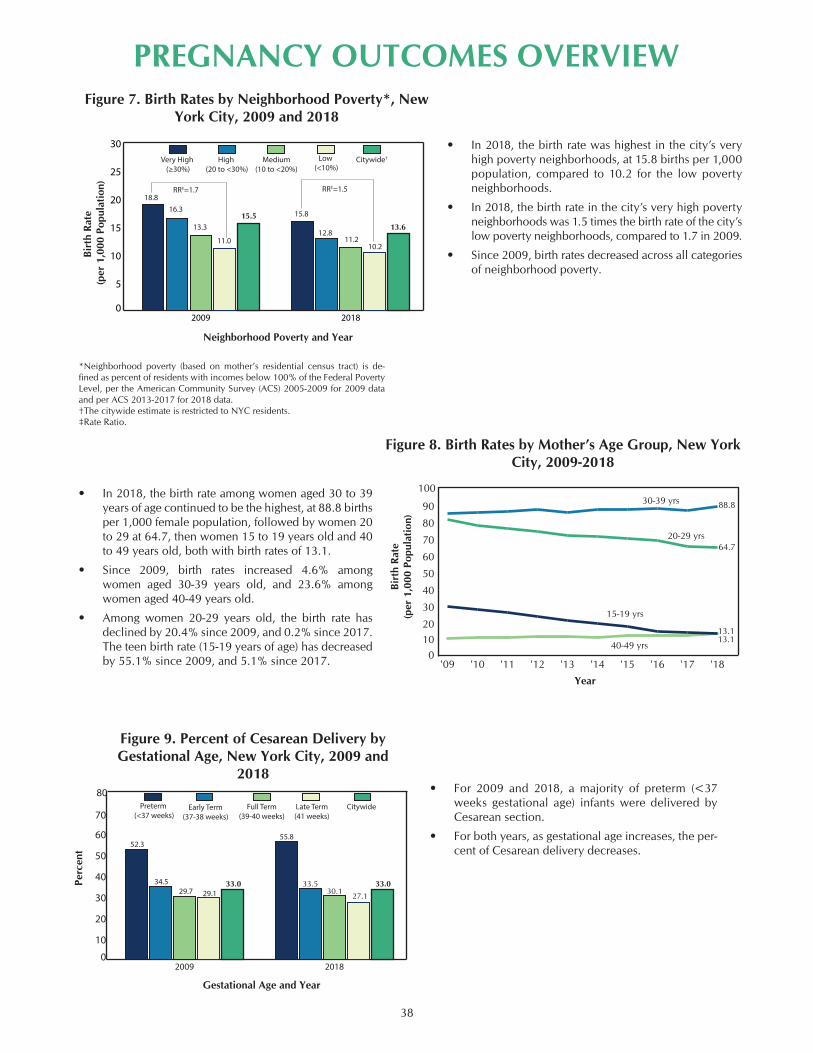
38
PREGNANCY OUTCOMES OVERVIEWFigure 7. Birth Rates by Neighborhood Poverty*, New
York City, 2009 and 2018
Figure 8. Birth Rates by Mother’s Age Group, New York City, 2009-2018
Figure 9. Percent of Cesarean Delivery by Gestational Age, New York City, 2009 and
2018
• In 2018, the birth rate was highest in the city’s very high poverty neighborhoods, at 15.8 births per 1,000 population, compared to 10.2 for the low poverty neighborhoods.
• In 2018, the birth rate in the city’s very high poverty neighborhoods was 1.5 times the birth rate of the city’s low poverty neighborhoods, compared to 1.7 in 2009.
• Since 2009, birth rates decreased across all categories of neighborhood poverty.
• In 2018, the birth rate among women aged 30 to 39 years of age continued to be the highest, at 88.8 births per 1,000 female population, followed by women 20 to 29 at 64.7, then women 15 to 19 years old and 40 to 49 years old, both with birth rates of 13.1.
• Since 2009, birth rates increased 4.6% among women aged 30-39 years old, and 23.6% among women aged 40-49 years old.
• Among women 20-29 years old, the birth rate has declined by 20.4% since 2009, and 0.2% since 2017. The teen birth rate (15-19 years of age) has decreased by 55.1% since 2009, and 5.1% since 2017.
• For 2009 and 2018, a majority of preterm (<37 weeks gestational age) infants were delivered by Cesarean section.
• For both years, as gestational age increases, the per-cent of Cesarean delivery decreases.
0
5
10
15
20
25
30
20182009
Birt
h Ra
te
(per
1,0
00 P
opul
atio
n)
10.211.211.0
12.813.613.3
15.516.3 15.8
Neighborhood Poverty and Year
Citywide†Low (<10%)
Medium(10 to <20%)
High (20 to <30%)
Very High (≥30%)
RR‡=1.7 RR‡=1.518.8
01020
30
40
50
60
70
80
90
100
'18'17'16'15'14'13'12'11'10'09
Year
88.8
64.7
13.113.1
Bir
th R
ate
(per
1,0
00 P
opul
atio
n)
40-49 yrs
30-39 yrs
20-29 yrs
15-19 yrs
0
10
20
30
40
50
60
70
80
20182009
55.8
33.029.7
34.5
52.3
Gestational Age and Year
CitywideLate Term(41 weeks)
Full Term(39-40 weeks)
Early Term(37-38 weeks)
Preterm (<37 weeks)
Perc
ent
29.133.0
27.1
33.530.1
*Neighborhood poverty (based on mother’s residential census tract) is de-fined as percent of residents with incomes below 100% of the Federal Poverty Level, per the American Community Survey (ACS) 2005-2009 for 2009 data and per ACS 2013-2017 for 2018 data. †The citywide estimate is restricted to NYC residents.‡Rate Ratio.
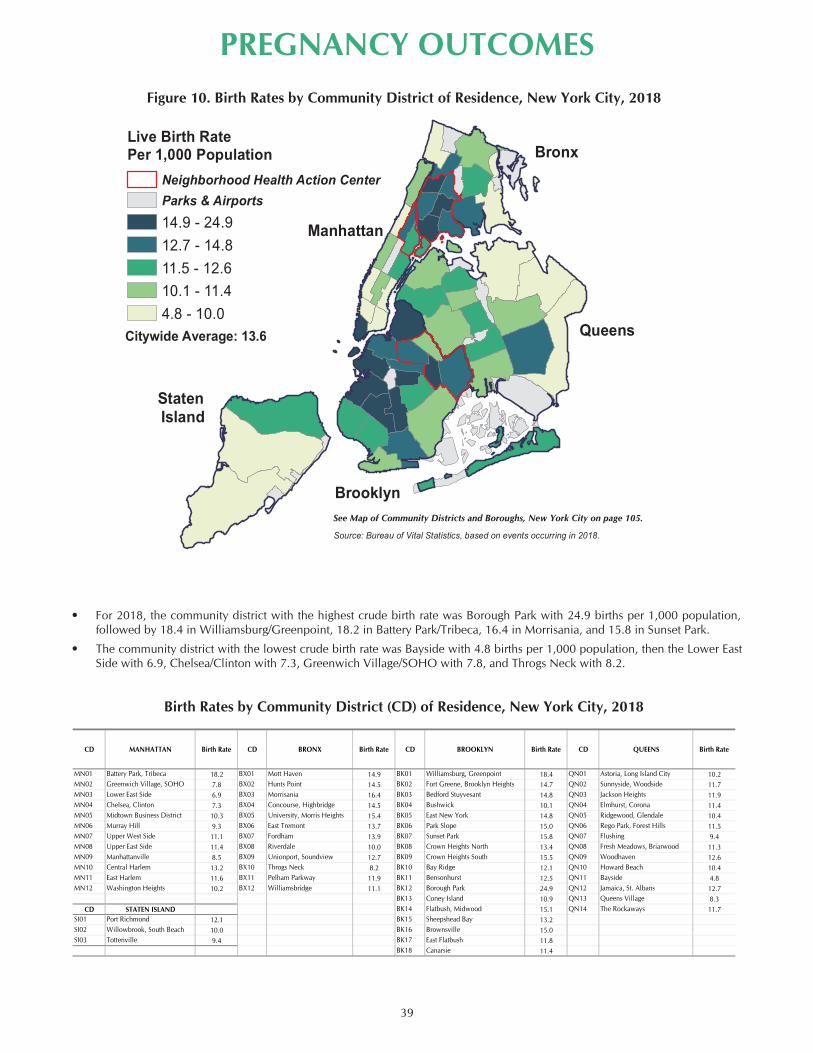
38 39
PREGNANCY OUTCOMESFigure 10. Birth Rates by Community District of Residence, New York City, 2018
Birth Rates by Community District (CD) of Residence, New York City, 2018
• For 2018, the community district with the highest crude birth rate was Borough Park with 24.9 births per 1,000 population, followed by 18.4 in Williamsburg/Greenpoint, 18.2 in Battery Park/Tribeca, 16.4 in Morrisania, and 15.8 in Sunset Park.
• The community district with the lowest crude birth rate was Bayside with 4.8 births per 1,000 population, then the Lower East Side with 6.9, Chelsea/Clinton with 7.3, Greenwich Village/SOHO with 7.8, and Throgs Neck with 8.2.
Live Birth RatePer 1,000 Population
Neighborhood Health Action CenterParks & Airports14.9 - 24.912.7 - 14.811.5 - 12.610.1 - 11.44.8 - 10.0
Source: Bureau of Vital Statistics, based on events occurring in 2018.
Bronx
Queens
Brooklyn
Staten Island
Manhattan
Citywide Average: 13.6
CD MANHATTAN Birth Rate CD BRONX Birth Rate CD BROOKLYN Birth Rate CD QUEENS Birth Rate
MN01 Battery Park, Tribeca 18.2 BX01 Mott Haven 14.9 BK01 Williamsburg, Greenpoint 18.4 QN01 Astoria, Long Island City 10.2MN02 Greenwich Village, SOHO 7.8 BX02 Hunts Point 14.5 BK02 Fort Greene, Brooklyn Heights 14.7 QN02 Sunnyside, Woodside 11.7MN03 Lower East Side 6.9 BX03 Morrisania 16.4 BK03 Bedford Stuyvesant 14.8 QN03 Jackson Heights 11.9MN04 Chelsea, Clinton 7.3 BX04 Concourse, Highbridge 14.5 BK04 Bushwick 10.1 QN04 Elmhurst, Corona 11.4MN05 Midtown Business District 10.3 BX05 University, Morris Heights 15.4 BK05 East New York 14.8 QN05 Ridgewood, Glendale 10.4MN06 Murray Hill 9.3 BX06 East Tremont 13.7 BK06 Park Slope 15.0 QN06 Rego Park, Forest Hills 11.5MN07 Upper West Side 11.1 BX07 Fordham 13.9 BK07 Sunset Park 15.8 QN07 Flushing 9.4MN08 Upper East Side 11.4 BX08 Riverdale 10.0 BK08 Crown Heights North 13.4 QN08 Fresh Meadows, Briarwood 11.3MN09 Manhattanville 8.5 BX09 Unionport, Soundview 12.7 BK09 Crown Heights South 15.5 QN09 Woodhaven 12.6MN10 Central Harlem 13.2 BX10 Throgs Neck 8.2 BK10 Bay Ridge 12.1 QN10 Howard Beach 10.4MN11 East Harlem 11.6 BX11 Pelham Parkway 11.9 BK11 Bensonhurst 12.5 QN11 Bayside 4.8MN12 Washington Heights 10.2 BX12 Williamsbridge 11.1 BK12 Borough Park 24.9 QN12 Jamaica, St. Albans 12.7
BK13 Coney Island 10.9 QN13 Queens Village 8.3CD STATEN ISLAND BK14 Flatbush, Midwood 15.1 QN14 The Rockaways 11.7
SI01 Port Richmond 12.1 BK15 Sheepshead Bay 13.2SI02 Willowbrook, South Beach 10.0 BK16 Brownsville 15.0SI03 Tottenville 9.4 BK17 East Flatbush 11.8
BK18 Canarsie 11.4
See Map of Community Districts and Boroughs, New York City on page 105.

40
TEEN BIRTHS
Figure 11. Teen Birth Rates by Mother’s Racial/Ethnic Group, New York City, 2009–2018
Figure 12. Teen Birth Rate by Neighborhood Poverty*, New York City Residents, 2009 and
2018
• From 2009 to 2018, the teen birth rate declined by 55.1% overall. Teen birth rates also declined for all racial/ethnic groups: by 54.9% among Hispanics, 55.8% among non-Hispanic Blacks, 33.3% among non-Hispanic Whites, and 47.1% among Asians and Pacific Islanders.
• The teen birth rate among Hispanics remains high compared to that of non-Hispanic Whites. In 2009 the teen birth rate for Hispanics was 5.7 times that of non-Hispanic Whites. In 2018, the teen birth rate for Hispanics was 3.8 times that of non-Hispanic Whites.
• In 2018, the teen birth rate among non-Hispanic Blacks was 2.6 times that of non-Hispanic Whites, reflecting a narrowing of the difference since 2009, when it was 3.9 times that of non-Hispanic Whites.
‡ Rate Ratio.
• Between 2009 and 2018, teen birth rates declined across all poverty levels: by 53.9% in the city’s very high poverty neighborhoods, by 55.4% in high poverty neighborhoods, by 61.2% in medium pov-erty neighborhoods, and by 61.7% in low poverty neighborhoods.
• Although rates have declined, the disparity between low poverty and very high poverty neighborhoods has increased. Teen birth rates remain comparatively high in the city’s very high poverty neighborhoods. In 2018, the teen birth rate in very high poverty neighborhoods was 4.7 times that of low poverty neighborhoods; in 2009, it was 3.9 times that of low poverty neighborhoods.
Figure 13. Teen Birth Rates by Age Group, New York City, 2009–2018
• From 2009 to 2018, birth rates declined among all teenagers, regardless of age. Among teens less than 18 years of age, the birth rate declined over this pe-riod by 62.4%; among women 18-19, it declined by 52.4%. The overall rate of teen birth (births to women <20) declined by 55.1%.
*Neighborhood poverty (based on mother’s residential census tract) is de-fined as percent of residents with incomes below 100% of the Federal Pov-erty Level, per the American Community Survey (ACS) 2005-2009 for 2009 data and per ACS 2013-2017 for 2018 data.†The citywide estimate is restricted to NYC residents.
0
10
20
30
40
50
60
70
Citywide (Teen Only)
NH-Black
NH-White
Asian & PI
Hispanic
'18'17'16'15'14'13'12'11'10'09
Year
Birt
h Ra
te
(per
1,0
00 F
emal
es A
ged
15-1
9)
21.514.413.1
5.62.7
0
10
20
30
40
50
60
US (<20)
New York City (<20)
18-19
<18
'18'17'16'15'14'13'12'11'10'09
Year
Birt
h Ra
te
(per
1,0
00 F
emal
es A
ged
15-1
9)
22.6
13.117.4
5.9
0
10
20
30
40
50
60
70
20182009
RR‡=3.9
4.49.5
11.515.4
13.1
24.529.2
34.5
20.8
45.1
Neighborhood Poverty and Year
Citywide†Low (<10%)
Medium(10 to <20%)
High (20 to <30%)
Very High (≥30%)
Birt
h Ra
te
(per
1,0
00 F
emal
es A
ged
15-1
9)
RR‡=4.7

41
TEEN BIRTHSFigure 14. Percent of Live Births to Teenagers (Three-Year Averages) by Community District of Residence,
New York City, 2016-2018
Percent of Live Births to Teenagers (Three-Year Averages) by Community District (CD) of Residence, New York City, 2016-2018
• The community district with the highest percentage (three-year average) of live births to teenagers (<20 years) was East Tremont with 7.1%, followed by Mott Haven with 6.8%, Brownsville with 6.3%, Hunts Point and University/Morris Heights with 5.7%, and Morrisania and Concourse/Highbridge with 5.5%.
• The following community districts had less than 1% of live births to teenagers: Battery Park/Tribeca, Greenwich Village/SOHO, Midtown Business District, Murray Hill, Upper West Side, Upper East Side, Park Slope, Rego Park/Forest Hills, Bayside, and Tottenville.
CD MANHATTANBirth
PercentageCD BRONX
Birth Percentage
CD BROOKLYNBirth
PercentageCD QUEENS
Birth Percentage
MN01 Battery Park, Tribeca 0.0 BX01 Mott Haven 6.8 BK01 Williamsburg, Greenpoint 1.5 QN01 Astoria, Long Island City 2.1MN02 Greenwich Village, SOHO 0.2 BX02 Hunts Point 5.7 BK02 Fort Greene, Brooklyn Heights 1.1 QN02 Sunnyside, Woodside 1.1MN03 Lower East Side 2.4 BX03 Morrisania 5.5 BK03 Bedford Stuyvesant 3.5 QN03 Jackson Heights 4.1MN04 Chelsea, Clinton 1.2 BX04 Concourse, Highbridge 5.5 BK04 Bushwick 5.3 QN04 Elmhurst, Corona 2.9MN05 Midtown Business District 0.5 BX05 University, Morris Heights 5.7 BK05 East New York 5.4 QN05 Ridgewood, Glendale 2.5MN06 Murray Hill 0.4 BX06 East Tremont 7.1 BK06 Park Slope 0.7 QN06 Rego Park, Forest Hills 0.7MN07 Upper West Side 0.7 BX07 Fordham 4.8 BK07 Sunset Park 2.6 QN07 Flushing 1.4MN08 Upper East Side 0.1 BX08 Riverdale 2.2 BK08 Crown Heights North 2.6 QN08 Fresh Meadows, Briarwood 1.2MN09 Manhattanville 4.5 BX09 Unionport, Soundview 5.3 BK09 Crown Heights South 1.4 QN09 Woodhaven 2.8MN10 Central Harlem 3.6 BX10 Throgs Neck 2.9 BK10 Bay Ridge 1.3 QN10 Howard Beach 2.7MN11 East Harlem 4.0 BX11 Pelham Parkway 3.8 BK11 Bensonhurst 1.6 QN11 Bayside 0.5MN12 Washington Heights 3.8 BX12 Williamsbridge 5.3 BK12 Borough Park 1.7 QN12 Jamaica, St. Albans 4.0
BK13 Coney Island 3.7 QN13 Queens Village 2.5CD STATEN ISLAND BK14 Flatbush, Midwood 2.3 QN14 The Rockaways 4.9
SI01 Port Richmond 4.3 BK15 Sheepshead Bay 1.6SI02 Willowbrook, South Beach 1.3 BK16 Brownsville 6.3SI03 Tottenville 0.6 BK17 East Flatbush 3.6
BK18 Canarsie 2.2
Percent of Live Birthsto Teenagers (age < 20 Years)
Neighborhood Health Action CenterParks & Airports5.4 - 7.13.7 - 5.32.3 - 3.6
Source: Bureau of Vital Statistics, based on events occurring in 2016-2018.
Bronx
Queens
Brooklyn
Staten Island
Manhattan
1.2 - 2.20.0 - 1.1
Citywide Average: 2.7
See Map of Community Districts and Boroughs, New York City on page 105.

42
INDUCED TERMINATION OF PREGNANCY
Figure 15. Age-Adjusted Induced Termination of Pregnancy Rates by Woman’s Racial/Ethnic
Group, New York City, 2009–2018
Figure 17. Induced Termination of Pregnancy Rates by Medical vs. Surgical Procedure,
New York City, 2009–2018
Figure 16. Age-specific Induced Termination of Pregnancy Rates by Woman’s Age Group, New
York City, 2009–2018
• The 2018 citywide age-adjusted rate of induced terminations of pregnancy (at 24.9 terminations per 1,000 females aged 15 to 44 years) declined by 41.7% since 2009. Similarly, age-adjusted rates among each racial/ethnic group declined: 47.8% among Asians and Pacific Islanders, 48.6% among Hispanics, 54.2% among non-Hispanic Blacks, and 30.9% among non-Hispanic Whites.
• The disparity between non-Hispanic White and non-Hispanic Black induced termination of pregnancy rates has narrowed since 2009. The rate among non-Hispanic Blacks was 3.8 times that of non-Hispanic Whites (39.9 terminations per 1,000 females aged 15-44 vs. 10.5) in 2018, compared to 5.7 times in 2009.
• Medication-induced abortion, using mifepristone in combination with misoprostol, is termed a “medical abortion” and may be performed up to nine weeks of gestation, rather than a surgical procedure, to ter-minate a pregnancy. Medical abortion is not to be confused with the morning-after pill, also known as emergency contraception, which is used to prevent pregnancy.
• Since 2009, the crude rate of medical abortion in New York City increased 56.3%, to 7.5 terminations per 1,000 females aged 15-44, while the rate of surgi-cal abortion decreased 52.3% to 19.3 terminations per 1,000 females aged 15-44.
• The 2018 crude citywide rate of induced terminations of pregnancy declined 41.1% since 2009, from 45.5 to 26.8 terminations per 1,000 females aged 15-49 years.
• Since 2009, the age-specific rate declined 64.8% among teens (15 to 19 years of age), from 52.5 termina-tions per 1,000 females in 2009, to 18.5 in 2018. The rate declined by 39.4% among women 20 to 29 years of age, 31.7% among women 30 to 39 years of age and 24.1% among women 40 and older.
• Rates remain the highest among women 20 to 29 years of age, followed by women 30 to 39 years of age, then teens, and women 40 and over.
01020
30
40
50
60
70
80
90
100
Citywide (24.9)
NH-Black (39.9)
NH-White (10.5)
Asian & PI (9.5)
Hispanic (24.2)
'18'17'16'15'14'13'12'11'10'09
Year
Rat
e (P
er 1
,000
Fem
ales
Age
d 15
-44)
01020
30
40
50
60
70
80
90
100
Citywide
40-49
30-39
20-2915-19
'18'17'16'15'14'13'12'11'10'09
Year
40.1
23.9 18.5
4.1
26.8
Rate
(Per
1,0
00 F
emal
es A
ged
15-4
9)
01020
30
40
50
60
70
80
90
100
Citywide
Surgical
Medical
'18'17'16'15'14'13'12'11'10'09
Year
19.3
7.5
26.8
Rat
e (P
er 1
,000
Fem
ales
Age
d 15
-44)
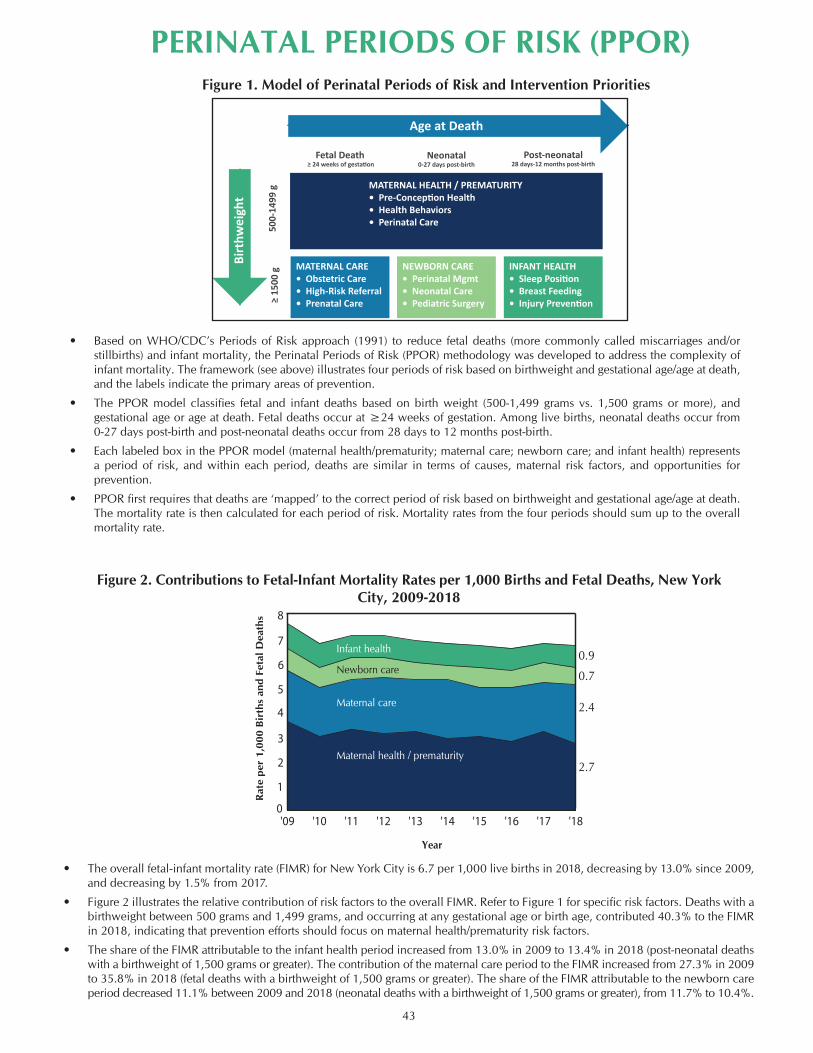
43
PERINATAL PERIODS OF RISK (PPOR)Figure 1. Model of Perinatal Periods of Risk and Intervention Priorities
Figure 2. Contributions to Fetal-Infant Mortality Rates per 1,000 Births and Fetal Deaths, New York City, 2009-2018
• Based on WHO/CDC’s Periods of Risk approach (1991) to reduce fetal deaths (more commonly called miscarriages and/or stillbirths) and infant mortality, the Perinatal Periods of Risk (PPOR) methodology was developed to address the complexity of infant mortality. The framework (see above) illustrates four periods of risk based on birthweight and gestational age/age at death, and the labels indicate the primary areas of prevention.
• The PPOR model classifies fetal and infant deaths based on birth weight (500-1,499 grams vs. 1,500 grams or more), and gestational age or age at death. Fetal deaths occur at ≥24 weeks of gestation. Among live births, neonatal deaths occur from 0-27 days post-birth and post-neonatal deaths occur from 28 days to 12 months post-birth.
• Each labeled box in the PPOR model (maternal health/prematurity; maternal care; newborn care; and infant health) represents a period of risk, and within each period, deaths are similar in terms of causes, maternal risk factors, and opportunities for prevention.
• PPOR first requires that deaths are ‘mapped’ to the correct period of risk based on birthweight and gestational age/age at death. The mortality rate is then calculated for each period of risk. Mortality rates from the four periods should sum up to the overall mortality rate.
• The overall fetal-infant mortality rate (FIMR) for New York City is 6.7 per 1,000 live births in 2018, decreasing by 13.0% since 2009, and decreasing by 1.5% from 2017.
• Figure 2 illustrates the relative contribution of risk factors to the overall FIMR. Refer to Figure 1 for specific risk factors. Deaths with a birthweight between 500 grams and 1,499 grams, and occurring at any gestational age or birth age, contributed 40.3% to the FIMR in 2018, indicating that prevention efforts should focus on maternal health/prematurity risk factors.
• The share of the FIMR attributable to the infant health period increased from 13.0% in 2009 to 13.4% in 2018 (post-neonatal deaths with a birthweight of 1,500 grams or greater). The contribution of the maternal care period to the FIMR increased from 27.3% in 2009 to 35.8% in 2018 (fetal deaths with a birthweight of 1,500 grams or greater). The share of the FIMR attributable to the newborn care period decreased 11.1% between 2009 and 2018 (neonatal deaths with a birthweight of 1,500 grams or greater), from 11.7% to 10.4%.
0
1
2
3
4
5
6
7
8
Maternal health
'18'17'16'15'14'13'12'11'10'09
Year
Rat
e pe
r 1,
000
Bir
ths
and
Feta
l Dea
ths
Infant health
Newborn care
Maternal care
Maternal health / prematurity
0.9
0.7
2.4
2.7
MATERNAL CARE• Obstetric Care• High-Risk Referral• Prenatal Care
NEWBORN CARE• Perinatal Mgmt• Neonatal Care• Pediatric Surgery
INFANT HEALTH• Sleep Posi�on• Breast Feeding• Injury Preven�on
Fetal Death ≥ 24 weeks of gesta�on
Neonatal0-27 days post-birth
Post-neonatal28 days-12 months post-birth
≥ 15
00 g
500-
1499
g
Age at Death
Birt
hwei
ght
MATERNAL HEALTH / PREMATURITY• Pre-Concep�on Health• Health Behaviors• Perinatal Care

44
PERINATAL PERIODS OF RISK (PPOR)
Table 1. Fetal-Infant Mortality Rate per 1,000 Births and Fetal Deaths by Perinatal Period of Risk, Year, and Mother’s Racial/Ethnic Group, New York City, 2014-2018
Births & Fetal
Deaths*Year Number Number Rate Number Rate Number Rate Number Rate Number Rate2014 122,416 354 2.9 295 2.4 71 0.6 107 0.9 827 6.82015 121,966 366 3.0 238 2.0 101 0.8 107 0.9 812 6.72016 120,702 344 2.8 271 2.2 88 0.7 105 0.9 808 6.72017 117,320 376 3.2 235 2.0 93 0.8 99 0.8 803 6.82018 114,641 314 2.7 274 2.4 85 0.7 100 0.9 773 6.7Mother's Racial/Ethnic Group, 2014-2018Puerto Rican 34,963 115 3.3 59 1.7 32 0.9 36 1.0 242 6.9Other Hispanic 135,224 355 2.6 252 1.9 86 0.6 127 0.9 820 6.1Asian and Pacific Islander 102,182 213 2.1 158 1.5 60 0.6 61 0.6 492 4.8Non-Hispanic White 202,769 334 1.6 326 1.6 129 0.6 101 0.5 890 4.4Non-Hispanic Black 112,880 644 5.7 393 3.5 124 1.1 185 1.6 1,346 11.9Other or Unknown 9,027 93 - 125 - 7 - 8 - 233 -NEW YORK CITY 597,045 1,754 2.9 1,313 2.2 438 0.7 518 0.9 4,023 6.7
Maternal Health/
PrematurityMaternal
CareNewborn
CareInfant Health
Total Fetal-Infant Mortality
*Limited to fetal deaths and live births with a birthweight of 500 grams or more, and fetal deaths with gestation of at least 24 weeks.

45
PERINATAL PERIODS OF RISK (PPOR)Ta
ble
2. F
etal
-Infa
nt M
orta
lity
Rate
per
1,0
00 B
irth
s an
d Fe
tal D
eath
s by
Per
inat
al P
erio
d of
Ris
k an
d C
omm
unity
D
istr
ict o
f Res
iden
ce, N
ew Y
ork
City
, 201
4-20
18
Con
tinue
d on
nex
t pag
e.
Feta
l-Inf
ant M
orta
lity
Rate
per
1,0
00 B
irths
and
Fet
al D
eath
s by
Per
inat
al P
erio
d of
Ris
k an
d C
omm
unity
Dis
trict
of R
esid
ence
, 201
4-20
18
Birth
s &
Fet
al
Dea
ths*
C
omm
unity
Dis
trict
of R
esid
ence
N
umbe
rN
umbe
rRa
teN
umbe
rRa
teN
umbe
rRa
teN
umbe
rRa
teN
umbe
rRa
teM
AN
HA
TTA
N86
,451
158
1.8
137
1.6
620.
752
0.6
409
4.7
Batte
ry P
ark,
Trib
eca
(01)
5,61
16
1.1
91.
64
0.7
20.
421
3.7
Gre
enw
ich
Vill
age,
SO
HO
(02)
3,73
34
1.1
20.
53
0.8
--
92.
4Lo
wer
Eas
t Sid
e (0
3)6,
489
182.
811
1.7
60.
93
0.5
385.
9C
hels
ea, C
linto
n (0
4)5,
062
61.
27
1.4
30.
62
0.4
183.
6M
idto
wn
Busi
ness
Dis
trict
(05)
2,81
92
0.7
41.
42
0.7
-0.
08
2.8
Mur
ray
Hill
(06)
6,46
410
1.5
111.
73
0.5
20.
326
4.0
Upp
er W
est S
ide
(07)
12,2
647
0.6
262.
19
0.7
50.
447
3.8
Upp
er E
ast S
ide
(08)
12,8
3420
1.6
131.
05
0.4
20.
240
3.1
Man
hatta
nvill
e (0
9)5,
134
163.
12
0.4
40.
86
1.2
285.
5C
entra
l Har
lem
(10)
7,80
825
3.2
131.
710
1.3
121.
560
7.7
East
Har
lem
(11)
7,49
715
2.0
182.
45
0.7
111.
549
6.5
Was
hing
ton
Hei
ghts
(12)
10,7
3629
2.7
212.
08
0.7
70.
765
6.1
BRO
NX
97,7
1737
33.
825
52.
673
0.7
133
1.4
834
8.5
Mot
t Hav
en (0
1)
7,93
436
4.5
293.
78
1.0
162.
089
11.2
Hun
ts P
oint
(02)
4,16
210
2.4
143.
41
0.2
--
256.
0M
orris
ania
(03)
7,29
424
3.3
233.
27
1.0
131.
867
9.2
Con
cour
se, H
ighb
ridge
(04)
12
,316
373.
042
3.4
100.
817
1.4
106
8.6
Uni
vers
ity/M
orris
Hei
ghts
(05)
11,0
2537
3.4
100.
914
1.3
131.
274
6.7
East
Tre
mon
t (06
) 6,
343
193.
021
3.3
50.
811
1.7
568.
8Fo
rdha
m (0
7)
10,8
3145
4.2
252.
35
0.5
80.
783
7.7
Rive
rdal
e (0
8)
5,39
019
3.5
112.
01
0.2
20.
433
6.1
Uni
onpo
rt, S
ound
view
(09)
11
,968
554.
630
2.5
80.
725
2.1
118
9.9
Thro
gs N
eck
(10)
5,02
523
4.6
142.
81
0.2
51.
043
8.6
Pelh
am P
arkw
ay (1
1)
6,82
025
3.7
81.
27
1.0
152.
255
8.1
Will
iam
sbrid
ge (1
2)
8,60
943
5.0
283.
36
0.7
80.
985
9.9
BRO
OKL
YN
199,
384
586
2.9
455
2.3
143
0.7
174
0.9
1358
6.8
Will
iam
sbur
g, G
reen
poin
t (01
) 18
,285
281.
540
2.2
110.
617
0.9
965.
3Fo
rt G
reen
e, B
rook
lyn
Hei
ghts
(02)
8,
508
121.
419
2.2
30.
45
0.6
394.
6Be
dfor
d St
uyve
sant
(03)
11,3
0742
3.7
383.
411
1.0
161.
410
79.
5Bu
shw
ick
(04)
6,40
915
2.3
132.
02
0.3
40.
634
5.3
East
New
Yor
k (0
5)13
,341
654.
941
3.1
161.
218
1.3
140
10.5
Park
Slo
pe (0
6)8,
615
141.
610
1.2
50.
67
0.8
364.
2Su
nset
Par
k (0
7)12
,236
362.
920
1.6
70.
67
0.6
705.
7C
row
n H
eigh
ts N
orth
(08)
6,42
223
3.6
152.
36
0.9
30.
547
7.3
Cro
wn
Hei
ghts
Sou
th (0
9)7,
453
293.
919
2.5
70.
910
1.3
658.
7Ba
y Ri
dge
(10)
9,22
620
2.2
202.
23
0.3
10.
144
4.8
Bens
onhu
rst (
11)
13,3
0625
1.9
211.
613
1.0
100.
869
5.2
Boro
ugh
Park
(12)
26,6
3950
1.9
481.
818
0.7
120.
512
84.
8C
oney
Isla
nd (1
3)6,
166
182.
910
1.6
50.
86
1.0
396.
3Fl
atbu
sh, M
idw
ood
(14)
12,7
7055
4.3
231.
86
0.5
50.
489
7.0
Shee
pshe
ad B
ay (1
5)11
,274
252.
218
1.6
70.
610
0.9
605.
3Br
owns
ville
(16)
6,57
832
4.9
253.
84
0.6
121.
873
11.1
East
Fla
tbus
h (1
7)9,
601
515.
338
4.0
60.
618
1.9
113
11.8
Can
arsi
e (1
8)11
,248
464.
137
3.3
131.
213
1.2
109
9.7
Mat
erna
l Hea
lth/
Prem
atur
ityM
ater
nal
Car
eN
ewbo
rn
Car
eIn
fant
H
ealth
Tota
l Fet
al-In
fant
M
orta
lity
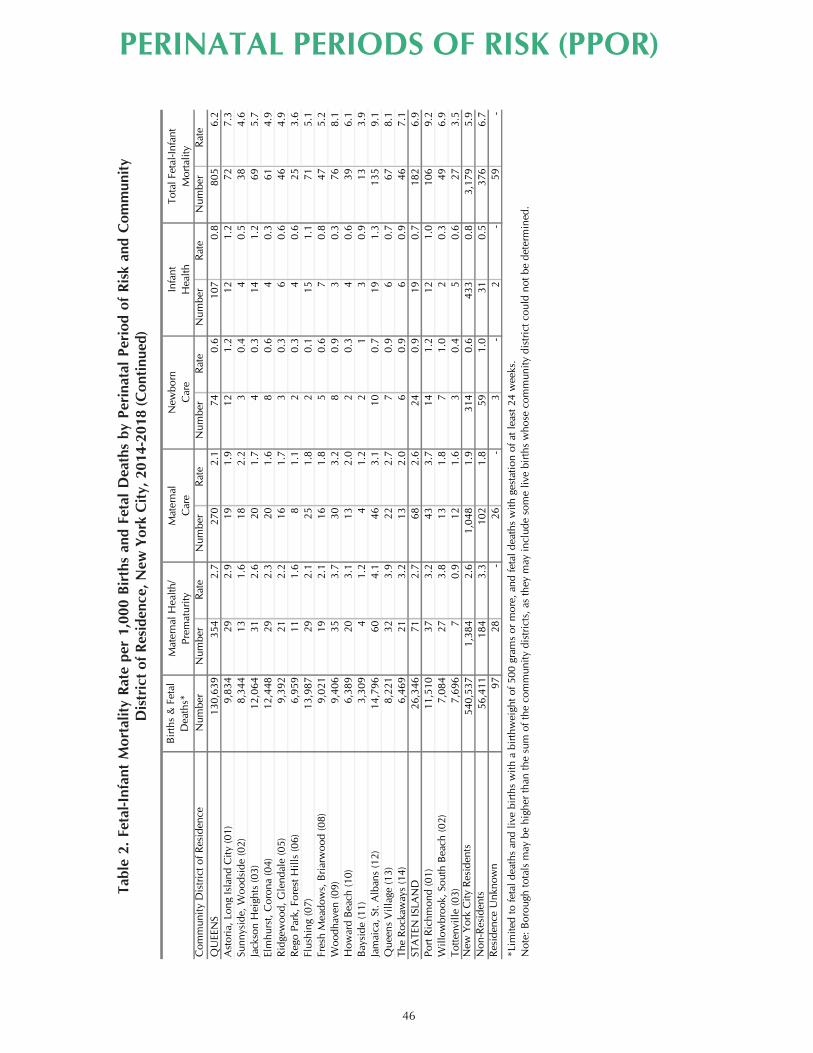
46
PERINATAL PERIODS OF RISK (PPOR)
Tabl
e 2.
Fet
al-In
fant
Mor
talit
y Ra
te p
er 1
,000
Bir
ths
and
Feta
l Dea
ths
by P
erin
atal
Per
iod
of R
isk
and
Com
mun
ity
Dis
tric
t of R
esid
ence
, New
Yor
k C
ity, 2
014-
2018
(Con
tinue
d)
Bir
ths
& F
etal
D
eath
s*
Com
mun
ity D
istr
ict o
f Res
iden
ce
Num
ber
Num
ber
Rat
eN
umbe
rR
ate
Num
ber
Rat
eN
umbe
rR
ate
Num
ber
Rat
eQ
UEE
NS
130,
639
354
2.7
270
2.1
740.
610
70.
880
56.
2A
stor
ia, L
ong
Isla
nd C
ity (0
1)9,
834
292.
919
1.9
121.
212
1.2
727.
3Su
nnys
ide,
Woo
dsid
e (0
2)8,
344
131.
618
2.2
30.
44
0.5
384.
6Ja
ckso
n H
eigh
ts (0
3)12
,064
312.
620
1.7
40.
314
1.2
695.
7El
mhu
rst,
Cor
ona
(04)
12,4
4829
2.3
201.
68
0.6
40.
361
4.9
Rid
gew
ood,
Gle
ndal
e (0
5)9,
392
212.
216
1.7
30.
36
0.6
464.
9R
ego
Park
, For
est H
ills
(06)
6,95
911
1.6
81.
12
0.3
40.
625
3.6
Flus
hing
(07)
13,9
8729
2.1
251.
82
0.1
151.
171
5.1
Fres
h M
eado
ws,
Bri
arw
ood
(08)
9,02
119
2.1
161.
85
0.6
70.
847
5.2
Woo
dhav
en (0
9)9,
406
353.
730
3.2
80.
93
0.3
768.
1H
owar
d B
each
(10)
6,38
920
3.1
132.
02
0.3
40.
639
6.1
Bay
side
(11)
3,30
94
1.2
41.
22
13
0.9
133.
9Ja
mai
ca, S
t. A
lban
s (1
2)14
,796
604.
146
3.1
100.
719
1.3
135
9.1
Que
ens
Vill
age
(13)
8,22
132
3.9
222.
77
0.9
60.
767
8.1
The
Roc
kaw
ays
(14)
6,46
921
3.2
132.
06
0.9
60.
946
7.1
STA
TEN
ISLA
ND
26,3
4671
2.7
682.
624
0.9
190.
718
26.
9Po
rt R
ichm
ond
(01)
11,5
1037
3.2
433.
714
1.2
121.
010
69.
2W
illow
broo
k, S
outh
Bea
ch (0
2)7,
084
273.
813
1.8
71.
02
0.3
496.
9To
ttenv
ille
(03)
7,69
67
0.9
121.
63
0.4
50.
627
3.5
New
Yor
k C
ity R
esid
ents
540,
537
1,38
42.
61,
048
1.9
314
0.6
433
0.8
3,17
95.
9N
on-R
esid
ents
56,4
1118
43.
310
21.
859
1.0
310.
537
66.
7R
esid
ence
Unk
now
n97
28-
26-
3-
2-
59-
*Lim
ited
to fe
tal d
eath
s an
d liv
e bi
rths
with
a b
irth
wei
ght o
f 500
gra
ms
or m
ore,
and
feta
l dea
ths
with
ges
tatio
n of
at l
east
24
wee
ks.
Not
e: B
orou
gh to
tals
may
be
high
er th
an th
e su
m o
f the
com
mun
ity d
istr
icts
, as
they
may
incl
ude
som
e liv
e bi
rths
who
se c
omm
unity
dis
tric
t cou
ld n
ot b
e de
term
ined
.
Mat
erna
l Hea
lth/
Prem
atur
ityM
ater
nal
Car
eN
ewbo
rn
Car
eIn
fant
H
ealth
Tota
l Fet
al-In
fant
M
orta
lity

SUMMARY OF VITAL STATISTICS 2018
THE CITY OF NEW YORKAppendix A
Supplemental Population, Mortality, Infant Mortality, and
Pregnancy Outcome Data Tables
bureau of ViTal sTaTisTics, new york ciTy deparTmenT of healTh and menTal hygiene
125 worTh sTreeT, cn 7, new york, new york, 10013

48
POPULATION CHARACTERISTICSTable PC1. Population, Live Births, Fertility Rates, Marriages, Deaths, and Infant Mortality, New York City,
1898-2018
Fertility RatesTotal Fertility
RatesRate per Per 1,000 Per 1,000 Rate per Rate per Deaths Rate per
Total 1,000 Women Women Total 1,000 Total 1,000 Under 1,000Reported* Population Aged 15-44 Reported* Population Reported* Population One Year* Live Births
1898-1900 3,358,000 119,000 35.4 30,535 9.1 67,503 20.1 16,264 136.7
1901-1905 3,786,000 129,000 34.1 37,988 10.0 71,689 18.9 15,611 121.01906-1910 4,473,000 144,000 32.2 44,966 10.1 75,865 17.0 16,609 115.31911-1915 5,049,000 140,581 27.8 51,157 10.1 74,666 14.8 14,060 100.01916-1920 5,492,000 136,101 24.8 59,081 10.8 80,435 14.6 12,004 88.21921-1925 6,175,000 130,462 21.1 62,710 10.2 69,303 11.2 8,985 68.9
1926-1930 6,703,000 125,590 18.7 62,278 9.3 75,395 11.2 7,662 61.01931-1935 7,101,000 106,179 15.0 63,273 8.9 75,561 10.6 5,521 52.01936-1940 7,363,000 102,418 13.9 69,184 9.4 76,065 10.3 4,079 39.81941-1945 7,597,000 126,495 16.7 76,086 10.0 78,382 10.3 3,525 27.91946-1950 7,815,000 158,926 20.3 90,914 11.6 79,708 10.2 4,139 26.0
1951-1955 7,867,000 163,526 20.8 71,689 9.1 80,583 10.2 3,986 24.41956-1960 7,806,000 166,949 21.4 68,281 8.7 84,290 10.8 4,290 25.71961-1965 7,816,200 165,197 21.1 68,318 8.7 87,597 11.2 4,333 26.21966-1970 7,872,972 147,294 18.7 71,653 9.1 88,779 11.3 3,477 23.61971-1975 7,652,200 115,941 15.1 67,737 8.9 82,113 10.7 2,313 19.9
1976 7,401,000 109,995 14.9 55,829 7.5 77,538 10.5 2,092 19.01977 7,318,000 110,486 15.1 52,804 7.2 75,011 10.3 1,971 17.81978 7,236,000 106,720 14.7 54,247 7.5 73,081 10.1 1,827 17.11979 7,154,000 106,021 14.8 58,532 8.2 72,079 10.1 1,767 16.71980 7,071,639 107,066 15.1 63.6 58,637 8.3 76,625 10.8 1,719 16.1
1981 7,097,000 108,547 15.3 63.9 61,775 8.7 73,329 10.3 1,678 15.51982 7,122,000 111,487 15.7 65.1 66,619 9.4 73,083 10.3 1,706 15.31983 7,147,000 112,353 15.7 65.1 68,164 9.5 73,544 10.3 1,603 14.31984 7,172,000 113,332 15.8 65.1 76,336 10.6 74,278 10.4 1,540 13.61985 7,197,000 118,542 16.5 67.6 77,897 10.8 74,852 10.4 1,591 13.4
1986 7,222,000 122,108 16.9 69.0 82,199 11.4 75,702 10.5 1,566 12.81987 7,247,000 127,386 17.6 71.5 76,194 10.5 76,448 10.5 1,673 13.11988 7,272,000 132,226 18.2 73.6 74,137 10.2 77,817 10.7 1,770 13.41989 7,297,000 137,673 18.9 76.0 69,758 9.6 75,957 10.4 1,827 13.31990 7,322,564 139,630 19.1 76.5 71,301 9.7 73,875 10.1 1,620 11.6
1991 7,388,000 138,148 18.7 75.3 69,314 9.4 72,421 9.8 1,575 11.41992 7,455,000 136,002 18.2 73.8 71,947 9.7 71,001 9.5 1,390 10.21993 7,522,000 133,583 17.8 72.1 72,490 9.6 73,408 9.8 1,366 10.21994 7,590,000 133,662 17.6 71.8 70,438 9.3 71,038 9.4 1,207 9.01995 7,658,000 131,009 17.1 70.1 71,507 9.3 70,769 9.2 1,155 8.8
1996 7,727,000 126,901 16.4 67.5 79,361 10.3 66,784 8.6 992 7.81997 7,796,000 123,313 15.8 65.3 80,027 10.3 62,506 8.0 881 7.11998 7,866,000 124,252 15.8 65.5 53,661 6.8 61,010 7.8 843 6.81999 7,937,000 123,739 15.6 64.9 55,075 6.9 62,470 7.9 848 6.92000 8,008,278 125,563 15.7 65.5 1918.4 58,291 7.3 60,839 7.6 839 6.7
2001‡ 8,060,000 124,023 15.4 64.5 1884.2 72,587 9.0 62,964 7.8 760 6.12001‡ 8,060,000 60,218 7.52002‡ 8,072,000 122,937 15.2 64.1 1866.4 65,490 8.1 59,651 7.4 742 6.02003‡ 8,068,000 124,345 15.4 65.1 1890.5 61,101 7.6 59,213 7.3 807 6.52004‡ 8,043,000 124,099 15.4 65.3 1898.3 62,057 7.7 57,466 7.1 760 6.12005‡ 8,013,000 122,725 15.3 65.0 1890.7 66,348 8.3 57,068 7.1 732 6.0
2006‡ 7,994,000 125,506 15.7 66.6 1935.2 65,619 8.2 55,391 6.9 740 5.92007 8,014,000 128,961 16.1 68.4 1976.3 66,483 8.3 54,073 6.7 697 5.42008 8,068,000 127,680 15.8 67.3 1937.2 66,670 8.3 54,193 6.7 698 5.52009 8,132,000 126,774 15.6 66.5 1902.0 65,542 8.1 52,881 6.5 668 5.32010 8,175,133 124,791 15.3 65.3 1863.2 67,051 8.2 52,575 6.4 609 4.9
2011 8,244,910 123,029 14.9 64.5 1835.1 71,401 8.7 52,789 6.4 577 4.72012 8,336,697 123,231 14.8 64.1 1824.5 74,362 8.9 52,455 6.3 583 4.72013 8,405,837 120,457 14.3 62.6 1768.7 77,678 9.2 53,409 6.4 551 4.62014 8,491,079 122,084 14.4 62.9 1767.2 78,409 9.2 53,034 6.2 516 4.22015 8,550,405 121,673 14.2 62.7 1753.9 77,777 9.1 54,120 6.3 526 4.3
2016 8,537,673 120,367 14.1 62.5 1738.6 84,073 9.8 54,280 6.4 491 4.12017 8,622,698 117,013 13.6 60.7 1688.8 82,866 9.6 54,319 6.3 500 4.32018 8,398,748 114,296 13.6 61.7 1714.2 76,688 9.1 55,081 6.6 446 3.9
‡ Population data may vary by publication year. See Technical Notes: Population, Citywide population.
Year Population
Live BirthsMarriages† Deaths Infant Mortality
Excluding World Trade Center disaster deaths
*Figures prior to 1966 are averages across the years presented; single-year figures prior to 1966 appear in the annual summaries for 1965 and earlier. Figures for 1898-1913 births are estimated.† See Technical Notes: Births, Mother's Marital Status.
15
49
POPULATION CHARACTERISTICSTa
ble
PC2.
Pop
ulat
ion
Estim
ates
by
Age
, Mut
ually
Exc
lusi
ve R
ace
and
His
pani
c O
rigi
n, a
nd S
ex, N
ew Y
ork
City
, 201
8
Tabl
e PC
3. M
arri
ages
, Bir
ths,
Dea
ths,
and
Infa
nt D
eath
s by
Mon
th a
nd A
vera
ge p
er D
ay, N
ew Y
ork
City
, 201
8
Infa
ntIn
fant
Mon
ths
Mar
riage
s*Bi
rths
Dea
ths
Dea
ths
Mar
riage
sBi
rths
Dea
ths
Dea
ths
Janu
ary
5,12
09,
894
5,63
632
165
319
182
1.0
Febr
uary
5,30
78,
602
4,64
431
190
307
166
1.1
Mar
ch5,
910
9,39
04,
739
4519
130
315
31.
5A
pril
6,42
08,
961
4,46
830
214
299
149
1.0
May
7,30
19,
703
4,32
829
236
313
140
0.9
June
6,89
69,
643
4,22
750
230
321
141
1.7
July
7,05
29,
818
4,30
043
227
317
139
1.4
Aug
ust
8,24
110
,170
4,30
533
266
328
139
1.1
Sept
embe
r6,
324
9,44
24,
263
4121
131
514
21.
4O
ctob
er6,
837
9,79
44,
720
4422
131
615
21.
4N
ovem
ber
5,44
39,
381
4,57
936
181
313
153
1.2
Dec
embe
r5,
837
9,49
84,
872
3218
830
615
71.
0To
tal
76,6
8811
4,29
655
,081
446
210
313
151
1.2
* Se
e Te
chni
cal N
otes
: Bir
ths,
Mot
her's
Mar
ital S
tatu
s.
Num
ber
Ave
rage
Per
Day
17
Age
in
Year
sTo
tal
Mal
eFe
mal
eTo
tal
Mal
eFe
mal
eTo
tal
Mal
eFe
mal
eTo
tal
Mal
eFe
mal
eTo
tal
Mal
eFe
mal
eTo
tal
Mal
eFe
mal
eAl
l Age
s8,
398,
748
4,
005,
969
4,
392,
779
2,
449,
450
1,
184,
548
1,
264,
902
2,
694,
258
1,
316,
078
1,
378,
180
1,
849,
077
83
8,08
9
1,01
0,98
8
1,23
6,87
1
587,
377
64
9,49
4
169,
092
79
,877
89
,215
U
nder
553
5,24
0
27
3,55
6
26
1,68
4
18
5,85
1
94
,507
91
,344
14
8,74
7
76
,529
72
,218
10
8,71
5
55
,094
53,6
21
69,8
05
36,2
38
33
,567
22,1
22
11
,188
10
,934
5-
948
5,72
0
24
8,47
8
23
7,24
2
17
6,30
2
89
,977
86
,325
12
5,93
2
64
,646
61
,286
10
4,06
5
52
,785
51,2
80
61,5
26
31,9
89
29
,537
17,8
95
9,
081
8,81
4
10
-14
450,
993
229,
697
221,
296
160,
972
81,8
27
79,1
45
115,
563
59,3
21
56,2
42
105,
152
52,9
76
52
,176
56
,644
29
,248
27,3
96
12
,662
6,32
5
6,
337
15-1
944
4,16
7
22
3,21
9
22
0,94
8
15
8,48
6
80
,432
78
,054
10
9,91
0
55
,251
54
,659
10
7,74
9
53
,488
54,2
61
57,0
49
28,5
71
28
,478
10,9
73
5,
477
5,49
6
20
-24
534,
372
257,
674
276,
698
177,
735
88,2
46
89,4
89
144,
188
68,0
49
76,1
39
123,
527
59,1
83
64
,344
76
,761
36
,566
40,1
95
12
,161
5,63
0
6,
531
25-2
977
6,10
7
37
7,11
7
39
8,99
0
21
7,54
1
11
0,64
4
10
6,89
7
26
3,07
8
12
6,09
1
13
6,98
7
16
0,57
8
77
,849
82,7
29
118,
509
54,9
42
63
,567
16,4
01
7,
591
8,81
0
30
-34
723,
193
356,
269
366,
924
198,
976
101,
986
96,9
90
261,
561
130,
629
130,
932
135,
786
64,4
94
71
,292
11
3,06
1
52
,852
60,2
09
13
,809
6,30
8
7,
501
35-3
961
3,97
5
29
9,91
4
31
4,06
1
17
9,60
8
90
,195
89
,413
20
1,90
2
10
3,34
1
98
,561
12
2,05
5
55
,728
66,3
27
99,6
07
45,6
69
53
,938
10,8
03
4,
981
5,82
2
40
-44
532,
840
256,
675
276,
165
159,
792
78,4
56
81,3
36
164,
615
84,7
12
79,9
03
111,
997
49,5
59
62
,438
87
,720
40
,049
47,6
71
8,
716
3,
899
4,81
7
45
-49
529,
007
253,
777
275,
230
155,
071
75,0
04
80,0
67
159,
715
82,4
35
77,2
80
118,
274
51,7
64
66
,510
87
,607
40
,757
46,8
50
8,
340
3,
817
4,52
3
50
-54
527,
046
251,
324
275,
722
151,
287
71,1
28
80,1
59
154,
320
80,0
84
74,2
36
130,
535
57,6
24
72
,911
82
,813
38
,741
44,0
72
8,
091
3,
747
4,34
4
55
-59
522,
675
246,
047
276,
628
137,
342
62,8
90
74,4
52
162,
626
82,4
87
80,1
39
132,
371
57,8
82
74
,489
82
,770
39
,350
43,4
20
7,
566
3,
438
4,12
8
60
-64
477,
320
219,
423
257,
897
115,
768
51,3
04
64,4
64
163,
499
79,2
61
84,2
38
114,
947
49,0
44
65
,903
76
,541
36
,787
39,7
54
6,
565
3,
027
3,53
8
65
-69
394,
415
175,
747
218,
668
90,1
96
38,3
92
51,8
04
150,
835
70,1
77
80,6
58
88,9
35
36,6
92
52
,243
59
,817
28
,442
31,3
75
4,
632
2,
044
2,58
8
70
-74
304,
703
130,
134
174,
569
68,5
44
28,0
01
40,5
43
125,
307
56,4
25
68,8
82
67,3
83
25,6
55
41
,728
40
,201
18
,677
21,5
24
3,
268
1,
376
1,89
2
75
-79
218,
228
88,5
97
129,
631
49,7
95
19,1
87
30,6
08
89,4
81
38,4
98
50,9
83
49,2
88
17,6
46
31
,642
27
,464
12
,333
15,1
31
2,
200
93
3
1,26
7
80
-84
153,
134
59,7
18
93,4
16
33,2
74
12,0
93
21,1
81
66,1
37
27,5
50
38,5
87
32,8
20
10,9
86
21
,834
19
,493
8,
552
10
,941
1,41
0
537
87
3
85 &
Ove
r17
5,61
3
58
,603
11
7,01
0
32
,910
10
,279
22
,631
86
,842
30
,592
56
,250
34
,900
9,
640
25
,260
19
,483
7,
614
11
,869
1,47
8
478
1,
000
Dat
a So
urce
: US
Cens
us B
urea
u, p
opul
atio
n es
timat
es, 2
018
vint
age.
Oth
er o
r Mul
tiple
Rac
esAl
l H
ispan
icN
on-H
ispan
ic W
hite
Non
-Hisp
anic
Bla
ckAs
ian
and
Paci
fic Is
land
er
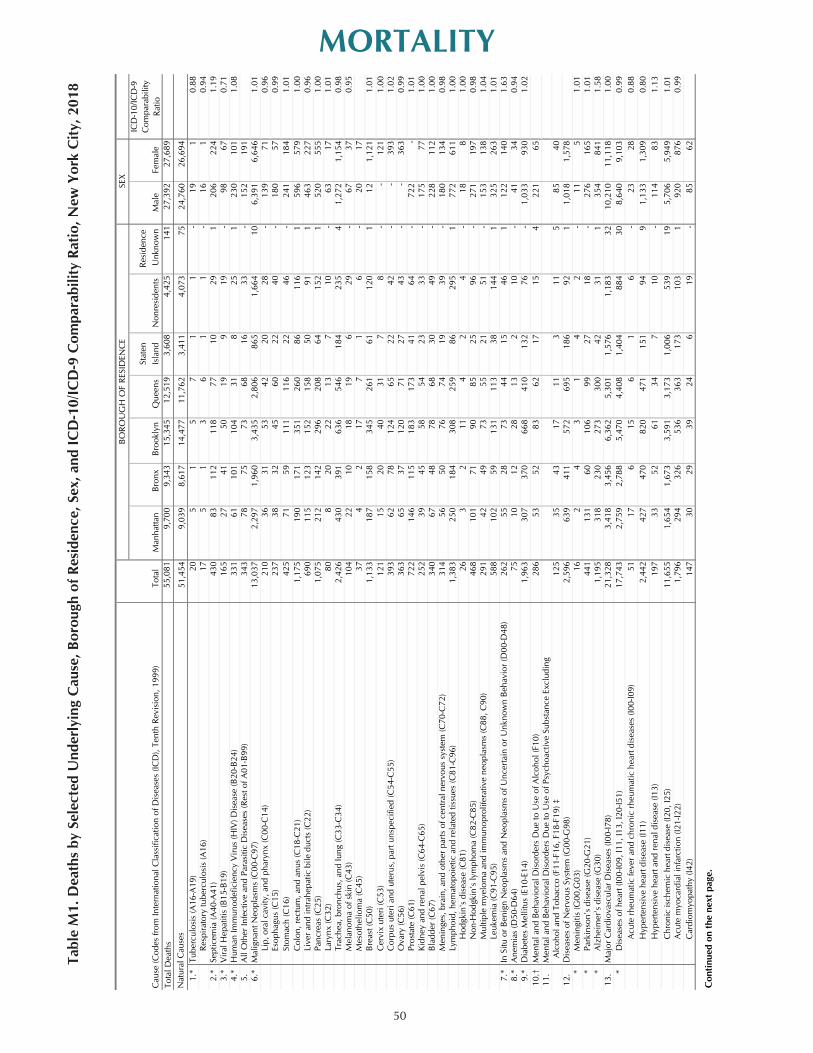
50
MORTALITY
Stat
en
Resi
denc
eC
ause
(Cod
es fr
om In
tern
atio
nal C
lass
ifica
tion
of D
isea
ses
(ICD
), Te
nth
Revi
sion
, 199
9) T
otal
Man
hatta
n
Bron
x B
rook
lyn
Que
ens
Isla
ndN
onre
side
nts
Unk
now
nM
ale
Fem
ale
Tota
l Dea
ths
55,0
819,
700
9,34
315
,345
12,5
193,
608
4,42
514
127
,392
27,6
89
Nat
ural
Cau
ses
51,4
549,
039
8,61
714
,477
11,7
623,
411
4,07
375
24,7
6026
,694
1.
*Tu
berc
ulos
is (A
16-A
19)
205
15
71
1-
191
0.88
R
espi
rato
ry tu
berc
ulos
is (A
16)
175
13
61
1-
161
0.94
2.
*Se
ptic
emia
(A40
-A41
)43
083
112
118
7710
291
206
224
1.19
3.
*V
iral H
epat
itis
(B15
-B19
)16
527
4150
199
19-
9867
0.71
4.
*H
uman
Imm
unod
efic
ienc
y V
irus
(HIV
) Dis
ease
(B20
-B24
)33
161
101
104
318
251
230
101
1.08
5.
All
Oth
er In
fect
ive
and
Para
sitic
Dis
ease
s (R
est o
f A01
-B99
)34
378
7573
6816
33-
152
191
6.
*M
alig
nant
Neo
plas
ms
(C00
-C97
)13
,037
2,29
71,
960
3,43
52,
806
865
1,66
410
6,39
16,
646
1.01
L
ip, o
ral c
avity
, and
pha
rynx
(C00
-C14
)21
036
3153
4220
28-
139
710.
96
E
soph
agus
(C15
)23
738
3245
6022
40-
180
570.
99
Sto
mac
h (C
16)
425
7159
111
116
2246
-24
118
41.
01
C
olon
, rec
tum
, and
anu
s (C
18-C
21)
1,17
519
017
135
126
086
116
159
657
91.
00
Liv
er a
nd in
trahe
patic
bile
duc
ts (C
22)
690
115
123
152
158
5091
146
322
70.
96
Pan
crea
s (C
25)
1,07
521
214
229
620
864
152
152
055
51.
00
Lar
ynx
(C32
)80
820
2213
710
-63
171.
01
Tra
chea
, bro
nchu
s, a
nd lu
ng (C
33-C
34)
2,42
643
039
163
654
618
423
54
1,27
21,
154
0.98
M
elan
oma
of s
kin
(C43
)10
422
1018
196
29-
6737
0.95
M
esot
helio
ma
(C45
)37
42
177
16
-20
17
Bre
ast (
C50
)1,
133
187
158
345
261
6112
01
121,
121
1.01
C
ervi
x ut
eri (
C53
)12
115
2040
317
8-
-12
11.
00
Cor
pus
uter
i and
ute
rus,
par
t uns
peci
fied
(C54
-C55
)39
362
7812
465
2242
--
393
1.02
O
vary
(C56
)36
365
3712
071
2743
--
363
0.99
P
rost
ate
(C61
)72
214
611
518
317
341
64-
722
-1.
01
Kid
ney
and
rena
l pel
vis
(C64
-C65
)25
239
4558
5423
33-
175
771.
00
Bla
dder
(C67
)34
067
4878
6830
49-
228
112
1.00
M
enin
ges,
bra
in, a
nd o
ther
par
ts o
f cen
tral n
ervo
us s
yste
m (C
70-C
72)
314
5650
7674
1939
-18
013
40.
98
Lym
phoi
d, h
emat
opoi
etic
and
rela
ted
tissu
es (C
81-C
96)
1,38
325
018
430
825
986
295
177
261
11.
00
Hod
gkin
's d
isea
se (C
81)
263
211
42
4-
188
1.00
N
on-H
odgk
in's
lym
phom
a (C
82-C
85)
468
101
7190
8525
96-
271
197
0.98
M
ultip
le m
yelo
ma
and
imm
unop
rolif
erat
ive
neop
lasm
s (C
88, C
90)
291
4249
7355
2151
-15
313
81.
04
Leu
kem
ia (C
91-C
95)
588
102
5913
111
338
144
132
526
31.
01
7.*
In S
itu o
r Ben
ign
Neo
plas
ms
and
Neo
plas
ms
of U
ncer
tain
or U
nkno
wn
Beha
vior
(D00
-D48
) 26
255
2873
4415
461
122
140
1.63
8.
*A
nem
ias
(D50
-D64
)75
1012
2813
210
-41
340.
94
9.*
Dia
bete
s M
ellit
us (E
10-E
14)
1,96
330
737
066
841
013
276
-1,
033
930
1.02
10.
†M
enta
l and
Beh
avio
ral D
isor
ders
Due
to U
se o
f Alc
ohol
(F10
) 28
653
5283
6217
154
221
65 1
1.M
enta
l and
Beh
avio
ral D
isor
ders
Due
to U
se o
f Psy
choa
ctiv
e Su
bsta
nce
Excl
udin
g A
lcoh
ol a
nd T
obac
co (F
11-F
16, F
18-F
19) ‡
125
3543
1711
311
585
40 1
2.
Dis
ease
s of
Ner
vous
Sys
tem
(G00
-G98
)2,
596
639
411
572
695
186
921
1,01
81,
578
*
Men
ingi
tis (G
00,G
03)
162
43
14
2-
115
1.01
*
Par
kins
on's
dis
ease
(G20
-G21
)44
113
160
106
9927
18-
276
165
1.01
*
Alz
heim
er's
dis
ease
(G30
)1,
195
318
230
273
300
4231
135
484
11.
58 1
3.M
ajor
Car
diov
ascu
lar D
isea
ses
(I00-
I78)
21,3
283,
418
3,45
66,
362
5,30
11,
576
1,18
332
10,2
1011
,118
1.00
*
Dis
ease
s of
hea
rt (I0
0-I0
9, I1
1, I1
3, I2
0-I5
1)17
,743
2,75
92,
788
5,47
04,
408
1,40
488
430
8,64
09,
103
0.99
A
cute
rheu
mat
ic fe
ver a
nd c
hron
ic rh
eum
atic
hea
rt di
seas
es (I
00-I0
9)
5117
615
61
6-
2328
0.88
H
yper
tens
ive
hear
t dis
ease
(I11
)2,
442
427
470
820
471
151
949
1,13
31,
309
0.80
H
yper
tens
ive
hear
t and
rena
l dis
ease
(I13
)19
733
5261
347
10-
114
831.
13
Chr
onic
isch
emic
hea
rt di
seas
e (I2
0, I2
5)
11,6
551,
654
1,67
33,
591
3,17
31,
006
539
195,
706
5,94
91.
01
Acu
te m
yoca
rdia
l inf
arct
ion
(I21-
I22)
1,
796
294
326
536
363
173
103
192
087
60.
99
Car
diom
yopa
thy
(I42)
14
730
2939
246
19-
8562
Con
tinue
d on
the
next
pag
e.
BORO
UG
H O
F RE
SID
ENC
ESE
XIC
D-1
0/IC
D-9
C
ompa
rabi
lity
Ratio
1
Tabl
e M
1. D
eath
s by
Sel
ecte
d U
nder
lyin
g C
ause
, Bor
ough
of R
esid
ence
, Sex
, and
ICD
-10/
ICD
-9 C
ompa
rabi
lity
Ratio
, New
Yor
k C
ity, 2
018

MORTALITY
51
Stat
en
Resi
denc
e
Cau
se (C
odes
from
Inte
rnat
iona
l Cla
ssifi
catio
n of
Dis
ease
s (IC
D),
Tent
h Re
visi
on, 1
999)
Tota
lM
anha
ttan
Br
onx
Bro
okly
n Q
ueen
sIs
land
Non
resi
dent
s U
nkno
wn
Mal
eFe
mal
e
H
eart
failu
re (I
50)
398
9562
107
104
1416
-19
720
11.
04
*
E
ssen
tial h
yper
tens
ion
and
hype
rtens
ive
rena
l dis
ease
(I10
, I12
, I15
)1,
272
278
247
330
296
4873
-53
973
31.
12
*
C
ereb
rova
scul
ar d
isea
ses
(I60-
I69)
1,
888
324
355
458
475
8818
62
812
1,07
61.
05
*
A
ther
oscl
eros
is (I
70)
162
1422
2764
2411
-63
990.
97
*
A
ortic
ane
urys
m a
nd d
isse
ctio
n (I7
1)14
919
2540
388
190
9752
1.00
14.
*In
fluen
za a
nd P
neum
onia
(J09
-J18)
2,
004
291
405
641
467
9410
24
1,01
399
10.
70 1
5.*
Chr
onic
Low
er R
espi
rato
ry D
isea
ses
(J40-
J47)
1,78
131
735
944
941
013
211
04
787
994
1.04
Em
phys
ema
(J43)
9318
1620
295
32
5043
0.96
A
sthm
a (J4
5-J4
6)17
435
5643
295
51
6610
80.
89 1
6.Pn
eum
ocon
iosi
s D
ue to
Asb
esto
s an
d O
ther
Min
eral
Fib
res
(J61)
0-
--
--
--
--
17.
*Pn
eum
oniti
s D
ue to
Sol
ids
and
Liqu
ids
(J69)
13
523
1842
377
8-
6471
1.10
18.
*Pe
ptic
Ulc
er (K
25-K
28)
9823
1624
254
51
5444
0.97
19.
*C
hron
ic L
iver
Dis
ease
and
Cirr
hosi
s (K
70, K
73-K
74)
571
8611
413
711
829
852
411
160
1.03
A
lcoh
olic
live
r dis
ease
(K70
)39
859
8795
7920
571
309
891.
00 2
0.*
Cho
lelit
hias
is a
nd O
ther
Dis
orde
rs o
f Gal
lbla
dder
(K80
-K82
)64
1514
1514
24
-32
320.
96 2
1.*
Nep
hriti
s, N
ephr
otic
Syn
drom
e, a
nd N
ephr
osis
(N00
-N07
, N17
-N19
, N25
-N27
)45
983
5119
272
2734
-25
020
91.
26
Ren
al fa
ilure
(N17
-N19
)44
175
5018
870
2731
-24
319
81.
33 2
2.*
Preg
nanc
y, C
hild
birth
, and
the
Puer
peri
um (O
00-O
99)
324
79
51
6-
.32
1.14
M
ater
nal c
ause
s (A
34, O
00-O
95, O
98-O
99)§
233
48
3.
5-
.23
23.
*C
erta
in C
ondi
tions
Orig
inat
ing
in th
e Pe
rina
tal P
erio
d (P
00-P
96)
220
2042
6542
1039
213
189
1.08
24.
*C
onge
nita
l Mal
form
atio
ns, D
efor
mat
ions
, and
Chr
omos
omal
Abn
orm
aliti
es (Q
00-Q
99)
230
2047
5845
1050
-12
710
30.
90 2
5.Sy
mpt
oms,
Sig
ns, a
nd A
bnor
mal
Fin
ding
s, N
ot E
lsew
here
Cla
ssifi
ed (R
00-R
94, R
96-R
99)
370
105
5995
6520
26-
159
211
0.98
P
endi
ng fi
nal d
eter
min
atio
n (R
99)
1-
1-
--
--
1-
26.
Sudd
en In
fant
Dea
th S
yndr
ome
(R95
)5
11
21
--
-4
11.
06 2
7.A
ll O
ther
Nat
ural
Cau
ses
(Res
t of A
00-R
99)
4,52
498
382
21,
160
917
235
400
71,
902
2,62
2Ex
tern
al C
ause
s3,
627
661
726
868
757
197
352
662,
632
995
Inju
ry b
y Fi
rear
ms
(W32
-W34
, X72
-X74
, X93
-X95
, Y22
-Y24
, Y35
.0)
219
1357
8543
912
-19
821
1.00
28.
Acc
iden
ts (V
01-X
59,Y
85-Y
86)
2,41
544
252
053
248
715
123
647
1,72
968
61.
03
Acc
iden
tal p
oiso
ning
by
psyc
hoac
tive
subs
tanc
es, e
xclu
ding
alc
ohol
and
toba
cco
(X40
-X42
, X44
) ‡1,
375
244
369
263
215
111
145
281,
051
324
1.04
†M
enta
l and
beh
avio
ral d
isor
ders
due
to u
se o
f or a
ccid
enta
l poi
soni
ng b
y ps
ycho
activ
e s
ubst
ance
exc
ludi
ng a
lcoh
ol a
nd to
bacc
o (F
11-F
16, F
18-F
19, X
40-X
42, X
44) ‡
1,50
027
941
228
022
611
415
633
1,13
636
4
†
Acc
iden
ts e
xcep
t poi
soni
ng b
y ps
ycho
activ
e su
bsta
nce
use
1,04
019
815
126
927
240
9119
678
362
Mot
or v
ehic
le a
ccid
ents
||
219
2130
5973
1122
315
267
0.95
Acc
iden
tal f
alls
(W00
-W19
)48
912
169
120
116
2336
429
919
00.
77 2
9.*
Inte
ntio
nal S
elf-h
arm
(Sui
cide
) (U
03, X
60-X
84, Y
87.0
) 56
212
265
133
155
3154
241
215
01.
00 3
0.*
Ass
ault
(Hom
icid
e) (U
01-U
02, X
85-Y
09, Y
87.1
) 31
122
9810
354
328
325
853
1.00
31.
*Le
gal I
nter
vent
ion
(Y35
, Y89
.0)
61
21
11
--
51
0.94
32.
Even
ts o
f Und
eter
min
ed In
tent
(Y10
-Y34
, Y87
.2, Y
89.9
)29
667
3790
5110
2714
208
880.
99 3
3.*
Com
plic
atio
ns o
f Med
ical
and
Sur
gica
l Car
e (Y
40-Y
84, Y
88)
377
49
91
7-
2017
0.63
34.
*O
pera
tions
of W
ar a
nd T
heir
Sequ
elae
(Y36
,Y89
.1)
0-
--
--
--
--
* E
ligib
le to
be
rank
ed a
s le
adin
g ca
uses
nat
iona
lly a
nd in
New
Yor
k C
ity.
‡ Se
e Te
chni
cal N
otes
: Dea
ths,
Dru
g-Re
late
d D
eath
s.§
See
Tech
nica
l Not
es: D
eath
s, M
ater
nal D
eath
and
Mat
erna
l Mor
talit
y.||
Mot
or v
ehic
le a
ccid
ent c
odes
incl
ude:
V02
-V04
, V09
.0, V
09.2
, V12
-V14
, V19
.0-V
19.2
, V19
.4-V
19.6
, V20
-V79
, V80
.3-V
80.5
, V81
.0-V
81.1
, V82
.0-V
82.1
, V83
-V86
, V87
.0-V
87.8
, V88
.0-V
88.8
, V89
.0, a
nd V
89.2
.
† T
he fo
llow
ing
caus
e gr
oups
are
not
rank
ed a
s le
adin
g ca
uses
nat
iona
lly, b
ut a
re e
ligib
le to
be
rank
ed a
s le
adin
g ca
uses
in N
ew Y
ork
City
bec
ause
of t
he n
umbe
r of
dea
ths
and
thei
r pub
lic h
ealth
impo
rtanc
e: "
Men
tal a
nd b
ehav
iora
l dis
orde
rs
due
to u
se o
f alc
ohol
", "
Men
tal a
nd b
ehav
iora
l dis
orde
rs d
ue to
use
of p
sych
oact
ive
subs
tanc
es e
xclu
ding
alc
ohol
and
toba
cco"
, an
d "A
ccid
ents
", w
hich
in N
YC e
xclu
des
pois
onin
g by
psy
choa
ctiv
e su
bsta
nces
(exc
ludi
ng a
lcoh
ol a
nd to
bacc
o).
ICD
-10/
ICD
-9
Com
para
bilit
y Ra
tio
SEX
BORO
UG
H O
F RE
SID
ENC
E
1
Tabl
e M
1. D
eath
s by
Sel
ecte
d U
nder
lyin
g C
ause
, Bor
ough
of R
esid
ence
, Sex
, and
ICD
-10/
ICD
-9 C
ompa
rabi
lity
Ratio
, N
ew Y
ork
City
, 201
8 (C
ontin
ued)

52
MORTALITY
Tabl
e M
2. D
eath
s an
d D
eath
Rat
es p
er 1
,000
Pop
ulat
ion*
by
Age
, Eth
nic
Gro
up, a
nd S
ex, N
ew Y
ork
City
, 201
8
Age
inY
ears
Tota
lM
ale
Fem
ale
Tota
lM
ale
Fem
ale
Tota
lM
ale
Fem
ale
Tota
lM
ale
Fem
ale
Tota
lM
ale
Fem
ale
No.
Rat
eN
o.R
ate
No.
Rat
eN
o.R
ate
No.
Rat
eN
o.R
ate
No.
Rat
eN
o.R
ate
No.
Rat
eN
o.R
ate
No.
Rat
eN
o.R
ate
No.
Rat
eN
o.R
ate
No.
Rat
eN
o.N
o.N
o.A
ll A
ges
55,0
816.
627
,392
6.8
27,6
896.
310
,941
4.5
5,62
04.
75,
321
4.2
23,4
128.
711
,490
8.7
11,9
228.
714
,785
8.0
6,98
88.
37,
797
7.7
4,65
53.
82,
521
4.3
2,13
43.
31,
288
773
515
Age
-A
djus
ted
5.6
6.7
4.6
4.8
6.0
3.9
5.7
6.7
4.8
6.9
8.5
5.8
3.5
4.3
2.9
Und
er 5
520
1.0
303
1.1
217
0.8
121
0.7
610.
660
0.7
125
0.8
741.
051
0.7
178
1.6
118
2.1
601.
149
0.7
240.
725
0.7
4726
215-
957
0.1
290.
128
0.1
150.
17
0.1
80.
119
0.2
90.
110
0.2
190.
29
0.2
100.
23
0.0
30.
10
-1
1.
10-1
463
0.1
330.
130
0.1
210.
113
0.2
80.
111
0.1
30.
18
0.1
220.
212
0.2
100.
25
0.1
40.
11
0.0
41
315
-19
136
0.3
920.
444
0.2
430.
331
0.4
120.
234
0.3
200.
414
0.3
480.
434
0.6
140.
310
0.2
60.
24
0.1
11
.20
-24
274
0.5
194
0.8
800.
389
0.5
680.
821
0.2
760.
548
0.7
280.
471
0.6
540.
917
0.3
330.
420
0.5
130.
35
41
25-2
948
50.
635
00.
913
50.
315
80.
711
61.
042
0.4
128
0.5
870.
741
0.3
152
0.9
114
1.5
380.
534
0.3
240.
410
0.2
139
430
-34
577
0.8
399
1.1
178
0.5
160
0.8
122
1.2
380.
419
70.
813
91.
158
0.4
147
1.1
941.
553
0.7
420.
423
0.4
190.
331
2110
35-3
968
81.
145
71.
523
10.
723
71.
318
22.
055
0.6
176
0.9
119
1.2
570.
619
91.
610
71.
992
1.4
540.
534
0.7
200.
422
157
40-4
492
61.
757
02.
235
61.
326
41.
717
92.
385
1.0
244
1.5
154
1.8
901.
131
72.
817
43.
514
32.
380
0.9
471.
233
0.7
2116
545
-49
1,42
42.
785
83.
456
62.
140
42.
625
73.
414
71.
838
32.
425
13.
013
21.
746
33.
924
44.
721
93.
312
61.
473
1.8
531.
148
3315
50-5
42,
193
4.2
1,32
85.
386
53.
153
43.
533
04.
620
42.
558
93.
838
74.
820
22.
783
66.
446
98.
136
75.
017
32.
110
22.
671
1.6
6140
2155
-59
3,23
76.
22,
034
8.3
1,20
34.
372
35.
345
67.
326
73.
695
85.
964
27.
831
63.
91,
220
9.2
718
12.4
502
6.7
240
2.9
153
3.9
872.
096
6531
60-6
44,
085
8.6
2,43
911
.11,
646
6.4
868
7.5
521
10.2
347
5.4
1,38
18.
486
010
.952
16.
21,
402
12.2
758
15.5
644
9.8
317
4.1
218
5.9
992.
511
782
3565
-69
4,77
912
.12,
748
15.6
2,03
19.
395
810
.657
815
.138
07.
31,
784
11.8
1,04
314
.974
19.
21,
496
16.8
775
21.1
721
13.8
395
6.6
254
8.9
141
4.5
146
9848
70-7
45,
373
17.6
2,96
022
.72,
413
13.8
1,02
314
.955
920
.046
411
.42,
222
17.7
1,28
622
.893
613
.61,
537
22.8
779
30.4
758
18.2
455
11.3
256
13.7
199
9.2
136
8056
75-7
95,
965
27.3
3,04
734
.42,
918
22.5
1,16
123
.360
231
.455
918
.32,
429
27.1
1,27
333
.11,
156
22.7
1,75
235
.580
445
.694
830
.049
117
.928
322
.920
813
.713
285
4780
-84
6,61
043
.23,
156
52.8
3,45
437
.01,
397
42.0
625
51.7
772
36.4
2,90
944
.01,
432
52.0
1,47
738
.31,
538
46.9
681
62.0
857
39.3
632
32.4
340
39.8
292
26.7
134
7856
≥85
17,6
8910
0.7
6,39
510
9.1
11,2
9496
.52,
765
84.0
913
88.8
1,85
281
.89,
747
112.
23,
663
119.
76,
084
108.
23,
388
97.1
1,04
410
8.3
2,34
492
.81,
516
77.8
657
86.3
859
72.4
273
118
155
Mea
n ag
e at
dea
th69
.977
.070
.165
.874
.777
.674
.180
.970
.066
.273
.373
.971
.876
.467
.465
.470
.4M
edia
n ag
e at
de
ath
7381
7468
7981
7785
7268
7678
7581
7068
75
* Po
pula
tion
data
are
from
US
Cen
sus
Bur
eau
estim
ates
for
July
1, 2
018,
rel
ease
d in
the
2019
vin
tage
file
.
73.5
77
Oth
er/M
ultip
le
Rac
e/U
nkno
wn
Tota
lM
ale
Fem
ale
A
ll H
ispa
nic
Non
-His
pani
c W
hite
Non
-His
pani
c B
lack
Asi
an a
nd P
acifi
c Is
land
er
24
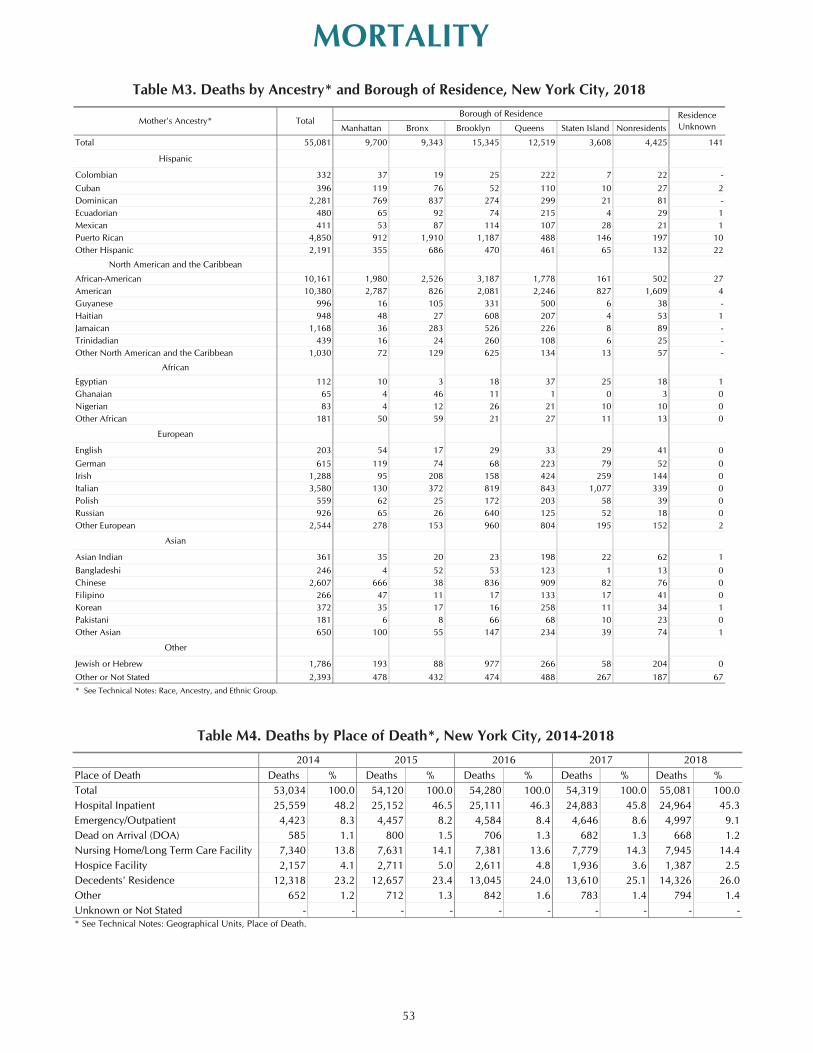
53
MORTALITYTable M3. Deaths by Ancestry* and Borough of Residence, New York City, 2018
Table M4. Deaths by Place of Death*, New York City, 2014-2018
Manhattan Bronx Brooklyn Queens Staten Island Nonresidents
Total 55,081 9,700 9,343 15,345 12,519 3,608 4,425 141
Hispanic
Colombian 332 37 19 25 222 7 22 -Cuban 396 119 76 52 110 10 27 2Dominican 2,281 769 837 274 299 21 81 -Ecuadorian 480 65 92 74 215 4 29 1Mexican 411 53 87 114 107 28 21 1Puerto Rican 4,850 912 1,910 1,187 488 146 197 10Other Hispanic 2,191 355 686 470 461 65 132 22
North American and the Caribbean
African-American 10,161 1,980 2,526 3,187 1,778 161 502 27American 10,380 2,787 826 2,081 2,246 827 1,609 4Guyanese 996 16 105 331 500 6 38 -Haitian 948 48 27 608 207 4 53 1Jamaican 1,168 36 283 526 226 8 89 -Trinidadian 439 16 24 260 108 6 25 -Other North American and the Caribbean 1,030 72 129 625 134 13 57 -
African
Egyptian 112 10 3 18 37 25 18 1Ghanaian 65 4 46 11 1 0 3 0Nigerian 83 4 12 26 21 10 10 0Other African 181 50 59 21 27 11 13 0
European
English 203 54 17 29 33 29 41 0German 615 119 74 68 223 79 52 0Irish 1,288 95 208 158 424 259 144 0Italian 3,580 130 372 819 843 1,077 339 0Polish 559 62 25 172 203 58 39 0Russian 926 65 26 640 125 52 18 0Other European 2,544 278 153 960 804 195 152 2
Asian
Asian Indian 361 35 20 23 198 22 62 1Bangladeshi 246 4 52 53 123 1 13 0Chinese 2,607 666 38 836 909 82 76 0Filipino 266 47 11 17 133 17 41 0Korean 372 35 17 16 258 11 34 1Pakistani 181 6 8 66 68 10 23 0Other Asian 650 100 55 147 234 39 74 1
Other
Jewish or Hebrew 1,786 193 88 977 266 58 204 0Other or Not Stated 2,393 478 432 474 488 267 187 67* See Technical Notes: Race, Ancestry, and Ethnic Group.
TotalMother's Ancestry*Residence Unknown
Borough of Residence
25
Place of Death Deaths % Deaths % Deaths % Deaths % Deaths %Total 53,034 100.0 54,120 100.0 54,280 100.0 54,319 100.0 55,081 100.0Hospital Inpatient 25,559 48.2 25,152 46.5 25,111 46.3 24,883 45.8 24,964 45.3Emergency/Outpatient 4,423 8.3 4,457 8.2 4,584 8.4 4,646 8.6 4,997 9.1Dead on Arrival (DOA) 585 1.1 800 1.5 706 1.3 682 1.3 668 1.2Nursing Home/Long Term Care Facility 7,340 13.8 7,631 14.1 7,381 13.6 7,779 14.3 7,945 14.4Hospice Facility 2,157 4.1 2,711 5.0 2,611 4.8 1,936 3.6 1,387 2.5Decedents' Residence 12,318 23.2 12,657 23.4 13,045 24.0 13,610 25.1 14,326 26.0Other 652 1.2 712 1.3 842 1.6 783 1.4 794 1.4Unknown or Not Stated - - - - - - - - - -* See Technical Notes: Geographical Units, Place of Death.
20182014 2015 20172016
25

54
MORTALITY
Table M5. Deaths by Birthplace and Borough of Residence, New York City, 2018*
Manhattan Bronx Brooklyn Queens Staten IslandTotal 55,081 9,700 9,343 15,345 12,519 3,608 4,425 141United States 32,791 6,472 6,374 7,865 6,162 2,787 3,092 39
United States (excluding Puerto Rico) 28,822 5,684 4,744 6,904 5,803 2,689 2,967 31Puerto Rico 3,969 788 1,630 961 359 98 125 8
China 2,376 616 33 793 799 70 65 -Dominican Republic 2,189 747 817 264 277 20 64 -Jamaica 1,412 50 366 576 300 9 111 -Ukraine 1,100 39 21 860 116 48 15 1Guyana 1,059 18 118 358 515 8 42 -Italy 1,000 39 117 294 298 156 96 -Haiti 966 54 29 616 217 4 46 -Trinidad and Tobago 671 26 38 401 154 13 39 -Poland 521 68 21 223 163 18 28 -Russia 512 42 29 324 88 16 13 -Ecuador 468 64 90 72 209 5 27 1Cuba 395 115 80 53 109 14 22 2Mexico 377 47 80 110 95 27 17 1Germany 336 99 28 49 108 16 36 -Greece 335 17 13 62 208 20 15 -Korea 325 29 13 13 226 11 32 1India 322 34 11 19 174 23 61 -Colombia 321 37 16 25 218 7 18 -Barbados 281 13 23 202 34 3 6 -Philippines 273 48 10 19 140 18 38 -Bangladesh 268 4 52 56 144 - 12 -Ireland 245 28 53 25 86 14 39 -Romania 232 27 8 88 91 6 11 1Panama 220 13 16 152 26 5 8 -Belarus 219 6 1 180 17 12 3 -Other or Not Stated 5,867 948 886 1,646 1,545 278 469 95* See Technical Notes: Geographical Units, Birthplace Presentation.
Residence Unknown
Total Borough of Residence Non-
ResidentsBirthplace
26

55
MORTALITY
Table M6. Deaths by Birthplace* and Age Group, New York City, 2018
Age Group (Years)Birthplace Total <15 15-24 25-34 35-44 45-54 55-64 65-74 75-84 85+Total 55,081 640 410 1,062 1,614 3,617 7,322 10,152 12,575 17,689United States 32,791 609 299 740 989 2,233 4,599 6,190 7,212 9,920
United States (excluding Puerto Rico) 28,822 608 299 721 948 2,101 4,233 5,351 5,949 8,612 Puerto Rico 3,969 1 - 19 41 132 366 839 1,263 1,308China 2,376 - 11 25 36 108 201 338 579 1,078Dominican Republic 2,189 3 17 46 62 167 299 435 559 601Jamaica 1,412 4 4 18 39 85 200 283 379 400Ukraine 1,100 2 1 9 12 26 65 116 267 602Guyana 1,059 2 4 11 26 90 148 229 282 267Italy 1,000 - - - 4 13 52 119 250 562Haiti 966 - 7 4 23 44 135 202 252 299Trinidad and Tobago 671 1 - 9 16 49 106 162 190 138Poland 521 - 2 2 14 26 65 70 61 281Russia 512 - 1 7 7 19 34 69 142 233Ecuador 468 2 2 18 24 28 54 89 116 135Cuba 395 - - - 1 2 39 48 99 206Mexico 377 - 9 40 95 89 53 33 31 27Germany 336 - - 2 1 8 8 47 61 209Greece 335 - - 1 3 4 20 57 98 152Korea 325 - - 1 12 18 39 59 93 103India 322 - 2 12 14 27 49 67 79 72Colombia 321 - 1 2 12 16 30 44 89 127Barbados 281 - - - 4 7 35 60 82 93Philippines 273 1 2 2 11 15 35 66 93 48Bangladesh 268 - 5 7 13 37 60 80 51 15Ireland 245 - - 1 5 6 13 29 72 119Romania 232 - - - 1 2 18 34 47 130Panama 220 1 - 2 1 8 33 55 54 66Belarus 219 - - - 2 6 15 17 47 132Other or Not Stated 5,867 15 43 103 187 484 917 1,154 1,290 1,674* See Technical Notes: Geographical Units, Birthplace Presentation.
26

56
MORTALITY
Table M7. Leading Causes of Death by Age Group and Sex, New York City, 2018
Rank ALL AGES Deaths Percent Deaths Percent Deaths Percent1 Diseases of Heart 17,743 32.2 8,640 31.5 9,103 32.92 Malignant Neoplasms 13,037 23.7 6,391 23.3 6,646 24.03 Influenza and Pneumonia 2,004 3.6 1,013 3.7 991 3.64 Diabetes Mellitus 1,963 3.6 1,033 3.8 930 3.45 Cerebrovascular Diseases 1,888 3.4 812 3.0 1,076 3.96 Chronic Lower Respiratory Diseases 1,781 3.2 787 2.9 994 3.67 Use of or Poisoning by Psychoactive Substance 1,500 2.7 1,136 4.1 364 1.38 Essential Hypertension and Hypertensive Renal Disease 1,272 2.3 539 2.0 733 2.69 Alzheimer's Disease 1,195 2.2 354 1.3 841 3.010 Accidents Except Poisoning by Psychoactive Substance 1,040 1.9 678 2.5 362 1.3
All Other Causes 11,658 21.2 6,009 21.9 5,649 20.4Total 55,081 100.0 27,392 100.0 27,689 100.0
Rank < 1 YEAR Deaths Percent Deaths Percent Deaths Percent1 Congenital Malformations, Deformations 98 22.0 51 19.1 47 26.32 Short Gestation and Low Birthweight 73 16.4 42 15.7 31 17.33 External Causes 57 12.8 38 14.2 19 10.64 Cardiovascular Disorders Originating in the Perinatal Period 53 11.9 32 12.0 21 11.75 Newborn Affected by Complications of Pregnancy 17 3.8 11 4.1 6 3.46 Bacterial Sepsis of Newborn 12 2.7 6 2.2 6 3.47 Newborn Affected by Complications of Placenta 10 2.2 7 2.6 3 1.78 Diseases of Heart 8 1.8 5 1.9 3 1.79 Influenza and Pneumonia 7 1.6 7 2.6 0 0.010 Respiratory Distress of Newborn 6 1.3 2 0.7 4 2.2
All Other Causes 105 23.5 66 24.7 39 21.8Total 446 100.0 267 100.0 179 100.0
Rank 1 - 14 YEARS Deaths Percent Deaths Percent Deaths Percent1 Malignant Neoplasms 48 24.7 30 30.6 18 18.82 Congenital Malformations, Deformations 29 14.9 10 10.2 19 19.83 Accidents Except Poisoning by Psychoactive Substance 14 7.2 7 7.1 7 7.34 Diseases of Heart 10 5.2 5 5.1 5 5.25 Influenza and Pneumonia 9 4.6 4 4.1 5 5.25 Chronic Lower Respiratory Diseases 9 4.6 4 4.1 5 5.2
All Other Causes 75 38.7 38 38.8 37 38.5Total 194 100.0 98 100.0 96 100.0
Rank 15 - 24 YEARS Deaths Percent Deaths Percent Deaths Percent1 Use of or Poisoning by Psychoactive Substance 67 16.3 47 16.4 20 16.12 Assault (Homicide) 65 15.9 58 20.3 7 5.63 Intentional Self-harm (Suicide) 59 14.4 41 14.3 18 14.54 Malignant Neoplasms 48 11.7 26 9.1 22 17.75 Accidents Except Poisoning by Psychoactive Substance 36 8.8 25 8.7 11 8.96 Diseases of Heart 15 3.7 10 3.5 5 4.07 Congenital Malformations, Deformations 13 3.2 10 3.5 3 2.48 Chronic Lower Respiratory Diseases 9 2.2 4 1.4 5 4.09 Influenza and Pneumonia 7 1.7 5 1.7 2 1.610 Diabetes Mellitus 6 1.5 4 1.4 2 1.6
All Other Causes 85 20.7 56 19.6 29 23.4Total 410 100.0 286 100.0 124 100.0
Rank 25 - 34 YEARS Deaths Percent Deaths Percent Deaths Percent1 Use of or Poisoning by Psychoactive Substance 271 25.5 214 28.6 57 18.22 Malignant Neoplasms 121 11.4 62 8.3 59 18.83 Intentional Self-harm (Suicide) 102 9.6 71 9.5 31 9.94 Accidents Except Poisoning by Psychoactive Substance 96 9.0 78 10.4 18 5.85 Assault (Homicide) 91 8.6 82 10.9 9 2.96 Diseases of Heart 61 5.7 41 5.5 20 6.47 Mental Disorders Due to Use of Alcohol 24 2.3 16 2.1 8 2.68 Chronic Lower Respiratory Diseases 21 2.0 10 1.3 11 3.58 Human Immunodeficiency Virus (HIV) Disease 21 2.0 15 2 6 1.910 Congenital Malformations, Deformations 18 1.7 10 1.3 8 2.6
All Other Causes 236 22.2 150 20.0 86 27.5Total 1,062 100.0 749 100.0 313 100.0
Continued on next page.
All Male Female
28
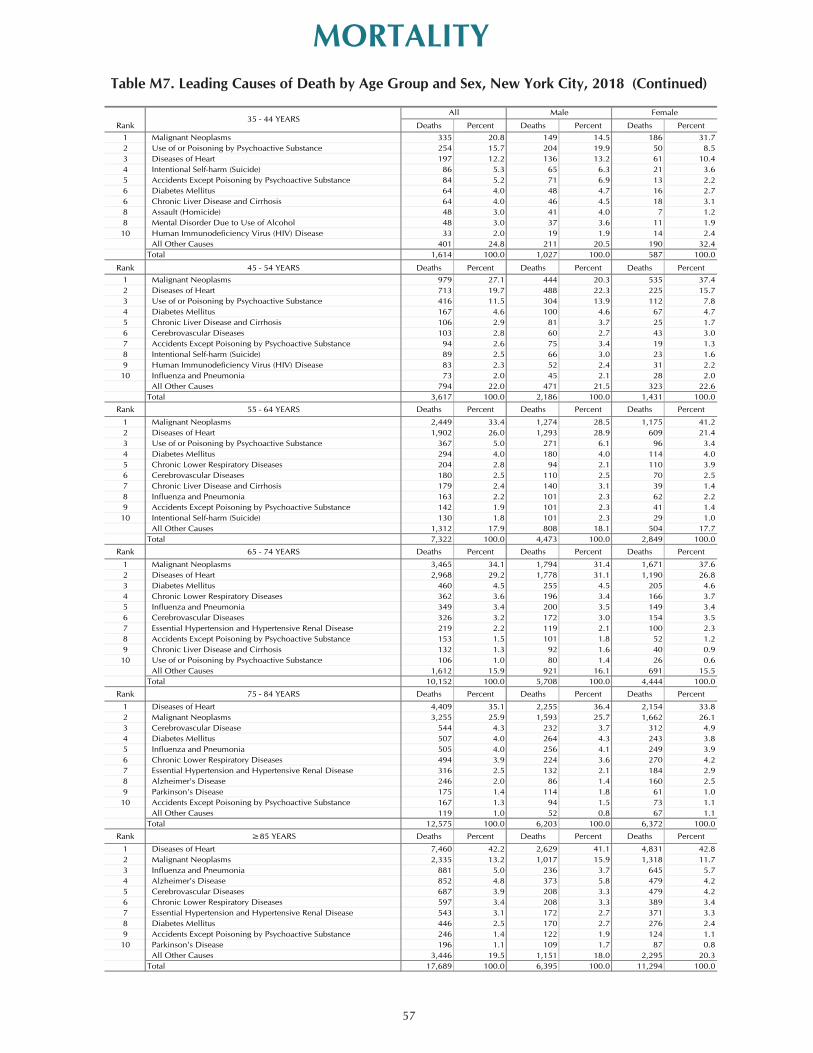
57
MORTALITYTable M7. Leading Causes of Death by Age Group and Sex, New York City, 2018 (Continued)
Deaths Percent Deaths Percent Deaths Percent1 Malignant Neoplasms 335 20.8 149 14.5 186 31.72 Use of or Poisoning by Psychoactive Substance 254 15.7 204 19.9 50 8.53 Diseases of Heart 197 12.2 136 13.2 61 10.44 Intentional Self-harm (Suicide) 86 5.3 65 6.3 21 3.65 Accidents Except Poisoning by Psychoactive Substance 84 5.2 71 6.9 13 2.26 Diabetes Mellitus 64 4.0 48 4.7 16 2.76 Chronic Liver Disease and Cirrhosis 64 4.0 46 4.5 18 3.18 Assault (Homicide) 48 3.0 41 4.0 7 1.28 Mental Disorder Due to Use of Alcohol 48 3.0 37 3.6 11 1.910 Human Immunodeficiency Virus (HIV) Disease 33 2.0 19 1.9 14 2.4
All Other Causes 401 24.8 211 20.5 190 32.4Total 1,614 100.0 1,027 100.0 587 100.0
Rank 45 - 54 YEARS Deaths Percent Deaths Percent Deaths Percent1 Malignant Neoplasms 979 27.1 444 20.3 535 37.42 Diseases of Heart 713 19.7 488 22.3 225 15.73 Use of or Poisoning by Psychoactive Substance 416 11.5 304 13.9 112 7.84 Diabetes Mellitus 167 4.6 100 4.6 67 4.75 Chronic Liver Disease and Cirrhosis 106 2.9 81 3.7 25 1.76 Cerebrovascular Diseases 103 2.8 60 2.7 43 3.07 Accidents Except Poisoning by Psychoactive Substance 94 2.6 75 3.4 19 1.38 Intentional Self-harm (Suicide) 89 2.5 66 3.0 23 1.69 Human Immunodeficiency Virus (HIV) Disease 83 2.3 52 2.4 31 2.210 Influenza and Pneumonia 73 2.0 45 2.1 28 2.0
All Other Causes 794 22.0 471 21.5 323 22.6Total 3,617 100.0 2,186 100.0 1,431 100.0
Rank 55 - 64 YEARS Deaths Percent Deaths Percent Deaths Percent
1 Malignant Neoplasms 2,449 33.4 1,274 28.5 1,175 41.22 Diseases of Heart 1,902 26.0 1,293 28.9 609 21.43 Use of or Poisoning by Psychoactive Substance 367 5.0 271 6.1 96 3.44 Diabetes Mellitus 294 4.0 180 4.0 114 4.05 Chronic Lower Respiratory Diseases 204 2.8 94 2.1 110 3.96 Cerebrovascular Diseases 180 2.5 110 2.5 70 2.57 Chronic Liver Disease and Cirrhosis 179 2.4 140 3.1 39 1.48 Influenza and Pneumonia 163 2.2 101 2.3 62 2.29 Accidents Except Poisoning by Psychoactive Substance 142 1.9 101 2.3 41 1.410 Intentional Self-harm (Suicide) 130 1.8 101 2.3 29 1.0
All Other Causes 1,312 17.9 808 18.1 504 17.7Total 7,322 100.0 4,473 100.0 2,849 100.0
Rank 65 - 74 YEARS Deaths Percent Deaths Percent Deaths Percent
1 Malignant Neoplasms 3,465 34.1 1,794 31.4 1,671 37.62 Diseases of Heart 2,968 29.2 1,778 31.1 1,190 26.83 Diabetes Mellitus 460 4.5 255 4.5 205 4.64 Chronic Lower Respiratory Diseases 362 3.6 196 3.4 166 3.75 Influenza and Pneumonia 349 3.4 200 3.5 149 3.46 Cerebrovascular Diseases 326 3.2 172 3.0 154 3.57 Essential Hypertension and Hypertensive Renal Disease 219 2.2 119 2.1 100 2.38 Accidents Except Poisoning by Psychoactive Substance 153 1.5 101 1.8 52 1.29 Chronic Liver Disease and Cirrhosis 132 1.3 92 1.6 40 0.910 Use of or Poisoning by Psychoactive Substance 106 1.0 80 1.4 26 0.6
All Other Causes 1,612 15.9 921 16.1 691 15.5Total 10,152 100.0 5,708 100.0 4,444 100.0
Rank 75 - 84 YEARS Deaths Percent Deaths Percent Deaths Percent
1 Diseases of Heart 4,409 35.1 2,255 36.4 2,154 33.82 Malignant Neoplasms 3,255 25.9 1,593 25.7 1,662 26.13 Cerebrovascular Disease 544 4.3 232 3.7 312 4.94 Diabetes Mellitus 507 4.0 264 4.3 243 3.85 Influenza and Pneumonia 505 4.0 256 4.1 249 3.96 Chronic Lower Respiratory Diseases 494 3.9 224 3.6 270 4.27 Essential Hypertension and Hypertensive Renal Disease 316 2.5 132 2.1 184 2.98 Alzheimer's Disease 246 2.0 86 1.4 160 2.59 Parkinson's Disease 175 1.4 114 1.8 61 1.010 Accidents Except Poisoning by Psychoactive Substance 167 1.3 94 1.5 73 1.1
All Other Causes 119 1.0 52 0.8 67 1.1Total 12,575 100.0 6,203 100.0 6,372 100.0
Rank ≥85 YEARS Deaths Percent Deaths Percent Deaths Percent
1 Diseases of Heart 7,460 42.2 2,629 41.1 4,831 42.82 Malignant Neoplasms 2,335 13.2 1,017 15.9 1,318 11.73 Influenza and Pneumonia 881 5.0 236 3.7 645 5.74 Alzheimer's Disease 852 4.8 373 5.8 479 4.25 Cerebrovascular Diseases 687 3.9 208 3.3 479 4.26 Chronic Lower Respiratory Diseases 597 3.4 208 3.3 389 3.47 Essential Hypertension and Hypertensive Renal Disease 543 3.1 172 2.7 371 3.38 Diabetes Mellitus 446 2.5 170 2.7 276 2.49 Accidents Except Poisoning by Psychoactive Substance 246 1.4 122 1.9 124 1.110 Parkinson's Disease 196 1.1 109 1.7 87 0.8
All Other Causes 3,446 19.5 1,151 18.0 2,295 20.3Total 17,689 100.0 6,395 100.0 11,294 100.0
All Male Female35 - 44 YEARS
Rank
29

58
MORTALITY
Table M8. Leading Causes of Death by Racial/Ethnic Group* and Sex, New York City, 2018
Deaths Percent Deaths Percent Deaths Percent1 Diseases of Heart 1,431 29.5 693 29.1 738 29.92 Malignant Neoplasms 985 20.3 533 22.4 452 18.33 Influenza and Pneumonia 219 4.5 93 3.9 126 5.14 Diabetes Mellitus 217 4.5 95 4.0 122 4.95 Chronic Lower Respiratory Diseases 207 4.3 83 3.5 124 5.06 Use of or Poisoning by Psychoactive Substance 190 3.9 142 6.0 48 1.97 Alzheimer's Disease 181 3.7 41 1.7 140 5.78 Cerebrovascular Diseases 170 3.5 56 2.4 114 4.69 Essential Hypertension and Hypertensive Renal Disease 101 2.1 43 1.8 58 2.3
10 Chronic Liver Disease and Cirrhosis 80 1.6 60 2.5 20 0.8 All Other Causes 1,069 22.0 541 22.7 528 21.4Total 4,850 100.0 2,380 100.0 2,470 100.0
Deaths Percent Deaths Percent Deaths Percent1 Diseases of Heart 1,542 25.3 787 24.3 755 26.52 Malignant Neoplasms 1,402 23.0 697 21.5 705 24.73 Use of or Poisoning by Psychoactive Substance 309 5.1 250 7.7 59 2.14 Diabetes Mellitus 255 4.2 141 4.4 114 4.05 Cerebrovascular Diseases 245 4.0 115 3.5 130 4.66 Influenza and Pneumonia 199 3.3 100 3.1 99 3.57 Accidents Except Poisoning by Psychoactive Substance 196 3.2 145 4.5 51 1.88 Essential Hypertension and Hypertensive Renal Disease 161 2.6 67 2.1 94 3.39 Alzheimer's Disease 154 2.5 51 1.6 103 3.6
10 Chronic Lower Respiratory Diseases 150 2.5 63 1.9 87 3.1 All Other Causes 1,478 24.3 824 25.4 654 22.9Total 6,091 100.0 3,240 100.0 2,851 100.0
Deaths Percent Deaths Percent Deaths Percent1 Diseases of Heart 1,310 28.1 700 27.8 610 28.62 Malignant Neoplasms 1,301 27.9 711 28.2 590 27.63 Cerebrovascular Diseases 216 4.6 102 4.0 114 5.34 Influenza and Pneumonia 196 4.2 117 4.6 79 3.75 Diabetes Mellitus 184 4.0 99 3.9 85 4.06 Essential Hypertension and Hypertensive Renal Disease 123 2.6 57 2.3 66 3.17 Chronic Lower Respiratory Diseases 118 2.5 78 3.1 40 1.98 Accidents Except Poisoning by Psychoactive Substance 117 2.5 84 3.3 33 1.59 Alzheimer's Disease 91 2.0 30 1.2 61 2.9
10 Intentional Self-harm (Suicide) 74 1.6 46 1.8 28 1.3 All Other Causes 925 19.9 497 19.7 428 20.1Total 4,655 100.0 2,521 100.0 2,134 100.0
Deaths Percent Deaths Percent Deaths Percent1 Diseases of Heart 8,207 35.1 3,959 34.5 4,248 35.62 Malignant Neoplasms 5,783 24.7 2,833 24.7 2,950 24.73 Chronic Lower Respiratory Diseases 841 3.6 364 3.2 477 4.04 Influenza and Pneumonia 827 3.5 436 3.8 391 3.35 Cerebrovascular Diseases 699 3.0 296 2.6 403 3.46 Use of or Poisoning by Psychoactive Substance 533 2.3 413 3.6 120 1.07 Alzheimer's Disease 530 2.3 161 1.4 369 3.18 Diabetes Mellitus 487 2.1 307 2.7 180 1.59 Essential Hypertension and Hypertensive Renal Disease 430 1.8 177 1.5 253 2.1
10 Accidents Except Poisoning by Psychoactive Substance 421 1.8 244 2.1 177 1.5 All Other Causes 4,654 19.9 2,300 20.0 2,354 19.7Total 23,412 100.0 11,490 100.0 11,922 100.0
Deaths Percent Deaths Percent Deaths Percent1 Diseases of Heart 4,802 32.5 2,250 32.2 2,552 32.72 Malignant Neoplasms 3,343 22.6 1,485 21.3 1,858 23.83 Diabetes Mellitus 764 5.2 357 5.1 407 5.24 Influenza and Pneumonia 516 3.5 240 3.4 276 3.54 Cerebrovascular Diseases 516 3.5 217 3.1 299 3.86 Chronic Lower Respiratory Diseases 430 2.9 173 2.5 257 3.37 Essential Hypertension and Hypertensive Renal Disease 420 2.8 176 2.5 244 3.18 Use of or Poisoning by Psychoactive Substance 394 2.7 271 3.9 123 1.69 Alzheimer's Disease 225 1.5 65 0.9 160 2.1
10 Accidents Except Poisoning by Psychoactive Substance 208 1.4 129 1.8 79 1.0 All Other Causes 3,167 21.4 1,625 23.3 1,542 19.8Total 14,785 100.0 6,988 100.0 7,797 100.0
All Male Female
* Decedents of other or multiple races, or with unknown race/ethnicity, are not shown.
Non-Hispanic White
Asian and Pacific Islander
Other Hispanic
Puerto RicanRank
Rank
Rank
Rank
Rank Non-Hispanic Black

59
MORTALITY
Table M9. Leading Causes of Premature Death (Age<65 Years), Overall and by Sex, New York City, 2018
Rank Cause of Death Deaths Percent Deaths Percent Deaths Percent1 Malignant Neoplasms 3,982 27.2 1,987 21.9 1,995 35.8
Trachea, bronchus, and lung 641 4.4 361 4.0 280 5.0 Breast 455 3.1 5 0.1 450 8.1 Colon, rectum, and anus 391 2.7 218 2.4 173 3.1 Pancreas 275 1.9 160 1.8 115 2.1 Liver and intrahepatic bile ducts 238 1.6 174 1.9 64 1.1
2 Diseases of Heart 2,906 19.8 1,978 21.8 928 16.63 Use of or Poisoning by Psychoactive Substance 1,375 9.4 1,040 11.4 335 6.04 Diabetes Mellitus 550 3.8 344 3.8 206 3.75 Accidents Except Poisoning by Psychoactive Substance 474 3.2 361 4.0 113 2.06 Intentional Self-harm (Suicide) 471 3.2 346 3.8 125 2.27 Chronic Liver Disease and Cirrhosis 355 2.4 273 3.0 82 1.58 Cerebrovascular Diseases 331 2.3 200 2.2 131 2.39 Chronic Lower Respiratory Diseases 328 2.2 159 1.7 169 3.0
10 Influenza and Pneumonia 298 2.0 184 2.0 114 2.0 All Other Causes 3,595 24.5 2,214 24.4 1,381 24.8Total 14,665 100.0 9,086 100.0 5,579 100.0
Note: Ten leading causes of death are listed in descending order of frequency for all premature deaths.
All Male Female
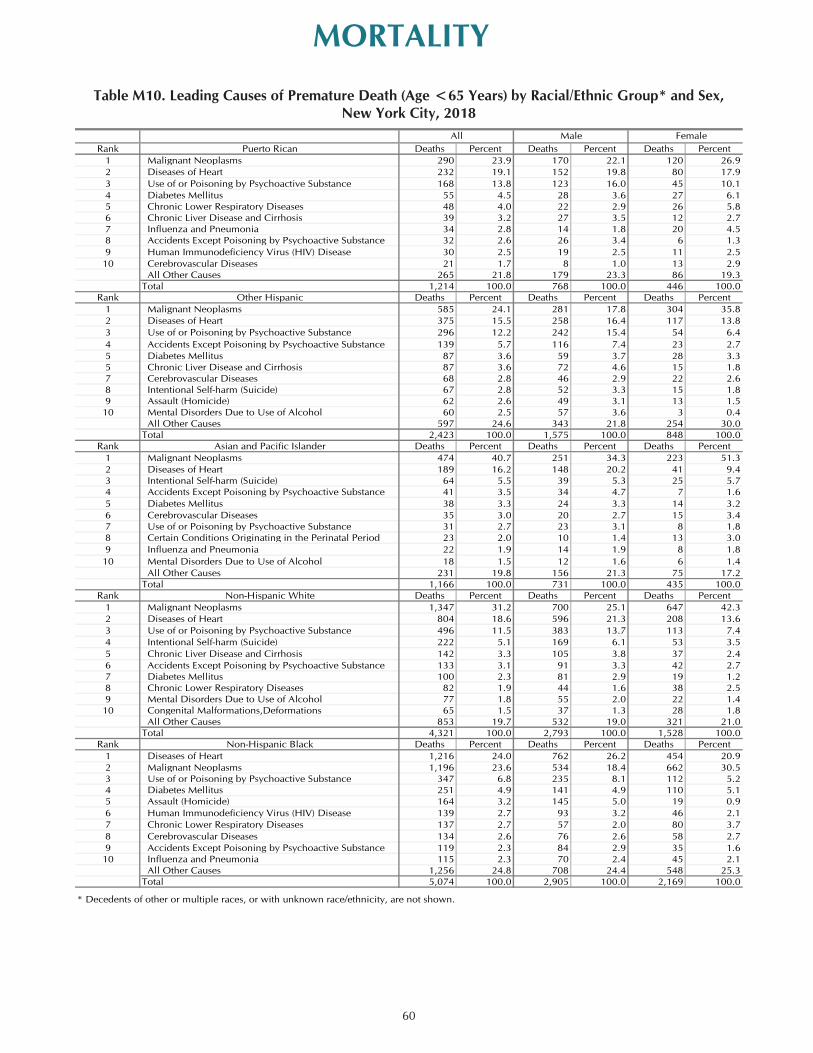
60
MORTALITY
Table M10. Leading Causes of Premature Death (Age <65 Years) by Racial/Ethnic Group* and Sex, New York City, 2018
Rank Puerto Rican Deaths Percent Deaths Percent Deaths Percent1 Malignant Neoplasms 290 23.9 170 22.1 120 26.92 Diseases of Heart 232 19.1 152 19.8 80 17.93 Use of or Poisoning by Psychoactive Substance 168 13.8 123 16.0 45 10.14 Diabetes Mellitus 55 4.5 28 3.6 27 6.15 Chronic Lower Respiratory Diseases 48 4.0 22 2.9 26 5.86 Chronic Liver Disease and Cirrhosis 39 3.2 27 3.5 12 2.77 Influenza and Pneumonia 34 2.8 14 1.8 20 4.58 Accidents Except Poisoning by Psychoactive Substance 32 2.6 26 3.4 6 1.39 Human Immunodeficiency Virus (HIV) Disease 30 2.5 19 2.5 11 2.5
10 Cerebrovascular Diseases 21 1.7 8 1.0 13 2.9 All Other Causes 265 21.8 179 23.3 86 19.3Total 1,214 100.0 768 100.0 446 100.0
Rank Other Hispanic Deaths Percent Deaths Percent Deaths Percent1 Malignant Neoplasms 585 24.1 281 17.8 304 35.82 Diseases of Heart 375 15.5 258 16.4 117 13.83 Use of or Poisoning by Psychoactive Substance 296 12.2 242 15.4 54 6.44 Accidents Except Poisoning by Psychoactive Substance 139 5.7 116 7.4 23 2.75 Diabetes Mellitus 87 3.6 59 3.7 28 3.35 Chronic Liver Disease and Cirrhosis 87 3.6 72 4.6 15 1.87 Cerebrovascular Diseases 68 2.8 46 2.9 22 2.68 Intentional Self-harm (Suicide) 67 2.8 52 3.3 15 1.89 Assault (Homicide) 62 2.6 49 3.1 13 1.5
10 Mental Disorders Due to Use of Alcohol 60 2.5 57 3.6 3 0.4 All Other Causes 597 24.6 343 21.8 254 30.0Total 2,423 100.0 1,575 100.0 848 100.0
Rank Asian and Pacific Islander Deaths Percent Deaths Percent Deaths Percent1 Malignant Neoplasms 474 40.7 251 34.3 223 51.32 Diseases of Heart 189 16.2 148 20.2 41 9.43 Intentional Self-harm (Suicide) 64 5.5 39 5.3 25 5.74 Accidents Except Poisoning by Psychoactive Substance 41 3.5 34 4.7 7 1.65 Diabetes Mellitus 38 3.3 24 3.3 14 3.26 Cerebrovascular Diseases 35 3.0 20 2.7 15 3.47 Use of or Poisoning by Psychoactive Substance 31 2.7 23 3.1 8 1.88 Certain Conditions Originating in the Perinatal Period 23 2.0 10 1.4 13 3.09 Influenza and Pneumonia 22 1.9 14 1.9 8 1.8
10 Mental Disorders Due to Use of Alcohol 18 1.5 12 1.6 6 1.4 All Other Causes 231 19.8 156 21.3 75 17.2Total 1,166 100.0 731 100.0 435 100.0
Rank Non-Hispanic White Deaths Percent Deaths Percent Deaths Percent1 Malignant Neoplasms 1,347 31.2 700 25.1 647 42.32 Diseases of Heart 804 18.6 596 21.3 208 13.63 Use of or Poisoning by Psychoactive Substance 496 11.5 383 13.7 113 7.44 Intentional Self-harm (Suicide) 222 5.1 169 6.1 53 3.55 Chronic Liver Disease and Cirrhosis 142 3.3 105 3.8 37 2.46 Accidents Except Poisoning by Psychoactive Substance 133 3.1 91 3.3 42 2.77 Diabetes Mellitus 100 2.3 81 2.9 19 1.28 Chronic Lower Respiratory Diseases 82 1.9 44 1.6 38 2.59 Mental Disorders Due to Use of Alcohol 77 1.8 55 2.0 22 1.4
10 Congenital Malformations,Deformations 65 1.5 37 1.3 28 1.8 All Other Causes 853 19.7 532 19.0 321 21.0Total 4,321 100.0 2,793 100.0 1,528 100.0
Rank Non-Hispanic Black Deaths Percent Deaths Percent Deaths Percent1 Diseases of Heart 1,216 24.0 762 26.2 454 20.92 Malignant Neoplasms 1,196 23.6 534 18.4 662 30.53 Use of or Poisoning by Psychoactive Substance 347 6.8 235 8.1 112 5.24 Diabetes Mellitus 251 4.9 141 4.9 110 5.15 Assault (Homicide) 164 3.2 145 5.0 19 0.96 Human Immunodeficiency Virus (HIV) Disease 139 2.7 93 3.2 46 2.17 Chronic Lower Respiratory Diseases 137 2.7 57 2.0 80 3.78 Cerebrovascular Diseases 134 2.6 76 2.6 58 2.79 Accidents Except Poisoning by Psychoactive Substance 119 2.3 84 2.9 35 1.6
10 Influenza and Pneumonia 115 2.3 70 2.4 45 2.1 All Other Causes 1,256 24.8 708 24.4 548 25.3Total 5,074 100.0 2,905 100.0 2,169 100.0
* Decedents of other or multiple races, or with unknown race/ethnicity, are not shown.
All Male Female
34

61
MORTALITY
Tabl
e M
11. D
eath
s an
d D
eath
Rat
es p
er 1
00,0
00 P
opul
atio
n fr
om S
elec
ted
Und
erly
ing
Cau
ses,
Ove
rall
and
by E
thni
c G
roup
* an
d Se
x,
New
Yor
k C
ity, 2
018
Ethn
ic G
roup
*Se
x
Cau
se o
f Dea
thN
o.C
rude
R
ate
Age
-A
dj.
Rat
eN
o.C
rude
R
ate
Age
-A
dj.
Rat
eN
o.C
rude
R
ate
Age
-A
dj.
Rat
eN
o.C
rude
R
ate
Age
-A
dj.
Rat
eN
o.C
rude
R
ate
Age
-A
dj.
Rat
eN
o.N
o.C
rude
R
ate
Age
-A
dj.
Rat
eN
o.C
rude
R
ate
Age
-A
dj.
Rat
eA
ll C
ause
s†55
,081
6.6
5.6
10,9
414.
54.
923
,412
8.7
5.7
14,7
858.
06.
94,
655
3.8
3.5
1,28
827
,392
6.8
6.7
27,6
896.
34.
6N
atur
al C
ause
s51
,454
612.
651
5.0
9,97
540
7.2
443.
622
,037
817.
952
4.5
13,8
7375
0.3
641.
94,
392
355.
133
2.6
1,17
724
,760
618.
160
9.2
26,6
9460
7.7
443.
2H
uman
Imm
unod
efic
ienc
y V
irus
(HIV
) Dis
ease
331
3.9
3.6
863.
53.
548
1.8
1.6
180
9.7
8.5
30.
20.
214
230
5.7
5.4
101
2.3
2.0
Mal
igna
nt N
eopl
asm
s13
,037
155.
213
3.8
2,38
797
.510
4.5
5,78
321
4.6
150.
93,
343
180.
815
4.3
1,30
110
5.2
95.7
223
6,39
115
9.5
155.
46,
646
151.
311
9.0
M
alig
nant
neo
plas
m o
f sto
mac
h42
55.
14.
411
14.
54.
813
55.
03.
597
5.2
4.5
786.
35.
84
241
6.0
5.8
184
4.2
3.2
M
alig
nant
neo
plas
ms
of c
olon
, rec
tum
, and
anu
s1,
175
14.0
12.0
208
8.5
9.1
502
18.6
13.0
344
18.6
15.9
105
8.5
7.7
1659
614
.914
.457
913
.210
.2
Mal
igna
nt n
eopl
asm
of p
ancr
eas
1,07
512
.810
.919
88.
18.
750
718
.813
.025
814
.011
.895
7.7
7.0
1752
013
.012
.655
512
.69.
6
Mal
igna
nt n
eopl
asm
s of
trac
hea,
bro
nchu
s, a
nd lu
ng (m
ale)
1,27
231
.830
.819
816
.721
.056
142
.633
.031
537
.637
.218
431
.330
.414
1,27
231
.830
.8-
--
M
alig
nant
neo
plas
ms
of tr
ache
a, b
ronc
hus,
and
lung
(fem
ale)
1,15
426
.320
.415
812
.511
.859
743
.327
.827
827
.520
.710
716
.514
.314
--
-1,
154
26.3
20.4
M
alig
nant
neo
plas
m o
f bre
ast (
fem
ale)
1,12
125
.520
.518
514
.613
.947
634
.523
.035
334
.926
.890
13.9
11.9
17-
--
1,12
125
.520
.5
Mal
igna
nt n
eopl
asm
of c
ervi
x ut
eri (
fem
ale)
121
2.8
2.3
352.
82.
631
2.2
1.7
454.
53.
59
1.4
1.2
1-
--
121
2.8
2.3
M
alig
nant
neo
plas
m o
f ova
ry (f
emal
e)36
38.
36.
767
5.3
5.0
165
12.0
8.4
100
9.9
7.6
264.
03.
55
--
-36
38.
36.
7
Mal
igna
nt n
eopl
asm
of p
rost
ate
(mal
e)72
218
.017
.913
411
.316
.226
420
.114
.725
730
.732
.852
8.9
9.0
1572
218
.017
.9-
--
L
euke
mia
588
7.0
6.1
102
4.2
4.4
320
11.9
8.4
965.
24.
657
4.6
4.2
1332
58.
18.
026
36.
04.
9D
iabe
tes
Mel
litus
1,96
323
.420
.047
219
.320
.948
718
.112
.476
441
.335
.418
414
.913
.856
1,03
325
.825
.193
021
.216
.0Pa
rkin
son’
s D
isea
se44
15.
34.
384
3.4
3.9
244
9.1
5.4
623.
42.
844
3.6
3.4
727
66.
96.
916
53.
82.
.6A
lzhe
imer
’s D
isea
se1,
195
14.2
11.0
335
13.7
15.6
530
19.7
10.3
225
12.2
10.2
917.
47.
114
354
8.8
9.1
841
19.1
12.1
Dis
ease
s of
Hea
rt17
,743
211.
317
3.9
2,97
312
1.4
133.
88,
207
304.
618
3.9
4,80
225
9.7
219.
81,
310
105.
999
.945
18,
640
215.
721
3.4
9,10
320
7.2
143.
4
Hyp
erte
nsiv
e he
art d
isea
se2,
442
29.1
24.2
469
19.1
20.9
863
32.0
19.8
920
49.8
42.2
139
11.2
10.6
511,
133
28.3
27.7
1,30
929
.821
.2
Chr
onic
isch
emic
hea
rt d
isea
ses
11,6
5513
8.8
113.
61,
829
74.7
82.7
5,72
921
2.6
127.
72,
878
155.
613
1.3
907
73.3
69.2
312
5,70
614
2.4
141.
35,
949
135.
492
.4
Acu
te m
yoca
rdia
l inf
arct
ion
1,79
621
.417
.831
913
.014
.380
529
.918
.647
225
.521
.615
512
.511
.845
920
23.0
22.6
876
19.9
14.0
E
ssen
tial (
Prim
ary)
Hyp
erte
nsio
n an
d H
yper
tens
ive
Ren
al D
isea
se1,
272
15.1
12.4
262
10.7
11.9
430
16.0
9.4
420
22.7
19.2
123
9.9
9.4
3753
913
.513
.373
316
.711
.6C
ereb
rova
scul
ar D
isea
ses
1,88
822
.518
.741
516
.918
.769
925
.915
.851
627
.923
.721
617
.516
.442
812
20.3
20.0
1,07
624
.517
.5In
fluen
za a
nd P
neum
onia
204
23.9
19.7
418
17.1
18.8
827
30.7
18.1
516
27.9
23.9
196
15.8
15.1
471,
013
25.3
25.3
991
22.6
15.9
Chr
onic
Low
er R
espi
rato
ry D
isea
ses
1,78
121
.117
.835
714
.615
.984
131
.219
.643
023
.320
.011
89.
59.
135
787
19.6
19.4
994
22.6
16.6
A
sthm
a17
42.
11.
966
2.7
2.8
210.
80.
673
3.9
3.7
90.
70.
75
661.
61.
610
82.
52.
1C
hron
ic L
iver
Dis
ease
and
Cir
rhos
is57
16.
86.
121
18.
68.
921
58.
06.
791
4.9
4.2
282.
32.
126
411
10.3
9.6
160
3.6
3.0
Exte
rnal
Cau
ses
3,62
743
.240
.196
639
.439
.41,
375
51.0
43.9
912
49.3
45.8
263
21.3
20.5
111
2,63
265
.762
.999
522
.720
.0M
otor
Veh
icle
Acc
iden
ts21
92.
62.
467
2.7
2.7
732.
72.
245
2.4
2.3
292.
32.
35
152
3.8
3.6
671.
51.
3Fa
lls48
95.
84.
810
14.
14.
525
19.
35.
962
3.4
2.9
675.
45.
18
299
7.5
7.4
190
4.3
3.1
Inte
ntio
nal S
elf-h
arm
(Sui
cide
)56
26.
76.
399
4.0
4.0
279
10.4
9.3
945.
15.
074
6.0
5.8
1641
210
.39.
815
03.
43.
2A
ssau
lt (H
omic
ide)
311
3.7
3.7
833.
43.
331
1.2
1.2
173
9.4
9.6
110.
90.
913
258
6.4
6.4
531.
21.
2Ev
ents
of U
ndet
erm
ined
Inte
nt29
63.
53.
451
2.1
2.1
127
4.7
4.3
744.
04.
022
1.8
1.9
2220
85.
25.
188
2.0
1.9
Men
tal a
nd B
ehav
iora
l Dis
orde
rs D
ue to
Use
of o
r A
ccid
enta
l
Pois
onin
g by
Psy
choa
ctiv
e Su
bsta
nces
, Exc
ludi
ng A
lcoh
ol1,
500
17.9
16.9
499
20.4
20.0
533
19.8
18.5
394
21.3
18.5
332.
72.
641
1,13
628
.426
.536
48.
37.
7A
ccid
ents
Exc
ept D
rug
Pois
onin
g1,
040
12.4
10.9
271
11.1
11.4
421
15.6
11.1
208
11.2
10.2
117
9.5
8.9
2367
816
.916
.536
28.
26.
4
* Se
e Te
chni
cal N
otes
: Dem
ogra
phic
Cha
ract
eris
tics
of V
ital E
vent
s: R
ace,
Anc
estr
y, a
nd E
thni
c G
roup
.†
For
All
Cau
ses,
rat
es a
re p
er 1
,000
pop
ulat
ion
and
all o
ther
sel
ecte
d ca
uses
rat
es a
re p
er 1
00,0
00 p
opul
atio
n. P
opul
atio
n da
ta a
re fr
om th
e 20
18 U
S C
ensu
s B
urea
u's
estim
ates
.
Mal
eFe
mal
eTo
tal
His
pani
cN
on-H
ispa
nic
Whi
teN
on-H
ispa
nic
Bla
ckA
sian
and
Pac
ific
Isla
nder
Oth
er o
r U
nkno
wn
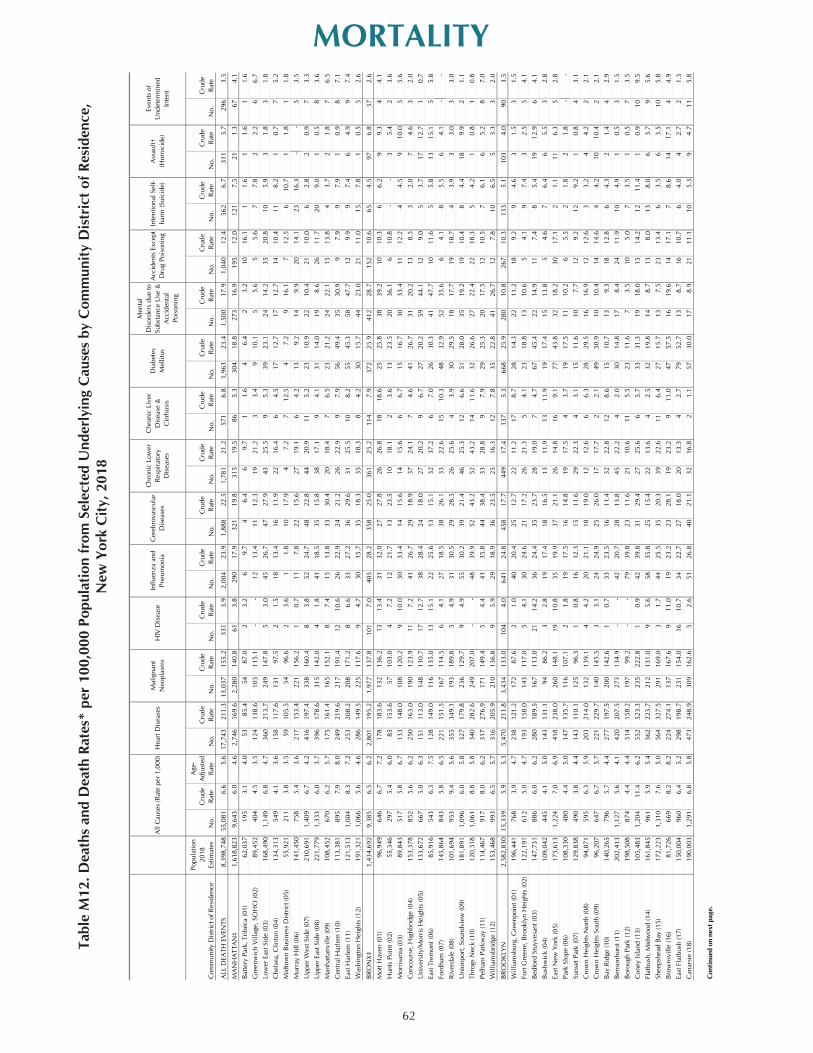
62
MORTALITYTa
ble
M12
. Dea
ths
and
Dea
th R
ates
* pe
r 10
0,00
0 Po
pula
tion
from
Sel
ecte
d U
nder
lyin
g C
ause
s by
Com
mun
ity D
istr
ict o
f Res
iden
ce,
New
Yor
k C
ity, 2
018
Com
mun
ity D
istr
ict o
f Res
iden
ce
Popu
latio
n 20
18
Estim
ates
No.
Cru
de
Rat
e
Age
-A
djus
ted
Rat
eN
o.C
rude
R
ate
No.
Cru
de
Rat
eN
o.C
rude
R
ate
No.
Cru
de
Rat
eN
o.C
rude
R
ate
No.
Cru
de
Rat
eN
o.C
rude
R
ate
No.
Cru
de
Rat
eN
o.C
rude
R
ate
No.
Cru
de
Rat
eN
o.C
rude
R
ate
No.
Cru
de
Rat
eN
o.C
rude
R
ate
ALL
DEA
TH E
VEN
TS8,
398,
748
55,0
816.
65.
617
,743
211.
313
,037
155.
233
13.
92,
004
23.9
1,88
822
.51,
781
21.2
571
6.8
1,96
323
.41,
500
17.9
1,04
012
.456
26.
731
13.
729
63.
5
MA
NH
ATT
AN
‡1,
618,
823
9,64
36.
04.
62,
746
169.
62,
280
140.
861
3.8
290
17.9
321
19.8
315
19.5
865.
330
418
.827
316
.919
512
.012
17.
521
1.3
674.
1B
atte
ry P
ark,
Tri
beca
(01)
62,0
3719
53.
14.
053
85.4
5487
.02
3.2
69.
74
6.4
69.
71
1.6
46.
42
3.2
1016
.11
1.6
11.
61
1.6
Gre
enw
ich
Vill
age,
SO
HO
(02)
89,4
5240
44.
53.
512
413
8.6
103
115.
1-
-12
13.4
1112
.319
21.2
33.
49
10.1
55.
65
5.6
77.
82
2.2
66.
7Lo
wer
Eas
t Sid
e (0
3)16
8,49
01,
149
6.8
4.7
360
213.
724
914
7.8
53.
045
26.7
4727
.943
25.5
95.
339
23.1
2414
.235
20.8
105.
93
1.8
31.
8C
hels
ea, C
linto
n (0
4)13
4,31
354
94.
13.
615
811
7.6
131
97.5
21.
518
13.4
1611
.922
16.4
64.
517
12.7
1712
.714
10.4
118.
21
0.7
75.
2M
idto
wn
Bus
ines
s D
istr
ict (
05)
55,9
2121
13.
83.
559
105.
554
96.6
23.
61
1.8
1017
.94
7.2
712
.54
7.2
916
.17
12.5
610
.71
1.8
11.
8M
urra
y H
ill (0
6)14
1,45
075
85.
43.
621
715
3.4
221
156.
21
0.7
117.
822
15.6
2719
.16
4.2
139.
214
9.9
2014
.123
16.3
--
53.
5U
pper
Wes
t Sid
e (0
7)21
0,69
11,
409
6.7
4.2
416
197.
433
816
0.4
83.
852
24.7
4822
.844
20.9
115.
223
10.9
2210
.421
10.0
62.
82
0.9
73.
3U
pper
Eas
t Sid
e (0
8)22
1,77
91,
333
6.0
3.7
396
178.
631
514
2.0
41.
841
18.5
3515
.838
17.1
94.
131
14.0
198.
626
11.7
209.
01
0.5
83.
6M
anha
ttanv
ille
(09)
108,
452
670
6.2
5.7
175
161.
416
515
2.1
87.
415
13.8
3330
.420
18.4
76.
523
21.2
2422
.115
13.8
43.
72
1.8
76.
5C
entr
al H
arle
m (1
0)11
3,38
189
57.
98.
024
921
9.6
217
191.
412
10.6
2622
.924
21.2
2622
.99
7.9
5649
.435
30.9
97.
99
7.9
10.
98
7.1
East
Har
lem
(11)
121,
513
1,00
48.
37.
225
320
8.2
208
171.
28
6.6
3327
.236
29.6
3125
.510
8.2
5545
.358
47.7
129.
99
7.4
64.
99
7.4
Was
hing
ton
Hei
ghts
(12)
191,
321
1,06
65.
64.
628
614
9.5
225
117.
69
4.7
3015
.735
18.3
3518
.38
4.2
3015
.744
23.0
2111
.015
7.8
10.
55
2.6
BR
ON
X‡
1,43
4,69
29,
385
6.5
6.2
2,80
119
5.2
1,97
713
7.8
101
7.0
405
28.2
358
25.0
361
25.2
114
7.9
372
25.9
412
28.7
152
10.6
654.
597
6.8
372.
6M
ott H
aven
(01)
96,9
4964
66.
77.
217
818
3.6
132
136.
213
13.4
3132
.027
27.8
2626
.818
18.6
2525
.838
39.2
1010
.36
6.2
99.
34
4.1
Hun
ts P
oint
(02)
55,3
4629
75.
46.
085
153.
657
103.
04
7.2
1221
.713
23.5
1018
.12
3.6
1323
.520
36.1
610
.8-
-3
5.4
23.
6M
orri
sani
a (0
3)89
,843
517
5.8
6.7
133
148.
010
812
0.2
910
.030
33.4
1415
.614
15.6
66.
715
16.7
3033
.411
12.2
44.
59
10.0
55.
6C
onco
urse
, Hig
hbri
dge
(04)
153,
378
852
5.6
6.2
250
163.
019
012
3.9
117.
241
26.7
2918
.937
24.1
74.
641
26.7
3120
.213
8.5
32.
07
4.6
32.
0U
nive
rsity
/Mor
ris
Hei
ghts
(05)
133,
672
667
5.0
6.3
151
113.
014
811
0.7
1712
.738
28.4
2418
.027
20.2
96.
727
20.2
5944
.112
9.0
53.
717
12.7
10.
7Ea
st T
rem
ont (
06)
85,9
1654
36.
37.
512
814
9.0
116
135.
013
15.1
2225
.613
15.1
3237
.26
7.0
2630
.341
47.7
1011
.65
5.8
1315
.15
5.8
Ford
ham
(07)
145,
864
843
5.8
6.5
221
151.
516
711
4.5
64.
127
18.5
3826
.133
22.6
1510
.348
32.9
5235
.66
4.1
85.
56
4.1
--
Riv
erda
le (0
8)10
1,69
495
39.
45.
635
534
9.1
193
189.
85
4.9
3130
.529
28.5
2625
.64
3.9
3029
.518
17.7
1918
.74
3.9
33.
03
3.0
Uni
onpo
rt, S
ound
view
(09)
181,
891
1,09
66.
05.
832
717
9.8
236
129.
79
4.9
5530
.239
21.4
4625
.312
6.6
5128
.035
19.2
1910
.48
4.4
189.
92
1.1
Thro
gs N
eck
(10)
120,
318
1,06
18.
85.
834
028
2.6
249
207.
0-
-48
39.9
5243
.252
43.2
1411
.632
26.6
2722
.422
18.3
54.
21
0.8
10.
8Pe
lham
Par
kway
(11)
114,
467
917
8.0
6.2
317
276.
917
114
9.4
54.
441
35.8
4438
.433
28.8
97.
929
25.3
2017
.512
10.5
76.
16
5.2
87.
0W
illia
msb
ridg
e (1
2)15
3,46
899
36.
55.
731
620
5.9
210
136.
89
5.9
2918
.936
23.5
2516
.312
7.8
3522
.841
26.7
127.
810
6.5
53.
33
2.0
BR
OO
KLY
N2,
582,
830
15,3
395.
95.
35,
470
211.
83,
434
133.
010
44.
064
124
.845
817
.744
917
.413
75.
366
825
.928
010
.826
710
.313
35.
110
34.
090
3.5
Will
iam
sbur
g, G
reen
poin
t (01
)19
6,44
176
83.
94.
723
812
1.2
172
87.6
21.
040
20.4
2512
.722
11.2
178.
728
14.3
2211
.218
9.2
94.
63
1.5
31.
5Fo
rt G
reen
e, B
rook
lyn
Hei
ghts
(02)
122,
191
612
5.0
4.7
193
158.
014
311
7.0
54.
130
24.6
2117
.226
21.3
54.
123
18.8
1310
.65
4.1
97.
43
2.5
54.
1B
edfo
rd S
tuyv
esan
t (03
)14
7,73
188
66.
06.
228
018
9.5
167
113.
021
14.2
3624
.435
23.7
2819
.07
4.7
6745
.422
14.9
117.
48
5.4
1912
.96
4.1
Bus
hwic
k (0
4)10
9,04
244
54.
15.
014
313
1.1
9486
.23
2.8
1917
.418
16.5
1311
.913
11.9
1917
.415
13.8
54.
67
6.4
65.
53
2.8
East
New
Yor
k (0
5)17
5,61
31,
224
7.0
6.9
418
238.
026
014
8.1
1910
.835
19.9
3721
.126
14.8
169.
177
43.8
3218
.230
17.1
21.
111
6.3
52.
8Pa
rk S
lope
(06)
108,
330
480
4.4
5.0
147
135.
711
610
7.1
21.
819
17.5
1614
.819
17.5
43.
719
17.5
1110
.26
5.5
21.
82
1.8
--
Suns
et P
ark
(07)
129,
838
490
3.8
4.4
143
110.
112
596
.31
0.8
1612
.315
11.6
2922
.34
3.1
1511
.610
7.7
129.
212
9.2
10.
84
3.1
Cro
wn
Hei
ghts
Nor
th (0
8)94
,871
595
6.3
5.9
203
214.
013
213
9.1
44.
220
21.1
1819
.012
12.6
66.
328
29.5
1616
.912
12.6
33.
24
4.2
22.
1C
row
n H
eigh
ts S
outh
(09)
96,2
0764
76.
75.
722
122
9.7
140
145.
53
3.1
2424
.925
26.0
1717
.72
2.1
4950
.910
10.4
1414
.64
4.2
1010
.42
2.1
Bay
Rid
ge (1
0)14
0,26
579
65.
74.
427
719
7.5
200
142.
61
0.7
3323
.516
11.4
3222
.812
8.6
1510
.713
9.3
1812
.86
4.3
21.
44
2.9
Ben
sonh
urst
(11)
202,
413
1,12
75.
64.
142
020
7.5
273
134.
9-
-42
20.7
2813
.845
22.2
42.
030
14.8
178.
424
11.9
104.
91
0.5
31.
5B
orou
gh P
ark
(12)
198,
508
874
4.4
4.4
314
158.
219
799
.2-
-79
39.8
2311
.621
10.6
115.
523
11.6
73.
510
5.0
73.
51
0.5
73.
5C
oney
Isla
nd (1
3)10
5,48
31,
204
11.4
6.2
552
523.
323
522
2.8
10.
942
39.8
3129
.427
25.6
65.
733
31.3
1918
.015
14.2
1211
.41
0.9
109.
5Fl
atbu
sh, M
idw
ood
(14)
161,
845
961
5.9
5.4
362
223.
721
213
1.0
95.
658
35.8
2515
.422
13.6
42.
532
19.8
148.
713
8.0
138.
06
3.7
95.
6Sh
eeps
head
Bay
(15)
172,
223
1,31
07.
65.
056
432
7.5
291
169.
03
1.7
4425
.535
20.3
3922
.611
6.4
2715
.713
7.5
2313
.46
3.5
63.
510
5.8
Bro
wns
ville
(16)
81,7
2666
98.
28.
222
427
4.1
137
167.
69
11.0
1923
.223
28.1
1923
.29
11.0
4757
.516
19.6
1417
.17
8.6
1417
.14
4.9
East
Fla
tbus
h (1
7)15
0,00
496
06.
45.
229
819
8.7
231
154.
016
10.7
3422
.727
18.0
2013
.34
2.7
7952
.713
8.7
1610
.76
4.0
42.
72
1.3
Can
arsi
e (1
8)19
0,00
31,
291
6.8
5.8
473
248.
930
916
2.6
52.
651
26.8
4021
.132
16.8
21.
157
30.0
178.
921
11.1
105.
39
4.7
115.
8
Con
tinue
d on
nex
t pag
e.
Hea
rt D
isea
ses
Mal
igna
nt
Neo
plas
ms
HIV
Dis
ease
Influ
enza
and
Pn
eum
onia
Cer
ebro
vasc
ular
D
isea
ses
Ass
ault†
(H
omic
ide)
Even
ts o
f U
ndet
erm
ined
In
tent
Dia
bete
s M
ellit
us
Men
tal
Dis
orde
rs d
ue to
Su
bsta
nce
Use
&
Acc
iden
tal
Pois
onin
g
Acc
iden
ts E
xcep
t D
rug
Pois
onin
gIn
tent
iona
l Sel
f-ha
rm (S
uici
de)
All
Cau
ses
(Rat
e pe
r 1,
000)
Chr
onic
Low
er
Res
pira
tory
D
isea
ses
Chr
onic
Liv
er
Dis
ease
&
Cir
rhos
is
1
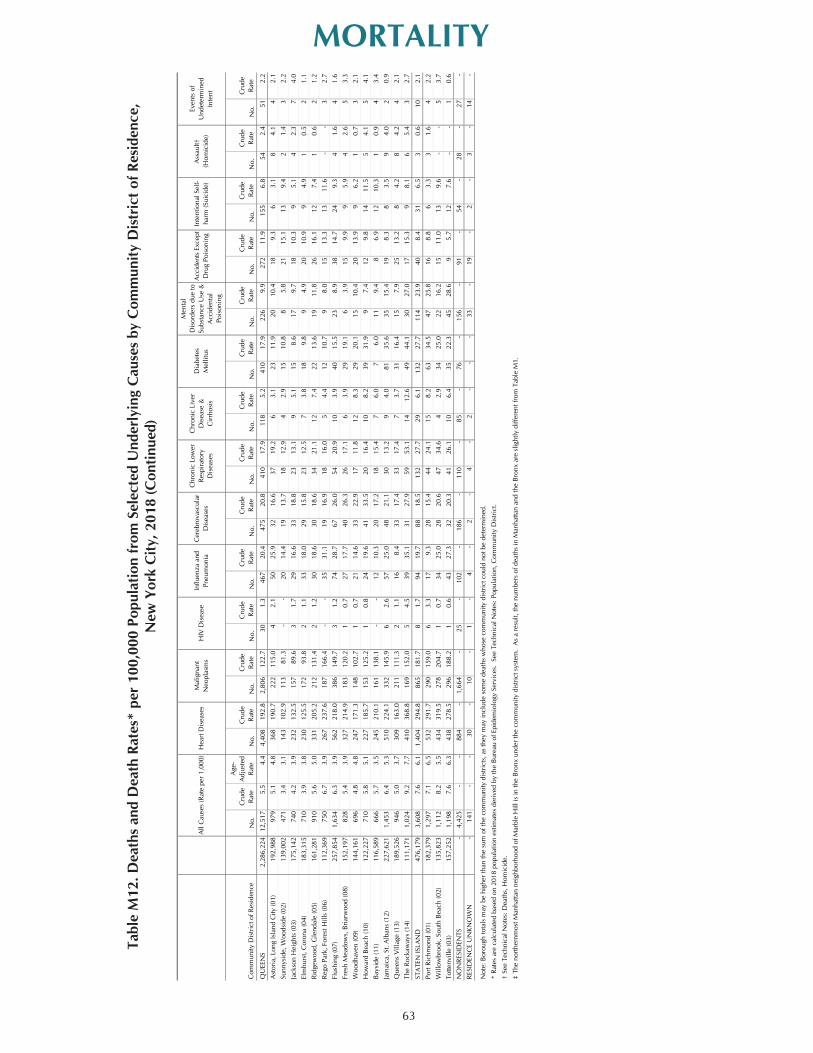
63
MORTALITY
Tabl
e M
12. D
eath
s an
d D
eath
Rat
es*
per
100,
000
Popu
latio
n fr
om S
elec
ted
Und
erly
ing
Cau
ses
by C
omm
unity
Dis
tric
t of R
esid
ence
, N
ew Y
ork
City
, 201
8 (C
ontin
ued)
Com
mun
ity D
istr
ict o
f Res
iden
ceN
o.C
rude
R
ate
Age
-A
djus
ted
Rat
eN
o.C
rude
R
ate
No.
Cru
de
Rat
eN
o.C
rude
R
ate
No.
Cru
de
Rat
eN
o.C
rude
R
ate
No.
Cru
de
Rat
eN
o.C
rude
R
ate
No.
Cru
de
Rat
eN
o.C
rude
R
ate
No.
Cru
de
Rat
eN
o.C
rude
R
ate
No.
Cru
de
Rat
eN
o.C
rude
R
ate
QU
EEN
S2,
286,
224
12,5
175.
54.
44,
408
192.
82,
806
122.
730
1.3
467
20.4
475
20.8
410
17.9
118
5.2
410
17.9
226
9.9
272
11.9
155
6.8
542.
451
2.2
Ast
oria
, Lon
g Is
land
City
(01)
192,
988
979
5.1
4.8
368
190.
722
211
5.0
42.
150
25.9
3216
.637
19.2
63.
123
11.9
2010
.418
9.3
63.
18
4.1
42.
1Su
nnys
ide,
Woo
dsid
e (0
2)13
9,00
247
13.
43.
114
310
2.9
113
81.3
--
2014
.419
13.7
1812
.94
2.9
1510
.88
5.8
2115
.113
9.4
21.
43
2.2
Jack
son
Hei
ghts
(03)
175,
142
740
4.2
3.9
232
132.
515
789
.63
1.7
2916
.633
18.8
2313
.19
5.1
158.
617
9.7
1810
.39
5.1
42.
37
4.0
Elm
hurs
t, C
oron
a (0
4)18
3,31
571
03.
93.
823
012
5.5
172
93.8
21.
133
18.0
2915
.823
12.5
73.
818
9.8
94.
920
10.9
94.
91
0.5
21.
1R
idge
woo
d, G
lend
ale
(05)
161,
281
910
5.6
5.0
331
205.
221
213
1.4
21.
230
18.6
3018
.634
21.1
127.
422
13.6
1911
.826
16.1
127.
41
0.6
21.
2R
ego
Park
, For
est H
ills
(06)
112,
369
750
6.7
3.9
267
237.
618
716
6.4
--
3531
.119
16.9
1816
.05
4.4
1210
.79
8.0
1513
.313
11.6
--
32.
7Fl
ushi
ng (0
7)25
7,85
41,
634
6.3
3.9
562
218.
038
614
9.7
31.
274
28.7
6726
.054
20.9
103.
940
15.5
238.
938
14.7
249.
34
1.6
41.
6Fr
esh
Mea
dow
s, B
riar
woo
d (0
8)15
2,19
782
85.
43.
932
721
4.9
183
120.
21
0.7
2717
.740
26.3
2617
.16
3.9
2919
.16
3.9
159.
99
5.9
42.
65
3.3
Woo
dhav
en (0
9)14
4,16
169
64.
84.
824
717
1.3
148
102.
71
0.7
2114
.633
22.9
1711
.812
8.3
2920
.115
10.4
2013
.99
6.2
10.
73
2.1
How
ard
Bea
ch (1
0)12
2,22
771
05.
85.
122
718
5.7
153
125.
21
0.8
2419
.641
33.5
2016
.410
8.2
3931
.99
7.4
129.
814
11.5
54.
15
4.1
Bay
side
(11)
116,
589
666
5.7
3.5
245
210.
116
113
8.1
--
1210
.320
17.2
1815
.47
6.0
76.
011
9.4
86.
912
10.3
10.
94
3.4
Jam
aica
, St.
Alb
ans
(12)
227,
621
1,45
36.
45.
351
022
4.1
332
145.
96
2.6
5725
.048
21.1
3013
.29
4.0
8135
.635
15.4
198.
38
3.5
94.
02
0.9
Que
ens
Vill
age
(13)
189,
526
946
5.0
3.7
309
163.
021
111
1.3
21.
116
8.4
3317
.433
17.4
73.
731
16.4
157.
925
13.2
84.
28
4.2
42.
1Th
e R
ocka
way
s (1
4)11
1,17
11,
024
9.2
7.7
410
368.
816
915
2.0
54.
539
35.1
3127
.959
53.1
1412
.649
44.1
3027
.017
15.3
98.
16
5.4
32.
7
STA
TEN
ISLA
ND
476,
179
3,60
87.
66.
11,
404
294.
886
518
1.7
81.
794
19.7
8818
.513
227
.729
6.1
132
27.7
114
23.9
408.
431
6.5
30.
610
2.1
Port
Ric
hmon
d (0
1)18
2,37
91,
297
7.1
6.5
532
291.
729
015
9.0
63.
317
9.3
2815
.444
24.1
158.
263
34.5
4725
.816
8.8
63.
33
1.6
42.
2W
illow
broo
k, S
outh
Bea
ch (0
2)13
5,82
31,
112
8.2
5.5
434
319.
527
820
4.7
10.
734
25.0
2820
.647
34.6
42.
934
25.0
2216
.215
11.0
139.
6-
-5
3.7
Totte
nvill
e (0
3)15
7,25
21,
198
7.6
6.3
438
278.
529
618
8.2
10.
643
27.3
3220
.341
26.1
106.
435
22.3
4528
.69
5.7
127.
6-
-1
0.6
NO
NR
ESID
ENTS
-4,
425
--
884
-1,
664
-25
-10
2-
186
-11
0-
85-
76-
156
-91
-54
-28
-27
-R
ESID
ENC
E U
NK
NO
WN
-14
1-
-30
-10
-1
-4
-2
-4
-2
--
-33
-19
-2
-3
-14
-
Not
e: B
orou
gh to
tals
may
be
high
er th
an th
e su
m o
f the
com
mun
ity d
istr
icts
, as
they
may
incl
ude
som
e de
aths
who
se c
omm
unity
dis
tric
t cou
ld n
ot b
e de
term
ined
.
* R
ates
are
cal
cula
ted
base
d on
201
8 po
pula
tion
estim
ates
der
ived
by
the
Bur
eau
of E
pide
mio
logy
Ser
vice
s. S
ee T
echn
ical
Not
es: P
opul
atio
n, C
omm
unity
Dis
tric
t.
† Se
e Te
chni
cal N
otes
: Dea
ths,
Hom
icid
e.
‡ Th
e no
rthe
rnm
ost M
anha
ttan
neig
hbor
hood
of M
arbl
e H
ill is
in th
e B
ronx
und
er th
e co
mm
unity
dis
tric
t sys
tem
. A
s a
resu
lt, th
e nu
mbe
rs o
f dea
ths
in M
anha
ttan
and
the
Bro
nx a
re s
light
ly d
iffer
ent f
rom
Tab
le M
1.
Ass
ault†
(H
omic
ide)
Even
ts o
f U
ndet
erm
ined
In
tent
All
Cau
ses
(Rat
e pe
r 1,
000)
HIV
Dis
ease
Hea
rt D
isea
ses
Mal
igna
nt
Neo
plas
ms
Influ
enza
and
Pn
eum
onia
Cer
ebro
vasc
ular
D
isea
ses
Chr
onic
Low
er
Res
pira
tory
D
isea
ses
Chr
onic
Liv
er
Dis
ease
&
Cir
rhos
is
Dia
bete
s M
ellit
us
Men
tal
Dis
orde
rs d
ue to
Su
bsta
nce
Use
&
Acc
iden
tal
Pois
onin
g
Acc
iden
ts E
xcep
t D
rug
Pois
onin
gIn
tent
iona
l Sel
f-ha
rm (S
uici
de)
1

64
MORTALITY Table M13. Deaths and Crude Death Rates* per 100,000 Population for Selected Causes, New York City, 1901-2018
ANNUAL 1901- 1906- 1911- 1916- 1921- 1926- 1931- 1936- 1941- 1946- 1949- 1952-
Cause (ICD-10 Codes)‡‡ 1905 1910 1915 1920 1925 1930 1935 1940 1945 1948 1951 1955Infant Deaths (under 1 year) 15,611 16,609 14,060 12,004 8,895 7,662 5,521 4,079 3,828 4,298 3,882 4,021 Rate per 1,000 live births 120.8 115.2 100.0 88.2 68.9 61.0 52.0 39.8 30.3 26.8 24.5 24.6Neonatal Deaths (under 28 days) §§ §§ 5,143 4,894 4,309 3,892 3,152 2,631 2,764 3,298 2,989 3,032 Rate per 1,000 live births 37.4 36.0 33.0 31.0 29.7 25.7 21.9 20.5 18.9 18.5Early Neonatal Deaths (under 7 Days) §§ §§ §§ §§ §§ §§ §§ 2,110 2,338 2,845 2,604 2,713 Rate per 1,000 live births 20.5 18.5 17.7 16.4 16.6Fetal Deaths (28 Weeks Gestation and Older) §§ §§ §§ §§ §§ §§ §§ 2,589 2,709 2,902 2,441 2,310 Ratio per 1,000 live births 25.3 21.4 18.1 15.4 14.1 Perinatal mortality ratio† §§ §§ §§ §§ §§ §§ §§ 44.7 39.1 35.1 31.3 30.2Pregnancy, Childbirth, and the Puerperium (O00-O99) §§ §§ §§ §§ §§ §§ §§ §§ §§ §§ §§ §§ Rate per 100,000 live birthsMaternal Causes |||| (A34, O00-O95, O98-O99) 694 745 694 664 689 651 608 372 255 178 115 102 Ratio per 100,000 live births 538.0 517.4 493.7 487.9 528.1 518.4 572.6 363.2 201.6 110.8 72.6 62.3Respiratory Tuberculosis (A16) 8,154 8,832 8,745 7,915 4,937 4,574 4,068 3,680 3,281 2,932 2,173 1,178 Rate 215.4 197.5 173.2 144.1 80.0 68.2 57.3 50.0 43.2 37.7 27.4 15.0Other Forms of Tuberculosis (A17-A19) §§ §§ §§ §§ §§ §§ §§ §§ §§ 225 174 97 Rate 2.9 2.2 1.2HIV Disease (B20-B24)‡ §§ §§ §§ §§ §§ §§ §§ §§ §§ §§ §§ §§ Rate Malignant Neoplasms (C00-C97) 2,621 3,334 4,256 4,993 6,229 7,637 9,062 11,257 13,169 14,627 15,556 16,553 Rate 69.2 74.5 84.3 90.9 100.9 113.9 127.6 152.9 173.3 188.2 196.0 210.6 Trachea, bronchus, and lung, male (C33-C34) §§ §§ §§ §§ §§ §§ §§ §§ §§ 828 847 1,021 Rate 21.9 22.2 27.0 Trachea, bronchus, and lung, female (C33-C34) §§ §§ §§ §§ §§ §§ §§ §§ §§ 220 179 228 Rate 5.5 4.4 5.6 Colon, rectum, and anus (C18-C21) §§ §§ §§ §§ §§ §§ §§ §§ §§ §§ §§ §§ Rate Breast, female (C50) §§ §§ §§ §§ §§ §§ §§ §§ §§ 1,429 1,476 1,517 Rate 35.9 36.4 37.3Diabetes Mellitus (E10-E14) 520 690 916 1,063 1,284 1,624 2,140 2,787 3,131 3,423 1,583 1,644 Rate 13.7 15.4 18.1 19.4 20.8 24.2 30.1 37.9 41.2 44.0 19.9 20.9Major Cardiovascular Diseases (I00-I78) 5,954 9,148 12,699 14,792 18,114 21,815 23,706 25,711 30,886 32,539 36,206 37,724 Rate 157.3 204.5 251.5 269.3 293.3 325.5 333.8 349.2 406.6 418.7 456.3 479.9 Cerebrovascular disease (I60-I69) 2,593 1,790 970 834 719 723 1,333 3,846 3,611 3,710 5,099 5,688 Rate 68.4 40.0 19.2 15.2 11.6 10.8 20.2 52.2 47.5 47.7 64.3 72.4Influenza and Pneumonia (J09-J18) 10,425 10,985 10,528 17,136 8,935 9,989 8,205 5,337 3,453 3,014 2,469 2,664 Rate 275.4 245.6 208.5 312.0 144.7 149.0 115.5 72.5 45.5 38.8 31.2 33.9Other Respiratory Diseases (J00-J06, J20-J99) 3,224 2,307 1,458 1,407 689 622 594 536 492 424 450 461 Rate 85.2 51.6 38.9 25.6 11.2 9.3 8.4 7.3 6.5 5.5 5.7 5.9Chronic Liver Disease and Cirrhosis (K70, K73-K74) 814 1,076 900 500 338 413 584 922 1,052 1,500 1,500 1,440 Rate 21.5 24.1 17.8 9.1 5.5 6.2 8.2 12.5 13.8 17.5 19.2 18.3Nephritis, Nephrosis, etc. (N00-N07, N17-N19, N25-N27) 5,752 5,600 5,499 5,676 4,108 3,411 3,608 3,675 3,081 2,574 570 556 Rate 151.9 125.2 108.9 103.4 50.9 50.8 50.9 40.6 40.6 33.1 7.2 7.1Use of Psychoactive Substance (F11-F16, F18-F19) §§ §§ §§ §§ §§ §§ §§ §§ §§ §§ §§ 81 Rate 1.0Accidental Drug Poisoning (X40-X42, X44)†† §§ §§ §§ §§ §§ §§ §§ §§ §§ §§ §§ §§ Rate Motor Vehicle Accidents¶ §§ §§ 253 658 929 1,175 1,167 920 728 635 600 634 Rate 5.0 12.0 15.0 17.5 16.4 12.5 9.6 8.2 7.6 8.1Home Accidents §§ §§ §§ §§ §§ §§ §§ 1,546 1,823 1,941 1,699 1,568 Rate 21.0 24.0 25.0 21.4 19.9Other Accidents (rest of V01-X59, Y85-Y86) 3,521 3,549 3,516 3,426 3,138 3,574 3,205 3,107 3,091 3,255 2,707 2,450 Rate 93.0 79.3 69.3 62.4 50.8 53.3 45.1 42.2 40.7 41.9 34.3 31.2Intentional Self-harm (Suicide) (X60-X84, Y87.0) 761 825 686 742 842 1,163 1,369 1,191 907 930 863 649 Rate 20.1 18.4 17.2 13.5 13.6 17.4 19.3 16.2 11.9 12.0 10.9 8.3Assault (Homicide) (X85-Y09, Y87.1) 143 247 293 271 334 405 522 351 265 362 318 340 Rate 3.8 5.5 5.8 4.9 5.4 6.0 7.4 4.5 3.5 4.7 4.0 4.3Events of Undetermined Intent (Y10-Y34, Y87.2, Y89.9) §§ §§ §§ §§ §§ §§ §§ §§ §§ §§ §§ §§ Rate Alzheimer's Disease (G30) §§ §§ §§ §§ §§ §§ §§ §§ §§ §§ §§ §§ RateAsthma (J45-J46) §§ §§ §§ §§ §§ §§ §§ §§ §§ §§ §§ §§ Rate
*Populations for calculating rates vary by year. See Technical Notes: Population, Citywide.†See Technical Notes: Vital Events Rates. ‡HIV disease was first reported as a cause of death in 1982. See the Technical Notes and Historical Technical Notes: Deaths, HIV and AIDS Mortality. §Data for 1982-1985.||Rate not calculated for count less than 5.¶Motor vehicle accident codes are listed in Table M1.**World Trade Center (WTC) disaster deaths are not included in 2001. See Special Section on WTC deaths in the 2002 Summary of Vital Statistics for detailed statistics.††Beginning January 2007, causes of death coding was changed. See Technical Notes: Deaths, Cause of Death Coding.‡‡ Codes following causes in parenthesis are the International Classification of Diseases, Tenth Revision.§§Data are not available or not applicable.||||See Technical Notes: Maternal Death and Maternal Mortality.
38

65
MORTALITY Table M13. Deaths and Crude Death Rates* per 100,000 Population for Selected Causes, New York City, 1901-2018
AVERAGE1956- 1961- 1966- 1971- 1976- 1981- 1986- 1991- 1996- 2001- 2006-1960 1965 1970 1975 1980 1985 1990 1995 2000 2005** 2010 2011 2012 2013 2014 2015 2016 2017 2018
4,290 4,333 3,477 2,312 1,875 1,624 1,691 1,339 881 760 682 577 583 551 516 526 491 500 44625.7 26.2 23.6 19.9 17.4 14.4 12.8 10.0 7.1 6.1 5.4 4.7 4.7 4.6 4.2 4.3 4.1 4.3 3.9
3,220 3,226 2,602 1,714 1,333 1,097 1,159 912 609 512 445 378 383 377 326 342 312 344 27819.3 19.5 17.7 14.8 12.3 9.7 8.8 6.8 4.9 4.1 3.5 3.1 3.1 3.1 2.7 2.8 2.6 2.9 2.4
2,909 2,922 2,351 1,480 1,131 927 972 753 478 394 335 293 301 283 254 242 230 250 21917.4 17.7 16.0 12.8 10.5 8.2 7.4 5.6 3.8 3.2 2.6 2.4 2.4 2.3 2.1 2.0 1.9 2.1 1.9
2,362 2,276 1,885 1,288 835 719 698 686 518 431 388 368 379 371 401 345 388 347 37814.1 13.8 12.8 11.1 7.7 6.4 5.3 5.1 4.2 3.5 3.1 3.0 3.1 3.1 3.3 2.8 3.2 3.0 3.331.1 31.0 28.4 23.6 18.1 14.5 12.6 10.6 8.0 6.7 5.7 5.4 5.5 5.4 5.3 4.8 5.1 5.1 5.2
§§ §§ §§ §§ §§ §§ §§ §§ 30 32 39 37 29 30 27 39 24 43 3224.1 25.7 30.5 30.1 23.5 24.9 22.1 32.1 19.9 36.7 28.0
107 109 73 36 28 33 29 26 22 29 32 30 23 25 23 35 18 25 2364.1 66.0 49.6 31.1 25.9 29.2 22.3 19.2 17.5 23.1 25.4 24.4 18.7 20.8 18.8 28.8 15.0 21.4 20.1824 624 432 235 141 125 174 135 39 25 16 27 13 13 22 17 16 13 17
10.6 8.0 5.5 3.1 2.0 1.7 2.4 1.8 0.5 0.3 0.2 0.3 0.2 0.2 0.3 0.2 0.2 0.2 0.252 43 39 32 22 35 55 34 14 5 5 5 3 4 9 3 5 2 3
0.7 0.6 0.5 0.4 0.3 0.5 0.8 0.5 0.2 0.1 0.1 0.1 || || 0.1 || 0.1 || ||§§ §§ §§ §§ §§ 768§ 3,703 6,257 2,716 1,603 1,032 766 609 579 523 483 432 369 331
10.7 50.9 83.2 36.4 19.9 12.7 9.3 7.3 6.9 6.2 5.6 5.1 4.3 3.916,869 17,398 17,814 17,315 16,549 15,889 15,612 15,191 14,335 13,717 13,185 13,443 13,405 13,362 13,380 13,318 13,533 13,297 13,037216.1 222.1 226.3 226.3 228.7 222.3 214.7 201.9 192.2 169.9 162.1 162.6 160.8 159.0 157.6 155.8 158.5 154.2 155.21,157 1,294 1,890 2,434 2,387 2,217 2,201 2,083 1,849 1,713 1,565 1,538 1,585 1,569 1,405 1,453 1,354 1,297 1,27230.9 34.8 51.0 68.1 71.0 66.7 64.4 60.6 52.7 44.8 40.5 39.1 39.9 39.1 34.7 35.6 33.2 31.5 31.8261 303 474 777 970 1,169 1,315 1,426 1,416 1,388 1,340 1,340 1,302 1,349 1,254 1,271 1,165 1,170 1,1546.4 7.4 11.4 19.1 25.0 30.6 33.9 36.7 35.9 32.7 31.4 30.9 29.8 30.7 28.2 28.4 26.1 25.9 26.3§§ §§ §§ §§ §§ §§ §§ 1,805 1,685 1,546 1,414 1,374 1,380 1,329 1,268 1,275 1,311 1,304 1,175
24.0 22.6 19.2 17.4 16.6 16.6 15.8 14.9 14.9 15.4 15.1 14.01,573 1,694 1,787 1,723 1,622 1,533 1,537 1,510 1,354 1,266 1,111 1,090 1,122 1,080 1,098 1,049 1,084 1,032 1,12138.7 41.3 42.9 42.3 41.9 40.1 39.6 38.9 34.3 29.8 26.0 25.1 25.7 24.6 24.7 23.5 24.3 22.9 25.5
1,581 1,789 1,867 2,064 1,547 1,436 1,198 1,348 1,659 1,770 1,662 1,770 1,813 1,844 1,798 1,852 1,796 1,802 1,96320.3 22.9 23.7 27.0 21.4 20.1 16.5 17.9 22.2 21.9 20.4 21.4 21.7 21.9 21.2 21.7 21.0 20.9 23.4
38,988 39,943 41,981 40,639 37,978 37,818 33,527 32,074 29,330 26,663 23,414 20,044 19,808 19,967 19,715 20,502 20,597 21,031 21,328499.5 510.2 532.4 531.1 524.8 529.1 461.0 426.4 393.2 330.3 287.9 242.4 237.6 237.5 232.2 239.8 241.2 243.9 253.96,013 6,174 6,277 5,433 4,174 3,194 2,927 2,256 2,058 1,807 1,555 1,750 1,647 1,707 1,787 1,847 1,842 1,901 1,88877.0 78.9 79.7 71.0 57.7 44.7 40.2 30.0 27.6 22.4 19.1 21.2 19.8 20.3 21.0 21.6 21.6 22.0 22.5
3,459 3,394 3,562 3,164 3,000 2,740 3,354 2,810 2,548 2,726 2,372 2,492 2,245 2,472 2,220 2,096 2,019 1,945 2,00444.3 43.4 45.2 41.4 41.5 38.3 46.1 37.4 34.2 33.8 29.2 30.1 26.9 29.4 26.1 24.5 23.6 22.6 23.9651 960 1,425 1,627 1,583 1,941 2,507 1,943 2,025 2,037 1,909 2,278 2,209 2,355 2,425 2,386 2,238 2,407 2,4168.3 12.3 18.1 21.3 21.9 27.2 34.5 25.8 27.1 25.2 23.5 27.5 26.5 28.0 28.6 27.9 26.2 27.9 28.8
1,858 2,386 2,936 2,440 2,185 1,789 1,289 946 697 521 493 550 534 586 589 610 522 605 57123.8 30.5 37.3 31.9 30.2 25.0 17.7 12.6 9.3 6.5 6.1 6.7 6.4 7.0 6.9 7.1 6.1 7.0 6.8573 509 447 372 381 383 816 311 564 654 429 453 461 464 486 437 416 388 4597.3 6.5 5.7 4.9 5.3 5.4 11.2 4.1 7.6 8.1 5.3 5.5 5.5 5.5 5.7 5.1 4.9 4.5 5.596 263 551 677 414 573 787 947 875 866 262 158 152 148 170 195 172 134 125
1.2 3.4 7.0 8.8 5.7 8.0 10.8 12.6 11.7 10.7 3.2 1.9 1.8 1.8 2.0 2.3 2.0 1.6 1.5§§ §§ §§ §§ §§ 1 143 49 26 41 353 600 660 724 723 856 1,320 1,398 1,375
|| 2.0 0.7 0.3 0.5 4.3 7.3 7.9 8.6 8.5 10.0 15.5 16.2 16.4655 714 887 834 606 477 624 554 419 386 315 283 315 305 271 258 245 221 2198.4 9.1 11.3 10.9 8.4 6.7 8.6 7.4 5.6 4.8 3.9 3.4 3.8 3.6 3.2 3.0 2.9 2.6 2.6
1,095 951 871 755 525 486 589 508 §§ §§ §§ §§ §§ §§ §§ §§ §§ §§ §§14.0 12.1 11.1 9.9 7.3 6.8 8.1 6.8
2,091 1,947 1,730 1,239 926 812 880 394 493 792 712 735 719 731 755 798 752 832 82126.8 24.9 22.0 16.2 12.8 11.4 12.1 5.2 6.6 9.8 8.8 8.9 8.6 8.7 8.9 9.3 8.8 9.6 9.8711 908 680 641 711 603 600 599 514 483 477 509 557 550 565 552 525 565 5629.1 11.6 8.6 8.4 9.8 8.4 8.3 8.0 6.9 6.0 5.9 6.2 6.7 6.5 6.7 6.5 6.1 6.6 6.7366 592 992 1,663 1,700 1,763 1,902 1,815 778 624 549 528 440 343 353 379 362 298 3114.7 7.6 12.6 21.7 23.5 24.7 26.2 24.1 10.4 7.7 6.8 6.4 5.3 4.1 4.2 4.4 4.2 3.5 3.7§§ §§ 946 1,062 699 696 504 161 151 232 212 247 241 227 253 265 259 245 296
10.9 13.9 9.7 9.7 6.9 2.0 2.0 2.9 2.6 3.0 2.9 2.7 3.0 3.1 3.0 2.8 3.5§§ §§ §§ §§ §§ §§ §§ 84 115 232 400 626 696 740 789 1,079 1,100 1,116 1,195
1.2 1.5 2.9 4.9 7.6 8.3 8.8 9.3 12.6 12.9 12.9 14.2§§ §§ §§ §§ §§ §§ §§ 269 243 196 154 171 166 180 182 167 157 161 174
3.7 3.3 2.4 1.9 2.1 2.0 2.1 2.1 2.0 1.8 1.9 2.1
39

66
MORTALITYTable M14. Alcohol-attributable Deaths Due to Excessive Alcohol Use, Age ≥ 20 Years*,
New York City, 2016-2018
Total† Male Female Total† Male Female Total† Male Female1,959 1,414 545 2,120 1,500 620 2,036 1,458 578
Chronic Causes*Acute pancreatitis 12 6 6 11 6 4 11 7 5Alcohol abuse 68 58 10 57 49 8 112 88 24Alcohol cardiomyopathy 9 7 2 6 5 1 9 8 1Alcohol dependence syndrome 194 157 37 167 128 39 124 93 31Alcohol-induced chronic pancreatitis 1 1 - - - - 1 1 -Alcoholic gastritis - - - - - - 1 1 -Alcoholic liver disease 369 276 93 424 313 111 398 309 89Alcoholic psychosis 4 3 1 4 2 2 50 40 10Breast cancer (females only) 12 - 12 17 - 17 14 - 14Chronic hepatitis < 1 < 1 < 1 < 1 - < 1 < 1 - < 1Chronic pancreatitis 4 3 2 3 1 2 3 3 -Epilepsy 5 2 2 6 4 2 7 3 4Esophageal cancer 7 5 2 10 8 2 6 4 1Esophageal varices 1 < 1 1 2 < 1 2 < 1 - < 1Fetal alcohol syndrome - - - 1 - 1 - - -Gastroesophageal hemorrhage 1 1 - < 1 < 1 - 2 1 1Hypertension 91 41 49 139 64 75 100 38 62Ischemic heart disease 20 11 9 32 17 15 22 10 12Laryngeal cancer 5 4 1 6 5 1 4 3 1Liver cancer 34 23 11 47 32 15 31 19 12Liver cirrhosis unspecified 84 45 40 98 47 51 95 52 43Low birth weight prematurity IUGR‡ death 3 1 1 4 2 2 2 1 1Oropharyngeal cancer 7 5 1 11 8 3 6 4 2Portal hypertension < 1 - < 1 1 < 1 < 1 4 4 -Prostate cancer (males only) 4 4 - 6 6 - < 1 - < 1Psoriasis < 1 - < 1 - - - - - -Stroke hemorrhagic 24 20 4 39 30 9 25 19 6Stroke ischemic 10 7 3 11 7 4 11 8 4Supraventricular cardiac dysrhythmia 3 1 2 5 2 3 3 1 2Subtotal 972 681 290 1107 738 369 1043 716 326Acute CausesAlcohol poisoning 75 56 19 76 64 12 53 45 8Aspiration 4 3 1 3 3 < 1 4 3 1Child maltreatment 3 1 2 2 1 1 3 2 1Drowning 2 2 - 4 3 1 7 4 2Fall injuries 142 87 55 159 94 65 156 96 61Fire injuries 16 10 6 23 13 10 28 13 14Firearm injuries - - - - - - < 1 < 1 -Homicide 163 134 29 134 107 27 139 116 23Hypothermia 3 3 - 4 3 1 8 6 3Motor-vehicle nontraffic crashes - - - - - - < 1 < 1 -Motor-vehicle traffic crashes 70 54 15 67 59 8 60 50 11Occupational and machine injuries 1 1 - - - - 1 1 -Other road vehicle crashes 5 4 < 1 5 5 < 1 5 4 1Poisoning (not alcohol) 385 297 89 407 320 88 401 307 94Suicide 120 82 38 129 92 36 128 94 34Suicide by and exposure to alcohol - - - - - - 1 1 -Water transport < 1 < 1 - < 1 < 1 - < 1 < 1 -Subtotal 988 732 255 1013 763 251 994 742 252
† Total may not equal sum of males and females due to rounding.‡ IUGR=Intrauterine growth restriction.
2018
* Generally, chronic causes of death are collected for people aged 20 years and older, and acute causes of death for people aged 15 years and older. However, there are several exceptions to this rule. See Technical Notes.
Total for All Causes2016 2017
Note: Alcohol prevalence data are provided by the Bureau of Epidemiology Services. The definition of alcohol consumption levels was changed in 2014. See Technical Notes: Deaths, Alcohol and Smoking Attributable Mortality. 2017 data were revised slightly due to a glitch fix in the CDC Alcohol Related Disease Impact (ARDI) website.

67
MORTALITY
Tabl
e M
15. S
mok
ing-
attr
ibut
able
Dea
ths
and
Age
-adj
uste
d D
eath
Rat
es, A
ge ≥
35
Year
s,
New
Yor
k C
ity, 2
015-
2018
Mal
eFe
mal
eTo
tal
Mal
eFe
mal
eTo
tal
Mal
eFe
mal
eTo
tal
Mal
eFe
mal
eTo
tal
Mal
eFe
mal
eTo
tal
Mal
eFe
mal
eTo
tal
Mal
eFe
mal
eTo
tal
Mal
eFe
mal
eTo
tal
Tota
l4,
657
3,39
08,
047
242.
912
7.3
176.
34,
125
3,16
57,
290
208.
911
6.7
156.
54,
734
3,36
38,
097
233.
011
6.7
165.
34,
585
3,41
47,
999
223.
711
8.8
163.
1
Cere
brov
ascu
lar d
iseas
e63
5712
13.
52.
22.
754
5510
92.
82.
02.
470
6213
23.
52.
12.
766
6813
43.
32.
32.
7
Chro
nic
obstr
uctiv
e pu
lmon
ary
dise
ase
(age
s ≥ 6
5)50
056
51,
065
29.6
21.3
24.5
424
529
953
24.1
19.6
21.4
494
593
1,08
826
.620
.522
.850
257
71,
079
26.3
19.8
22.4
Coro
nary
hea
rt di
seas
e1,
542
1,11
32,
655
80.3
42.4
59.0
1,32
21,
073
2,39
566
.840
.052
.21,
680
1,14
12,
821
83.2
39.9
58.2
1,61
41,
207
2,82
179
.542
.158
.2
Dia
bete
s mel
litus
6231
933.
11.
12.
054
3386
2.6
1.2
1.8
6332
952.
91.
11.
859
3190
2.7
1.1
1.7
Influ
enza
, pne
umon
ia, T
uber
culo
sis, a
nd C
OPD
(age
s 35-
64)
190
126
316
7.7
4.6
6.0
197
121
318
7.9
4.3
6.0
167
123
290
6.8
4.3
5.5
186
128
314
7.6
4.6
6.0
Influ
enza
, pne
umon
ia, a
nd tu
berc
ulos
is (a
ges ≥
65)
174
9326
710
.13.
56.
115
776
233
8.8
2.8
5.2
183
8326
69.
82.
95.
618
490
274
9.7
3.1
5.7
Lung
can
cer
1,17
792
52,
102
61.0
34.3
45.3
1,05
183
21,
883
53.2
30.3
39.8
1,06
585
71,
922
51.3
29.5
38.5
1,03
784
71,
884
49.5
29.4
37.7
Oth
er c
ance
rs61
625
987
531
.79.
518
.757
624
782
228
.78.
917
.266
926
393
232
.79.
018
.860
525
185
629
.48.
617
.3
Oth
er c
ardi
ovas
cula
r dise
ases
(age
s 35-
64)*
203
6827
18.
62.
75.
518
056
237
7.8
2.2
4.9
205
6426
98.
72.
45.
419
967
266
8.6
2.7
5.5
Oth
er h
eart
dise
ase
(age
s ≥ 6
5)†
7487
161
4.2
3.3
3.7
5177
128
2.8
2.9
2.9
7086
156
3.7
3.0
3.3
7082
152
3.7
2.8
3.2
O
ther
vas
cula
r dise
ases
(age
s ≥ 6
5)‡
5765
121
3.2
2.5
2.8
6066
125
3.2
2.4
2.8
7057
127
3.7
2.0
2.7
6366
129
3.3
2.3
2.7
2018
Dea
ths
Age-
adju
sted
Rate
s(p
er 1
00,0
00
Popu
latio
n)
2017
2015
2016
‡ O
ther
vas
cula
r dise
ases
are
com
prise
d of
ath
eros
cler
osis,
aor
tic a
neur
ysm
, and
oth
er a
rteria
l dise
ases
.
Age-
adju
sted
Rate
s(p
er 1
00,0
00
Popu
latio
n)D
eath
sD
eath
s
Age-
adju
sted
Rate
s(p
er 1
00,0
00
Popu
latio
n)
* O
ther
car
diov
ascu
lar d
iseas
es a
re c
ompr
ised
of o
ther
hea
rt di
seas
es, c
ereb
rova
scul
ar d
iseas
es, o
ther
vas
cula
r dise
ases
and
dia
bete
s mel
litus
.
Tota
l may
diff
er fr
om su
m o
f mal
e an
d fe
mal
e nu
mbe
rs du
e to
roun
ding
.
† O
ther
hea
rt di
seas
es a
re c
ompr
ised
of rh
eum
atic
hea
rt di
seas
e, p
ulm
onar
y he
art d
iseas
e, a
nd o
ther
form
s of h
eart
dise
ase.
Begi
nnin
g in
201
4, th
e ca
lcul
atio
n of
smok
ing-
attri
buta
ble
deat
hs u
ses t
he u
pdat
ed C
DC
met
hod.
As a
resu
lt, th
e nu
mbe
r of s
mok
ing-
attri
buta
ble
deat
hs a
re m
uch
high
er th
an in
prio
r yea
rs. S
ee T
echn
ical
Not
es: D
eath
s, Al
coho
l-and
Sm
okin
g-at
tribu
tabl
e M
orta
lity
for m
etho
dolo
gy.
Dea
ths
Age-
adju
sted
Rate
s(p
er 1
00,0
00
Popu
latio
n)
Not
e: S
mok
ing
prev
alen
ce ra
tes a
re fr
om th
e N
ew Y
ork
City
Com
mun
ity H
ealth
Sur
vey
and
calc
ulat
ed b
y th
e Bu
reau
of E
pide
mio
logy
Ser
vice
s, N
ew Y
ork
City
Dep
artm
ent o
f Hea
lth a
nd M
enta
l Hyg
iene
.
Dise
ase
Cate
gory
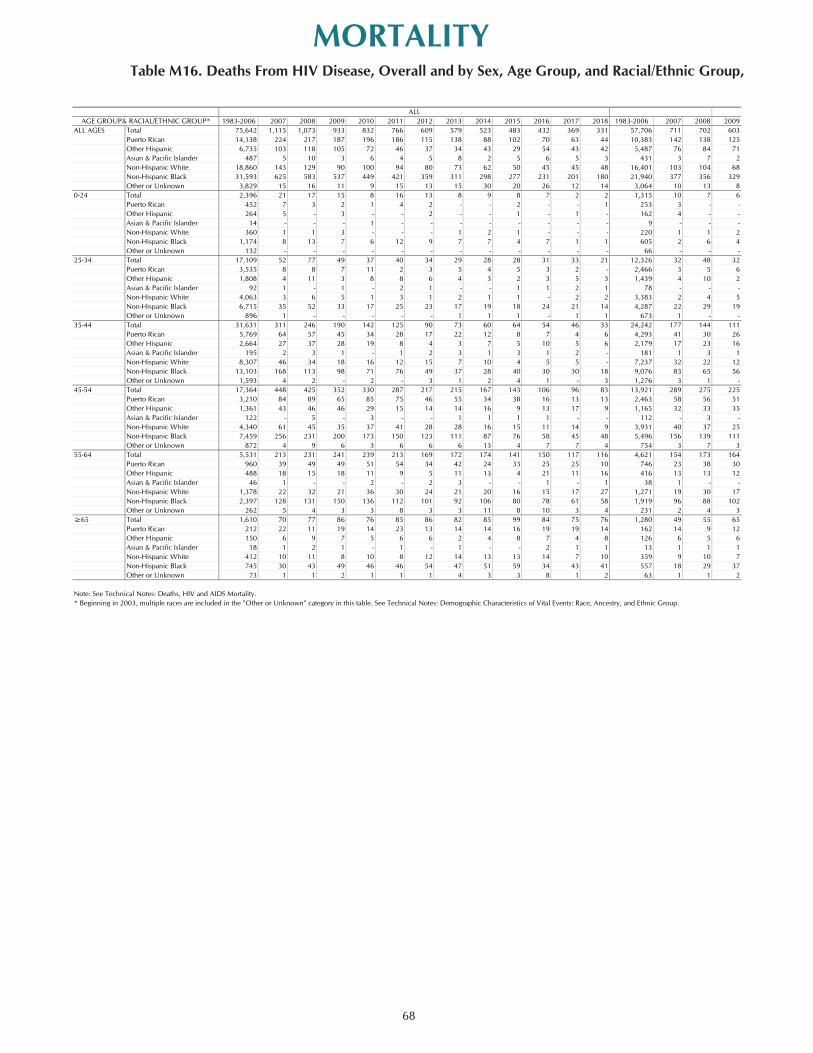
68
MORTALITYTable M16. Deaths From HIV Disease, Overall and by Sex, Age Group, and Racial/Ethnic Group, New York City, 1983-2018
1983-2006 2007 2008 2009 2010 2011 2012 2013 2014 2015 2016 2017 2018 1983-2006 2007 2008 2009ALL AGES Total 75,642 1,115 1,073 933 832 766 609 579 523 483 432 369 331 57,706 711 702 603
Puerto Rican 14,138 224 217 187 196 186 115 138 88 102 70 63 44 10,383 142 138 125 Other Hispanic 6,735 103 118 105 72 46 37 34 43 29 54 43 42 5,487 76 84 71 Asian & Pacific Islander 487 5 10 3 6 4 5 8 2 5 6 5 3 431 3 7 2 Non-Hispanic White 18,860 143 129 90 100 94 80 73 62 50 45 45 48 16,401 103 104 68 Non-Hispanic Black 31,593 625 583 537 449 421 359 311 298 277 231 201 180 21,940 377 356 329 Other or Unknown 3,829 15 16 11 9 15 13 15 30 20 26 12 14 3,064 10 13 8
0-24 Total 2,396 21 17 15 8 16 13 8 9 8 7 2 2 1,315 10 7 6Puerto Rican 452 7 3 2 1 4 2 - - 2 - - 1 253 3 - -Other Hispanic 264 5 - 3 - - 2 - - 1 - 1 - 162 4 - -Asian & Pacific Islander 14 - - - 1 - - - - - - - - 9 - - -Non-Hispanic White 360 1 1 3 - - - 1 2 1 - - - 220 1 1 2Non-Hispanic Black 1,174 8 13 7 6 12 9 7 7 4 7 1 1 605 2 6 4Other or Unknown 132 - - - - - - - - - - - - 66 - - -
25-34 Total 17,109 52 77 49 37 40 34 29 28 28 31 33 21 12,326 32 48 32Puerto Rican 3,535 8 8 7 11 2 3 5 4 5 3 2 - 2,466 3 5 6 Other Hispanic 1,808 4 11 3 8 8 6 4 3 2 3 5 3 1,439 4 10 2 Asian & Pacific Islander 92 1 - 1 - 2 1 - - 1 1 2 1 78 - - -Non-Hispanic White 4,063 3 6 5 1 3 1 2 1 1 - 2 2 3,383 2 4 5 Non-Hispanic Black 6,715 35 52 33 17 25 23 17 19 18 24 21 14 4,287 22 29 19 Other or Unknown 896 1 - - - - - 1 1 1 - 1 1 673 1 - -
35-44 Total 31,631 311 246 190 142 125 90 73 60 64 54 46 33 24,242 177 144 111 Puerto Rican 5,769 64 57 45 34 28 17 22 12 8 7 4 6 4,293 41 30 26 Other Hispanic 2,664 27 37 28 19 8 4 3 7 5 10 5 6 2,179 17 23 16 Asian & Pacific Islander 195 2 3 1 - 1 2 3 1 3 1 2 - 181 1 3 1 Non-Hispanic White 8,307 46 34 18 16 12 15 7 10 4 5 5 - 7,237 32 22 12 Non-Hispanic Black 13,103 168 113 98 71 76 49 37 28 40 30 30 18 9,076 83 65 56 Other or Unknown 1,593 4 2 - 2 - 3 1 2 4 1 - 3 1,276 3 1 -
45-54 Total 17,364 448 425 352 330 287 217 215 167 143 106 96 83 13,921 289 275 225 Puerto Rican 3,210 84 89 65 85 75 46 55 34 38 16 13 13 2,463 58 56 51 Other Hispanic 1,361 43 46 46 29 15 14 14 16 9 13 17 9 1,165 32 33 35 Asian & Pacific Islander 122 - 5 - 3 - - 1 1 1 1 - - 112 - 3 -Non-Hispanic White 4,340 61 45 35 37 41 28 28 16 15 11 14 9 3,931 40 37 25 Non-Hispanic Black 7,459 256 231 200 173 150 123 111 87 76 58 45 48 5,496 156 139 111 Other or Unknown 872 4 9 6 3 6 6 6 13 4 7 7 4 754 3 7 3
55-64 Total 5,531 213 231 241 239 213 169 172 174 141 150 117 116 4,621 154 173 164 Puerto Rican 960 39 49 49 51 54 34 42 24 33 25 25 10 746 23 38 30 Other Hispanic 488 18 15 18 11 9 5 11 13 4 21 11 16 416 13 13 12 Asian & Pacific Islander 46 1 - - 2 - 2 3 - - 1 - 1 38 1 - -Non-Hispanic White 1,378 22 32 21 36 30 24 21 20 16 15 17 27 1,271 19 30 17 Non-Hispanic Black 2,397 128 131 150 136 112 101 92 106 80 78 61 58 1,919 96 88 102 Other or Unknown 262 5 4 3 3 8 3 3 11 8 10 3 4 231 2 4 3
≥65 Total 1,610 70 77 86 76 85 86 82 85 99 84 75 76 1,280 49 55 65 Puerto Rican 212 22 11 19 14 23 13 14 14 16 19 19 14 162 14 9 12 Other Hispanic 150 6 9 7 5 6 6 2 4 8 7 4 8 126 6 5 6 Asian & Pacific Islander 18 1 2 1 - 1 - 1 - - 2 1 1 13 1 1 1 Non-Hispanic White 412 10 11 8 10 8 12 14 13 13 14 7 10 359 9 10 7 Non-Hispanic Black 745 30 43 49 46 46 54 47 51 59 34 43 41 557 18 29 37 Other or Unknown 73 1 1 2 1 1 1 4 3 3 8 1 2 63 1 1 2
Note: See Technical Notes: Deaths, HIV and AIDS Mortality.* Beginning in 2003, multiple races are included in the "Other or Unknown" category in this table. See Technical Notes: Demographic Characteristics of Vital Events: Race, Ancestry, and Ethnic Group.
ALLAGE GROUP& RACIAL/ETHNIC GROUP*

69
MORTALITYTable M16. Deaths From HIV Disease, Overall and by Sex, Age Group, and Racial/Ethnic Group, New York City, 1983-2018
2010 2011 2012 2013 2014 2015 2016 2017 2018 1983-2006 2007 2008 2009 2010 2011 2012 2013 2014 2015 2016 2017 2018574 528 402 398 359 332 296 249 230 17,936 404 371 330 258 238 207 181 164 151 136 120 101
135 123 75 94 56 68 50 44 31 3,755 82 79 62 61 63 40 44 32 34 20 19 13 54 39 28 28 36 19 44 34 30 1,248 27 34 34 18 7 9 6 7 10 10 9 12 3 2 4 5 1 3 6 4 3 56 2 3 1 3 2 1 3 1 2 - 1 - 76 75 63 53 50 40 36 34 33 2,459 40 25 22 24 19 17 20 12 10 9 11 15 297 277 223 204 196 185 140 124 122 9,653 248 227 208 152 144 136 107 102 92 91 77 58 9 12 9 14 20 17 20 9 11 765 5 3 3 - 3 4 1 10 3 6 3 3
4 13 6 6 7 5 2 1 2 1,081 11 10 9 4 3 7 2 2 3 5 1 - - 2 - - - 2 - - 1 199 4 3 2 1 2 2 - - - - - -- - 1 - - - - 1 - 102 1 - 3 - - 1 - - 1 - - -
1 - - - - - - - - 5 - - - - - - - - - - - -- - - - 2 1 - - - 140 - - 1 - - - 1 - - - - -
3 11 5 6 5 2 2 - 1 569 6 7 3 3 1 4 1 2 2 5 1 - - - - - - - - - - 66 - - - - - - - - - - - -
27 29 24 27 17 21 24 22 15 4,783 20 29 17 10 11 10 2 11 7 7 11 6 7 2 2 5 - 2 2 1 - 1,069 5 3 1 4 - 1 - 4 3 1 1 - 6 7 5 4 3 2 3 4 2 369 - 1 1 2 1 1 - - - - 1 1
- 1 1 - - 1 1 2 1 14 1 - 1 - 1 - - - - - - - 1 2 1 1 1 1 - 1 2 680 1 2 - - 1 - 1 - - - 1 - 13 17 15 16 12 14 18 14 9 2,428 13 23 14 4 8 8 1 7 4 6 7 5
- - - 1 1 1 - - 1 223 - - - - - - - - - - 1 - 94 77 54 45 33 32 31 29 19 7,389 134 102 79 48 48 36 28 27 32 23 17 14 20 17 10 10 4 6 6 3 4 1,476 23 27 19 14 11 7 12 8 2 1 1 2 14 8 1 3 5 2 8 4 4 485 10 14 12 5 - 3 - 2 3 2 1 2
- - 1 1 - 1 1 2 - 14 1 - - - 1 1 2 1 2 - - - 11 10 13 3 7 1 4 5 - 1,070 14 12 6 5 2 2 4 3 3 1 - - 47 42 28 27 16 20 12 15 9 4,027 85 48 42 24 34 21 10 12 20 18 15 9 2 - 1 1 1 2 - - 2 317 1 1 - - - 2 - 1 2 1 - 1 219 183 136 140 115 97 63 62 52 3,443 159 150 127 111 104 81 75 52 46 43 34 31 62 43 29 38 22 25 10 9 5 747 26 33 14 23 32 17 17 12 13 6 4 8 20 12 12 10 13 7 11 13 7 196 11 13 11 9 3 2 4 3 2 2 4 2 1 - - 1 1 1 1 - - 10 - 2 - 2 - - - - - - - - 28 30 22 20 13 11 8 11 7 409 21 8 10 9 11 6 8 3 4 3 3 2 105 95 69 65 55 50 28 24 30 1,963 100 92 89 68 55 54 46 32 26 30 21 18 3 3 4 6 11 3 5 5 3 118 1 2 3 - 3 2 - 2 1 2 2 1 179 159 120 118 130 103 109 84 88 910 59 58 77 60 54 49 54 44 38 41 33 28 38 41 25 33 21 20 19 19 9 214 16 11 19 13 13 9 9 3 13 6 6 1 10 7 4 10 11 1 16 8 13 72 5 2 6 1 2 1 1 2 3 5 3 3 1 - 2 2 - - 1 - 1 8 - - - 1 - - 1 - - - - - 28 25 19 16 18 15 12 12 17 107 3 2 4 8 5 5 5 2 1 3 5 10 99 78 67 54 75 59 54 42 44 478 32 43 48 37 34 34 38 31 21 24 19 14 3 8 3 3 5 8 7 3 4 31 3 - - - - - - 6 - 3 - - 51 67 62 62 57 74 67 51 54 330 21 22 21 25 18 24 20 28 25 17 24 22 8 18 9 8 9 13 13 12 12 50 8 2 7 6 5 4 6 5 3 6 7 2 4 5 5 1 4 7 6 4 4 24 - 4 1 1 1 1 1 - 1 1 - 4
- 1 - 1 - - 2 - 1 5 - 1 - - - - - - - - 1 - 8 8 8 13 9 11 12 5 7 53 1 1 1 2 - 4 1 4 2 2 2 3 30 34 39 36 33 40 26 29 29 188 12 14 12 16 12 15 11 18 19 8 14 12 1 1 1 3 2 3 8 1 1 10 - - - - - - 1 1 - - - 1
FEMALEMALE

70
MORTALITY
Table M17. Selected Characteristics of Deaths Due to Fatal Occupational Injuries, New York City, 2018*
Violence and other injuries by
persons or animals
Transportation incidents
Fires and explosions
Falls, slips, trips
Exposure to harmful substances
or environments
Contact with objects and equipment
Total 73 11 12 17 12 19Selected IndustriesGovernment§ (Federal, State, Local) 10 5Private industry§ 63 10 11 12 11 19
Goods producing 26 7 4 12Construction & Manufacturing 22 7 3 11
Service providing 37 9 9 5 7 7Trade, transportation, and utilities 17 4 7 4Financial activitiesProfessional and business services 6Educational and health services 5Leisure and hospitality 4 3Other services, except public adminstration
SexFemale 9 5Male 64 9 12 12 12 18Race or ethnic origin||Non-Hispanic White 21 6 4 4 3 3Non-Hispanic Black 13 5 4Hispanic 25 5 3 4 3 10Asian 11 3 4 3Age Group<25 years25-34 years 14 4 3 335-44 years 8 445-54 years 18 4 4 3 555-64 years 16 3 4 3 3>65 years 14 5 5*Source: Bureau of Labor Statistics: Fatal Occupational Injuries in New York City https://www.bls.gov/iif/oshwc/cfoi/tgs/2018/iiffw68.htm
||Persons identified as Hispanic or Latino may be of any race. The race categories shown exclude data for Hispanic and Latino workers.
Selected event or exposure†‡
All Deaths
†Based on the BLS Occupational Injury and Illness Classification System (OIICS) 2.01 implemented for 2011 data forward.
§Includes all fatal occupational injuries meeting this ownership criterion across all specific years, regardless of industry classification system.
‡Totals for major categories may include subcategories not shown separately. Blank cells indicate no data reported, or data that do not meet publication criteria. CFOI fatality counts exclude illness-related deaths unless precipitated by an injury event.
Characteristics
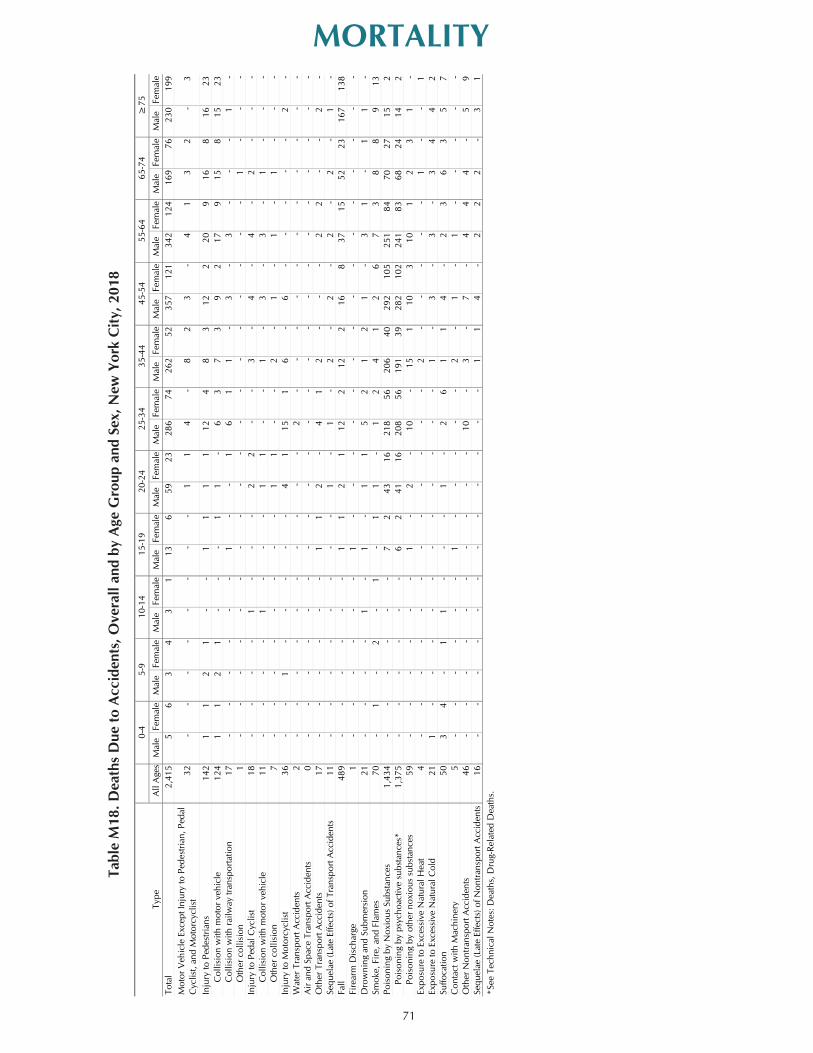
71
MORTALITY
Tabl
e M
18. D
eath
s D
ue to
Acc
iden
ts, O
vera
ll an
d by
Age
Gro
up a
nd S
ex, N
ew Y
ork
City
, 201
8
Ty
pe A
ll A
ges
Mal
eFe
mal
eM
ale
Fem
ale
Mal
eFe
mal
eM
ale
Fem
ale
Mal
eFe
mal
eM
ale
Fem
ale
Mal
eFe
mal
eM
ale
Fem
ale
Mal
eFe
mal
eM
ale
Fem
ale
Mal
eFe
mal
eTo
tal
2,41
55
63
43
113
659
2328
674
262
5235
712
134
212
416
976
230
199
Mot
or V
ehic
le E
xcep
t Inj
ury
to P
edes
tria
n, P
edal
C
yclis
t, an
d M
otor
cycl
ist
32-
--
--
--
-1
14
-8
23
-4
13
2-
3
Inju
ry to
Ped
estr
ians
142
11
21
--
11
11
124
83
122
209
168
1623
C
ollis
ion
with
mot
or v
ehic
le12
41
12
1-
--
11
-6
37
39
217
915
815
23
Col
lisio
n w
ith r
ailw
ay tr
ansp
orta
tion
17-
--
--
-1
--
16
11
-3
-3
--
-1
-
Oth
er c
ollis
ion
1-
--
--
--
--
--
--
--
--
-1
--
-In
jury
to P
edal
Cyc
list
18-
--
-1
--
-2
2-
-3
-4
-4
-2
--
-
Col
lisio
n w
ith m
otor
veh
icle
11-
--
-1
--
-1
1-
-1
-3
-3
-1
--
-
Oth
er c
ollis
ion
7-
--
--
--
-1
1-
-2
-1
-1
-1
--
-In
jury
to M
otor
cycl
ist
36-
-1
--
--
-4
115
16
-6
--
--
-2
-W
ater
Tra
nspo
rt A
ccid
ents
2-
--
--
--
--
-2
--
--
--
--
--
-A
ir an
d Sp
ace
Tran
spor
t Acc
iden
ts0
--
--
--
--
--
--
--
--
--
--
--
Oth
er T
rans
port
Acc
iden
ts17
--
--
--
11
2-
41
2-
--
22
--
2-
Sequ
elae
(Lat
e Ef
fect
s) o
f Tra
nspo
rt A
ccid
ents
11-
--
--
--
-1
-1
-2
-2
-2
-2
-1
-Fa
ll48
9-
--
--
-1
12
112
212
216
837
1552
2316
713
8Fi
rear
m D
isch
arge
1-
--
--
-1
--
--
--
--
--
--
--
-D
row
ning
and
Sub
mer
sion
21-
--
-1
-1
-1
15
21
21
-3
1-
11
-Sm
oke,
Fir
e, a
nd F
lam
es
70-
1-
2-
1-
11
-1
24
12
67
38
89
13Po
ison
ing
by N
oxio
us S
ubst
ance
s1,
434
--
--
--
72
4316
218
5620
640
292
105
251
8470
2715
2
Poi
soni
ng b
y ps
ycho
activ
e su
bsta
nces
*1,
375
--
--
--
62
4116
208
5619
139
282
102
241
8368
2414
2
Poi
soni
ng b
y ot
her
noxi
ous
subs
tanc
es59
--
--
--
1-
2-
10-
151
103
101
23
1-
Expo
sure
to E
xces
sive
Nat
ural
Hea
t4
--
--
--
--
--
--
2-
--
--
1-
-1
Expo
sure
to E
xces
sive
Nat
ural
Col
d21
1-
--
--
--
--
--
1-
3-
3-
34
42
Suffo
catio
n50
34
-1
1-
--
1-
26
11
4-
23
63
57
Con
tact
with
Mac
hine
ry5
--
--
--
1-
--
--
2-
1-
1-
--
--
Oth
er N
ontr
ansp
ort A
ccid
ents
46-
--
--
--
--
-10
-3
-7
-4
44
-5
9Se
quel
ae (L
ate
Effe
cts)
of N
ontr
ansp
ort A
ccid
ents
16-
--
--
--
--
--
-1
14
-2
22
-3
1*S
ee T
echn
ical
Not
es: D
eath
s, D
rug-
Rela
ted
Dea
ths.
0-4
5-9
10-1
415
-19
20-2
425
-34
35-4
445
-54
55-6
465
-74
≥75
49
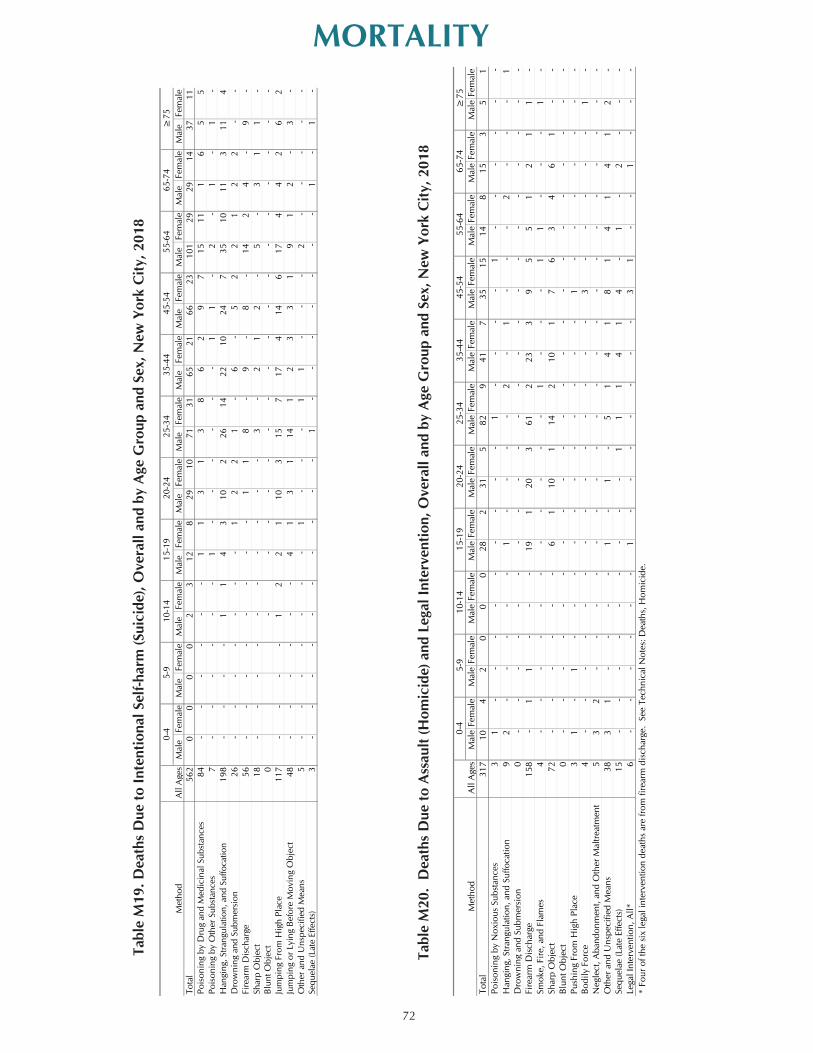
72
MORTALITY
Tabl
e M
19. D
eath
s D
ue to
Inte
ntio
nal S
elf-h
arm
(Sui
cide
), O
vera
ll an
d by
Age
Gro
up a
nd S
ex, N
ew Y
ork
City
, 201
8
Tabl
e M
20.
Dea
ths
Due
to A
ssau
lt (H
omic
ide)
and
Leg
al In
terv
entio
n, O
vera
ll an
d by
Age
Gro
up a
nd S
ex, N
ew Y
ork
City
, 201
8
M
etho
d A
ll A
ges
Mal
eFe
mal
eM
ale
Fem
ale
Mal
eFe
mal
eM
ale
Fem
ale
Mal
eFe
mal
eM
ale
Fem
ale
Mal
eFe
mal
eM
ale
Fem
ale
Mal
eFe
mal
eM
ale
Fem
ale
Mal
eFe
mal
eTo
tal
562
00
00
23
128
2910
7131
6521
6623
101
2929
1437
11Po
ison
ing
by D
rug
and
Med
icin
al S
ubst
ance
s84
--
--
--
11
31
38
62
97
1511
16
55
Pois
onin
g by
Oth
er S
ubst
ance
s7
--
--
--
1-
--
--
-1
1-
2-
1-
1-
Han
ging
, Str
angu
latio
n, a
nd S
uffo
catio
n19
8-
--
-1
14
310
226
1422
1024
735
1011
311
4D
row
ning
and
Sub
mer
sion
26-
--
--
--
12
21
-6
-5
22
12
2-
-Fi
rear
m D
isch
arge
56-
--
--
--
-1
18
-9
-8
-14
24
-9
-Sh
arp
Obj
ect
18-
--
--
--
--
-3
-2
12
-5
-3
11
-Bl
unt O
bjec
t0
--
--
--
--
--
--
--
--
-Ju
mpi
ng F
rom
Hig
h Pl
ace
117
--
--
12
21
103
157
174
146
174
42
62
Jum
ping
or
Lyin
g Be
fore
Mov
ing
Obj
ect
48-
--
--
-4
13
114
12
33
19
12
-3
-O
ther
and
Uns
peci
fied
Mea
ns5
--
--
--
-1
--
-1
1-
--
2-
--
--
Sequ
elae
(Lat
e Ef
fect
s)3
--
--
--
--
--
1-
--
--
--
1-
1-
20-2
425
-34
0-4
5-9
10-1
415
-19
35-4
445
-54
55-6
465
-74
≥75
50
5-9
10-1
415
-19
20-2
425
-34
35-4
445
-54
55-6
465
-74
≥75
Met
hod
All
Age
sM
ale
Fem
ale
Mal
eFe
mal
eM
ale
Fem
ale
Mal
eFe
mal
eM
ale
Fem
ale
Mal
eFe
mal
eM
ale
Fem
ale
Mal
eFe
mal
eM
ale
Fem
ale
Mal
eFe
mal
eM
ale
Fem
ale
Tota
l31
710
42
00
028
231
582
941
735
1514
815
35
1Po
ison
ing
by N
oxio
us S
ubst
ance
s3
1-
--
--
--
--
1-
--
-1
--
--
--
Han
ging
, Str
angu
latio
n, a
nd S
uffo
catio
n9
2-
--
--
1-
--
-2
-1
--
-2
--
-1
Dro
wni
ng a
nd S
ubm
ersi
on0
--
--
--
--
--
--
--
--
--
--
--
Fire
arm
Dis
char
ge15
8-
11
--
-19
120
361
223
39
55
12
11
-Sm
oke,
Fir
e, a
nd F
lam
es4
--
--
--
--
--
-1
--
-1
1-
--
1-
Shar
p O
bjec
t72
--
--
--
61
101
142
101
76
34
61
--
Blun
t Obj
ect
0-
--
--
--
--
--
--
--
--
--
--
-Pu
shin
g Fr
om H
igh
Plac
e3
1-
1-
--
--
--
--
--
1-
--
--
--
Bodi
ly F
orce
4-
--
--
--
--
--
--
-3
--
--
-1
-N
egle
ct, A
band
onm
ent,
and
Oth
er M
altr
eatm
ent
53
2-
--
--
--
--
--
--
--
--
--
-O
ther
and
Uns
peci
fied
Mea
ns38
31
--
--
1-
1-
51
41
81
41
41
2-
Sequ
elae
(Lat
e Ef
fect
s)15
--
--
--
--
-1
11
41
4-
1-
2-
--
Lega
l Int
erve
ntio
n, A
ll*6
--
--
--
1-
--
--
--
31
--
1-
--
* Fo
ur o
f the
six
lega
l int
erve
ntio
n de
aths
are
from
fire
arm
dis
char
ge.
See
Tech
nica
l Not
es: D
eath
s, H
omic
ide.
0-4
50

73
MORTALITYTa
ble
M21
. Dea
ths
Due
to E
vent
s of
Und
eter
min
ed In
tent
, Ove
rall
and
by A
ge G
roup
and
Sex
, New
Yor
k C
ity, 2
018
Tabl
e M
22. D
eath
s Due
to C
ompl
icat
ions
of M
edic
al a
nd S
urgi
cal C
are,
Ove
rall
and
by A
ge G
roup
and
Sex
, New
Yor
k C
ity, 2
018
Tabl
e M
23. D
eath
s D
ue to
Fir
earm
s (A
ll C
ause
s), O
vera
ll an
d by
Age
Gro
up a
nd S
ex, N
ew Y
ork
City
, 201
8
Met
hod
All
Age
sM
ale
Fem
ale
Mal
eFe
mal
eM
ale
Fem
ale
Mal
eFe
mal
eM
ale
Fem
ale
Mal
eFe
mal
eM
ale
Fem
ale
Mal
eFe
mal
eM
ale
Fem
ale
Mal
eFe
mal
eM
ale
Fem
ale
Tota
l29
627
140
01
04
06
530
1135
1128
1043
1719
915
11Po
ison
ing
by N
oxio
us S
ubst
ance
s28
--
--
--
--
11
24
41
13
43
-1
21
Han
ging
, Str
angu
latio
n, a
nd S
uffo
catio
n2
--
--
--
--
1-
--
--
--
--
1-
--
Dro
wni
ng a
nd S
ubm
ersi
on12
1-
--
--
1-
2-
21
3-
1-
1-
--
--
Fire
arm
Dis
char
ge
0-
--
--
--
--
--
--
--
--
--
--
-Sm
oke,
Fir
e, a
nd F
lam
es4
--
--
1-
--
--
--
2-
--
1-
--
--
Shar
p or
Blu
nt O
bjec
t1
--
--
--
--
--
--
--
--
1-
--
--
Falli
ng F
rom
Hig
h Pl
ace
16-
--
--
-1
--
12
14
--
14
1-
1-
-O
ther
and
Uns
peci
fied
Mea
ns22
826
14-
--
-2
-2
324
522
1026
630
1317
711
10Se
quel
ae (L
ate
Effe
cts)
5-
--
--
--
--
--
--
--
-2
-1
-2
-
45-5
4≥
7565
-74
55-6
40-
435
-44
25-3
420
-24
15-1
910
-14
5-9
51
Met
hod
All
Age
sM
ale
Fem
ale
Mal
eFe
mal
eM
ale
Fem
ale
Mal
eFe
mal
eM
ale
Fem
ale
Mal
eFe
mal
eM
ale
Fem
ale
Mal
eFe
mal
eM
ale
Fem
ale
Mal
eFe
mal
eM
ale
Fem
ale
Tota
l37
10
00
00
10
10
01
31
31
23
34
67
Adv
erse
Effe
cts
From
Dru
gs, M
edic
amen
ts,
and
Biol
ogic
al S
ubst
ance
s fo
r Th
erap
eutic
U
se7
--
--
--
1-
--
-1
1-
2-
--
--
-2
Med
ical
Mis
adve
ntur
es to
Pat
ient
s D
urin
g Su
rgic
al a
nd M
edic
al C
are
2-
--
--
--
--
--
--
--
--
--
11
-
Adv
erse
Effe
cts
from
Med
ical
Dev
ices
for
Ther
apeu
tic U
se0
--
--
--
--
--
--
--
--
--
--
--
Oth
er a
nd U
nspe
cifie
d M
eans
281
--
--
--
-1
--
-2
11
12
33
35
5
Sequ
elae
(Lat
e Ef
fect
s)0
--
--
--
--
--
--
--
--
--
--
--
0-4
5-9
10-1
415
-19
20-2
425
-34
35-4
445
-54
55-6
465
-74
≥75
51
Met
hod
All
Age
sM
ale
Fem
ale
Mal
eFe
mal
eM
ale
Fem
ale
Mal
eFe
mal
eM
ale
Fem
ale
Mal
eFe
mal
eM
ale
Fem
ale
Mal
eFe
mal
eM
ale
Fem
ale
Mal
eFe
mal
eM
ale
Fem
ale
Fire
arm
s (A
ll C
ause
s)21
9-
11
--
-21
121
469
232
319
619
36
110
-
0-4
5-9
10-1
415
-19
20-2
425
-34
35-4
445
-54
55-6
465
-74
≥75
51

74
MORTALITYTable M24. Life Expectancy at Specified Ages, Overall and by Sex and Racial/Ethnic Group,
New York City, 1999-2001 and 2009-2011*
0 77.6 79.7 77.7 73.2 80.8 81.9 81.2 76.91 77.1 79.0 77.3 73.0 80.2 81.2 80.5 76.65 73.2 75.0 73.4 59.0 76.2 77.3 76.5 72.710 65.2 70.0 68.5 64.2 71.3 72.3 71.5 67.815 63.3 65.1 63.6 59.3 66.3 67.4 66.6 62.820 58.4 60.2 58.7 54.5 61.5 62.5 61.7 58.025 53.6 55.4 53.9 49.9 56.6 57.6 56.8 53.330 48.8 50.5 49.0 45.2 51.8 52.8 51.9 48.635 44.1 45.8 44.3 40.7 47.0 48.0 47.0 43.940 39.5 41.2 39.6 36.3 42.2 43.2 42.2 39.345 35.0 36.7 35.1 32.1 37.6 38.6 37.5 34.950 30.7 32.4 30.7 28.2 33.1 34.1 33.0 30.755 26.6 28.2 26.5 24.4 28.8 29.8 28.7 26.660 22.6 24.1 22.4 20.8 24.7 25.6 24.5 22.965 18.8 20.2 18.6 17.5 20.7 21.6 20.5 19.370 15.3 16.7 15.1 14.5 17.0 17.8 16.7 16.075 12.1 13.3 11.8 11.3 13.4 14.3 13.1 12.980 9.2 10.4 8.9 9.3 10.3 11.0 10.0 10.185 6.7 7.7 6.4 7.1 7.5 8.1 7.1 7.6
0 74.5 76.1 74.9 69.1 78.1 78.6 78.8 73.31 74.0 75.4 74.5 69.0 77.5 77.9 78.1 73.05 70.1 71.4 70.6 65.1 73.5 74.0 74.1 69.110 65.2 66.5 65.7 60.2 68.6 69.0 69.2 64.215 60.2 61.5 60.8 55.3 63.6 64.1 64.2 59.220 55.4 56.6 55.9 50.6 58.8 59.2 59.4 54.525 50.7 51.9 51.2 46.1 54.0 54.4 54.6 49.930 46.0 47.1 46.4 41.6 49.2 49.6 49.7 45.435 41.3 42.5 41.7 37.2 44.5 44.9 44.9 40.840 36.8 37.9 37.1 32.9 39.8 40.2 40.1 36.345 32.4 33.6 32.7 28.8 35.2 35.7 35.4 32.050 28.3 29.5 28.5 25.2 30.8 31.3 31.0 27.955 24.4 25.6 24.4 21.8 26.7 27.2 26.8 24.060 20.6 21.8 20.5 18.4 22.7 23.2 22.8 20.565 17.0 18.2 16.9 15.3 19.0 19.5 19.0 17.270 13.8 14.9 13.6 12.6 15.5 16.1 15.3 14.275 10.8 12.0 10.6 10.2 12.2 13.0 12.0 11.480 8.2 9.4 7.9 8.2 9.3 10.1 9.0 9.085 6.1 7.3 5.7 6.6 6.8 7.5 6.5 6.9
0 80.2 82.6 80.4 76.5 83.2 84.7 83.4 79.81 79.7 81.9 79.9 76.2 82.5 84.0 82.6 79.45 75.8 77.9 76.0 72.3 78.6 80.0 78.7 75.510 70.8 72.9 71.1 67.4 73.6 75.0 73.7 70.615 65.9 68.0 66.1 62.4 68.7 70.1 68.7 65.620 61.0 63.0 61.2 57.5 63.7 65.1 63.8 60.725 56.1 58.1 56.4 52.7 58.8 60.2 58.9 55.830 51.2 53.2 51.4 47.9 53.9 55.3 53.9 51.035 46.4 48.4 46.6 43.3 49.0 50.4 49.0 46.240 41.7 43.7 41.8 38.8 44.2 45.6 44.1 41.545 37.1 39.1 37.2 34.4 39.5 40.8 39.4 37.050 32.6 34.5 32.6 30.3 34.9 36.2 34.8 32.755 28.3 30.0 28.2 26.3 30.5 31.7 30.3 28.560 24.1 25.7 23.9 22.4 26.1 27.3 25.9 24.565 20.1 21.5 19.9 18.8 21.9 23.0 21.6 20.770 16.4 17.7 16.1 15.5 18.0 18.9 17.7 17.175 12.9 14.1 12.6 12.5 14.2 15.1 13.9 13.780 9.7 10.8 9.4 9.8 10.8 11.5 10.5 10.685 7.0 7.9 6.7 7.3 7.8 8.4 7.5 7.8
Note: Three-year average death data are used to estimate above decennial life expectancy to smooth the outcome. See Technical Notes: Life Expectancy.
* US Census population data for 2000 and 2010 are used to calculate 1999-2001 and 2009-2011 life expectancy, respectively. See Technical Notes: Population.
Non-Hispanic White
Non-Hispanic Black
Total Hispanic
Exact Age in Years
All1999-2001† 2009-2011
Total HispanicNon-Hispanic
WhiteNon-Hispanic
Black
1999-2001† 2009-2011
Total HispanicNon-Hispanic
White
Female
1999-2001† 2009-2011
Non-Hispanic Black
Total
Male
Exact Age in Years
† World Trade Center (WTC) disaster deaths are excluded. See Special Section in the 2002 Summary of Vital Statistics, Table WTC10, for the impact of WTC deaths on life expectancy in New York City.
Total Hispanic
Exact Age in Years
Non-Hispanic White
Non-Hispanic Black
Non-Hispanic White
Non-Hispanic Black
Non-Hispanic Black
Non-Hispanic White
HispanicTotalHispanic

75
MORTALITYTable M25. Life Expectancy at Specified Ages, Overall and by Sex, New York City, 2009-2018
2009 2010 2011 2012 2013 2014 2015 2016 2017 20180 80.6 80.9 80.9 81.1 81.1 81.3 81.2 81.2 81.2 81.31 80.0 80.3 80.3 80.5 80.4 80.6 80.5 80.5 80.6 80.65 76.1 76.3 76.3 76.5 76.5 76.6 76.6 76.5 76.6 76.610 71.1 71.4 71.4 71.6 71.5 71.7 71.6 71.6 71.7 71.715 66.2 66.4 66.4 66.6 66.6 66.8 66.7 66.6 66.7 66.720 61.3 61.6 61.5 61.7 61.6 61.8 61.7 61.7 61.8 61.825 56.4 56.7 56.7 56.9 56.8 57.0 56.9 56.8 56.9 56.930 51.6 51.9 51.9 52.0 51.9 52.1 52.1 52.0 52.1 52.135 46.8 47.1 47.1 47.2 47.1 47.3 47.3 47.2 47.3 47.340 42.0 42.3 42.3 42.5 42.4 42.6 42.5 42.5 42.6 42.545 37.4 37.6 37.6 37.8 37.7 37.9 37.8 37.8 37.9 37.950 33.0 33.1 33.2 33.3 33.1 33.3 33.2 33.2 33.3 33.355 28.7 28.8 28.8 28.9 28.8 28.9 28.9 28.9 28.9 28.860 24.6 24.7 24.7 24.7 24.6 24.7 24.6 24.7 24.6 24.665 20.6 20.8 20.7 20.7 20.6 20.7 20.6 20.6 20.6 20.570 16.9 17.0 17.0 17.0 16.9 17.0 16.9 17.0 16.9 16.875 13.4 13.5 13.4 13.5 13.4 13.6 13.5 13.6 13.6 13.480 10.2 10.3 10.3 10.4 10.4 10.5 10.5 10.6 10.6 10.685 7.5 7.5 7.4 7.5 7.4 7.5 7.4 7.6 7.6 7.5
2009 2010 2011 2012 2013 2014 2015 2016 2017 20180 77.8 78.1 78.2 78.4 78.3 78.5 78.6 78.5 78.5 78.61 77.3 77.5 77.6 77.8 77.7 77.9 77.9 77.8 77.9 77.95 73.3 73.6 73.6 73.9 73.8 74.0 74.0 73.8 73.9 74.010 68.4 68.6 68.7 68.9 68.8 69.0 69.0 68.9 69.0 69.015 63.4 63.6 63.8 64.0 63.9 64.1 64.1 63.9 64.0 64.120 58.6 58.8 58.9 59.1 59.0 59.2 59.2 59.0 59.1 59.225 53.8 54.1 54.2 54.3 54.2 54.4 54.4 54.2 54.3 54.430 49.1 49.3 49.4 49.6 49.4 49.6 49.6 49.4 49.6 49.635 44.3 44.5 44.6 44.8 44.6 44.9 44.9 44.7 44.9 44.940 39.6 39.8 39.9 40.1 39.9 40.2 40.2 40.1 40.3 40.245 35.0 35.2 35.3 35.5 35.3 35.5 35.5 35.5 35.6 35.650 30.7 30.8 30.9 31.1 30.9 31.1 31.0 31.0 31.1 31.155 26.6 26.7 26.7 26.9 26.6 26.8 26.8 26.7 26.8 26.860 22.6 22.7 22.8 22.8 22.6 22.8 22.7 22.7 22.7 22.765 18.9 19.0 19.1 19.1 18.8 19.0 18.8 18.8 18.8 18.870 15.4 15.5 15.5 15.6 15.4 15.6 15.5 15.5 15.4 15.375 12.2 12.2 12.3 12.3 12.2 12.4 12.2 12.3 12.3 12.280 9.3 9.3 9.4 9.4 9.4 9.5 9.5 9.6 9.5 9.585 6.8 6.8 6.8 6.8 6.7 6.7 6.7 6.7 6.8 6.7
2009 2010 2011 2012 2013 2014 2015 2016 2017 20180 83.0 83.3 83.2 83.4 83.4 83.6 83.5 83.5 83.6 83.61 82.3 82.7 82.6 82.7 82.7 82.9 82.8 82.8 83.0 82.85 78.4 78.7 78.6 78.8 78.8 79.0 78.8 78.9 79.0 78.910 73.4 73.8 73.7 73.8 73.8 74.0 73.9 73.9 74.0 73.915 68.5 68.8 68.7 68.9 68.9 69.0 68.9 68.9 69.1 69.020 63.5 63.9 63.8 63.9 63.9 64.1 63.9 64.0 64.1 64.025 58.6 58.9 58.9 59.0 59.0 59.2 59.0 59.1 59.2 59.130 53.7 54.0 53.9 54.1 54.1 54.3 54.1 54.2 54.3 54.235 48.8 49.1 49.1 49.2 49.2 49.4 49.3 49.3 49.4 49.340 44.0 44.3 44.2 44.4 44.4 44.6 44.5 44.5 44.6 44.545 39.3 39.6 39.5 39.6 39.6 39.8 39.7 39.8 39.8 39.750 34.8 35.0 34.9 35.0 35.0 35.1 35.1 35.1 35.1 35.055 30.4 30.5 30.5 30.5 30.5 30.6 30.5 30.6 30.6 30.560 26.0 26.2 26.1 26.2 26.1 26.2 26.2 26.2 26.1 26.065 21.9 22.0 21.9 22.0 21.9 22.0 21.9 22.0 21.9 21.770 17.9 18.1 18.0 18.0 18.0 18.0 17.9 18.0 17.9 17.875 14.2 14.4 14.2 14.3 14.3 14.3 14.3 14.5 14.4 14.280 10.8 10.9 10.8 11.0 11.0 11.1 11.1 11.2 11.3 11.285 7.8 7.8 7.7 7.8 7.8 7.9 7.8 8.0 8.0 8.0
Note: Population data from 2009 are interpolated based on 2000 and 2010 Census counts. Population data for 2011-2018 are extrapolated from the 2000 and 2010 US Census since the life tables are derived from a complete life table, which requires single year of age population data. See Technical Notes: Population.
Female
Male
Age in years
Age in years
Age in years
Total
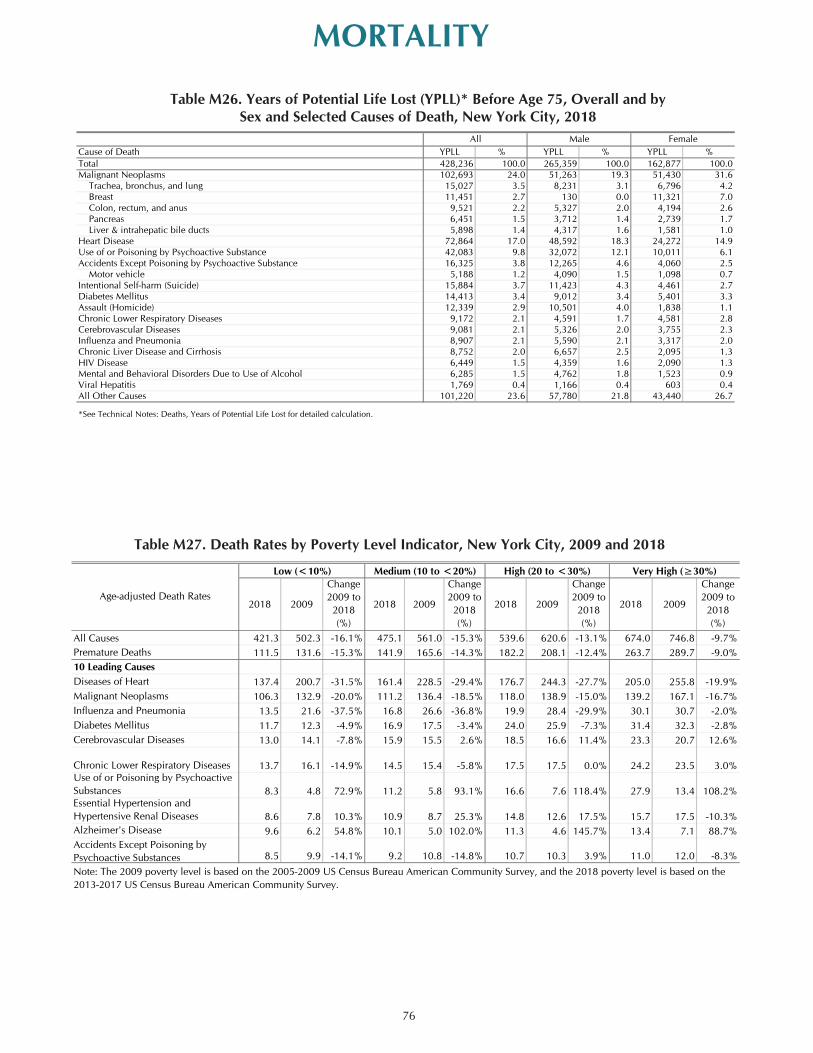
76
MORTALITY
Table M27. Death Rates by Poverty Level Indicator, New York City, 2009 and 2018
Cause of Death YPLL % YPLL % YPLL %Total 428,236 100.0 265,359 100.0 162,877 100.0Malignant Neoplasms 102,693 24.0 51,263 19.3 51,430 31.6 Trachea, bronchus, and lung 15,027 3.5 8,231 3.1 6,796 4.2 Breast 11,451 2.7 130 0.0 11,321 7.0 Colon, rectum, and anus 9,521 2.2 5,327 2.0 4,194 2.6 Pancreas 6,451 1.5 3,712 1.4 2,739 1.7 Liver & intrahepatic bile ducts 5,898 1.4 4,317 1.6 1,581 1.0Heart Disease 72,864 17.0 48,592 18.3 24,272 14.9Use of or Poisoning by Psychoactive Substance 42,083 9.8 32,072 12.1 10,011 6.1Accidents Except Poisoning by Psychoactive Substance 16,325 3.8 12,265 4.6 4,060 2.5 Motor vehicle 5,188 1.2 4,090 1.5 1,098 0.7Intentional Self-harm (Suicide) 15,884 3.7 11,423 4.3 4,461 2.7Diabetes Mellitus 14,413 3.4 9,012 3.4 5,401 3.3Assault (Homicide) 12,339 2.9 10,501 4.0 1,838 1.1Chronic Lower Respiratory Diseases 9,172 2.1 4,591 1.7 4,581 2.8Cerebrovascular Diseases 9,081 2.1 5,326 2.0 3,755 2.3Influenza and Pneumonia 8,907 2.1 5,590 2.1 3,317 2.0Chronic Liver Disease and Cirrhosis 8,752 2.0 6,657 2.5 2,095 1.3HIV Disease 6,449 1.5 4,359 1.6 2,090 1.3Mental and Behavioral Disorders Due to Use of Alcohol 6,285 1.5 4,762 1.8 1,523 0.9Viral Hepatitis 1,769 0.4 1,166 0.4 603 0.4All Other Causes 101,220 23.6 57,780 21.8 43,440 26.7
*See Technical Notes: Deaths, Years of Potential Life Lost for detailed calculation.
All Male Female
55
2018 2009
Change 2009 to
2018 (%)
2018 2009
Change 2009 to
2018 (%)
2018 2009
Change 2009 to
2018 (%)
2018 2009
Change 2009 to
2018 (%)
All Causes 421.3 502.3 -16.1% 475.1 561.0 -15.3% 539.6 620.6 -13.1% 674.0 746.8 -9.7%Premature Deaths 111.5 131.6 -15.3% 141.9 165.6 -14.3% 182.2 208.1 -12.4% 263.7 289.7 -9.0%10 Leading CausesDiseases of Heart 137.4 200.7 -31.5% 161.4 228.5 -29.4% 176.7 244.3 -27.7% 205.0 255.8 -19.9%Malignant Neoplasms 106.3 132.9 -20.0% 111.2 136.4 -18.5% 118.0 138.9 -15.0% 139.2 167.1 -16.7%Influenza and Pneumonia 13.5 21.6 -37.5% 16.8 26.6 -36.8% 19.9 28.4 -29.9% 30.1 30.7 -2.0%Diabetes Mellitus 11.7 12.3 -4.9% 16.9 17.5 -3.4% 24.0 25.9 -7.3% 31.4 32.3 -2.8%Cerebrovascular Diseases 13.0 14.1 -7.8% 15.9 15.5 2.6% 18.5 16.6 11.4% 23.3 20.7 12.6%
Chronic Lower Respiratory Diseases 13.7 16.1 -14.9% 14.5 15.4 -5.8% 17.5 17.5 0.0% 24.2 23.5 3.0%Use of or Poisoning by Psychoactive Substances 8.3 4.8 72.9% 11.2 5.8 93.1% 16.6 7.6 118.4% 27.9 13.4 108.2%Essential Hypertension and Hypertensive Renal Diseases 8.6 7.8 10.3% 10.9 8.7 25.3% 14.8 12.6 17.5% 15.7 17.5 -10.3%Alzheimer's Disease 9.6 6.2 54.8% 10.1 5.0 102.0% 11.3 4.6 145.7% 13.4 7.1 88.7%Accidents Except Poisoning by Psychoactive Substances 8.5 9.9 -14.1% 9.2 10.8 -14.8% 10.7 10.3 3.9% 11.0 12.0 -8.3%
Note: The 2009 poverty level is based on the 2005-2009 US Census Bureau American Community Survey, and the 2018 poverty level is based on the 2013-2017 US Census Bureau American Community Survey.
Age-adjusted Death Rates
Low (<10%) Medium (10 to <20%) High (20 to <30%) Very High (≥30%)
Table M26. Years of Potential Life Lost (YPLL)* Before Age 75, Overall and by Sex and Selected Causes of Death, New York City, 2018
77
MORTALITY
M28. Leading Causes of Death, New York City, 2009, 2017 and 2018
Cause RankCrude Death
Rate RankCrude Death
RateChange to 2018 (%) Rank
Crude Death Rate
Change to 2018 (%)
Diseases of Heart* 1 211.3 1 202.8 4.2% 1 239.4 -11.7%
Malignant Neoplasms 2 155.2 2 154.2 0.6% 2 157.1 -1.2%
Influenza and Pneumonia 3 23.9 3 22.6 5.8% 3 27.1 -12.0%
Diabetes Mellitus 4 23.4 4 20.9 12.0% 6 20.1 16.2%
Cerebrovascular Diseases 5 22.5 5 22.0 2.3% 4 17.3 30.4%
Chronic Lower Respiratory Diseases
6 21.2 6 20.5 3.4% 5 18.2 16.4%
Use of or Poisoning by Psychoactive Substance†
7 17.9 7 17.8 0.6% 10 8.3 115.2%
Essential Hypertension and Renal Diseases
8 15.1 8 14.1 7.1% 9 11.2 35.1%
Alzheimer's Disease 9 14.2 9 12.9 10.1% 16 6.2 129.2%
Accidents Except Drug Poisoning
10 12.4 10 12.2 1.6% 8 12.0 3.7%
†Appendix B Technical Notes: Drug-Related Deaths.
*See the 2010 Summary of Vital Statistics: Mortality – Special Section: Cause of Death Quality Improvement Initiative for information on the recent trends in cause of death reporting, particularly heart disease.
2018 2017 2009

78
INFANT MORTALITY
Table IM1. Infant Deaths by Cause, Sex, and Age, New York City, 2018
TotalNeonatal
(<28 Days)Post-
NeonatalNeonatal
(<28 Days)Post-
NeonatalTotal 446 164 103 114 65
1 HIV Infection (B20-B24)* - - - - -2 Diseases of the Circulatory System (I00-I99)* 12 1 7 1 33 Influenza and Pneumonia (J10-J18)* 7 - 7 - -4 Newborn Affected by Maternal Complications of Pregnancy (P01)* 17 11 - 5 15 Newborn Affected by Complications of Placenta, Cord, and Membranes (P02)* 10 6 1 2 16 Short Gestation and Low Birthweight (P07)* 73 39 3 29 27 Intrauterine Hypoxia and Birth Asphyxia (P20-P21)* 3 2 - 1 -8 Respiratory Distress of Newborn (P22)* 6 2 - 4 -9 Pulmonary Hemorrhage Originating in the Perinatal Period (P26)* 3 3 - - -
10 Atelectasis (P28.0-P28.1)* 1 - - 1 -11 Other Respiratory Conditions Originating in the Perinatal Period (P23-P28)† 5 1 2 1 112 Cardiovascular Disorders Originating in the Perinatal Period (P29)† 53 31 1 21 -13 Infections Specific to the Perinatal Period (P35-P39)† 15 8 1 6 -
Bacterial sepsis of newborn (P36) 12 6 - 6 -14 Neonatal Hemorrhage (P50-P52, P54)* 4 3 - 1 -15 Necrotizing Enterocolitis of Newborn (P77)* 4 2 - 1 116 Remainder of Conditions Originating in the Perinatal Period (Rest of P00-P99) 18 11 1 6 -17 Congenital Malformations, Deformations (Q00-Q99)* 98 37 14 26 21
Congenital malformations of heart (Q20-Q24) 33 8 9 6 1018 Sudden Infant Death Syndrome (R95)* 5 1 3 1 -19 All Other Diseases (Rest of A00-R99) 55 3 28 4 2020 External Causes (V01-Y89)† 57 3 35 4 15
*Causes are used to rank leading causes nationally and in New York City.†Contains causes not eligible to be ranked as a leading cause nationally, but are frequent in New York City. Including these groups permits recognition of important causes of infant death.
FemaleMale
Cause of Death (ICD-10 Codes)
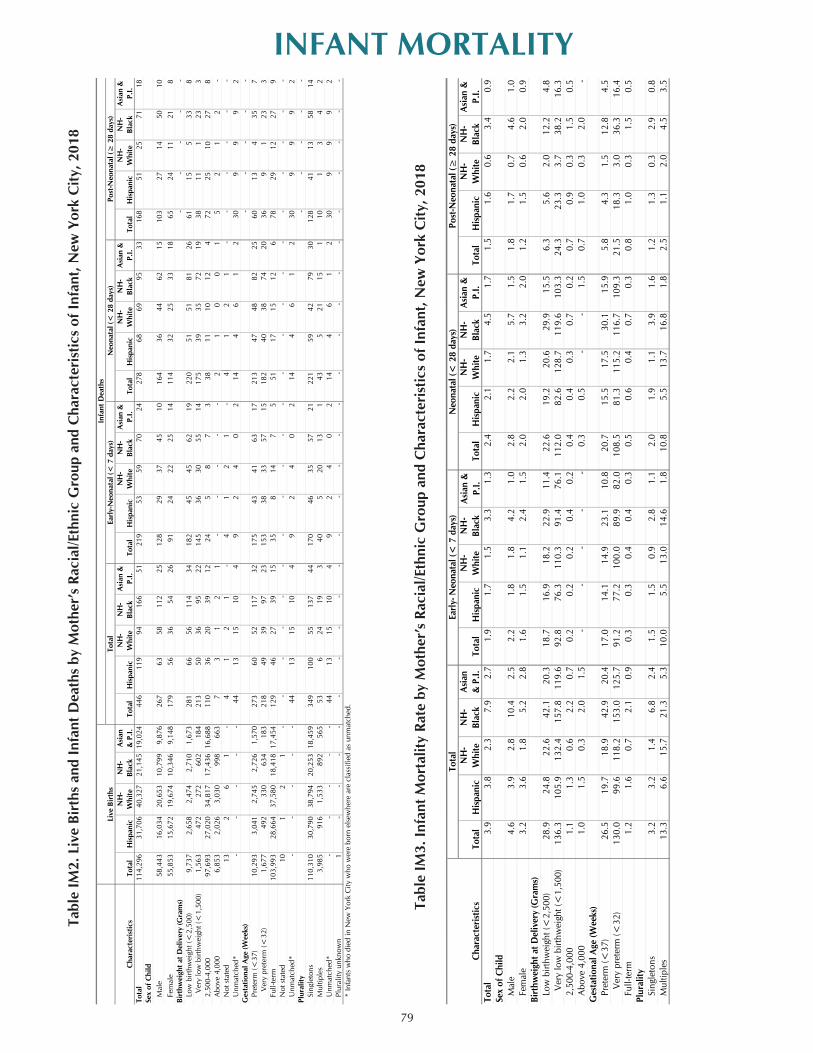
79
INFANT MORTALITYTa
ble
IM2.
Liv
e Bi
rths
and
Infa
nt D
eath
s by
Mot
her’
s Ra
cial
/Eth
nic
Gro
up a
nd C
hara
cter
istic
s of
Infa
nt, N
ew Y
ork
City
, 201
8
Tabl
e IM
3. In
fant
Mor
talit
y Ra
te b
y M
othe
r’s
Raci
al/E
thni
c G
roup
and
Cha
ract
eris
tics
of In
fant
, New
Yor
k C
ity, 2
018
Cha
ract
erist
ics
Tota
lH
ispan
icN
H-
Whi
teN
H-
Blac
kA
sian
& P
.I.To
tal
Hisp
anic
NH
-W
hite
NH
-Bl
ack
Asia
n &
P.
I.To
tal
Hisp
anic
NH
-W
hite
NH
-Bl
ack
Asia
n &
P.
I.To
tal
Hisp
anic
NH
-W
hite
NH
-Bl
ack
Asia
n &
P.
I.To
tal
3.9
3.8
2.3
7.9
2.7
1.9
1.7
1.5
3.3
1.3
2.4
2.1
1.7
4.5
1.7
1.5
1.6
0.6
3.4
0.9
Sex
of C
hild
Mal
e4.
63.
92.
810
.42.
52.
21.
81.
84.
21.
02.
82.
22.
15.
71.
51.
81.
70.
74.
61.
0Fe
mal
e3.
23.
61.
85.
22.
81.
61.
51.
12.
41.
52.
02.
01.
33.
22.
01.
21.
50.
62.
00.
9Bi
rthw
eigh
t at D
eliv
ery
(Gra
ms)
Low
birt
hwei
ght (
<2,
500)
28.9
24.8
22.6
42.1
20.3
18.7
16.9
18.2
22.9
11.4
22.6
19.2
20.6
29.9
15.5
6.3
5.6
2.0
12.2
4.8
Ver
y lo
w b
irthw
eigh
t (<
1,50
0)13
6.3
105.
913
2.4
157.
811
9.6
92.8
76.3
110.
391
.476
.111
2.0
82.6
128.
711
9.6
103.
324
.323
.33.
738
.216
.32,
500-
4,00
01.
11.
30.
62.
20.
70.
20.
20.
20.
40.
20.
40.
40.
30.
70.
20.
70.
90.
31.
50.
5A
bove
4,0
001.
01.
50.
32.
01.
5-
--
--
0.3
0.5
--
1.5
0.7
1.0
0.3
2.0
-G
esta
tiona
l Age
(Wee
ks)
Pret
erm
(<37
) 26
.519
.718
.942
.920
.417
.014
.114
.923
.110
.820
.715
.517
.530
.115
.95.
84.
31.
512
.84.
5V
ery
pret
erm
(<32
) 13
0.0
99.6
118.
215
3.0
125.
791
.277
.210
0.0
89.9
82.0
108.
581
.311
5.2
116.
710
9.3
21.5
18.3
3.0
36.3
16.4
Full-
term
1.
21.
60.
72.
10.
90.
30.
30.
40.
40.
30.
50.
60.
40.
70.
30.
81.
00.
31.
50.
5Pl
ural
itySi
ngle
tons
3.2
3.2
1.4
6.8
2.4
1.5
1.5
0.9
2.8
1.1
2.0
1.9
1.1
3.9
1.6
1.2
1.3
0.3
2.9
0.8
Mul
tiple
s13
.36.
615
.721
.35.
310
.05.
513
.014
.61.
810
.85.
513
.716
.81.
82.
51.
12.
04.
53.
5
Tota
lEa
rly- N
eona
tal (
< 7
day
s)N
eona
tal (
< 2
8 da
ys)
Post
-Neo
nata
l (≥
28
days
)
Cha
ract
eris
tics
Tota
lH
ispa
nic
NH
-W
hite
NH
-Bl
ack
Asi
an
& P
.I.To
tal
His
pani
cN
H-
Whi
teN
H-
Blac
kA
sian
&
P.I.
Tota
lH
ispa
nic
NH
-W
hite
NH
-Bl
ack
Asi
an &
P.
I.To
tal
His
pani
cN
H-
Whi
teN
H-
Blac
kA
sian
&
P.I.
Tota
lH
ispa
nic
NH
-W
hite
NH
-Bl
ack
Asi
an &
P.
I.To
tal
114,
296
31,7
0640
,327
21,1
4519
,024
446
119
9416
651
219
5359
7024
278
6869
9533
168
5125
7118
Sex
of C
hild
Mal
e58
,443
16,0
3420
,653
10,7
999,
876
267
6358
112
2512
829
3745
1016
436
4462
1510
327
1450
10Fe
mal
e55
,853
15,6
7219
,674
10,3
469,
148
179
5636
5426
9124
2225
1411
432
2533
1865
2411
218
Birt
hwei
ght a
t Del
iver
y (G
ram
s)-
--
--
Low
bir
thw
eigh
t (<
2,50
0)9,
737
2,65
82,
474
2,71
01,
673
281
6656
114
3418
245
4562
1922
051
5181
2661
155
338
Ver
y lo
w b
irth
wei
ght (
<1,
500)
1,56
347
227
260
218
421
350
3695
2214
536
3055
1417
539
3572
1938
111
233
2,50
0-4,
000
97,6
9327
,020
34,8
1717
,436
16,6
8811
036
2039
1224
58
73
3811
1012
472
2510
278
Abo
ve 4
,000
6,85
32,
026
3,03
099
866
37
31
21
--
--
-2
10
01
52
12
-N
ot s
tate
d13
26
1-
41
21
-4
12
1-
41
21
--
--
--
Unm
atch
ed*
--
--
-44
1315
104
92
40
214
46
12
309
99
2G
esta
tiona
l Age
(Wee
ks)
--
--
-Pr
eter
m (<
37)
10,2
933,
041
2,74
52,
726
1,57
027
360
5211
732
175
4341
6317
213
4748
8225
6013
435
7V
ery
pret
erm
(<32
) 1,
677
492
330
634
183
218
4939
9723
153
3833
5715
182
4038
7420
369
123
3Fu
ll-te
rm
103,
993
28,6
6437
,580
18,4
1817
,454
129
4627
3915
358
147
551
1715
126
7829
1227
9N
ot s
tate
d10
12
1-
--
--
--
--
--
--
--
--
--
--
Unm
atch
ed*
--
--
-44
1315
104
92
40
214
46
12
309
99
2Pl
ural
ity-
--
--
Sing
leto
ns11
0,31
030
,790
38,7
9420
,253
18,4
5934
910
055
137
4417
046
3557
2122
159
4279
3012
841
1358
14M
ultip
les
3,98
591
61,
533
892
565
536
2419
340
520
131
435
2115
110
13
42
Unm
atch
ed*
--
--
-44
1315
104
92
40
214
46
12
309
99
2Pl
ural
ity u
nkno
wn
1-
--
--
--
--
--
--
--
--
--
--
--
-*
Infa
nts
who
die
d in
New
Yor
k C
ity w
ho w
ere
born
els
ewhe
re a
re c
lass
ified
as
unm
atch
ed.
Live
Bir
ths
Post
-Neo
nata
l (≥
28
days
)N
eona
tal (
< 2
8 da
ys)
Earl
y-N
eona
tal (
< 7
day
s)To
tal
Infa
nt D
eath
s

80
INFANT MORTALITY
Table IM4. Live Births and Infant Mortality, Overall and by Mother’s Racial/Ethnic Group, New York City, 2014–2018
Mother's Racial/Ethnic Group 2014 2015 2016 2017 2018Live Births, Total 122,084 121,673 120,367 117,013 114,296
Puerto Rican 7,897 7,561 7,159 6,307 5,995Other Hispanic 27,753 27,994 26,915 26,553 25,711Asian and Pacific Islander 20,746 20,535 21,566 20,110 19,024Non-Hispanic White 40,443 40,607 40,633 40,345 40,327Non-Hispanic Black 23,680 23,116 22,465 21,992 21,145Other or Unknown 1,565 1,860 1,629 1,706 2,094
Infant Deaths (< 1 year), Total 516 526 491 500 446Puerto Rican 60 46 24 40 32Other Hispanic 113 119 102 115 87Asian and Pacific Islander 53 54 62 69 51Non-Hispanic White 107 110 105 95 94Non-Hispanic Black 177 186 180 171 166Other or Unknown 6 11 18 10 16
Infant Mortality Rate, Total 4.2 4.3 4.1 4.3 3.9Puerto Rican 7.6 6.1 3.4 6.3 5.3Other Hispanic 4.1 4.3 3.8 4.3 3.4Asian and Pacific Islander 2.6 2.6 2.9 3.4 2.7Non-Hispanic White 2.6 2.7 2.6 2.4 2.3Non-Hispanic Black 7.5 8.0 8.0 7.8 7.9
Neonatal Deaths (< 28 days), Total 326 342 312 344 278Puerto Rican 40 34 17 26 21Other Hispanic 66 80 65 76 47Asian and Pacific Islander 37 33 43 52 33Non-Hispanic White 75 75 65 66 69Non-Hispanic Black 103 112 109 121 95
Neonatal Mortality Rate, Total 2.7 2.8 2.6 2.9 2.4Puerto Rican 5.1 4.5 2.4 4.1 3.5Other Hispanic 2.4 2.9 2.4 2.9 1.8Asian and Pacific Islander 1.8 1.6 2.0 2.6 1.7Non-Hispanic White 1.9 1.8 1.6 1.6 1.7Non-Hispanic Black 4.3 4.8 4.9 5.5 4.5

81
INFANT MORTALITY
Table IM5. Infant Mortality Rate by Mother’s Birthplace*, New York City, 2012–2018
Birthplace† 2012-2014 2013-2015 2014-2016 2015-2017 2016-2018
New York City 4.5 4.4 4.2 4.2 4.1
United States‡ 4.8 4.8 4.5 4.4 4.2
United States (excluding Puerto Rico) 4.8 4.8 4.5 4.4 4.1
Puerto Rico 5.3 4.8 5.5 6.0 5.2
Jamaica 7.9 6.1 6.8 6.5 7.6
Haiti 6.2 7.4 7.0 7.6 7.3
El Salvador 4.2 5.0 5.5 4.1 6.0
Ghana 2.9 3.3 3.8 6.3 5.9
Pakistan 5.2 5.5 6.7 6.4 5.1
Yemen Arab Republic 3.7 2.7 3.8 4.7 4.9
Guyana 4.9 4.8 4.3 4.8 4.5
Philippines 2.3 1.9 1.9 2.4 4.5
Bangladesh 3.5 3.6 3.1 4.5 4.2
Colombia 3.0 3.4 4.6 5.0 3.9
Trinidad and Tobago 7.3 6.7 7.2 5.2 3.6
Nigeria 4.5 2.8 0.9 1.6 3.1
Guatemala 1.6 2.0 2.4 3.1 3.1
Mexico 3.7 2.8 2.4 3.0 3.1
Ecuador 3.2 3.7 3.8 3.8 3.0
Dominican Republic 4.4 4.1 3.9 3.7 2.9
Israel 2.2 2.6 2.7 1.2 2.8
Russia 1.3 1.0 2.0 2.0 2.8
Egypt 2.8 3.5 3.4 3.8 2.6
India 6.1 3.2 2.8 2.4 2.6Japan 1.3 2.0 2.8 2.9 2.4
Honduras 6.8 4.4 3.5 2.2 2.2
Uzbekistan 1.7 1.8 1.1 1.8 2.2
Ukraine 0.0 0.4 1.1 1.5 2.0
China 1.5 1.5 1.6 1.7 1.8
Korea 3.6 5.0 2.6 3.3 1.6
Canada 3.0 4.1 3.0 2.6 1.5
Poland 1.8 1.4 1.5 2.1 1.1
United Kingdom 1.3 1.3 0.6 1.3 0.7
*The infant mortality rate is listed only for countries with 500 or more live births in any year from 2012-2018.
†Foreign countries are listed according to the descending order of infant mortality rates in the most current period.
‡See Technical Notes: Geographical Units, Birthplace Presentation.

82
INFANT MORTALITYTable IM6. Infant and Neonatal Mortality Rates by Community District of Residence, New York City, 2014–2018
Infant Neonatal† Infant Neonatal† Infant Neonatal†Mortality Mortality Mortality Mortality Mortality Mortality
Rate Rate Rate Rate Rate RateNEW YORK CITY 4.2 2.7 4.2 2.8 4.1 2.7MANHATTAN 3.3 2.2 3.1 2.1 2.6 1.8
101 Battery Park, Tribeca 3.0 2.7 2.4 1.8 1.5 0.9102 Greenwich Village, SOHO 1.7 1.7 0.9 0.9 0.9 0.9103 Lower East Side 3.2 2.4 3.9 2.8 3.8 3.0104 Chelsea, Clinton 2.3 1.3 1.3 1.0 1.3 1.0105 Midtown Business District 1.8 1.2 0.6 0.6 1.8 1.2106 Murray Hill 1.8 1.6 2.4 1.6 2.8 2.1107 Upper West Side 2.3 1.3 1.4 0.9 1.0 0.8108 Upper East Side 1.8 0.9 2.1 1.4 1.8 1.3109 Manhattanville 5.0 3.8 5.7 3.8 4.4 3.3110 Central Harlem 6.7 3.8 6.5 3.7 4.0 2.0111 East Harlem 5.2 3.0 5.1 2.9 5.0 2.5112 Washington Heights 4.2 3.2 4.0 3.1 3.3 2.5
BRONX 4.8 2.9 5.0 3.2 4.8 2.8201 Mott Haven 4.6 2.2 4.8 2.3 5.7 2.6202 Hunts Point 2.7 2.3 2.9 2.5 2.1 1.2203 Morrisania 4.8 2.3 5.1 2.8 5.4 3.0204 Concourse, Highbridge 3.4 2.4 4.7 2.8 5.2 2.9205 University/Morris Heights 4.6 3.1 5.5 4.0 4.6 3.1206 East Tremont 4.1 3.0 6.3 4.7 7.0 4.9207 Fordham 4.2 2.7 4.1 2.9 4.1 3.0208 Riverdale 4.3 3.0 3.7 2.1 2.9 1.6209 Unionport, Soundview 5.8 3.3 6.4 3.4 5.9 2.9210 Throgs Neck 3.9 2.6 5.0 3.3 3.0 1.7211 Pelham Parkway 7.8 4.2 5.0 2.5 3.4 1.0212 Williamsbridge 6.2 4.1 5.5 4.1 5.7 4.3
BROOKLYN 3.7 2.3 3.6 2.3 3.5 2.3301 Williamsburg, Greenpoint 2.8 1.4 3.2 1.6 2.6 1.4302 Fort Greene, Brooklyn Heights 2.4 1.6 2.8 1.6 1.6 0.6303 Bedford Stuyvesant 4.9 2.6 4.6 2.2 4.3 2.7304 Bushwick 3.4 1.7 2.1 0.8 1.4 0.8305 East New York 6.2 4.2 5.7 4.5 6.9 4.8306 Park Slope 2.3 1.1 2.4 1.2 2.8 1.8307 Sunset Park 2.4 1.6 2.7 1.9 2.5 1.6308 Crown Heights North 4.9 3.1 4.7 3.4 4.4 3.4309 Crown Heights South 3.8 2.0 4.1 2.3 5.9 3.7310 Bay Ridge 1.0 0.9 0.9 0.7 1.7 1.1311 Bensonhurst 3.6 2.6 3.0 1.7 2.8 2.1312 Borough Park 2.2 1.4 1.9 1.5 1.5 1.2313 Coney Island 4.7 3.7 3.7 2.9 3.6 2.2314 Flatbush, Midwood 4.3 2.9 4.4 3.0 3.8 2.8315 Sheepshead Bay 2.1 1.0 2.7 1.5 2.7 1.5316 Brownsville 5.4 3.2 6.0 3.8 6.3 3.4317 East Flatbush 8.5 4.9 6.7 4.0 5.6 3.4318 Canarsie 5.0 3.2 6.4 4.3 6.4 3.9
QUEENS 4.0 2.7 4.2 2.9 4.1 2.8401 Astoria, Long Island City 5.0 4.0 6.7 5.0 6.0 3.8402 Sunnyside, Woodside 3.1 2.0 3.4 2.8 2.8 2.4403 Jackson Heights 4.6 2.7 3.3 2.3 2.6 1.8404 Elmhurst, Corona 3.3 2.5 3.7 2.5 3.1 2.3405 Ridgewood, Glendale 2.2 1.2 2.8 1.8 3.2 1.7406 Rego Park, Forest Hills 2.8 1.6 2.4 1.7 1.7 1.2407 Flushing 3.0 1.8 3.4 1.8 3.6 1.9408 Fresh Meadows, Briarwood 2.5 1.8 3.1 2.2 3.2 2.2409 Woodhaven 4.4 3.5 4.2 3.4 3.8 3.0410 Howard Beach 5.5 4.2 4.7 3.6 4.7 3.9411 Bayside 1.9 0.9 3.9 2.4 4.7 3.1412 Jamaica, St. Albans 6.1 3.4 5.9 3.8 6.0 3.8413 Queens Village 5.6 4.0 6.7 4.6 8.1 5.7414 The Rockaways 5.2 3.9 4.6 3.1 4.4 2.1
STATEN ISLAND 3.6 2.3 4.5 3.3 4.4 3.3501 Port Richmond 4.8 2.7 5.4 3.9 5.3 3.8502 Willowbrook, South Beach 2.8 2.1 5.1 3.9 5.2 4.2503 Tottenville 2.6 1.7 2.6 2.0 2.4 1.7
*Due to instability in the infant mortality rates by community district, rates are presented in rolling three-year averages.†Neonatal infants are those less than 28 days old.
Community District
2014–2016* 2015–2017* 2016–2018*

83
INFANT MORTALITYTable IM7. Live Births and Infant Mortality Rate by Characteristics of Mother and Infant, New York City, 2018
Characteristics Number Percent Deaths Rate Deaths Rate Deaths RateTotal 114,296 100.0 446 3.9 278 2.4 168 1.5Race/Ethnicity
Puerto Rican 5,995 5.2 32 5.3 21 3.5 11 1.8Other Hispanic 25,711 22.5 87 3.4 47 1.8 40 1.6Asian and Pacific Islander 19,024 16.6 51 2.7 33 1.7 18 0.9Non-Hispanic White 40,327 35.3 94 2.3 69 1.7 25 0.6Non-Hispanic Black 21,145 18.5 166 7.9 95 4.5 71 3.4Other and Unknown 2,094 1.8 16 - 13 - 3 -
Borough of ResidenceManhattan 16,595 14.5 35 2.1 23 1.4 12 0.7Bronx 18,511 16.2 84 4.5 48 2.6 36 1.9Brooklyn 37,933 33.2 125 3.3 82 2.2 43 1.1Queens 24,325 21.3 95 3.9 57 2.3 38 1.6Staten Island 5,067 4.4 17 3.4 11 2.2 6 1.2Non-NYC residents 11,859 10.4 86 7.3 53 4.5 33 2.8Unknown 6 - 4 - 4 - 0 -
Age GroupAge <18 744 0.7 5 6.7 1 1.3 4 5.4Age 18-19 2,148 1.9 7 3.3 2 0.9 5 2.3Age 20-29 43,737 38.3 163 3.7 99 2.3 64 1.5Age 30-39 60,458 52.9 199 3.3 142 2.3 57 0.9Age ≥40 7,208 6.3 28 3.9 20 2.8 8 1.1Age unknown 1 - - - - - - -Unmatched† - - 44 - 14 - 30 -
Education11th grade or less/12th grade, no diploma 17,786 15.6 80 4.5 39 2.2 41 2.3High school graduate or GED 25,408 22.2 122 4.8 81 3.2 41 1.6Some college/associate degree 24,008 21.0 88 3.7 56 2.3 32 1.3Bachelor's degree 25,364 22.2 60 2.4 45 1.8 15 0.6Master's degree or higher 21,294 18.6 36 1.7 27 1.3 9 0.4Woman's education unknown 436 0.4 16 - 16 - 0 -Unmatched† - - 44 - 14 - 30 -
Marital Status‡Not married 40,981 35.9 213 5.2 127 3.1 86 2.1Married 73,315 64.1 189 2.6 137 1.9 52 0.7Unmatched†
Birthplace§US born, including territories 57,118 50.0 222 3.9 147 2.6 75 1.3Foreign born 57,096 50.0 169 3.0 106 1.9 63 1.1Birthplace unknown 82 0 11 - 11 - - -Unmatched† - - 44 - 14 - 30 -
Primary Payer for This BirthMedicaid/Family Plus/Child PlusB/Other govt 65,431 57.2 249 3.8 150 2.3 99 1.5Other 48,292 42.3 149 3.1 111 2.3 38 0.8Coverage unknown 573 0.5 4 - 3 - 1 -Unmatched† - - 44 - 14 - 30 -
PluralitySingletons 110,311 96.5 349 3.2 221 2.0 128 1.2Multiples 3,985 3.5 53 13.3 43 10.8 10 2.5Unmatched† - - 44 - 14 - 30 -
First Prenatal Care VisitNo prenatal care 585 0.5 10 17.1 8 13.7 2 3.4First trimester (1-3 months) 84,015 73.5 267 3.2 176 2.1 91 1.1Second trimester (4-6 months) 19,881 17.4 69 3.5 43 2.2 26 1.3Third Trimester (7-9 months) 6,672 5.8 20 3.0 10 1.5 10 1.5Prenatal care unknown 3,143 2.7 36 - 27 - 9 -Unmatched† - - 44 - 14 - 30 -
Pre-pregnancy Body Mass Index (BMI)Underweight (BMI<18.5) 5,778 5.1 15 2.6 9 1.6 6 1.0Normal weight (18.5≤BMI<25) 58,574 51.2 174 3.0 108 1.8 66 1.1Overweight (25≤BMI<30) 28,762 25.2 102 3.5 67 2.3 35 1.2Obese (BMI≥30) 20,515 17.9 96 4.7 67 3.3 29 1.4Pre-pregnancy BMI unknown 667 0.6 15 - 13 - 2 -Unmatched† - - 44 - 14 - 30 -
BirthweightVery low birthweight (<1,500 grams) 1,563 1.4 213 136.3 175 112.0 38 24.3Low birthweight (1,500-2,499 grams) 8,174 7.2 68 8.3 45 5.5 23 2.8Normal birthweight 104,546 91.5 117 1.1 40 0.4 77 0.7Birthweight unknown 13 - 4 - 4 - - -Unmatched† - - 44 - 14 - 30 -
*Neonatal infants are those less than 28 days old; post-neonatal infants are those 28 days to less than 1 year old.†Infants who died in New York City who were born elsewhere were classified as unmatched. ‡See Technical Notes: Births, Woman's Marital Status.§See Technical Notes: Geographical Units, Birthplace Presentation.
Infant Mortality Rate (IMR) per 1,000 Live BirthsAll Neonatal* Post-Neonatal*Live Births

84
PREGNANCY OUTCOMESTable PO1. Live Births by Borough of Birth* and Institution, New York City, 2018
Borough and Institution BirthsManhattan
Bellevue Hospital Center 1,371 Harlem Hospital Center 834 Lenox Hill Hospital 3,857 Metropolitan Hospital Center 944 Mount Sinai Hospital 8,087 Mount Sinai West 5,806 New York Weill Cornell Medical Center 5,207 New York-Presbyterian/Columbia University Medical Center 4,848 New York-Presbyterian/Lower Manhattan Hospital 3,308 New York-Presbyterian/The Allen Hospital 2,169 NYU Langone - Tisch Hospital 6,366 Home† 113 Places other than a hospital or home‡ 34
BronxBronx Lebanon Hospital Center 1,903 Jack D. Weiler Hospital 3,865 Jacobi Medical Center 1,831 Lincoln Medical and Mental Health Center 1,815 Montefiore Medical Center - Wakefield Division 1,889 Montefiore Medical Center (Henry & Lucy Moses Division) 2 North Central Bronx Hospital 1,159 St. Barnabas Hospital 877 Home† 93 Places other than a hospital or home‡ 18
BrooklynBrookdale University Hospital and Medical Center 872 Brooklyn Birthing Center 169 Brooklyn Hospital Center 2,549 Coney Island Hospital 1,130 Kings County Hospital Center 1,741 Lutheran Medical Center 4,201 Maimonides Medical Center 8,055 New York-Presbyterian/Brooklyn Methodist Hospital 5,118 The Birthing Center of NY§ 12 University Hospital of Brooklyn 1,253 Woodhull Medical and Mental Health Center 1,512 Wyckoff Heights Medical Center 1,222 Home† 383 Places other than a hospital or home‡ 53
QueensElmhurst Hospital Center 2,306 Flushing Hospital Medical Center 2,591 Jamaica Hospital Medical Center 2,019 Long Island Jewish Forest Hills 1,974 Long Island Jewish Medical Center 9,035 New York Hospital Medical Center of Queens 3,753 Queens Hospital Center 1,491 St. John's Episcopal Hospital South Shore 648 Zucker Hillside Hospital 1 Home† 117 Places other than a hospital or home‡ 28
Staten IslandRichmond University Medical Center 2,960 Staten Island University Hospital 2,685 Home† 17 Places other than a hospital or home‡ 4
Foundling 1 New York City Total 114,296 * Live births are presented by borough of birth beginning in 2010; in prior years, they were reported by borough of report.† See Technical Notes: Geographical Units, Birthplace Presentation.‡ Places other than a hospital or home include ambulances, taxis, and airplanes.§ New birth center opened in 2017. In the 2017 Summary, the 3 births at this center were categorized into "Home" birth.
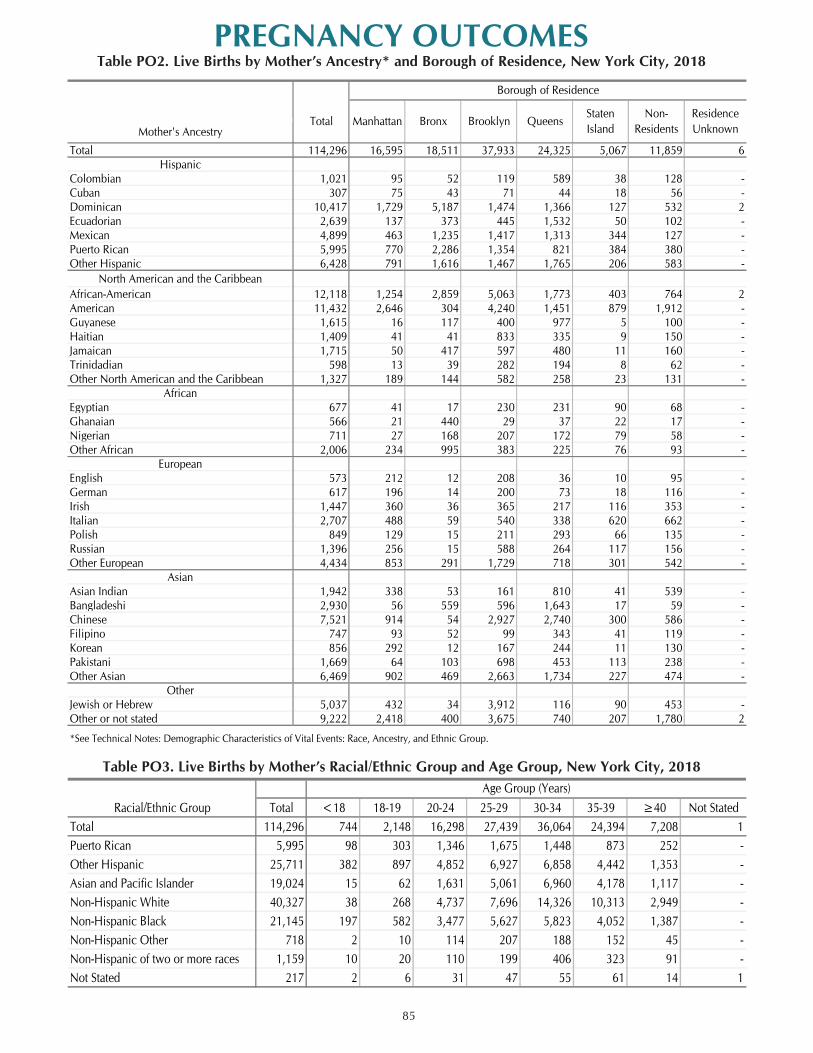
85
PREGNANCY OUTCOMESTable PO2. Live Births by Mother’s Ancestry* and Borough of Residence, New York City, 2018
Table PO3. Live Births by Mother’s Racial/Ethnic Group and Age Group, New York City, 2018
Mother's Ancestry
Total 114,296 16,595 18,511 37,933 24,325 5,067 11,859 6Hispanic
Colombian 1,021 95 52 119 589 38 128 -Cuban 307 75 43 71 44 18 56 -Dominican 10,417 1,729 5,187 1,474 1,366 127 532 2Ecuadorian 2,639 137 373 445 1,532 50 102 -Mexican 4,899 463 1,235 1,417 1,313 344 127 -Puerto Rican 5,995 770 2,286 1,354 821 384 380 -Other Hispanic 6,428 791 1,616 1,467 1,765 206 583 -
North American and the CaribbeanAfrican-American 12,118 1,254 2,859 5,063 1,773 403 764 2American 11,432 2,646 304 4,240 1,451 879 1,912 -Guyanese 1,615 16 117 400 977 5 100 -Haitian 1,409 41 41 833 335 9 150 -Jamaican 1,715 50 417 597 480 11 160 -Trinidadian 598 13 39 282 194 8 62 -Other North American and the Caribbean 1,327 189 144 582 258 23 131 -
AfricanEgyptian 677 41 17 230 231 90 68 -Ghanaian 566 21 440 29 37 22 17 -Nigerian 711 27 168 207 172 79 58 -Other African 2,006 234 995 383 225 76 93 -
EuropeanEnglish 573 212 12 208 36 10 95 -German 617 196 14 200 73 18 116 -Irish 1,447 360 36 365 217 116 353 -Italian 2,707 488 59 540 338 620 662 -Polish 849 129 15 211 293 66 135 -Russian 1,396 256 15 588 264 117 156 -Other European 4,434 853 291 1,729 718 301 542 -
AsianAsian Indian 1,942 338 53 161 810 41 539 -Bangladeshi 2,930 56 559 596 1,643 17 59 -Chinese 7,521 914 54 2,927 2,740 300 586 -Filipino 747 93 52 99 343 41 119 -Korean 856 292 12 167 244 11 130 -Pakistani 1,669 64 103 698 453 113 238 -Other Asian 6,469 902 469 2,663 1,734 227 474 -
OtherJewish or Hebrew 5,037 432 34 3,912 116 90 453 -Other or not stated 9,222 2,418 400 3,675 740 207 1,780 2
*See Technical Notes: Demographic Characteristics of Vital Events: Race, Ancestry, and Ethnic Group.
Manhattan BronxTotal Brooklyn QueensStaten Island
Non-Residents
Residence Unknown
Borough of Residence
Racial/Ethnic Group Total <18 18-19 20-24 25-29 30-34 35-39 ≥40 Not StatedTotal 114,296 744 2,148 16,298 27,439 36,064 24,394 7,208 1Puerto Rican 5,995 98 303 1,346 1,675 1,448 873 252 -Other Hispanic 25,711 382 897 4,852 6,927 6,858 4,442 1,353 -Asian and Pacific Islander 19,024 15 62 1,631 5,061 6,960 4,178 1,117 -Non-Hispanic White 40,327 38 268 4,737 7,696 14,326 10,313 2,949 -Non-Hispanic Black 21,145 197 582 3,477 5,627 5,823 4,052 1,387 -Non-Hispanic Other 718 2 10 114 207 188 152 45 -Non-Hispanic of two or more races 1,159 10 20 110 199 406 323 91 -Not Stated 217 2 6 31 47 55 61 14 1
Age Group (Years)
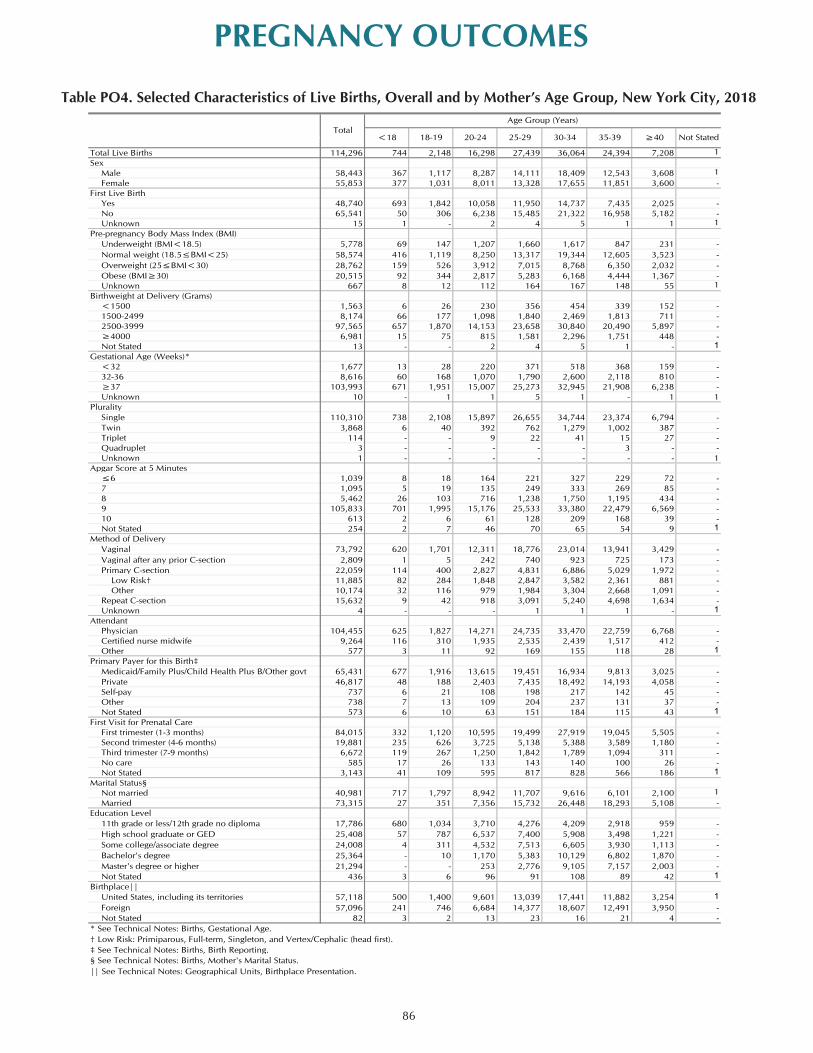
86
PREGNANCY OUTCOMES
Table PO4. Selected Characteristics of Live Births, Overall and by Mother’s Age Group, New York City, 2018
Total Live Births 114,296 744 2,148 16,298 27,439 36,064 24,394 7,208 1Sex
Male 58,443 367 1,117 8,287 14,111 18,409 12,543 3,608 1Female 55,853 377 1,031 8,011 13,328 17,655 11,851 3,600 -
First Live BirthYes 48,740 693 1,842 10,058 11,950 14,737 7,435 2,025 -No 65,541 50 306 6,238 15,485 21,322 16,958 5,182 -Unknown 15 1 - 2 4 5 1 1 1
Pre-pregnancy Body Mass Index (BMI)Underweight (BMI<18.5) 5,778 69 147 1,207 1,660 1,617 847 231 -Normal weight (18.5≤BMI<25) 58,574 416 1,119 8,250 13,317 19,344 12,605 3,523 -Overweight (25≤BMI<30) 28,762 159 526 3,912 7,015 8,768 6,350 2,032 -Obese (BMI≥30) 20,515 92 344 2,817 5,283 6,168 4,444 1,367 -Unknown 667 8 12 112 164 167 148 55 1
Birthweight at Delivery (Grams)<1500 1,563 6 26 230 356 454 339 152 -1500-2499 8,174 66 177 1,098 1,840 2,469 1,813 711 -2500-3999 97,565 657 1,870 14,153 23,658 30,840 20,490 5,897 -≥4000 6,981 15 75 815 1,581 2,296 1,751 448 -Not Stated 13 - - 2 4 5 1 - 1
Gestational Age (Weeks)*<32 1,677 13 28 220 371 518 368 159 -32-36 8,616 60 168 1,070 1,790 2,600 2,118 810 -≥37 103,993 671 1,951 15,007 25,273 32,945 21,908 6,238 -Unknown 10 - 1 1 5 1 - 1 1
PluralitySingle 110,310 738 2,108 15,897 26,655 34,744 23,374 6,794 -Twin 3,868 6 40 392 762 1,279 1,002 387 -Triplet 114 - - 9 22 41 15 27 -Quadruplet 3 - - - - - 3 - -Unknown 1 - - - - - - - 1
Apgar Score at 5 Minutes≤6 1,039 8 18 164 221 327 229 72 -7 1,095 5 19 135 249 333 269 85 -8 5,462 26 103 716 1,238 1,750 1,195 434 -9 105,833 701 1,995 15,176 25,533 33,380 22,479 6,569 -10 613 2 6 61 128 209 168 39 -Not Stated 254 2 7 46 70 65 54 9 1
Method of DeliveryVaginal 73,792 620 1,701 12,311 18,776 23,014 13,941 3,429 -Vaginal after any prior C-section 2,809 1 5 242 740 923 725 173 -Primary C-section 22,059 114 400 2,827 4,831 6,886 5,029 1,972 - Low Risk† 11,885 82 284 1,848 2,847 3,582 2,361 881 - Other 10,174 32 116 979 1,984 3,304 2,668 1,091 -Repeat C-section 15,632 9 42 918 3,091 5,240 4,698 1,634 -Unknown 4 - - - 1 1 1 - 1
AttendantPhysician 104,455 625 1,827 14,271 24,735 33,470 22,759 6,768 -Certified nurse midwife 9,264 116 310 1,935 2,535 2,439 1,517 412 -Other 577 3 11 92 169 155 118 28 1
Primary Payer for this Birth‡Medicaid/Family Plus/Child Health Plus B/Other govt 65,431 677 1,916 13,615 19,451 16,934 9,813 3,025 -Private 46,817 48 188 2,403 7,435 18,492 14,193 4,058 -Self-pay 737 6 21 108 198 217 142 45 -Other 738 7 13 109 204 237 131 37 -Not Stated 573 6 10 63 151 184 115 43 1
First Visit for Prenatal CareFirst trimester (1-3 months) 84,015 332 1,120 10,595 19,499 27,919 19,045 5,505 -Second trimester (4-6 months) 19,881 235 626 3,725 5,138 5,388 3,589 1,180 -Third trimester (7-9 months) 6,672 119 267 1,250 1,842 1,789 1,094 311 -No care 585 17 26 133 143 140 100 26 -Not Stated 3,143 41 109 595 817 828 566 186 1
Marital Status§Not married 40,981 717 1,797 8,942 11,707 9,616 6,101 2,100 1Married 73,315 27 351 7,356 15,732 26,448 18,293 5,108 -
Education Level11th grade or less/12th grade no diploma 17,786 680 1,034 3,710 4,276 4,209 2,918 959 -High school graduate or GED 25,408 57 787 6,537 7,400 5,908 3,498 1,221 -Some college/associate degree 24,008 4 311 4,532 7,513 6,605 3,930 1,113 -Bachelor's degree 25,364 - 10 1,170 5,383 10,129 6,802 1,870 -Master's degree or higher 21,294 - - 253 2,776 9,105 7,157 2,003 -Not Stated 436 3 6 96 91 108 89 42 1
Birthplace||United States, including its territories 57,118 500 1,400 9,601 13,039 17,441 11,882 3,254 1Foreign 57,096 241 746 6,684 14,377 18,607 12,491 3,950 -Not Stated 82 3 2 13 23 16 21 4 -
* See Technical Notes: Births, Gestational Age.
‡ See Technical Notes: Births, Birth Reporting.§ See Technical Notes: Births, Mother's Marital Status.|| See Technical Notes: Geographical Units, Birthplace Presentation.
† Low Risk: Primiparous, Full-term, Singleton, and Vertex/Cephalic (head first).
Age Group (Years)
35-3930-3425-2920-2418-19<18Total
Not Stated≥40

87
PREGNANCY OUTCOMES
Table PO5. Selected Characteristics of Live Births by Mother’s Racial/Ethnic Group, New York City, 2018
Total Live Births 114,296 5,995 25,711 19,024 40,327 21,145 718 1,159 217Sex Male 58,443 3,082 12,952 9,876 20,653 10,799 350 601 130 Female 55,853 2,913 12,759 9,148 19,674 10,346 368 558 87First Live Birth Yes 48,740 2,461 10,042 9,096 17,457 8,680 315 607 82 No 65,541 3,534 15,667 9,927 22,867 12,463 403 552 128 Unknown 15 - 2 1 3 2 - - 7Pre-pregnancy Body Mass Index (BMI) Underweight (BMI<18.5) 5,778 222 666 1,857 2,231 704 31 58 9 Normal weight (18.5≤BMI<25) 58,574 2,094 10,557 11,908 25,752 7,175 353 662 73 Overweight (25≤BMI<30) 28,762 1,636 8,318 3,835 8,086 6,393 208 249 37 Obese (BMI≥30) 20,515 2,011 6,056 1,387 4,068 6,659 125 185 24 Unknown 667 32 114 37 190 214 1 5 74Birthweight at Delivery (Grams) <1500 1,563 103 369 184 272 602 10 13 10 1500-2499 8,174 533 1,653 1,489 2,202 2,108 82 85 22 2500-3999 97,565 5,002 21,990 16,675 34,756 17,411 583 979 169 ≥4000 6,981 356 1,698 676 3,091 1,023 43 82 12 Not stated 13 1 1 - 6 1 - - 4Gestational Age (Weeks)† <32 1,677 107 385 183 330 634 15 15 8 32-36 8,616 567 1,982 1,387 2,415 2,092 69 85 19 ≥37 103,993 5,321 23,343 17,454 37,580 18,418 634 1,059 184 Unknown 10 - 1 - 2 1 - - 6Plurality Single 110,310 5,780 25,010 18,459 38,794 20,253 687 1,121 206 Twin 3,868 208 679 556 1,490 856 31 38 10 Triplet 114 7 22 9 40 36 - - - Quadruplet 3 - - - 3 - - - - Unknown 1 - - - - - - - 1Apgar Score at 5 Minutes ≤6 1,039 71 194 123 257 364 13 11 6
7 1,095 71 225 126 288 357 10 14 48 5,462 306 1,128 823 1,737 1,363 36 59 109 105,833 5,509 23,987 17,850 37,674 18,906 655 1,061 19110 613 22 126 79 305 69 2 10 -
Not stated 254 16 51 23 66 86 2 4 6Method of Delivery Vaginal 73,792 3,736 15,922 12,111 28,260 12,415 462 749 137 Vaginal after any prior C-section 2,809 131 645 356 1,188 441 23 19 6 Primary C-section 22,059 1,225 4,825 3,761 6,865 4,915 150 269 49 Low Risk‡ 11,885 629 2,563 2,213 3,758 2,462 81 156 23 Other 10,174 596 2,262 1,548 3,107 2,453 69 113 26 Repeat C-section 15,632 903 4,319 2,795 4,014 3,373 83 122 23 Unknown 4 - - 1 - 1 - - 2Attendant Physician 104,455 5,368 23,003 18,255 36,936 18,982 670 1,067 174 Certified nurse midwife 9,264 582 2,580 717 3,228 1,989 46 85 37 Other 577 45 128 52 163 174 2 7 6Primary Payer for this Birth§ Medicaid/Family Plus/Child Health Plus B/Other govt 65,431 4,183 20,159 10,649 15,064 14,409 454 387 126 Private 46,817 1,714 5,191 8,060 24,721 6,059 249 744 79 Self-pay 737 27 131 198 144 230 3 3 1 Other 738 45 128 77 304 165 3 16 - Not stated 573 26 102 40 94 282 9 9 11First Visit for Prenatal Care First trimester (1-3 months) 84,015 4,090 17,558 14,941 32,766 13,144 501 899 116 Second trimester (4-6 months) 19,881 1,279 5,553 2,954 5,165 4,574 136 172 48 Third tremester (7-9 months) 6,672 363 1,748 824 1,201 2,411 55 52 18 No care 585 60 127 59 121 206 3 3 6 Not stated 3,143 203 725 246 1,074 810 23 33 29Marital Status|| Not married 40,981 4,445 15,162 2,723 4,266 13,656 240 379 110 Married 73,315 1,550 10,549 16,301 36,061 7,489 478 780 107Education Level 11th grade or less/12th grade, no diploma 17,786 1,411 7,479 2,815 2,892 2,994 104 74 17 High school graduate or GED 25,408 1,616 6,300 3,583 7,576 5,963 203 138 29 Some college/associate degree 24,008 1,915 6,841 3,091 5,067 6,637 178 260 19 Bachelor's degree 25,364 675 3,369 5,187 12,056 3,601 121 334 21 Master's degree or higher 21,294 371 1,670 4,328 12,594 1,848 105 352 26 Not stated 436 7 52 20 142 102 7 1 105Birthplace¶ United States, including its territories 57,118 5,969 8,232 2,475 27,362 11,811 300 847 122 Foreign 57,096 24 17,471 16,545 12,957 9,322 417 312 48 Not stated 82 2 8 4 8 12 1 - 47
† See Technical Notes: Births, Gestational Age.
§ See Technical Notes: Births, Birth Reporting.|| See Technical Notes: Mother's Marital Status.¶ See Technical Notes: Geographical Units, Birthplace Presentation.
‡ Low Risk: Primiparous, Full-term, Singleton, and Vertex/Cephalic (head first).
* See Technical Notes: Demographic Characteristics of Vital Events, Race, Ancestry and Ethnic Group.
Racial/Ethnic Group*
TotalNon-
Hispanic Black
Non- Hispanic Two or More Races
Non-Hispanic
WhiteNot Stated
Non-Hispanic
OtherAsian
Other Hispanic
Puerto Rican

88
PREGNANCY OUTCOMES
Table PO6. Live Births by Selected Characteristics and Mother’s Ancestry, New York City, 2018
Percent of Total Live Births with Specified Characteristics
Total 114,296 50.0 42.6 8.5 9.0 6.5 35.9 57.5 18.1 2.5 42.3
Hispanic
Colombian 1,021 67.4 53.4 7.0 7.8 5.7 43.9 53.9 16.0 2.2 48.7Cuban 307 16.0 51.8 10.4 9.1 3.4 34.5 33.2 20.2 3.3 56.7Dominican 10,417 72.3 42.7 8.2 9.0 9.1 59.5 81.6 23.1 5.1 27.7Ecuadorian 2,639 80.4 34.9 5.6 8.5 7.4 50.8 82.4 20.8 4.4 34.8Mexican 4,899 71.2 29.6 7.0 8.7 6.0 64.6 88.4 25.6 6.2 36.0Puerto Rican 5,995 0.4 41.1 10.6 11.2 7.3 74.1 70.1 33.7 6.7 33.0Other Hispanic 6,428 56.0 39.2 8.9 10.4 6.7 60.8 71.3 25.6 4.5 39.8
North America and the Caribbean
African-American 12,118 16.9 42.5 13.3 13.8 8.9 75.4 69.5 33.7 5.0 30.0American 11,432 3.1 43.1 6.9 7.1 1.8 16.1 32.1 12.9 0.9 57.1Guyanese 1,615 89.1 44.7 14.3 12.0 12.9 41.7 63.5 21.3 2.8 37.0Haitian 1,409 81.6 41.7 11.4 13.6 14.7 38.5 65.5 30.0 1.7 28.1Jamaican 1,715 91.5 42.0 12.5 12.8 19.7 62.9 68.1 31.3 2.1 35.7Trinidadian 598 89.8 40.1 12.7 13.7 17.5 50.8 62.2 27.7 2.0 38.2Other North America and the Caribbean 1,327 86.4 48.0 10.6 9.6 15.0 39.6 54.2 19.9 1.4 46.1
African
Egyptian 677 92.2 29.4 6.8 7.8 17.4 2.5 76.4 21.0 0.3 40.0Ghanaian 566 97.5 29.2 12.5 11.1 20.9 47.3 73.4 29.7 0.2 31.1Nigerian 711 95.8 37.7 10.8 11.4 24.7 28.0 62.2 27.2 0.3 38.3Other African 2,006 96.6 32.8 9.1 7.5 19.2 31.9 81.8 21.0 1.1 36.9
European
English 573 46.4 56.9 4.0 4.0 2.7 9.1 9.8 6.5 0.0 78.9German 617 28.4 61.1 4.7 5.8 2.5 11.8 7.6 5.7 0.3 75.7Irish 1,447 8.9 58.5 6.0 7.7 1.6 14.2 11.0 11.3 0.5 65.4Italian 2,707 9.0 56.1 6.8 8.3 1.7 16.7 13.3 16.2 0.5 54.2Polish 849 63.3 50.5 5.9 6.2 2.0 15.7 26.5 7.7 0.2 59.0Russian 1,396 79.8 49.7 5.9 5.7 2.9 22.3 37.2 6.7 0.4 60.5Other European 4,434 73.4 51.6 5.8 6.9 5.7 16.3 38.1 8.7 0.5 60.1
Asian
Asian Indian 1,942 80.6 52.5 12.3 9.0 3.8 5.0 33.3 9.7 0.1 50.1Bangladeshi 2,930 98.0 40.9 12.6 10.0 6.6 2.6 82.0 12.1 0.4 28.4Chinese 7,521 89.0 47.7 6.0 6.8 3.0 21.6 62.4 2.6 0.2 29.2Filipino 747 76.8 49.4 9.9 9.4 5.8 19.5 29.0 9.4 0.4 51.7Korean 856 67.6 61.3 5.0 5.8 2.3 8.2 16.0 1.5 0.1 62.7Pakistani 1,669 91.4 37.6 9.7 9.3 8.0 2.7 73.5 16.0 1.0 27.8Other Asian 6,469 88.4 40.7 7.3 7.5 7.4 12.4 62.1 8.5 2.0 44.2
Other
Jewish or Hebrew 5,037 13.1 27.0 5.7 5.9 1.2 3.4 63.8 10.4 0.8 44.0Other or Not Stated 9,222 18.2 45.2 7.3 8.1 3.5 12.6 26.3 10.2 0.7 62.1
Note: See Technical Notes: Demographic Characteristics of Vital Events: Race, Ancestry, and Ethnic Group.
* Beginning in 2006, US Virgin Islands and Guam are not included in the Foreign-born category.
† Clinical gestational age <37 completed weeks.
‡ Due to revision of the birth certificate, since 2008 "On Medicaid" also includes Family Health Plus, Other government, and Child Health Plus B.
Pre-pregnancy
Obesity
Teenaged (<20 Years)
Exclusive Breast
Feeding
Mother's Ancestry Live Births Foreign-born*
First Live Birth
Low Birth Weight
(<2,500 Grams)
Preterm Birth (<37
Weeks)†
Late or No Prenatal
Care
Not Married
On Medicaid‡
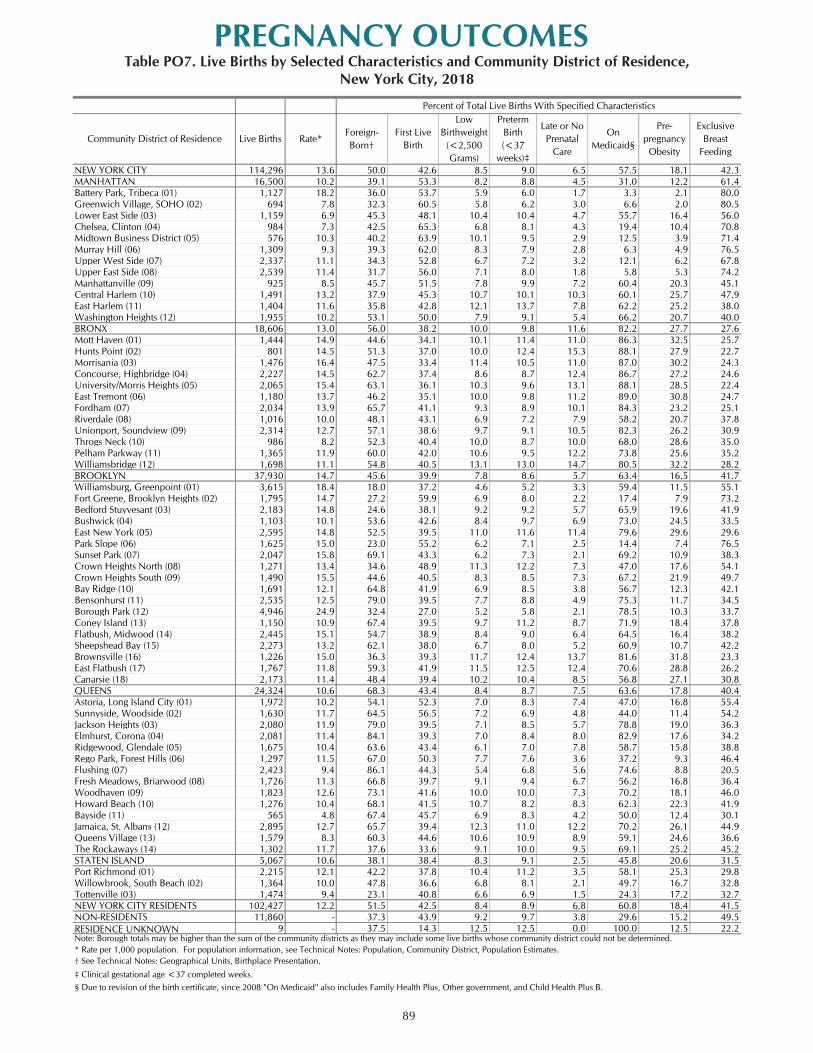
89
PREGNANCY OUTCOMESTable PO7. Live Births by Selected Characteristics and Community District of Residence,
New York City, 2018
Percent of Total Live Births With Specified Characteristics
NEW YORK CITY 114,296 13.6 50.0 42.6 8.5 9.0 6.5 57.5 18.1 42.3MANHATTAN 16,500 10.2 39.1 53.3 8.2 8.8 4.5 31.0 12.2 61.4Battery Park, Tribeca (01) 1,127 18.2 36.0 53.7 5.9 6.0 1.7 3.3 2.1 80.0Greenwich Village, SOHO (02) 694 7.8 32.3 60.5 5.8 6.2 3.0 6.6 2.0 80.5Lower East Side (03) 1,159 6.9 45.3 48.1 10.4 10.4 4.7 55.7 16.4 56.0Chelsea, Clinton (04) 984 7.3 42.5 65.3 6.8 8.1 4.3 19.4 10.4 70.8Midtown Business District (05) 576 10.3 40.2 63.9 10.1 9.5 2.9 12.5 3.9 71.4Murray Hill (06) 1,309 9.3 39.3 62.0 8.3 7.9 2.8 6.3 4.9 76.5Upper West Side (07) 2,337 11.1 34.3 52.8 6.7 7.2 3.2 12.1 6.2 67.8Upper East Side (08) 2,539 11.4 31.7 56.0 7.1 8.0 1.8 5.8 5.3 74.2Manhattanville (09) 925 8.5 45.7 51.5 7.8 9.9 7.2 60.4 20.3 45.1Central Harlem (10) 1,491 13.2 37.9 45.3 10.7 10.1 10.3 60.1 25.7 47.9East Harlem (11) 1,404 11.6 35.8 42.8 12.1 13.7 7.8 62.2 25.2 38.0Washington Heights (12) 1,955 10.2 53.1 50.0 7.9 9.1 5.4 66.2 20.7 40.0BRONX 18,606 13.0 56.0 38.2 10.0 9.8 11.6 82.2 27.7 27.6Mott Haven (01) 1,444 14.9 44.6 34.1 10.1 11.4 11.0 86.3 32.5 25.7Hunts Point (02) 801 14.5 51.3 37.0 10.0 12.4 15.3 88.1 27.9 22.7Morrisania (03) 1,476 16.4 47.5 33.4 11.4 10.5 11.0 87.0 30.2 24.3Concourse, Highbridge (04) 2,227 14.5 62.7 37.4 8.6 8.7 12.4 86.7 27.2 24.6University/Morris Heights (05) 2,065 15.4 63.1 36.1 10.3 9.6 13.1 88.1 28.5 22.4East Tremont (06) 1,180 13.7 46.2 35.1 10.0 9.8 11.2 89.0 30.8 24.7Fordham (07) 2,034 13.9 65.7 41.1 9.3 8.9 10.1 84.3 23.2 25.1Riverdale (08) 1,016 10.0 48.1 43.1 6.9 7.2 7.9 58.2 20.7 37.8Unionport, Soundview (09) 2,314 12.7 57.1 38.6 9.7 9.1 10.5 82.3 26.2 30.9Throgs Neck (10) 986 8.2 52.3 40.4 10.0 8.7 10.0 68.0 28.6 35.0Pelham Parkway (11) 1,365 11.9 60.0 42.0 10.6 9.5 12.2 73.8 25.6 35.2Williamsbridge (12) 1,698 11.1 54.8 40.5 13.1 13.0 14.7 80.5 32.2 28.2BROOKLYN 37,930 14.7 45.6 39.9 7.8 8.6 5.7 63.4 16.5 41.7Williamsburg, Greenpoint (01) 3,615 18.4 18.0 37.2 4.6 5.2 3.3 59.4 11.5 55.1Fort Greene, Brooklyn Heights (02) 1,795 14.7 27.2 59.9 6.9 8.0 2.2 17.4 7.9 73.2Bedford Stuyvesant (03) 2,183 14.8 24.6 38.1 9.2 9.2 5.7 65.9 19.6 41.9Bushwick (04) 1,103 10.1 53.6 42.6 8.4 9.7 6.9 73.0 24.5 33.5East New York (05) 2,595 14.8 52.5 39.5 11.0 11.6 11.4 79.6 29.6 29.6Park Slope (06) 1,625 15.0 23.0 55.2 6.2 7.1 2.5 14.4 7.4 76.5Sunset Park (07) 2,047 15.8 69.1 43.3 6.2 7.3 2.1 69.2 10.9 38.3Crown Heights North (08) 1,271 13.4 34.6 48.9 11.3 12.2 7.3 47.0 17.6 54.1Crown Heights South (09) 1,490 15.5 44.6 40.5 8.3 8.5 7.3 67.2 21.9 49.7Bay Ridge (10) 1,691 12.1 64.8 41.9 6.9 8.5 3.8 56.7 12.3 42.1Bensonhurst (11) 2,535 12.5 79.0 39.5 7.7 8.8 4.9 75.3 11.7 34.5Borough Park (12) 4,946 24.9 32.4 27.0 5.2 5.8 2.1 78.5 10.3 33.7Coney Island (13) 1,150 10.9 67.4 39.5 9.7 11.2 8.7 71.9 18.4 37.8Flatbush, Midwood (14) 2,445 15.1 54.7 38.9 8.4 9.0 6.4 64.5 16.4 38.2Sheepshead Bay (15) 2,273 13.2 62.1 38.0 6.7 8.0 5.2 60.9 10.7 42.2Brownsville (16) 1,226 15.0 36.3 39.3 11.7 12.4 13.7 81.6 31.8 23.3East Flatbush (17) 1,767 11.8 59.3 41.9 11.5 12.5 12.4 70.6 28.8 26.2Canarsie (18) 2,173 11.4 48.4 39.4 10.2 10.4 8.5 56.8 27.1 30.8QUEENS 24,324 10.6 68.3 43.4 8.4 8.7 7.5 63.6 17.8 40.4Astoria, Long Island City (01) 1,972 10.2 54.1 52.3 7.0 8.3 7.4 47.0 16.8 55.4Sunnyside, Woodside (02) 1,630 11.7 64.5 56.5 7.2 6.9 4.8 44.0 11.4 54.2Jackson Heights (03) 2,080 11.9 79.0 39.5 7.1 8.5 5.7 78.8 19.0 36.3Elmhurst, Corona (04) 2,081 11.4 84.1 39.3 7.0 8.4 8.0 82.9 17.6 34.2Ridgewood, Glendale (05) 1,675 10.4 63.6 43.4 6.1 7.0 7.8 58.7 15.8 38.8Rego Park, Forest Hills (06) 1,297 11.5 67.0 50.3 7.7 7.6 3.6 37.2 9.3 46.4Flushing (07) 2,423 9.4 86.1 44.3 5.4 6.8 5.6 74.6 8.8 20.5Fresh Meadows, Briarwood (08) 1,726 11.3 66.8 39.7 9.1 9.4 6.7 56.2 16.8 36.4Woodhaven (09) 1,823 12.6 73.1 41.6 10.0 10.0 7.3 70.2 18.1 46.0Howard Beach (10) 1,276 10.4 68.1 41.5 10.7 8.2 8.3 62.3 22.3 41.9Bayside (11) 565 4.8 67.4 45.7 6.9 8.3 4.2 50.0 12.4 30.1Jamaica, St. Albans (12) 2,895 12.7 65.7 39.4 12.3 11.0 12.2 70.2 26.1 44.9Queens Village (13) 1,579 8.3 60.3 44.6 10.6 10.9 8.9 59.1 24.6 36.6The Rockaways (14) 1,302 11.7 37.6 33.6 9.1 10.0 9.5 69.1 25.2 45.2STATEN ISLAND 5,067 10.6 38.1 38.4 8.3 9.1 2.5 45.8 20.6 31.5Port Richmond (01) 2,215 12.1 42.2 37.8 10.4 11.2 3.5 58.1 25.3 29.8Willowbrook, South Beach (02) 1,364 10.0 47.8 36.6 6.8 8.1 2.1 49.7 16.7 32.8Tottenville (03) 1,474 9.4 23.1 40.8 6.6 6.9 1.5 24.3 17.2 32.7NEW YORK CITY RESIDENTS 102,427 12.2 51.5 42.5 8.4 8.9 6.8 60.8 18.4 41.5NON-RESIDENTS 11,860 - 37.3 43.9 9.2 9.7 3.8 29.6 15.2 49.5RESIDENCE UNKNOWN 9 - 37.5 14.3 12.5 12.5 0.0 100.0 12.5 22.2Note: Borough totals may be higher than the sum of the community districts as they may include some live births whose community district could not be determined.* Rate per 1,000 population. For population information, see Technical Notes: Population, Community District, Population Estimates.† See Technical Notes: Geographical Units, Birthplace Presentation.
§ Due to revision of the birth certificate, since 2008 "On Medicaid" also includes Family Health Plus, Other government, and Child Health Plus B.
Community District of Residence Live Births Rate*Foreign-Born†
First Live Birth
Low Birthweight
(<2,500 Grams)
Preterm Birth (<37
weeks)‡
Late or No Prenatal
Care
On Medicaid§
Pre-pregnancy
Obesity
Exclusive Breast
Feeding
‡ Clinical gestational age <37 completed weeks.

90
PREGNANCY OUTCOMESTable PO8. Live Births by Mother’s Birthplace and Borough of Residence, New York City, 2018
Table PO9. Live Births by Mother’s Birthplace and Age Group, New York City, 2018
Birthplace Total Manhattan Bronx Brooklyn Queens Staten Island
United States 57,121 10,101 8,126 20,617 7,707 3,138 7,429 3United States (excluding Puerto Rico) 56,282 9,986 7,728 20,457 7,603 3,117 7,388 3
Puerto Rico 839 115 398 160 104 21 41 -Dominican Republic 7,616 1,146 4,062 1,048 953 69 336 2China 6,486 688 48 2,533 2,484 253 480 -Mexico 3,517 334 895 956 997 260 75 -Bangladesh 2,910 56 548 601 1,631 16 58 -Ecuador 2,140 107 298 367 1,273 26 69 -Jamaica 2,112 54 518 766 560 16 198 -Guyana 1,750 22 118 519 983 6 102 -Pakistan 1,522 43 98 655 416 101 209 -India 1,486 206 36 82 700 33 429 -Uzbekistan 1,397 17 - 952 374 27 27 -Haiti 1,298 34 35 819 290 5 115 -Yemen 1,071 60 298 479 185 28 21 -Russia 952 166 13 445 145 77 106 -Israel 830 181 13 413 100 30 93 -Ukraine 817 99 13 484 68 73 80 -Guatemala 794 15 137 290 285 23 44 -Trinidad and Tobago 784 26 44 403 232 11 68 -Nigeria 777 31 183 242 174 87 60 -Honduras 758 28 299 154 210 30 37 -El Salvador 720 21 90 117 377 8 107 -Colombia 702 71 30 88 414 22 77 -Ghana 686 25 531 32 42 25 31 -Egypt 668 41 20 218 238 88 63 -Other or Not Stated 15,382 3,023 2,058 4,653 3,487 615 1,545 1
Total 114,296 16,595 18,511 37,933 24,325 5,067 11,859 6
Residence Unknown
Non-Residents
Borough of Residence
Birthplace Total <20 20-24 25-29 30-34 35-39 ≥40 Not StatedUnited States 57,121 1,900 9,601 13,039 17,443 11,883 3,254 1
United States (excluding Puerto Rico) 56,282 1,857 9,425 12,820 17,260 11,713 3,206 1 Puerto Rico 839 43 176 219 183 170 48 -Dominican Republic 7,616 348 1,510 2,271 1,953 1,182 352 -China 6,486 13 410 2,126 2,461 1,162 314 -Mexico 3,517 84 372 801 1,174 818 268 -Bangladesh 2,910 10 569 992 878 391 70 -Ecuador 2,140 61 323 489 619 479 169 -Jamaica 2,112 47 256 519 614 522 154 -Guyana 1,750 41 324 472 455 336 122 -Pakistan 1,522 13 206 537 510 212 44 -India 1,486 1 56 343 666 341 79 -Uzbekistan 1,397 28 431 415 340 151 32 -Haiti 1,298 14 79 254 410 387 154 -Yemen 1,071 75 250 329 234 130 53 -Russia 952 2 15 165 461 229 80 -Israel 830 5 100 140 271 242 72 -Ukraine 817 0 44 184 324 215 50 -Guatemala 794 51 154 223 217 123 26 -Trinidad and Tobago 784 11 56 153 274 230 60 -Nigeria 777 1 32 158 307 197 82 -Honduras 758 45 152 172 204 143 42 -El Salvador 720 39 156 177 177 134 37 -Colombia 702 11 63 171 204 185 68 -Ghana 686 2 25 146 283 149 81 -Egypt 668 2 71 236 224 105 30 -Other or Not Stated 15,382 88 1,043 2,927 5,361 4,448 1,515 -Total 114,296 2,892 16,298 27,439 36,064 24,394 7,208 1
Age Group (Years)

91
PREGNANCY OUTCOMESTable PO10. Live Births and Pregnancy Rates* to Teenagers (Age 15-19 Years) by Racial/Ethnic Group
and Borough of Residence, New York City, 2018
New York City‡ 15-17 744 48 1,416 2,208 126,102 5.9 17.518-19 2,148 132 2,676 4,956 94,846 22.6 52.3
Age 15-19 2,892 180 4,092 7,164 220,948 13.1 32.4Racial/Ethnic Group‡
Hispanic 15-17 480 18 505 1,003 45,869 10.5 21.918-19 1,200 36 905 2,141 32,185 37.3 66.5
Age 15-19 1,680 54 1,410 3,144 78,054 21.5 40.3Asian and Pacific Islander 15-17 15 1 43 59 15,841 0.9 3.7
18-19 62 1 102 165 12,637 4.9 13.1Age 15-19 77 2 145 224 28,478 2.7 7.9
Non-Hispanic White 15-17 38 3 87 128 29,058 1.3 4.418-19 268 16 219 503 25,601 10.5 19.6
Age 15-19 306 19 306 631 54,659 5.6 11.5Non-Hispanic Black 15-17 197 11 584 792 32,200 6.1 24.6
18-19 582 44 1,040 1,666 22,061 26.4 75.5Age 15-19 779 55 1,624 2,458 54,261 14.4 45.3
NYC Events to NYC Residents§ 15-17 718 46 1,306 2,070 126,102 5.7 16.418-19 2,060 123 2,478 4,661 94,846 21.7 49.1
Age 15-19 2,778 169 3,784 6,731 220,948 12.6 30.5Racial/Ethnic Group§
Hispanic 15-17 462 18 471 951 45,869 10.1 20.718-19 1,165 36 860 2,061 32,185 36.2 64.0
Age 15-19 1,627 54 1,331 3,012 78,054 20.8 38.6Asian and Pacific Islander 15-17 15 1 39 55 15,841 0.9 3.5
18-19 57 1 97 155 12,637 4.5 12.3Age 15-19 72 2 136 210 28,478 2.5 7.4
Non-Hispanic White 15-17 37 3 75 115 29,058 1.3 4.018-19 240 14 186 440 25,601 9.4 17.2
Age 15-19 277 17 261 555 54,659 5.1 10.2Non-Hispanic Black 15-17 191 9 539 739 32,200 5.9 23.0
18-19 565 41 961 1,567 22,061 25.6 71.0Age 15-19 756 50 1,500 2,306 54,261 13.9 42.5
Borough of Residence Manhattan 15-17 69 7 197 273 16,438 4.2 16.6
18-19 206 15 416 637 19,979 10.3 31.9Age 15-19 275 22 613 910 36,417 7.6 25.0
Bronx 15-17 242 10 397 649 27,413 8.8 23.718-19 676 24 648 1,348 19,186 35.2 70.3
Age 15-19 918 34 1,045 1,997 46,599 19.7 42.9 Brooklyn 15-17 204 19 365 588 40,202 5.1 14.6
18-19 682 45 718 1,445 27,470 24.8 52.6Age 15-19 886 64 1,083 2,033 67,672 13.1 30.0
Queens 15-17 160 7 293 460 33,416 4.8 13.818-19 416 33 616 1,065 22,651 18.4 47.0
Age 15-19 576 40 909 1,525 56,067 10.3 27.2 Staten Island 15-17 43 3 54 100 8,633 5.0 11.6
18-19 80 6 80 166 5,560 14.4 29.9Age 15-19 123 9 134 266 14,193 8.7 18.7
NYC Events to Non-NYC Residents 15-17 26 2 110 138 - N.A. N.A.18-19 88 9 198 295 - N.A. N.A.
Age 15-19 114 11 308 433 - N.A. N.A.
* Population data used to calculate rates are from 2010 Census population estimates. See Technical Notes: Population. † From 2011, the number of events to 15-17 year old females and to 15-19 year old females include events to females <18 and <20 years of age, respectively. See Technical Notes: Pregnancy Outcome Rates.‡ Includes all events occurring in NYC regardless of residence; other/unknown race and ethnicity are not presented.§ Numbers and rates are limited to events occurring in NYC to NYC residents only; other/unknown race and ethnicity are not presented.N.A. Not applicable.
TotalAge Group
(Years)†
Pregnancy Rate Per 1,000
WomenLive Births
Spontaneous Terminations
Induced Terminations
Birth Rate per 1,000 Women
Population Women
81

92
PREGNANCY OUTCOMES
Table PO11. Live Births to Teenagers (Age<20 Years), Overall and by Selected Characteristics, New York City, 2014-2018
2014 2015 2016 2017 2018Total Live Births 122,084 121,673 120,367 117,013 114,296Percent to Teenagers (Age<20) 3.7 3.3 2.8 2.7 2.5Population* (Females Age 15-19) 235,417 232,369 231,576 229,278 220,948Birth Rate† (Age 15-19) 19.4 17.5 14.8 13.8 13.1Births to Teenagers 4,572 4,073 3,425 3,175 2,892Percent of Births with Specified Characteristics: Hispanic 58.5 59.0 59.0 59.9 59.3 Foreign-born‡ 30.0 31.8 33.5 32.7 34.2 First Live Birth 85.9 86.1 88.1 87.3 87.7 <2,500 grams 9.6 10.5 9.7 10.6 9.5 Preterm§ 9.3 10.0 9.0 10.6 9.3 Prenatal Care in First or Second Trimester of Pregnancy 85.4 84.7 85.3 84.3 84.4 Not Married 88.4 86.8 86.1 87.0 86.9 On Medicaid|| 90.3 91.0 90.3 90.4 90.2 Pre-pregnancy Obesity 13.6 13.9 13.6 14.3 15.2Infant Mortality Rate¶ 3.7 6.6 5.3 5.4 3.9* For denominator information, see Technical Notes: Population.
‡ See Technical Notes: Geographical Units, Birthplace Presentation § Clinical gestational age <37 completed weeks. || See Technical Notes: Births, Birth Reporting.¶ Infant mortality rate per 1,000 live births to teenagers.
† Births to women age <20 years per 1,000 female population age 15 to 19. See Technical Notes: Vital Event Rates.
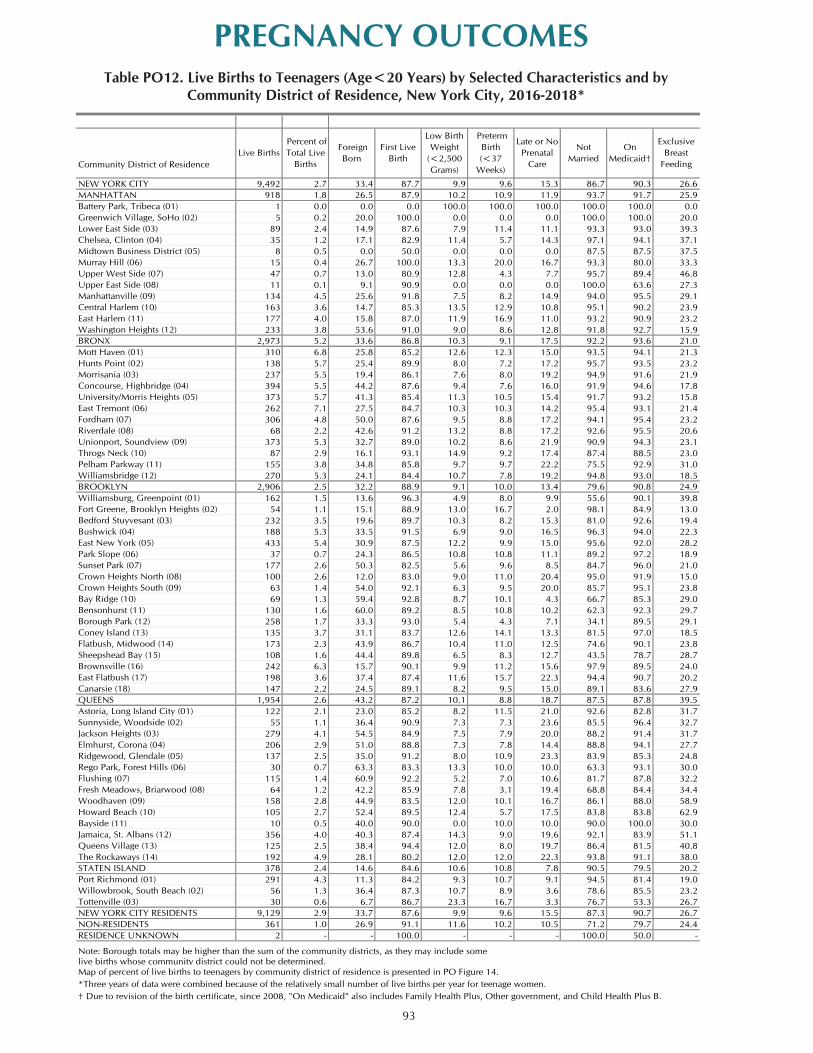
93
PREGNANCY OUTCOMESTable PO12. Live Births to Teenagers (Age<20 Years) by Selected Characteristics and by
Community District of Residence, New York City, 2016-2018*
Community District of Residence
NEW YORK CITY 9,492 2.7 33.4 87.7 9.9 9.6 15.3 86.7 90.3 26.6MANHATTAN 918 1.8 26.5 87.9 10.2 10.9 11.9 93.7 91.7 25.9Battery Park, Tribeca (01) 1 0.0 0.0 0.0 100.0 100.0 100.0 100.0 100.0 0.0Greenwich Village, SoHo (02) 5 0.2 20.0 100.0 0.0 0.0 0.0 100.0 100.0 20.0Lower East Side (03) 89 2.4 14.9 87.6 7.9 11.4 11.1 93.3 93.0 39.3Chelsea, Clinton (04) 35 1.2 17.1 82.9 11.4 5.7 14.3 97.1 94.1 37.1Midtown Business District (05) 8 0.5 0.0 50.0 0.0 0.0 0.0 87.5 87.5 37.5Murray Hill (06) 15 0.4 26.7 100.0 13.3 20.0 16.7 93.3 80.0 33.3Upper West Side (07) 47 0.7 13.0 80.9 12.8 4.3 7.7 95.7 89.4 46.8Upper East Side (08) 11 0.1 9.1 90.9 0.0 0.0 0.0 100.0 63.6 27.3Manhattanville (09) 134 4.5 25.6 91.8 7.5 8.2 14.9 94.0 95.5 29.1Central Harlem (10) 163 3.6 14.7 85.3 13.5 12.9 10.8 95.1 90.2 23.9East Harlem (11) 177 4.0 15.8 87.0 11.9 16.9 11.0 93.2 90.9 23.2Washington Heights (12) 233 3.8 53.6 91.0 9.0 8.6 12.8 91.8 92.7 15.9BRONX 2,973 5.2 33.6 86.8 10.3 9.1 17.5 92.2 93.6 21.0Mott Haven (01) 310 6.8 25.8 85.2 12.6 12.3 15.0 93.5 94.1 21.3Hunts Point (02) 138 5.7 25.4 89.9 8.0 7.2 17.2 95.7 93.5 23.2Morrisania (03) 237 5.5 19.4 86.1 7.6 8.0 19.2 94.9 91.6 21.9Concourse, Highbridge (04) 394 5.5 44.2 87.6 9.4 7.6 16.0 91.9 94.6 17.8University/Morris Heights (05) 373 5.7 41.3 85.4 11.3 10.5 15.4 91.7 93.2 15.8East Tremont (06) 262 7.1 27.5 84.7 10.3 10.3 14.2 95.4 93.1 21.4Fordham (07) 306 4.8 50.0 87.6 9.5 8.8 17.2 94.1 95.4 23.2Riverdale (08) 68 2.2 42.6 91.2 13.2 8.8 17.2 92.6 95.5 20.6Unionport, Soundview (09) 373 5.3 32.7 89.0 10.2 8.6 21.9 90.9 94.3 23.1Throgs Neck (10) 87 2.9 16.1 93.1 14.9 9.2 17.4 87.4 88.5 23.0Pelham Parkway (11) 155 3.8 34.8 85.8 9.7 9.7 22.2 75.5 92.9 31.0Williamsbridge (12) 270 5.3 24.1 84.4 10.7 7.8 19.2 94.8 93.0 18.5BROOKLYN 2,906 2.5 32.2 88.9 9.1 10.0 13.4 79.6 90.8 24.9Williamsburg, Greenpoint (01) 162 1.5 13.6 96.3 4.9 8.0 9.9 55.6 90.1 39.8Fort Greene, Brooklyn Heights (02) 54 1.1 15.1 88.9 13.0 16.7 2.0 98.1 84.9 13.0Bedford Stuyvesant (03) 232 3.5 19.6 89.7 10.3 8.2 15.3 81.0 92.6 19.4Bushwick (04) 188 5.3 33.5 91.5 6.9 9.0 16.5 96.3 94.0 22.3East New York (05) 433 5.4 30.9 87.5 12.2 9.9 15.0 95.6 92.0 28.2Park Slope (06) 37 0.7 24.3 86.5 10.8 10.8 11.1 89.2 97.2 18.9Sunset Park (07) 177 2.6 50.3 82.5 5.6 9.6 8.5 84.7 96.0 21.0Crown Heights North (08) 100 2.6 12.0 83.0 9.0 11.0 20.4 95.0 91.9 15.0Crown Heights South (09) 63 1.4 54.0 92.1 6.3 9.5 20.0 85.7 95.1 23.8Bay Ridge (10) 69 1.3 59.4 92.8 8.7 10.1 4.3 66.7 85.3 29.0Bensonhurst (11) 130 1.6 60.0 89.2 8.5 10.8 10.2 62.3 92.3 29.7Borough Park (12) 258 1.7 33.3 93.0 5.4 4.3 7.1 34.1 89.5 29.1Coney Island (13) 135 3.7 31.1 83.7 12.6 14.1 13.3 81.5 97.0 18.5Flatbush, Midwood (14) 173 2.3 43.9 86.7 10.4 11.0 12.5 74.6 90.1 23.8Sheepshead Bay (15) 108 1.6 44.4 89.8 6.5 8.3 12.7 43.5 78.7 28.7Brownsville (16) 242 6.3 15.7 90.1 9.9 11.2 15.6 97.9 89.5 24.0East Flatbush (17) 198 3.6 37.4 87.4 11.6 15.7 22.3 94.4 90.7 20.2Canarsie (18) 147 2.2 24.5 89.1 8.2 9.5 15.0 89.1 83.6 27.9QUEENS 1,954 2.6 43.2 87.2 10.1 8.8 18.7 87.5 87.8 39.5Astoria, Long Island City (01) 122 2.1 23.0 85.2 8.2 11.5 21.0 92.6 82.8 31.7Sunnyside, Woodside (02) 55 1.1 36.4 90.9 7.3 7.3 23.6 85.5 96.4 32.7Jackson Heights (03) 279 4.1 54.5 84.9 7.5 7.9 20.0 88.2 91.4 31.7Elmhurst, Corona (04) 206 2.9 51.0 88.8 7.3 7.8 14.4 88.8 94.1 27.7Ridgewood, Glendale (05) 137 2.5 35.0 91.2 8.0 10.9 23.3 83.9 85.3 24.8Rego Park, Forest Hills (06) 30 0.7 63.3 83.3 13.3 10.0 10.0 63.3 93.1 30.0Flushing (07) 115 1.4 60.9 92.2 5.2 7.0 10.6 81.7 87.8 32.2Fresh Meadows, Briarwood (08) 64 1.2 42.2 85.9 7.8 3.1 19.4 68.8 84.4 34.4Woodhaven (09) 158 2.8 44.9 83.5 12.0 10.1 16.7 86.1 88.0 58.9Howard Beach (10) 105 2.7 52.4 89.5 12.4 5.7 17.5 83.8 83.8 62.9Bayside (11) 10 0.5 40.0 90.0 0.0 10.0 10.0 90.0 100.0 30.0Jamaica, St. Albans (12) 356 4.0 40.3 87.4 14.3 9.0 19.6 92.1 83.9 51.1Queens Village (13) 125 2.5 38.4 94.4 12.0 8.0 19.7 86.4 81.5 40.8The Rockaways (14) 192 4.9 28.1 80.2 12.0 12.0 22.3 93.8 91.1 38.0STATEN ISLAND 378 2.4 14.6 84.6 10.6 10.8 7.8 90.5 79.5 20.2Port Richmond (01) 291 4.3 11.3 84.2 9.3 10.7 9.1 94.5 81.4 19.0Willowbrook, South Beach (02) 56 1.3 36.4 87.3 10.7 8.9 3.6 78.6 85.5 23.2Tottenville (03) 30 0.6 6.7 86.7 23.3 16.7 3.3 76.7 53.3 26.7NEW YORK CITY RESIDENTS 9,129 2.9 33.7 87.6 9.9 9.6 15.5 87.3 90.7 26.7NON-RESIDENTS 361 1.0 26.9 91.1 11.6 10.2 10.5 71.2 79.7 24.4RESIDENCE UNKNOWN 2 - - 100.0 - - - 100.0 50.0 -
live births whose community district could not be determined.Note: Borough totals may be higher than the sum of the community districts, as they may include some
Map of percent of live births to teenagers by community district of residence is presented in PO Figure 14.*Three years of data were combined because of the relatively small number of live births per year for teenage women. † Due to revision of the birth certificate, since 2008, "On Medicaid" also includes Family Health Plus, Other government, and Child Health Plus B.
On Medicaid†
Exclusive Breast
Feeding
Late or No Prenatal
CareLive Births
Percent of Total Live
Births
Foreign Born
First Live Birth
Low Birth Weight
(<2,500 Grams)
Preterm Birth (<37
Weeks)
Not Married
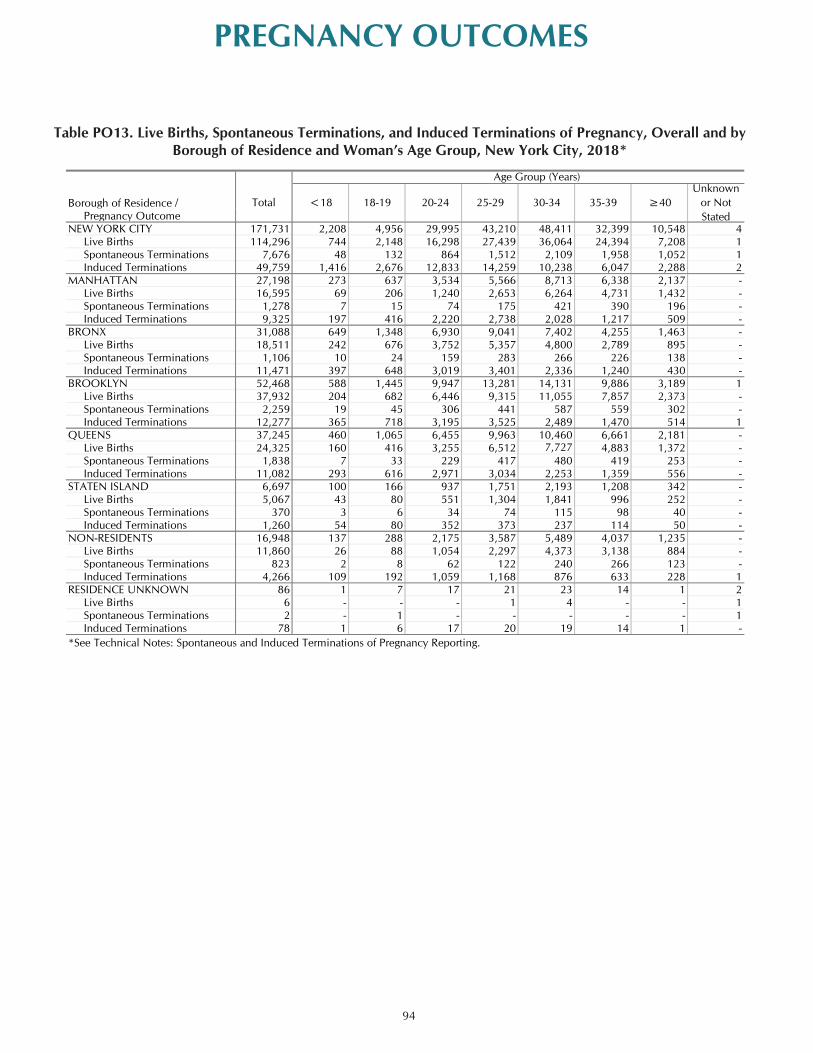
94
PREGNANCY OUTCOMES
Table PO13. Live Births, Spontaneous Terminations, and Induced Terminations of Pregnancy, Overall and by Borough of Residence and Woman’s Age Group, New York City, 2018*
Borough of Residence / Pregnancy OutcomeNEW YORK CITY 171,731 2,208 4,956 29,995 43,210 48,411 32,399 10,548 4 Live Births 114,296 744 2,148 16,298 27,439 36,064 24,394 7,208 1 Spontaneous Terminations 7,676 48 132 864 1,512 2,109 1,958 1,052 1 Induced Terminations 49,759 1,416 2,676 12,833 14,259 10,238 6,047 2,288 2MANHATTAN 27,198 273 637 3,534 5,566 8,713 6,338 2,137 - Live Births 16,595 69 206 1,240 2,653 6,264 4,731 1,432 - Spontaneous Terminations 1,278 7 15 74 175 421 390 196 - Induced Terminations 9,325 197 416 2,220 2,738 2,028 1,217 509 -BRONX 31,088 649 1,348 6,930 9,041 7,402 4,255 1,463 - Live Births 18,511 242 676 3,752 5,357 4,800 2,789 895 - Spontaneous Terminations 1,106 10 24 159 283 266 226 138 - Induced Terminations 11,471 397 648 3,019 3,401 2,336 1,240 430 -BROOKLYN 52,468 588 1,445 9,947 13,281 14,131 9,886 3,189 1 Live Births 37,932 204 682 6,446 9,315 11,055 7,857 2,373 - Spontaneous Terminations 2,259 19 45 306 441 587 559 302 - Induced Terminations 12,277 365 718 3,195 3,525 2,489 1,470 514 1QUEENS 37,245 460 1,065 6,455 9,963 10,460 6,661 2,181 - Live Births 24,325 160 416 3,255 6,512 7,727 4,883 1,372 - Spontaneous Terminations 1,838 7 33 229 417 480 419 253 - Induced Terminations 11,082 293 616 2,971 3,034 2,253 1,359 556 -STATEN ISLAND 6,697 100 166 937 1,751 2,193 1,208 342 - Live Births 5,067 43 80 551 1,304 1,841 996 252 - Spontaneous Terminations 370 3 6 34 74 115 98 40 - Induced Terminations 1,260 54 80 352 373 237 114 50 -NON-RESIDENTS 16,948 137 288 2,175 3,587 5,489 4,037 1,235 - Live Births 11,860 26 88 1,054 2,297 4,373 3,138 884 - Spontaneous Terminations 823 2 8 62 122 240 266 123 - Induced Terminations 4,266 109 192 1,059 1,168 876 633 228 1RESIDENCE UNKNOWN 86 1 7 17 21 23 14 1 2 Live Births 6 - - - 1 4 - - 1 Spontaneous Terminations 2 - 1 - - - - - 1 Induced Terminations 78 1 6 17 20 19 14 1 -*See Technical Notes: Spontaneous and Induced Terminations of Pregnancy Reporting.
Age Group (Years)Unknown
or Not Stated
≥4035-3930-3425-29 20-2418-19<18Total
85

95
PREGNANCY OUTCOMESTable PO14. Spontaneous Terminations of Pregnancy by Gestational Age and Woman’s Age Group
New York City, 2018
Table PO15. Selected Characteristics of Spontaneous Terminations of Pregnancy, ≥28 Weeks Gestation, Overall and by Woman’s Age Group, New York City, 2018
Total 7,676 48 132 864 1,512 2,109 1,958 1,052 1<13 5,727 34 100 604 1,051 1,566 1,522 850 -13-15 488 1 4 56 113 140 117 57 -16-19 586 7 5 72 143 171 124 64 -20-27 495 5 17 80 114 135 101 43 -≥28 378 1 6 52 91 96 94 38 -Not Stated 2 - - - - 1 - - 1*See Technical Notes: Spontaneous and Induced Terminations of Pregnancy.
Unknown or not stated
Age Group (Years)
TotalGestational Age (Weeks)
<18 18-19 20-24 25-29 30-34 35-39 ≥40
85
Age Group (Years)
Total 378 1 6 52 91 96 94 38Sex Male 193 - 5 30 42 53 46 17 Female 176 1 1 21 46 42 46 19 Undetermined 9 - - 1 3 1 2 2Weight at Delivery (Grams) <500 12 - - 1 4 3 3 1 500-999 36 - 1 7 9 6 10 3 1,000-1,499 46 - 3 5 13 7 13 5 1,500-1,999 60 1 - 10 12 17 14 6 2,000-2,499 70 - 1 7 20 23 15 4 ≥2,500 139 - 1 19 31 35 35 18 Not stated 15 - - 3 2 5 4 1
35-39 ≥40Total <18
*See Technical Notes: Spontaneous and Induced Terminations of Pregnancy Reporting.
18-19 20-24 25-29 30-34
86

96
PREGNANCY OUTCOMESTable PO16. Selected Characteristics of Spontaneous Terminations of Pregnancy, ≥28 Weeks Gestation,
Overall and by Woman’s Racial/Ethnic Group, New York City, 2018*
Total 378 7 58 47 102 105 12 47 Sex Male 193 4 35 23 45 58 7 21 Female 176 2 23 24 53 44 5 25 Undetermined 9 1 - - 4 3 - 1 Weight at Delivery (Grams) <500 12 1 1 1 4 4 - 1 500-999 36 1 6 4 5 17 - 3 1,000-1,499 46 1 3 5 12 16 3 6 1,500-1,999 60 - 10 7 10 23 1 9 2,000-2,499 70 1 12 9 19 17 4 8 ≥2,500 139 2 25 19 45 28 4 16 Not stated 15 1 1 2 7 - - 4*See Technical Notes: Spontaneous and Induced Terminations of Pregnancy Reporting.
Puerto Rican
Other Hispanic
Asian and Pacific Islander
Non-Hispanic
White
Non-Hispanic
BlackOther
Racial/Ethnic Group
Not StatedTotal
86
Borough of Residence /
Pregnancy Outcome Manhattan Bronx Brooklyn Queens Staten IslandNEW YORK CITY 164,433 65,182 21,686 34,708 37,077 5,780 Live Births 114,296 42,945 13,452 28,270 23,963 5,666 Spontaneous Terminations 378 137 45 111 71 14 Induced Terminations 49,759 22,100 8,189 6,327 13,043 100MANHATTAN 25,963 23,709 1,040 516 687 11 Live Births 16,595 15,893 295 271 126 10 Spontaneous Terminations 43 40 1 2 - - Induced Terminations 9,325 7,776 744 243 561 1BRONX 30,051 9,960 19,183 348 538 22 Live Births 18,511 5,756 12,262 240 231 22 Spontaneous Terminations 69 26 39 4 - - Induced Terminations 11,471 4,178 6,882 104 307 -BROOKLYN 50,359 15,237 227 30,242 3,388 1,265 Live Births 37,932 10,048 96 25,065 1,473 1,250 Spontaneous Terminations 150 43 1 97 4 5 Induced Terminations 12,277 5,146 130 5,080 1,911 10QUEENS 35,483 6,635 216 1,879 26,718 35 Live Births 24,325 4,556 106 1,479 18,150 34 Spontaneous Terminations 76 13 1 5 57 - Induced Terminations 11,082 2,066 109 395 8,511 1STATEN ISLAND 6,339 1,028 30 1,011 101 4,169 Live Births 5,067 291 11 662 30 4,073 Spontaneous Terminations 12 2 - 1 - 9 Induced Terminations 1,260 735 19 348 71 87NON-RESIDENTS 16,153 8,556 985 701 5,634 277 Live Births 11,860 6,400 681 551 3,952 276 Spontaneous Terminations 27 13 3 1 10 - Induced Terminations 4,266 2,143 301 149 1,672 1RESIDENCE UNKNOWN 85 57 5 11 11 1 Live Births 6 1 1 2 1 1 Spontaneous Terminations 1 - - 1 - - Induced Terminations 78 56 4 8 10 -
*See Technical Notes: Spontaneous and Induced Terminations of Pregnancy Reporting.
Borough of OccurrenceTotal
87
Table PO17. Live Births, Spontaneous Terminations of ≥28 Weeks Gestation, and Induced Terminationsof Pregnancy by Borough of Residence and Occurrence, New York City, 2018*

97
PREGNANCY OUTCOMES
Table PO19. Induced Terminations of Pregnancy by Woman’s Marital Status, Age Group, and Racial/Ethnic Group, New York City, 2014-2018*
Table PO18. Induced Terminations of Pregnancy by Selected Characteristics and Woman’s Age Group, New York City, 2018*
Induced Termination of Pregnancy, All 49,759 1,416 2,676 12,833 14,259 10,238 6,047 2,288 2Racial/Ethnic Group
Hispanic 14,114 505 905 4,088 4,029 2,653 1,436 498 -Asian and Pacific Islander 2,998 43 102 646 819 697 509 182 -Non-Hispanic White 6,593 87 219 1,310 1,866 1,573 1,086 452 -Non-Hispanic Black 17,252 584 1,040 4,696 5,137 3,382 1,794 618 1Other 949 21 64 277 278 168 95 46 -Unknown 7,853 176 346 1,816 2,130 1,765 1,127 492 1
Marital StatusMarried 7,888 17 89 980 2,015 2,259 1,768 760 -Not married 34,943 1,254 2,312 10,365 10,405 6,348 3,199 1,059 1Other/Unknown 6,928 145 275 1,488 1,839 1,631 1,080 469 1
Gestational Age (Weeks)≤6 21,637 504 1,067 5,417 6,531 4,565 2,586 967 -7 - 8 14,083 366 726 3,599 4,045 2,925 1,766 656 -9 - 10 5,712 171 338 1,585 1,582 1,142 659 235 -11 - 12 2,923 117 199 807 779 535 341 145 -13 - 15 2,119 83 122 557 520 422 295 120 -16 - 20 2,033 101 142 573 506 377 228 106 -≥21 1,171 73 81 277 283 246 157 53 1Unknown 81 1 1 18 13 26 15 6 1
Type of Primary Termination ProcedureSuction curettage 31,075 826 1,603 7,780 8,905 6,551 3,908 1,501 1Sharp curettage / D+C 1,190 30 35 230 273 265 236 121 -Dilation and evacuation 3,497 158 230 940 862 664 458 185 -Intrauterine instillation 23 . . 2 4 10 4 3 -Hysterotomy / hysterectomy 15 . 2 5 5 2 1 . -Medical (non-surgical) 13,836 399 803 3,860 4,191 2,708 1,407 468 -Other 58 2 1 4 10 15 18 8 -Procedure Missing 65 1 2 12 9 23 15 2 1
*See Technical Notes: Spontaneous and Induced Terminations of Pregnancy.
Age Group (Years)
Total <18 18-19 20-24 25-29 30-34 35-39 ≥40 Not Stated
Marital Status (Percent)
Married 13.9 14.7 14.6 15.3 15.9
Not married 73.6 72.8 75.3 72.9 70.2
Other/Unknown 12.6 12.6 10.1 11.8 13.9
Age Group (Years)
<20 7,067 5,908 5,400 4,754 4,092
20 - 24 19,764 18,049 16,218 14,492 12,833
25 - 29 18,345 17,499 17,004 15,576 14,259
30 - 34 12,462 11,979 11,607 10,725 10,238
35 - 39 7,262 7,108 6,981 6,474 6,047
≥40 2,718 2,705 2,642 2,368 2,288
Unknown 2 2 2 2 2
Racial/Ethnic Group
Hispanic 20,371 18,139 16,718 14,443 14,114
Asian and Pacific Islander 4,547 4,012 3,490 3,047 2,998
Non-Hispanic White 9,401 9,652 9,139 7,471 6,593
Non-Hispanic Black 27,367 25,515 23,209 20,569 17,252
Other 2,477 2,155 1,711 1,930 949
Unknown 3,457 3,777 5,587 6,931 7,853
Total 67,620 63,250 59,854 54,391 49,759*See Technical Notes: Spontaneous and Induced Terminations of Pregnancy Reporting.
2014 2015 2016 20182017

98
PREGNANCY OUTCOMES
Table PO20. Characteristics of Birth and Pregnancy Outcomes by Neighborhood Poverty*†, New York City, 2009 and 2018
Birth Characteristics 2018 2009
Chg 2009 to 2018
(%) 2018 2009
Chg 2009 to 2018
(%) 2018 2009
Chg 2009 to 2018
(%) 2018 2009
Chg 2009 to 2018
(%)Births 23,582 28,380 -16.9 29,508 32,150 -8.2 22,262 25,654 -13.2 26,990 30,542 -11.6Population 2,317,327 2,568,779 -9.8 2,631,852 2,409,595 9.2 1,733,143 1,571,814 10.3 1,707,264 1,626,937 4.9
Birth Rate (per 1,000 population) 10.2 11.0 -7.9 11.2 13.3 -16.0 12.8 16.3 -21.3 15.8 18.8 -15.8Preterm Live Births (%) 8.0 9.0 -11.1 9.0 9.2 -2.2 9.5 9.7 -2.1 9.2 10.1 -8.9Low Birth Weight (%) 7.5 8.4 -10.7 8.4 8.4 0.0 9.1 8.4 8.3 8.8 9.5 -7.4Body Mass Indicator Normal (%) 61.5 63.1 -2.5 52.0 53.9 -3.5 47.0 51.0 -7.8 43.8 46.9 -6.6 Overweight/Obese (%) 32.8 30.8 6.5 42.9 40.5 5.9 48.1 43.0 11.9 51.2 48.0 6.7C-section (%) 34.0 36.2 -6.1 33.9 34.3 -1.2 33.9 31.3 8.3 29.7 29.0 2.4Multiple Births (%) 3.7 4.9 -24.5 3.4 3.4 0.0 3.3 3.1 6.5 3.1 3.0 3.3Breastfed Exclusively (%) 56.4 39.7 42.1 43.9 29.8 47.3 36.2 26.7 35.6 30.2 28.2 7.1Late or No Prenatal Care (%) 4.4 6.6 7.8 8.5Foreign Born (%)‡ 44.0 45.7 -3.7 59.0 61.4 -3.9 58.6 58.8 -0.3 43.9 42.8 2.6*Births with missing census tracts are excluded. New York City resident births only.
‡See Technical Notes: Geographical Units, Birthplace Presentation.†See Technical Notes: Neighborhood Poverty. Neighborhood poverty (based on census tract) is defined as percent of residents with incomes below 100% of the Federal Poverty
Low (<10%) Medium (10 to <20%) High (20 to <30%) Very High (≥30%)
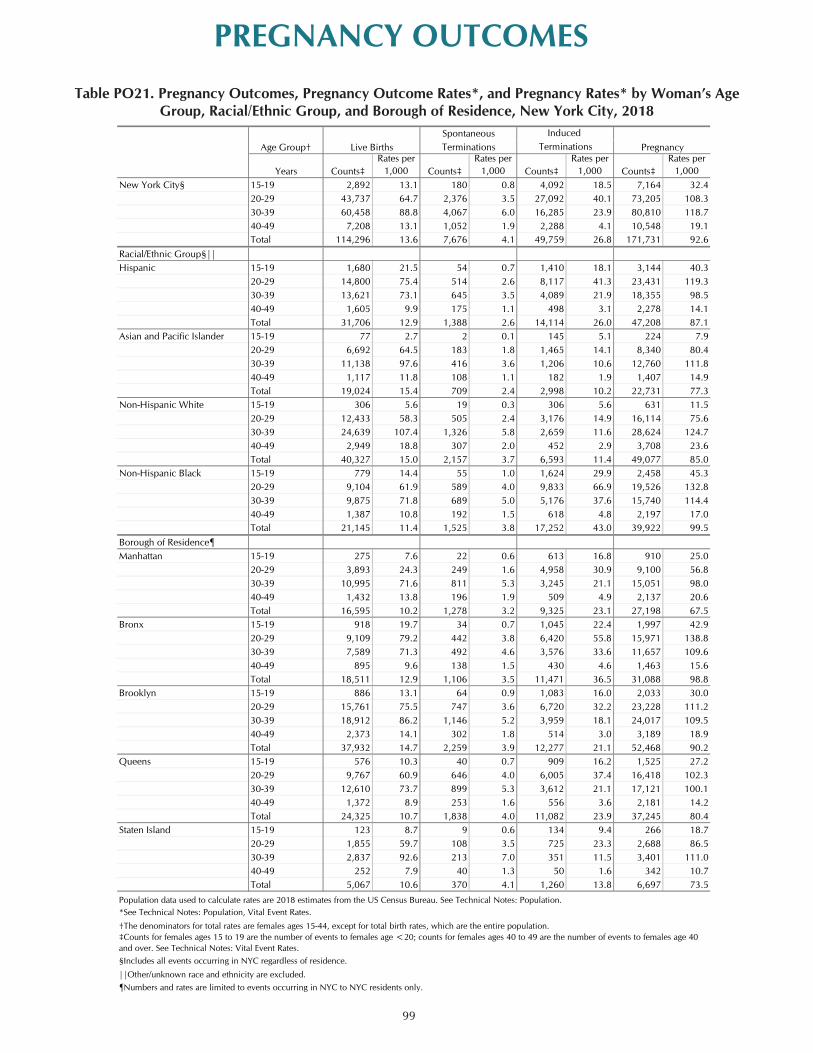
99
PREGNANCY OUTCOMES
Table PO21. Pregnancy Outcomes, Pregnancy Outcome Rates*, and Pregnancy Rates* by Woman’s Age Group, Racial/Ethnic Group, and Borough of Residence, New York City, 2018
SpontaneousTerminations
Years Counts‡Rates per
1,000 Counts‡Rates per
1,000 Counts‡Rates per
1,000 Counts‡Rates per
1,000New York City§ 15-19 2,892 13.1 180 0.8 4,092 18.5 7,164 32.4
20-29 43,737 64.7 2,376 3.5 27,092 40.1 73,205 108.330-39 60,458 88.8 4,067 6.0 16,285 23.9 80,810 118.740-49 7,208 13.1 1,052 1.9 2,288 4.1 10,548 19.1Total 114,296 13.6 7,676 4.1 49,759 26.8 171,731 92.6
Racial/Ethnic Group§||Hispanic 15-19 1,680 21.5 54 0.7 1,410 18.1 3,144 40.3
20-29 14,800 75.4 514 2.6 8,117 41.3 23,431 119.330-39 13,621 73.1 645 3.5 4,089 21.9 18,355 98.540-49 1,605 9.9 175 1.1 498 3.1 2,278 14.1Total 31,706 12.9 1,388 2.6 14,114 26.0 47,208 87.1
Asian and Pacific Islander 15-19 77 2.7 2 0.1 145 5.1 224 7.920-29 6,692 64.5 183 1.8 1,465 14.1 8,340 80.430-39 11,138 97.6 416 3.6 1,206 10.6 12,760 111.840-49 1,117 11.8 108 1.1 182 1.9 1,407 14.9Total 19,024 15.4 709 2.4 2,998 10.2 22,731 77.3
Non-Hispanic White 15-19 306 5.6 19 0.3 306 5.6 631 11.520-29 12,433 58.3 505 2.4 3,176 14.9 16,114 75.630-39 24,639 107.4 1,326 5.8 2,659 11.6 28,624 124.740-49 2,949 18.8 307 2.0 452 2.9 3,708 23.6Total 40,327 15.0 2,157 3.7 6,593 11.4 49,077 85.0
Non-Hispanic Black 15-19 779 14.4 55 1.0 1,624 29.9 2,458 45.320-29 9,104 61.9 589 4.0 9,833 66.9 19,526 132.830-39 9,875 71.8 689 5.0 5,176 37.6 15,740 114.440-49 1,387 10.8 192 1.5 618 4.8 2,197 17.0Total 21,145 11.4 1,525 3.8 17,252 43.0 39,922 99.5
Borough of Residence¶Manhattan 15-19 275 7.6 22 0.6 613 16.8 910 25.0
20-29 3,893 24.3 249 1.6 4,958 30.9 9,100 56.830-39 10,995 71.6 811 5.3 3,245 21.1 15,051 98.040-49 1,432 13.8 196 1.9 509 4.9 2,137 20.6Total 16,595 10.2 1,278 3.2 9,325 23.1 27,198 67.5
Bronx 15-19 918 19.7 34 0.7 1,045 22.4 1,997 42.920-29 9,109 79.2 442 3.8 6,420 55.8 15,971 138.830-39 7,589 71.3 492 4.6 3,576 33.6 11,657 109.640-49 895 9.6 138 1.5 430 4.6 1,463 15.6Total 18,511 12.9 1,106 3.5 11,471 36.5 31,088 98.8
Brooklyn 15-19 886 13.1 64 0.9 1,083 16.0 2,033 30.020-29 15,761 75.5 747 3.6 6,720 32.2 23,228 111.230-39 18,912 86.2 1,146 5.2 3,959 18.1 24,017 109.540-49 2,373 14.1 302 1.8 514 3.0 3,189 18.9Total 37,932 14.7 2,259 3.9 12,277 21.1 52,468 90.2
Queens 15-19 576 10.3 40 0.7 909 16.2 1,525 27.220-29 9,767 60.9 646 4.0 6,005 37.4 16,418 102.330-39 12,610 73.7 899 5.3 3,612 21.1 17,121 100.140-49 1,372 8.9 253 1.6 556 3.6 2,181 14.2Total 24,325 10.7 1,838 4.0 11,082 23.9 37,245 80.4
Staten Island 15-19 123 8.7 9 0.6 134 9.4 266 18.720-29 1,855 59.7 108 3.5 725 23.3 2,688 86.530-39 2,837 92.6 213 7.0 351 11.5 3,401 111.040-49 252 7.9 40 1.3 50 1.6 342 10.7Total 5,067 10.6 370 4.1 1,260 13.8 6,697 73.5
Population data used to calculate rates are 2018 estimates from the US Census Bureau. See Technical Notes: Population. *See Technical Notes: Population, Vital Event Rates.
†The denominators for total rates are females ages 15-44, except for total birth rates, which are the entire population.
§Includes all events occurring in NYC regardless of residence.
||Other/unknown race and ethnicity are excluded.¶Numbers and rates are limited to events occurring in NYC to NYC residents only.
‡Counts for females ages 15 to 19 are the number of events to females age <20; counts for females ages 40 to 49 are the number of events to females age 40 and over. See Technical Notes: Vital Event Rates.
Table 1. Pregnancy Outcomes, Pregnancy Outcome Rates*, and Pregnancy Rates* by Women’s Age Group, Racial/Ethnic Group, and Borough of Residence, New York City, 2018
Live BirthsInduced
TerminationsAge Group† Pregnancy

100
PREGNANCY OUTCOMES
Table PO22. Most Popular Baby Names by Sex, New York City, Selected Years
Table PO23. Most Popular Baby Names by Sex and Mother’s Racial/Ethnic Group, New York City, 2018
Girls1898 1928 1948 1980 1990 2000 2005 2010 2013 2014 2015 2016 2017 2018
1 Mary Mary Linda Jennifer Stephanie Ashley Emily Isabella Sophia Sophia Olivia Olivia Emma Emma2 Catherine Marie Mary Jessica Jessica Samantha Ashley Sophia Isabella Isabella Sophia Sophia Olivia Isabella3 Margaret Annie Barbara Melissa Ashley Kayla Kayla Olivia Emma Olivia Emma/Mia Emma Mia Sophia4 Annie Margaret Patricia Nicole Jennifer Emily Sarah Emily Olivia Mia Isabella Isabella Sophia Mia5 Rose Catherine Susan Michelle Amanda Brianna Isabella Madison Mia Emma Leah Mia Isabella Olivia6 Marie Gloria Kathleen Elizabeth Samantha Sarah Samantha Mia Emily Emily Emily Ava Ava Ava7 Esther Helen Carol Lisa Nicole Jessica Sophia Emma Leah Leah Ava Emily Leah Leah8 Sarah Teresa Nancy Christina Christina Nicole Nicole Leah Sofia Ava Chloe Leah Emily Sarah9 Frances Joan Margaret Tiffany Melissa Michelle Olivia Sarah Madison Sofia Madison Sarah Sarah Amelia
10 Ida Barbara Diane Maria Michelle Amanda Rachel Chloe Chloe Chloe Sarah Madison Abigail Chloe
Boys1898 1928 1948 1980 1990 2000 2005 2010 2013 2014 2015 2016 2017 2018
1 John John Robert Michael Michael Michael Michael Jayden Jayden Ethan Ethan Liam Liam Liam2 William William John David Christopher Justin Daniel Ethan Ethan Jacob Liam Jacob Noah Noah3 Charles Joseph James Jason Jonathan Christopher Joshua Daniel Jacob Liam Noah Ethan Jacob Ethan4 George James Michael Joseph Anthony Matthew David Jacob Daniel Jayden Jacob Noah Ethan Jacob5 Joseph Richard William Christopher David Daniel Justin David David Noah Jayden Aiden David Aiden6 Edward Edward Richard Anthony Daniel Anthony Matthew Justin Noah Daniel Matthew Matthew Lucas David7 James Robert Joseph John Joseph Joshua Anthony Michael Michael Michael David Daniel Matthew Lucas8 Louis Thomas Thomas Daniel Matthew David Christopher Matthew Matthew Alexander Daniel/Dylan Lucas Jayden Matthew9 Francis George Stephen Robert John Joseph Joseph Joseph Alexander David Aiden Michael Aiden Daniel10 Samuel Louis David James Andrew Kevin Nicholas Joshua Liam Matthew Michael Dylan Daniel Alexander
Rank
Rank
17
Rank Overall Hispanic NH-Black NH-White Asian & P.I. Overall Hispanic NH-Black NH-White Asian & P.I.1 Emma Isabella Ava Esther Chloe Liam Liam Noah David Muhammad2 Isabella Emma Madison Leah Olivia Noah Noah Liam Joseph Ethan3 Sophia Sophia Olivia Sarah Mia Ethan Matthew Aiden Michael Jasper4 Mia Mia Skylar Olivia Sophia Jacob Dylan Jeremiah Moshe Aiden5 Olivia Camila Amelia Chaya Emma Aiden Sebastian Josiah* Jacob Ryan6 Ava Sofia Zuri Emma Amelia David Jacob Logan* Benjamin Lucas7 Leah Luna Riley Rachel Emily Lucas Jayden Amir† Alexander Jayden8 Sarah Valentina Chloe Charlotte Evelyn Matthew Ethan Ethan† James Liam9 Amelia Abigail Isabella Chana Grace* Daniel Lucas Elijah William Noah
10 Chloe Amelia Zoey Sophia Isabella* Alexander Aiden Jayden Jack Daniel * Tied ranks† Tied ranksNH=Non-Hispanic; P.I.=Pacific Islander. Mothers of other, multiple, or unknown racial/ethnic group are not shown.
Girls Boys

SUMMARY OF VITAL STATISTICS 2018
THE CITY OF NEW YORKAppendix B
Technical Notes and New York City Vital Event Certificates
bureau of ViTal sTaTisTics, new york ciTy deparTmenT of healTh and menTal hygiene
125 worTh sTreeT, cn 7, new york, new york, 10013

102
TECHNICAL NOTES, 2018POPULATION
CITYWIDE POPULATION
The 2018 NYC population estimates used in tables and figures are based on the US Census Bureau 2018 Vintage population estimate as extracted from the Census website (https://www.census.gov/data/datasets/2018/demo/popest/counties-detail.html/cc-est2018-alldata-36.csv). The 2018 US Census population estimate for New York City (NYC) is 8,398,748. See Table PC2 for 2018 NYC population estimates by age, mutually exclusive race and Hispanic origin, and sex. Population data used to compute rate trends (2009-2018), regardless of NYC geography presented, was estimated by DOHMH, Epidemiology Services, using the methodology found below under Community District Population Estimates. Population estimates for 2012-2018 are from Census Bureau vintage files from each year, respectively.
RACE/ETHNICITY CATEGORIES
According to the definition of race categories used in the 2010 Census, “White” refers to a person having origins in any of the original peoples of Europe, the Middle East, or North Africa. It includes people who indicated their race(s) as “White” or reported entries such as Irish, German, Italian, Lebanese, Arab, Moroccan, or Caucasian. “Black or African American” refers to a person having origins in any of the Black racial groups of Africa. It includes people who indicated their race(s) as “Black, African American, or Negro”. “American Indian or Alaska Native” refers to a person having origins in any of the original peoples of North and South America (including Central America) and who maintains tribal affiliation or community attachment. This category includes people who indicated their race(s) as “American Indian or Alaska Native” or reported their enrolled or principal tribe. “Asian” refers to a person having origins in any of the original peoples of the Far East, Southeast Asia, or the Indian subcontinent, including, for example, Cambodia, China, India, Japan, Korea, Malaysia, Pakistan, the Philippine Islands, Thailand, and Vietnam. It includes people who indicated their race(s) as “Asian” or reported entries such as “Asian Indian,” “Chinese,” “Filipino,” “Korean,” “Japanese,” “Vietnamese,” and “Other Asian” or provided other detailed Asian responses. “Native Hawaiian or Other Pacific Islander” refers to a person having origins in any of the original peoples of Hawaii, Guam, Samoa, or other Pacific Islands. It includes people who indicated their race(s) as “Pacific Islander” or reported entries such as “Native Hawaiian,” “Guamanian or Chamorro,” “Samoan,” and “Other Pacific Islander” or provided other detailed Pacific Islander responses. “Some Other Race” includes all other responses not included in the White, Black or African American, American Indian or Alaska Native, Asian, and Native Hawaiian or Other Pacific Islander race categories described above. Respondents reporting entries such as multiracial, mixed, interracial, or a Hispanic or Latino group (for example, Mexican, Puerto Rican, Cuban, or Spanish) in response to the race question are included in this category.
Hispanics or Latinos are those people who classified themselves in one of the specific Spanish, Hispanic, or Latino categories listed on the Census 2010 questionnaire -”Mexican,” “Puerto Rican,” or “Cuban”-as well as those who indicate that they are “other Hispanic, Latino, or Spanish origin.” People who do not identify with one of the specific origins listed on the questionnaire but indicate that they are “another Hispanic, Latino, or Spanish origin” are those whose origins are from Spain, the Spanish-speaking countries of Central or South America, or the Dominican Republic. The terms “Hispanic,” “Latino,” and “Spanish” are used interchangeably.
Origin can be view as the heritage, nationality group, lineage, or country of birth of the person or the person’s parents or ancestors before their arrival in the United States.
People who identify their origin as Spanish, Hispanic, or Latino may be of any race. Thus, the percent Hispanic should not be added to percentages for racial categories.
COMMUNITY DISTRICT POPULATION ESTIMATES
Community districts were established by City Charter in 1969 for the delivery of city services. Population data for these districts are compiled by Department of City Planning from census tract and census block data. The sum of the community district populations in each borough may not equal the borough population or the citywide population because community districts may cross borough boundaries.
2018 Community District estimates
The 2018 Community District population estimates were calculated based on the Census postcensal estimate for 2018 released in June 2019 (See Historical Technical Notes for previous years’ methods).
LIFE EXPECTANCY
For life expectancy computations, single-year age group populations were based on decennial census counts. Life expectancies for 2001-2009 have been updated from the previous Summary using linear interpolation of single-year age group populations based on 2000 and 2010 census counts. Citywide life expectancies by sex and race/ethnicity for 2010 are calculated based on 2010 census population. Population data for life expectancies for 2011-2018 were extrapolated based on single-year age groups of Census population, 2000 and 2010. Life expectancy for Asians and Pacific Islanders is not displayed because the required single year of age population denominators are too small to produce reliable estimates. Also See Technical Notes: Deaths, Life Expectancy.
AGE CATEGORIES
Since 2010, rates of teen events (ages 15-17, 18-19) require population data with 22 age groups as opposed to the standard 18 provided by the census. As a result, 22-age group population estimates are calculated and provided by Bureau of Epidemiology Services based on Census Bureau’s estimates.

103
TECHNICAL NOTES, 2018
DEMOGRAPHICS/CHARACTERISTICS OF VITAL EVENTS AGE AT DEATH For ages greater than one year, decedent’s age is based on age at last birthday. Unknown ages are recoded to mean age at death but are extremely rare.
RACE, ANCESTRY, AND ETHNIC GROUPRace and ancestry are two separate items on the certificates. A relative of the decedent usually reports this information to the funeral director for the death certificate. As of 2003 and 2008, the death and birth certificates, respectively, allow for the selection of multiple races. Responses are coded following rules from the National Center for Health Statistics (NCHS). The ordered selection rules for defining ethnic group first assign Puerto Rican or other Hispanic ethnicities based on ancestry, regardless of race. Then, those of other or unknown ancestries are classified by race as Asian and Pacific Islander, non-Hispanic White, non-Hispanic Black, and other/multiple race/unknown.
NCHS defines ancestry as the nationality, lineage, or country where the subject’s ancestors were born before their arrival in the United States. If a religious group is reported, NCHS instructions are to ask for the country of origin or nationality. New York City receives enough certificates reporting Jewish or Hebrew ancestry to warrant inclusion in these tables, notwithstanding the religious meaning of the terms. Persons whose race is Black and whose ancestry is American are classified as being of African American ancestry.
Infant Mortality
Infant’s ethnic group is determined from mother’s ancestry and race reported on the infant’s birth certificate. In the absence of corresponding birth certificate for an infant death, the infant’s race and ancestry information on the infant’s death certificate is used to assign an ethnic group. When rates are computed by infant characteristics (e.g. sex of infant or hospital/location of death), such characteristics are drawn from the death certificate, except for those characteristics that are either not indicated on the death certificate or only available on the child’s birth certificate (e.g. mother’s prenatal care, infant’s birth weight, and gestational age). In the absence of a birth certificate, demographics are limited to those available on the death certificate. Infants who died in New York City who were born elsewhere are classified as unmatched in Appendix A: Tables IM2 and IM7.

104
TECHNICAL NOTES, 2018
GEOGRAPHICAL UNITSRESIDENCY STATUS IN DATA PRESENTATION
Tables that stratify by location of residence (e.g., borough) separate data for nonresidents and residence-unknown categories. See Appendix A: Table M1 as an example. Tables that do not stratify by location of residence combine all deaths registered in New York City, regardless of residence.
Vital events that occurred to New York City residents while outside of New York City are not included in this report, with the exception of Life Expectancy. Life expectancy calculations use national data from the NCHS (Summary Figures 1-2; Appendix A Tables M24-M25) or New York State of Health (Summary Figures 3-4), including deaths to New York City residents that occurred outside of New York City. For more information, see Life Expectancy.
BIRTHPLACE PRESENTATION
Mortality Data
Decedent’s birthplace is reported by country. Puerto Rico, American Samoa, Northern Mariana Islands, US Virgin Islands and Guam are included in United States.
Mother’s Birthplace (used for births and infant mortality data)
Starting in 2006, mother’s birthplace is categorized as: “United States, including its territories” (Puerto Rico, the US Virgin Islands, American Samoa, Northern Mariana Islands, and Guam), “Foreign,” or “Not Stated.” When mother’s birthplace is classified by country-specific categories, Puerto Rico is included in the United States counts, as well as reported individually so as to identify any emergent health issues.
BOROUGH OF RESIDENCE
Borough of residence and other geographic classifications are based on the usual residence reported on the certificate.
COMMUNITY DISTRICT (CD)
Community districts were established by City Charter in 1969 for the delivery of city services. There are 59 community districts in New York City. Since 1985, assignments to geographic areas smaller than borough, such as community district, are made through the Geosupport Program, which is developed and maintained by the Department of City Planning. Additional information on community district geography can be found at Community Portal (http://www1.nyc.gov/site/planning/community/community-portal.page).
NEIGHBORHOOD POVERTY INDICATOR
Since 2012, neighborhood poverty disparities have been presented in the Summary of Vital Statistics. The neighborhood poverty indicator is the agency-recommended indicator for monitoring socioeconomic health disparities. The summary reports poverty at the census tract level. Each census tract is assigned to a neighborhood poverty category based on the percent of the census tract population living below the federal poverty level. The four neighborhood poverty categories are:
Low:<10% of the population
below poverty
Medium:10-19% of the population
below poverty
High:20-29% of the population
below poverty
Very High:≥30% of the population
below poverty
The denominator of any rate by neighborhood poverty category contains the combined populations of census tracts falling within a category. The numerator contains the summed number of vital events occurring to residents of the census tracts falling within a category. Additional information on poverty indicator can be found at http://www.hsph.harvard.edu/thegeocodingproject/.

105
TECHNICAL NOTES, 2018
Community Districts and Boroughs, New York City
SI03
SI02
SI01
QN13
QN07
QN12
BK18
QN11
QN05
QN08
QN10
BX12
BX10
BK05
QN14
QN01
QN02
BK01
BK15
BX09
BK10
BK07
QN09
BK11
BX11
BK12
BX08
BK17
BK13
BK06
QN03
BK14
QN06
BK02BK03
MN12
QN04
BX01 BX02
BX04
BK04
BX07
BK16
MN08
BX03
BK08
BK09
MN03
BX05
MN02
MN07
MN04
BX06
MN05
MN11
MN09MN10
MN06
MN01
QN14
Community Districts and Boroughs,New York City
ManhattanBronxBrooklynQueensStaten IslandNeighborhood Health Action CenterParks and Airports

106
VITAL EVENT RATESDEATH RATES
Death Rate, all causes per 1,000 population Death Rate, specified causes per 100,000 population
Death Rate, age and sex specific per 1,000 population Death Rate, age -adjusted per 100,000 population
The number of deaths per 100,000 population. Sex and race/ethnicity specific death rates are adjusted using the US standard population age distribution eliminating the effect of differences in population age composition, and allowing comparisons over time and between geographic areas. In this publication, 5 age groups are used for calculation: 0-24, 25-44, 45-64, 65-84, 85+, except for Appendix Table M2 which uses the age groups in the table.
Maternal Mortality Ratio – World Health Organization Definition (Appendix A Table M13)
*Deaths of a woman while pregnant or within 42 days of termination of pregnancy from any cause related to or aggravated by pregnancy or its management (ICD10 codes: O00-O95, O98-O99, A34)
Perinatal Mortality Ratio
INFANT MORTALITY RATES
Infant Mortality Rate Neonatal Mortality Rate
Early Neonatal Mortality Rate Late Neonatal Mortality Rate
Infant deaths counted in the numerator and live births counted in the denominator are defined by the same calendar year. Some infants counted in the numerator were born in the preceding year and some counted in the denominator may die in the following year.
PREGNANCY OUTCOME RATES
Fertility Rate Pregnancy Rate
BIRTH RATESTotal birth rate Age-specific birth rate
Total spontaneous termination rate Age-specific spontaneous termination rate
x 1,000Number of live births
Deaths to infants < 1 yr old x 1,000
Number of live births
Deaths to infants < 28 days of life
x 1,000Number of live births
Deaths to infants < 7 days of life x 1,000
Number of live births
Deaths to infants 7-27 days of life
x 1,000Female population aged 15 to 44 years
Live births x 1,000
Female population aged 15 to 44 years
∑ (Births, Spontaneous, Induced Terminations)
x 1,000Total population regardless of age or sex
Total births x 1,000
Female population of specific age group Births among specific age group
x 1,000Female population ages 15 to 44 years
Total spontaneous terminations x 1,000
Female population of specified age group
Spontaneous terminations among specific aged females
x 1,000Fetal deaths 28 weeks and over + live births
Fetal deaths 28 weeks and over + infant deaths under 7 days
x 100,000Live births
Deaths due to complications of pregnancy, childbirth and the puerperium occurring within 42 days of delivery
x 1,000Population, specified age group and sex
Deaths to persons of specified age group and sex
x 100,000Population
Deaths to specific causes (specified ICD10 codes) x 1,000
Population
Deaths to all causes
TECHNICAL NOTES, 2018

107
TECHNICAL NOTES, 2018
Total induced termination of pregnancy rate Age-specific induced termination of pregnancy rate
Fetal-infant Mortality Rate (FIMR)
Pregnancy Outcome Counts and Rates
Pregnancy outcome (birth, spontaneous termination, or induced termination) counts and rate numerators use the number of events to women of all ages. For example, the birth rate includes all births in a population, regardless of the mother’s age. The denominator for these rates differs by event, consistent with national standards. The birth rate denominator is the number of males and females of all ages. The denominator for spontaneous or induced termination rates is the number of females aged 15-44 years. The counts and numerator used in age-specific pregnancy outcome rates for the youngest age category (teens 15-19), is the number of events to women in the population under age 20, relative to the denominator of women in the population ages 15 to 19 (Table PO23, Appendix A). Similarly, the numerator of the oldest age category (40-49) includes events to all women in the population over the age of 40, relative to the denominator of women in the population ages 40-49. NYC first reported these age-specific rates in the 2011 Pregnancy Outcomes Report and applied a denominator of women in the population ages 40-49 as opposed to 40-44 due to the increased number of events occurring among women ages 45-49. The numerator used for the youngest age category for teen pregnancy outcomes (15-17 in Table PO10 Appendix A) is the number of events to women in the population under age 17, relative to the denominator or women in the population ages 15-17.
DEATHSDEATH CERTIFICATE (see copies in back of Appendix B)
There are two forms, one for natural causes and one for medical examiner cases. The current revisions of the death certificate, implemented in 2003, is based on the recommended 2003 US Standard Certificate of Death (http://www.cdc.gov/nchs/data/dvs/DEATH11-03final-ACC.pdf).
Natural cause practitioner certificates – Most deaths are due to natural causes.
Medical examiner certificate of death – When the cause of death is an accident, homicide, suicide, or due to other certain circumstances (approximately 15% of deaths), the New York City Office of the Chief Medical Examiner (OCME) completes the medical examiner certificate of death and supplementary report.
For natural cause certificates, the Electronic Vital Events Registration System’s (EVERS, now replaced by eVital as of October 15, 2018) Electronic Death Registration System (EDRS) became available for voluntary use by hospitals in 2005. In January 2010, EDRS reporting became mandatory for medical examiner certificates. In April 2010, EDRS reporting became mandatory for hospitals reporting >25 deaths/year.
The two forms are similar. Both collect important information pertaining to the fact of death (person, place, and time of death). Both collect “personal particulars” which include items such as decedent’s Social Security number, address, birthplace, education, marital status, informant’s information, and place of disposition. The personal particulars are typically provided by a family member of the decedent through the funeral home. Both collect cause of death, which is completed by the physician or a medical examiner. On the natural cause certificate, the cause of death is entered on the confidential medical report. On the OCME certificate, the cause of death is entered on the death certificate itself. In addition to cause of death, the OCME certificate collects information on the circumstances of external causes of death. The OCME certificate indicates manner of death: natural, accident, homicide, suicide, or undetermined. The confidential medical report information is for the compilation of public health statistics and scientific purposes only.
DEATH REPORTING
The death events reported are based on certificates filed with the New York City Department of Health and Mental Hygiene (DOHMH) for vital events occurring in or en-route to New York City, regardless of individual residency status, in a particular year. Any events registered after file closure (typically occurring within 5 months of year-end) are excluded from this report. Such late registrations are rare.
Death certificates must be filed within 72 hours of death or finding the body. During 2017, 94% of death certificates were filed electronically using the Electronic Vital Events Registration System (EVERS, now replaced by eVital as of October 15, 2018). Since the June 1993 revision of the death certificate, decedent race and ancestry information is reported by funeral directors.
DEATH RATES
See Vital Event Rates.TYPE OF PLACE OF DEATH
“Hospital” includes residential units and other special facilities within the hospital. “Nursing home” includes only sites licensed as Extended Care Facilities by New York State. “Home” refers to the decedent’s residence, and includes private houses and apartments, group quarters for special populations, homes for adults, and other long-term residential sites.
x 1,000Female population age 15 to 44 years
Total induced terminations x 1,000Female population of specified age group
Induced terminations among specific aged females
x 1,000[Live births (birthweight ≥ 500 grams)]
[Fetal deaths (weight ≥ 500 grams and gestational age ≥ 24 weeks) + infant deaths (under 1 year old)]
108
TECHNICAL NOTES, 2018CAUSE OF DEATH REPORTING
The cause of death on the death certificate is completed by a physician, medical examiner or, as of January 16, 2012, by a nurse practitioner. The clinician is required to provide the complete sequence of events and/or medical conditions leading to the death. These include the following:
immediate cause – the specific condition that directly preceded the death.
intermediate cause(s) – the significant condition(s) that preceded and gave rise to the immediate cause of death.
underlying cause – the disease or condition that set off the chain of events leading to death.
For further information on how cause of death should be documented, visit https://www1.nyc.gov/site/doh/providers/reporting-and-services/evital.page.
CAUSE OF DEATH- QUALITY IMPROVEMENT INITIATIVE
The Office of Vital Statistics (OVS) initiated a program to improve quality of cause of death data in 2009, affecting mortality trends by causes of death. See the NYC Summary of Vital Statistics 2010, Special Section, for more information.
CAUSE OF DEATH CODING
Since 2008, the reported causes of death are coded using the NCHS automated coding software package SuperMICAR, which classifies conditions according to the International Classification of Diseases (ICD) published by the World Health Organization. A single underlying cause is assigned based on the reported chain of events leading to death. Standardized codes allow for national and international comparisons. Causes of death that cannot be coded by SuperMICAR are investigated and coded by nosologists.
Prior to 2007, a large proportion of accidental drug related deaths (X40-X42, X44) were miscoded as chronic drug use (F11-F16, F18-F19). For a full explanation, see the 2007 Annual Summary of Vital Statistics Special Report: NYC Changes from Manual to Automated Cause of Death Coding, pages 73-75.
Table M1 is based on the NCHS List of 113 Selected Causes of Death. Some causes have been added to or dropped from these tables based on their frequency and importance in New York City.
Death trends across ICD code revision years may change as a fact of the change in ICD codes and coding rules. These should be interpreted with caution.
COMPARABILITY RATIO
National comparability ratios, last updated in 2003, reflect discontinuities in trends for the cause of death when a new version of the ICD is implemented. They are presented in the Appendix A Table M1 to explain changes in following the implementation of the ICD-10 coding system in January 1999.
Comparability ratios measure the net effect of ICD-10 on each cause of death. NCHS determined the causes of death under ICD-10 and ICD-9 for more than 2.3 million 1996 US mortality records and calculated the ratio:
Deaths from cause ICD9
Deaths from cause ICD10
More information on the ICD-10/ICD-9 comparability ratio can be found at Comparability of Cause-of-death Between ICD Revisions (http://www.cdc.gov/nchs/nvss/mortality/comparability_icd.htm).
SMOKING- AND ALCOHOL-ATTRIBUTABLE MORTALITY
Smoking- and alcohol-attributable deaths represent the number of New York City deaths attributed to exposure to smoking and alcohol respectively.
SMOKING-ATTRIBUTABLE MORTALITY (SAM)
SAM was calculated using CDC’s Adult SAMMEC (Smoking-Attributable Mortality, Morbidity, and Economic Costs) program using an attributable fraction formula. New York City sex-specific smoking prevalence was estimated from the New York City DOHMH Community Health Survey (CHS) and computed by the Bureau of Epidemiology. The relative risks (RR) of death for current and former smokers ≥35 years of age for 19 smoking-related diseases was estimated from American Cancer Society’s Cancer Prevention Study. The smoking-attributable fraction (SAF) for each smoking-related disease and sex is calculated using the following formula:
SAF = [(p0 + p1(RR1) + p2(RR2)) - 1] / [p0 + p1(RR1) + p2(RR2)]
where p0 is the percentage of adult never-smokers in New York City; p1 is the percentage of adult current smokers in New York City; p2 is the percentage of adult former-smokers in New York City; RR1 is the relative risk of death for adult current smokers relative to adult never-smokers; and RR2 is the relative risk of death for adult former-smokers relative to adult never-smokers.
To estimate the SAM, the age- and sex-specific SAFs are multiplied by the number of deaths for each smoking-related disease. Specifically, the number of deaths for each sex and 5-year age category was multiplied by the SAF:
SAM = Number of deaths x SAF
Summing across age categories provides the sex-specific estimate of SAM for each disease. Total SAM is the sum of the sex-specific SAM estimates. A detailed description of the methodology is available at https://chronicdata.cdc.gov/Health-Consequences-and-Costs/Smoking-Attributable-Mortality-Morbidity-and-Econo/w47j-r23n/data.

109
TECHNICAL NOTES, 2018Beginning 2014, substantial changes in SAM calculation were made based on the 2014 Surgeon General Report that used more age strata and updated relative risks. Four new conditions were also added – colorectal cancer (C18-C20), liver cancer (C22), diabetes (E10-E14) and tuberculosis (A16-A19). In addition, C66 (cancer of ureter) to kidney cancer was added – this was inadvertently omitted when CDC analyses began being based on ICD-10 several years ago. See chapter 12 of the 2014 Surgeon General Report at the following link: http://www.surgeongeneral.gov/library/reports/50-years-of-progress/sgr50-chap-12.pdf
ALCOHOL-ATTRIBUTABLE MORTALITY (appendix a Table m14)
Alcohol-attributable deaths in Appendix A Table M14 represent the number of New York City deaths attributed to alcohol. Alcohol-attributable mortality (AAM) was calculated using the Alcohol-Related Disease Impact (ARDI) program by applying an alcohol-attributable fraction (AAF). For conditions that, by definition, are caused by alcohol use, the AAF was set equal to 1.0. For other conditions, especially injuries, ARDI directly estimated the AAF based on direct observations about the relationship between alcohol and a given health outcome. For most chronic conditions, the AAF was indirectly estimated using New York City alcohol prevalence data from the CHS combined with pooled risk estimates from large meta-analyses using the following formula:
AAF = [p(RR – 1)] / [1+ (p(RR – 1)]
where p is the percentage of New York City men and women age 20 years and older who consume alcohol at a specified level of average daily alcohol consumption within a given year, and RR is the likelihood of death from a particular condition at a specified level of average daily alcohol consumption. To estimate AAM, AAFs were multiplied by the number of New York City deaths for specific causes defined by the CDC’s National Center for Chronic Disease Prevention and Health Promotion. A detailed description of the methodology is available at http://nccd.cdc.gov/DPH_ARDI/default/default.aspx.
Beginning in 2014, the cut points of average drinks per day to define alcohol consumption as “Low”, “Medium”, and “High” were revised slightly based on Ridolfo and Stevenson’s study in 2001 and the study of Bagnardi et al. in 2001. The death data are stratified by sex and five-year age groups. Generally, chronic causes of death are collected for people aged 20 years and older and acute causes of death for people aged 15 years and older. However, there are several exceptions to this rule. See Alcohol Related Disease Impact (ARDI) Custom Data User Manual at the following link for details. http://nccd.cdc.gov/DPH_ARDI/Info/ARDI_Custom_Data_User_Manual_2014.pdf
COMPLICATIONS OF MEDICAL AND SURGICAL CARE (appendix a Tables m1, m22)
With the 10th revision of the ICD coding system, complications of medical and surgical care are no longer classified as accidents and are now shown separately from accidents.
DRUG-RELATED DEATHS
“Mental and behavioural disorders due to the use of or poisoning by psychoactive substance excluding alcohol and tobacco” is based on NCHS standard cause of death definitions using underlying causes as a basis for categorizing deaths and presented among the leading causes of death. It is also called “Use of or poisoning by psychoactive substance” or “Drug Use/Poisoning” combining underlying chronic drug-use ICD-10 codes (F11-F16, F18-F19) and accidental (unintentional) drug-poisoning ICD-10 codes (X40-X42, X44) to estimate overall drug-related deaths. This definition is found in Mortality Tables 1-4, Figure 15, Appendix A Tables M1, M7-M12, and M26. “Accidental poisoning by psychoactive substances, excluding alcohol and tobacco,” the “accidental” subset of underlying codes (X40-X42, X44) are reported in Appendix A Tables M1, M13, and M18. “Mental and behavioural disorders due to the use of psychoactive substance excluding alcohol and tobacco,” the “chronic” subset of underlying codes (F11-F16, F18-F19) is found in Appendix A Table M1 and M13. However, please use “accidental” (unintentional) and “chronic” subset trend data with caution as changes from manual to automated ICD coding resulted in a redistribution of chronic causes to acute in 2007 and going forward. For more information on coding error, please see Cause of Death Coding.
EXTERNAL CAUSES OF DEATH (Mortality Figures 18-21; Appendix A Tables M18-M23)
External causes of death include accidents, suicide, assault, legal intervention, events of undetermined intent, operations of war and their sequelae, and complications of medical and surgical care. The Office of Chief Medical Examiner determines the cause and manner of death in such cases. For the purpose of statistical analysis, whether a cause is defined as external depends on the ICD code assigned as the underlying cause of death and may not agree with the manner of death reported.
Sometimes a cause of death has not been established when the statistical file is closed. Such deaths are classified as “pending final determination” and may later be classified.
Deaths classified as “events of undetermined intent” are considered due to external causes for the purpose of statistical analysis.
Information on errors in coding external causes of death prior to 2007 is described on page 108: Cause of Death Coding.
FATAL OCCUPATIONAL INjURIES (Appendix A Table M17)
Appendix A, Table M17 is based on US Department of Labor’s Bureau of Labor Statistics. These deaths, unlike NYC Vital statistics, are based on the location of the injury, regardless of the residence of the decedents or location of the death. Note that these deaths may or may not occur at the time of injury, they can occur subsequently. The industry in which the decedent worked and was injured is coded based on the North American Industry Classification System (NAICS). Comparisons by industry before and after 2003 are discouraged because of the substantial coding differences.
For all NYC occurring deaths due to external causes, the Bureau of Vital Statistics (BVS) reviews autopsy and other reports to determine if the injury occurred at work. Definitions and terminology are based on US Department of Labor’s Bureau of Labor Statistics, which may differ from other definitions used in vital statistics.

110
TECHNICAL NOTES, 2018
HEART DISEASE DEATHS
See the NYC Summary of Vital Statistics 2010 Mortality – Special Section: Cause of Death Quality Improvement Initiative for information on the initiative’s impact on cause of death reporting, particularly heart disease reporting.
HIV AND AIDS MORTALITY
Beginning 1999, with the 10th revision of the ICD code, deaths due to HIV disease (ICD-10 codes B20-B24) are characterized by the resulting disease or condition, replacing AIDS and other HIV infections in ICD 9th revision.
HOMICIDE (Mortality Figure 21; Appendix A Table M20)
A homicide is defined as the action of one person causing the death of another regardless of intent (e.g., whether self-defense or justifiable legal intervention). Annual counts of homicides reported by the New York City Police Department (NYPD) differ from those of the Bureau of Vital Statistics (BVS) for a number of reasons outlined below. Nonetheless, reported trends are similar. All homicides are medical examiner (ME) cases.
NYPD reports homicides as counts of Murder and Non-Negligent Manslaughter using rules and procedures from the Federal Bureau of Investigation’s Uniform Crime Reporting System (UCR). The count includes deaths determined to be both criminal and satisfying the UCR guidelines. NYPD judges some homicides as justifiable and reports these separately to the FBI (Federal Bureau of Investigation). BVS reports a death as a homicide based on the ICD-10 system. ICD-10 defines legal intervention as “injuries inflicted by police or other law-enforcing agents ... in the course of arresting or attempting to arrest ... and other legal action.” Since 2003, deaths from legal intervention have been reported separately in Appendix A, Tables M1 and M20 and are excluded from the homicide counts in Tables M11 and M12.
NYPD Murder and Non-Negligent Manslaughter statistics count all murder crimes known to have been committed in New York City regardless of where the death occurred. Note, the crime may or may not have occurred at the time of death; death can occur subsequently and therefore potentially in a different jurisdiction than the murder crime. BVS reports all homicide deaths known to have occurred in New York City regardless of where the crime was committed.
In its annual count, the NYPD includes homicides known to have occurred within that calendar year by the second week of January of the following year. Any death determined to be a criminal murder outside of that period will be counted in the year that the determination is made. BVS reports homicide by the date of the death and the annual count includes any cases reported until the file closes for the year (approximately 5 months after the end of the year).
Sometimes death results from a crime many years after the crime was committed. Other times, a death may be determined a crime years after the death. In either situation, the ME may determine the death a homicide. If classified as a criminal homicide, NYPD will count the death in the year that the determination is made. However BVS will report the homicide by the date of death. In cases where a death is reclassified a homicide after the file closes, the death will be recorded as a homicide on the death certificate, but this change will not be reflected in any counts of homicides for the year of death or any other years.
LIFE EXPECTANCY (Mortality Figures 1-4; Appendix A Tables M24, M25)
Life expectancy tables summarize the effect of mortality rates prevailing at a specific time on persons being born or living at that time. Tables may be computed for population subgroups, most often males, females, and race groups. The calculation requires counts and mortality figures for the desired subgroups. Life expectancy is estimated by ethnic group instead of race to ascertain differences among Hispanics, non-Hispanic Whites and non-Hispanic Blacks. Life expectancy tables by race/ethnicity for New York City are generally presented for census years when accurate population data are available. The mortality experience for the census year, the year before, and the year after is used to smooth statistical variation (Table M24). However, due to the increasing interest in disparities by race/ethnicity in life expectancy and changes in the population in New York City, we began calculating annual life expectancy by race/ethnicity in 2011. Life expectancies in Figures 1-2, Appendix A Tables M24, M25 are calculated by complete life tables (for a single year of age). Life expectancies in Figures 3-4 are calculated by abridged life tables (age groups). The number of Asian and Pacific Islander deaths is too small to generate reliable life expectancies and therefore are not presented either in Mortality Figure 2 or Appendix A Table M24.
The World Trade Center disaster deaths are not included in calculation of life expectancy.
Appendix A Table M25 presents annual life expectancy by age and sex providing trend information.
Historical Hispanic ancestry data and life expectancy estimates should be interpreted with caution. In addition to changes in collection of Hispanic ancestry information, Hispanic immigration patterns may result in overestimated life expectancy if Hispanics move out of the US before death at a greater rate than other ethnic groups. The Hispanic population tends to be younger than other ethnic groups, which may lead to underestimates of Hispanic death rates and overestimates of Hispanic life expectancy.
MATERNAL DEATH AND MATERNAL MORTALITY (Appendix A M13)
Deaths due to “Maternal Causes” meet the World Health Organization’s definition of maternal mortality: “death of a woman while pregnant or within 42 days of termination of pregnancy from any cause related to or aggravated by the pregnancy or its management ...” With the 10th revision of the ICD coding system, this category includes codes O00-O95, O98-O99 and A34 (obstetrical tetanus). “Pregnancy, childbirth and the puerperium” (O00-O99) includes deaths to women that occur outside of the time limitation defined by the World Health Organization (WHO).
111
TECHNICAL NOTES, 2018
MOTOR VEHICLE DEATHS (Mortality: Figure 19, Appendix A Table M18)
The Bureau of Vital Statistics (BVS) methodology for counting Motor Vehicle Deaths differs from that of the Department of Transportation (DOT) and NYPD in several ways. First, DOT and NYPD include deaths resulting from motor vehicle crashes that happen within NYC city limits, regardless of where the death occurred, whereas BVS reports deaths that happen within NYC city limits, regardless of where the crash occurred. Second, in cases where serious injury suffered during a motor vehicle crash results in death from injury sequelae (e.g., death occurs one month later) the fatality will be counted by DOT and NYPD for the month during which the crash occurred. However, BVS will report that same death by the actual date of death, not the date of injury occurrence. Third, DOT and NYPD do not include deaths resulting from illness while operating a motor vehicle in their traffic fatality count, while BVS does, consistent with the standardized NCHS approach. Lastly, DOT and NYPD reports do not include deaths which occur on private roadways, such as driveways, while BVS reports do include these. All of the above distinctions apply to counts of non-motor vehicle-involved bicyclist deaths, as well.
PREMATURE DEATHS (Mortality: Figures 10-17, Tables 3-4; Appendix A Table M9-10)
Premature deaths are deaths that occur before a person reaches an expected age, for instance, age 65 or age 75. Premature death rates in the NYC Annual Summary of Vital Statistics use 65 as the expected age. The number of deaths or deaths by select cause(s) relative to the <65 population in the same geographic area are used to calculate the premature death rate.
WORLD TRADE CENTER (WTC) DEATHS
Since 2008, any deaths during the reporting year identified as late-effect WTC deaths are counted in the year of the confirmed death report and in Appendix A, Table M1 under Assault (homicide): ICD-10 Code U02. The total number of WTC deaths is 2,752. The number does not include 3 deaths that occurred outside of NYC. Unless otherwise specified, WTC deaths occurring in 2001 are generally not included in Summary tables and figures due to the effect this large number would have on year-to-year trends.
YEARS OF POTENTIAL LIFE LOST (Mortality Appendix A Table M26)
Years of potential life lost (YPLL) measures years lost due to premature death. In contrast to mortality measures, YPLL emphasizes the effect of premature mortality on a population. YPLL is often calculated using a cutoff age, 65 or 75, as follows:
YPLL=∑[(cutoff age - i )] x di
where i is the midpoint of the grouped year of age at death and di is the number of deaths at grouped year of age i. YPLL can be calculated for specified causes of death. In Table M26, age 75 is used as the cut off age and single year of age is used in calculation. Therefore i is single year of age younger than 75. See also Premature Deaths.
PREGNANCY OUTCOMESBIRTHS
BIRTH CERTIFICATE (see copy in back of Appendix B)
The birth certificate comprises two parts: the certificate of birth and the confidential medical report of birth. The current revision of the birth certificate, implemented in 2008, is based on the recommended 2003 US Standard Certificate of Live Birth: http://www.cdc.gov/nchs/data/dvs/birth11-03final-ACC.pdf. The 2008 revision coincided with the January 2008 electronic filing requirement.
The certificate of birth is the legal record. Each certificate is authenticated by the medical provider (physician or midwife) or his or her representative and filed with the New York City Department of Health and Mental Hygiene.
The confidential medical report, used for the compilation of public health statistics and scientific purposes, includes parents’ demographic information, mother’s prenatal history and care, information on financial coverage, maternal morbidity, labor and delivery, and condition and treatment of the infant during, and immediately after, birth. These data are collected from the mother, the mother’s and infant’s medical records, and medical providers.
BIRTH REPORTING
The birth events reported are based on certificates filed with the New York City DOHMH for vital events occurring in or en-route to New York City, regardless of individual residency status, in a particular year. Births must be filed within five business days of the event. Birth data are generally collected using two worksheets: mother/parent and facility worksheets. Effective January 2008, BVS required all hospitals registering more than 100 births per year to use the Electronic Vital Events Registration System (EVERS). After 2012, more than 99% of all births were registered electronically through EVERS (now eVital). Any events registered after file closure (typically occurring within 5 months of year-end) are excluded from this report. Such late registrations are rare.
BIRTH RATES
See Vital Event Rates on page 106.
DATA PRESENTATION
Starting with the 2007 summary, items with unknown/not stated values are excluded from the denominator when calculating percentages. This affects Appendix A Tables PO6, PO7, PO11, PO12 and Map PO Figure 14.
112
TECHNICAL NOTES, 2018
BREAST FEEDING (appendix a Tables po6-7, po12)
Breast feeding has been reported on the birth certificate since 2008. It includes infant feeding practices through the first 5 days of life. New York City births must be filed with the Department of Health within five business days of the event.
PLACE OF BIRTH
Since 1996, home births in Appendix A Tables PO4 and PO5 include all events for which “Home” was selected as the “Type of Place” regardless of whether the certificate was filed through a hospital. Home births in Table PO1 include events for which “home” was selected as “Type of Place” and the certificate was not filed by an institution; typically, these events were filed by the person who attended to the birth at home.
Appendix A Table PO1 describes the live births according to the borough in which the birth occurred. Prior to 2010, Table PO1 reported births according to the borough in which the reporting office was located. This primarily affects the frequency of “places other than a hospital or home” and “home births,” which occur citywide but are frequently reported by the Bureau of Vital Statistics in Manhattan.
MOTHER’S MARITAL STATUS
The New York City DOHMH is prohibited by local law from recording mother’s marital status on the record or report of birth. As a result, marital status is estimated and should be interpreted with caution. Since 1997, marital status is computed using the following algorithm: certificates without the father’s name and those with the father’s name that are accompanied by an Acknowledgment of Paternity are categorized as non-married; all others are categorized as married. Married parents have a right to have both their names on their child’s birth certificate. This applies equally to married opposite-sex parents and same-sex parents. Some hospitals require proof of marriage. If the mother is not married, a father’s name may be added through an Acknowledgment of Paternity or court order.
TEEN BIRTHS
See Age-specific birth rate under Vital Event Rates on page 106.
GESTATIONAL AGE
Gestational age, or clinical estimate of gestation, is defined as the best obstetric estimate of the infant’s gestation in completed weeks based on the birth attendant’s final estimate of gestation. Characteristics of live births and/or infant deaths in the Appendix A, Tables PO4-PO7, PO11, and PO12, respectively, include either gestational age categories or a dichotomous indicator of preterm (<37 weeks gestation) birth.
Beginning in 2007, the range for valid gestational age was changed from 20-44 weeks to 17-47 weeks.
SPONTANEOUS AND INDUCED TERMINATIONS OF PREGNANCY REPORTING
SPONTANEOUS TERMINATION OF PREGNANCY CERTIFICATE (see copy in back of Appendix B)
Like the birth certificate, the spontaneous termination of pregnancy certificate has two parts, the certificate and the confidential medical report. The certificate is available to the mother. The confidential medical report information is collected for the compilation of public health statistics and scientific purpose.
INDUCED TERMINATION OF PREGNANCY CERTIFICATE (see copy in back of Appendix B)
Certificates of induced termination of pregnancy are not issued. Data are collected for the compilation of public health statistics and scientific purpose.
The spontaneous and induced termination of pregnancy events reported are based on certificates filed with the New York City Department of Health and Mental Hygiene (DOHMH) for vital events occurring in or en-route to New York City, regardless of individual residency status, in a particular year. By law, all terminations of pregnancy are to be reported within 5 business days of the event, unless a permit to dispose of the conceptus is required (≥24 week gestation) or requested (any gestational age). In such a case, the event must be reported within 24 hours. However, the number of induced and spontaneous terminations filed depends to some extent on the outreach conducted by BVS. Effective January 1, 2011, all facilities that report births electronically to the Department pursuant to Public Health Law 203, are required to report spontaneous terminations electronically via the Electronic Vital Events Registration System (EVERS, now replaced by eVital as of October 15, 2018); the Chief Medical Examiner and all facilities reporting 100 or more induced terminations of pregnancy per year also are required to file electronically via EVERS; all facilities that have commenced reporting electronically, regardless of number of events reported are required to do so electronically. After 2010, 99.8% of induced terminations of pregnancy and 99.7% of spontaneous terminations of pregnancy were filed electronically. Otherwise, paper forms, authorized by the department may be used for reporting such events.
SPONTANEOUS AND INDUCED TERMINATION OF PREGNANCY RATES
See Vital Event Rates on page 106.
PERINATAL PERIODS OF RISK (PPOR)
Perinatal Periods of Risk (PPOR) is both a community approach and an analytic framework for investigating and reducing infant mortality rates in urban settings. It examines fetal and infant deaths by age at death (fetal, neonatal, post-neonatal) and birthweight (500-1,400 grams,≥1,500 grams). It then groups age at death and birthweight into four categories that identify where the risk factors are that led to the death: “Maternal Health and Prematurity,” “Maternal Care,” “Newborn Care,” and “Infant Health.” Communities should be able to use the information from PPOR to mobilize and prioritize prevention efforts.

113
TECHNICAL NOTES, 2018HISTORICAL TECHNICAL NOTES
POPULATIONPOPULATION ESTIMATES
2013-2017
Tables and figures with 2013-2017 data use intercensal population estimates determined by Census Bureau in 2013-2017 vintage files. Tables and figures with 2001-2012 data use intercensal population estimates determined by Census Bureau released as of September 2012.
2010-2017
Tables and figures with single-year data use 2010 Census population count. Tables and figures with 2001-2010 data use intercensal population estimates determined by NYC Department of City Planning as of July 1, 2010. Single-year population data after 2010 are extrapolated based on 2000 and 2010 Census population counts.
2007-2009
The 2007-2009 Annual Summaries used the respective year’s pre-challenged US Census Bureau’s population estimates. As a result, city and borough-wide estimates overall and by age, ethnicity and sex may vary from those presented in prior summaries.
2005-2006
The 2005-2006 Annual Summaries used post 2000 census estimates for citywide, county (borough), 5-year age group, ethnic group, and sex population counts. The Summaries’ year population counts used pre-challenged census estimates; prior year population counts presented in the Summaries used post-challenged census estimates in addition to Census 2000 data.
2000-2004
Population counts used US Census citywide decennial population counts.
Intercensal years between 1990 and 2000
Intercensal counts were estimated using an exponential formula, which assumes that the growth rate was the same throughout the decade:
(where r is a constant growth rate and t is the time interval).
Intercensal years through 1989
Intercensal counts were estimated using a linear interpolation.
1960, 1970, 1980, 1990, 2000
The population counts for years 1960, 1970, 1980, 1990 and 2000 were US Census counts.
COMMUNITY DISTRICT
2013-2017
Community District population estimates for 2013-2017 were based on Census intercensal estimates by county, age, race, and sex, 2013-2017 vintages, and interpolated by Bureau of Epidemiology Services. See following description of 2012 data for details.
2012
Community District population estimates for the years 2010-2012 are based on population estimates from 2010 to 2012. Census intercensal estimates by county, age, race, and sex. The 2010 number is adjusted to account for undercount in Brooklyn and Queens as documented by the Department of City Planning. To calculate individual year’s Community District estimates beginning with July 1, 2000, an interpolation by Community District, age, race, and sex was adjusted to the county, age, race, and sex numbers using an iterative proportional fitting procedure. Each year through 2009 was constructed from an interpolation based on the previous year, the modified Census 2010, and the intercensal numbers for that year. The July 1, 2010 numbers were then extrapolated using July 1, 2009 and Census 2010 and then adjusted to the July 1st intercensal numbers. These estimates differ from the 2001-2011 estimates used in the 2010 and 2011 Summaries because the 2010 and 2011 Summaries’ estimates were adjusted to official intercensal estimates consistent with Census 2010 released in October 2012.
2011
Community District population estimates for the years 2000-2010 use population estimates from Census 2000 and Census 2010 and the official Census intercensal estimates by county, age, race, and sex. To calculate individual year’s Community District estimates beginning with July 1, 2000, an interpolation by Community District, age, race, and sex was adjusted to the county, age, race, and sex numbers using an iterative proportional fitting procedure. Each year through 2009 was constructed from an interpolation based on the previous year and Census 2010. The July 1, 2010 numbers were then extrapolated using July 1, 2009 and Census 2010 and then adjusted to the July 1st intercensal numbers. These estimates differ from the 2000-2010 estimates used in the 2010 Summary because they are adjusted to official intercensal estimates consistent with Census 2010 released in October 2012.
114
TECHNICAL NOTES, 2018
2010
Community district population estimates by sex and 18 age groups were derived by the New York City Department of City Planning. For community district data by race/ethnicity and 22 age groups for the same period, DOHMH Bureau of Epidemiology Services constructed estimates from the Department of City Planning data and available Census 2000 and 2010 data, ensuring consistency with marginal totals from the Census Intercensal Estimates program. Postcensal estimates as well as the official 2010 modified race summary files were used. Because the 2010 modified race summary file was not available from the Census for single-year age by modified race groups, DOHMH used Census summary file 1 and adjusted the dataset to match the Census modified race summary file. To create the modified race groups, the “some other race” group was removed and race is imputed. While the modified race summary file created by the Census used information from other members of the same household, the DOHMH used race information from the corresponding Census tract. The race distribution was then modified to match the 2010 modified race summary file.
2008-2009
Community District population estimates for intercensal years use United States Census Bureau Population Estimate Program and housing unit data from the New York City Department of City Planning. The “housing unit method” of estimation allocates the population to Community Districts. The method multiplies the estimated number of households in a given area by an estimate of the population per household. In the intercensal context, housing unit growth, measured by housing permit data, determines the locations of growth. Because these estimates are calibrated to equal United States Census-borough-specific population totals, the borough population per household is fixed. New population estimates are derived using the iterative proportional fitting procedure (IPFP) implemented in SAS® Version 9.2. The validity of these estimates depends on vacancy rates, housing unit loss rates, percentage of permits actually constructed, and time to complete construction, which are assumed consistent at the borough level and thus have no effect on the allocation of growth. The method is sensitive to the quality of the housing permit data, which does not identify residential conversions to multiple units. Demographic characteristics are allocated assuming those at the location of growth. Therefore, this approach does not capture intercensal demographic changes at the neighborhood level including change due to migration.
2005-2006
Year 2000 Census counts were used for defining smaller geographic units such as Community Districts or single-year age groups.
HEALTH CENTER DISTRICT
Through 2007
Population estimates for Health Center District (HCD) were not computed in time for the release of 2008 report and have not been presented since 2007. As a result, Health Center District tables were either replaced (Table 7) or did not present rates (Table 34).
Through 2007
Health Center District data were presented in Summary Reports. Populations for geographic area smaller than borough were based on decennial census data.
2005-2006
Year 2000 Census counts were used for defining smaller geographic units such as Community Districts or single-year age groups.
RACE/ETHNIC GROUP
2000-2001
Census data were used to define race and ethnic distribution; in 2002, the Census Bureau issued the modified Race File resulting in a 65% reduction in Other and Multiple Race, a 6% increase in Asian and Pacific Islander, and 3% increases for non-Hispanic White and non-Hispanic Black. There was no change for Hispanic population.
DEMOGRAPHIC CHARACTERISTICS OF VITAL EVENTS
RACE, ANCESTRY AND ETHNIC GROUP
Through 2007
The birth certificate allowed the selection of one race category.
1991-2005
Mother’s birthplace was reported in four categories: United States other than Puerto Rico, Puerto Rico, Foreign and Not Stated. US Virgin Islands and Guam are included in the “Foreign” category.
Through 2002
The death certificate allowed the selection of one race category.
1999
The meaning of ancestry was clarified with hospitals, resulting in a notable increase in Hebrew and Jewish ancestry and a decrease in American ancestry.

115
TECHNICAL NOTES, 2018BIRTHPLACE
2000-2005
Decedent’s birthplace was first reported by country in 2000. US Virgin Islands and Guam were included in the “Other” category.
GEOGRAPHICAL UNITS
COMMUNITY DISTRICT
Prior to 2003
Community districts were referred to by number through 2002 and by name after.
PLACE OF BIRTH
Through 1995
Through 1995, all reports of home births included only events filed outside the hospital.
DEATHS
DEATH REPORTING
Through 1992
Medical certifier provided race and ancestry information.
RACE/ETHNICITY
1993 – present
The death certificate was revised in June 1993 to require funeral directors to provide ancestry information, presumably from decedents’ family members.
Through 1992
Medical certifier provided ancestry information.
CAUSE OF DEATH CODING
Through 2006
ICD-coding was conducted manually by NCHS certified nosologists.
ALCOHOL-RELATED DEATHS: ICD CODING
2008 – present
Following increasing deaths due to binge drinking, the ICD codes for alcohol-related deaths were re-evaluated by the World Health Organization’s Mortality Reference Group and coding was implemented in 2008. Core changes included recoding acute alcoholism (previously coded as F10.2) to X45 (alcohol poisoning), and recoding F10.0 cases as X45 cases. This resulted in an increase in alcohol liver disease and alcohol poisoning, and a decrease in alcohol dependence syndrome. A subsequent decrease in alcohol liver disease between 2008 and 2009 is, in part, a result of further corrections to coding applied in 2009. Similar changes are seen in US data.
HIV AND AIDS
1987 to 1999
In 1987, NCHS introduced code 042 for AIDS and 043-044 for other HIV Disease deaths. Additional information on historical HIV coding can be found in the 1997 and 1998 Annual Summaries.
1983 to 1986
AIDS was recognized as a cause of death and coded as ICD-9 code 279.1.
EXTERNAL CAUSES
Through 1999
External Causes were not shown separately.
DRUG-RELATED DEATHS: ICD CODING
2008 – present
Unintentional Drug-related Overdose Deaths (Mortality: Figure 19), a definition used in Take Care New York (TCNY) was reported in the Summaries starting in 2008. The definition had changed after an extensive review of drug-related cases. Starting in the 2011 Summary, the definition of Unintentional Drug-related Overdose Deaths has 2 modifications from “Drug Use/Poisoning”: (i) restricted to deaths among individuals ages 15 to 84; and (ii) restricted to manner of deaths confirmed by medical examiner to be accidental.

116
TECHNICAL NOTES, 2018
Through 2006
Through 2006, a large proportion of accidental drug related deaths (X40-X42, X44) were miscoded as chronic drug use (F11-F16, F18-F19). For a full explanation, please see the 2007 Annual Summary of Vital Statistics Special Report: NYC Changes from Manual to Automated Cause of Death Coding, pages 73-75. NCHS coded data is often substituted when presenting external causes of death trends that span 2006 to 2007.
MATERNAL DEATHS AND MATERNAL MORTALITY
Through 1998
Currently labeled “Maternal deaths” were “Complications of pregnancy, childbirth and the puerperium” through 1998.
ACCIDENTS (UNINTENTIONAL)
Through 1999
Complications of medical care and surgical care were classified as accidents per ICD-9.
Through 1998
The site of accidents (home and public place) has been dropped due to unreliable reporting.
SMOKING-ATTRIBUTABLE MORTALITY (SAM)
2011-2012
Due to the concern of underestimating smoking-attributable mortality caused by the rapid decrease in smoking prevalence in New York City, data were presented by “Deaths and age-adjusted death rates for selected smoking-related causes of death per 100,000 population (35 years and over).”
Through 2010, 2013
SAM was calculated using CDC’s Adult SAMMEC (Smoking-Attributable Mortality, Morbidity, and Economic Costs) program using an attributable fraction formula. New York City sex-specific smoking prevalence was estimated from the New York City DOHMH Community Health Survey (CHS) and computed by the Bureau of Epidemiology. The relative risks (RR) of death for current and former smokers ≥35 years of age for 19 smoking-related diseases were estimated from the American Cancer Society’s Cancer Prevention Study. The smoking-attributable fraction (SAF) for each smoking-related disease and sex is calculated using the following formula:
SAF = [(p0 + p1(RR1) + p2(RR2)) - 1] / [p0 + p1(RR1) + p2(RR2)]
where p0 is the percentage of adult never-smokers in New York City; p1 is the percentage of adult current smokers in New York City; p2 is the percentage of adult former smokers in New York City; RR1 is the relative risk of death for adult current smokers relative to adult never-smokers; and the RR2 is the relative risk of death for adult former-smokers relative to adult never-smokers.
To estimate the SAM, the age- and sex-specific SAFs are multiplied by the number of deaths for each smoking-related disease. Specifically, the number of deaths for each sex and 5-year age category was multiplied by the SAF:
SAM = Number of deaths x SAF
Summing across age categories provides the sex-specific estimate of SAM for each disease. Total SAM is the sum of the sex-specific SAM estimates.
WORLD TRADE CENTER DEATHS
2008 – present
See Technical Notes, 2009 regarding late effect WTC-deaths.
2007, 2008
In 2007, a 2002 death was reclassified as a WTC death.
In 2008, a 2001 death was reclassified as a 2001 WTC death.
In 2008, a missing person was classified as a 2001 WTC death per New York State Supreme Court.
2002
In 2002, the number of WTC deaths included in 2001 deaths was updated from 2,740 to 2,749. This new number included six additional death certificates filed through October 31, 2002 and three deaths that occurred outside of New York City (See 2002 Special Section for details).
FATAL OCCUPATIONAL INjURIES
Through 2002
The industry in which the decedent worked and was injured was coded based on the Standard Industrial Classification (SIC).

117
TECHNICAL NOTES, 2018
WORLD TRADE CENTER DEATHS AND LIFE EXPECTANCY
2002 (Special Section)
Impact of World Trade Center deaths on life expectancy.
BIRTHS
AGE-SPECIFIC BIRTH RATES
Through 2010
Until 2011, the youngest age-specific birth rates included events within the specific age range (e.g. age-specific birth rates to females 15 to 19 include births to females in that age group. Age-specific births to females 15-17 include births to females in that age group.) See current technical notes for change after 2010.
Until 2011, the oldest age-specific birth rate presented was 40 to 44. See current technical notes for change after 2010.
TRIMESTER OF FIRST PRENATAL CARE VISIT (LATE OR NO PRENATAL CARE)
2008-2009
Following the 2008 transition to EVERS, the magnitude of births registered without information used to calculate Trimester of First Prenatal Care Visit was great and data were suppressed. By 2010 reporting improved such that data could be released and included in the Summary.
ANCESTRY, OTHER
2008-2010
Following the 2008 transition to EVERS, the number of births registered with an “other” or unknown ancestry increased.
MOTHER’S MARITAL STATUS
Through 1996
Mother’s Marital Status was computed using an algorithm developed by NCHS. A 1996 review of marital status indicated that the number of non-marital births was being overestimated. See Special Note on Mother’s Marital Status in the 1997 Annual Summary for details.
2008 REVISED NYC BIRTH CERTIFICATE
2008
For comprehensive information on the 2008 revision of the NYC birth certificate, please see the Technical Notes from the 2008 Summary of Vital Statistics: http://www1.nyc.gov/assets/doh/downloads/pdf/vs/2008sum.pdf.
INDUCED AND SPONTANEOUS TERMINATION OF PREGNANCY
REPORTING
Through 2007
Induced and spontaneous terminations of pregnancies registered after the annual file closed were added to the following year’s data.

118
� Hospital � Freestanding Birthing Center � Clinic/Doctorʼs Office
� Other-specify:
4a. DATE OFCHILD'SBIRTH
CERTIFICATE OF BIRTHCERTIFICATE NO.
DATE FILED
1. NAMEOF CHILD
(First, Middle, Last)
(Month) (Day) (Year - yyyy) 4b. TIME2. SEX 3a. NUMBER DELIVEREDof this pregnancy
3b. If more than one, number of this child in order of delivery
5. PLACEOFBIRTH
5c.TYPEOFPLACE
5a. NEW YORK CITY BOROUGH 5b. Name of Hospital or other facility (if not facility, street address)
6a. MOTHER/PARENTʼS NAME (Prior to first marriage)(First, Middle, Last) SEX ___M ___F
6b. MOTHER/PARENTʼS DATE OF BIRTH (Month) (Day) (Year - yyyy)
6c. MOTHER/PARENTʼS BIRTHPLACECity & State or foreign country
7. MOTHER/PARENTʼSUSUAL RESIDENCEa. State b. County
7c. City or town 7d. Street and number Apt. No. ZIP Code
8a. FATHER/PARENTʼS NAME (Prior to first marriage)(First, Middle, Last) SEX ___M ___F
9a. NAME OF ATTENDANT AT DELIVERY
8b. FATHER/PARENTʼSDATE OF BIRTH (Month) (Day) (Year - yyyy)
8c. FATHER/PARENTʼS BIRTHPLACECity & State or foreign country
� M.D. � RPA� D.O. � R.N.� Lic. Midwife� Other-Specify
9b. I CERTIFY THAT THIS CHILD WAS BORN ALIVEAT THE PLACE, DATE AND TIME GIVEN
Signed
Name of Signer
AddressDate Signed , Year - yyyy
(Type or Print)
Mother/Parentʼs Current (First, Middle, Last)Legal Name
Address Apt.
City State ZIP
VR-6S (Rev. 12/09)
THIS
CER
TIFI
CAT
E N
OT
VALI
D U
NLE
SS F
ILED
IN T
HE
DEP
AR
TMEN
T O
F H
EALT
H A
ND
MEN
TAL
HYG
IEN
ETy
pew
rite
or p
rint w
ith b
lack
fine
poi
nt in
k. C
ertif
icat
es c
onta
inin
g al
tera
tions
or o
mis
sion
s ar
e un
acce
ptab
le.
Plea
se c
ompl
ete
the
follo
win
g:H
as p
aren
t app
rove
d as
sign
men
t of S
SN fo
r chi
ld?
Mot
her/P
aren
t's S
SN:
Fath
er/P
aren
tʼs S
SN:
YES
�N
O �
Die
d: D
ate:
P
lace
:
Cer
t. N
o. � AM
� PM
7e. Inside citylimits of 7c?
Yes � No �
THE CITY OF NEW YORK – DEPARTMENT OF HEALTH AND MENTAL HYGIENE
� Home Delivery: Planned to deliver at home?
� M.D. � RPA� D.O. � R.N.� Hosp. Admin.� Lic. Midwife� Other-Specify
� Yes� No� Unknown
VOID

119
10. PARENT’S RACERace as defined by the U.S. Census(Check one or more to indicate what the parent considers her/himself to be)a. Mother/Parent b. Father/Parent
�.......................................White ........................................��.......................Black or African American ........................��.................American Indian or Alaska Native ..................�
Name of enrolled or principal tribe
(Mother/Parent) (Father/Parent)
� .................................Asian Indian ...................................��.....................................Chinese ......................................��......................................Filipino .......................................�� ...................................Japanese .....................................�� .....................................Korean .......................................��..................................Vietnamese....................................��..................................Other Asian....................................�
Specify
(Mother/Parent) (Father/Parent)
� ..............................Native Hawaiian ................................�� .......................Guamanian or Chamorro .........................��.....................................Samoan ......................................�� ..........................Other Pacific Islander ............................�
Specify
(Mother/Parent) (Father/Parent)
�.......................................Other.........................................�Specify
(Mother/Parent) (Father/Parent)
15. PRENATAL HISTORY
a. 1. Total Number of Previous Live Births __________ � None
2. Number Born Alive and Now Living __________ � None
3. Number Born Alive and Now Dead __________ � Noneb. Those born alive may have been Preterm, Low Birth Weight
or both. Please indicate:
1. Number Preterm (< 37 wks.) __________ � None
2. Number Low Birth Weight(< 2500 grams or 5 lbs. 8 oz.) __________ � None
(Check the box that best describes the highest degree or level ofschool completed at time of delivery)
a. Mother/Parent b. Father/Parent
� ......................8th grade or less; none..............................��...................9th-12th grade, no diploma ..........................��.................High school graduate or GED.........................�� ............Some college credit, but no degree ....................�� ...............Associate degree (e.g., AA, AS).......................��...........Bachelor’s degree (e.g., BA, AB, BS)...................��..........Master’s degree (e.g., MA, MS, MEng, .................�
MEd, MSW, MBA)�...................Doctorate (e.g., PhD, EdD)...........................�
or Professional degree (e.g., MD, DDS,DVM, LLB, JD)
12. PARENT’S LENGTH OF TIME IN US
13. PARENT’S EDUCATION
(Check one box and specify what the parent considers her/himself to be)a. Mother/Parent b. Father/Parent
Hispanic (Mexican, Puerto Rican,� .........................Cuban, Dominican, etc.) . . . . . . . . . . .�
Specify
(Mother/Parent) (Father/Parent)
NOT Hispanic (Italian, African American,Haitian, Pakistani, Ukranian,
� .........................Nigerian, Taiwanese, etc.) . . . . . . . . . . .�Specify
(Mother/Parent) (Father/Parent)
a. Mother/Parent: If born outside of the United States, how long lived in U.S.? years ________ or if < 1 yr, months ________
b. Father/Parent: If born outside of the United States, how long lived in U.S.? years ________ or if < 1 yr, months ________
11. PARENT’S ANCESTRY
d. Date of First Live Birth (mm/yyyy) ______/______
e. Date of Last Live Birth (mm/yyyy) ______/______
f. Date of Last other Pregnancy Outcome (mm/yyyy) ______/______
g. Date Last Normal Menses began (mm/dd/yyyy) ____/____/____
16. PRENATAL CAREa. Total Number of Prenatal Visits for this Pregnancy
� None __________b. Date of First Prenatal Care Visit
(mm/dd/yyyy) ______/______/_______c. Date of Last Prenatal Care Visit
(mm/dd/yyyy) ______/______/_______d. Primary Prenatal Care Provider Type(Check one)� MD/DO � No Provider� C(N)M/NP/PA/Other Midwife � No Information� Clinic � Other
e. Risk Factors in this Pregnancy(Check all that apply)
� Pre-pregnancy diabetes� Gestational diabetes� Pre-pregnancy hypertension� Gestational hypertension� Cardiac disease:
� Structural defect� Functional defect
� Other serious chronic illness � Anemia (Hct.<30/Hgb.<10)� Asthma/Acute or chronic lung disease � Rh sensitization � Polyhydramnios� Oligohydramnios� Hemoglobinopathy� Abruptio placenta � Eclampsia� Other previous poor pregnancy outcome � Prelabor referral for high risk care � Other vaginal bleeding � Previous cesarean section: Number ________ � Infertility treatment:
� Fertility drugs, artificial/intrauterine insemination� Assisted reproductive technology (e.g., IVF, GIFT)
Number of embryos implanted (if applicable) ________ � Fetal reduction� None of the above
f. Infections Present and/or Treated During Pregnancy(Check all that apply)
g. 1. Cigarette Smoking in the 3 Months Before or DuringPregnancy?
� Yes � NoIf Yes, Average Number of Cigarettes or Packs/Day (enter 0 if None)
Cigarettes or Packs/Day
2. 3 mo. before pregnancy _______ or _______
3. First 3 mo. of pregnancy _______ or _______
4. Second 3 mo. of pregnancy _______ or _______
5. Third trimester of pregnancy _______ or _______
� Gonorrhea � Hepatitis C� Syphilis � Tuberculosis� Herpes Simplex (HSV) � Rubella� Chlamydia � Bacterial Vaginosis� Hepatitis B � None of the above
l. Obstetric Procedures(Check all that apply)
� Cervical cerclage � Fetal genetic testing� Tocolysis � None of the above� External cephalic version:
� Successful� Failed
m. If woman was 35 or over, was fetal genetic testing offered?
� Yes � No, Too Late � No, Other Reason
� Heroin � Marijuana� Cocaine � Sedatives� Methadone � Tranquilizers� Methamphetamine � Anticonvulsants
h. Alcohol Use During This Pregnancy?
� Yes � No
j. Mother/Parent Pre-Pregnancy Weight __________ pounds
k. Mother/Parent Height _______ feet _______ inches
i. Illicit and other Drugs Used During This Pregnancy?
� Yes � NoIf yes, check all that apply
� Medicaid/Family Health Plus � Other� Private Insurance � Self-pay� Other govt/CHPlusB � Unknown� CHAMPUS/TRICARE
b. Is the mother/parent enrolled in an HMO or other managedcare plan?
� Yes � No
c. Did mother/parent participate in WIC?
� Yes � No
a. Primary Payor(Check one)
� Maternal transfusion� Perineal laceration (3rd or 4th degree)� Ruptured uterus� Unplanned hysterectomy� Admit to ICU� Unplanned operating room procedure following delivery� Hemorrhage� Postpartum transfer to a higher level of care� None of the above
(Check all that apply)
THE CITY OF NEW YORK – DEPARTMENT OF HEALTH AND MENTAL HYGIENECONFIDENTIAL MEDICAL REPORT OF BIRTH (1 of 2)
Only for scientific purposes approved by the Commissioner. Not open to inspection or subject to compelled disclosure.
VR-6S (Rev. 12/09)
(Each question MUST be answered)
NAME CHILD’S MEDICAL CERTIFICATEOF CHILD RECORD NO. NO.
MOTHER’S/PARENT’S MEDICAL MOTHER’S/PARENT’S TELEPHONE RECORD NO. NUMBERS: Day ( ) Evening ( )
c. 1. Total Number of other Pregnancy Outcomes(Spontaneous or Induced Terminations): __________ � None
2. Number of Spontaneous Terminationsof Pregnancy less than 20 Weeks __________ � None
3. Number of Spontaneous Terminationsof Pregnancy 20 Weeks or More __________ � None
4. Number of Induced Terminationsof Pregnancy __________ � None
18. MATERNAL MORBIDITY
17. FINANCIAL COVERAGE
14. PARENT’S OCCUPATIONYes No
a. Was mother/parent employed during pregnancy? � �1. Current/most recent 2. Kind of business or
occupation industry
b. Mother/Parent
c. Father/Parent
VVVVVVOVVVrent) OIAL CAROVOotal Number of Prenatal Visits for this P
one __
VODate of First Prenatal C
(mm/dd/yyyy) ______/______/_
VOe of Last Prenatal Care V
mm/dVd. Primary Pre(Check one)VMD/DO
NP/PVVDOIDDDIDDDOID(mm/yyyy) ______/______
OID(mm/yyyy) ______/______
OIr Pregnancy Outcom m/yyyy) ____
OIormal Menses began (mm/dd ___/_DDDDDDD�DDDDDi. Illic
�
If yesID____ � None
____ns
________
_____ �
OIOIV

120
19. LABOR AND DELIVERYa. If birth occured in hospital, was mother/parent transferred in before giving birth?
If yes, name of facility transferred from
� Yes ____________________________________________________
� No
b. Mother/Parent Weight at Delivery
________ pounds
c. Onset of Labor(Check all that apply)
� Prolonged rupture of membranes � Prolonged labor(12 hours or more) (20 hours or more)
� Premature rupture of membranes � None of the above(prior to labor)
� Precipitous labor (less than 3 hours)
d. Characteristics of Labor & Delivery(Check all that apply)
� Induction of Labor-AROM � Chorioamnionitis� Induction of Labor-Medicinal � Febrile (>100.4F or 38C)� Augmentation of Labor � Meconium staining� Placenta previa � Fetal intolerance� Other excessive bleeding � External electronic fetal monitor � Steroids � Internal electronic fetal monitor� Antibiotics � None of the above
e. 1. Anesthesia(Check all that apply)
� Epidural � Paracervical � General inhalation � Pudendal � General intravenous � Local� Spinal � None of the above
2. Complications from any of the above?
� Yes � No
Method of Delivery
f. Fetal Presentation at Birth
� Cephalic � Other� Breech
g. Final route and method of delivery (Check one)
� Vaginal/Spontaneous � Vaginal/Vacuum � Vaginal/Forceps � Cesarean
1. If cesarean, was trial of labor attempted?
� Yes � No
2. Indications for C-Section � Unknown(Select all that apply) � Maternal condition-not pregnancy related� Failure to progress � Maternal condition-pregnancy related� Malpresentation � Refused VBAC� Previous C-Section � Elective� Fetus at risk/NFS � Other
3. Was delivery with forceps attempted but unsuccessful?
� Yes � No
4. Indications for Forceps � Unknown(Select all that apply) � Fetus at Risk
� Failure to progress � Other
5. Was delivery with vacuum extraction attempted but unsuccessful?
� Yes � No
6. Indications for Vacuum � Unknown(Select all that apply) � Fetus at Risk
� Failure to progress � Other
h. Other Procedures Performed at Delivery (Check all that apply)
� Episiotomy & repair � Repair of lacerations� Sterilization � None of the above
b. If birth weight < 1250 grams (2 lbs. 12 oz.), reason(s) fordelivery at a less than level III hospital: (Only if applicable)
� None � Unknown at this time (Select all that apply)� Rapid/Advanced Labor � Severe pre-eclampsia � Bleeding � Woman Refused Transfer � Fetus at Risk � Other-specify ___________
a. Birthweight
_________ _________ or _________Pounds Ounces Grams
THE CITY OF NEW YORK – DEPARTMENT OF HEALTH AND MENTAL HYGIENECONFIDENTIAL MEDICAL REPORT OF BIRTH (2 of 2)
Only for scientific purposes approved by the Commissioner. Not open to inspection or subject to compelled disclosure.
VR-6S (Rev. 12/09)
(Each question MUST be answered)
NAME CERTIFICATEOF CHILD NO.
d. Clinical Estimate of Gestation
Completed Weeks: _____________
e. Infant Transferred
Within 24 hours of Delivery After 24 hours Not Transferred
� � �
c. Apgar Score at
1. 1 minute 2. 5 minutes 3. 10 minutes___________ ___________ ___________
Congenital Anomalies
k. Select all that apply
g. Abnormal Conditions of the Newborn(Check all that apply)
� Assisted ventilation required immediately following delivery
� Assisted ventilation required for more than six hours
� NICU admission� Newborn given surfactant replacement therapy� Antibiotics received by the newborn for
suspected neonatal sepsis� Seizure or serious neurologic dysfunction� Significant birth injury (skeletal fracture(s),
peripheral nerve injury, and/or soft tissue/solid organ hemorrhage which requires intervention)
� None of the above
h. Hepatitis B Inoculation1. Immunization administered?� Yes Date: (mm/dd/yyyy) _____/_____/_________� No2. Immunoglobulin administered?� Yes Date: (mm/dd/yyyy) _____/_____/_________� No
i. Is infant living at time of report?
� Yes � No
j. How is infant being fed? (Check one)� Breast milk � Both � Formula � Neither
20. INFANT
Yes No� �
Yes No� �
Yes No� �
Yes No� �
Yes No� �
Yes No� �
Yes No� �
Yes No� �
Yes No� �
Yes No� �
Yes No� �
Yes No� �
Yes No� �
� Level II Ultrasound � MSAFP/Triple Screen� Amniocentesis � Other � Unknown1. Anencephaly
Yes No� �
� Level II Ultrasound � MSAFP/Triple Screen� Amniocentesis � Other � Unknown
2. Meningomyelocele/Spina Bifida
Yes No� �
� Level II Ultrasound� Other � Unknown
3. Cyanotic Congenital Heart Disease
Yes No� �
� Level II Ultrasound� Other � Unknown
4. Congenital Diaphragmatic Hernia
Yes No� �
� Level II Ultrasound� Other � Unknown5. Omphalocele
Yes No� �
� Level II Ultrasound� Other � Unknown6. Gastroschisis
Yes No� �
� Level II Ultrasound� Other � Unknown7. Limb Reduction Defect
Yes No� �
� Level II Ultrasound� Other � Unknown
8. Cleft lip with or without Cleft Palate
Yes No� �
� Level II Ultrasound� Other � Unknown9. Cleft Palate alone
Yes No� �
� Level II Ultrasound � MSAFP/Triple Screen� CVS � Amniocentesis� Other � Unknown
10. Down Syndrome� Karyotype confirmed� Karyotype pending
Yes No� �
� Level II Ultrasound � MSAFP/Triple Screen� CVS � Amniocentesis� Other � Unknown
11. Other Chromosomal Disorder� Karyotype confirmed� Karyotype pending
Yes No� �
� Level II Ultrasound� Other � Unknown12. Hypospadias
13. None of those listed above �
l. DiagnosedPrenatally? m. If Yes, please indicate all methods used:
f. If transferred, name of facility transferred to:
______________________________________________
VOVOVOVOVOVOVOOIOIOIVOI
VOI
VOIongenital Anomalies
OVOk. SeleIDD
urs Not Transferred DDDDDDi.DDDDDDDVOVOVOVO
Anencephaly
VOomyeloceV3. CHVOID
transferred
_______________________________
VOVOV
121
5. Date last attended by a Physicianmm dd yyyy
6. Certifier: I certify that death occurred at the time, date and place indicated and that to the best of my knowledge traumatic injury or poisoning DID NOT play any part in causing death, and that death did not occur in any unusual manner and was due entirely to NATURAL CAUSES. See instructions on reverse of certificate.
Name of Physician Signature
Address License No. Date
D.O.M.D.
CERTIFICATE OF DEATH
1. DECEDENT’SLEGAL NAME
(First, Middle, Last)
THE CITY OF NEW YORK – DEPARTMENT OF HEALTH AND MENTAL HYGIENE
Certificate No.
DATE FILED
(Type or Print)
8. Date of Birth (Month) (Day) (Year-yyyy) 9. Age at last birthday(years)
Under 1 Year Under 1 Day
Months Days Hours Minutes
10. Social Security No.
11a. Usual Occupation (Type of work done during most of working life. Do not use “retired”)
11b. Kind of business or industry 12. Aliases or AKAs
13. Birthplace (City & State or Foreign Country)
18. Father’s Name (First, Middle, Last)
20a. Informant’s Name
19. Mother’s Maiden Name (Prior to first marriage) (First, Middle, Last)
20b. Relationship to Decedent 20c. Address (Street and Number Apt. No. City & State ZIP Code)
22a. Funeral Establishment 22b. Address (Street and Number City & State ZIP Code)
14. Education (Check the box that best describes the highest degree or level of school completed at the time of death)1 ❑ 8th grade or less; none 4 ❑ Some college credit, but no degree 7 ❑ Master’s degree (e.g., MA, MS, MEng, MEd, MSW, MBA)
2 ❑ 9th – 12th grade; no diploma 5 ❑ Associate degree (e.g., AA, AS) 8 ❑ Doctorate (e.g., PhD, EdD) or
3 ❑ High school graduate or GED 6 ❑ Bachelor’s degree (e.g., BA, AB, BS) Professional degree (e.g., MD, DDS, DVM, LLB, JD)
7a. Usual Residence State 7b. County 7c. City or Town 7e. Inside City Limits?
1 ❑ Yes 2 ❑ No
7d. Street and Number Apt. No. ZIP Code
15. Ever in U.S. Armed Forces?
1 ❑ Yes 2 ❑ No
17. Surviving Spouse’s/Partner’s Name (If wife, name prior to first marriage)(First, Middle, Last)16. Marital/Partnership Status at time of death1 ❑ Married 2 ❑ Domestic Partnership 3 ❑ Divorced4 ❑ Married, but separated 5 ❑ Never Married 6 ❑ Widowed7 ❑ Other, Specify 8 ❑ Unknown
21a. Method of Disposition1 ❑ Burial 2 ❑ Cremation 3 ❑ Entombment 4 ❑ City Cemetery
5 ❑ Other Specify
21c. Location of Disposition (City & State or Foreign Country)
21b. Place of Disposition (Name of cemetery, crematory, other place)
Date and Time of Death
3a. (Month) (Day) (Year-yyyy) 3b. Time ❑ AM
❑ PM
4. Sex
21d. Date of mm dd yyyyDisposition
1 2 3 4 5
VR 15 (Rev. 01/09)
ME
DIC
AL
CE
RT
IFIC
AT
E O
F D
EA
TH
(To
be fi
lled
in b
y th
e P
hysi
cian
) P
ER
SO
NA
L P
AR
TIC
UL
AR
S(T
o be
fille
d in
by
Fun
eral
Dire
ctor
or,
in c
ase
of C
ity B
uria
l, by
Phy
sici
an)
Place
Of
Death
2a. New York City
2b. Borough
2e. Name of hospital or other facility (if not facility, street address)2c. Type of Place 4 ❑ Nursing Home/Long Term Care Facility1 ❑ Hospital Inpatient 5 ❑ Hospice Facility2 ❑ Emergency Dept./Outpatient 6 ❑ Decedent’s Residence3 ❑ Dead on Arrival 7 ❑ Other Specify
2d. Any Hospice carein last 30 days1 ❑ Yes 2 ❑ No3 ❑ Unknown
VOID

122
5. Date last attended by a Physicianmm dd yyyy
6. Certifier: I certify that death occurred at the time, date and place indicated and that to the best of my knowledge traumatic injury or poisoning DID NOT play any part in causing death, and that death did not occur in any unusual manner and was due entirely to NATURAL CAUSES. See instructions on reverse of certificate.
Name of Physician Signature
Address License No. Date
D.O.M.D.
CONFIDENTIAL MEDICAL REPORTVR 15 (Rev. 01/09)
I am submitting herewith a confidential report of the cause of death.
24. Race as defined by the U.S. Census (Check one or more toindicate what the decedent considered himself or herself to be)
01 ❏ White 02 ❏ Black or African American03 ❏ American Indian or Alaska Native
(Name of enrolled or principal tribe) 04 ❏ Asian Indian 05 ❏ Chinese06 ❏ Filipino 07 ❏ Japanese08 ❏ Korean 09 ❏ Vietnamese10 ❏ Other Asian–Specify11 ❏ Native Hawaiian 12 ❏ Guamanian or Chamorro13 ❏ Samoan14 ❏ Other Pacific Islander–Specify15 ❏ Other–Specify
23.Ancestry (Check one box and specify)
❏ Hispanic (Mexican, Puerto Rican, Cuban, Dominican, etc.)
Specify
❏ NOT Hispanic (Italian, AfricanAmerican, Haitian, Pakistani, Ukrainian, Nigerian, Taiwanese, etc.)
Specify
APPROXIMATE INTERVAL:ONSET TO DEATH
27b. If pregnant within one yearof death, outcome of pregnancy1 ❏ Live Birth
2 ❏ Spontaneous Termination/Ectopic Pregnancy
3 ❏ Induced Termination 4 ❏ None
26a. Was an autopsy performed?
1 ❏ Yes 2 ❏ No26b. Were autopsy findings
available to complete the cause of death?
1 ❏ Yes 2 ❏ No
27a. If Female1 ❏ Not pregnant within 1 year of death2 ❏ Pregnant at time of death 3 ❏ Not pregnant at death, but pregnant within 42 days of death4 ❏ Not pregnant at death, but pregnant 43 days to 1 year
before death5 ❏ Unknown if pregnant within 1 year of death
29. Did tobacco use contribute to death?
1 ❏ Yes 2 ❏ No 3 ❏ Probably 4 ❏ Unknown
28. Was this casereferred to OCME?
1 ❏ Yes
2 ❏ No
30. For infant under one year: Name and address of hospital or other place of birth
SIGNATURED.O.M.D. ADDRESS LICENSE NO.
To be filled in by FUNERAL DIRECTOR or, in case of City Burial, by Physician
THE CITY OF NEW YORK – DEPARTMENT OF HEALTH AND MENTAL HYGIENE
CERTIFICATE OF DEATH
1. DECEDENT’SLEGAL NAME
(First, Middle, Last)
THE CITY OF NEW YORK – DEPARTMENT OF HEALTH AND MENTAL HYGIENE
Certificate No.
DATE FILED
(Type or Print)
8. Date of Birth (Month) (Day) (Year-yyyy) 9. Age at last birthday(years)
Under 1 Year Under 1 Day
Months Days Hours Minutes
10. Social Security No.
11a. Usual Occupation (Type of work done during most of working life. Do not use “retired”)
11b. Kind of business or industry 12. Aliases or AKAs
13. Birthplace (City & State or Foreign Country)
18. Father’s Name (First, Middle, Last)
20a. Informant’s Name
19. Mother’s Maiden Name (Prior to first marriage) (First, Middle, Last)
20b. Relationship to Decedent 20c. Address (Street and Number Apt. No. City & State ZIP Code)
22a. Funeral Establishment 22b. Address (Street and Number City & State ZIP Code)
14. Education (Check the box that best describes the highest degree or level of school completed at the time of death)1 ❑ 8th grade or less; none 4 ❑ Some college credit, but no degree 7 ❑ Master’s degree (e.g., MA, MS, MEng, MEd, MSW, MBA)
2 ❑ 9th – 12th grade; no diploma 5 ❑ Associate degree (e.g., AA, AS) 8 ❑ Doctorate (e.g., PhD, EdD) or
3 ❑ High school graduate or GED 6 ❑ Bachelor’s degree (e.g., BA, AB, BS) Professional degree (e.g., MD, DDS, DVM, LLB, JD)
Certificate No.
DECEDENT’S LEGAL NAME (Type or Print)
7a. Usual Residence State 7b. County 7c. City or Town 7e. Inside City Limits?
1 ❑ Yes 2 ❑ No
7d. Street and Number Apt. No. ZIP Code
15. Ever in U.S. Armed Forces?
1 ❑ Yes 2 ❑ No
17. Surviving Spouse’s/Partner’s Name (If wife, name prior to first marriage)(First, Middle, Last)16. Marital/Partnership Status at time of death1 ❑ Married 2 ❑ Domestic Partnership 3 ❑ Divorced4 ❑ Married, but separated 5 ❑ Never Married 6 ❑ Widowed7 ❑ Other, Specify 8 ❑ Unknown
21a. Method of Disposition1 ❑ Burial 2 ❑ Cremation 3 ❑ Entombment 4 ❑ City Cemetery
5 ❑ Other Specify
21c. Location of Disposition (City & State or Foreign Country)
21b. Place of Disposition (Name of cemetery, crematory, other place)
IMMEDIATE CAUSE FINAL disease or conditionresulting in death.
CAUSE OF DEATH–Enterthe chain of events—diseases, complications or abnormalities–that directly caused the death. DO NOT enter terminalevents such as cardiacarrest, respiratory arrest, or ventricular fibrillationwithout showing the etiology.
Sequentially list conditions, ifany, leading to the causelisted on line a. Enter theUNDERLYING CAUSE(disease that initiated theevents resulting in death)LAST.
OPERATION-Enter in Part II information onoperation or procedure related to disease orconditions listed in Part I.
SUBSTANCE USEInclude the use of tobacco,alcohol or other substance ifthis caused or contributed todeath. SPECIFY IN PART Ior PART II.
a. IMMEDIATE CAUSE
b. DUE TO OR AS A CONSEQUENCE OF
c. DUE TO OR AS A CONSEQUENCE OF
d. DUE TO OR AS A CONSEQUENCE OF
OTHER SIGNIFICANT CONDITIONS CONTRIBUTING TO DEATH but not resulting in the underlying cause given in Part I. Include operation information.
25. CAUSE OF DEATH – List only one cause on each line. DO NOT ABBREVIATE.
PAR
T I
PAR
T II
27c. Date of Outcome
mm dd yyyy
Date and Time of Death
3a. (Month) (Day) (Year-yyyy) 3b. Time ❑ AM
❑ PM
4. Sex
21d. Date of mm dd yyyyDisposition
1 2 3 4 5
VR 15 (Rev. 01/09)
ME
DIC
AL
CE
RT
IFIC
AT
E O
F D
EA
TH
(To
be fi
lled
in b
y th
e P
hysi
cian
) P
ER
SO
NA
L P
AR
TIC
UL
AR
S(T
o be
fille
d in
by
Fun
eral
Dire
ctor
or,
in c
ase
of C
ity B
uria
l, by
Phy
sici
an)
AUT
MANNER
RESIDENCE
ANC
ICD
CODE
BOR
INST
NH
ANC
H
BP
LDIS
DOHMHUSE ONLY
TH
IS C
ER
TIF
ICA
TE
NO
T V
AL
ID U
NL
ES
S F
ILE
D IN
TH
E D
EPA
RT
ME
NT
OF
HE
ALT
H A
ND
ME
NTA
L H
YG
IEN
E
Place
Of
Death
2a. New York City
2b. Borough
2e. Name of hospital or other facility (if not facility, street address)2c. Type of Place 4 ❑ Nursing Home/Long Term Care Facility1 ❑ Hospital Inpatient 5 ❑ Hospice Facility2 ❑ Emergency Dept./Outpatient 6 ❑ Decedent’s Residence3 ❑ Dead on Arrival 7 ❑ Other Specify
2d. Any Hospice carein last 30 days1 ❑ Yes 2 ❑ No3 ❑ Unknown
VOID

123
CERTIFICATE OF DEATH
Place
Of
Death
2a. New York City
2b. Borough
2e. Name of hospital or other facility (if not facility, street address)
Date and Time of Deathor Found Dead
3a. (Month) (Day) (Year-yyyy) 3b. Time ❑ AM ❑ PM
4. Sex 5. OCME Case No.
6. CAUSEOFDEATH
AP
PR
OX
IMAT
E IN
TER
VAL:
O
NS
ET
TO D
EAT
HPA RT
I
PART II
a. Immediate cause
b. Due to or as aconsequence of
c. Due to or as aconsequence of
7a. Injury Date (mm dd yyyy) 7b. Time❑ AM
❑ PM
7c. At Work1 ❑ Yes
2 ❑ No
7d. Place of Injury – At home, factory, street, etc.
7e. Location
7f. How Injury Occurred
7g. If Transportation Injury Specify
❑ Driver/Operator ❏ Pedestrian
❑ Passenger
❑ Other Specify
9. Autopsy
❑ Yes
❑ No AutopsyPursuant to Law
❑ No Autopsy
8. Manner of Death❑ Pending further study❑ Natural ❑ Homicide❑ Accident ❑ Suicide ❑ Undetermined
10. On the basis of examination and/or investigation, in my opinion, death occurred due to the causes and manner as stated:
Certifier Signature Date
Certifier Name (Print)(Medical Investigator) (Deputy Chief) (Chief) (Medical Examiner)
I certify that I personally examined the body on
at
SIGNATURE:
I did not personally examine the body after death.
SIGNATURE:
Cleared For CremationIf Family Requests
M.E. Signature
(Medical Investigator) (Deputy Chief) (Chief) (Medical Examiner)
(Deputy Chief) (Chief) (Medical Examiner)
(Date) (Location)
or
29c. Date of Outcome
mm dd yyyy
THE CITY OF NEW YORK – DEPARTMENT OF HEALTH AND MENTAL HYGIENE
MEDICAL EXAMINER’S SUPPLEMENTARY REPORTVR 16 (Rev. 01/09) Certificate No.
DECEDENT’S LEGAL NAME (Type or Print)
To be filled in by FUNERAL DIRECTOR or, in case of City Burial, by OCME
THE CITY OF NEW YORK – DEPARTMENT OF HEALTH AND MENTAL HYGIENE
29a. If Female1 ❏ Not pregnant within 1 year of death2 ❏ Pregnant at time of death 3 ❏ Not pregnant at death, but pregnant within 42 days of death4 ❏ Not pregnant at death, but pregnant 43 days to 1 year before death5 ❏ Unknown if pregnant within 1 year of death
30. Did tobacco use contribute to death?
1 ❏ Yes 2 ❏ No 3 ❏ Probably 4 ❏ Unknown
Certificate No.
DATE FILED
❑ New
❑ Corr/Amend
❑ Replacement
31. For infant under one year: Name and address of hospital or other place of birth
Other significant conditions contributing to death but not resulting in the underlying cause given in Part I. Include operation information.
12. Date of Birth (Month) (Day) (Year-yyyy) 13. Age at last birthday(years)
Under 1 Year Under 1 DayMonths Days Hours Minutes
14. Social Security No.
15a. Usual Occupation (Type of work done during most of working life. Do not use “retired”)
15b. Kind of business or industry 16. Aliases or AKAs
17. Birthplace (City & State or Foreign Country)
22. Father’s Name (First, Middle, Last)
24a. Informant’s Name
23. Mother’s Maiden Name (Prior to first marriage) (First, Middle, Last)
24b. Relationship to Decedent 24c. Address (Street and Number Apt. No. City & State ZIP Code)
26a. Funeral Establishment 26b. Address (Street and Number City & State ZIP Code)
11a. Usual Residence State 11b. County 11c. City or Town 11e. Inside City Limits?
1 ❑ Yes 2 ❑ No
11d. Street and Number Apt. No. ZIP Code
19. Ever in U.S. Armed Forces?
1 ❑ Yes 2 ❑ No
21. Surviving Spouse’s/Partner’s Name (If wife, name prior to first marriage)(First, Middle, Last)
25c. Location of Disposition (City & State or Foreign Country)
25b. Place of Disposition (Name of cemetery, crematory, other place)
25d. Date of mm dd yyyyDisposition
2c. Type of Place 4 ❑ Nursing Home/Long Term Care Facility1 ❑ Hospital Inpatient 5 ❑ Hospice Facility2 ❑ Emergency Dept./Outpatient 6 ❑ Decedent’s Residence3 ❑ Dead on Arrival 7 ❑ Other Specify
1 2 3 4 5
18. Education (Check the box that best describes the highest degree or level of school completed at the time of death)1 ❑ 8th grade or less; none 4 ❑ Some college credit, but no degree 7 ❑ Master’s degree (e.g., MA, MS, MEng, MEd, MSW, MBA)2 ❑ 9th – 12th grade; no diploma 5 ❑ Associate degree (e.g., AA, AS) 8 ❑ Doctorate (e.g., PhD, EdD) or 3 ❑ High school graduate or GED 6 ❑ Bachelor’s degree (e.g., BA, AB, BS) Professional degree (e.g., MD, DDS, DVM, LLB, JD)
25a. Method of Disposition1 ❑ Burial 2 ❑ Cremation 3 ❑ Entombment 4 ❑ City Cemetery
5 ❑ Other Specify
28. Race as defined by the U.S. Census (Check one or more toindicate what the decedent considered himself or herself to be)
01 ❏ White 02 ❏ Black or African American
03 ❏ American Indian or Alaska Native(Name of enrolled or principal tribe)
04 ❏ Asian Indian 05 ❏ Chinese
06 ❏ Filipino 07 ❏ Japanese
08 ❏ Korean 09 ❏ Vietnamese
10 ❏ Other Asian–Specify
11 ❏ Native Hawaiian 12 ❏ Guamanian or Chamorro
13 ❏ Samoan
14 ❏ Other Pacific Islander–Specify
15 ❏ Other–Specify
27.Ancestry (Check one box and specify)
❏ Hispanic (Mexican, Puerto Rican, Cuban, Dominican, etc.)
Specify
❏ NOT Hispanic (Italian, AfricanAmerican, Haitian, Pakistani, Ukrainian, Nigerian, Taiwanese, etc.)
Specify
29b. If pregnant within one year of death, outcome of pregnancy
1 ❏ Live Birth
2 ❏ Spontaneous Termination / Ectopic Pregnancy
3 ❏ Induced Termination 4 ❏ None
VR 16 (Rev. 01/09)
ME
DIC
AL
CE
RT
IFIC
AT
E O
F D
EA
TH
(To
be fi
lled
in b
y th
e O
CM
E)
PE
RS
ON
AL
PA
RT
ICU
LA
RS
(To
be fi
lled
in b
y F
uner
al D
irect
or o
r, in
cas
e of
City
Bur
ial,
by O
CM
E)
AUT
MANNER
RESIDENCE
ANC
ICD
CODE
BOR
INST
NH
ANC
H
BP
LDIS
DOHMHUSE ONLY
TH
IS C
ER
TIF
ICA
TE
NO
T V
AL
ID U
NL
ES
S F
ILE
D IN
TH
E D
EPA
RT
ME
NT
OF
HE
ALT
H A
ND
ME
NTA
L H
YG
IEN
E
1. DECEDENT’SLEGAL NAME
(First, Middle, Last)
2d. Any Hospice carein last 30 days1 ❑ Yes 2 ❑ No3 ❑ Unknown
20. Marital/Partnership Status at time of death1 ❑ Married 2 ❑ Domestic Partnership 3 ❑ Divorced4 ❑ Married, but separated 5 ❑ Never Married 6 ❑ Widowed7 ❑ Other, Specify 8 ❑ Unknown
D.O.M.D.
VOID

124
CERTIFICATE OF DEATH
Place
Of
Death
2a. New York City
2b. Borough
2e. Name of hospital or other facility (if not facility, street address)
Date and Time of Deathor Found Dead
3a. (Month) (Day) (Year-yyyy) 3b. Time ❑ AM ❑ PM
4. Sex 5. OCME Case No.
6. CAUSEOFDEATH
AP
PR
OX
IMAT
E IN
TER
VAL:
O
NS
ET
TO D
EAT
HPA RT
I
PART II
a. Immediate cause
b. Due to or as aconsequence of
c. Due to or as aconsequence of
7a. Injury Date (mm dd yyyy) 7b. Time❑ AM
❑ PM
7c. At Work1 ❑ Yes
2 ❑ No
7d. Place of Injury – At home, factory, street, etc.
7e. Location
7f. How Injury Occurred
7g. If Transportation Injury Specify
❑ Driver/Operator ❏ Pedestrian
❑ Passenger
❑ Other Specify
9. Autopsy
❑ Yes
❑ No AutopsyPursuant to Law
❑ No Autopsy
8. Manner of Death❑ Pending further study❑ Natural ❑ Homicide❑ Accident ❑ Suicide ❑ Undetermined
10. On the basis of examination and/or investigation, in my opinion, death occurred due to the causes and manner as stated:
Certifier Signature Date
Certifier Name (Print)(Medical Investigator) (Deputy Chief) (Chief) (Medical Examiner)
I certify that I personally examined the body on
at
SIGNATURE:
I did not personally examine the body after death.
SIGNATURE:
Cleared For CremationIf Family Requests
M.E. Signature
(Medical Investigator) (Deputy Chief) (Chief) (Medical Examiner)
(Deputy Chief) (Chief) (Medical Examiner)
(Date) (Location)
or
29c. Date of Outcome
mm dd yyyy
THE CITY OF NEW YORK – DEPARTMENT OF HEALTH AND MENTAL HYGIENE
MEDICAL EXAMINER’S SUPPLEMENTARY REPORTVR 16 (Rev. 01/09) Certificate No.
DECEDENT’S LEGAL NAME (Type or Print)
To be filled in by FUNERAL DIRECTOR or, in case of City Burial, by OCME
THE CITY OF NEW YORK – DEPARTMENT OF HEALTH AND MENTAL HYGIENE
29a. If Female1 ❏ Not pregnant within 1 year of death2 ❏ Pregnant at time of death 3 ❏ Not pregnant at death, but pregnant within 42 days of death4 ❏ Not pregnant at death, but pregnant 43 days to 1 year before death5 ❏ Unknown if pregnant within 1 year of death
30. Did tobacco use contribute to death?
1 ❏ Yes 2 ❏ No 3 ❏ Probably 4 ❏ Unknown
Certificate No.
DATE FILED
❑ New
❑ Corr/Amend
❑ Replacement
31. For infant under one year: Name and address of hospital or other place of birth
Other significant conditions contributing to death but not resulting in the underlying cause given in Part I. Include operation information.
12. Date of Birth (Month) (Day) (Year-yyyy) 13. Age at last birthday(years)
Under 1 Year Under 1 DayMonths Days Hours Minutes
14. Social Security No.
15a. Usual Occupation (Type of work done during most of working life. Do not use “retired”)
15b. Kind of business or industry 16. Aliases or AKAs
17. Birthplace (City & State or Foreign Country)
22. Father’s Name (First, Middle, Last)
24a. Informant’s Name
23. Mother’s Maiden Name (Prior to first marriage) (First, Middle, Last)
24b. Relationship to Decedent 24c. Address (Street and Number Apt. No. City & State ZIP Code)
26a. Funeral Establishment 26b. Address (Street and Number City & State ZIP Code)
11a. Usual Residence State 11b. County 11c. City or Town 11e. Inside City Limits?
1 ❑ Yes 2 ❑ No
11d. Street and Number Apt. No. ZIP Code
19. Ever in U.S. Armed Forces?
1 ❑ Yes 2 ❑ No
21. Surviving Spouse’s/Partner’s Name (If wife, name prior to first marriage)(First, Middle, Last)
25c. Location of Disposition (City & State or Foreign Country)
25b. Place of Disposition (Name of cemetery, crematory, other place)
25d. Date of mm dd yyyyDisposition
2c. Type of Place 4 ❑ Nursing Home/Long Term Care Facility1 ❑ Hospital Inpatient 5 ❑ Hospice Facility2 ❑ Emergency Dept./Outpatient 6 ❑ Decedent’s Residence3 ❑ Dead on Arrival 7 ❑ Other Specify
1 2 3 4 5
18. Education (Check the box that best describes the highest degree or level of school completed at the time of death)1 ❑ 8th grade or less; none 4 ❑ Some college credit, but no degree 7 ❑ Master’s degree (e.g., MA, MS, MEng, MEd, MSW, MBA)2 ❑ 9th – 12th grade; no diploma 5 ❑ Associate degree (e.g., AA, AS) 8 ❑ Doctorate (e.g., PhD, EdD) or 3 ❑ High school graduate or GED 6 ❑ Bachelor’s degree (e.g., BA, AB, BS) Professional degree (e.g., MD, DDS, DVM, LLB, JD)
25a. Method of Disposition1 ❑ Burial 2 ❑ Cremation 3 ❑ Entombment 4 ❑ City Cemetery
5 ❑ Other Specify
28. Race as defined by the U.S. Census (Check one or more toindicate what the decedent considered himself or herself to be)
01 ❏ White 02 ❏ Black or African American
03 ❏ American Indian or Alaska Native(Name of enrolled or principal tribe)
04 ❏ Asian Indian 05 ❏ Chinese
06 ❏ Filipino 07 ❏ Japanese
08 ❏ Korean 09 ❏ Vietnamese
10 ❏ Other Asian–Specify
11 ❏ Native Hawaiian 12 ❏ Guamanian or Chamorro
13 ❏ Samoan
14 ❏ Other Pacific Islander–Specify
15 ❏ Other–Specify
27.Ancestry (Check one box and specify)
❏ Hispanic (Mexican, Puerto Rican, Cuban, Dominican, etc.)
Specify
❏ NOT Hispanic (Italian, AfricanAmerican, Haitian, Pakistani, Ukrainian, Nigerian, Taiwanese, etc.)
Specify
29b. If pregnant within one year of death, outcome of pregnancy
1 ❏ Live Birth
2 ❏ Spontaneous Termination / Ectopic Pregnancy
3 ❏ Induced Termination 4 ❏ None
VR 16 (Rev. 01/09)
ME
DIC
AL
CE
RT
IFIC
AT
E O
F D
EA
TH
(To
be fi
lled
in b
y th
e O
CM
E)
PE
RS
ON
AL
PA
RT
ICU
LA
RS
(To
be fi
lled
in b
y F
uner
al D
irect
or o
r, in
cas
e of
City
Bur
ial,
by O
CM
E)
AUT
MANNER
RESIDENCE
ANC
ICD
CODE
BOR
INST
NH
ANC
H
BP
LDIS
DOHMHUSE ONLY
TH
IS C
ER
TIF
ICA
TE
NO
T V
AL
ID U
NL
ES
S F
ILE
D IN
TH
E D
EPA
RT
ME
NT
OF
HE
ALT
H A
ND
ME
NTA
L H
YG
IEN
E
1. DECEDENT’SLEGAL NAME
(First, Middle, Last)
2d. Any Hospice carein last 30 days1 ❑ Yes 2 ❑ No3 ❑ Unknown
20. Marital/Partnership Status at time of death1 ❑ Married 2 ❑ Domestic Partnership 3 ❑ Divorced4 ❑ Married, but separated 5 ❑ Never Married 6 ❑ Widowed7 ❑ Other, Specify 8 ❑ Unknown
D.O.M.D.
VOID

125
CERTIFICATE NO.
THE CITY OF NEW YORK – DEPARTMENT OF HEALTH AND MENTAL HYGIENECERTIFICATE OF SPONTANEOUS TERMINATION OF PREGNANCY
DATE FILED FE
TU
SM
OT
HE
R/P
AR
EN
TA
TT
EN
DA
NT
/CE
RT
IFIE
RFE
TU
SP
lace
of D
eliv
ery
FAT
HE
R/
PAR
EN
TFU
NE
RA
L D
IRE
CT
OR
’SC
ER
TIF
ICA
TE
1. NAME (Optional): (First, Middle, Last, Suffix)
4. OBSTETRIC ESTIMATEOF GESTATION
6a. TYPE OF PLACE□ Hospital – ER/ED□ Hospital – Amb. Surg.□ Hospital – Labor/Labor
and Delivery□ Hospital – Other
□ Freestanding Birthing Center□ Home□ Clinic/Doctor’s Office□ Other, Specify _____________□ Unknown
5a. NUMBER DELIVEREDTHIS PREGNANCY __________
6b.FACILITY NAME/ADDRESS
IF MORE THAN ONE
If not in facility, street address: (Street Number and Name, City or Town, County, State, Country, Zip Code)
5b.Number in order of delivery ________
13. RESIDENCE ADDRESS: (Street Number and Name, Apt. No., City or Town, County, State, Country, Zip Code)
If answer to either is yes, do not use this form. Case must bereported by filing a certificate of birth and a certificate of death.
Did heart beat after delivery? _______Was there movement of voluntary muscle? _______
2a. DATE OF DELIVERY(Month) (Day) (Year-yyyy)
7. CURRENT LEGAL NAME: (First, Middle, Last, Suffix) 9. DATE OF BIRTH(Month) (Day) (Year-yyyy)
12. BIRTHPLACECity State
8. NAME PRIOR TO FIRST MARRIAGE: (First, Middle, Last, Suffix) 11. SEX□ Male□ Female
10. AGE
18. SEX□ Male□ Female
17. AGE
14. INSIDE CITY LIMITS?□ Yes □ Unknown□ No
Country
16. DATE OF BIRTH(Month) (Day) (Year-yyyy)
19. BIRTHPLACECity State
Country
15. NAME PRIOR TO FIRST MARRIAGE: (First, Middle, Last, Suffix)
NAME OF CEMETERY OR CREMATORY (OR DESTINATION) CITY OR COUNTY AND STATE DATE OF DISPOSITION(Month) (Day) (Year-yyyy)
3. SEX□ Male □ Unknown □ Female
2b. TIME__________□ Unknown
□ AM□ PM
5c. Number born alive __________________ # of weeks
20. ATTENDANT NAME AT DELIVERY:
(First, Middle, Last, Suffix)
21. CERTIFIER: I HEREBY CERTIFY THAT THIS EVENT OCCURRED AT THE TIME AND ON THE DATEINDICATED AND THAT ALL FACTS STATED IN THIS CERTIFICATE ARE TRUE TO THE BEST OF MY KNOWLEDGE, INFORMATION AND BELIEF.
Signature of Physician Certifier
Name of Physician Certifier
Address
License No. Date_____/_____/_____
□ MD □ DO□ LIC. Midwife □ RPA□ Other, (specify)
____________________
□ MD□ DO
FUNERAL DIRECTOR’S CERTIFICATE
I hereby certify that I have been employed as Funeral Director by
of . This statement is made to obtain a disposition permit
for this fetus
Funeral Establishment Business Registration No.
Address
(Address)
(Signature of Funeral Director) (License No.)
(Name of person in control of disposition)
VR-17 (REV. 01/10)
TH
IS C
ER
TIF
ICA
TE
NO
T V
ALI
D U
NLE
SS
FIL
ED
IN T
HE
DE
PAR
TM
EN
T O
F H
EA
LTH
AN
D M
EN
TAL
HY
GIE
NE
1.Ty
pew
rite
or p
rint
with
bla
ck fi
ne p
oint
ink.
2.C
ertif
icat
es c
onta
inin
g al
tera
tions
or
omis
sion
s ar
e un
acce
pta
ble
.3.
Item
s “D
ate
filed
,” “
Cer
tific
ate
No.
” an
d th
is s
pace
, res
erve
d fo
r th
e D
epar
tmen
t of H
ealth
and
Men
tal H
ygie
ne u
se o
nly.
□I C
ER
TIF
Y T
HA
T I
HA
VE
IN M
Y P
OS
SE
SS
ION
AN
AFF
IDA
VIT
OF
AU
TH
OR
IZA
TIO
N F
OR
CR
EM
AT
ION
____
____
____
FD In
itial
s
VOID

126
Race as defined by the U.S. Census(Check one or more to indicate what the parent considers her/himself to be)
a. Mother/Parent b. Father/Parent
� .......................................White ........................................��.......................Black or African American ........................�� .................American Indian or Alaska Native...................�
Name of enrolled or principal tribe
(Mother/Parent) (Father/Parent)
�..................................Asian Indian ...................................�� .....................................Chinese.......................................��......................................Filipino .......................................��....................................Japanese .....................................��......................................Korean .......................................�� ..................................Vietnamese....................................�� ..................................Other Asian....................................�
Specify
(Mother/Parent) (Father/Parent)
�...............................Native Hawaiian ................................��........................Guamanian or Chamorro .........................�� .....................................Samoan ......................................�� ..........................Other Pacific Islander............................�
Specify
(Mother/Parent) (Father/Parent)
� .......................................Other.........................................�Specify
(Mother/Parent) (Father/Parent)
� ....................................Unknown .....................................�
(Check one box and specify what the parent considers her/himself to be)
a. Mother/Parent b. Father/ParentHispanic (Mexican, Puerto Rican,
�..........................Cuban, Dominican, etc.) .......................�Specify
(Mother/Parent) (Father/Parent)
NOT Hispanic (Italian, African American,Haitian, Pakistani, Ukranian,
� .........................Nigerian, Taiwanese, etc.) ......................�Specify
(Mother/Parent) (Father/Parent)
� ......................................Unknown ...................................�
a. Mother/Parent b. Father/Parent
� .........................Never lived in United States.......................�If born outside of the United States, how long lived in U.S.?
years(Mother/Parent) (Father/Parent)
or if <1 yr, months
(Mother/Parent) (Father/Parent)
c. Was this case referred to OCME? � Yes � No � Unknown If yes, ME Case Number:
THE CITY OF NEW YORK – DEPARTMENT OF HEALTH AND MENTAL HYGIENECONFIDENTIAL MEDICAL REPORT OF SPONTANEOUS TERMINATION OF PREGNANCY (1 of 2)
Only for scientific purposes approved by the Commissioner. Not subject to compelled disclosure.
VR-17 (REV. 01/10)
(Each question MUST be answered)
Mother/Parent Medical Record No. CERTIFICATE NO.
(Check the box that best describes the highest degree or level ofschool completed at time of delivery)
a. Mother/Parent b. Father/Parent
� ......................8th grade or less; none..............................��...................9th-12th grade, no diploma .........................�� .................High school graduate or GED ........................�� ............Some college credit, but no degree....................�� ...............Associate degree (e.g., AA, AS) .......................�� ...........Bachelor’s degree (e.g., BA, AB, BS) ...................�� ..........Master’s degree (e.g., MA, MS, MEng,..................�
MEd, MSW, MBA)� ...................Doctorate (e.g., PhD, EdD)...........................�
or Professional degree (e.g., MD, DDS,DVM, LLB, JD)
� .................................Unknown ........................................�
23. PARENT’S EDUCATION
Yes Noa. Was mother/parent employed during pregnancy? � �
1. Current/most recent 2. Kind of businessoccupation or industry
b. Mother/Parent
c. Father/Parent
28. CAUSE/CONDITIONS CONTRIBUTING TO FETAL DEATH
24. PARENT’S OCCUPATION
26. PARENT’S RACE
27. PARENT’S LENGTH OF TIME IN U.S.
25. PARENT’S ANCESTRY
FOR GESTATION OF 20 WEEKS OR MORE: ALL ITEMS BELOW MUST BE COMPLETED (except OCME cases).
29. PRENATAL
a. Initiating Cause/Condition
(Among the choices below, please select the one that most likelybegan the sequence of events resulting in the death of the fetus).
� Maternal Conditions/Diseases (Specify)
� Complications of Placenta, Cord, or Membranes
� Rupture of membranes prior to onset of labor
� Abruptio placenta
� Placental insufficiency
� Prolapsed cord
� Chorioamnionitis
� Other (Specify)
� Other Obstetrical or Pregnancy Complications (Specify)
� Fetal Anomaly (Specify)
� Fetal Injury (Please consult with OCME)
� Fetal Infection (Specify)
� Other Fetal Conditions/Disorders (Specify)
� Unknown
b. Other Significant Causes or Conditions
(Select or specify all other conditions contributing to death).
� Maternal Conditions/Diseases (Specify)
� Complications of Placenta, Cord, or Membranes
� Rupture of membranes prior to onset of labor
� Abruptio placenta
� Placental insufficiency
� Prolapsed cord
� Chorioamnionitis
� Other (Specify)
� Other Obstetrical or Pregnancy Complications (Specify)
� Fetal Anomaly (Specify)
� Fetal Injury (Please consult with OCME)
� Fetal Infection (Specify)
� Other Fetal Conditions/Disorders (Specify)
� Unknown
a. Primary Payor(Check one)
� Medicaid � Self-pay
� Other govt. insurance � None
� Private insurance � Unknown
b. Total Number of Prenatal Visits for this Pregnancy
� None __________
c. Date of First Prenatal Care Visit
(mm/dd/yyyy) _____/_____/__________
d. Date of Last Prenatal Care Visit
(mm/dd/yyyy) _____/_____/__________
e. Previous Live Births
1. Total Number of Previous Live Births ________ � None
2. Number Born Alive and Now Living ________ � None
3. Number Born Alive and Now Dead ________ � None
f. Date of First Live Birth (mm/yyyy) _____/__________
g. Date of Last Live Birth (mm/yyyy) _____/__________
h. Total Number of Other Pregnancy Outcomes ______ � None(Spontaneous or Induced losses or ectopic pregnancies)Do not include this fetus
i. Date of Last Other Pregnancy Outcome(mm/yyyy) _____/__________
a. Height ________ feet ________ inches
b. Pre-Pregnancy Weight ________ pounds
c. Weight Immediately Prior to Event ________ pounds
30. MOTHER/PARENT HEALTH
a. Risk Factors in this Pregnancy(Check all that apply)
� Diabetes – Prepregnancy
� Diabetes – Gestational
� Hypertension – Pre-pregnancy
� Hypertension – Gestational
� Hypertension – Eclampsia
� Previous Preterm Birth
� Other previous poor pregnancy outcome
� Infertility Treatment – Fertility-enhancing drugs,Artificial/Intrauterine insemination
� Infertility Treatment – Assisted Reproductive Technology
� Mother had a Previous Cesarean Delivery
If yes, how many? __________� Other
� None
� Unknown
31. PREGNANCY FACTORS
d. Cigarette Smoking
1. Cigarette smoking in the 3 months before or during pregnancy?
� Yes � No � Unknown
If yes, average number of cigarettes or packs/day(enter 0 if None)
Cigarettes or Packs/Day
2. 3 mo. before pregnancy __________ or __________
3. First 3 mo. of pregnancy __________ or __________
4. Second 3 mo. of pregnancy __________ or __________
5. Third trimester of pregnancy __________ or __________
e. Alcohol use during this pregnancy?
� Yes � No � Unknown
f. Illicit and other drugs used during this pregnancy?
� Yes � No � Unknown
If yes, check all that apply
� Heroin � Sedatives
� Cocaine � Tranquilizers
� Methadone � Anticonvulsants
� Methamphetamine � Other
� Marijuana � Unknown
22. Date Last Normal Menses Began: _____/_____/_________mm dd yyyy
VOID
127
b. Infection Present and/or Treated During Pregnancy(Check all that apply)
� Gonorrhea � Tuberculosis
� Syphilis � Rubella
� Herpes Simplex (HSV) � Cytomegalovirus
� Chlamydia � Parvovirus
� Bacterial Vaginosis � Toxoplasmosis
� Hepatitis B � Other
� Hepatitis C � None
� Listeria � Unknown
� Group B Strep
31. PREGNANCY FACTORS (cont.)
b. Maternal Morbidity (Check all that apply)(Complications associated with labor and delivery)
� Maternal transfusion
� Third or fourth degree perineal laceration
� Ruptured uterus
� Unplanned hysterectomy
� Admission to intensive care unit
� Unplanned operating room procedure following delivery
� Hemorrhage
� Postpartum transfer to a higher level of care
� Other
� None
� Unknown
c. Was mother transferred for maternal medical or fetal indication prior to delivery?
� Yes � No � Unknown
If yes, name of facility transferred from:
a. Weight of Fetus (grams preferred, specify unit)
_____________ _____________ � lb/oz � grams
b. Estimated Time of Fetal Death
� Death at time of first assessment, no labor ongoing
� Death at time of first assessment, labor ongoing
� Died during labor, after first assessment
� Unknown time of fetal death
c. Was an autopsy performed?
� Yes � No � Planned
d. Was a histological placental examination performed?
� Yes � No � Planned
FOR GESTATION OF 20 WEEKS OR MORE: ALL ITEMS BELOW MUST BE COMPLETED (except OCME cases).
e. Were autopsy or histological placental examination results used in determining the cause of fetal death?
� Yes � No � Unknown
f. Congenital Anomalies of the Fetus(Check all that apply)
� Anencephaly
� Meningomyelocele/Spina bifida
� Cyanotic congenital heart disease
� Congenital diaphragmatic hernia
� Omphalocele
� Gastroschisis
� Limb reduction defect (excluding congenital amputation anddwarfing syndromes)
� Cleft lip with or without cleft palate
� Cleft palate alone
� Down syndrome
� Karyotype confirmed
� Karyotype pending
� Suspected chromosomal disorder
� Karyotype confirmed
� Karyotype pending
� Hypospadias
� Other
� None
� Unknown
THE CITY OF NEW YORK – DEPARTMENT OF HEALTH AND MENTAL HYGIENECONFIDENTIAL MEDICAL REPORT OF SPONTANEOUS TERMINATION OF PREGNANCY (2 of 2)
Only for scientific purposes approved by the Commissioner. Not subject to compelled disclosure.
VR-17 (REV. 01/10)
(Each question MUST be answered)
Mother/Parent Medical Record No. CERTIFICATE NO.
a. Method of Delivery
1. Was delivery with forceps attempted but unsuccessful?
� Attempted and successful � Attempted and unsuccessful
� Forceps were not used � Unknown
2. Was delivery with vacuum extraction attempted but unsuccessful?
� Attempted and successful � Attempted and unsuccessful
� Vacuum extraction was not used � Unknown
3. Fetal presentation at delivery
� Cephalic
� Breech
� Other
� Unknown
4. Final route and method of delivery(Check one)
� Vaginal/Spontaneous
� Vaginal/Forceps
� Vaginal/VacuumVaginal delivery after a previous C-section?
� Yes � No � Unknown
� Primary Cesarean
� Repeat CesareanIf cesarean, was a trial of labor attempted?
� Yes � No � Unknown
5. Hysterotomy/Hysterectomy
� Yes � No � Unknown
32. DELIVERY
33. FETAL ATTRIBUTESVOID
128
1. DATE OF PROCEDURE FOR TERMINATION (Month) (Day) (Year-yyyy) 2. FACILITY TYPE
□ Hospital □ Shared Facility□ Clinic (Article 28) □ Doctor’s Office□ Clinic (non-Article 28) □ Unknown□ Other type _____________________
4. PRIMARY FINANCIAL COVERAGE THIS TERMINATION
□ Medicaid □ Self Pay□ Other Govt. Insurance □ Unknown□ Private Insurance
3A. FACILITY NAME
5. PATIENT’S LEGAL NAME
8. NEVER LIVED IN UNITED STATES □
10. EDUCATION
14. DATE LAST NORMALMENSES BEGAN(Month) (Day) (Year-yyyy)
15. OBSTETRICESTIMATE OF GESTATION
_______ weeks
12. RACERace as defined by the U.S. Census. (Check one or more to indicate what the patient considers herself to be.)
□ White □ Chinese □ Other Asian (specify) □ Other Pacific Islander (specify)□ Black or African American □ Filipino ________________ ________________________□ American Indian or Alaska Native (specify tribe) □ Japanese □ Native Hawaiian □ Other (specify)
_____________________________________ □ Korean □ Guamanian or ________________________
□ Asian Indian □ Vietnamese □ Unknown□ Samoan
13. MARITAL/PARTNERSHIP STATUS□ Married□ Domestic Partnership□ Divorced□ Married, but separated□ Never Married□ Widowed□ Other, Specify _______________□ Unknown
11. ANCESTRY (CHECK ONE BOX AND SPECIFY)□ Hispanic (Mexican, Puerto Rican, Cuban, Dominican, etc.)
Specify□ NOT Hispanic (Italian, African American, Haitian, Pakistani,
Ukranian, Nigerian, Taiwanese, etc.)Specify
□ Unknown
□ 8th grade or less; none □ Associate degree□ 9th–12th grade, no diploma □ Bachelor’s degree□ High school graduate or GED completed □ Master’s degree□ Some college credit, but no degree □ Doctorate or Professional degree
□ Unknown
□ Suction Curettage □ Mifepristone and Misoprostol□ Sharp Curettage (D&C) □ Methotrexate and Misoprostol□ Dilation and Evacuation (D&E) □ Other Medical (nonsurgical)□ Intra-Uterine Instillation Specify Medications□ Hysterotomy/Hysterectomy□ Misoprostol □ Other, Specify
9. PATIENT’S USUAL RESIDENCE (COMPLETE ONLY ONE)
If born outside of the United States,
how long lived in U.S.?________(years)
Or if less than 1 year, ________(months)
6. PATIENT’S DATE OF BIRTH(Month) (Day) (Year-yyyy)
7. PATIENT’S BIRTHPLACE
City or Town State CountryFirst Name _____l_____
(First two letters)
3B. FACILITY ADDRESSStreet Number and Name Apt. #, Suite #, etc.
City or Town County State Country ZIP Code
CERTIFICATE NO.(For Health Dept. Use Only)
THE CITY OF NEW YORK – DEPARTMENT OF HEALTH AND MENTAL HYGIENECERTIFICATE OF INDUCED TERMINATION OF PREGNANCYUse this form ONLY for induced terminations whether surgical or medical.
Only for scientific purposes approved by the Commissioner; not subject to compelled disclosure.
DATE FILED (For Health Dept. Use Only)
VR-18(REV. 01/13)
FAC
ILIT
YP
AT
IEN
TP
AT
IEN
T A
TT
RIB
UT
ES
ME
DIC
AL
AT
TE
ND
AN
T/C
ER
TIF
IER
16. PREVIOUS PREGNANCIES
17. TERMINATION PROCEDURE
17A. PRIMARY PROCEDURE (CHECK ONLY ONE)
19. ATTENDANT NAME AT TERMINATION:
(First, Middle, Last, Suffix)
20. CERTIFIER: I HEREBY CERTIFY THAT THIS EVENT OCCURRED AT THE TIME AND ON THE DATE INDICATED AND THAT ALL FACTS STATED IN THIS CERTIFICATEARE TRUE TO THE BEST OF MY KNOWLEDGE, INFORMATION AND BELIEF.
17B. ADDITIONAL PROCEDURES (CHECK ALL THAT APPLY)
Last Name _____l_____(First two letters)
a. Total Number of Previous Live Births ______ □ None
b. Born Alive Now Living ______ □ None
c. Born Alive Now Dead ______ □ None
d. Total Number of Other Pregnancy Outcomes ______ □ None
e. Number of Spontaneous Terminations ______ □ None
f. Number of Induced Terminations ______ □ None
□ None□ Suction Curettage□ Sharp Curettage (D&C)□ Dilation and Evacuation (D&E)□ Intra-Uterine Instillation□ Hysterotomy/Hysterectomy□ Misoprostol
□ Mifepristone and Misoprostol□ Methotrexate and Misoprostol□ Other Medical (nonsurgical)
Specify Medications
□ Other, Specify
□ MD□ DO□ NP
□ MD□ DO□ NPSignature of Certifier
Name of Certifier
Address
License No. Date_____/_____/_____
□ New York City ZIP Code ____l____l____l____l____□ Manhattan □ Bronx □ Brooklyn □ Queens □ Staten Island□ Unknown
□ New York State (Outside NYC)City or Town County ZIP Code
□ Outside NYS
______________________(U.S. State)
□ Outside U.S.
______________________(Foreign Country)
completed
Chamorro
18. CONTRACEPTIVE METHOD PRESCRIBED AND/OR DISPENSED AFTER THIS PROCEDURE (Check all that apply)□ None Offered □ Oral Contraceptive Pills □ Injection □ Contraceptive Patch □ Diaphragm □ Emergency Contraception□ Offered but Declined □ Condoms □ Contraceptive Implant □ Cervical Vaginal Ring □ IUD □ Other, Specify _____________
VOID