summary results - 康樂及文化事務署
TRANSCRIPT


Summary Results
“The Physical Fitness Test for the Community” (the Study) was the first territory-wide physical fitness test for Hong Kong, conducted by random sampling to collect data on the physical fitness of Hong Kong people. The objectives of the Study were to: (1) enable individual participants to have a general understanding of their physical fitness condition; (2) continue building up a physical fitness database of Hong Kong people; (3) identify the relationship between physical exercise pattern and physical fitness of Hong Kong people; and (4) identify priority areas for improvement to enhance the overall physical fitness of the public.
As part of the “Healthy Exercise for All Campaign”, the Study, conducted between April 2011 and January 2012, was steered by the Advisory Committee for the “Healthy Exercise for All Campaign - Physical Fitness Test for the Community” set up by the Community Sports Committee under the Sports Commission, and coordinated by the Leisure and Cultural Services Department. It consisted of questionnaire survey and a series of
) that was carried out by the General Administration of Sport of China. Target participants were Hong Kong citizens (infants aged 3–6, children aged 7–12, adolescents aged 13–19, adults aged 20–59 and the elderly aged 60–69). The Study selected over 13,000 participants as sample through stratified and random sampling in 18 districts, and ended up securing 8,178 valid samples.
508
2,723
5841,846
2,517
2
Successful Samples4/2011 ~ 1/2012 18 districts
Selected over 13,000 participants
8,178 valid samples
Mid-2011 Provisional Population Figures”

Results showed that 19.4% and 8.8% of infants and children respectively were underweight while 13.5% and 26.9% of the two age groups were overweight or obese. In adolescents, 18.5% of boys were overweight or obese whereas 21.0% of girls were underweight. At least one in two men aged 20 or above was classified as overweight or obese. 40.8% of elderly women were obese. The fact that weight problem straddles various age groups is a matter of concern.
There is a significant correlation between Physical Activity (P.A.) level and physical fitness. A higher level of P.A. is accompanied with a more desirable physical fitness. Only 17.7% of the infants spent an hour or more on outdoor activities a day. 51.8% of children, 42.3% of adolescents, and 37.1% of adults and the elderly were classified as physically active as measured by the “Baseline Indicator” which defined one as being physically active for performing physical activities of moderate intensity or above for at least 30 minutes a day and 3 days per week. The percentages would be much lower, at 8.3%, 8.4%, and 28.6% respectively, if the “American Indicator” was adopted that assessed the state of being physically active by the amount of physical activities that should vary with different age groups. Simply put, a majority of Hong Kong people did not have sufficient P.A. Physical Activity (P.A.) Level
American Indicator(2008 P.A. Guidelines for American, USDHHS)
Baseline Indicator
For all age groups
• 3 days per week• Accumulation of 30 min
of mod-or-above intensity P.A. per day
Adults & the Elderly : Accumulation of 150 min of mod-or-above intensity P.A. per week (or 75 min of vigorous intensity P.A. or other combinations of different intensities)
Children : 7 days per week, accumulation of 60 min of mod-or-above intensity P.A. per day
Adolescents : In addition to the recommendations for children, any 3 days must be involved with vigorous intensity P.A.
Age Groups Meet Baseline Indicator (%)
Meet American Indicator (%)
Children (excluding P.E. lesson) 51.8 8.3
Adolescents 42.3 8.4
Young Adults 37.1 28.5
The middle-aged 37.2 28.5
The Elderly 36.5 29.3
P.A. Level (Active)

Men generally fared better than women in all age groups in terms of physical fitness. After reaching adulthood, both genders registered significant drop in physical fitness and increase in exposure to various health risks (obesity, high BP, and low cardiovascular fitness) as age advanced. Meanwhile, women’s fitness was found to have diminished much faster than men’s.
Physical fitness and P.A. level were also found to have a different degree of correlation with the living habits such as sleeping time, screen time, parents’ rate in P.A., and education attainment. It follows that personal lifestyle, if carefully adjusted, could raise people’s physical fitness and P.A. level. The proposed adjustments include sufficient time for sleeping (neither too many nor too few), reduction in sedentary activities, increase in family-oriented P.A., start running a balanced diet at an earliest age, and regular updating of fitness-related information, etc.
The P.A. found to be most popular among the infants was “playing in the playground”. “Ball games” were found to be the most popular for children and adolescents. For young adults, the most popular items were “ball games” and “running”/ “jogging”. With the increase of age, “walking” took over the lead. The reasons most frequently adduced by children for the state of being inactive were “bad weather”, “too much homework”, and “being too tired”. For adolescents, the most frequently cited reasons were “not interested”, “lazy”, and “lack of spare time”. For adults and the elderly, they were “lack of spare time”, “tired”, and “lazy”.
Major Obstacles to P.A. Participation
Adolescents
Lazy
Lack of Spare Time
Children
Too Much Homework
Inclement Weather
Not interested
Being Too Tired
Lazy
Tired
Lack of Spare Time
Adults & the Elderly
Most Favorite Sports Activities
29.7 45.3 80.4
Infants(%)
Playing in thePlayground SwimmingBall
Games
42.0 48.8 68.1
Children(%) Ball GamesSwimmingTrack &
Field
Ice Skating/ Roller Skating: 24.8
Ball GamesAdolescents
(%)
75.1
Swimming: 24.7
Frequently Participated Sports Activities
Adults & the Elderly
Young Adults(%)
40.436.924.7
Running / Jogging Ball GamesWalking
The Middle-aged(%)
23.7 26.8 35.5
WalkingRunning / JoggingHiking
The Elderly(%) Hiking
18.3 21.3 51.4
WalkingTai Chi
Infants
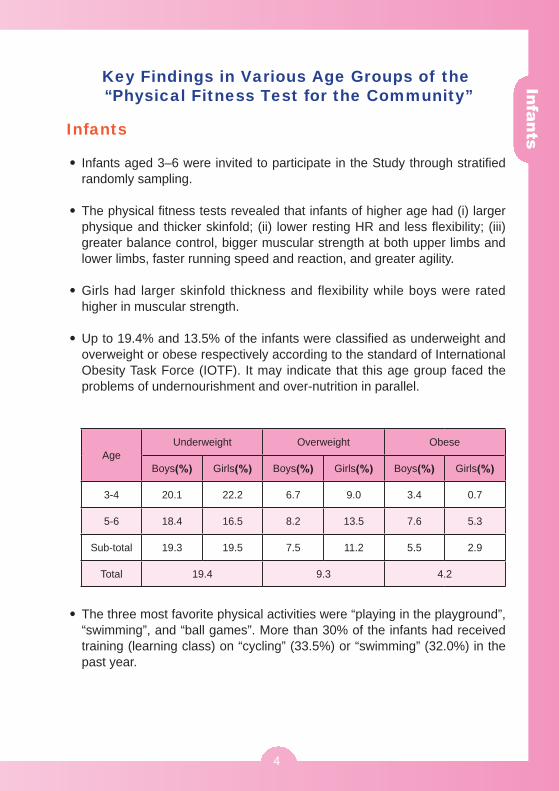
Infants aged 3–6 were invited to participate in the Study through stratified randomly sampling.
The physical fitness tests revealed that infants of higher age had (i) larger physique and thicker skinfold; (ii) lower resting HR and less flexibility; (iii) greater balance control, bigger muscular strength at both upper limbs and lower limbs, faster running speed and reaction, and greater agility.
Girls had larger skinfold thickness and flexibility while boys were rated higher in muscular strength.
Up to 19.4% and 13.5% of the infants were classified as underweight and overweight or obese respectively according to the standard of International Obesity Task Force (IOTF). It may indicate that this age group faced the problems of undernourishment and over-nutrition in parallel.
Key Findings in Various Age Groups of the “Physical Fitness Test for the Community”
The three most favorite physical activities were “playing in the playground”, “swimming”, and “ball games”. More than 30% of the infants had received training (learning class) on “cycling” (33.5%) or “swimming” (32.0%) in the past year.
AgeUnderweight Overweight Obese
Boys Girls Boys Girls Boys Girls
3-4 20.1 22.2 6.7 9.0 3.4 0.7
5-6 18.4 16.5 8.2 13.5 7.6 5.3
Sub-total 19.3 19.5 7.5 11.2 5.5 2.9
Total 19.4 9.3 4.2

Less than 20% of infants (17.7%) in Hong Kong performed an hour or more
a minimum of 60 minutes’ physical activities each day for children aged 2 years or above. The Study findings pointed to an insufficient P.A. in this age group.
The findings indicated that the more frequent the infants took part in P.A. together with their family members, the longer the infants’ outdoor activity lasted. More than half of infants (51.5%), though, could not manage to have P.A. with the rest of the families at least once per week. 6.1% even did not have such P.A. during weekends or on holidays in the past year.
American Academy of Pediatrics, Committee on Public Education thought it not advisable for children aged 2 or above to spend more than 2 hours of watching television and videos each day. The findings, however, were that almost a quarter of the infants had spent 2 hours or more with TV, cell phone or computer and video games. It is revealed that infants aged 5 to 6 with sedentary activity lasting for two hours or more a day were found to have faster resting HR, less leg muscular strength, lower running speed, and longer reaction time.

Children
Children aged 7–12 were invited to participate in the Study through stratified randomly sampling.
The physical fitness tests revealed that children of higher age had (i) larger physique, higher BMI, thicker skinfold, and higher resting blood pressure; (ii) lower resting HR; (iii) greater muscular strength and endurance as well as higher cardiovascular fitness.
Girls had higher resting HR and flexibility, and carried smaller percent body fat while boys had larger muscular strength at lower limbs and higher cardiovascular fitness.
26.9% of children were classified as overweight or obese and 8.8% were underweight if measured by the standard of the International Obesity Task Force (IOTF). The figures may reflect insufficient P.A. and imbalanced diet among the children.
AgeUnderweight Overweight Obese
Boys Girls Boys Girls Boys Girls
7-9 8.0 10.1 18.2 16.6 10.0 6.2
10-12 7.6 9.8 22.4 19.7 10.2 3.2
Sub-total 7.8 9.9 20.5 18.3 10.1 4.5
Total 8.8 19.5 7.4

About 80% of the children (81.1%) indicated that they had sufficient or very sufficient P.A.. If measured by the “American Indicator” (with modifications), however, only 9.5% of boys and 7.0% of girls were “active”. There was substantial discrepancy between the children’s self-evaluation and the reality.
Category (with modification)
least 60 minutes of moderate-or above intensity physical activity in a week
Boys Girls(%) Total(%)
III Active 7 days 9.5 7.0 8.3
II Some active 1-6 days 69.9 72.2 71.0
I Sedentary <1 day 20.5 20.9 20.7
The percentage of children deemed “active” significantly increased from 5.7% to 9.0% in the past two years (if measured by the American Indicator”), chiefly attributable to a significant increase in the number of girls being classified as “active”. The Study found that children with higher P.A. level had much better performances regarding muscular strength and cardiovascular fitness.
About half of the children did pass the mark set by the “Baseline Indicator” with the proportion of boys being “active” reaching 54.7%, larger than the girls at 48.7%. The use of different standard made no difference to the discrepancy between what the children assessed for themselves and the real situation.
CategoryAccumulation of moderate-or-above intensity physical activity in a week
Boys Girls(%) Total(%)
III Active 54.7 48.7 51.8
II Some active 30-89 minutes 35.7 44.6 40.0
I Sedentary < 30 minutes 9.6 6.7 8.2

About 80% of children had taken part in sports training as extra-curricular activities in the past year with “ball games” being the most favorite sports, followed by “swimming” and “track and field”.
The three major reasons adduced by the children for their poor physical health were “insufficient sleep”, “imbalanced diet”, and “too much homework”. The fourth reason was “inadequate physical activity”.
The three major benefits the children associated with P.A. were that it “helps maintain physical health”, “develops various physical skills”, and “helps control body-weight”.
The three major reasons for the children taking part in the P.A. were “I like P.A.”, “P.A. is very interesting”, and “P.A. makes me feel happy”.
The three major obstacles the children cited for P.A. were “bad weather”, “too much homework”, and “being too tired”.
Major Reasons Cited for Poor Physical Health
2nd 3rd 4th1st
Imbalanced Diet
47.2%
Inadequate P.A.
38.0%
Insufficient Sleep62.9%
Too much homework
38.8%
Children

About 40% of the children spent more than 5 hours on sedentary activities (including study and recreation) after school. It was found that children registered a significant drop in P.A. level but a major hike in BMI when their screen time (watching TV/ movies, playing electronic games, using computer or web-surfing) increased.
17.9% of the children slept less than 7 hours per day while the percentage of those who slept for 9 hours or more per day was 32.0%. There was a significant difference in physical fitness between groups of children having different sleep hours. Children who slept for 7 to 8 hours each day generally had a higher score than those with less or more sleeping time in terms of the performances in exercise measurements.
Screen Time & P.A. Level
• Chi-square Test: p .01• Screen Time P.A. Level †
Gender Boys (%) Girls (%)
Screen Time per Day (min) 180 >180 < 60 60
P.A. Level †
Sedentary 18.1 32.0 21.5 20.5Some Active 73.0 55.6 68.8 74.2
Active 8.9 12.4 9.7 5.3† American Indicator
Children
Screen Time & BMI
18.6018.5618.3318.42
16.99
17.8717.86
17.27
18.53
17.00
16.0
16.5
17.0
17.5
18.0
18.5
19.0
0 <60 60-120 121-180 >180
Screen Time(min)
BMI
BoysGirls
Children

59.5% of the children had been in contact with electronic motion-sensing games and of this, more than 80% thought that the games inspired greater interest in sports participation. Half of those having been in contact with the electronic motion-sensing games had spent on them for an hour or more per day. Electronic screen-based motion-sensing games are increasingly popular nowadays with great attraction to young generation.
Children of those parents who had taken part in P.A. more frequently were correspondingly more active. But the Study indicated that 34.9% of fathers and 37.2% of mothers did not participate in exerise of any sort. Moreover, up to 62.9% of the families had not arranged P.A. on weekends or holidays (at least once a week) in the past year.
ParametersSleeping Time (hours)
p-value 6 7– 8 9
BMI (kg/m2) 18.03 (3.30) 17.88 (3.11) 17.19 (2.97) 0.000
Chest Circumference (cm) 70.34 (8.74) 71.00 (8.38) 67.79 (8.09) 0.000
Handgrip (kg) 28.13 (9.65) 29.26 (9.64) 25.11 (8.95) 0.000
1 min Sit-up (rep) 19.70 (8.97) 19.94 (8.73) 17.51 (8.42) 0.000
StandingLong Jump (cm) 113.45 (24.63) 116.29 (23.87) 110.31 (22.41) 0.000
15 m PACER (turns) 14.78 (6.45) 16.33 (6.83) 13.95 (5.06) 0.000
Children (Girls)
Sleeping Time & Physical Fitness

Adolescents
Adolescents aged 13–19 were invited to participate in the Study through stratified randomly sampling.
The physical fitness tests revealed that boys had a larger physique than girls and higher resting blood pressure and vice versa in skinfold thickness, percent body fat, and resting HR. Boys also fared better than girls in various exercise measurements except sit-and-reach test. The overall physical fitness of both genders recorded a significant increase as age advanced with the increase in boys at a higher rate than the girls’.
If measured by the standard of the International Obesity Task Force (IOTF), 18.5% of boys and 9.4% of girls were overweight or obese; the percentages of underweight for the corresponding genders were 15.5% and 21.0%. The proportion of boys being classified as overweight or obese was higher than girls but the proportion of girls being underweight was higher.
The Study indicated that adolescents with higher P.A. level had much better scores in tests relating to muscular strength and cardiovascular fitness. If judged by the standard of the “American Indicator (with modifications)”, only 12.8% of boys and 4.2% of girls were classified as “active”.
AgeUnderweight Overweight Obese
Boys Girls Boys Girls Boys Girls
13-15 12.8 13.4 15.0 9.5 7.1 2.4
16.-19 17.3 26.3 11.9 5.8 4.0 1.8
Sub-total 15.5 21.0 13.2 7.4 5.3 2.1
Total 18.2 10.3 3.7
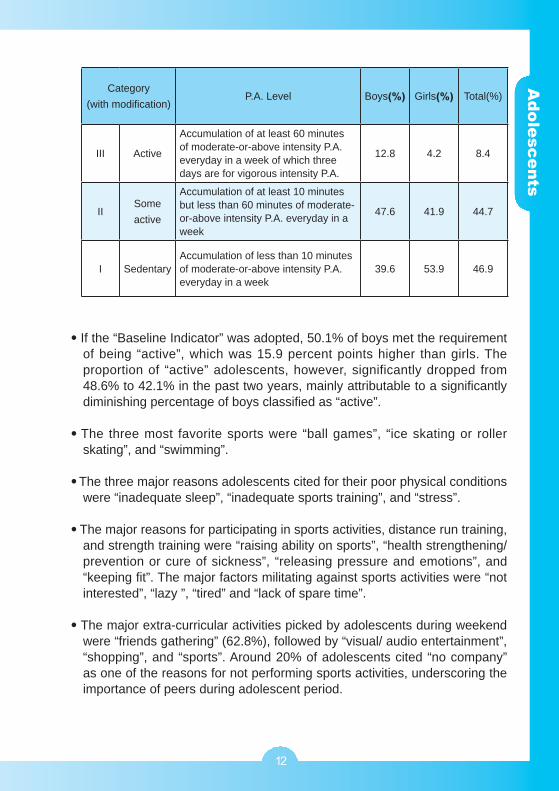
If the “Baseline Indicator” was adopted, 50.1% of boys met the requirement of being “active”, which was 15.9 percent points higher than girls. The proportion of “active” adolescents, however, significantly dropped from 48.6% to 42.1% in the past two years, mainly attributable to a significantly diminishing percentage of boys classified as “active”.
The three most favorite sports were “ball games”, “ice skating or roller skating”, and “swimming”.
The three major reasons adolescents cited for their poor physical conditions were “inadequate sleep”, “inadequate sports training”, and “stress”.
The major reasons for participating in sports activities, distance run training, and strength training were “raising ability on sports”, “health strengthening/ prevention or cure of sickness”, “releasing pressure and emotions”, and “keeping fit”. The major factors militating against sports activities were “not interested”, “lazy ”, “tired” and “lack of spare time”.
The major extra-curricular activities picked by adolescents during weekend were “friends gathering” (62.8%), followed by “visual/ audio entertainment”, “shopping”, and “sports”. Around 20% of adolescents cited “no company” as one of the reasons for not performing sports activities, underscoring the importance of peers during adolescent period.
Category (with modification)
P.A. Level Boys Girls Total(%)
III Active
Accumulation of at least 60 minutes of moderate-or-above intensity P.A. everyday in a week of which three days are for vigorous intensity P.A.
12.8 4.2 8.4
IISome active
Accumulation of at least 10 minutes but less than 60 minutes of moderate-or-above intensity P.A. everyday in a week
47.6 41.9 44.7
I SedentaryAccumulation of less than 10 minutes of moderate-or-above intensity P.A. everyday in a week
39.6 53.9 46.9
During school days, a majority of adolescents had 6 to less than 9 hours of sleep. However, 8.8% of boys and 14.4% of girls had less than 6 hours of sleep while the corresponding percentages for boys and girls who slept in excess of 9 hours were 10.2% and 5.4%.
Senior secondary students’ time of sleep (boys: 7.12 hours, girls: 6.74 hours) is less than junior secondary ones (boys: 7.64 hours, girls: 7.32 hours), probably reflecting a higher academic stress the former group faced. The girls, on the other hand, slept less than boys during school days and vice versa during non-school days.
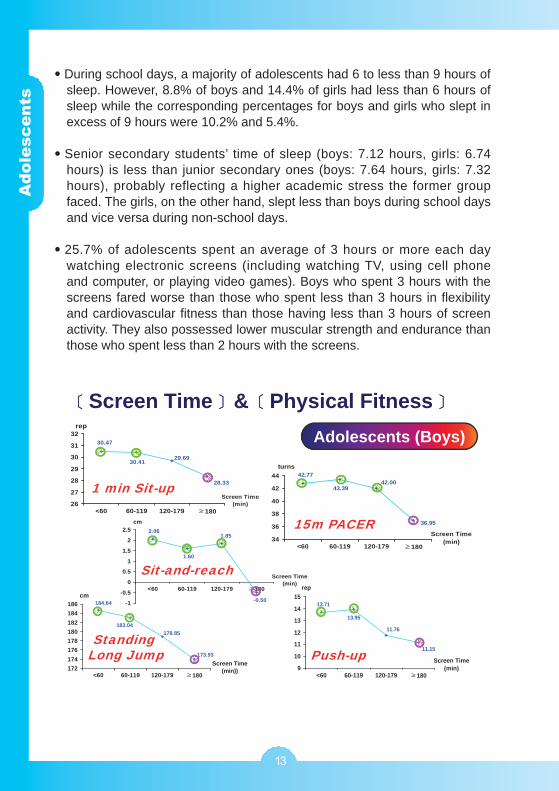
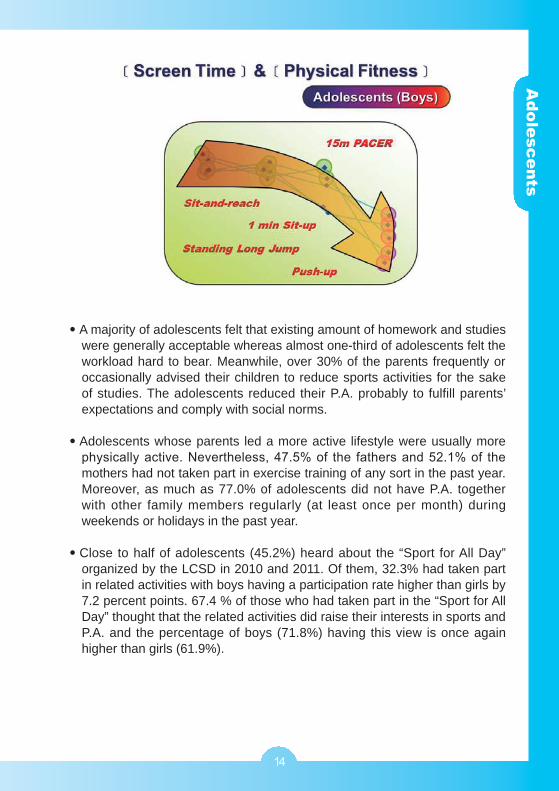
25.7% of adolescents spent an average of 3 hours or more each day watching electronic screens (including watching TV, using cell phone and computer, or playing video games). Boys who spent 3 hours with the screens fared worse than those who spent less than 3 hours in flexibility and cardiovascular fitness than those having less than 3 hours of screen activity. They also possessed lower muscular strength and endurance than those who spent less than 2 hours with the screens.
2.06
1.60
1.85
-0.50-1
-0.5
0
0.5
1
1.5
2
2.5
<60 60-119 120-179 180
Screen Time(min)
cm
Screen Time & Physical FitnessAdolescents (Boys)
42.77
43.3942.00
36.95
34
36
38
40
42
44
<60 60-119 120-179 180
Screen Time(min)
turns
30.47
30.4129.69
28.33
26
27
28
29
30
31
32
<60 60-119 120-179 180
Screen Time(min)
rep
11.15
11.76
13.95
13.71
9
10
11
12
13
14
15
<60 60-119 120-179 180
Screen Time(min)
rep
173.93
178.85183.04
184.64
172174176178180182184186
<60 60-119 120-179 180
Screen Time(min))
cm
1 min Sit-up
15m PACER
Sit-and-reach
StandingLong Jump Push-up
A majority of adolescents felt that existing amount of homework and studies were generally acceptable whereas almost one-third of adolescents felt the workload hard to bear. Meanwhile, over 30% of the parents frequently or occasionally advised their children to reduce sports activities for the sake of studies. The adolescents reduced their P.A. probably to fulfill parents’ expectations and comply with social norms.
Adolescents whose parents led a more active lifestyle were usually more
mothers had not taken part in exercise training of any sort in the past year. Moreover, as much as 77.0% of adolescents did not have P.A. together with other family members regularly (at least once per month) during weekends or holidays in the past year.
Close to half of adolescents (45.2%) heard about the “Sport for All Day” organized by the LCSD in 2010 and 2011. Of them, 32.3% had taken part in related activities with boys having a participation rate higher than girls by 7.2 percent points. 67.4 % of those who had taken part in the “Sport for All Day” thought that the related activities did raise their interests in sports and P.A. and the percentage of boys (71.8%) having this view is once again higher than girls (61.9%).

Adults & the Elderly
Adults aged 20–59 and elderly aged 60–69 were invited to participate in the Study through stratified randomly sampling.
The physical fitness tests revealed that men performed better than women in exercise measurements as a whole except the sit-and-reach test. There was an atrophy in the overall physical fitness as ones’ age advanced for both genders with the diminution rate of women significantly higher than men’s.
14.0% of young (aged 20–39) women were deemed underweight if measured by the BMI that was laid down by the World Health Organization (WHO). There was a continuous increase in the proportion of women facing obesity problem as their age advanced. 40.3% of middle-aged (aged 40–59) men and 40.8% of older women were obese. Men and women whose waist circumference is greater than 90cm and 80cm respectively were classified as having central obesity. It followed that over a quarter of adults and the elderly faced such problem.
66.5 62.9
12.9
54.1
30.7
18.522.8
48.4
25.9
9.4
14.1
59.9
0.0
10.0
20.0
30.0
40.0
50.0
60.0
70.0%
Men/ BoysWomen/ Girls
The Prevalence of Overweight / Obese
* #* * # #
* Reference: IOTF (2000)# Reference: WHO (2000)

There was a significant increase in the proportion of people with hypertensive response beginning at young group. The percentage of elderly men with such symptom was 2.4 times that of young men (16.4%). The percentage of elderly women with the symptom was as high as 5.6 times that of young women (6.3%).
AgeHigh Blood Pressure Symptom (%)
Men Women Total
20-39 16.4 6.3 10.6
40-59 29.0 19.4 23.9
60-69 40.0 35.1 37.6
All 25.7 15.6 20.2
The “active” group had a higher overall physical fitness. If the “International Physical Activity Questionnaire (IPAQ)” and “American Indicator” (with modifications) were adopted, only less than 30% of adults and the elderly had sufficient amount of P.A. (including active and highly active levels) in each age groups. Almost one of every two adults was found “sedentary”. The percentage of “active” people hovered around 28% to 30% in the past two years.
Central Obesity Waist Circumference
TEXT
TEXT
TEXT
TEXT
TXT22.2
31.4
33.132.7
55.1
10.80.0
10.0
20.0
30.0
40.0
50.0
60.0
YoungAdults
The Middled-aged
The Elderly
%
Men: > 90cm
Women: > 80cm
Reference: WHO (2000)
If the “Baseline Indicator” was taken into account, though, the percentage of men counted as “active” was 41.3%, which was higher than women by 7.7 percent points. The proportion of adults and the elderly classified as “active” dropped significantly from 43.5% to 37.0% in the past two years and of them, men and women registered a drastic decrease by 8.7 and 4.2 percent points respectively.
In the whole group comprising adults and the elderly, the time spent on walking per day was 84.90 minutes on average. More than 60% spent less than 120 minutes on walking. Meanwhile, the time spent on sitting was 7.01 hours per day on average.
The four activities most frequently chosen during leisure were “audio/ video entertainment”, “shopping”, “browsing on the internet”, and “sports/ physical exercise”. More than half of the respondents took part in sport activities for “health strengthening/ prevention or cure of sickness”. There is however as high as a quarter of young adults having no sports activities. The proportion of other two age groups (middle-aged: 35.7%, elderly: 32.5%) also drew concerns. More and more people showed no interest in sport with the advance in age. The percentage of those who were not suitable for participating in related activities because of health problems is also on the rise.
The three major factors militating against sports activities were “lack of spare time”, “tired”, and “lazy”. 71.5% of young adults said they could not spare time for sports activities, a percentage that is higher than the other two age groups (middle-aged: 61.2%, elderly: 40.8%) The statistics also showed that 81.9% of men and 58.1% of women had full-time/part-time jobs. Their average working duration were 47.75 hours. 11.0% of them even worked for at least 60 hours. 28.3% of the elderly had not yet retired.
The five sports activities most frequently picked by adults and the elderly were “walking”, “running/ jogging”, “ball games”, “swimming”, and “hiking”. “Ball games” and “running/ jogging” were most popular among young adults but it was “walking” that got the first place when age advanced. It pointed to a decline in popularity of physically demanding activities or those involving body-contact when ones became older. It explained why walking was a more appropriate choice for the elderly.

There was a significant association between family income and men's P.A. level. More physically active men were found in family with higher income but the bearing of the family income on women’s P.A. level was not significant.
In men, non-smokers had smaller waist-to-hip ratio, larger leg power, better balance-controlling ability, and shorter reaction time than smokers. In women, as there was probably a high sampling error due to small number of female smoking participants got as sample, no significant difference in physical fitness was detected between smokers and non-smokers.
Types of occupations were highly associated with one’s P.A. level. In men, 47.9% of the “professionals” were classified as “active”, the occupation type that got the highest percentage among other types. In women, “managers or administrators” had the largest proportion of being classified as “active” at 34.8%.
The higher levels of education women attained, the more physically fit they were as a whole, probably due to more knowledge they had about health and physique. The association between education level and fitness in men was not as obvious as in women. But certain significant differences were detected when comparing tertiary education and secondary education groups with the former having better physical fitness.
Close to half of adults and the elderly (46.4%) heard about the “Sport for All Day” organized by the LCSD in 2010 and 2011. 53.7% of young adults had the knowledge of related activities, which was higher than older adults by 22.9 percent points. Of the adults and the elderly who heard about the “Sport for All Day”, 12.2% had taken part in related activities as much as 60.4% of “Sport for All Day” participants thought that taking part in related activities could raise their interests in sports and P.A..
Frequently Participated Sports ActivitiesAdults & the Elderly
Ball Games
27.720.519.8
Adults and the Elderly (%) Hiking Swimming WalkingRunning /
Jogging
29.0 32.8
Ball Games
40.436.924.7
Young Adults(%)
Running /Jogging
23.7 26.8 35.5
The Middle-aged(%)
Walking
Hiking Running /Jogging
Walking
Hiking
18.3 21.3 51.4
WalkingThe Elderly
(%)Tai Chi