summertime foraging ecology of north atlantic right · pdf filesummertime foraging ecology of...
TRANSCRIPT
MARINE ECOLOGY PROGRESS SERIESMar Ecol Prog Ser
Vol. 264: 123–135, 2003 Published December 15
INTRODUCTION
The foraging behavior of marine mammals is difficultto observe directly, because it often occurs below thesea surface. The miniaturization of sensors and dataloggers in recent decades has facilitated the develop-ment of time-depth recorders (TDR) to study the divingbehavior of marine mammals (Kooyman 1989, Costa1993), but obtaining information about prey distribu-tion and abundance at the same temporal and spatialscales of the TDR is rarely feasible. The North Atlantic
right whale Eubalaena glacialis occupies a uniquetrophic position in the marine ecosystem; it is one ofthe world’s largest predators (up to 17 m), yet it feedsprimarily on one of the smallest marine animals, the 2to 3 mm long calanoid copepod Calanus finmarchicus.Assessing the abundance of this copepod at spatialscales that are relevant to a right whale (10s of cm to min the vertical, 10s to 100s of m in the horizontal) isnearly impossible with conventional net samplingmethods. Targeted net sampling is only feasible whenright whales are feeding at or very near the surface
© Inter-Research 2003 · www.int-res.com*Email: [email protected]
Summertime foraging ecology of North Atlanticright whales
Mark F. Baumgartner1, 3,*, Bruce R. Mate2
1College of Oceanic and Atmospheric Sciences, Oregon State University, 104 Ocean Administration Building, Corvallis, Oregon 97331, USA.
2Coastal Oregon Marine Experiment Station, Hatfield Marine Science Center, Oregon State University, Newport, Oregon 97365, USA
3Present address: Biology Department, MS #33, Woods Hole Oceanographic Institution, Woods Hole, Massachusetts 02543, USA
ABSTRACT: North Atlantic right whales were instrumented with suction-cup mounted, time-depthrecorders (TDR) during the summers of 2000 and 2001 to examine their diving and foraging behav-ior. Simultaneous observations of temperature, salinity and the vertical distribution of their principalprey, Calanus finmarchicus stage 5 copepodites (C5), were obtained along each whale’s track with aconductivity-temperature-depth instrument (CTD) and an optical plankton counter (OPC). Rightwhale feeding dives were characterized by rapid descent from the surface to a particular depthbetween 80 and 175 m, remarkable fidelity to that depth for 5 to 14 min and then rapid ascent backto the surface. The average depth of dive was strongly and positively correlated with both the aver-age depth of peak C. finmarchicus C5 abundance and the average depth of the bottom mixed layer’supper surface. Significantly longer surface intervals were observed for reproductively active femalesand their calves when compared to other individuals, indicating that this critical segment of the pop-ulation may be at increased risk of ship strikes owing to their diving behavior. Ingestion rates calcu-lated from TDR and OPC data exceeded estimated daily metabolic requirements for most of thetagged right whales; however, short deployment durations and uncertainty in metabolic rates makeit impossible to judge whether individual right whales were obtaining sufficient energy to meet themetabolic costs of reproduction. Improvements in attachment durations and the development ofnovel methods to estimate the metabolic rates of large whales in situ are required to determinewhether right whale reproduction is limited by insufficient food resources.
KEY WORDS: Right whale · Eubalaena glacialis · Calanus finmarchicus · Diving behavior · Energetics · Aggregation
Resale or republication not permitted without written consent of the publisher

Mar Ecol Prog Ser 264: 123–135, 2003
and copepod patches can be visually identified(Watkins & Schevill 1976, Wishner et al. 1988, 1995,Mayo & Marx 1990, Beardsley et al. 1996). With theadvent of instrumentation to estimate the abundanceof zooplankton, however, the distribution of C. fin-marchicus can now be adequately and rapidly sampledat spatial scales much closer to those utilized by thewhales.
North Atlantic right whales are one of the mostendangered large whales, and despite internationalprotection from whaling since the 1930s, this specieshas failed to recover to its pre-exploitation populationlevels (Clapham et al. 1999). Recent estimates suggestthat only around 300 individuals remain (Knowlton etal. 1994, IWC 2001, Kraus et al. 2001), and the current,unacceptably high mortality rates (due, in part, to shipstrikes and fishing gear entanglements) are projectedto cause extinction within a few centuries (Caswell etal. 1999, Fujiwara & Caswell 2001). Consequently,there is an urgent need for information about the habi-tat and habitat use of right whales to improve conser-vation efforts. There is also a need to improve ourunderstanding of food availability and foraging suc-cess as determinants of reproductive success. One ofthe hypotheses to explain the lack of recovery in thispopulation states that centuries of depressed abun-dance due to whaling has allowed other predators ofCalanus finmarchicus to flourish (e.g. planktivorousfish, see Payne et al. 1990), so sufficient food resourcesto support substantial population growth no longerexist (IWC 2001). Recent results linking temporal vari-ability in both crude right whale survival probability(Fujiwara & Caswell 2001) and right whale reproduc-tive success (Kenney et al. 2001) to the North AtlanticOscillation, which, in turn, affects C. finmarchicusabundance (Fromentin & Planque 1996, Greene &Pershing 2000, Conversi et al. 2001), seem consistentwith this hypothesis.
Right whales have been observed feeding on oldercopepodite stages of Calanus finmarchicus in CapeCod Bay (Watkins & Schevill 1976, Mayo & Marx 1990)and in the Great South Channel (Wishner et al. 1988,1995, Beardsley et al. 1996) in the late winter andspring. Surface feeding occurs occasionally, but sub-surface feeding is much more common (Watkins &Schevill 1976, Mayo & Marx 1990, Kenney et al. 1995).During the summer, right whales can be found in thelower Bay of Fundy and on the SW Scotian Shelf,where they continue to feed on older stages of C. fin-marchicus (Stone et al. 1988, Murison & Gaskin 1989,Woodley & Gaskin 1996). At this time of year, the bulkof the C. finmarchicus population consists of stage 5copepodites (C5) that are in a resting state deep in thewater column (Sameoto & Herman 1990, Miller et al.1991). Net sampling by Murison & Gaskin (1989) in the
lower Bay of Fundy indicated that C. finmarchicus C5was the dominant zooplankter near right whales andthat these copepods occurred at depths below 100 m.Both Murison & Gaskin (1989) and Goodyear (1993)observed right whales diving to depths below 100 m inthe lower Bay of Fundy.
We report here on a study of right whale diving andforaging behavior in the lower Bay of Fundy and on thesouthwestern Scotian Shelf. Right whale diving behav-ior was monitored via suction-cup mounted TDRs, andobservations of Calanus finmarchicus C5 vertical dis-tribution were obtained near the tagged whales withan optical plankton counter (OPC). These measure-ments were used to investigate the hypothesis thatright whales exploit high abundances of C. finmarchi-cus C5 concentrated in discrete layers. Kenney et al.(1986) suggested that foraging must occur on discretelayers of zooplankton for right whales to satisfy theirenergetic demands. We used the OPC to sample thesediscrete layers at temporal and spatial scales similar tothose of the foraging whales. Simultaneous observa-tions of temperature and salinity obtained with a con-ductivity-temperature-depth instrument (CTD) alsoallowed an investigation of the hydrographic featuresthat promote the formation or persistence of theselayers. To address the hypothesis of insufficient foodresources, right whale ingestion rates were estimatedfrom the TDR and OPC data and compared to dailymetabolic requirements.
MATERIALS AND METHODS
The tag used during the 2000 summer field seasonconsisted of a modified Wildlife Computers modelMK7 TDR that recorded pressure (converted to depthat a resolution of 2 m), temperature and relative lightintensity every second. The tag needed to be recov-ered for access to these data. The TDR also included aslot in which a Telonics model CHP-1P, 149 MHz radiotransmitter was placed. Syntactic foam floatation wasmolded around one end of the TDR to make the entiretag positively buoyant. The tag was attached to awhale via a silicone suction cup and detachment wasuncontrolled. In 2001, a Vemco model V22P acoustictransmitter was included in the tag to allow trackingwhile a whale was submerged. The acoustic transmit-ter emitted 36 kHz pulses at 165 dB (re 1 µPa at 1 m) atintervals proportional to the depth of the tag (e.g.every 1.03 s at 10 m and 0.76 s at 200 m). A corrosiverelease mechanism was also incorporated in the tag in2001 that was designed to provide reliable attachmentdurations of between 1 and 2 h. The suction cup waschanged in 2001 to a more robust, rubber material. Inboth 2000 and 2001, the tag was attached with a 9 m
124

Baumgartner & Mate: Right whale foraging ecology
telescoping pole from an elevated platform in the bowof a 7.5 m rigid-hulled inflatable boat (RHIB).
Visual observations were used to assess the reactionof whales to close boat approaches. However, thevalue of these observations in gauging the overalleffects of tagging is unclear. It is important to considerthe effect of tagging on biologically meaningful activi-ties (e.g. feeding, breeding) and to use objective datawhen doing so. Toward that end, the diving behaviorof the tagged whales was also investigated for reac-tions to close boat approach and tagging. The taggedright whales engaged primarily in feeding behavior(see ‘Results’), so only whales tagged for over 1 h with2 or more feeding dives were examined. The charac-teristics of the first feeding dive (duration, averagedive depth, descent speed, ascent speed) were com-pared to those of the second, third, fourth and lastobserved feeding dives to document any significantchanges in diving behavior as a result of the tag attach-ment process. This first feeding dive occurred up to7.5 min after tag deployment. In addition, the charac-teristics of the second feeding dive were compared tothose of the third, fourth and last dives, and the char-acteristics of the third feeding dive were compared tothose of the fourth and last dives.
Following deployment, the whale was tracked at thesurface via the radio transmitter, and in 2001, via theacoustic transmitter when the whale was submerged.Recovery of the tag after detachment was facilitatedwith these same systems. Right whales were taggedand tracked only during daylight hours. Radio trackingwas accomplished with a 4-element Yagi antenna and areceiver. Bearing alone was estimatedfrom the received signal intensity, andthe range of the system was over 1 km.Acoustic tracking was accomplishedwith a directional hydrophone and a re-ceiver. Bearing and horizontal distanceto the animal were estimated from thereceived acoustic signal intensity and,with some experience, these could bejudged to within 15° and 50 to 100 m,respectively. The pulse interval wasmeasured, converted to depth and dis-played by the acoustic receiver, so anestimate of the depth of the whale wasalso available in real time. To test therange of the acoustic system, a trans-mitter was suspended in the lower Bayof Fundy at 75 m and detectability wastested at various distances. The maxi-mum distance tested was 1 km beforeweather forced an end to the experi-ment, but the signal was easily de-tected at this maximum distance.
Upon each resurfacing of a tagged whale after a longdive, the resurfacing position was obtained by parkinga RHIB on the exact location and obtaining a globalpositioning system (GPS) measurement. Shortly there-after, NOAA Ship ‘Delaware II’ would occupy thissame position and deploy an instrument packageconsisting of a Seabird model SBE19 CTD and a FocalTechnologies model OPC-1T. These instruments werehoused in a rosette cage and deployed in a vertical castat a nominal 0.5 m s–1 (2000) or 1.0 m s–1 (2001) descentrate. The CTD provided the vertical distribution oftemperature and salinity and the OPC provided thevertical distribution of particle abundance in sizesranging from 0.25 to 20 mm (Herman 1988, 1992). Theabundance of Calanus finmarchicus C5 was estimatedfrom the OPC data using a calibration equation devel-oped from comparisons between OPC measurementsand net samples collected in this same region (Baum-gartner 2003). During tracking, behavioral observa-tions and social interactions were noted and when pos-sible photographs were taken for comparison with theNew England right whale catalog (Hamilton & Martin1999) to identify tagged individuals.
Dives were defined as any vertical excursion below50 m. The period between these dives was typicallyspent at or just below the surface. Vertical excursionsbetween the surface and 50 m typically occurredduring traveling or associations with other right wales.Dives were considered to be initiated when the verti-cal descent speed exceeded 0.5 m s–1 and the descentportion of the dive was terminated when the ver-tical descent speed dropped below 0.5 m s–1 (Fig. 1).
125
Fig. 1. Eubalaena glacialis. Typical right whale feeding dive with descent, at depthand ascent portions shown. By convention, the descent portion begins when thedownward velocity exceeds 0.5 m s–1 and ends when the downward velocity drops be-low 0.5 m s–1. Likewise, the ascent portion begins when the upward velocity exceeds
0.5 m s–1 and ends when the upward velocity drops below 0.5 m s–1

Mar Ecol Prog Ser 264: 123–135, 2003
Ascent was initiated when the vertical ascent speedexceeded 0.5 m s–1 and the dive was terminatedwhen the vertical ascent speed dropped below 0.5 ms–1. The dive duration was defined as the time be-tween the initiation of the descent and the termina-tion of the ascent. The duration at depth was definedas the time between the termination of the descentand the initiation of the ascent. The mean and SD ofthe dive depth were computed during the at-depthportion of the dive (i.e. between the termination ofthe descent and the initiation of the ascent). Clas-sification of dives was facilitated by a Ward’s mini-mum-variance cluster analysis and visualization withmultivariate star plots (Johnson 1998). The clusteranalysis and visualization were conducted on thedive duration, duration at depth, descent speed,ascent speed and SD of the dive depth. Dives wereclassified into 3 types: feeding, V-shaped and ‘other’.Surface intervals were measured after feeding divesonly when the successive dive was also a feedingdive and no social activity was observed. Surfaceintervals were also expressed as a percentage ofthe total dive cycle time (PCST: after Dolphin 1987).The total dive cycle time was computed as the sumof the dive duration and the succeeding surfaceinterval.
The vertical distribution of Calanus finmarchicus C5was estimated from the calibrated OPC data in 4 mdepth strata below 50 m. The depth of the peak C. fin-marchicus C5 abundance was chosen as the midpointof the depth stratum containing the maximum C. fin-marchicus C5 concentration. The lower Bay of Fundy ischaracterized by strong tidal flow that interacts withthe sea floor to create a turbulent, well-mixed bottomlayer. To examine the potential relationships amongthis bottom mixed layer, the vertical distribution of C.finmarchicus C5 and the diving behavior of the taggedright whales, the depth of the top of this layer wasdetermined from the CTD data. The top of this bound-ary layer was defined as the deepest depth at whichthe density differed from the bottom density by at least0.05 kg m–3.
Each tagged whale was considered an independentobservation. Therefore, individual dive characteristics(e.g. mean dive depth, dive duration, duration atdepth) and associated environmental conditions (peakCalanus finmarchicus C5 abundance, depth of peakabundance and bottom mixed layer depth) were aver-aged to provide a single observation of each variablefor each whale. For comparisons between dive char-acteristics and environmental conditions, only datafor dives with accompanying CTD/OPC casts wereaveraged. Dive characteristics and associated envi-ronmental conditions were compared using correlationanalysis.
Total ingestion of Calanus finmarchicus C5 (Id) wasestimated for each feeding dive as
(1)
where Ag is the area of the whale’s gape (the openingthrough which water enters the mouth), S is the swim-ming speed, Td is the duration at depth, EC5 is theenergy (calorific) content of a single C. finmarchicusC5 and C is the estimated C. finmarchicus C5 concen-tration available to the whale. The total ingestion rate(I ’) during the period when the whale was tagged wasestimated as follows:
(2)
where Tf is the total time spent at depth during feedingdives, Tt is the total time the tag was attached to thewhale and the summation of Id and Td occurred overall dives that had accompanying CTD/OPC casts. Theratio of Tf to Tt is considered the fraction of time spentfeeding. The gape area was assumed to be 1.21 m2
(Mayo et al. 2001) and the energy content of a singleC. finmarchicus C5 was fixed at 1.62 × 10⁻³ kcal cope-pod–1 (Comita 1966) or 6.78 J copepod–1 (1 kcal =4186.8 J). In 2001, improved tracking with the acoustictransmitter allowed accurate measurements of bothdiving and resurfacing locations. The distance be-tween the diving and resurfacing locations divided bythe dive duration was used as an estimate of the swim-ming speed during feeding (S in Eq. 1). These speedsmust be considered minimum speeds, however, sincewe do not know whether the whales foraged alongstraight-line paths between the diving and resurfacingpositions. To account for this, swimming speeds wereincreased to 1.5 m s–1 whenever the observed mini-mum speed was less than 1.5 m s–1. Speeds wereassumed to be 1.5 m s–1 for all dives in 2000. In CapeCod Bay, Mayo et al. (2001) observed average swim-ming speeds during surface feeding of 1.34 m s–1 andWatkins & Shevill (1976) report speeds of ‘up to3 knots’ or 1.54 m s–1. Minimum swimming speeds inthe present study averaged nearly 1 m s–1 (see Table 3in ‘Results’); however, subsurface foraging paths inthe Bay of Fundy are not necessarily straight (D. P.Nowacek pers. comm.). Therefore, 1.5 m s–1 is assumedto be a reasonable estimate of true speed during feed-ing.
To investigate whether sufficient food was availableto the tagged whales, the rate of ingestion was com-pared to the estimated rate needed to meet the dailymetabolic requirements for maintenance in rightwhales. For simplicity, a right whale’s day was dividedinto 2 activities: foraging and resting. The metabolicrate during foraging was assumed to be equal to thediving metabolic rate (DMR). Assuming that the
I
T I
T T’ f d
t d= ∑
∑
I A ST E Cd g d C= 5
126

Baumgartner & Mate: Right whale foraging ecology
tagged right whales were able to continue to feed at I ’for T h each day, the fraction of the daily metabolicrequirement met by each whale is
(3)
where A is the assimilation efficiency and RMR is theresting metabolic rate. The time required to meet thedaily metabolic requirement (Treq) is then
(4)
Both DMR and RMR were assumed to be multiples ofthe basal metabolic rate (BMR), which was estimated as
(5)
where M is the mass of a right whale in kg. The termin brackets is after Kleiber (1975) and the first term con-verts Kleiber’s expression from kcal d–1 to W (or J s–1).The assimilation efficiency and body mass are assumedto be 0.80 (Lockyer 1981) and 40 000 kg (Kenney &Winn 1986), respectively; therefore, BMR = 0.96 × 10⁴
W. The magnitude of DMR is unknown for right whales,but for other species, DMR is 1.5 – 2 × BMR in Weddellseals (Kooyman et al. 1973, Castellini et al. 1992), 2 – 3 ×BMR in northern elephant seals (Costa & Williams1999) and nearly 6 × BMR in the bottlenose dolphin andotariids (sea lions and fur seals) (Costa & Gentry 1986,Costa et al. 1989, Costa & Williams 1999). When com-pared to other marine mammals, the DMR for rightwhales is probably low since the energetic costs asso-ciated with continuous filter feeding do not appearparticularly expensive (relative to lunge feeding inrorquals, for instance; Croll et al. 2001) and their insu-lating blubber layer is thick. Recent energetic investi-gations of bowhead whales, a closely related species tothe right whale, suggest these whales have very lowmetabolic rates due, in part, to a very thick blubberlayer and a low core temperature (J. C. George pers.comm.). We assume here that DMR = 2 × BMR and RMR= 1 × BMR. For consistency with the literature, we alsopresent ingestion rate as a fraction of the ingestion raterequired to meet basal metabolic requirements. Thislatter rate (I ’BMR) is estimated as
(6)
or 1.20 × 10⁴ W.
RESULTS
A total of 28 right whales were tagged in the lowerBay of Fundy between 11 July and 28 August 2000(Fig. 2). All but 2 of the tags were recovered. The
median duration of attachment was 28 min and 23.1%(n = 6) of the tagging events exceeded 1 h. During asingle event in 2000, a rubber suction cup was usedinstead of the silicone cup and the resulting attach-ment duration was 7 h. A total of 63 complete diveswas recorded of which 93.7% (n = 59) were feedingdives, 4.8% (n = 3) were V-shaped and 1.6% (n = 1)were classified as ‘other.’ From 11 to 29 August 2001,25 right whales were tagged and all of the tags wererecovered. Of these 25 whales, 6 adults (presumablyfemale) with calves, 2 calves and 1 pregnant (R. M.Rolland pers. comm.) female were tagged. Two of thewhales were tagged in Roseway Basin on the south-western Scotian Shelf and the remaining 23 weretagged in the lower Bay of Fundy (Fig. 2). The medianduration of attachment was 86 min and 64.0% (n = 16)of the tagging events exceeded 1 h. A total of 86 com-plete dives was recorded of which 88.4% (n = 76) werefeeding dives, 5.8% (n = 5) were V-shaped and 5.8%(n = 5) were classified as ‘other.’ Of the 149 total divesrecorded in both 2000 and 2001, 86.6% (n = 129) hadan accompanying CTD/OPC cast which, on average,was conducted 21.5 min after and 158 m away from thewhale’s resurfacing location.
Strong reaction to tagging or the close approach ofthe RHIB was uncommon. In 2000, 71% of the 42whales that were closely approached by the RHIB
I
A’ BMRBMR = 1
BMR = [ ]4186 8
8640070 0 75. .M
T
AIreq
24 RMR’ RMR DMR
=+ −
daily assimilationdaily requirement
’DMR RMR
=+ −AI T
T T( ) ( )24
127
45°N
44°
43°
Fig. 2. Map of study area. ( ) Tagging locations in the lower Bayof Fundy and Roseway Basin. Shipping lanes through the lowerBay of Fundy at the time of this study and the 91 m (50 fathom)
and 200 m isobaths are also shown

Mar Ecol Prog Ser 264: 123–135, 2003
(within 10 m) showed no observable reaction (22 of 28successfully tagged individuals and 8 of 14 unsuccess-fully tagged individuals). Of the remaining whales,reactions included lifting the head or flukes, archingthe back, rolling to one side, rolling to one side andbeating the flukes (on 1 occasion), or performing ahead lunge (on 1 occasion). Observations during closeboat approaches in 2001 were qualitatively similar tothose collected in 2000. The characteristics of the first,second, third, fourth and last feeding dives were com-pared for the 18 whales that were tagged for over 1 hand had 2 or more feeding dives. The duration of thefirst feeding dive was, on average, 13% (n = 18, p =0.0061), 15% (n = 17, p = 0.0039), 17% (n = 16, p =0.0010) and 14% (n = 12, p = 0.045) shorter than thesecond, third, fourth and last dives, respectively. Incontrast, no significant differences in dive duration(p > 0.05) were detected in comparisons of the secondand successive dives or the third and successive dives.Differences in dive duration between the first andsuccessive dives did not depend on the time betweentag attachment and the first feeding dive (correlationanalysis, p > 0.5). No significant differences in descentspeed, ascent speed or dive depth (p > 0.05) weredetected in comparisons between the first dive andsuccessive dives.
Based on these results, the effect of the tag attach-ment process on diving behavior is considered to besmall and short-lived; hence, none of the subsequentanalyses take this effect into account. Only the dura-tion of the first feeding dive was affected by the tag-ging process, and the difference between this first diveand successive dives was small (~15% shorter). Reduc-tion in dive duration during the first dive is likelycaused by inadequate ventilation during the surfacinginterval in which the tag was deployed which, in turn,may be due to evasion of the boat by premature diving,longer submergence times between breaths or in-creased swim speeds.
Feeding dives were characterized bya rapid descent from the surface to aparticular depth, remarkable fidelity tothat depth for an average of just over9 min and then a rapid ascent backto the surface (Fig. 1, Table 1). Ascentspeed averaged 0.07 m s–1 (95% CI:0.01 – 0.13 m s–1) faster than the corre-sponding descent speed during feed-ing dives (one-sample t-test, p = 0.026).Excluding the tagged calves, femaleswith calves and the pregnant female,there was no evidence to suggest thatPCST was correlated with either depth(r = 0.119, p = 0.73) or dive duration(r = 0.029, p = 0.93). For these indi-
viduals, PCST averaged 21.2% (n = 11, SD = 4.1%,range = 15.8 – 30.1%) whereas for the tagged calvesand females with calves, PCST averaged 34.2% (n = 4,SD = 9.2%, range = 24.3 – 44.3%). The PCST for thepregnant female (shown in Fig. 4c) was 51.1%, whichwas the highest observed. Excluding the pregnantfemale, dive durations for calves and females withcalves were similar to the other whales (2-samplet-test, p = 0.78: however, note low sample size andthus low power of test), but surface intervals weresignificantly higher (2-sample t-test, p = 0.0011).Surface intervals for calves and females with calvesaveraged 5.69 min (n = 4, SD = 1.22 min, range =4.54 – 6.97 min) whereas surface intervals for all otherindividuals excluding the pregnant female averaged3.13 min (n = 11, SD = 0.99 min, range = 1.65 –5.06 min). The pregnant female had the highestaverage surface interval of 11.08 min.
Traveling (e.g. Fig. 3b) and social activity (e.g.Fig. 3c) were also observed and it was during thesetimes that dives classified as V-shaped and ‘other’often occurred. Of the 8 dives classified as V-shaped,5 were to within 10 m of the bottom mixed layer (e.g.Fig. 4c,d). Of the 6 dives classified as ‘other’, 2 of thedives were to within 10 m of the bottom mixed layer(Fig. 3b,c) and 4 were to the sea floor (e.g. Fig. 3b). Inall, 5 brief excursions to the bottom were observed(e.g. Fig. 3b,d), but none of these individuals remainedat or near the bottom. Feeding dives did not occur nearthe bottom.
We observed increases in dive duration, descentspeed and ascent speed with dive depth during feed-ing dives which contributed to a positive correlationbetween duration at depth and dive depth (Table 2).These dive characteristics were also strongly and posi-tively correlated with the depth of the peak Calanusfinmarchicus C5 abundance. There was suggestive,but inconclusive evidence that both dive duration and
128
Table 1. Eubalaena glacialis and Calanus finmarchicus. Summary of feedingdive characteristics for whales that engaged in at least 1 feeding dive whiletagged. Dive characteristics were initially averaged to provide a single observa-tion for each whale. Distance and minimum speed were computed from the con-secutive diving and resurfacing positions obtained in 2001 only. Prey abundancerefers to the peak abundance of C. finmarchicus C5 in the water column
Dive characteristics n Median Mean SD 95% CI Range
Dive duration (min) 34 12.65 12.17 2.22 11.39–12.94 7.83–16.32Duration at depth (min) 34 9.50 9.39 2.29 8.59–10.18 4.72–13.55Descent speed (m s–1) 34 1.38 1.40 0.30 1.29–1.50 0.81–2.00Ascent speed (m s–1) 34 1.54 1.47 0.26 1.38–1.56 0.93–2.05Dive depth (m) 34 119.9 121.2 24.2 112.8–129.7 78.7–174.0Distance (km) 18 0.59 0.59 0.20 0.49–0.70 0.21–0.94Minimum speed (km h–1) 18 0.85 0.93 0.44 0.71–1.15 0.38–1.94Prey abundance 31 6219 7481 4581 5800–9161 2059–20610(copepods m–3)

Baumgartner & Mate: Right whale foraging ecology
duration at depth were correlated withpeak C. finmarchicus C5 abundance(r = 0.339, p = 0.062 for dive duration;r = 0.353, p = 0.051 for duration atdepth; Table 2). C. finmarchicus C5were very often aggregated in discretelayers near foraging right whales andthe at-depth portion of the whales’dives were spent in or near these layers(Fig. 4). The average depth of dive wasstrongly correlated with the averagedepth of peak C. finmarchicus C5abundance (r = 0.902, p < 0.0001,Table 2, Fig. 5a). There was no evi-dence to suggest that the relationshipbetween the average depth of dive andthe average depth of maximum C. fin-marchicus C5 abundance was differentfrom one-to-one (Ho: intercept = 0, p =0.93; Ho: slope = 1, p = 0.76). The dis-crete layers of C. finmarchicus C5upon which the whales presumably fedwere often observed near the bottommixed layer (Fig. 4). Consequently,the whales’ average dive depth wasstrongly correlated with the averagedepth of the bottom mixed layer (r =0.865, p < 0.0001, Fig. 5b). Averagedive depths were shallower than thebottom mixed layer by an average of7 m, however, which indicates that C.finmarchicus C5 typically aggregatedjust above the bottom mixed layer.
Since right whales were observedforaging at the depth of maximumCalanus finmarchicus C5 abundance,total ingestion (Id from Eq. 1) was com-puted for every feeding dive using theestimate of the peak C. finmarchicusC5 abundance from the accompanyingOPC cast. Ingestion rates (I ’ from Eq. 2)
129
Fig. 3. Eubalaena glacialis. Diving and tracking observations illustrating (a) feeding,(b) traveling, (c) socializing and (d) presumed searching behaviors. Individual diveswere classified and labeled as feeding (F), V-shaped (V) or ‘other’ (O). ( E) Times (onthe time series) and locations (on the accompanying map) of visual contacts. (m) Timesand locations at which a resurfacing occurred and a conductivity-temperature-depth/optical plankton counter (CTD/OPC) cast was conducted. Solid and dashedlines indicate the sea floor and the top of the bottom mixed layer, respectively, mea-sured at the location of each CTD/OPC cast. Concentric lines on the accompanyingmaps are separated by 0.5 km. Tags detached at depth in (a) and at the bottom in (d)
Time after tag attachment (min)
Table 2. Eubalaena glacialis and Calanus finmarchicus. Correlation matrix of feeding dive characteristics for tagged individualsthat engaged in at least 1 feeding dive for which an accompanying CTD/OPC cast was conducted. n = 31 for each correlation
coefficient. Prey abundance refers to the peak abundance of C. finmarchicus C5 in the water column
Dive Duration Descent Ascent Prey Depth of peakduration at depth speed speed abundance prey abundance
Dive depth 0.586*** 0.447* 0.470** 0.533** 0.093 0.902***Dive duration 0.974*** 0.558** 0.728*** 0.339† 0.569***Duration at depth 0.635*** 0.778*** 0.353† 0.469**Descent speed 0.766*** 0.234 0.538**Ascent speed 0.234 0.604***Prey abundance 0.031**
***p < 0.001, **0.001 ≤ p < 0.01, *0.01 ≤ p < 0.05, †0.05 ≤ p < 0.10
a
b
c
d

Mar Ecol Prog Ser 264: 123–135, 2003130
Fig. 4. Eubalaena glacialis and Calanus finmarchicus. (a–d) Examples of diving and tracking observations during feedingbehavior. Contoured C. finmarchicus C5 abundance estimated from the OPC casts is shown. Color scale shown in (d) applies
to all plots. Symbols and lines are the same as in Fig. 3
Time after tag attachment (min)
Fig. 5. Eubalaena glacialis and Calanusfinmarchicus. Average depth of feedingdive versus (a) average depth of peak C.finmarchicus C5 abundance and (b) aver-age depth of the bottom mixed layer. ( )Tagged whales that had 2 or more feed-ing dives with accompanying CTD/OPCcasts. (E) Tagged whales that had only1 feeding dive with an accompanying
CTD/OPC cast
a
a
b
b
c
d

Baumgartner & Mate: Right whale foraging ecology
were estimated only for those whales tracked over 1 h(Table 3). Of the 22 tagged individuals examined, 14had ingestion rates that were high enough to meetestimated daily metabolic requirements. However, 2 ofthese 14 would have needed to feed for nearly 24 h atthe observed ingestion rates to meet this requirement,whereas 4 would have needed less than 5 h. The con-centration of C. finmarchicus C5 explained 94% ofthe variation in the estimated ingestion rates whenassessed with a regression model forced through theorigin (Fig. 6). The resulting regression equation, i.e.I ’ = (6.58 m3 W) × C, suggests that the minimum C. fin-marchicus C5 concentration required to meet dailymetabolic requirements is 3600 copepods m–3 (forag-ing would need to continue for 24 h d–1 to meet thisrequirement). The minimum peak concentration ob-served near whales that were tagged for over 1 h andthat engaged in feeding dives was ca. 3000 copepodsm–3 (Table 3), which is in good agreement with theminimum concentration required to meet daily meta-bolic requirements. One of the tagged whales engagedin behavior that we interpret as searching (Fig. 3d) andpeak concentrations of C. finmarchicus C5 near thisindividual averaged ca. 1300 copepods m–3. A whale
feeding continuously on this concentration (i.e. 24 hd–1) would ingest only 35% of its daily requirement onaverage, whereas feeding on a concentration of 3000copepods m–3 would yield 83% of the daily require-ment. The evidence from this single individual sug-gests that right whales may ignore C. finmarchicus C5concentrations as low as 1300 copepods m–3 becauseforaging would not come close to meeting the dailyrequirement, yet peak concentrations over 3000 cope-pods m–3 that nearly provide the daily requirementmay be more acceptable.
DISCUSSION
The stereotypical shape of feeding dives in NorthAtlantic right whales is optimized for exploiting zoo-plankton aggregated in discrete layers. Rapid descentsand ascents reduce transit time to foraging depths, andthese transit times are even further reduced whendiving to deeper depths by increasing both descentand ascent rates. Thus, duration at the depth wherefeeding occurs is maximized. The significantly fasterascents relative to descents are due to the right whale’s
131
Table 3. Eubalaena glacialis and Calanus finmarchicus. Number of feeding dives, duration of tag attachment, percent time feed-ing, average minimum speed between diving and resurfacing positions, average peak C. finmarchicus C5 abundance below50 m, ingestion rate (I ’), ingestion rate as a fraction of the ingestion rate required to meet estimated basal metabolic requirements(I ’BMR), and time required to meet daily metabolic requirement (Treq) from Eq. (4). Data are from deployments lasting over 1 h. Thefirst column contains the label used for each whale in Fig. 6. Fig. numbers are also provided for those deployments shown inFigs. 3 and 4. Minimum speeds were not calculated for individuals tagged in 2000 (see ‘Materials and methods’ for explanation).
Missing values for Treq indicate Treq > 24 h
Label in No. feeding Attachment % time Speed Prey abundance I ’ I ’ Treq Fig.Fig. 6 dives duration (min) feeding (m s–1) (copepods m–3) (104 W) (× I ’BMR) (h)
1a 0 69 0.0 – – 0.00 0.00 – 3c2a 0 63 0.0 – – 0.00 0.00 – 3d3 0 92 0.0 – – 0.00 0.00 –4b 1 93 5.1 1.94 5592 0.45 0.38 – 3b5 2 102 13.5 0.38 3500 0.53 0.44 –6 6 98 48.7 0.75 3124 1.89 1.57 –7b,c 4 93 30.7 1.01 5124 1.89 1.57 – 4c8 6 101 63.3 0.95 3020 2.37 1.98 –9 4 66 54.5 0.52 3677 2.48 2.07 22.510 7 96 45.9 1.87 3087 2.49 2.08 22.311a 9 198 40.6 – 6331 3.23 2.69 14.212 6 112 52.0 0.84 5332 3.31 2.76 13.613 5 87 57.1 0.61 4673 3.39 2.83 13.114 4 82 43.7 0.92 6602 3.53 2.94 12.415 7 118 53.2 0.85 5440 3.55 2.96 12.316d 3 66 54.7 0.99 5759 3.73 3.11 11.417a 23 422 54.2 – 6233 4.19 3.50 9.618e 4 90 33.7 1.54 8672 4.64 3.87 8.4 4d19 6 86 64.2 0.61 9871 7.69 6.41 4.420a 6 68 48.0 – 12867 7.78 6.49 4.421d 5 102 57.7 0.68 11893 8.47 7.06 4.0 3a,4b22a 8 136 68.0 – 14945 12.48 10.41 2.6 4aAverage 40.4 0.96 6618 3.55 2.96aWhales tagged in 2000. All other whales tagged in 2001; bwhales tagged in Roseway Basin on southwestern Scotian Shelf. All otherwhales tagged in Grand Manan Basin of the lower Bay of Fundy; cpregnant female; dadult (presumably female) with calf; ecalf

Mar Ecol Prog Ser 264: 123–135, 2003
positive buoyancy, which the whale must overcome byfluke stroking on descent, but is exploited to reduceenergy expenditure by gliding on ascent (Nowacek etal. 2001). The low variability in dive depth during theat-depth portion of the feeding dive is in marked con-trast to the high variability in dive depth exhibited byblue and fin whales (Croll et al. 2001). These differ-ences are presumably related to feeding ecology. Rightwhales feed on zooplankton aggregated in discretelayers by continuously swimming with their mouthsagape, but blue and fin whales are gulp feeders thatengulf euphausiids or fish along with vast quantities ofseawater in a single mouthful. The variability in divedepths during the at-depth portion of these rorquals’dives, therefore, has been interpreted as lunge feeding(Croll et al. 2001). The duration of the tagged rightwhales’ dives (average 12.2 min) were much longerthan fin (5.5 min; Croll et al. 2001), blue (6.6 min; Crollet al. 2001) and humpback whales (2.8 min; Dolphin1987). Croll et al. (2001) have suggested that increaseddive durations in the Balaenidae (right and bowheadwhales) are a result of lower metabolic costs associatedwith continuous filter feeding. Conversely, decreaseddive durations in rorquals are a consequence of thehigher metabolic costs associated with lunge feeding.
When dive durations exceed the capacity for aerobicmetabolism, anaerobic metabolism causes lactate tobuild in the blood which must be cleared during thesucceeding surfacing interval. Dives that exceed thisaerobic dive limit (ADL), therefore, are associated withdisproportionately longer surfacing intervals (Kooymanet al. 1980, 1983). Dolphin (1987) reported increasingPCST for humpback whale dives that exceeded 60 min depth and suggested that this increased time atthe surface was required to repay the oxygen debtincurred during anaerobic metabolism. In the presentstudy, there was no evidence that PCST was correlatedwith either dive depth or duration for the tagged rightwhales. We observed average PCST values of 21.2%(excluding calves, females with calves and the preg-nant female), which is in good agreement with PCSTvalues for presumed aerobic dives by Weddell seals(21%; Kooyman et al. 1980) and humpback whales(21.4%; Dolphin 1987). These results suggest that thetagged right whales were diving within their ADL.Although the dive durations for calves and femaleswith calves were similar to the other whales, surfaceintervals were significantly higher, which resulted in ahigher PCST for calves and females with calves. Thecalves were seldom more than a body’s length awayfrom their presumed mothers and they often surfacedand dove simultaneously with the adult as well. Theextended surface intervals and higher PCST values forthe tagged females with calves, then, are interpretedas being governed by the calf’s diving capabilities.Theoretical ADL is computed as the total oxygen storesdivided by DMR and while total oxygen stores increaselinearly with body mass (M), DMR increases with M 0.75
(Costa & Williams 1999). ADL is therefore proportionalto M 0.25, so a calf’s ADL will be lower than that of anadult simply due to its reduced body size. In addition tothe effect of body size on ADL, calves must also havehigher metabolic rates to fuel growth which will fur-ther reduce their ADL. Croll et al. (2001) estimatedtotal O2 stores for blue and fin whales to be an aver-age 55.6 ml O2 kg–1. Assuming right whales have simi-lar total O2 stores and that a calf’s DMR = 4 × BMR(i.e. DMR = 4 × [70M 0.75 kcal d—1] � [4.8 kcal (l O2)–1] �[1440 min d–1]), a 5000 kg calf (New England Aquar-ium unpubl. data cited in Brown et al. 2001) wouldhave a theoretical ADL of 11.5 min. Observed divedurations for calves and females with calves averaged11.60 min (n = 5, SD = 2.04 min, range = 8.84 to14.09 min). The prolonged surface intervals, elevatedPCST values and these ADL calculations suggest thatright whale calves may dive for durations close to theirADL, but caution is warranted when interpreting theseresults because of the low sample size and the uncer-tainty in estimating both total O2 stores and divingmetabolic rate for right whales.
132
Fig. 6. Eubalaena glacialis and Calanus finmarchicus. Esti-mated ingestion rate versus average peak C. finmarchicus C5abundance. (4) to (22): Labels for whales reference data inTable 3. A linear regression forced through the origin wasfitted to the data and is shown as the dashed line. Horizontal,dotted lines indicate the ingestion rates and times spent for-aging required to meet daily metabolic needs (e.g. ingestionfor 8 h d–1 at a rate of 4.8 × 10⁴ W would be sufficient to meet
daily metabolic requirements)
Baumgartner & Mate: Right whale foraging ecology
The significantly longer surface intervals observedfor calves, females with calves and the pregnantfemale may indicate that reproductively active femalesand their calves are at comparatively greater risk forcollisions with ships than other animals in the popula-tion. Fujiwara & Caswell (2001) estimated that the sur-vivorship of right whale mothers declined from 1980 to1995, while the survivorship of mature males and (non-calving) females remained unchanged over the sameperiod. Higher rates of mortality among right whalemothers may be due to their use of the calving groundsoff the southeast United States, where the volume ofshipping traffic is high (Fujiwara & Caswell 2001).However, our results suggest that the diving behaviorof reproductively active females and their calves mayalso place them at greater risk of ship strikes on thefeeding grounds as well.
The strong correlation between dive depths and thedepth of maximum Calanus finmarchicus C5 abun-dance indicate that right whales are adept at locatingand exploiting discrete layers of highly concentratedprey. The accuracy with which they target these layerswould seem to rule out the possibility that right whalessample the water column mouthful by mouthful untilthey reach a suitable prey concentration. Instead, thetransition from the descent phase to the at-depth por-tion of the dive occurs very quickly and the fidelity tothe depth initially targeted is often remarkable. Theseobservations suggest that right whales can detectlayers of C. finmarchicus C5 without opening theirmouths. The sensory mechanisms by which the whalesaccomplish this are unknown, but may include visionor sensory hairs (Kenney et al. 2001). Rowntree (1996)even suggests that the cyamid amphipods that inhabitright whale callosities may aid in locating prey. As istypical for turbid coastal environments, light levels atmid-depth in Grand Manan Basin are probably verylow and vision would only be useful during daylighthours. C. finmarchicus do not bioluminesce as do someother copepods (e.g. Metridia spp.), so direct visualdetection of prey in the absence of ambient light isprobably not possible. Regardless of the sensory mech-anisms employed, right whales may be able to restricttheir search for suitable prey concentrations using cuesfrom the physical environment. The tagged rightwhales rarely ventured into the bottom mixed layerproper and when they did so, it was typically during anexcursion to the sea floor that seemed exploratory innature. There are a variety of cues with which rightwhales can detect the presence of this mixed layer,including shear at the top of the layer (i.e. rapid veloc-ity changes with depth), turbulence within the layeritself or particular temperature or salinity properties.With foraging experience, right whales may learn thatsuitable prey concentrations of C. finmarchicus are
uncommon in the bottom mixed layer, so only occa-sional forays into this layer are necessary. Moreover,searching may be further restricted to only a few10s of m around the top of this boundary layer sinceC. finmarchicus C5 aggregate just above the bottommixed layer at this time of year.
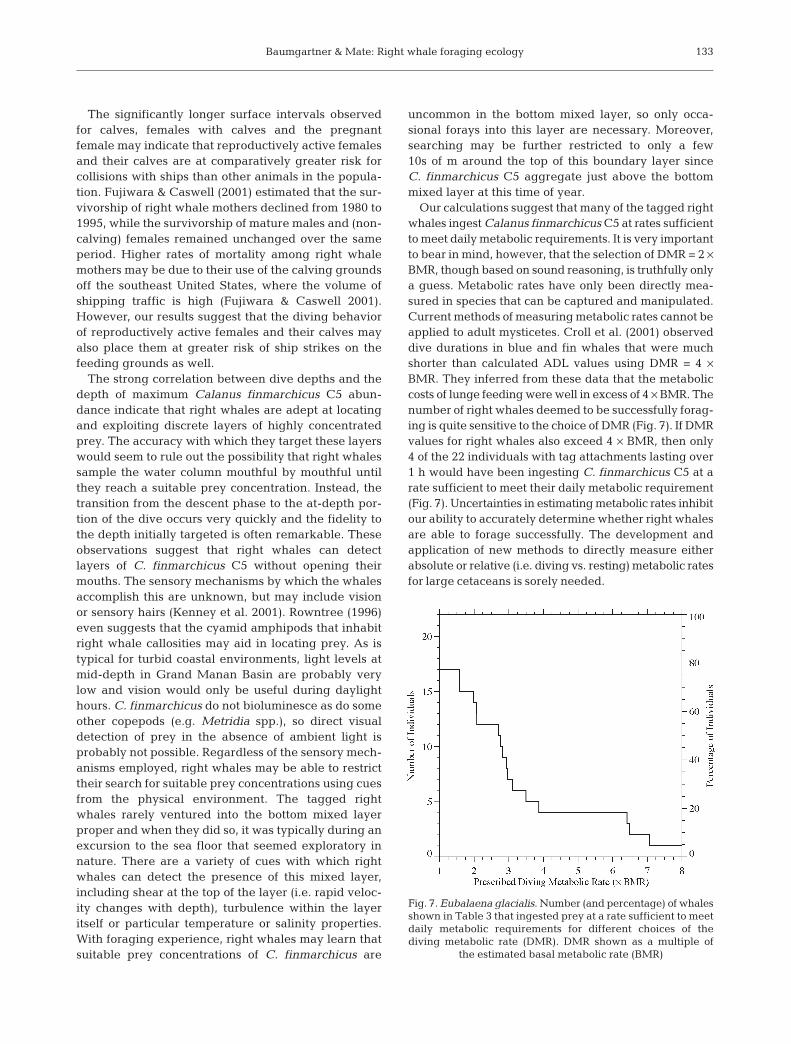
Our calculations suggest that many of the tagged rightwhales ingest Calanus finmarchicus C5 at rates sufficientto meet daily metabolic requirements. It is very importantto bear in mind, however, that the selection of DMR = 2 ×BMR, though based on sound reasoning, is truthfully onlya guess. Metabolic rates have only been directly mea-sured in species that can be captured and manipulated.Current methods of measuring metabolic rates cannot beapplied to adult mysticetes. Croll et al. (2001) observeddive durations in blue and fin whales that were muchshorter than calculated ADL values using DMR = 4 ×BMR. They inferred from these data that the metaboliccosts of lunge feeding were well in excess of 4 × BMR. Thenumber of right whales deemed to be successfully forag-ing is quite sensitive to the choice of DMR (Fig. 7). If DMRvalues for right whales also exceed 4 × BMR, then only4 of the 22 individuals with tag attachments lasting over1 h would have been ingesting C. finmarchicus C5 at arate sufficient to meet their daily metabolic requirement(Fig. 7). Uncertainties in estimating metabolic rates inhibitour ability to accurately determine whether right whalesare able to forage successfully. The development andapplication of new methods to directly measure eitherabsolute or relative (i.e. diving vs. resting) metabolic ratesfor large cetaceans is sorely needed.
133
Fig. 7. Eubalaena glacialis. Number (and percentage) of whalesshown in Table 3 that ingested prey at a rate sufficient to meetdaily metabolic requirements for different choices of thediving metabolic rate (DMR). DMR shown as a multiple of
the estimated basal metabolic rate (BMR)

Mar Ecol Prog Ser 264: 123–135, 2003
Despite the uncertainties in DMR, it is clear thatsome of the tagged whales were easily ingestingCalanus finmarchicus C5 at a rate sufficient to meettheir daily metabolic requirements. These whales wereable to identify and exploit very dense aggregationsof C. finmarchicus C5, which indicates that foodresources upon which individual right whales cansurvive seem to exist. Since no emaciated right whaleswere observed in the field and some tagged whaleschose socializing with conspecifics over foraging, thisresult is in no way surprising. It seems clear that suffi-cient food resources exist for individual right whales tosurvive, but the benchmark for successful foraging in aviable population is not simply meeting daily or evenannual maintenance requirements. Ingestion must alsobe sufficient to fuel reproduction, including the meta-bolic costs of social behavior (a rather energetic activ-ity in right whales), growth of a fetus and support ofa newborn calf via lactation. Of the 22 individualsexamined, 15 ingested C. finmarchicus C5 at rates thatwould require more than half of the day to be dedi-cated to foraging just to meet daily metabolic require-ments (Table 3). These results might suggest thatsufficient food resources do not exist to support the ele-vated metabolic demands associated with reproduc-tion for most of the population. However, a few caveatsmust be recalled before such a claim could be made.
The deployment durations during this study wereshort; most successful deployments were between 0.5and 2 h. Therefore, the ingestion rates estimated heremay not accurately reflect daily ingestion rates. Sincewe observed a few whales foraging on abundances ofCalanus finmarchicus C5 in excess of 10 000 copepodsm–3, we know that very dense concentrations are occa-sionally encountered. For those whales that had low in-gestion rates during the period they were tagged, it ispossible that they might also encounter similarly highabundances after several more hours of foraging effort.Accurate daily ingestion rates can only be obtainedwith deployments that last at least 24 h. Ingestion ratescan further be improved with direct swim speed mea-surements (relative to the water, not the ground), al-though we believe the error in the estimated ingestionrates attributable to a fixed swim speed (1.5 m s–1) is rel-atively small. In light of these considerations, we cannotjudge whether sufficient food resources exist to supportright whale population growth with our data. However,clear directions for future work are indicated. Day-longdeployments with concurrent zooplankton samplingare necessary to obtain accurate daily ingestion rates.Day-long deployments would also yield data on theamount of time devoted to foraging (T in Eq. 3), restingand social activities. As mentioned before, innovativemethods to measure metabolic rates in large cetaceansare also needed. Finally, it is important to obtain simi-
lar measurements outside the lower Bay of Fundythroughout the spring-summer-fall feeding season.Since right whales are capable of storing fat, it is pos-sible that feeding conditions elsewhere may providethe bulk of the energy required to meet reproductivemetabolic costs (e.g. Beardsley et al. 1996). Focusingonly on 1 feeding habitat, then, might provide a dis-torted view of whether sufficient food resources existto support right whale population growth.
Acknowledgements. We are indebted to chief scientists T. Coleand P. Clapham, the master, officers and crew of NOAA Ship‘Delaware II’ and the many professional and volunteer ob-servers who made field operations possible. Particular thanks goto our able drivers, B. Lagerquist and F. Wenzel, and to P. Duley,T. Fernald and J. Nicolas for special assistance in the field. T.Follett contributed considerable expertise to the construction ofthe tags. Several people graciously loaned equipment for whichwe are grateful: M. Taylor provided the CTD, R. Trask providedthe rosette cage, W. Pearcy provided the acoustic receiver andH. Dewar provided the directional hydrophone. R. Rolland con-ducted the fecal steroid hormone analysis to identify the preg-nant female tagged in Roseway Basin. We are grateful to C.Miller, E. Durbin, R. Kenney and 2 anonymous reviewers forcomments on earlier drafts of this manuscript. This research wassupported by the National Marine Fisheries Service, Office ofNaval Research and the Oregon State University MarineMammal Endowment. M.F.B. was supported by the SpaceGrant and Earth System Science fellowship programs of theNational Aeronautics and Space Administration.
LITERATURE CITED
Baumgartner MF (2003) Comparisons of Calanus finmarchi-cus fifth copepodite abundance estimates from nets andan optical plankton counter. J Plankton Res 25:855–868
Beardsley RC, Epstein AW, Chen C, Wishner KF, MacaulayMC, Kenney RD (1996) Spatial variability in zooplanktonabundance near feeding right whales in the Great SouthChannel. Deep-Sea Res II 43:1601–1625
Brown MW, Brault S, Hamilton PK, Kenney RD and 5 others(2001) Sighting heterogeneity of right whales in the west-ern North Atlantic: 1980–1992. J Cetacean Res ManageSpec Issue 2:245–250
Castellini MA, Kooyman GL, Ponganis, PJ (1992) Metabolicrates of freely diving Weddell seals: correlations withoxygen stores, swim velocity and diving duration. J ExpBiol 165:181–194
Caswell H, Fujiwara M, Brault S (1999) Declining survivalprobability threatens the North Atlantic right whale. ProcNatl Acad Sci USA 96:3308–3313
Clapham PJ, Young SB, Brownell Jr RL (1999) Baleen whales:conservation issues and the status of the most endangeredpopulations. Mamm Rev 29:35–60
Comita GW, Marshall SM, Orr AP (1966) On the biology ofCalanus finmarchicus. XIII. Seasonal change in weight,calorific value and organic matter. J Mar Biol Assoc UK46:1–17
Conversi A, Piontkovski S, Hameed S (2001) Seasonal andinterannual dynamics of Calanus finmarchicus in the Gulfof Maine (northeastern US shelf) with reference to theNorth Atlantic Oscillation. Deep-Sea Res II 48:519–530
Costa DP (1993) The secret life of marine mammals: novel
134

Baumgartner & Mate: Right whale foraging ecology
tools for studying their behavior and biology at sea.Oceanography 6:120–128
Costa DP, Gentry RL (1986) Free-ranging energetics of north-ern fur seals, Callorhinus ursinus. In: Gentry RL, KooymanGL (eds) Fur seals: maternal strategies on land and at sea.Princeton University Press, Princeton, NJ, p 79–101
Costa DP, Williams TM (1999) Marine mammal energetics. In:Reynolds JE III, Rommel SA (eds) Biology of Marine Mam-mals. Smithsonian Institution Press, Washington, Districtof Columbia, USA, p 176–217
Costa DP, Croxall JP, Duck C (1989) Foraging energetics ofAntarctic fur seals, Arctocephalus gazella, in relation tochanges in prey availability. Ecology 70:596–606
Croll DA, Acevedo-Gutiérrez A, Tershy BR, Urbán-Ramírez J(2001) The diving behavior of blue and fin whales: is diveduration shorter than expected based on oxygen stores?Comp Biochem Physiol A 129:797–809
Dolphin WF (1987) Dive behavior and estimated energyexpenditure of foraging humpback whales in southeastAlaska. Can J Zool 65:354–362
Fromentin J, Planque B (1996) Calanus and environment inthe eastern North Atlantic. II. Influence of the NorthAtlantic Oscillation on C. finmarchicus and C. helgolandi-cus. Mar Ecol Prog Ser 134:111–118
Fujiwara M, Caswell H (2001) Demography of the endan-gered North Atlantic right whale. Nature 414:537–541
Greene CH, Pershing AJ (2000) The response of Calanus fin-marchicus populations to climate variability in the North-west Atlantic: basin-scale forcing associated with theNorth Atlantic Oscillation. ICES J Mar Sci 57:1536–1544
Goodyear JD (1993) A sonic/radio tag for monitoring divedepths and underwater movements of whales. J WildlManage 57:503–513
Hamilton PK, Martin SM (1999) A catalog of identified rightwhales from the western North Atlantic: 1935 – 1997. NewEngland Aquarium, Boston, MA
Herman AW (1988) Simultaneous measurement of zooplank-ton and light attenuance with a new optical planktoncounter. Cont Shelf Res 8:205–221
Herman AW (1992) Design and calibration of a new opticalplankton counter capable of sizing small zooplankton.Deep-Sea Res 39:395–415
International Whaling Commission (IWC) (2001) Report of theworkshop on status and trends of western North Atlanticright whales. J Cetacean Res Manage Spec Issue 2:61–87
Johnson DE (1998) Applied multivariate methods for dataanalysts. Duxbury Press, Pacific Grove, CA
Kenney RD, Winn HE (1986) Cetacean high-use habitats ofthe northeast United States continental shelf. Fish Bull84:345–357
Kenney RD, Hyman MAM, Owen RE, Scott GP, Winn HE(1986) Estimation of prey densities required by westernNorth Atlantic right whales. Mar Mamm Sci 2:1–13
Kenney RD, Winn HE, Macaulay MC (1995) Cetaceans in theGreat South Channel, 1979 – 1989: right whale (Eubala-ena glacialis). Cont Shelf Res 15:385–414
Kenney RD, Mayo CA, Winn HE (2001) Migration and forag-ing strategies at varying spatial scales in western NorthAtlantic right whales: a review of hypotheses. J CetaceanRes Manage Spec Issue 2:251–260
Kleiber M (1975) The Fire of Life: an introduction to animalenergetics. RE Kreiger Publishing Co, Huntington, NY
Knowlton AR, Kraus SD, Kenney RD (1994) Reproduction inNorth Atlantic right whales (Eubalaena glacialis). Can JZool 72:1297–1305
Kooyman GL (1989) Diverse divers: physiology and behavior.Springer-Verlag, Berlin
Kooyman GL, Kerem DH, Campbell WB, Wright JJ (1973)Pulmonary gas exchange in freely diving Weddell seals.Respir Physiol 17:283–290
Kooyman GL, Wahrenbrock EA, Castellini MA, Davis RW,Sinnett EE (1980) Aerobic and anaerobic metabolismduring voluntary diving in Weddell seals: evidence ofpreferred pathways from blood chemistry and behavior.J Comp Physiol B 138:335–346
Kooyman GL, Castellini MA, Davis RW, Maue RA (1983)Aerobic diving limits of immature Weddell seals. J CompPhysiol B 151:171–174
Kraus SD, Hamilton PK, Kenney RD, Knowlton AR, Slay CK(2001) Reproductive parameters of the North Atlanticright whale. J Cetacean Res Manage Spec Issue 2:231–326
Lockyer C (1981) Growth and energy budgets of large baleenwhales from the Southern Hemisphere. In: FAO AdvisoryCommittee on Marine Resource Research, Mammals inthe sea, Vol III. General papers and large cetaceans. FAO,Rome, p 379–487
Mayo CA, Marx MK (1990) Surface foraging behavior ofthe North Atlantic right whale, Eubalaena glacialis, andassociated zooplankton characteristics. Can J Zool 68:2214–2220
Mayo CA, Letcher BH, Scott S (2001) Zooplankton filteringefficiency of the baleen of a North Atlantic right whale,Eubalaena glacialis. J Cetacean Res Manage Spec Issue 2:225–229
Miller CB, Cowles TJ, Wiebe PH, Copley NJ, Grigg H (1991)Phenology in Calanus finmarchicus; hypotheses aboutcontrol mechanisms. Mar Ecol Prog Ser 72:79–91
Murison LD, Gaskin GE (1989) The distribution of rightwhales and zooplankton in the Bay of Fundy, Canada. CanJ Zool 67:1411–1420
Nowacek DP, Johnson MP, Tyack PL, Shorter KA, McLellanWA, Pabst DA (2001) Buoyant balaenids: the ups anddowns of buoyancy in right whales. Proc R Soc Lond B 268:1811–1816
Payne PM, Wiley DN, Young SB, Pittman S, Clapham PJ, JossiJW (1990) Recent fluctuations in the abundance of baleenwhales in the southern Gulf of Maine in relation tochanges in selected prey. Fish Bull 88:687–696
Rowntree VJ (1996) Feeding, distribution, and reproductivebehavior of cyamids (Crustacea: Amphipoda) living onhumpback and right whales. Can J Zool 74:103–109
Sameoto DD, Herman AW (1990) Life cycle and distribution ofCalanus finmarchicus in deep basins on the Nova Scotiashelf and seasonal changes in Calanus spp. Mar Ecol ProgSer 66:225–237
Stone GS, Kraus SD, Prescott JH, Hazard KW (1988) Signifi-cant aggregations of the endangered right whale, Eubala-ena glacialis, on the continental shelf of Nova Scotia. CanField-Nat 102:471–474
Watkins WA, Schevill WE (1976) Right whale feeding andbaleen rattle. J Mammal 57:58–66
Wishner K, Durbin E, Durbin A, Macaulay M, Winn H,Kenney R (1988) Copepod patches and right whales in theGreat South Channel off New England. Bull Mar Sci 43:825–844
Wishner KF, Schoenherr JR, Beardsley R, Chen C (1995)Abundance, distribution and population structure of thecopepod Calanus finmarchicus in a springtime right whalefeeding area in the southwestern Gulf of Maine. ContShelf Res 15:475–507
Woodley TH, Gaskin DE (1996) Environmental characteristicsof North Atlantic right and fin whale habitat in the lowerBay of Fundy, Canada. Can J Zool 74:75–84
135
Editorial responsibility: Kenneth Sherman (ContributingEditor), Narragansett, Rhode Island, USA
Submitted: February 27, 2003; Accepted: September 15, 2003Proofs received from author(s): December 2, 2003