supplement to chapter 6: control charts for...
TRANSCRIPT

1
Islamic University, Gaza - Palestine
Supplement to chapter 6: Control Charts for Variables
Islamic University, Gaza - Palestine
Parameter(s) is a characteristic of a population, i.o.w. it describes a population ,q Example: average weight of the population, e.g. 50,000 cans made in a month.Statistic(s) is a characteristic of a sample, used to make inferences on the population parameters that are typically unknown, called an estimator, q Example: average weight of a sample of 500 cans from that month’s output, an estimate of the average weight of the 50,000 cans.
Parameter and Statistic

2
Islamic University, Gaza - Palestine
q Populationq Set of all items that possess a characteristic of interest (Lot)
q Sampleq Subset of a population
Population and Sample
Mean Absolute Deviation, MAD
Islamic University, Gaza - Palestine
Population and Sample
population samples Data (from samples)
sampling measurement
deviation standard sample deviation standardMode Mode
median~ median ~average mean
−−
−−
−−
s
XX
σ
µ
µ
Statistics Parameters SAMPLE POPULATION
populationfor )(
samplefor 1
)( Sor SD
2
1
2
1
⇒−
=
⇒−
−=
∑
∑
=
=
N
x
n
xx
n
ii
n
ii
µσ

3
Islamic University, Gaza - Palestine
Normal Distribution and Standard Deviation
Islamic University, Gaza - Palestine
Sigma and Defective Units
Specification Range(in +/- Sigmas)
Percent ofPopulationWithin Range
Defective UnitsPer Billion
1 68.27 317,300,000
2 95.45 45,400,000
3 99.73 2,700,000
4 99.9937 63,000
5 99.999943 57
6 99.9999998 2

4
Islamic University, Gaza - Palestine
Six Sigma Conversion Table
The Six Sigma convention for determining defects is based on the above conversion table. It accounts for a 1.5 sigma shift to measure the number of defects per million opportunities instead of the number of defects per unit.
Islamic University, Gaza - Palestine
MEANING
Ø manufactured Refers to the use of statistical techniques in controlling the quality of goods.
Ø Means of establishing & achieving quality specification, which requires use of tools & techniques of statistics.

5
Islamic University, Gaza - Palestine
Definition
”Statistical quality control can be simply defined as an economic & effective system of maintaining & improving the quality of outputs throughout the whole operating process of specification, production & inspection based on continuous testing with random samples.”
OTHER DEFINITION
“Statistical quality control should be viewed as a kit of tools which may influence decisions to the functions of specification, production or inspection“.
Islamic University, Gaza - Palestine
Characteristics of S.Q.C.
Ø Designed to control quality standard of goods produced for marketing.
Ø Exercise by the producers during production to assess the quality of goods.
Ø Carried out with the help of certain statistical tools like Mean Chart, Range Chart, P-Chart, C-Chart etc.
Ø Designed to determine the variations in quality of the goods & limits of tolerance.

6
Islamic University, Gaza - Palestine
Causes of variations in quality
ASSIGNABLE CAUSES
It refers to those changes in the quality of the products which can be assigned or attributed to any particular causes like defective materials, defective labor, etc.
CHANCE CAUSES
These causes take place as per chance or in a random fashion as a result of the cumulative effect of a multiplicity of several minor causes which cannot be identified. These causes are inherent in every type of production.
Islamic University, Gaza - Palestine
Causes of variations in quality (cont.)
Chance causeVariation by chance cause is unavoidable and inevitably occurs in a process, even if the operation is carried out using standardized raw materials and methods. It is not practical to eliminate the chance cause technically and economically for the present.
Assignable causeVariation by assignable cause means that there are meaningfulfactors to be investigated. It is avoidable and cannot beoverlooked: there are cases caused by not following certainstandards or applying improper standards.For e.g. Training , M/c repair.

7
Islamic University, Gaza - Palestine
METHODS OF S.Q.C.
PROCESS CONTROL-: Under this the quality of the products is controlled while the products are in the process of production.
The process control is secured with the technique of control charts. Control charts are also used in the field of advertising, packing etc. They ensures that whether the products confirm to the specified quality standard or not.
Islamic University, Gaza - Palestine
Purpose & uses of control charts
1. Helps in determining the quality standard of the products.
2. Helps in detecting the chance & assignable variations in the quality standards by setting two control limits.
3. Reveals variations in the quality standards of the products from the desired level.
4. Indicates whether the production process is in control or not.
5. Ensures less inspection cost & time in the process control.

8
Islamic University, Gaza - Palestine
What Does a Control Chart Do?
– Focuses attention on detecting and monitoring process variation over time;
– Distinguishes special from common causes of variation, as a guide to local or management action;
– Serves as a tool for ongoing control of a process;– Helps improve a process to perform consistently and
predictably for higher quality, lower cost, and higher effective capacity;
– Provides a common language for discussing process performance.
Islamic University, Gaza - Palestine
Quality Control Charts
• A control chart is a graphic display of data that illustrates the results of a process over time.
• The main use of control charts is to prevent defects, rather than to detect or reject them.
• Quality control charts allow you to determine whether a process is in control or out of control.– When a process is in control, any variations in the results of
the process are created by random events; processes that are in control do not need to be adjusted.
– When a process is out of control, variations in the results of the process are caused by non-random events; you need to identify the causes of those non-random events and adjust the process to correct or eliminate them.

9
Islamic University, Gaza - Palestine
Purpose & Uses of Control Charts
1. Helps in determining the quality standard of the products.
2. Helps in detecting the chance & assignable variations in the quality standards by setting two control limits.
3. Reveals variations in the quality standards of the products from the desired level.
4. Indicates whether the production process is in control or not.
5. Ensures less inspection cost & time in the process control.
Islamic University, Gaza - Palestine
Elements of a Control Chart
• X axis shows time• Y axis shows average cost (or dependent variable of
interest)• Observed rates are plotted against time sequence• Upper or lower control limit are drawn so that points 95%
or 99% of data should fall within these limits
10
Islamic University, Gaza - Palestine
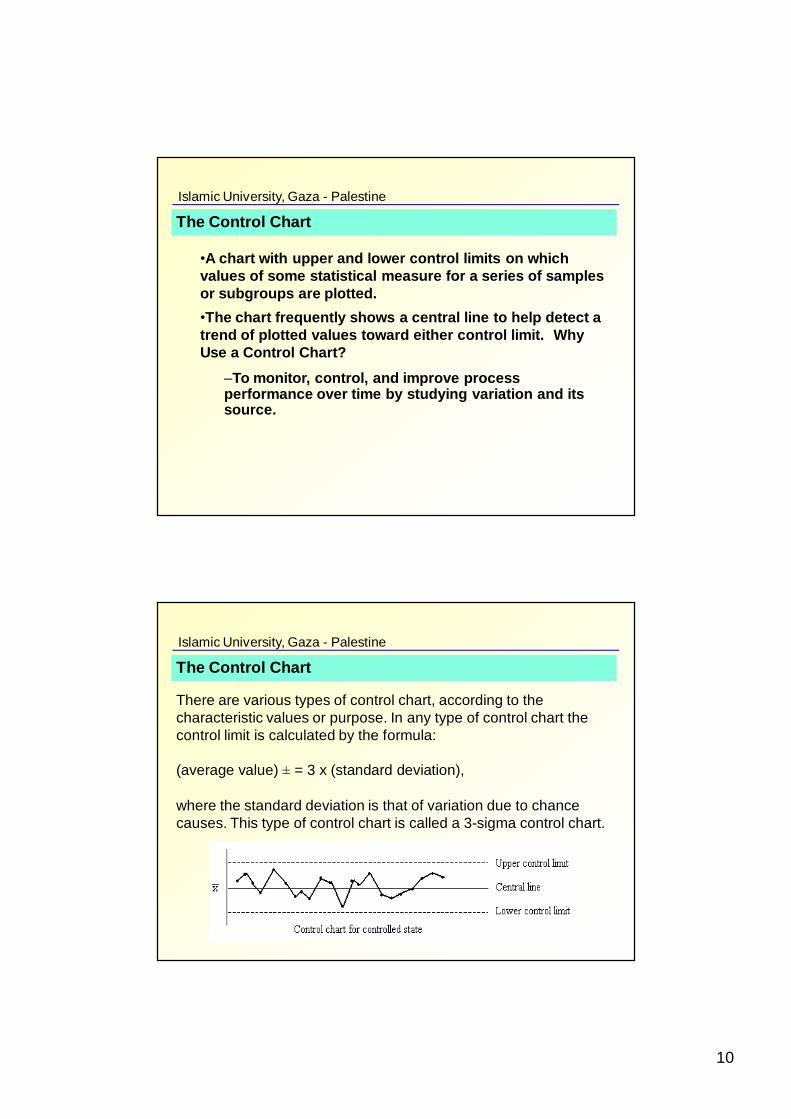
•A chart with upper and lower control limits on which values of some statistical measure for a series of samples or subgroups are plotted. •The chart frequently shows a central line to help detect a trend of plotted values toward either control limit. Why Use a Control Chart?
–To monitor, control, and improve process performance over time by studying variation and its source.
The Control Chart
Islamic University, Gaza - Palestine
20
There are various types of control chart, according to the characteristic values or purpose. In any type of control chart the control limit is calculated by the formula:
(average value) ± = 3 x (standard deviation),
where the standard deviation is that of variation due to chance causes. This type of control chart is called a 3-sigma control chart.
The Control Chart

11
Islamic University, Gaza - Palestine
X-chart
This chart is constructed for controlling the variations in the average quality std. of the products in a production process.
1) control limit is = X
2) Upper control limit( X+A2 R )(quality control factor)
3) Lower control limit( X-A2 R )
Islamic University, Gaza - Palestine
Steps to create an X-bar chart?
1. Check assumptions2. Calculate grand average3. Calculate standard deviation4. Calculate standard deviation for each time period5. Calculate control limits6. Plot chart7. Interpret and distribute

12
Islamic University, Gaza - Palestine
R Chart
Monitor process variation:1.Decide on the quality to be measured.2.Determine a sample size.3.Gather 20 to 30 samples.4.Compute the sample range for each sample.5.Determine the average sample mean for all samples6.Using the size of the samples to determine the values for D3 and D4
Islamic University, Gaza - Palestine
Control Charts for & R & S Chart x
RLCL
RUCLk
SS
RXLCL
RXUCL
kX
X
ChartsSandX
BB
AA
3
4
3
3
=
=
=
−=
+=
=
∑
∑
RUCL
RLCLk
RR
RXLCL
RXUCL
kX
X
ChartsandX
DD
AA
4
3
2
2
R
=
=
=
−=
+=
=
∑
∑

13
Islamic University, Gaza - Palestine
Procedure to Construct X Chart and R Chart
1. Identify the process to be controlled.2. Select the variable of interest.3. Decide a suitable sample size (n) and number of samples to be
collected (k)4. Collect the specified number of samples over a given time
interval.5. Find the measurement of interest for each piece within the
sample.6. Obtain the mean (X) of each sample. (X =[∑ xi]/n).7. Also obtain the range R of each sample (R=Max xi - Min xi).8. Then obtain and { =[∑ X]/k, = [∑ R]/k. 9. Establish the control limits for X and R chart.
X R
Islamic University, Gaza - Palestine
Control Charts for and R & Trial Control Limits
• The control limits obtained from equations should be treated as trial control limits.
• If this process is in control for the m (k, x) samples collected, then the system was in control in the past.
• If all points plot inside the control limits and no systematic behavior is identified, then the process was in control in the past, and the trial control limits are suitable for controlling current or future production.
x

14
Islamic University, Gaza - Palestine
Trial control limits and the out-of-control process
• If points plot out of control, then the control limits must be revised.
• Before revising, identify out of control points and look for assignable causes.– If assignable causes can be found, then discard the point(s)
and recalculate the control limits. – If no assignable causes can be found then
1) either discard the point(s) as if an assignable cause had been found or
2) retain the point(s) considering the trial control limits as appropriate for current control.
If future samples still indicate control, then the unexplained points can probably be safely dropped
Islamic University, Gaza - Palestine
Trial control limits and the out-of-control process (cont.)
Before revising, identify out of control points and look for assignable causes. – When many of the initial samples plot out of control against the trial limits, (as few data will remain which we can recompute reliable control limits.)
It is better to concentrate on the pattern formed by these points.
When setting up x and R control charts, it is best to begin with the R chart. Because the control limits on the x chart depend on the process variability, unless process variability is in control, these limits will not have much meaning.
15
Islamic University, Gaza - Palestine
Revision of Control Limits and Center Line
• The effective use of control chart will require periodic revision of the control limits and center lines.
– Every week, every month, or every 25, 50, or 100 samples. – When revising control limits, it is highly desirable to use at least 25
samples or subgroups in computing control limits.
• If the R chart exhibits control, the center line of the X Chart will be replaced with a target value. This can be helpful in shifting the process average to the desired value.
Islamic University, Gaza - Palestine
Control Charts for and R
Rational Subgroups
• X bar chart monitors the between sample variability• R chart monitors the within sample variability.
x

16
Islamic University, Gaza - Palestine
Control Limits, Specification Limits, and Natural Tolerance Limits
• Control limits are functions of the natural variability of the process.
• Natural tolerance limits represent the natural variability of the process (usually set at 3-sigma from the mean).
• Specification limits are determined by developers/designers.
• There is no mathematical relationship between control limits and specification limits.
• Do not plot specification limits on the charts – Causes confusion between control and capability – If individual observations are plotted, then specification limits may be plotted on the chart.
Islamic University, Gaza - Palestine
Control Charts for and R
Guidelines for the Design of the Control Chart• Specify sample size, control limit width, and
frequency of sampling• if the main purpose of the x-bar chart is to detect
moderate to large process shifts, then small sample sizes are sufficient (n = 4, 5, or 6)
• if the main purpose of the x-bar chart is to detect small process shifts, larger sample sizes are needed (as much as 15 to 25)…which is often impractical…alternative types of control charts are available for this situation…see Chapter 8
x

17
Islamic University, Gaza - Palestine
Control Charts for and R (cont.)
Guidelines for the Design of the Control Chart
• If increasing the sample size is not an option, then sensitizing procedures (such as warning limits) can be used to detect small shifts…but this can result in increased false alarms.
• R chart is insensitive to shifts in process standard deviation.(the range method becomes less effective as the sample size increases) may want to use S or S2
chart.• The OC curve can be helpful in determining an
appropriate sample size.
x
Islamic University, Gaza - Palestine
Control Charts for and R (cont.)
Guidelines for the Design of the Control ChartAllocating Sampling Effort• Choose a larger sample size and sample less frequently?
or, Choose a smaller sample size and sample more frequently?
• The method to use will depend on the situation. In general, small frequent samples are more desirable.
x

18
Islamic University, Gaza - Palestine
When should you recalculate the control limits?
• Judgement call• Do the data display a distinctly different kind of
behaviour than in the past?• Is the reason for this change in behaviour known?• Is the new process behaviour desirable?• Is it intended and expected that the new process
behaviour will continue?• If yes, then revise the limits
Islamic University, Gaza - Palestine
Corrective Action Should Be Taken When Observing Points outside the Control Limits,
Or when a Trend Has Been Detected,
Seven consecutive points above the center line (or seven below),
Seven consecutive points that are increasing (decreasing),
When to Take Corrective Action?

19
Islamic University, Gaza - Palestine
Suggested Number of Data Points
• More data points means more delay• Fewer data points means less precision, wider limits• A tradeoff needs to be made between more delay and
less precision• Generally 25 data points judged sufficient
– Use smaller time periods to have more data points– Fewer cases may be used as approximation
The idea is to improve not to prove a point
Islamic University, Gaza - Palestine
- Rational subgroup from homogeneous lot : same machine, same operator
- Decisions on size of sample empirical judgment + relates to costs
• choose n = 4 or 5 → use R-chart• when n ≥ 10 → use s-chart- frequency of taking subgroups often enough to detect process
changes- Guideline of sample sizes/frequency using • Say, 4000 parts/day∴ 75 samples• if n = 4 ∴ 19 subgroups• or n = 5 15 subgroups
Suggested Number of Data Points (cont.)

20
Islamic University, Gaza - Palestine
In-Control Process
If the control chart is not indicating any out-of-control condition, then only common causes of variation exist it is sometimes said to be in a state of statistical control,
If the common-cause variation is small, then control chart can be used to monitor the process,
If the common-cause variation is too large, the process needs to be altered (changed).
Islamic University, Gaza - Palestine
Pattern Tests and the Western Electric Rules
• A wide variety of pattern tests (also called zone rules) can be developed based on the IID and normal distribution assumptions and the properties of the normal distribution.
• For example, the following excerpts from the Western Electric Rules indicate that the process is out of control if one or more of the following conditions occur:
• Pattern tests can be used to augment Shewhart charts

21
Islamic University, Gaza - Palestine
1. One data point is outside the 3 Sigma control limits.
2. Two out of three consecutive data points are beyond a 2 Sigma limit.
3. Four out of five consecutive data points are beyond a 1 Sigma limit and on one side of the center line.
4. Eight (Seven) consecutive points are on one side of the center line.
• Although Shewhart charts with 3 limits can quickly detect large process changes, they are ineffective for small, sustained process changes (for example, changes smaller than 1.5 )
• Two alternative control charts have been developed to detect small changes: the CUSUM and EWMA control charts.
• They also can detect large process changes (for example, 3 shifts), but detection is usually somewhat slower than for Shewhart charts.
Pattern Tests and the Western Electric Rules (cont.)
Islamic University, Gaza - Palestine
The Seven Run Rule
• You can use quality control charts and the seven run rule to look for patterns in data.
• The seven run rule states that if seven data points in a row are all below the mean, above the mean, or are all increasing or decreasing, then the process needs to be examined for non-random problems.

22
Islamic University, Gaza - Palestine
Sample Quality Control Chart
Islamic University, Gaza - Palestine
Interpreting Control Charts
• Points are above UCL and/or below LCL
• Seven or more consecutive points fall above or below the centerline.
• A trend of Seven or more consecutive points (increasing or decreasing) is present
• Two out of 3 consecutive values are in the outer one-third.
• Four out 5 consecutive values are in the outer two-thirds.
• The centerline shifts from chart to chart.

23
Islamic University, Gaza - Palestine
Interpreting Control Charts: Points above UCL and/or below LCL
UCL
LCL
Centerline
Islamic University, Gaza - Palestine
Interpreting Control Charts: 7 Consecutive Points on One Side of the Centerline
UCL
LCL
Centerline

24
Islamic University, Gaza - Palestine
Interpreting Control Charts: 7 Consecutive Increasing Points
UCL
LCL
Centerline
Islamic University, Gaza - Palestine
Interpreting Control Charts: 2 out of 3 Consecutive Points in Outer 1/3
UCL
LCL
Centerline

25
Islamic University, Gaza - Palestine
Interpreting Control Charts: 4 out of 5 Consecutive Points in Outer 2/3
UCL
LCL
Centerline
Islamic University, Gaza - Palestine
ADVANTAGES OF S.Q.C.
Ø Helpful in controlling quality of a productØ Eliminate Assignable causes of variationØ Better quality at lower inspection costØ Useful to both consumers & producersØ It makes workers quality consciousØ Helps in earn goodwill

26
Islamic University, Gaza - Palestine
LIMITATIONS S.Q.C.
Ø Does not serve as a ‘solution’ for all quality evils.Ø It cannot be used to all production process.Ø It involves mathematical & statistical problems in the
process of analysis & interpretation of variations in quality.
Ø Provides only an information services.
Islamic University, Gaza - Palestine
Two types of Error
α
β
Producer’s Risk or Type 1 error.
Means lot good, but sampling plan rejects
Consumer’s Risk or Type 2 error.
Means lot bad, but sampling plan accepts.

27
Islamic University, Gaza - Palestine
S.Q.C. UCL = + A2
CL + LCL = - A2
R UCL = D4 CL = LCL = D3
x UCL = + 2.66 s CL = LCL = - 2.66 s
pn UCL = n + 3 CL = n
LCL = n – 3 p UCL = + 3
CL =
LCL = - 3 c UCL = + 3
CL = LCL = - 3
u UCL = + 3 CL =
LCL = - 3
Islamic University, Gaza - Palestine
End of Chapter 5