supplemental data. ono et al. plant cell. (2010). … · it is important to note, in this regard,...
TRANSCRIPT

Supplemental Figure 1. Bi-functional activities of Vv GT6.
(A) HPLC analysis of authentic quercetin 3-O-galactoside (peak a), quercetin 3-O-glucoside
(peak b), and quercetin aglycon (peak c). Analytical HPLC was carried out using a Shimadzu
Prominence system (Shimadzu, Kyoto, Japan), which was equipped with an on-line SPD-M20A
photodiode array detector (Shimadzu): column, J'sphere ODS-M80 (4.6 x 150 mm, YMC,
Japan); flow rate, 0.7 ml/min; solvent A, 0.2% (v/v) formic acid in a 1:9 mixture (v/v) of ace-
tonitrile and H2O; solvent B, 0.2% (v/v) formic acid in a 9:1 mixture (v/v) of acetonitrile and
H2O; After injection of samples into a column that had been equilibrated with 10% solvent B,
the column was initially developed with 10% solvent B for 3 min and then with two successive
linear gradients from 10% to 20% solvent B for 12 min and from 20% to 90% solvent B for 8
min. This was followed by isocratic development with 90% solvent B for 1 min. The column was
finally equilibrated with 10% solvent B for 10 min before the next injection. Detection absor-
bance, 360 nm.
(B) HPLC analysis of the reaction of Vv GT6 with quercetin (100 �M) in the presence of both
UDP-Glc and UDP-Gal (1 mM each) at pH 7.4 and 30 °C for 10 min.
Supplemental Data. Ono et al. Plant Cell. (2010). 10.1105/tpc.110.074625
1
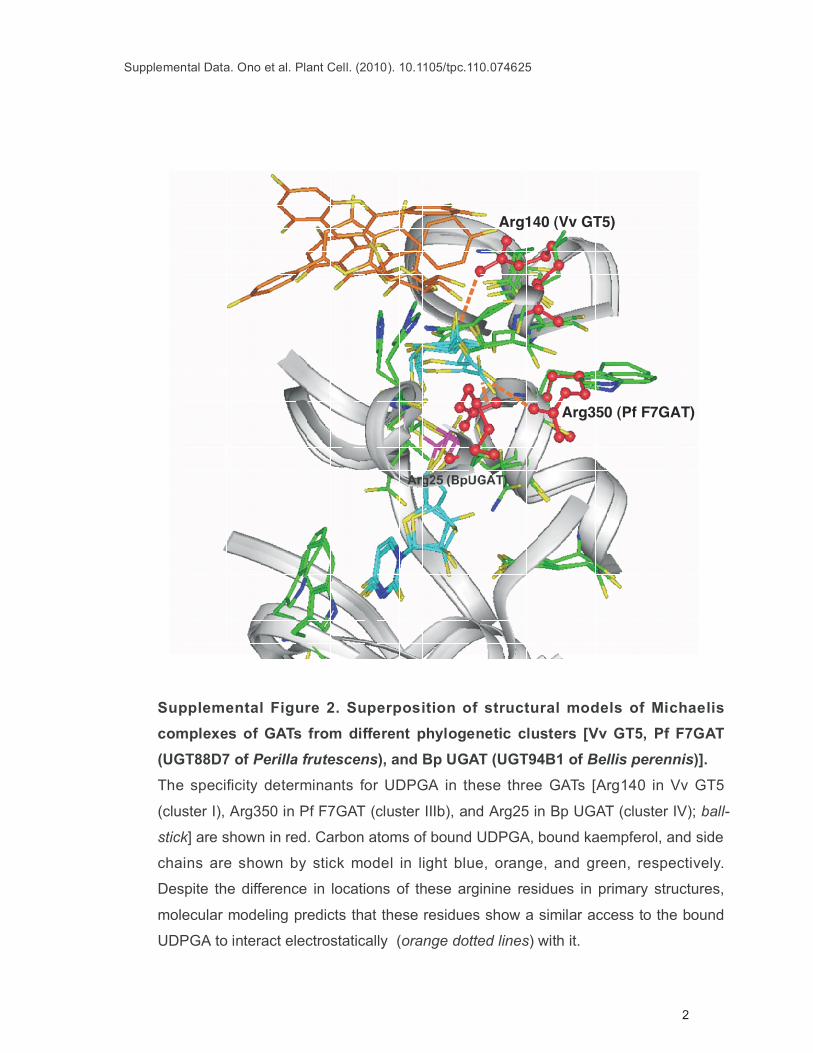
Supplemental Figure 2. Superposition of structural models of Michaelis
complexes of GATs from different phylogenetic clusters [Vv GT5, Pf F7GAT
(UGT88D7 of Perilla frutescens), and Bp UGAT (UGT94B1 of Bellis perennis)].
The specificity determinants for UDPGA in these three GATs [Arg140 in Vv GT5
(cluster I), Arg350 in Pf F7GAT (cluster IIIb), and Arg25 in Bp UGAT (cluster IV); ball-
stick] are shown in red. Carbon atoms of bound UDPGA, bound kaempferol, and side
chains are shown by stick model in light blue, orange, and green, respectively.
Despite the difference in locations of these arginine residues in primary structures,
molecular modeling predicts that these residues show a similar access to the bound
UDPGA to interact electrostatically (orange dotted lines) with it.
Arg140 (Vv GT5)
Arg350 (Pf F7GAT)
Supplemental Data. Ono et al. Plant Cell. (2010). 10.1105/tpc.110.074625
2
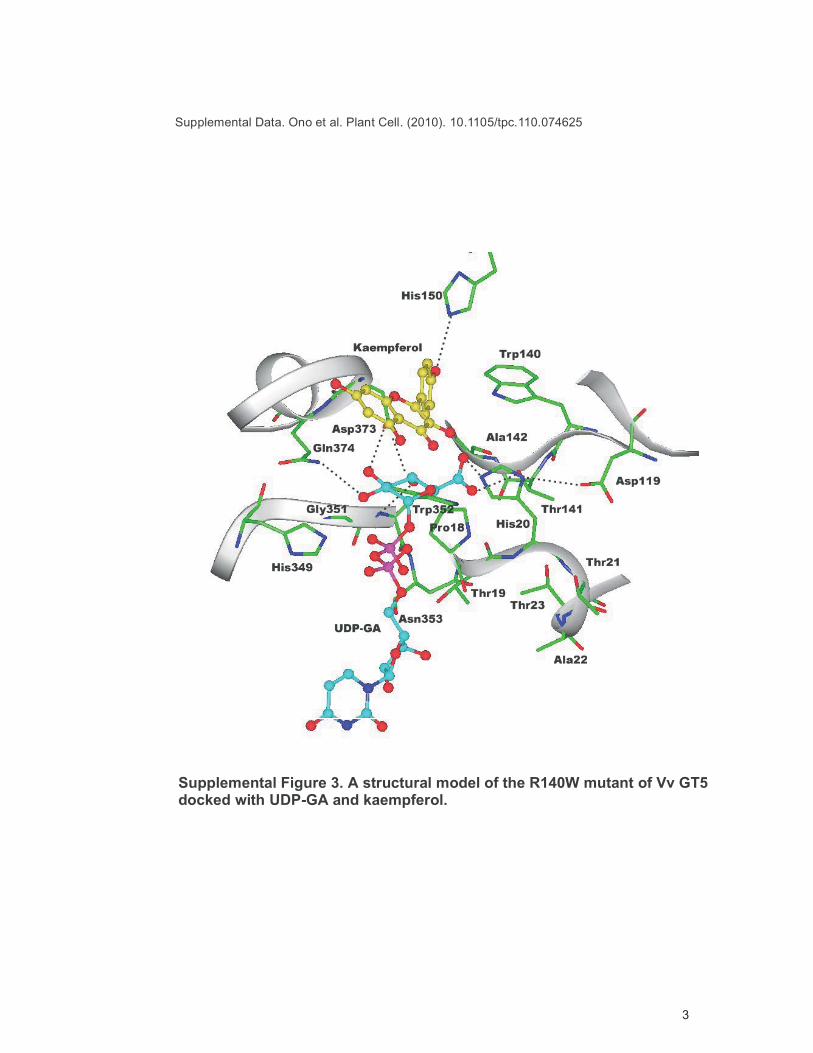
Supplemental Figure 3. A structural model of the R140W mutant of Vv GT5docked with UDP-GA and kaempferol.
Supplemental Data. Ono et al. Plant Cell. (2010). 10.1105/tpc.110.074625
3
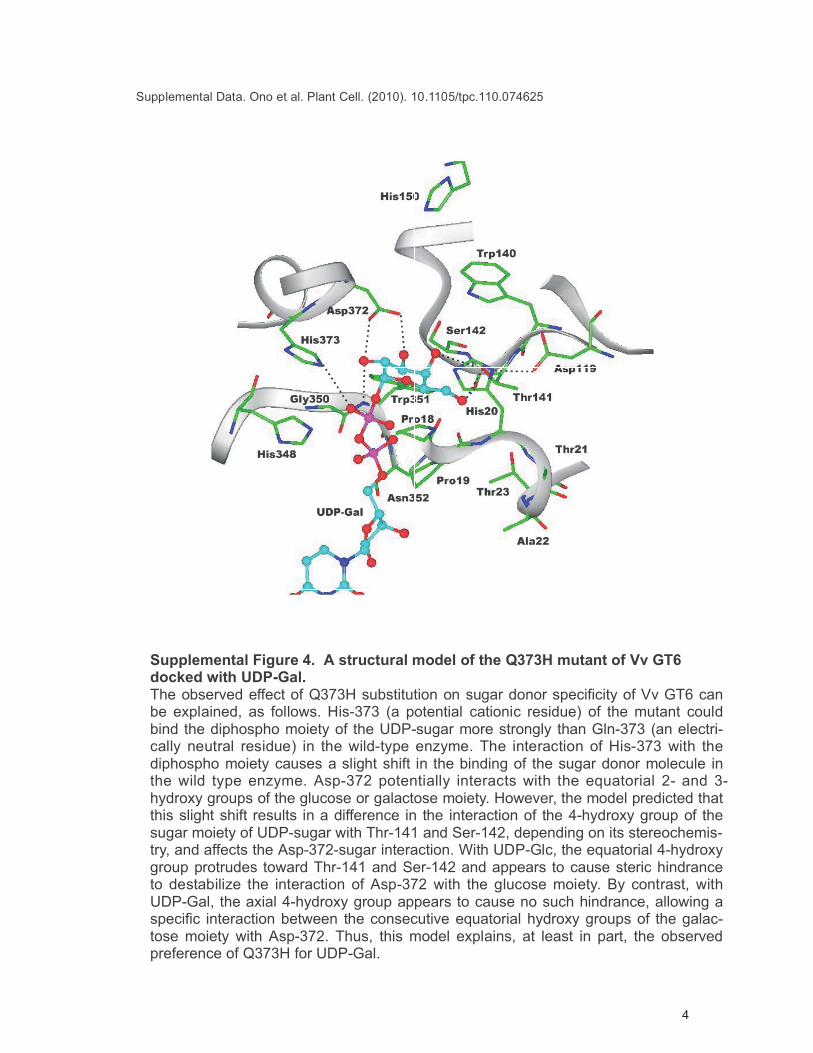
Supplemental Figure 4. A structural model of the Q373H mutant of Vv GT6docked with UDP-Gal.The observed effect of Q373H substitution on sugar donor specificity of Vv GT6 canbe explained, as follows. His-373 (a potential cationic residue) of the mutant couldbind the diphospho moiety of the UDP-sugar more strongly than Gln-373 (an electri-cally neutral residue) in the wild-type enzyme. The interaction of His-373 with thediphospho moiety causes a slight shift in the binding of the sugar donor molecule inthe wild type enzyme. Asp-372 potentially interacts with the equatorial 2- and 3-hydroxy groups of the glucose or galactose moiety. However, the model predicted thatthis slight shift results in a difference in the interaction of the 4-hydroxy group of thesugar moiety of UDP-sugar with Thr-141 and Ser-142, depending on its stereochemis-try, and affects the Asp-372-sugar interaction. With UDP-Glc, the equatorial 4-hydroxygroup protrudes toward Thr-141 and Ser-142 and appears to cause steric hindranceto destabilize the interaction of Asp-372 with the glucose moiety. By contrast, withUDP-Gal, the axial 4-hydroxy group appears to cause no such hindrance, allowing aspecific interaction between the consecutive equatorial hydroxy groups of the galac-tose moiety with Asp-372. Thus, this model explains, at least in part, the observedpreference of Q373H for UDP-Gal.
Supplemental Data. Ono et al. Plant Cell. (2010). 10.1105/tpc.110.074625
4
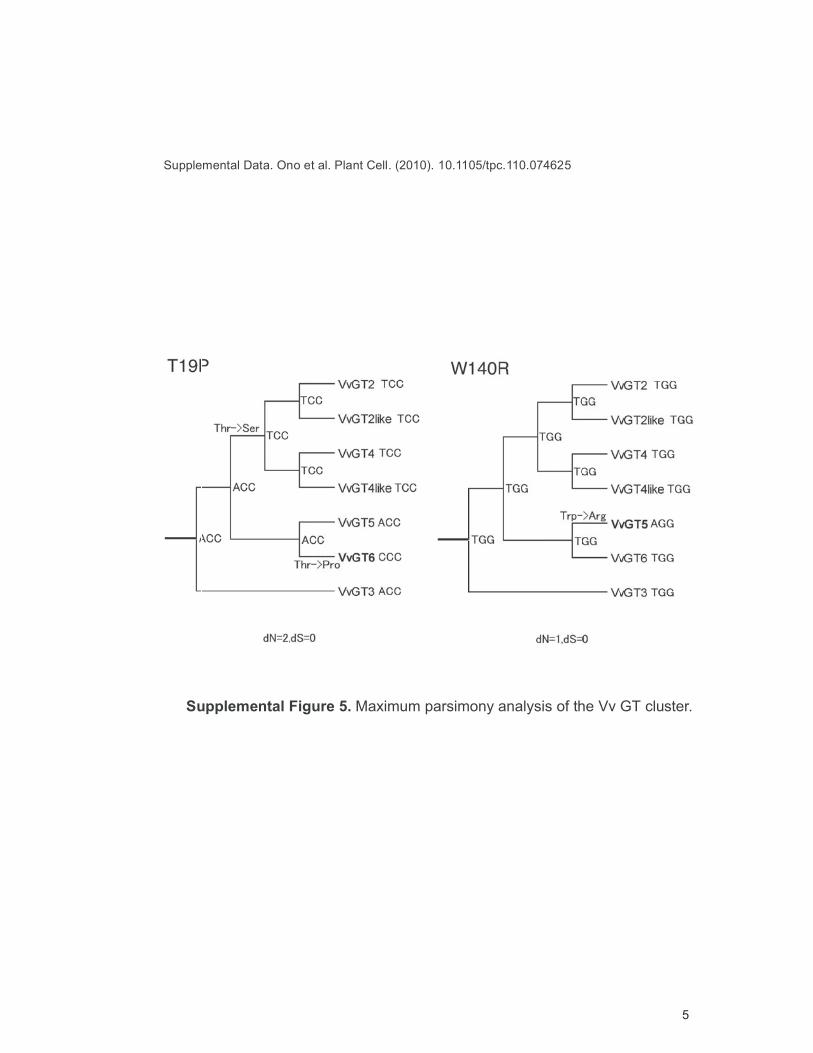
Supplemental Figure 5. Maximum parsimony analysis of the Vv GT cluster.
Supplemental Data. Ono et al. Plant Cell. (2010). 10.1105/tpc.110.074625
5
Supplemental Data. Ono et al. Plant Cell. (2010). 10.1105/tpc.110.074625
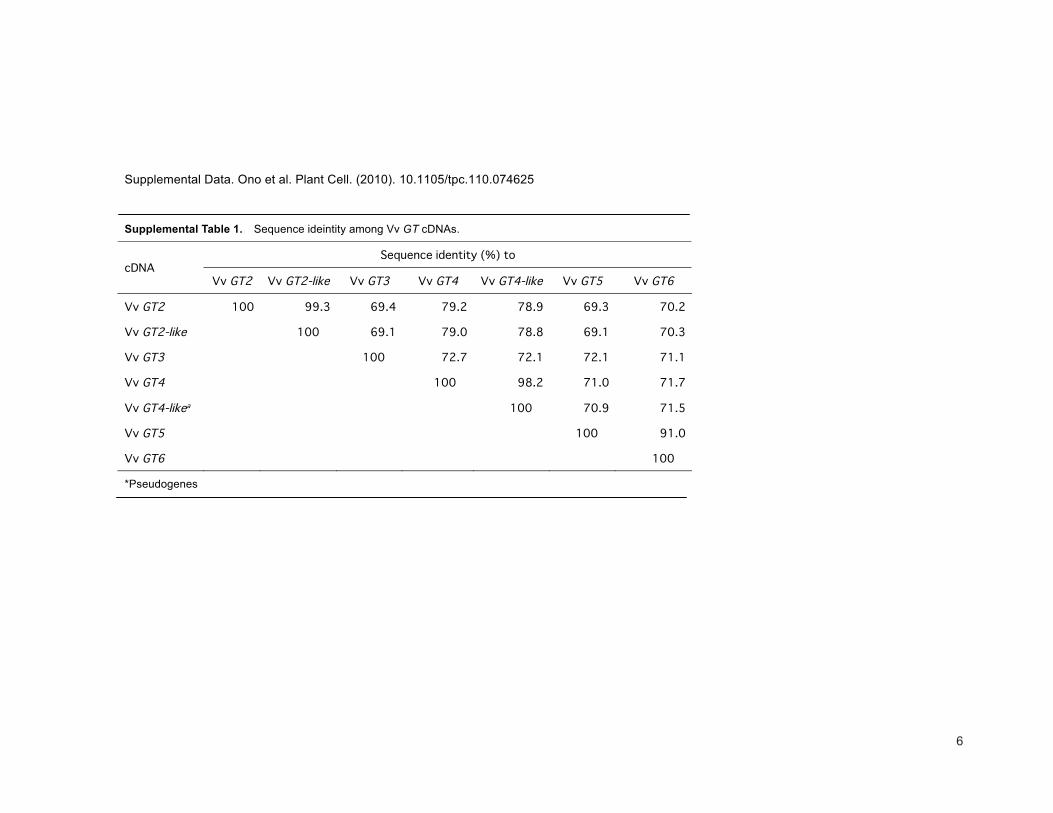
Supplemental Table 1. Sequence ideintity among Vv GT cDNAs.
*Pseudogenes
6

Supplemental Data. Ono et al. Plant Cell. (2010). 10.1105/tpc.110.074625
Supplemental Table 2. HPLC analysis of quercetin monoglucuronides and
3-O-glucoside.
Quercetin glycosides Retention time (min) �max (nm)1
3-O-glucuronide 10.95 356
7-O-glucuronide 11.34 371
3’-O-glucuronide 13.66 366
4’-O-glucuronide 8.81 348
3-O-glucoside 10.60 354
Analytical HPLC conditions were as follows: column, YMC pack Polymer C18 (4.6 mm x
250 mm, 6 �m; YMC, Japan); column temperature, 40 °C; flow rate, 0.8 ml/min; solvent
A, 0.05% (v/v) trifluoroacetic acid in H2O; solvent B, 0.05% (v/v) trifluoroacetic acid in
acetonitrile; After injection of samples into a column that had been equilibrated with 20%
solvent B, the column was developed with a linear gradient from 20% to 60% solvent B
for 15 min, followed by isocratic development with 60% solvent B for 10 min. �max values
were determined on-line by means of photodiode array spectrophotometric analysis
(220-500 nm).
7
Supplemental Data. Ono et al. Plant Cell. (2010). 10.1105/tpc.110.074625
Supplemental Results 1. Thermodynamic consideration of the effects of
R140W substitution on kinetic parameters of Vv GT5.
According to the transition state theory (Copeland, 2000), kcat is related to Gibbs
free energy of activation (�G#) for the ternary “enzyme-UDPGA-quercetin”
Michaelis complex:
�G# = RT {ln (kBT/h) – ln kcat},
where kB is the Boltzmann constant (1.38 x 10⁻²³ J·K-1), h is the Planck constant
(6.63 x 10⁻³⁴ J·s), R is the gas constant (8.31 J·mol-1·K-1), and T is the absolute
temperature in Kelvin degrees.
The �G# value calculated for the Vv GT5-catalyzed glucuronosyl transfer
was 69.2 kJ·mol-1, while the value of the R140W mutant was 96.3 kJ·mol-1. This
result indicates that the transition state of the enzymatic glucuronosyl transfer
was destabilized by 27.1 kJ·mol-1 due to the R140W substitution. This could be
ascribed, at least in part, to loss of the Arg140-mediated electrostatic interaction
in the transition state of glucuronosyl transfer.
Thus, the predicted Arg-140-mediated salt bridge is also of mechanistic
significance in specific stabilization of the transition state of GAT catalysis, by
which both rate acceleration and specificity of GAT catalysis are attained. This
role of Arg-140 is consistent with a generally accepted theory of enzymatic
catalysis, which is called the “transition state fitting theory.” This theory proposes
that enzyme active sites have evolved to best complement the substrate
transition state structure, rather than the ground state, which accelerates the
reaction and determines the specificity of enzymatic catalysis (Pauling, 1948;
Copeland, 2000).
It is important to note, in this regard, that replacement of Arg25 of Bp UGAT
(UGT94B1) with serine or glycine or replacement of Arg350 of Pf 7GAT
(UGT88D7) with tryptophan significantly reduced kcat, with Km values for UDPGA
being changed only minimally (Osmani et al., 2008; Noguchi et al., 2009). These
results suggest that arginine residues are also involved in the stabilization of the
transition state during GAT catalysis.
8

REFERENCES
Copeland, R.A. (2000). Enzymes: A practical introduction to structure,
mechanism, and data analysis. (New York: Wiley-VCH).
Noguchi, A., Horikawa, M., Fukui, Y., Fukuchi-Mizutani, M., Iuchi-Okada, A.,
Ishiguro, M., Kiso, Y., Nakayama, T., and Ono, E. (2009). Local
differentiation of sugar donor specificity of flavonoid glycosyltransferase
in Lamiales. Plant Cell 21: 1556-1572.
Osmani, S.A., Bak, S., Imberty, A., Olsen, C.E., and Moller, B.L. (2008).
Catalytic key amino acids and UDP-sugar donor specificity of a plant
glucuronosyltransferase, UGT94B1: molecular modeling substantiated
by site-specific mutagenesis and biochemical analyses. Plant Physiol.
148: 1295-1308.
Pauling, L. (1948). Nature of forces between large molecules of biological
interest. Nature 161: 707-709.
9

Supplemental Data. Ono et al. Plant Cell. (2010). 10.1105/tpc.110.074625
Supplemental Results 2. Maximum likelihood analysis of Vv GT genes.
Ratios of non-synonymous to synonymous substitution rate (dN/dS ratio, �
value) of Vv GT genes (i.e., Vv GT2~6; Figure 1B) were estimated by maximum
likelihood analysis (Yang, 2007). The calculated log-likelihood value, lone-ratio, on
the basis of the one-dN/dS-ratio model assuming the same � value for all
branches was –18470.3 with an estimated � value of 0.25. The log-likelihood
value was also calculated on the basis of branch-specific model, which assumes
that the ratio �1 for the ancestral lineages of Vv GT2~6 (foreground branches:
shown in red in Figure 1B) is different from the ratio �0 for all other branches
(background branches). The value, lbranch, was calculated to be –18459.6 with
estimated dN/dS ratios of �1 = 0.34 and �0 = 0.22 (i.e., the dN/dS ratio on the
foreground lineages is higher than the value of the background lineages). Twice
the difference of the log-likelihood values, 2(lbranch – lone-ratio), can be compared
with a �2 distribution with one (= 2 – 1) degree of freedom to examine the fitness
of the data to these models. A comparison of the 2(lbranch – lone-ratio) value (=
21.39) with the �2 distribution with one degree of freedom rejected the
one-dN/dS-model with a p value of 3.75 � 10-6. Thus, the data fitted to the
branch-specific model significantly better than to the one-ratio model. The fact
that the dN/dS ratio for these Vv GT genes, �1 = 0.34, is higher than the value
(�0 = 0.22) for other cluster I flavonoid 3-O-glycosyltransferases suggests that,
in the V. vinifera genome, differentiation of Vv GT genes has more recently
occurred in more positive manner than other cluster I enzymes due to either
positive Darwinian selection or relaxation of functional constraints (Figure 1B).
REFERENCE
Yang, Z. (2007). PAML 4: a program package for phylogenetic analysis by
maximum likelihood. Mol. Biol. Evol. 24: 1586-1591.
10