supplemental text - g3: genes, genomes, genetics€¦ · web view2015/03/04 · creating rna-seq...
TRANSCRIPT

SUPPLEMENTAL TEXT
The Muller elements nomenclature
Orthologous chromosomes among the different Drosophila species often have different
chromosome numbers. For example, chromosome 4 in D. melanogaster is orthologous to
chromosome 6 in D. grimshawi, D. mojavensis, and D. virilis. Hermann Muller developed a
nomenclature (A–F) to refer to orthologous chromosomes among the different Drosophila
species (Muller 1940). Using this nomenclature, chromosome 4 in D. melanogaster is
known as the Muller F element while chromosome 3L is known as the Muller D element.
Introduction to Position Effect Variegation (PEV)
PEV describes the phenomenon whereby a euchromatic gene is either partially or
completely silenced when it is moved (by translocation or transposition) to a region next to
a heterochromatic domain (Muller 1930). For example, insertion of a transgenic reporter
(hsp70-driven white) into a euchromatic environment (via P-element transposition) results
in a red eye phenotype because the white gene is expressed in all the ommatidia of the
compound eye. In contrast, insertion of the transgenic reporter into a heterochromatic
environment results in a variegating phenotype because the white gene is silenced in a
subset of the ommatidia. The white gene is required for deposition of pigment in the eye.
Identifying subfamilies of the DINE-1 element
Transposons in the species-specific transposon libraries are classified as DINE-1 fragments
based on sequence similarity to the conserved core element within block A of the DINE-1
W. Leung et al. 1

consensus (Yang and Barbash 2008). Comparison of the DINE-1 fragments identified by
RepeatMasker using the species-specific library versus the RepBase Drosophila library
(Jurka et al. 2005) allows us to further categorize the subfamilies of DINE-1 elements in
each species. (See File S5 for a complete list of RepBase repeats that overlap with DINE-1
fragments in all of the analysis regions.) This comparison shows that there are additional
DINE-1 elements in the D. grimshawi, D. mojavensis, and D. erecta species-specific
transposon libraries that are not in the Drosophila RepBase library (see Table S5).
Comparison of the repeats identified by the two repeat libraries also shows that the DINE-1
fragments on the D. mojavensis F element can be partitioned into at least two subfamilies:
67.4% of the DINE-1 fragments overlap with Homo6, while 21.8% overlap with
Helitron1_Dmoj. Homo6 is classified as a member of the HOBO family (a hAT DNA
transposon) (de Freitas Ortiz and Loreto 2009), but part of the Homo6 consensus sequence
was masked in a subsequent RepBase release (17.07) because of a helitron insertion.
Previous analyses have shown that the IsBu1 element in D. buzatii (another species in the
repleta group) is homologous to the DINE-1 element in D. mojavensis (Cáceres et al. 2001;
Casals et al. 2005). A CENSOR search of IsBu1 (GenBank record AY756162.1) against the
Drosophila RepBase library shows that IsBu1 has ~94% sequence similarity to the Homo6
consensus sequence (Figure SM1). Given the similarity of the D. mojavensis fragments to
the core element of DINE-1 and the ambiguity associated with the annotation of Homo6, we
have retained the assignment of these repeats as putative DINE-1 fragments.
W. Leung et al. 2

Nc versus CAI comparisons indicate response to selective pressure
While most of the F element genes within each Nc versus CAI scatterplot follow a similar
trend, there are also a few outliers (as denoted by the inverted V shape in the LOESS
regression lines in Figure 6C). Heat map analyses of Nc and CAI (Eisen et al. 1998) show
that two of these outliers, ATPsyn-beta and RpS3A, consistently show strong selection on
codon bias (high CAI and low Nc) in all four species (Figure S7). (Heat maps for all analysis
regions are available in Figure SM2.) The heat map also shows substantial differences in
the Nc and CAI among D. mojavensis F element genes relative to their putative orthologs in
D. melanogaster and D. erecta (e.g., Thd1, Ephrin, sv, Actbeta, and Rfabg show a higher CAI,
indicating more optimal codon usage).
Changes in codon preference for each amino acid
In addition to the changes in the distribution of Nc (Effective Number of Codons) and CAI
(Codon Adaptation Index), analysis of the proportions of codon usage for each amino acid
showed that there were also substantial differences in codon usage among the four species
(File S7). For example, F element genes showed weak preference for the various codons for
leucine (L), while genes on the D element showed a strong preference for CTG and a weak
preference for TTA. This preference pattern remains the same across all the D euchromatic
reference genes even though the genes at the base of the D. mojavensis and D. grimshawi D
elements differed from those found at the base of the D. melanogaster and D. erecta D
elements (Figure SM3).
W. Leung et al. 3

There were also different codon usage patterns among the F elements. For example, the D.
melanogaster and D. erecta F element genes preferred the codon CAA instead of CAG to
encode the amino acid glutamine (Q), while D. mojavensis and D. grimshawi F element
genes showed almost codon equal usage. In contrast, genes in the D euchromatic reference
regions in all four species showed a strong preference for CAG over CAA. Another example
is seen in the codon preferences for valine (V); all the euchromatic reference regions and
the D. grimshawi F element showed a strong preference of GTG over GTA, while the other F
elements show a strong preference of GTT over GTC.
SUPPLEMENTAL METHODS
Rationale for sequence improvement
The Drosophila 12 Genomes Consortium has previously analyzed D. melanogaster and the
Comparative Analysis Freeze 1 (CAF1) assemblies of 11 Drosophila species, including D.
erecta, D. mojavensis, and D. grimshawi analyzed in this study. The CAF1 assemblies of D.
erecta, D. mojavensis, and D. grimshawi are each based on the reconciliation (Zimin et al.
2008) of two independent assemblies constructed by the Arachne (Batzoglou et al. 2002)
and the Celera (Myers et al. 2000) assemblers. The reconciliation procedure improved the
overall quality of the assemblies by reducing the number of misassemblies and increasing
the length of the assembled scaffolds (Drosophila 12 Genomes Consortium et al. 2007).
The estimated genome coverage for the D. erecta genome assembly was ~10.6x, and we
found that this assembly was of sufficient quality for gene annotation and genomic analysis
without further sequence enhancement (see GenBank record AAPQ00000000.1). Of the
1338 isoforms we have annotated in all of the D. erecta analysis regions, we have identified
W. Leung et al. 4

29 isoforms (nine genes) that contained potential errors in the consensus. Additional
details on these putative consensus errors are described in File S2. The locations of these
putative consensus errors are shown in the “Consensus Errors” track on the GEP UCSC
Genome Browser (http://gander.wustl.edu).
In contrast, both the D. mojavensis and D. grimshawi assemblies have approximately six to
eight fold genome coverage. Examination of the D. grimshawi CAF1 assembly near the base
of the D element suggested that this region was of sufficient quality for genomic analysis
without sequence improvement. Of the 138 isoforms we have annotated in the D.
grimshawi euchromatic reference regions, four isoforms (two genes) contained putative
consensus errors (see File S2 for details).
Examination of the D. mojavensis and D. grimshawi F element scaffolds and the base of the
D. mojavensis D element suggested that there was still substantial room for sequence
improvement. Consequently, prior to performing the genomic analysis, we manually
improved these regions to a quality standard similar to the one used for the mouse genome
project (Mouse Genome Sequencing Consortium et al. 2002).
Defining the analysis regions
Defining the F element analysis regions: Schaeffer and colleagues used physical and genetic
markers to anchor many genomic scaffolds in the CAF1 assemblies to the polytene
chromosomes (Schaeffer et al. 2008). That analysis assigned scaffold 4512 to the D. erecta F
element and scaffolds 14822 and 14592 to the D. grimshawi F element. However, they were
W. Leung et al. 5

unable to visualize the D. mojavensis F element in polytene chromosomes. Based on
previous analysis by the Drosophila 12 Genomes Consortium, which shows that most
Drosophila genes tend to remain on the same Muller element (Drosophila 12 Genomes
Consortium et al. 2007), the 3.4 Mb scaffold 6498 was assigned to the D. mojavensis F
element.
Examination of this scaffold using FlyBase GBrowse showed that the F element genes were
only found within the first 2 Mb of this scaffold. Most of the genes at the end of scaffold
6498 were found on the D. melanogaster A element. The last F element gene (CG31999) on
scaffold 6498 has a gene span of 157 kb, with a total transposon density of 90%. These
properties suggested that CG31999 is located within a heterochromatic environment in D.
mojavensis. The 143 kb region between the last F element gene (CG31999) and the next
non-F element gene (CG42450) contained multiple large gaps, with a total estimated gap
size of ~27 kb.
Examination of the reads placement file (reads.placed) for the D. mojavensis CAF1 assembly
(available through the AAA: 12 Drosophila Genomes website at
http://rana.lbl.gov/drosophila/) showed that only mate pairs from fosmid end reads
supported the large gaps found in this region. Examination of the A element genes found at
the end of the D. mojavensis scaffold 6498 in D. virilis showed that most of these genes are
found in the middle of other non-F element scaffolds in the D. virilis CAF1 assembly.
W. Leung et al. 6

Collectively, there was insufficient evidence to support the hypothesis that the A element
genes found at the end of scaffold 6498 were part of the D. mojavensis F element.
Consequently, we have restricted our analysis of the D. mojavensis F element to the first 2
Mb of scaffold 6498 where all of the F element genes are found.
The ends of the genomic scaffolds in a whole genome assembly often contain
misassemblies and are highly repetitive. To reduce the bias introduced by these potential
assembly errors, we have restricted our analysis of the F element scaffolds to the region
that extended from the start of the coding span of the first gene to the end of the coding
span of the last gene.
Defining the D element analysis regions: In order to compare and contrast the evolution of
the F element with the evolution of a euchromatic domain, we have also analyzed the
repeat and gene characteristics of a euchromatic region in D. melanogaster, D. erecta, D.
mojavensis, and D. grimshawi. Because of the low rate of recombination near the base of the
chromosome arms, the region near the base of the chromosomes might exhibit different
genomic properties compared to other regions (Talbert and Henikoff 2010). To account for
the potential differences that could be introduced by the proximity to the centromere, we
selected ~1 Mb euchromatic reference regions near the base of the D element and
compared their properties against those of the F element.
W. Leung et al. 7

The D. melanogaster release 5 assembly has well-defined heterochromatin boundaries
based on both cytogenomic (Hoskins et al. 2007) and epigenomic criteria (Riddle et al.
2011). However, these types of evidence were unavailable for the other Drosophila species.
Previous studies in D. melanogaster have shown that there is a 4.7-fold increase in
transposon density near the centromeres of the long chromosome arms (Kaminker et al.
2002) and that changes in repeat density could be used to demarcate the approximate
boundaries of heterochromatic and euchromatic regions (Yasuhara and Wakimoto 2008).
Consequently, we analyzed the changes in repeat density for each species using a sliding
window analysis (1k window, 500 bp step size) across the entire genome assembly (Figure
S1). The ends of the D element scaffold in the D. melanogaster, D. erecta, and D. mojavensis
assemblies contained highly repetitive regions that likely correspond to the locations of the
heterochromatic domains. In contrast, the ends of the large D. grimshawi scaffolds only
contained short regions that exhibit high repeat density (Figure S1). This difference in the
extent to which the heterochromatic regions have been assembled might lead to an
underestimate of the true repeat content of the D. grimshawi genome.
Among all the autosomes, the D element showed the clearest demarcation between regions
with high and low repeat density, which may correspond to the heterochromatin-
euchromatin border in all four species (Figure S1). Hence we decided to focus our analysis
on an ~1 Mb region upstream of the heterochromatin-euchromatin border and we referred
to this region as the “base” of the chromosome in the main text. We have also selected a 1.4
Mb region upstream of the base of the D. erecta D element as well as a 1.3 Mb region near
W. Leung et al. 8

the telomere of the D element as additional comparison regions. The exact coordinates of
all the analysis regions are listed in Table S1.
Additional issues with the CAF1 assemblies
We encountered two issues with the CAF1 assemblies during the course of our analysis:
duplicated regions in the D. yakuba assembly and misassembled scaffolds in the D.
grimshawi assembly.
Duplicate scaffolds in the D. yakuba CAF1 assembly: Because the modENCODE project did
not generate RNA-Seq data for D. erecta, we utilized the D. yakuba RNA-Seq data to assist in
the annotation of the D. erecta analysis regions. Initial mapping of the modENCODE RNA-
Seq reads to the D. yakuba genome assembly (see protocol below) resulted in large regions
of the D. yakuba genome that have no RNA-Seq read coverage. Comparison of these
genomic regions with known genes in D. melanogaster indicated that these D. yakuba
genomic regions likely contained multiple genes. Comparison of these genomic regions
against the entire D. yakuba CAF1 assembly revealed that some of the “random” scaffolds in
the CAF1 assembly have substantial overlap with the larger scaffolds that have previously
been assigned to specific Muller elements.
In order to identify these redundant scaffolds in the CAF1 assembly, we compared the
sequences of all of the “random” scaffolds against the rest of the scaffolds in the D. yakuba
assembly using NCBI BLASTN (Altschul et al. 1990) with default parameters and an Expect
threshold of 1e-20. “Random” scaffolds that have substantial overlap with the main
W. Leung et al. 9

scaffolds along their entire lengths were removed from the assembly in order to construct
a filtered genome assembly. The D. yakuba RNA-Seq reads were then mapped against this
filtered assembly.
Highly repetitive scaffolds in the D. grimshawi CAF1 assembly: The first step in most de novo
repeats discovery algorithms involved comparing the genome assembly against itself in
order to discover repetitive regions. During the construction of the species-specific
transposon libraries (protocol described below), we found that the comparison of the D.
grimshawi assembly against itself took a substantially longer time to complete than those of
the other Drosophila species. The D. grimshawi assembly also produced substantially more
alignments (after filtering trivial self alignments) than the other assemblies.
Examination of the D. grimshawi alignment results revealed that the large number of D.
grimshawi alignments could be attributed to a few scaffolds. For example, when we
compared the D. grimshawi assembly against itself using the Pairwise Aligner for Long
Sequences (PALS) program (Edgar and Myers 2005), we found that two of the scaffolds
(scaffold_17366 and scaffold_14590) produced more than 1 million alignments (Table
SM1).
Aligning these two scaffolds against each other with blast 2 sequences (Tatusova and
Madden 1999) showed a tandem array of high-scoring segment pairs (HSPs) across the
entire length of the two sequences (Figure SM4A). Searching scaffold_17366 against the
RepBase Drosophila repeat library (Jurka et al. 2005) with CENSOR (Kohany et al. 2006)
W. Leung et al. 10

showed that the scaffold consists of a tandem array of a 155 bp Gypsy-5 LTR fragment
(Figure SM4B).
To ascertain whether these scaffolds have been correctly assembled, we examined all the
reads used to construct these scaffolds and determined the percentage of reads that were
missing their mate pair (the reads.placed file for the D. grimshawi CAF1 assembly is
available at http://rana.lbl.gov/drosophila/). A large number of missing or inconsistent
mate pairs in these regions would support the hypothesis that these scaffolds have been
misassembled (Phillippy et al. 2008).
Examination of the reads.placed file showed that most of the reads placed in scaffolds with
a large number of PALS alignments were unpaired. In addition, most of the missing mate
pairs were not placed in the CAF1 assembly (Figure SM5). These observations suggested
that the scaffolds that contained a tandem array of the LTR fragments were likely to be an
artifact produced by the assembly process and did not accurately reflect the organization of
the D. grimshawi genome. These misassembled scaffolds were removed from the D.
grimshawi assembly prior to the construction of the species-specific transposon library.
Using modENCODE RNA-Seq datasets to improve gene annotations
The modENCODE project has produced RNA-Seq data for six Drosophila species (in
addition to D. melanogaster) in order to study the changes in transcriptional profiles across
multiple Drosophila species (Graveley et al. 2011). Among the three Drosophila species
W. Leung et al. 11

that were part of this study, the modENCODE project only produced RNA-Seq data (from
head tissues, adult males, and adult females) for D. mojavensis.
While the other species of interest (i.e. D. erecta and D. grimshawi) were not included, we
could use the RNA-Seq data from nearby species to improve the annotations of these two
species. Specifically, we used the RNA-Seq data from D. yakuba to improve the D. erecta
annotations and the D. virilis and D. mojavensis RNA-Seq data to improve the D. grimshawi
annotations. The limited amount of comparative RNA-Seq data nonetheless provides us
with additional confidence in the annotation of D. erecta, D. mojavensis, and D. grimshawi,
especially when there are substantial changes in the gene model compared to the putative
D. melanogaster ortholog.
The RNA-Seq data also enabled us to identify potential errors in the D. melanogaster gene
annotations. For example, the original D. erecta GLEAN-R annotations produced by the
Drosophila 12 Genomes Consortium predicted two genes, GG16094 and GG16095, in
scaffold_4784 (within the euchromatic reference region of D. erecta analyzed in this study).
These two features are predicted to be the orthologs of the D. melanogaster genes CG13814
and rdgC, respectively (Figure SM6, top). However, GG16094 only shows weak sequence
similarity to its putative D. melanogaster ortholog CG13814. Examination of the alignment
between the predicted proteins assembled from D. yakuba RNA-Seq reads and this region
of the D. erecta genome assembly, as well as the TopHat splice junction predictions,
suggested that GG16094 was actually an unannotated coding exon of rdgC (Figure SM6,
W. Leung et al. 12

bottom). FlyBase has subsequently revised the annotation for this region in release 5.51,
and CG13814 was merged with rdgC in D. melanogaster.
Building the RNA-Seq transcriptome libraries
For our analysis, we retrieved the RNA-Seq datasets for D. yakuba, D. mojavensis, and D.
virilis from the NCBI Gene Expression Omnibus (GEO) database (available under accession
number GSE44612) and used them to construct transcriptome libraries for each species.
Because the CAF1 assemblies are relatively high quality, we used the align-then-assemble
strategy to construct the transcriptome library for each species (reviewed in (Martin and
Wang 2011)).
Mapping RNA-Seq reads with TopHat: The RNA-Seq transcriptome libraries for each species
were built by mapping RNA-Seq reads against the assembly of the corresponding species
with TopHat and Bowtie2 to discover splice junctions (Trapnell et al. 2009; Langmead and
Salzberg 2012). To improve the accuracy of the mapping and splice junction predictions,
only reads that mapped reliably to a single location in the assembly were kept.
Using the strategy first described by Cabili and colleagues (Cabili et al. 2011), we ran
TopHat twice in order to identify splice junctions. The first TopHat run was used to
discover splice junctions and the second run used this initial set of splice junctions as raw
junctions in “no-novel-juncs” mode. The two-stage TopHat mapping strategy improved the
TopHat splice junction predictions and reduced the number of unmapped reads.
W. Leung et al. 13

The following parameters were used for both TopHat runs: -g 1 --no-mixed --no-discordant
--b2-very-sensitive --min-intron-length 30 --max-intron-length 150000. We used both
SAMtools (Li et al. 2009) and BamTools (Barnett et al. 2011) to manipulate and analyze the
BAM files produced by TopHat.
Creating RNA-Seq transcripts and predicted protein libraries: For all three species, the
mapped RNA-Seq reads were assembled into transcripts using Cufflinks (v2.1.1) with the
following parameters: --min-intron-length 30 --max-intron-length 150000 (Trapnell et al.
2010). For D. mojavensis, we also assembled the transcripts using CEM (--max-pe-span
150000) (Li and Jiang 2012). After combining the transcripts from multiple replicates and
filtering redundant transcripts, we used TransDecoder (Grabherr et al. 2011) to produce a
predicted protein library for each species (-m 50 --search_pfam Pfam-A.hmm). The
complete workflow for building the transcriptome library is summarized in Figure SM7A.
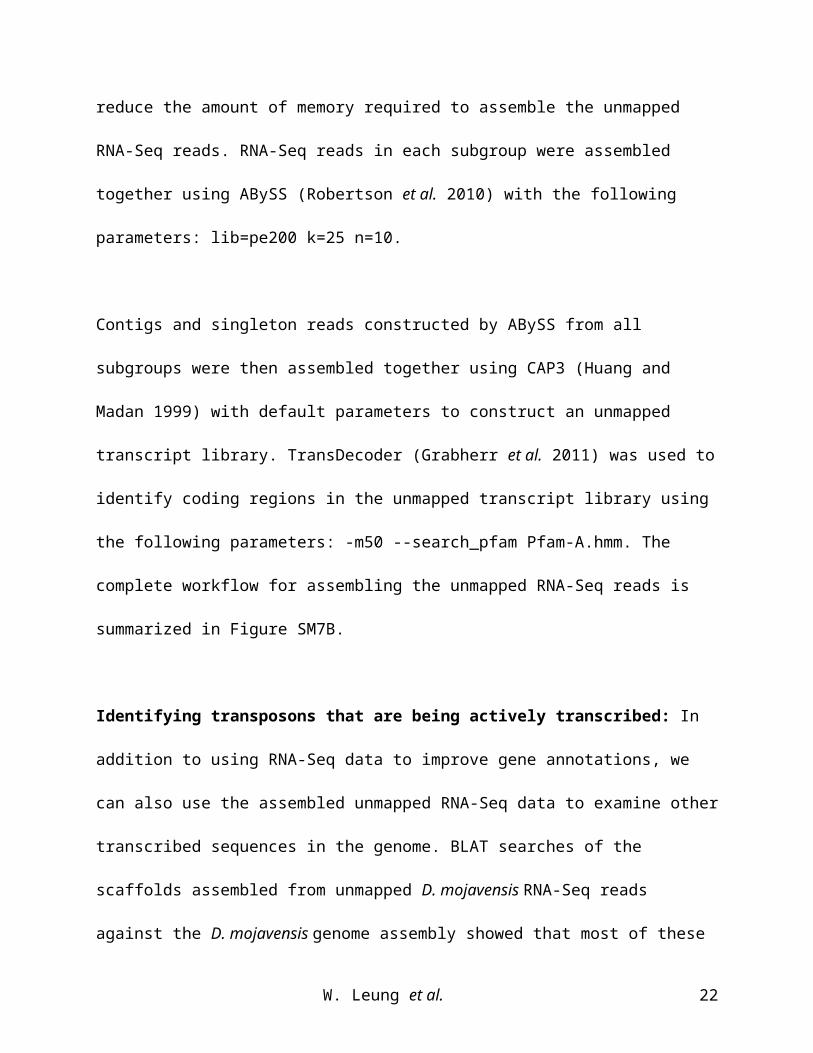
Assembling unmapped RNA-Seq reads: Depending on the quality of the assembly, some of
the RNA-Seq reads might not have been mapped to the reference assembly even though
they are part of a gene (e.g., because of gaps in the assembly). The use of the stringent
TopHat mapping criteria described above also resulted in a larger fraction of unmapped
reads compared to the default parameters. In order to utilize these additional unmapped
RNA-Seq data, we assembled the unmapped RNA-Seq reads and then aligned the
assembled RNA-Seq scaffolds against the target assembly using the protocol described
below. (For example, we aligned the scaffolds assembled from unmapped D. yakuba RNA-
Seq reads against the D. erecta assembly to identify additional splice junctions.)
W. Leung et al. 14

For each sample, the BAM file that contained the unmapped RNA-Seq reads produced by
the second TopHat run was converted into fastq format using the bam2FastQ program in
BamUtil (available at http://genome.sph.umich.edu/wiki/BamUtil). The assembly process
only used the subset of reads where both paired end reads were found in the collection of
unmapped RNA-Seq reads. We partitioned the fastq file into smaller subgroups (~1Gb
each) in order to reduce the amount of memory required to assemble the unmapped RNA-
Seq reads. RNA-Seq reads in each subgroup were assembled together using ABySS
(Robertson et al. 2010) with the following parameters: lib=pe200 k=25 n=10.
Contigs and singleton reads constructed by ABySS from all subgroups were then assembled
together using CAP3 (Huang and Madan 1999) with default parameters to construct an
unmapped transcript library. TransDecoder (Grabherr et al. 2011) was used to identify
coding regions in the unmapped transcript library using the following parameters: -m50 --
search_pfam Pfam-A.hmm. The complete workflow for assembling the unmapped RNA-Seq
reads is summarized in Figure SM7B.
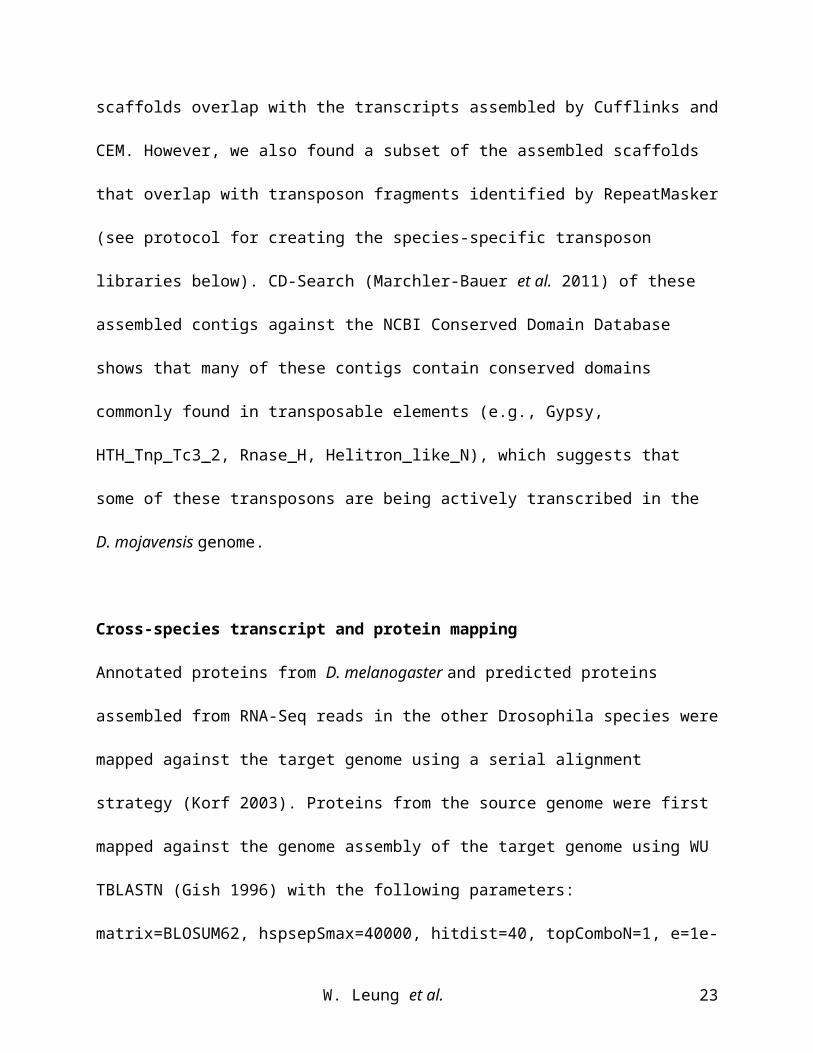
Identifying transposons that are being actively transcribed: In addition to using RNA-Seq
data to improve gene annotations, we can also use the assembled unmapped RNA-Seq data
to examine other transcribed sequences in the genome. BLAT searches of the scaffolds
assembled from unmapped D. mojavensis RNA-Seq reads against the D. mojavensis genome
assembly showed that most of these scaffolds overlap with the transcripts assembled by
Cufflinks and CEM. However, we also found a subset of the assembled scaffolds that overlap
W. Leung et al. 15

with transposon fragments identified by RepeatMasker (see protocol for creating the
species-specific transposon libraries below). CD-Search (Marchler-Bauer et al. 2011) of
these assembled contigs against the NCBI Conserved Domain Database shows that many of
these contigs contain conserved domains commonly found in transposable elements (e.g.,
Gypsy, HTH_Tnp_Tc3_2, Rnase_H, Helitron_like_N), which suggests that some of these
transposons are being actively transcribed in the D. mojavensis genome.
Cross-species transcript and protein mapping
Annotated proteins from D. melanogaster and predicted proteins assembled from RNA-Seq
reads in the other Drosophila species were mapped against the target genome using a
serial alignment strategy (Korf 2003). Proteins from the source genome were first mapped
against the genome assembly of the target genome using WU TBLASTN (Gish 1996) with
the following parameters: matrix=BLOSUM62, hspsepSmax=40000, hitdist=40,
topComboN=1, e=1e-20, W=4, T=20, B=10000000, V=10000000, filter=seg+xnu,
hspmax=0. We then collected the high-scoring segment pairs (HSPs) for each aligned
protein to define a search window (with 10 kb padding at both ends). The same protein
was re-aligned against this search window using SPALN (Iwata and Gotoh 2012) with
cross-species parameters (-Tdromel -yS -yX).
We used a similar search strategy to map the D. melanogaster transcripts and the predicted
transcripts assembled from RNA-Seq reads in the other Drosophila species to the target
genome. Transcripts were first mapped against the target assembly using WU BLASTN
(Gish 1996) with the following parameters: M=5, N=4, Q=20, R=10, hspsepQmax=1000,
W. Leung et al. 16

hspsepSmax=20000, hspmax=5000, B=10000000, V=10000000, topComboN=1. We then
collected the HSPs for each aligned transcript to define the search window (with 10 kb
padding at both ends). The transcript was then re-aligned against this search window using
sim4cc (Zhou et al. 2009) with default parameters.
Creating the species-specific transposon libraries
Overview of the pipeline used to construct the species-specific repeat libraries: Previous
studies have shown that many transposons are species-specific (Jurka et al. 2011) and that
using transposon libraries even from closely related Drosophila species could lead to a
substantial underestimate of the total repeat content (Leung et al. 2010). Consequently,
prior to analyzing the types and distribution of transposable elements on the F element, we
needed to first construct species-specific transposon libraries.
A plethora of computational tools has been developed for constructing de novo repeat
libraries from a genome assembly (reviewed in (Bergman and Quesneville 2007; Lerat
2010)). Most alignment-based repeat finders construct de novo transposon libraries using
three major steps: compare the genome against itself, cluster the alignments, and then
generate a consensus sequence for each cluster of alignments (Flutre et al. 2011).
Alternatively, tools such as ReAS (Li et al. 2005) and RepeatScout (Price et al. 2005) use
over-represented k-mers in genomic reads or in a whole genome assembly to identify
repeats. Flutre and colleagues have previously shown that different de novo repeat
discovery approaches can recover sequences that were missed by other algorithms and
W. Leung et al. 17

that one should utilize multiple computational approaches when constructing species-
specific repeat libraries (Flutre et al. 2011).
Using the REPET pipeline developed by Flutre and colleagues as a template (Flutre et al.
2011), we utilized six different approaches to construct the species-specific library: ReAS,
RepeatModeler, BLASTN+RECON+MAP, dcblast+GROUPER+MAP, PALS+PILER+MUSCLE,
and Tallymer+CD-HIT. All the consensus sequences identified by these different
approaches are combined into a single library. In order to reduce redundancy in the
combined repeat library, we used the UCLUST (Edgar 2010) recentering strategy to
construct a centroid for each cluster of sequences. Each repeat library was classified by a
combination of TEClass (Abrusán et al. 2009), RepClass (Feschotte et al. 2009), and
sequence similarity to the conserved core within block A of the DINE-1 consensus, as
previously defined by Yang and Barbash (Yang and Barbash 2008).
ReAS repeat library: The Drosophila 12 Genomes Consortium has previously created
species-specific transposon libraries for 12 Drosophila species using ReAS (Li et al. 2005;
Drosophila 12 Genomes Consortium et al. 2007). The species-specific ReAS transposon
libraries (v2) are available for download through FlyBase at
ftp://ftp.flybase.net/12_species_analysis/genomes/aaa/transposable_elements/ReAS/v2/.
Transposons in the ReAS library were classified using the protocol described below.
RepeatModeler library: RepeatModeler (Smit and Hubley 2008) was run on the whole
genome assemblies with the WU BLAST search engine using default parameters. While
W. Leung et al. 18

RepeatModeler included a module for classifying repeats, we found that RepeatModeler
could not classify a substantial fraction of the consensus sequences in the RepeatModeler
libraries. Hence we applied our repeat classification protocol (described below) to re-
classify the RepeatModeler consensus sequences.
BLASTN+RECON+MAP library: Each genome assembly was aligned against itself using the
BLASTN program in the NCBI BLAST+ suite (Camacho et al. 2009) with the following
parameters: -max_target_seqs 10000000 -evalue 1e-300 -perc_identity 90 -reward 1 -
penalty -1 -gapopen 2 -gapextend 2. Trivial self-alignments and alignments shorter than
100 bp in length were filtered from the BLASTN output.
We then used RECON to analyze the collection of filtered alignments using default
parameters in order to cluster the BLASTN alignments. Sequences within each cluster were
aligned with MAP to construct the consensus sequences using the following parameters:
gap size=50, mismatch=-8, gap open=16 gap extend=4.
Note that we used RECON version 1.07 (maintained by the developers of RepeatModeler,
available at http://www.repeatmasker.org/RepeatModeler.html) instead of the official
release (1.05, (Bao and Eddy 2002)) because it contained a bug fix for running RECON on
64-bit machines. We used the implementation of the MAP program (rpt_map) provided by
the developers of the REPET package (Flutre et al. 2011) instead of the original version
(Huang 1994) because it has been optimized for handling multiple sequences.
W. Leung et al. 19

dcblast+GROUPER+MAP library: Each genome was soft-masked using WindowMasker
(Morgulis et al. 2006) and then aligned against itself using the discontiguous megablast
program in the NCBI BLAST+ suite (Morgulis et al. 2008) with the following parameters: -
evalue 1e-20 -max_target_seqs 100 -task dc-megablast -db_soft_mask 30.
The dc-megablast alignments were clustered together using GROUPER (Quesneville et al.
2003) with the following parameters: -j -Z 3 -X 2 -G -1. Sequences within each GROUPER
cluster were aligned with MAP to construct the consensus sequences using the following
parameters: gap size=50, mismatch=-8, gap open=16 gap extend=4.
PALS+PILER+MUSCLE library: Each genome assembly was aligned against itself using PALS
(with the -self parameter) and PILER-DF was used with the -trfs parameter and default
parameters to produce alignment clusters (Edgar and Myers 2005). Sequences within each
cluster were aligned against each other using MUSCLE (Edgar 2004) to produce the final
consensus sequences using the following parameters: -maxiters 1 -diags 1.
Tallymer+CD-HIT library: Using the occratio program in Tallymer (Kurtz et al. 2008), we
analyzed the entire genome assembly to determine the size of k such that approximately
95% of the k-mers were unique (k=18 for D. melanogaster, k=17 for D. erecta, k=18 for D.
mojavensis, k=21 for D. grimshawi). Using this species-specific k-mer size (-mersize k), we
identified k-mers that appear at least 40 times (-minocc 40) using the Tallymer mkindex
program. Regions that matched these high frequency k-mers were identified using the
W. Leung et al. 20

“search” program in Tallymer with default parameters. Only Tallymer matches with a
minimum length of 80 bp were kept.
The Tallymer matches were clustered together using the cd-hit-est program in the CD-HIT
package (Li and Godzik 2006) to construct the final consensus sequences with the
following parameters: -c 0.9 -n 8 -r 1.
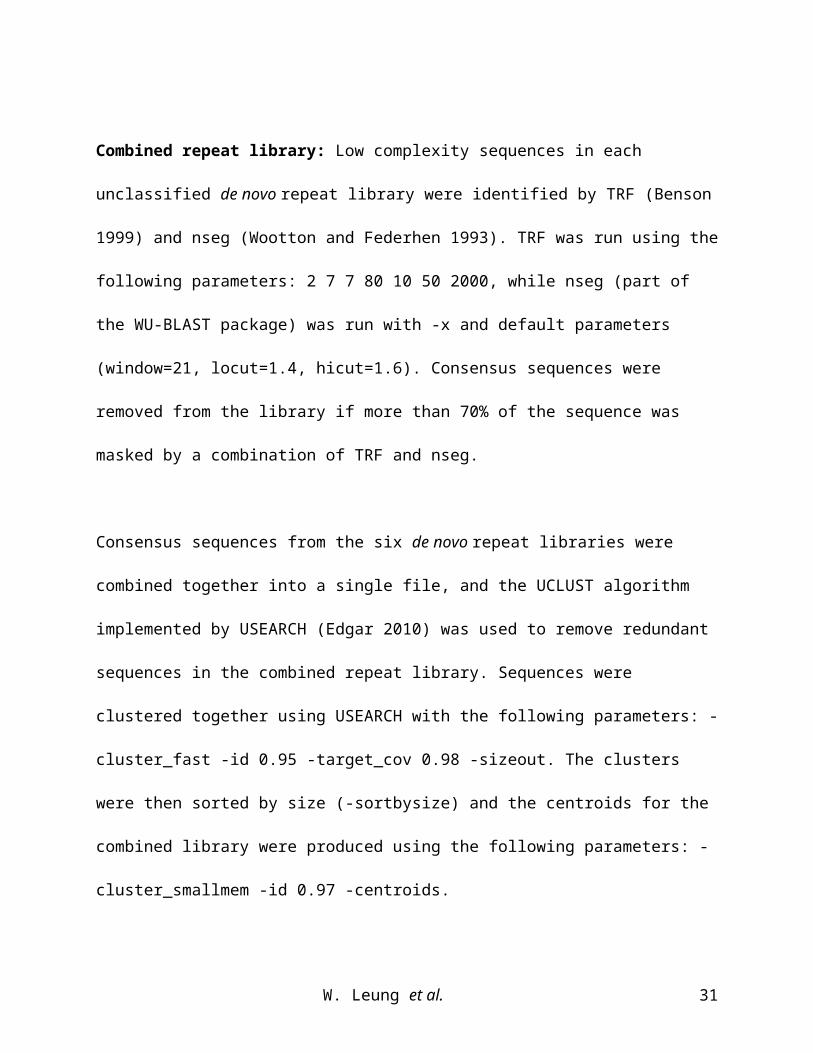
Combined repeat library: Low complexity sequences in each unclassified de novo repeat
library were identified by TRF (Benson 1999) and nseg (Wootton and Federhen 1993). TRF
was run using the following parameters: 2 7 7 80 10 50 2000, while nseg (part of the WU-
BLAST package) was run with -x and default parameters (window=21, locut=1.4,
hicut=1.6). Consensus sequences were removed from the library if more than 70% of the
sequence was masked by a combination of TRF and nseg.
Consensus sequences from the six de novo repeat libraries were combined together into a
single file, and the UCLUST algorithm implemented by USEARCH (Edgar 2010) was used to
remove redundant sequences in the combined repeat library. Sequences were clustered
together using USEARCH with the following parameters: -cluster_fast -id 0.95 -target_cov
0.98 -sizeout. The clusters were then sorted by size (-sortbysize) and the centroids for the
combined library were produced using the following parameters: -cluster_smallmem -id
0.97 -centroids.
W. Leung et al. 21
Repeat classification: We initially used TEClass (Abrusán et al. 2009) with default
parameters to classify the sequences in each de novo repeat library. Repeats that were in
the “Unclear” class were extracted from the repeat library and then classified by RepClass
(Feschotte et al. 2009) using RepBase release 17.09.
Because both TEClass and RepClass were not specifically designed to identify DINE-1
elements, we reclassified repeats in each de novo repeat library based on sequence
similarity to the DINE-1 element in each species. The sequence for the conserved core
element within block A of the DINE-1 consensus for each species was obtained from the
multiple sequence alignment of DINE elements produced by Yang and Barbash (Yang and
Barbash 2008). Sequences in each de novo repeat library were compared against the
species-specific conserved core sequence of DINE-1 using CENSOR (Kohany et al. 2006)
with the following parameters: -redundant -nofilter -s.
Comparing results from different de novo repeat analysis pipelines: To evaluate the efficacy
of the various approaches for constructing de novo repeat libraries, we analyzed the repeat
density of the D. melanogaster F element and the base of the D using the six de novo repeat
libraries and the combined repeat library. In addition, we also analyzed the two regions
using the RepBase Drosophila library (Jurka et al. 2005) as reference.
Most of the repeat libraries produced repeat density estimates that were similar to the
results obtained using the Drosophila RepBase library. However, the PALS+PILER+MUSCLE
pipeline consistently underestimated the true repeat content because it failed to identify
W. Leung et al. 22
most of the DINE-1 fragments. Despite differences in the estimated repeat content, the F
element showed higher repeat density than the euchromatic reference region from the D
element, irrespective of the repeat libraries used (Figure SM8). An Excel workbook with all
the repeat analysis results is available in File S4.
Omitting genes from the analysis of gene movement
Of the 79 D. melanogaster F element genes that have been annotated by FlyBase in release
5.50, two of these genes (CG11231 and JYalpha) have been omitted from the analysis of
gene movement.
Comparison between the genes found in the F elements of D. melanogaster and D. erecta
showed that the D. erecta F element scaffold (scaffold_4512) is in the reverse
complemented orientation relative to the D. melanogaster F element. The gene order is
completely syntenic between the D. erecta and D. melanogaster F elements, with the
exception of CG11231, which cannot be placed in the D. erecta CAF1 assembly. A TBLASTN
search of the D. melanogaster CG11231 protein against the genome assemblies of D. erecta
and D. mojavensis showed a large number of weak matches with similar E-values. The best
match to CG11231 was found in scaffold_4797, but it contained multiple in-frame stop
codons. A TBLASTN search of the D. melanogaster CG11231 protein against the D.
grimshawi assembly failed to detect any regions with significant (E-value < 1e-5) similarity.
A BLASTN (Altschul et al. 1990) search of the D. melanogaster CG11231 transcript against
the D. melanogaster release 5 assembly showed multiple significant matches to chrU, which
W. Leung et al. 23

contained all the unplaced scaffolds in the D. melanogaster assembly. A CENSOR search of
the CG11231 transcript against the Drosophila RepBase library revealed multiple
significant matches to transposon fragments. A BLASTN search of CG11231 against the
assemblies of species more closely related to D. melanogaster (e.g., D. simulans) also
showed multiple weak matches. Collectively, the comparative analysis indicates that
CG11231 is either a gene specific to D. melanogaster or a misannotation.
The D. melanogaster F element also contained a partial gene (JYalpha); the complete gene
model (CG40625) is placed on chrU. The putative ortholog of CG40625 is found on the D.
erecta F element scaffold (4512), but this ortholog is found on an unplaced scaffold 3030 in
D. mojavensis and cannot be found by TBLASTN in the D. grimshawi genome assembly.
Hence we have also omitted this gene from the gene movement analysis.
Assignment of wanderer genes to Muller elements
The assignment of genomic scaffolds to Muller elements is primarily based on the work of
Schaeffer and colleagues (Schaeffer et al. 2008). The assignment of the putative orthologs
of the PRY gene to the Y chromosome is based on previous work by Koerich and colleagues
(Koerich et al. 2008). The D. virilis Or13a gene is found in scaffold_13050, which has not
been assigned to a Muller element by Schaeffer and colleagues. However, seven of the eight
genes on this 3.4 Mb scaffold (Or13a, Stim, CG8578, CG33172, Myb, Ranbp16, and Rrp47) are
found on the A element in D. melanogaster, and the remaining gene (CG42617) is found in
the heterochromatic region of 3R (chr3RHet). Because most genes remained on the same
W. Leung et al. 24

Muller element across the different Drosophila species (Bhutkar et al. 2008), we assigned
the D. virilis ortholog of Or13a to the A element.
Software versions
The bioinformatics tools used in this analysis and their versions are listed in Table SM2.
LITERATURE CITED
Abrusán, G., N. Grundmann, L. DeMester, and W. Makalowski, 2009 TEclass — a tool for
automated classification of unknown eukaryotic transposable elements. Bioinforma.
Oxf. Engl. 25: 1329–1330.
Altschul, S. F., W. Gish, W. Miller, E. W. Myers, and D. J. Lipman, 1990 Basic local alignment
search tool. J. Mol. Biol. 215: 403–410.
Bao, Z., and S. R. Eddy, 2002 Automated de novo identification of repeat sequence families
in sequenced genomes. Genome Res. 12: 1269–1276.
Barnett, D. W., E. K. Garrison, A. R. Quinlan, M. P. Strömberg, and G. T. Marth, 2011
BamTools: a C++ API and toolkit for analyzing and managing BAM files. Bioinforma.
Oxf. Engl. 27: 1691–1692.
Batzoglou, S., D. B. Jaffe, K. Stanley, J. Butler, S. Gnerre et al., 2002 ARACHNE: a whole-
genome shotgun assembler. Genome Res. 12: 177–189.
Benson, G., 1999 Tandem repeats finder: a program to analyze DNA sequences. Nucleic
Acids Res. 27: 573–580.
W. Leung et al. 25

Bergman, C. M., and H. Quesneville, 2007 Discovering and detecting transposable elements
in genome sequences. Brief. Bioinform. 8: 382–392.
Bhutkar, A., S. W. Schaeffer, S. M. Russo, M. Xu, T. F. Smith et al., 2008 Chromosomal
rearrangement inferred from comparisons of 12 Drosophila genomes. Genetics 179:
1657–1680.
Cabili, M. N., C. Trapnell, L. Goff, M. Koziol, B. Tazon-Vega et al., 2011 Integrative annotation
of human large intergenic noncoding RNAs reveals global properties and specific
subclasses. Genes Dev. 25: 1915–1927.
Cáceres, M., M. Puig, and A. Ruiz, 2001 Molecular characterization of two natural hotspots
in the Drosophila buzzatii genome induced by transposon insertions. Genome Res.
11: 1353–1364.
Camacho, C., G. Coulouris, V. Avagyan, N. Ma, J. Papadopoulos et al., 2009 BLAST+:
architecture and applications. BMC Bioinformatics 10: 421.
Casals, F., M. Cáceres, M. H. Manfrin, J. González, and A. Ruiz, 2005 Molecular
characterization and chromosomal distribution of Galileo, Kepler and Newton, three
foldback transposable elements of the Drosophila buzzatii species complex. Genetics
169: 2047–2059.
De Freitas Ortiz, M., and E. L. S. Loreto, 2009 Characterization of new hAT transposable
elements in 12 Drosophila genomes. Genetica 135: 67–75.
W. Leung et al. 26

Drosophila 12 Genomes Consortium, A. G. Clark, M. B. Eisen, D. R. Smith, C. M. Bergman et
al., 2007 Evolution of genes and genomes on the Drosophila phylogeny. Nature 450:
203–218.
Edgar, R. C., 2004 MUSCLE: multiple sequence alignment with high accuracy and high
throughput. Nucleic Acids Res. 32: 1792–1797.
Edgar, R. C., 2010 Search and clustering orders of magnitude faster than BLAST.
Bioinforma. Oxf. Engl. 26: 2460–2461.
Edgar, R. C., and E. W. Myers, 2005 PILER: identification and classification of genomic
repeats. Bioinforma. Oxf. Engl. 21 Suppl 1: i152–158.
Eisen, M. B., P. T. Spellman, P. O. Brown, and D. Botstein, 1998 Cluster analysis and display
of genome-wide expression patterns. Proc. Natl. Acad. Sci. U. S. A. 95: 14863–14868.
Feschotte, C., U. Keswani, N. Ranganathan, M. L. Guibotsy, and D. Levine, 2009 Exploring
repetitive DNA landscapes using REPCLASS, a tool that automates the classification
of transposable elements in eukaryotic genomes. Genome Biol. Evol. 1: 205–220.
Flutre, T., E. Duprat, C. Feuillet, and H. Quesneville, 2011 Considering transposable element
diversification in de novo annotation approaches. PloS One 6: e16526.
Gish, W., 1996 http://blast.wustl.edu.
Grabherr, M. G., B. J. Haas, M. Yassour, J. Z. Levin, D. A. Thompson et al., 2011 Full-length
transcriptome assembly from RNA-Seq data without a reference genome. Nat.
Biotechnol. 29: 644–652.
W. Leung et al. 27

Graveley, B. R., A. N. Brooks, J. W. Carlson, M. O. Duff, J. M. Landolin et al., 2011 The
developmental transcriptome of Drosophila melanogaster. Nature 471: 473–479.
Hoskins, R. A., J. W. Carlson, C. Kennedy, D. Acevedo, M. Evans-Holm et al., 2007 Sequence
finishing and mapping of Drosophila melanogaster heterochromatin. Science 316:
1625–1628.
Huang, X., 1994 On global sequence alignment. Comput. Appl. Biosci. CABIOS 10: 227–235.
Huang, X., and A. Madan, 1999 CAP3: A DNA sequence assembly program. Genome Res. 9:
868–877.
Iwata, H., and O. Gotoh, 2012 Benchmarking spliced alignment programs including Spaln2,
an extended version of Spaln that incorporates additional species-specific features.
Nucleic Acids Res. 40: e161.
Jurka, J., W. Bao, and K. K. Kojima, 2011 Families of transposable elements, population
structure and the origin of species. Biol. Direct 6: 44.
Jurka, J., V. V. Kapitonov, A. Pavlicek, P. Klonowski, O. Kohany et al., 2005 Repbase Update, a
database of eukaryotic repetitive elements. Cytogenet. Genome Res. 110: 462–467.
Kaminker, J. S., C. M. Bergman, B. Kronmiller, J. Carlson, R. Svirskas et al., 2002 The
transposable elements of the Drosophila melanogaster euchromatin: a genomics
perspective. Genome Biol. 3: RESEARCH0084.
Koerich, L. B., X. Wang, A. G. Clark, and A. B. Carvalho, 2008 Low conservation of gene
content in the Drosophila Y chromosome. Nature 456: 949–951.
W. Leung et al. 28

Kohany, O., A. J. Gentles, L. Hankus, and J. Jurka, 2006 Annotation, submission and screening
of repetitive elements in Repbase: RepbaseSubmitter and Censor. BMC
Bioinformatics 7: 474.
Korf, I., 2003 Serial BLAST searching. Bioinforma. Oxf. Engl. 19: 1492–1496.
Kurtz, S., A. Narechania, J. C. Stein, and D. Ware, 2008 A new method to compute K-mer
frequencies and its application to annotate large repetitive plant genomes. BMC
Genomics 9: 517.
Langmead, B., and S. L. Salzberg, 2012 Fast gapped-read alignment with Bowtie 2. Nat.
Methods 9: 357–359.
Lerat, E., 2010 Identifying repeats and transposable elements in sequenced genomes: how
to find your way through the dense forest of programs. Heredity 104: 520–533.
Leung, W., C. D. Shaffer, T. Cordonnier, J. Wong, M. S. Itano et al., 2010 Evolution of a distinct
genomic domain in Drosophila: comparative analysis of the dot chromosome in
Drosophila melanogaster and Drosophila virilis. Genetics 185: 1519–1534.
Li, W., and A. Godzik, 2006 Cd-hit: a fast program for clustering and comparing large sets of
protein or nucleotide sequences. Bioinforma. Oxf. Engl. 22: 1658–1659.
Li, H., B. Handsaker, A. Wysoker, T. Fennell, J. Ruan et al., 2009 The Sequence
Alignment/Map format and SAMtools. Bioinforma. Oxf. Engl. 25: 2078–2079.
Li, W., and T. Jiang, 2012 Transcriptome assembly and isoform expression level estimation
from biased RNA-Seq reads. Bioinforma. Oxf. Engl. 28: 2914–2921.
W. Leung et al. 29

Li, R., J. Ye, S. Li, J. Wang, Y. Han et al., 2005 ReAS: Recovery of ancestral sequences for
transposable elements from the unassembled reads of a whole genome shotgun.
PLoS Comput. Biol. 1: e43.
Marchler-Bauer, A., S. Lu, J. B. Anderson, F. Chitsaz, M. K. Derbyshire et al., 2011 CDD: a
Conserved Domain Database for the functional annotation of proteins. Nucleic Acids
Res. 39: D225–229.
Martin, J. A., and Z. Wang, 2011 Next-generation transcriptome assembly. Nat. Rev. Genet.
12: 671–682.
Morgulis, A., G. Coulouris, Y. Raytselis, T. L. Madden, R. Agarwala et al., 2008 Database
indexing for production MegaBLAST searches. Bioinforma. Oxf. Engl. 24: 1757–
1764.
Morgulis, A., E. M. Gertz, A. A. Schäffer, and R. Agarwala, 2006 WindowMasker: window-
based masker for sequenced genomes. Bioinforma. Oxf. Engl. 22: 134–141.
Mouse Genome Sequencing Consortium, R. H. Waterston, K. Lindblad-Toh, E. Birney, J.
Rogers et al., 2002 Initial sequencing and comparative analysis of the mouse
genome. Nature 420: 520–562.
Muller, H., 1930 Types of visible variations induced by X-rays in Drosophila. J. Genet. 22:
299–334.
Muller, H. J., 1940 Bearings of the “Drosophila” work on systematics, pp. 185–268 in The
New Systematics, edited by J. Huxley. Oxford: Clarendon Press.
W. Leung et al. 30
Myers, E. W., G. G. Sutton, A. L. Delcher, I. M. Dew, D. P. Fasulo et al., 2000 A whole-genome
assembly of Drosophila. Science 287: 2196–2204.
Phillippy, A. M., M. C. Schatz, and M. Pop, 2008 Genome assembly forensics: finding the
elusive mis-assembly. Genome Biol. 9: R55.
Price, A. L., N. C. Jones, and P. A. Pevzner, 2005 De novo identification of repeat families in
large genomes. Bioinforma. Oxf. Engl. 21 Suppl 1: i351–358.
Quesneville, H., D. Nouaud, and D. Anxolabéhère, 2003 Detection of new transposable
element families in Drosophila melanogaster and Anopheles gambiae genomes. J.
Mol. Evol. 57 Suppl 1: S50–59.
Riddle, N. C., A. Minoda, P. V. Kharchenko, A. A. Alekseyenko, Y. B. Schwartz et al., 2011
Plasticity in patterns of histone modifications and chromosomal proteins in
Drosophila heterochromatin. Genome Res. 21: 147–163.
Robertson, G., J. Schein, R. Chiu, R. Corbett, M. Field et al., 2010 De novo assembly and
analysis of RNA-seq data. Nat. Methods 7: 909–912.
Schaeffer, S. W., A. Bhutkar, B. F. McAllister, M. Matsuda, L. M. Matzkin et al., 2008 Polytene
chromosomal maps of 11 Drosophila species: the order of genomic scaffolds
inferred from genetic and physical maps. Genetics 179: 1601–1655.
Smit, A. F. A., and R. Hubley, 2008 RepeatModeler Open-1.0.
Talbert, P. B., and S. Henikoff, 2010 Centromeres convert but don’t cross. PLoS Biol. 8:
e1000326.
W. Leung et al. 31

Tatusova, T. A., and T. L. Madden, 1999 BLAST 2 Sequences, a new tool for comparing
protein and nucleotide sequences. FEMS Microbiol. Lett. 174: 247–250.
Trapnell, C., L. Pachter, and S. L. Salzberg, 2009 TopHat: discovering splice junctions with
RNA-Seq. Bioinforma. Oxf. Engl. 25: 1105–1111.
Trapnell, C., B. A. Williams, G. Pertea, A. Mortazavi, G. Kwan et al., 2010 Transcript assembly
and quantification by RNA-Seq reveals unannotated transcripts and isoform
switching during cell differentiation. Nat. Biotechnol. 28: 511–515.
Wootton, J. C., and S. Federhen, 1993 Statistics of local complexity in amino acid sequences
and sequence databases. Comput. Chem. 17: 149–163.
Yang, H.-P., and D. A. Barbash, 2008 Abundant and species-specific DINE-1 transposable
elements in 12 Drosophila genomes. Genome Biol. 9: R39.
Yasuhara, J. C., and B. T. Wakimoto, 2008 Molecular landscape of modified histones in
Drosophila heterochromatic genes and euchromatin-heterochromatin transition
zones. PLoS Genet. 4: e16.
Zhou, L., M. Pertea, A. L. Delcher, and L. Florea, 2009 Sim4cc: a cross-species spliced
alignment program. Nucleic Acids Res. 37: e80.
Zimin, A. V., D. R. Smith, G. Sutton, and J. A. Yorke, 2008 Assembly reconciliation.
Bioinforma. Oxf. Engl. 24: 42–45.
W. Leung et al. 32

SUPPLEMENTAL METHODS FIGURES
Figure SM1 CENSOR search of the D. buzatii ISBu1 transposon insertion sequence (AY756165.1) against the Drosophila RepBase library shows that it has 94% sequence similarity to the Homo6 consensus sequence in RepBase. The RepBase Homo6 record was last updated in release 17.07, where part of the Homo6 consensus sequence has been masked as a helitron.
W. Leung et al. 33

W. Leung et al. 34

W. Leung et al. 35

Figure SM2 Heat maps of CAI versus Nc show that D. grimshawi F element genes are under stronger selective pressure than is the case for other species. Genes with high z-scores are shown in blue in the heat map, while genes with low z-scores are shown in red. Most of the genes on the D. melanogaster, D. erecta, and D. mojavensis F elements show a red-red or blue-blue pattern in the heat map for CAI and Nc, indicating that most of the observed codon bias in these genes can be attributed to mutational biases rather than selection. In contrast, the heat maps for the D. grimshawi F element and the base of the D elements show a red-blue pattern for CAI and Nc, which indicates that most of the codon biases observed in these regions are the result of selection. Similar to the base of the D. erecta D element, genes on the extended (D. ere: D (ext.)) and the telomeric (D. ere: D (tel.)) regions of the D. erecta D element also showed the red-blue pattern for CAI and Nc. The order of the genes in each heat map is determined by Ward hierarchical clustering.
W. Leung et al. 36

Figure SM3 Different codon usage patterns in the F element genes compared to the euchromatic reference regions. (Left) The heat map shows the proportion of codon usage for each amino acid. Preferred codons are in blue and less frequent codons are in red. The heat map shows that F element genes have a different codon usage pattern compared to genes in the D euchromatic reference regions. The codon usage patterns in all the euchromatic reference regions are similar, despite the fact that the genes on the D. mojavensis and D. grimshawi D euchromatic reference regions differ from those found on the D. melanogaster and D. erecta euchromatic reference regions. (Right) Genes in the euchromatic reference regions show a strong preference for CTG over TTA for leucine (L), while genes in the F element do not show the same bias. CAA is preferred over CAG for glutamine (Q) in the D. melanogaster and D. erecta F elements, while there is no preference in the D. mojavensis and D. grimshawi F elements. In contrast, the D euchromatic reference regions show a strong preference for CAG over CAA. The euchromatic reference regions show a strong preference of GTG over GTA for valine (V), and the D. grimshawi F element shows the same preference. In contrast, the other F elements show a preference for GTT over GTC.
W. Leung et al. 37

A
B
Figure SM4 D. grimshawi scaffolds with tandem arrays of LTRs results generate a large number of whole genome alignments. (A) BLAST 2 alignment of the D. grimshawi scaffolds 17366 and 14590 shows a tandem array of matches. The unaligned regions correspond to gaps in either scaffold 17366 or 14590. (B) Searching scaffold 17366 against the Drosophila RepBase library shows a tandem array of matches (~155bp) to the D. grimshawi Gypsy-5 LTR across the entire length of this scaffold.
W. Leung et al. 38

Figure SM5 Analysis of missing mate pairs indicates that most of the highly repetitive scaffolds in the D. grimshawi assembly are caused by misassemblies. Analysis of the reads.placed file from the CAF1 assembly shows the majority of the reads placed in scaffolds with a large number of PALS hits are unpaired. Most of the missing mate pairs are unplaced in the CAF1 assembly.
W. Leung et al. 39

Figure SM6 Improving the D. melanogaster and D. erecta gene annotations using the D. yakuba RNA-Seq data. In release 5.50, FlyBase annotated the gene CG13814 next to rdgC in D. melanogaster. The GLEAN-R gene prediction GG16094 is assigned as a putative ortholog of CG13814 in D. erecta (black arrows). TopHat splice junction predictions and mapping of assembled proteins from D. yakuba RNA-Seq reads suggest that GG16094 is likely part of an unannotated isoform of rdgC in D. erecta (red arrows). FlyBase has subsequently revised the D. melanogaster annotation for this region in release 5.51 and merged CG13814 with rdgC.
W. Leung et al. 40

Figure SM7 Pipelines used to construct the species-specific modENCODE RNA-Seq transcriptome library. (A) RNA-Seq reads are mapped against the corresponding genome assembly using TopHat to discover novel splice junctions. We re-ran TopHat in ‘–no-novel-juncs’ mode using the splice junctions from the initial TopHat run as raw junctions to increase the number of mapped reads. The mapped reads are assembled independently using Cufflinks and CEM to construct the transcript library. Coding regions in the assembled transcripts are identified using TransDecoder. (B) Unmapped RNA-Seq reads are assembled together to produce an unmapped transcript library. To reduce memory requirements, the unmapped RNA-Seq reads are divided into smaller partitions and reads in each partition are assembled together using ABySS. Contigs produced by ABySS are combined into a single collection and assembled together using CAP3. Coding regions within the unmapped assembled transcripts are identified using TransDecoder.
W. Leung et al. 41

Figure SM8 Repeat density estimates for the D. melanogaster F element and the base of the D elements using eight different repeat libraries with RepeatMasker. Irrespective of the repeat library used in the analysis, the D. melanogaster F element shows higher repeat density than the D element. Except for the PALS+PILER+MUSCLE pipeline, the other de novo repeat discovery pipelines produce estimates of total repeat density that are similar to the results obtained using the RepBase Drosophila library. The PALS+PILER+MUSCLE pipeline has a lower estimate of the total repeat density than the other libraries in both the F element and the euchromatic reference region, particularly in the density of the DINE-1 elements.
W. Leung et al. 42

SUPPLEMENTAL METHODS TABLES
Table SM1 The list of D. grimshawi scaffolds that show the largest number of PALS alignments when the scaffold is aligned against the entire D. grimshawi assembly
D. grimshawi scaffold Number of PALS hitsscaffold_17366 1,043,884scaffold_14590 1,015,371scaffold_14979 975,948scaffold_14591 965,159scaffold_6903 859,208scaffold_13968 806,230scaffold_17208 799,044scaffold_6381 774,881scaffold_15098 772,658scaffold_15099 747,890
W. Leung et al. 43

Table SM2 Version information for the main bioinformatics tools used in this analysis
Program VersionABySS 1.3.3BamTools 2.3.0BamUtil 1.0.7BEDTools 2.16.1BLAT 34x13Bowtie 2 2.1.0CAP3 12/21/07CD-HIT 4.6CEM 0.9.1CENSOR 4.2.28Cufflinks 2.1.1EMBOSS 6.5.7.0GNU Parallel 20130422GRIMM 2.0.1GROUPER 2.25LAST 291MAP REPET 2.0MUSCLE 3.8.31NCBI BLAST+ 2.2.27+PALS 1.0_p1Phred, Phrap, and Consed 0.071220.b, 1.090518, 15.0PILER 1.0R 3.0.2RECON 1.0.7RepClass 1.0.1RepeatMasker open-3.4.0RepeatModeler open-1.0.5RepeatScout 1.0.5REPET 2.0SAMtools 0.1.18scnRCA 04/11/2013sim4cc 2010-11-22SPALN 2.1.2Tallymer gt 1.4.2tantan 13TEClass 2.1TopHat 2.0.8bTransDecoder 2012-08-15TRF 4.0.4UCSC Genome Browser 270USEARCH 6.0.203WindowMasker 1.0.0WU BLAST 2.0MP-WashU
W. Leung et al. 44