supplier network and aircraft production in wartime … · supplier networks and aircraft...
TRANSCRIPT
CIRJE Discussion Papers can be downloaded without charge from:
http://www.e.u-tokyo.ac.jp/cirje/research/03research02dp.html
Discussion Papers are a series of manuscripts in their draft form. They are not intended for
circulation or distribution except as indicated by the author. For that reason Discussion Papers may
not be reproduced or distributed without the written consent of the author.
CIRJE-F-755
Supplier Networks and Aircraft Productionin Wartime Japan
Tetsuji OkazakiUniversity of Tokyo
August 2010
Supplier Networks and Aircraft Production in Wartime Japan1
Tetsuji Okazaki
The University of Toyko
Abstract The Japanese aircraft industry, which operated on a very small scale before World War II, became Japan’s largest manufacturing industry by the end of the war. In this paper, we explore the causes of the growth of the aircraft industry during this time by focusing on the No. 5 Works of Mitsubishi Heavy Industries Co. We find that during the war, the supply of basic inputs increased substantially: the labor force, equipment and “machinery parts” were in sufficient supply, and none of them were binding constraints on production. A binding constraint existed in the supply of “special parts.” Put differently, aircraft production expanded as the supply of special parts increased. This increase in the supply of special parts and even faster growth in the supply of machinery parts came about through the expansion of supplier networks in terms of both the number of suppliers and the geographical area in which they were located. These findings imply that outsourcing played a key role in the rise of aircraft production in wartime Japan.
1 I would like to thank to two anonymous referees, Professor Price V. Fishback, Hugh Rockoff, Jochen Streb and other participants at the workshop on “The Historical Economics of War and Procurement” at Mannheim University (2008) and the session on “Economics of War” at the World Economic History Congress at Utrecht University (2009) for their useful comments on the earlier versions of this article. All remaining errors are the author’s responsibility.
Ⅰ
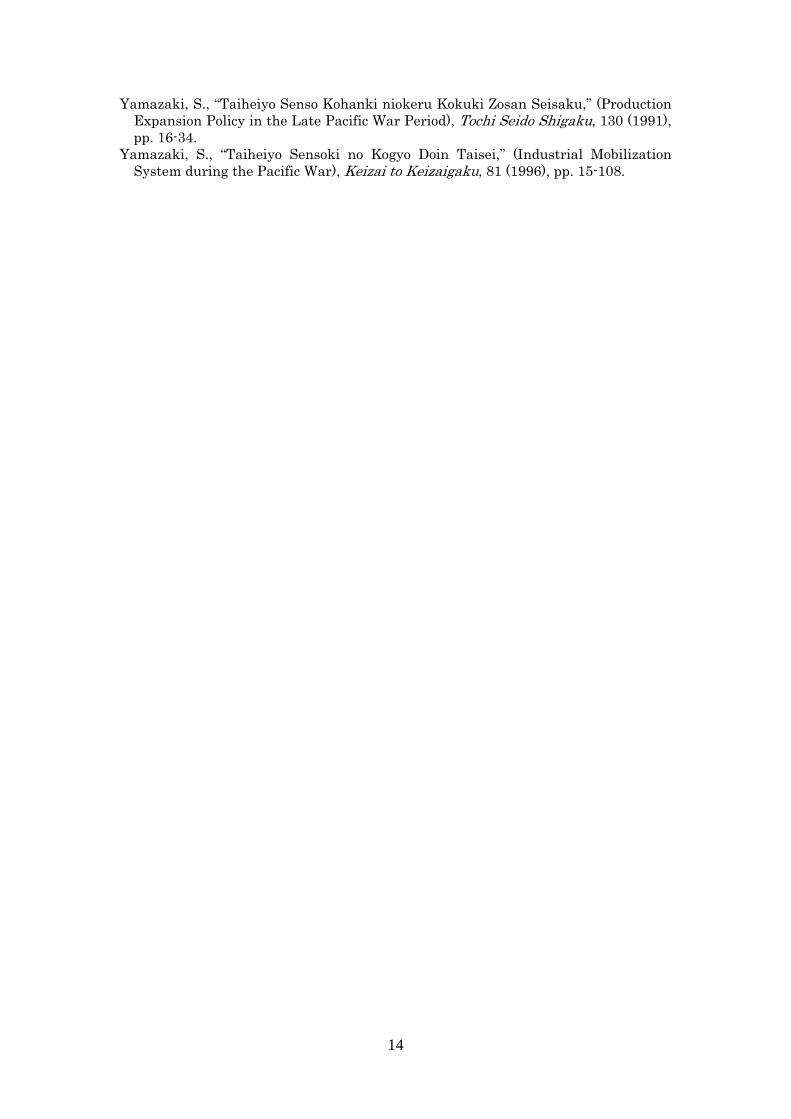
The Japanese aircraft industry, which operated at a very small scale before World War II, became a huge industry employing 1.5 million workers by the end of the war. Monthly airframe production, which was 306 in January 1939, increased to 2,541 in May 1944.2 Indeed, the Japanese war economy experienced an “armament miracle” or a “production miracle” during World War II, as did Germany and the United States.3 With respect to the US, Rockoff stressed multiple factors, including a return to work of the unemployed, an increase in average per-worker working hours and a geographic shift of workers, which contributed to the increase of output, based on the macroeconomic data.4 Meanwhile, with respect to Germany, Budrass et al. recently revealed that the increase in aircraft production can be attributed to two main factors; namely, learning-by-doing and outsourcing, using the micro-data from the audit reports of major aircraft producers.5 In this paper, we aim to contribute to this strand of literature by focusing on the rapid increase in aircraft production in wartime Japan.
The rapid growth in aircraft production in Japan has attracted interest since just after the war, and many studies have been undertaken. Among others, the “Final Reports of the United States Strategic Bombing Survey (USSBS)” (hereafter, “Final Reports”) and Japan’s Economy in War and Reconstruction by Cohen (a member of the USSBS) discuss the structure of the Japanese war economy in detail, drawing on thorough investigations obtained through the authority of the postwar occupation forces. These two studies are still worth reading as the basic literature on the Japanese war economy, including the aircraft industry.
One of the most noteworthy findings of the “Final Reports” is that aircraft production in wartime Japan depended on a supply of parts from numerous small suppliers. For instance, they state that “… a considerable percentage of airframe and engine subassembly manufacturing was let out to subcontractors, a high percentage of parts came from a large network of sub-subcontractors,” and “shops scattered throughout the industrial areas supplied the thousands of bits and pieces that made up the finished aircraft.” 6 This finding is important because it implies that the production organization of the Japanese armament industry shared a common feature with that of the German armament industry, in that they substantially utilized outsourcing.7 We intend to explore how outsourcing progressed and how it contributed to aircraft production in Japan.
Many studies on the Japanese war economy have accepted the view of USSBS and Cohen concerning the wartime production organization. For example, in an article focusing on the policy of the Japanese government and the military authorities, Yamazaki detailed the percentage of parts manufactured by outside suppliers and discussed the problems in managing these suppliers, using documents from the Administration Inspection Mission (Gyosei Sasatsushi), which inspected
2 USSBS, “Final Reports,” Aircraft Division, p.161. 3 Budrass et al., “Fixed-price”; Overy, War ; Rockoff, “The United States.” 4 Rockoff, “The United States,” pp.105–106. 5 Budrass et al., “Fixed-price.” 6 USSBS, “Final Reports,” Aircraft Division, p. 23. Similar findings are presented in Cohen’s study (p. 221). Toyo Keizai Shinposha eds., Showa Sangyoshi also writes, “As the aircraft industry was a highly synthetic industry and it was requested a sharp production increase in a short period, each aircraft firm rapidly increased to the extent let out to the outside suppliers, while expanding its own equipment” (p. 620). 7 Budrass et al., “Fixed-price.”
1
Nakajima Aircraft in September and October 1943. 8 Ueda analyzed the lists of “cooperative factories” and concluded that despite government policy to strengthen and put in order the relationships between assemblers and suppliers, the relationships were unstable and in mess.9 Furthermore, as the wartime aircraft industry was pioneering the mass production system in Japan, there are many other production management studies on the aircraft industry. This literature, including research by Kasai, Maeda, Minato, Ishiguchi, Takahashi and Wada, 10 has also focused on parts suppliers as the basis of the mass production system. The key implication is that wartime production in Japan involved an extensive division of work between firms and suppliers.
However, in the context of Japan, much still remains unexplored. One interesting potential area for research is the actual function of the supplier networks. A shortcoming of the existing literature is that it relies heavily on documents associated with the Administration Inspection Mission in September and October 1943. Hence, the information concentrates on what the members of the mission observed during these particular months. It is, therefore, desirable to examine the function of supplier networks from a longer-term, as well as a quantitative, perspective. Fortunately, the archives of the Nagoya Aircraft Works of the Mitsubishi Heavy Industry Co. hold documents that were prepared for the USSBS immediately after the war. These documents provide rich information on aircraft production and the parts supply of Nagoya Aircraft Works from 1939 to 1945, information not fully utilized by the “Final Reports” of the USSBS. In this paper, we examine the expansion of the supplier network, the parts supply from the network, and the relationship between parts supply and aircraft production in wartime Japan by focusing on the Nagoya Aircraft Works of Mitsubishi Heavy Industries.
The paper is organized as follows. Section 2 provides an overview of aircraft production and the relevant policies of the Japanese government and the military authorities during the war. Section 3 describes the expansion of Nagoya Works and its supplier network. In Section 4, we analyze the relationship between the parts supply and aircraft production. Section 5 concludes the paper.
Ⅱ
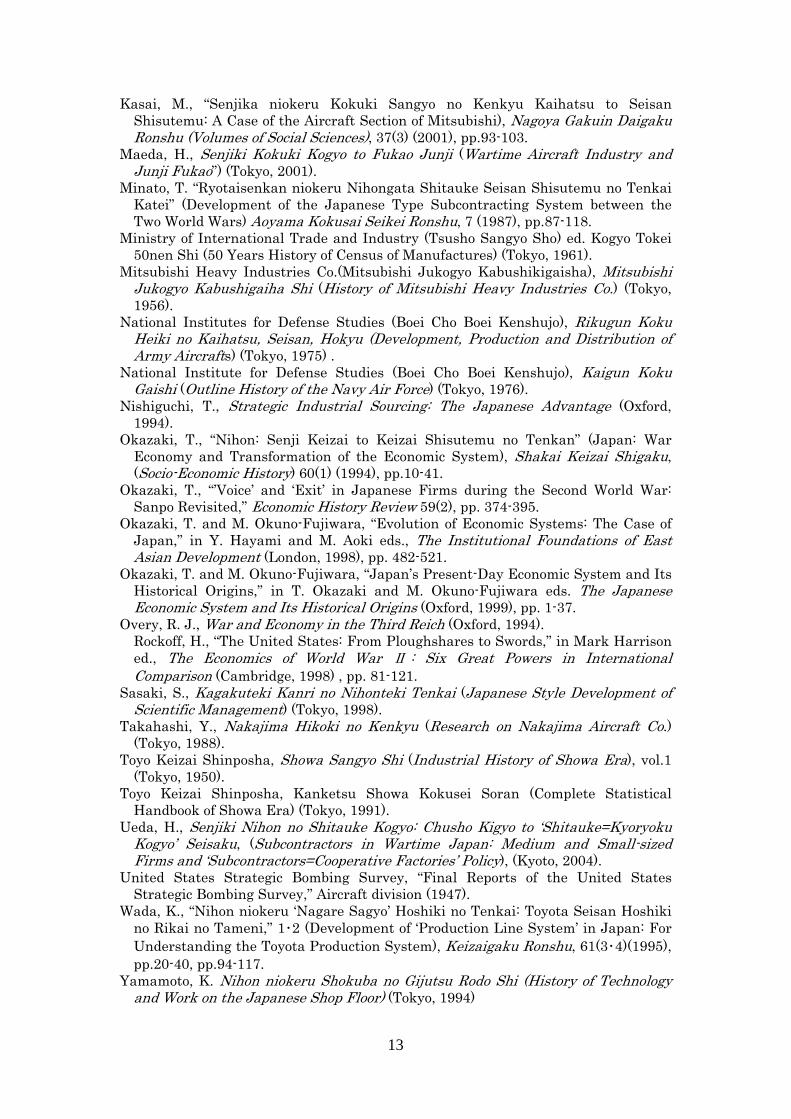
As shown in Figure 1, one of the remarkable features of the Japanese economy during World War II was the rapid growth of the machinery industry. As the Census of Manufactures is not available after 1943, we estimated the number of employees in the machinery industry and in the manufacturing industry as a whole for 1943 and 1944 using the manufacturing production index compiled by the Ministry of International Trade and Industry (MITI) after the war. According to our estimates, employment in the manufacturing industry in 1944 was about 2.5 million, five times larger than in 1936 when the war with China began. Consequently, the machinery industry came to be the largest sector of all manufacturing industries. Indeed, as shown in Figure 1, its share of manufacturing industry employment rose from 18.0% in 1936 to 54.1% in 1944.
Figure 1 here
8 Yamazaki, “Taiheiyo Senso Kohanki.” 9 Ueda, Senjiki. 10 Takahashi, Nakajima Hikoki; Wada, “Nihon”; Sasaki, Kagakuteki Kanri; Maeda, Senjiki; Kasai, “Senjika”
2
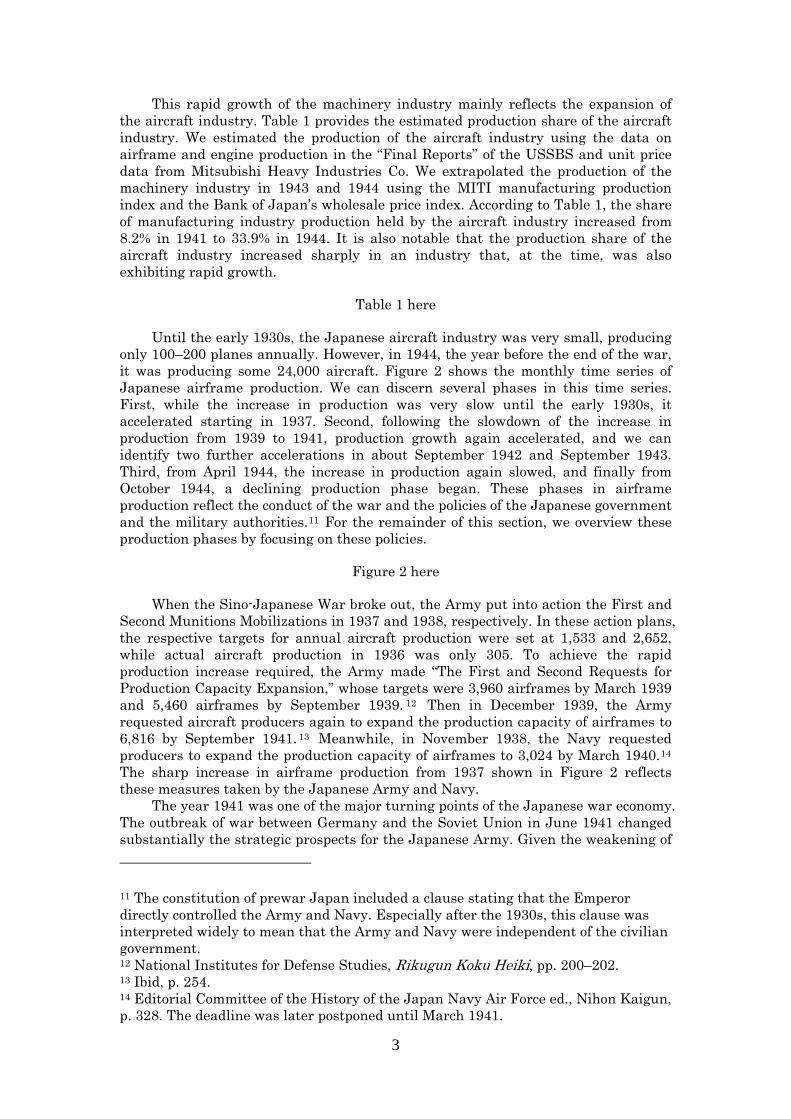
This rapid growth of the machinery industry mainly reflects the expansion of the aircraft industry. Table 1 provides the estimated production share of the aircraft industry. We estimated the production of the aircraft industry using the data on airframe and engine production in the “Final Reports” of the USSBS and unit price data from Mitsubishi Heavy Industries Co. We extrapolated the production of the machinery industry in 1943 and 1944 using the MITI manufacturing production index and the Bank of Japan’s wholesale price index. According to Table 1, the share of manufacturing industry production held by the aircraft industry increased from 8.2% in 1941 to 33.9% in 1944. It is also notable that the production share of the aircraft industry increased sharply in an industry that, at the time, was also exhibiting rapid growth.
Table 1 here
Until the early 1930s, the Japanese aircraft industry was very small, producing only 100–200 planes annually. However, in 1944, the year before the end of the war, it was producing some 24,000 aircraft. Figure 2 shows the monthly time series of Japanese airframe production. We can discern several phases in this time series. First, while the increase in production was very slow until the early 1930s, it accelerated starting in 1937. Second, following the slowdown of the increase in production from 1939 to 1941, production growth again accelerated, and we can identify two further accelerations in about September 1942 and September 1943. Third, from April 1944, the increase in production again slowed, and finally from October 1944, a declining production phase began. These phases in airframe production reflect the conduct of the war and the policies of the Japanese government and the military authorities.11 For the remainder of this section, we overview these production phases by focusing on these policies.
Figure 2 here
When the Sino-Japanese War broke out, the Army put into action the First and Second Munitions Mobilizations in 1937 and 1938, respectively. In these action plans, the respective targets for annual aircraft production were set at 1,533 and 2,652, while actual aircraft production in 1936 was only 305. To achieve the rapid production increase required, the Army made “The First and Second Requests for Production Capacity Expansion,” whose targets were 3,960 airframes by March 1939 and 5,460 airframes by September 1939. 12 Then in December 1939, the Army requested aircraft producers again to expand the production capacity of airframes to 6,816 by September 1941. 13 Meanwhile, in November 1938, the Navy requested producers to expand the production capacity of airframes to 3,024 by March 1940.14 The sharp increase in airframe production from 1937 shown in Figure 2 reflects these measures taken by the Japanese Army and Navy.
The year 1941 was one of the major turning points of the Japanese war economy. The outbreak of war between Germany and the Soviet Union in June 1941 changed substantially the strategic prospects for the Japanese Army. Given the weakening of
11 The constitution of prewar Japan included a clause stating that the Emperor directly controlled the Army and Navy. Especially after the 1930s, this clause was interpreted widely to mean that the Army and Navy were independent of the civilian government. 12 National Institutes for Defense Studies, Rikugun Koku Heiki, pp. 200–202. 13 Ibid, p. 254. 14 Editorial Committee of the History of the Japan Navy Air Force ed., Nihon Kaigun, p. 328. The deadline was later postponed until March 1941.
3
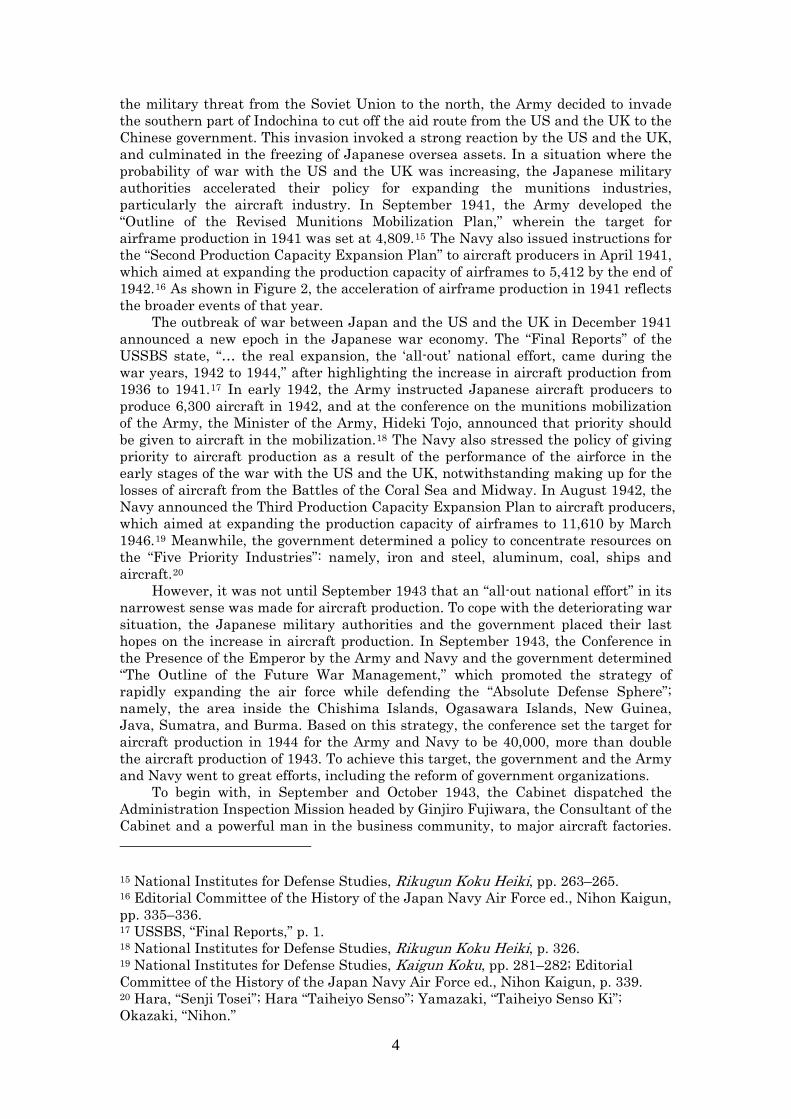
the military threat from the Soviet Union to the north, the Army decided to invade the southern part of Indochina to cut off the aid route from the US and the UK to the Chinese government. This invasion invoked a strong reaction by the US and the UK, and culminated in the freezing of Japanese oversea assets. In a situation where the probability of war with the US and the UK was increasing, the Japanese military authorities accelerated their policy for expanding the munitions industries, particularly the aircraft industry. In September 1941, the Army developed the “Outline of the Revised Munitions Mobilization Plan,” wherein the target for airframe production in 1941 was set at 4,809.15 The Navy also issued instructions for the “Second Production Capacity Expansion Plan” to aircraft producers in April 1941, which aimed at expanding the production capacity of airframes to 5,412 by the end of 1942.16 As shown in Figure 2, the acceleration of airframe production in 1941 reflects the broader events of that year.
The outbreak of war between Japan and the US and the UK in December 1941 announced a new epoch in the Japanese war economy. The “Final Reports” of the USSBS state, “… the real expansion, the ‘all-out’ national effort, came during the war years, 1942 to 1944,” after highlighting the increase in aircraft production from 1936 to 1941.17 In early 1942, the Army instructed Japanese aircraft producers to produce 6,300 aircraft in 1942, and at the conference on the munitions mobilization of the Army, the Minister of the Army, Hideki Tojo, announced that priority should be given to aircraft in the mobilization.18 The Navy also stressed the policy of giving priority to aircraft production as a result of the performance of the airforce in the early stages of the war with the US and the UK, notwithstanding making up for the losses of aircraft from the Battles of the Coral Sea and Midway. In August 1942, the Navy announced the Third Production Capacity Expansion Plan to aircraft producers, which aimed at expanding the production capacity of airframes to 11,610 by March 1946.19 Meanwhile, the government determined a policy to concentrate resources on the “Five Priority Industries”: namely, iron and steel, aluminum, coal, ships and aircraft.20
However, it was not until September 1943 that an “all-out national effort” in its narrowest sense was made for aircraft production. To cope with the deteriorating war situation, the Japanese military authorities and the government placed their last hopes on the increase in aircraft production. In September 1943, the Conference in the Presence of the Emperor by the Army and Navy and the government determined “The Outline of the Future War Management,” which promoted the strategy of rapidly expanding the air force while defending the “Absolute Defense Sphere”; namely, the area inside the Chishima Islands, Ogasawara Islands, New Guinea, Java, Sumatra, and Burma. Based on this strategy, the conference set the target for aircraft production in 1944 for the Army and Navy to be 40,000, more than double the aircraft production of 1943. To achieve this target, the government and the Army and Navy went to great efforts, including the reform of government organizations.
To begin with, in September and October 1943, the Cabinet dispatched the Administration Inspection Mission headed by Ginjiro Fujiwara, the Consultant of the Cabinet and a powerful man in the business community, to major aircraft factories.
15 National Institutes for Defense Studies, Rikugun Koku Heiki, pp. 263–265. 16 Editorial Committee of the History of the Japan Navy Air Force ed., Nihon Kaigun, pp. 335–336. 17 USSBS, “Final Reports,” p. 1. 18 National Institutes for Defense Studies, Rikugun Koku Heiki, p. 326. 19 National Institutes for Defense Studies, Kaigun Koku, pp. 281–282; Editorial Committee of the History of the Japan Navy Air Force ed., Nihon Kaigun, p. 339. 20 Hara, “Senji Tosei”; Hara “Taiheiyo Senso”; Yamazaki, “Taiheiyo Senso Ki”; Okazaki, “Nihon.”
4
This is significant in the sense that the government started to concentrate the authorities relating to aircraft production hitherto dispersed across many ministries. The mission concluded that it was indeed possible to produce the 40,000 aircraft required and that with appropriate measures, the production of up to 50,000 aircraft was feasible. The mission also argued that it was essential to reform the administrative system of aircraft production to remove the harmful effects of the conflict between the Army and the Navy.21
The administrative reforms advised by the Fujiwara Mission took form with the foundation of the Ministry of Munitions in November 1943. The Ministry of Munitions integrated the administrative functions for aircraft production in the Army Air Headquarters and the Naval Air Headquarters, all functions of the Planning Board, and the functions for munitions production in the Ministry of Commerce and Industry. In this sense, the Ministry of Munitions became the ministry in charge of all issues concerning munitions production and distribution. The aircraft production plan for 1944, the first plan drawn up by the Ministry of Munitions, set the aircraft production target to be 52,500, of which 27,120 aircraft were for the Army and 25,380 aircraft for the Navy.22
However, the environment of the Japanese war economy continued to deteriorate after the foundation of the Ministry of Munitions. From February 1944 to April 1944, the Army and Navy requisitioned additional ships every month, a process that damaged the production of aluminum. In June 1944, US forces landed on Saipan, signifying the breaking of “The Absolute Defense Sphere.” After that, Japan continued to lose ships and to abandon ship routes because of attacks by US forces. From November 1944, B-29s based at Saipan conducted strategic bombing of Japan,23 the main targets being the aircraft industry. The strategic bombing and the associated factory evacuations provided the final assault on Japanese aircraft production, which as shown in Figure 2 had already started to decline from October 1944.24
Ⅲ
Mitsubishi Heavy Industries Co. (MHI) was one of the largest aircraft producers in wartime Japan. Mitsubishi Zaibatsu entered the aircraft industry when it founded Mitsubishi Internal Combustion Engine Co. (MICE) in Nagoya in 1920. Mitsubishi intended originally to produce aircraft and automobiles at MICE, but gradually MICE began to focus on aircraft and in 1928 was renamed Mitsubishi Aircraft Co. In 1934, Mitsubishi Aircraft Co. and Mitsubishi Shipbuilding Co. merged to become Mitsubishi Heavy Industries Co., with Nagoya Aircraft Works (NAW) becoming the center for aircraft production.25
The expansion of the aircraft industry described in the previous section greatly influenced the NAW, as both the Army and the Navy expected it to bear a substantial portion of the expansion plan and correspondingly ordered many aircraft. With respect to The First and Second Production Capacity Expansion Requests of the
21 Hara, “Senji Tosei”; Yamazaki, “Taiheiyo Senso”; Yamazaki, “Taiheiyo Senso Kohanki.” 22 Yamazaki, “Taiheiyo Senso Kohanki.” 23 Hara, “Senji Tosei.” 24 The USSBS evaluation stated “During the dismantling of plants and the moving and reestablishment of production lines, the loss in production was greater than that because of direct air attacks” (“Final Reports,” p. 3). 25 MHI, “Mitsubishi Jukogyo,” p. 294; Maeda, “Senjiki,” pp. 50–53.
5
Army in 1938, the expectation was that MHI would produce 480 and 660 airframes of the total 3,960 and 5,460 airframes, respectively. With respect to The Third Production Capacity Expansion Request of the Army in 1939, it was expected MHI would produce 1,296 of the total 6,816 airframes. Meanwhile, with respect to The First Production Capacity Expansion Plan of the Navy in 1938, MHI was to produce 900 of the 3,024 total airframes.26
Table 2 shows the number of airframe orders for, and the production of, MHI. Table 2 clearly indicates that orders from the Army and the Navy increased sharply in 1937 and again in 1938. On August 1 1937, just after the breakout of the Sino-Japanese War, the Navy instructed MHI to increase production sharply and held a conference attended by all major aircraft producers at the NAW calling for an increase in production. The “Summary History of Nagoya Works” observes that in response to this conference, the works began to expand production rapidly as an emergency measure.”27
Table 2 here
The growth in the number of workers at the NAW reflected the increase in production from 1937, and equipment began to increase in 1938 when MHI received instructions from the Army and Navy to expand its production capacity (Table 3). In 1938, MHI moved the engine plant of the NAW and made it an independent establishment, Nagoya Engine Works, while the NAW specialized in airframe production. At the same time, the airframe plant was reorganized. All of the existing airframe plants were then assigned to naval airframes, and a new plant for army airframes was constructed.28
As stated in the previous section, the Army and the Navy instructed the major aircraft producers to expand their production capacity in September 1941 and April 1941, respectively. Upon receiving these instructions, MHI newly established the Kumamoto Works for Army airframes and the Okayama Works for Naval airframes, both away from the Nagoya area.29 Meanwhile, the NAW continued to expand.30 By comparing the scale of the NAW at the end of 1936 and the end of 1943, we can see that it was 7.0, 11.8 and 15.9 times larger in terms of floor space, the number of employees, and the number of machine tools, respectively (Table 3).
Table 3
In December 1944, the NAW suffered from two seriously damaging incidents: a major earthquake and US bombing. Given the scale of the damage, the NAW evacuated its plants to avoid any future bombing. The NAW plants were evacuated to many geographic areas, including Nagano, Toyama, Shizuoka, Shiga, Mie, and Fukui. To manage these dispersed plants, the NAW was then divided into four separate establishments; namely, No. 1, No. 2, No. 5, and No. 11 Works.31
An increase in parts supply should accompany the expansion of airframe production capacity. While the Nagoya Engine Works inside MHI supplied the
26 National Institutes for Defense Studies, Rikugun Koku Heiki, p. 202, p. 254; Editorial Committee of the History of the Japan Navy Air Force ed., Nihon Kaigun, pp. 335–336. 27 The page on August 1, 1937 of “Mitsubishi Kokuki Seisakujo Gaishi” (held at the headquarters of the Mitsubishi Heavy Industries Co.) 28 MHI, Mitsubishi Jukogyo, p. 297. 29 NAW, “Genkyo Shinkokusho,” Match 1943 (held at the NAW archives). 30 Ibid. 31 MHI, Mitsubishi Jukogyo, p. 298, pp. 350–351.
6
engines, the most important part of an aircraft so to speak, the NAW relied on a number of outside suppliers for the various other aircraft parts.32 For instance, the “Final Reports” on the USSBS indicate that MHI contracted out 32% of its work on aircraft production to subcontractors.33 The NAW undertook some efforts to find and manage its subcontractors when the expansion of production capacity began. For example, the “Chronological Table of the Factory” prepared by the NAW34 states, “[a]s the need to utilize subcontractors became more and more immediate, we set up a branch office with staff stationed in Osaka, in order to find subcontractors and then supervise their work. Afterwards, we also stationed staff in Tokyo.”35 Because the document was written in April 1940, we can say that by this time, the NAW had stationed staff to find and manage subcontractors in both Tokyo and Osaka.
In terms of the NAW department responsible for the Army airframes, detailed data on parts suppliers are available. In December 1944, the Army airframe department was reorganized into No. 5 Works, and this subsequently produced a document titled “Factory Survey” in October 1945 to file with the USSBS.36 This document contains rich data on the Army airframe section of the NAW from 1939. Concerning the period before December 1944, the data are for the No. 2 Processing Department of the NAW; however, below we refer to No. 2 Processing Department as No. 5 Works for simplicity. The “Factory Survey” contains a list of suppliers and their locations by parts categories; namely, “special parts,” “machinery parts,” “castings and forgings,” “metal sheet processing,” “material,” “material processing,” and “lumber.” The numbers of suppliers in the list are, by parts category, 83, 115, 30, 24, 73, 10, and 13, respectively. Furthermore, with respect to “special parts,” “machinery parts,” and “castings and forgings,” data are also available on the year when each supplier started to supply parts to No. 5 Works and the year when it ceased supply.
In terms of the categories of parts, special parts include bearings, electrical parts, and springs, and many large firms, including Fujikoshi Steel Co. (bearings), NSK Co. (bearings), Mitsubishi Electric Co. (electrical parts), Tokyo Shibaura Electric Co. (electrical parts) and Chuo Spring Co. (springs), are included in the list as suppliers for the No. 5 Works. However, machinery parts generally comprise miscellaneous items such as “small parts,” “large parts,” and “kinds of stopcocks,” and few large firms are included in the list. Furthermore, we assume that the special parts and machinery parts in this document correspond to the official categories of parts; namely, “special technical parts” and “general parts.” Special technical parts are then further classified into “controlled parts,” “government-coordinated parts,” and “government-supplied parts.” While controlled parts were produced under government supervision, ordering and distribution were organized directly between assemblers and suppliers. With government-coordinated parts, the government gave orders to suppliers, which then delivered the ordered parts to the assemblers. Finally, with respect to government-supplied parts, the government purchased these to deliver to the assemblers themselves. 37 In sum, the government was involved
32 Of the 13 aircraft producers in Japan, six major producers produced engines as
es C
,” p. 28. For other aircraft producers, the ratios were 43%
s. , Kojo Enkaku Nenpyo,” April 1940 (held at the NAW
W archives. , p. 13.
well as airframes, including Mitsubishi and Nakajima (Toyo Keizai Shinposha, Showa, p. 606. Concerning, Nagoya Engine Works of Mitsubishi Heavy Industri
o., see Maeda, Senjiki. 33 USSBS, “Final Reportsfor Nakajima Aircraft Co. and 31% for Aichi Aircraft Co. See also Toyo Keizai Shinposha, Showa, p. 621. 34 Held at the NAW archive35 NAW, “Kojo Genkyo Hokokuarchives), p. 10. 36 Held at the NA37 Final Reports of the USSBS
7
directly in the production and/or distribution of special technical parts in at least some way.
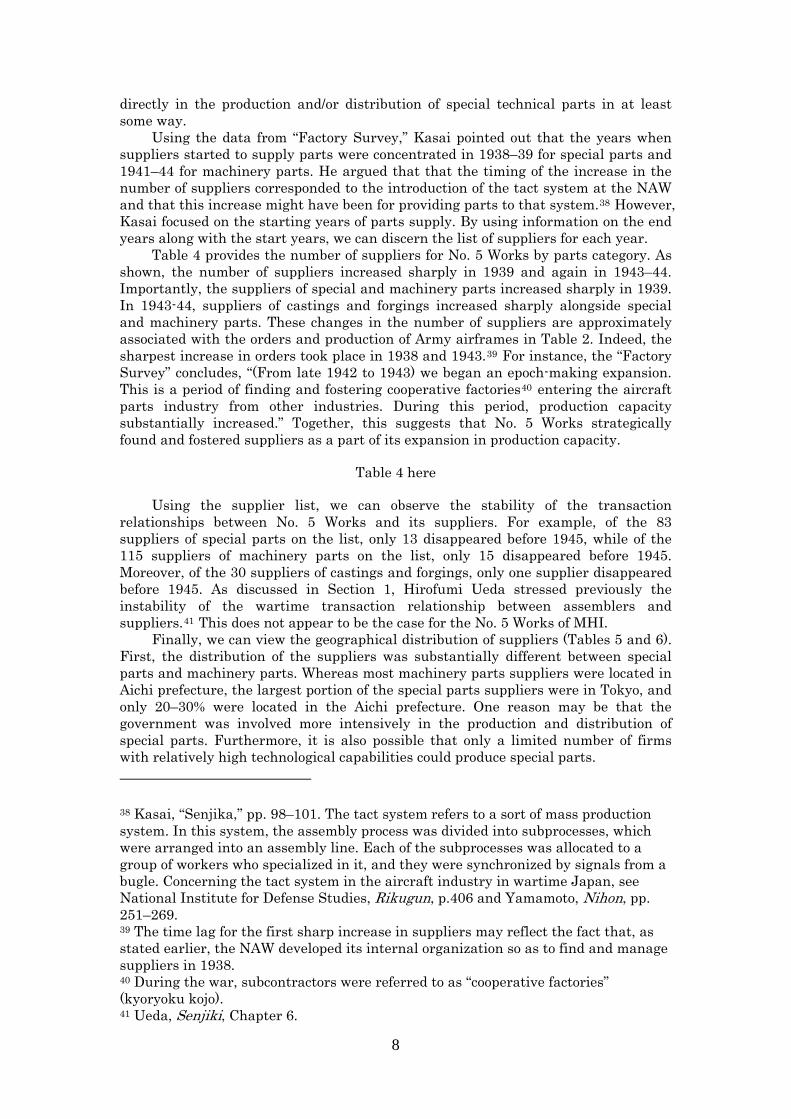
Using the data from “Factory Survey,” Kasai pointed out that the years when suppliers started to supply parts were concentrated in 1938–39 for special parts and 1941–44 for machinery parts. He argued that that the timing of the increase in the number of suppliers corresponded to the introduction of the tact system at the NAW and that this increase might have been for providing parts to that system.38 However, Kasai focused on the starting years of parts supply. By using information on the end years along with the start years, we can discern the list of suppliers for each year.
Table 4 provides the number of suppliers for No. 5 Works by parts category. As shown, the number of suppliers increased sharply in 1939 and again in 1943–44. Importantly, the suppliers of special and machinery parts increased sharply in 1939. In 1943-44, suppliers of castings and forgings increased sharply alongside special and machinery parts. These changes in the number of suppliers are approximately associated with the orders and production of Army airframes in Table 2. Indeed, the sharpest increase in orders took place in 1938 and 1943.39 For instance, the “Factory Survey” concludes, “(From late 1942 to 1943) we began an epoch-making expansion. This is a period of finding and fostering cooperative factories40 entering the aircraft parts industry from other industries. During this period, production capacity substantially increased.” Together, this suggests that No. 5 Works strategically found and fostered suppliers as a part of its expansion in production capacity.
Table 4 here
Using the supplier list, we can observe the stability of the transaction relationships between No. 5 Works and its suppliers. For example, of the 83 suppliers of special parts on the list, only 13 disappeared before 1945, while of the 115 suppliers of machinery parts on the list, only 15 disappeared before 1945. Moreover, of the 30 suppliers of castings and forgings, only one supplier disappeared before 1945. As discussed in Section 1, Hirofumi Ueda stressed previously the instability of the wartime transaction relationship between assemblers and suppliers.41 This does not appear to be the case for the No. 5 Works of MHI.
Finally, we can view the geographical distribution of suppliers (Tables 5 and 6). First, the distribution of the suppliers was substantially different between special parts and machinery parts. Whereas most machinery parts suppliers were located in Aichi prefecture, the largest portion of the special parts suppliers were in Tokyo, and only 20–30% were located in the Aichi prefecture. One reason may be that the government was involved more intensively in the production and distribution of special parts. Furthermore, it is also possible that only a limited number of firms with relatively high technological capabilities could produce special parts.
38 Kasai, “Senjika,” pp. 98–101. The tact system refers to a sort of mass production system. In this system, the assembly process was divided into subprocesses, which were arranged into an assembly line. Each of the subprocesses was allocated to a group of workers who specialized in it, and they were synchronized by signals from a bugle. Concerning the tact system in the aircraft industry in wartime Japan, see National Institute for Defense Studies, Rikugun, p.406 and Yamamoto, Nihon, pp. 251–269. 39 The time lag for the first sharp increase in suppliers may reflect the fact that, as stated earlier, the NAW developed its internal organization so as to find and manage suppliers in 1938. 40 During the war, subcontractors were referred to as “cooperative factories” (kyoryoku kojo). 41 Ueda, Senjiki, Chapter 6.
8

Second, over time the regional distribution of suppliers of machinery parts and castings and forgings changed, while the distribution of the suppliers of special parts was
verall, the suppliers of machinery parts dispersed geog
here
Ⅳ
n this section, we examine how the expansion of the supplier network contributed to airframe production at No. 5 Works. Th Factory Survey” included sections that
ly data for No. 5 Works for airframe production in terms of num
more stable. In terms of machinery parts, the most remarkable changes are the declining percentages in 1944. Meanwhile, the percentage of suppliers in Osaka, the prefecture in which the second-largest group of machinery parts suppliers was located, also declined from 1942.
As substitutes for Aichi and Osaka, the percentage of suppliers in Gifu, Shizuoka, and Tokyo increased. O
raphically from 1942. The geographical dispersion of suppliers is even clearer for castings and forgings. For example, suppliers in the Aichi prefecture supplied all castings and forgings until 1940. Afterwards, the percentage of suppliers in the Aichi prefecture declined substantially, while the percentages of suppliers in Tokyo, Osaka, Kanagawa, and Shizuoka increased. By 1943, most suppliers of castings and forgings were located in prefectures other than Aichi. In sum, with the expansion process of No. 5 Works, the parts supply base also expanded, in terms of both the number of suppliers and their geographic distribution.
Table 5
Table 6 here
Ie “
explained the reasons why production had fallen short. With respect to the labor force, “our labor force expansion plan will not finally be satisfied until the end of the war.” Furthermore, “however the fact that the requested labor force was not satisfied did not cause actual damage to production.” This was because, “as the expansion of our equipment and the production expansion of outside part suppliers did not keep pace with the increase in labor force, the labor force was in excess.” It also points out that special parts were particularly in short supply among those parts supplied by outside suppliers. In sum, the “Factory Survey” recognized that the binding constraints of airframe production were equipment and parts supply, particularly the supply of special parts.
We can also examine this observation quantitatively. To start with, the “Factory Survey” includes month
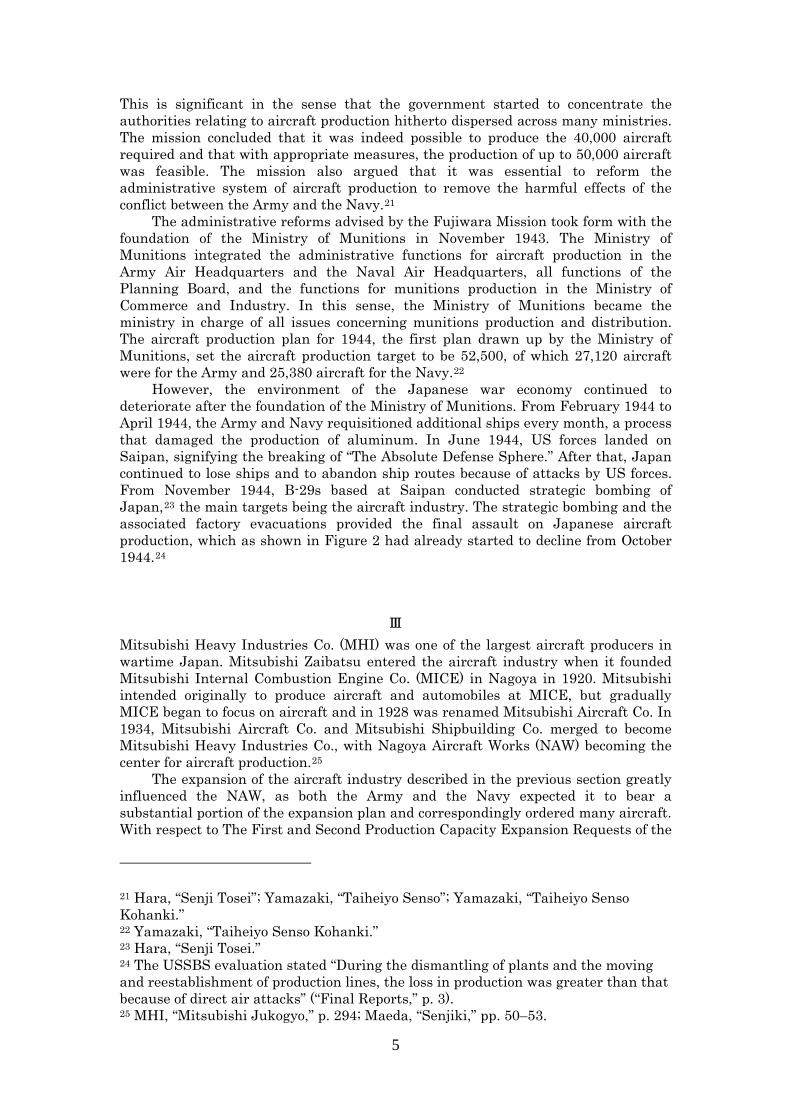
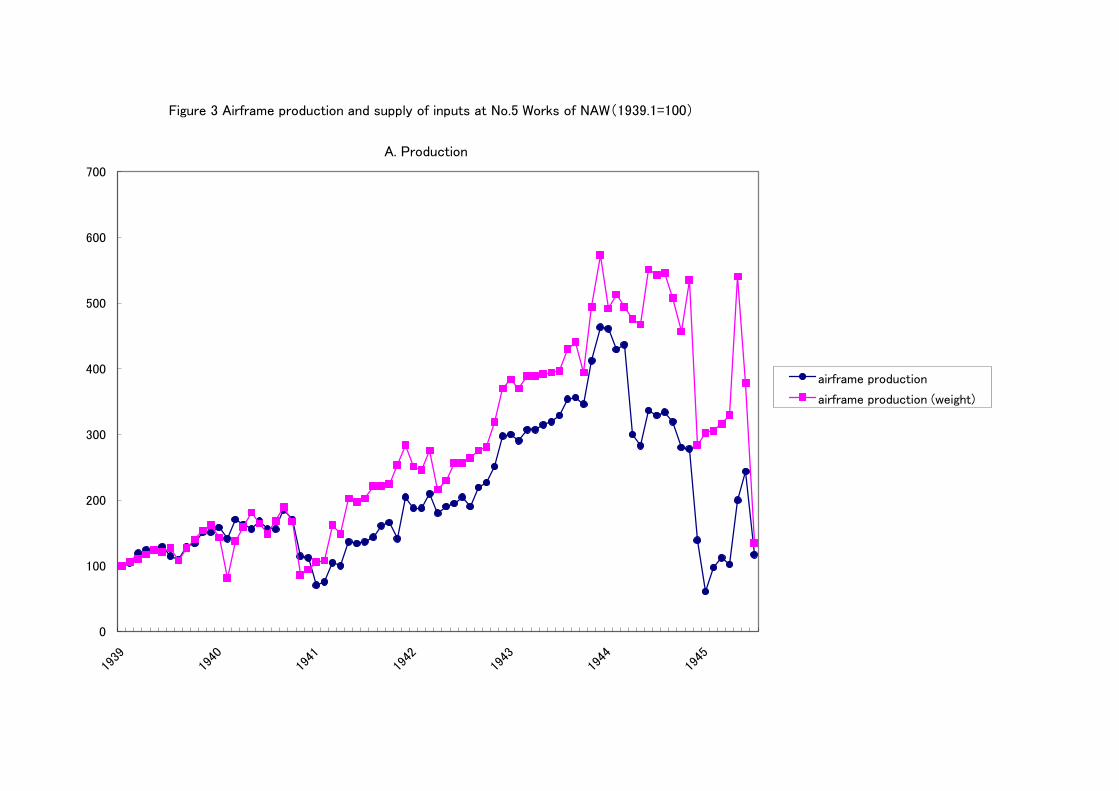
bers as well as weight, the supply of special parts, the supply of machinery parts, and the total hours worked from 1939.42 Airframe production is shown in Figure 3-A. The decline at the end of 1940 is a result of a condition peculiar to No. 5 Works entailing a change in the major type of airframe manufactured.43 The production of No. 5 Works then increased sharply from 1941 to 1943, with further accelerations in late 1942 and late 1943. Both of these accelerations reflect policy measures taken to increase the national level of production. Then in early 1944, production at No. 5 Works began to decline in terms of number and stagnated in terms of weight. Furthermore, production declined sharply in December 1944, when Nagoya suffered from bombing and a major earthquake. From February 1945, production recovered. In May and June 1945, the recovery accelerated, but in July 1945, it again declined.
Figures 3-A, 3-B, and 3-C here
42 Only a diagram concerning the supply of special parts is available. We obtained the requisite data from this diagram. 43 “Factory Survey.”
9

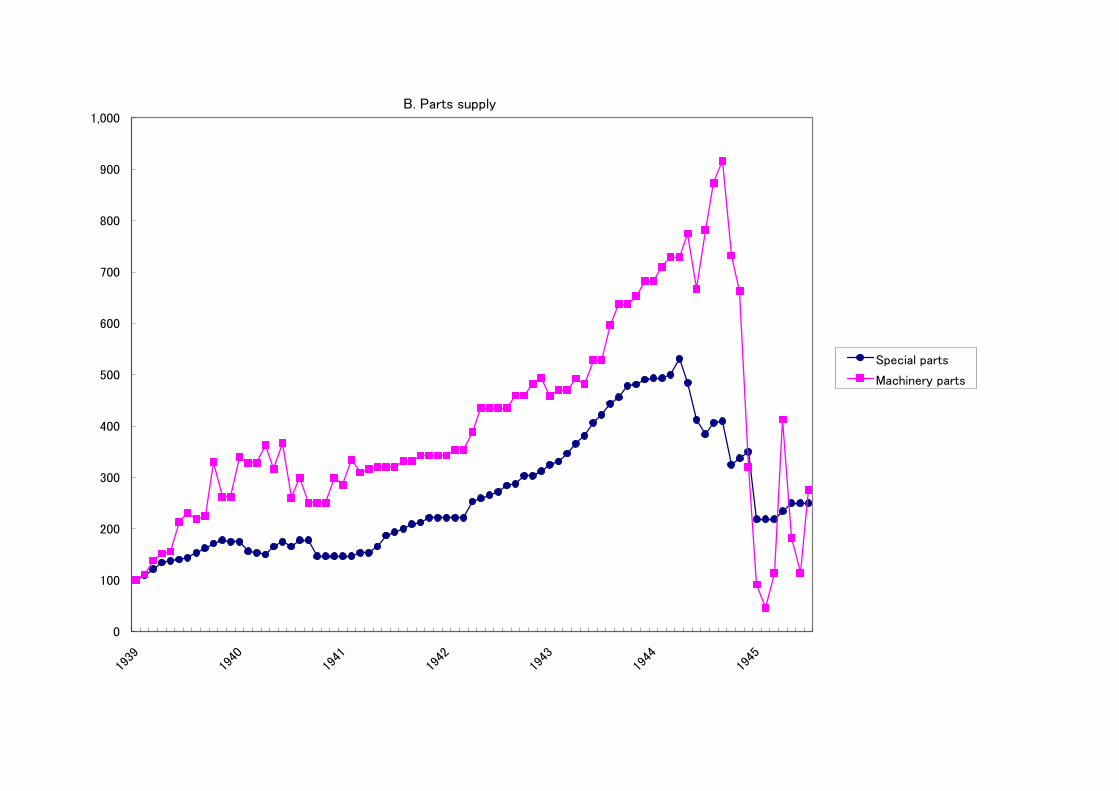
Figure 3-B shows the y of both special parts and machinery parts increased up until 1943, the supply of machinery parts grew faster. In ad
ory Survey” lacks the data on equipment, we estimated them
the expansion of equipment and the expansion of the supp
For this purpose, we assume a standard Cobb–Douglas prod
(1)
supply of parts. While the suppl
dition, whereas the supply of special parts began to decline after April 1944, the supply of machinery parts continued to increase until September 1944. However, the supply of machinery parts declined very sharply from October 1944, and consequently the index of machinery parts supply fell relative to the supply of special parts. The fact that the increase in special parts supply was lower than that of machinery parts is consistent with the recognition that special parts were the binding constraint of production. The timing of the decline in production and the special parts supply supports this view. Meanwhile, in early 1944, machinery parts supply was still increasing.
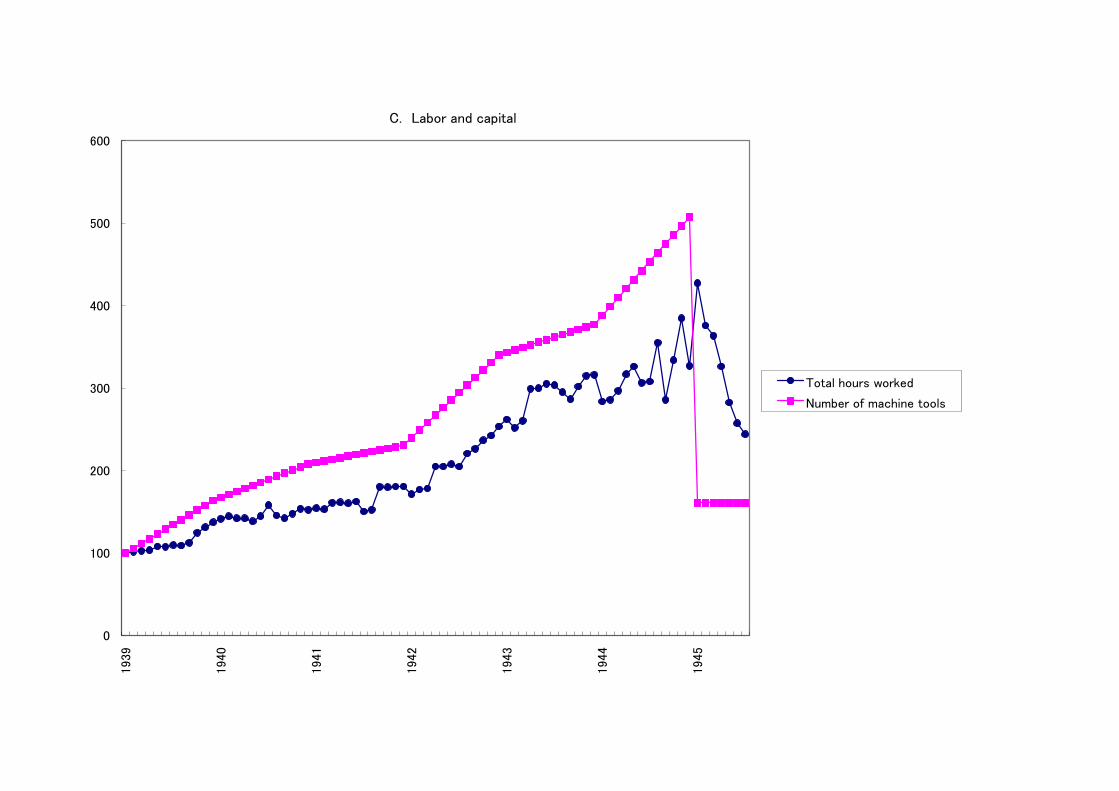
On the other hand, the total hours worked continued to increase until the end of 1944 (Figure 3-C). As “Fact
from other sources. The archives of the NAW hold a series titled “Report on the Present State of the Factory.” From these documents, we can take the data on the number of machine tools at No. 5 Works in November 1938, April 1940, April 1941, October 1941, December 1941, January 1942, February 1942, March 1942, April 1942, July 1942, September 1942, December 1942 and March 1944. In addition, the manuscript of the history of aircraft production by MHI provides the number of machine tools in December 1944 and July 1945. 44 By these data and linear interpolation, we obtain a monthly time series of the number of machine tools at No. 5 Works. 45 As shown in Figure 3-C, the number of machine tools continued to increase until the end of 1944.
From the above observations of Figures 3-A, 3-B and 3-C, we can say that the mobilization of the labor force,
lier network raised the upper limit of airframe production at No. 5 Works, and within the upper limit, the supply of special parts, whose increase was relatively slow, provided the binding constraint. Then, the situation changed after the end of 1944. When production declined sharply in December 1944, the decline in the supply of special parts was moderate. In addition, when production started to recover in February 1945, the supply of special parts did not increase. In contrast, the supply of machinery parts declined sharply in December 1944. It is true that the equipment declined sharply as well, but the extent of the decline was still relatively moderate compared with that of machinery parts supply. These facts suggest that the sharp decline in production after the end of 1944 was basically a result of the decline of machinery parts supply, and after that machinery parts supply was the binding constraint in production. In summary, during the war, the supply of special parts was basically the binding constraint in production, while during the last phase of the war, the supply of machinery parts became the binding constraint causing a sharp decline in production.
We examine this view and evaluate the impact of changes in parts supply by regression analysis.
uction function as follows:
Yt = A*SPt*MPt
*Ltγ*Kt
44 This manuscript was prepared by the headquarters of MHI in 1947 and is included in “Materials for the History of Mitsubishi Heavy Industries” held at the headquarters of MHI. As the data for December 1944 include all of the machine tools at NAW, we estimate the data for No. 5 Works based on its share in March 1944. 45 We assumed that the decline in equipment between December 1944 and July 1945 occurred all at once in January 1945 because of the bombing and the earthquake.
10
where Yt, A, SPt, MPt, Lt, Kt denote production, technology level, special parts supply,
LN(Yt/Y t–3) = LN(SPt/SP t–3) + LN(MPt/MPt–3) + γLN(Lt/LT t–3)
+ LN(Kt/K t–3) (2)
We estimate equation (2) by OLS. As Yt, we use production in terms of both num
the binding constraints over time, we split the obse
our observations from Figures 3-A, 3-B, and 3-C. T
Table 7 here
Figures 4-A and 4-B here
Ⅴ
machinery parts supply, total hours worked and equipment, respectively, and t indexes the month. From equation (1), we can derive the following equation on production change from month t–3 to month t.
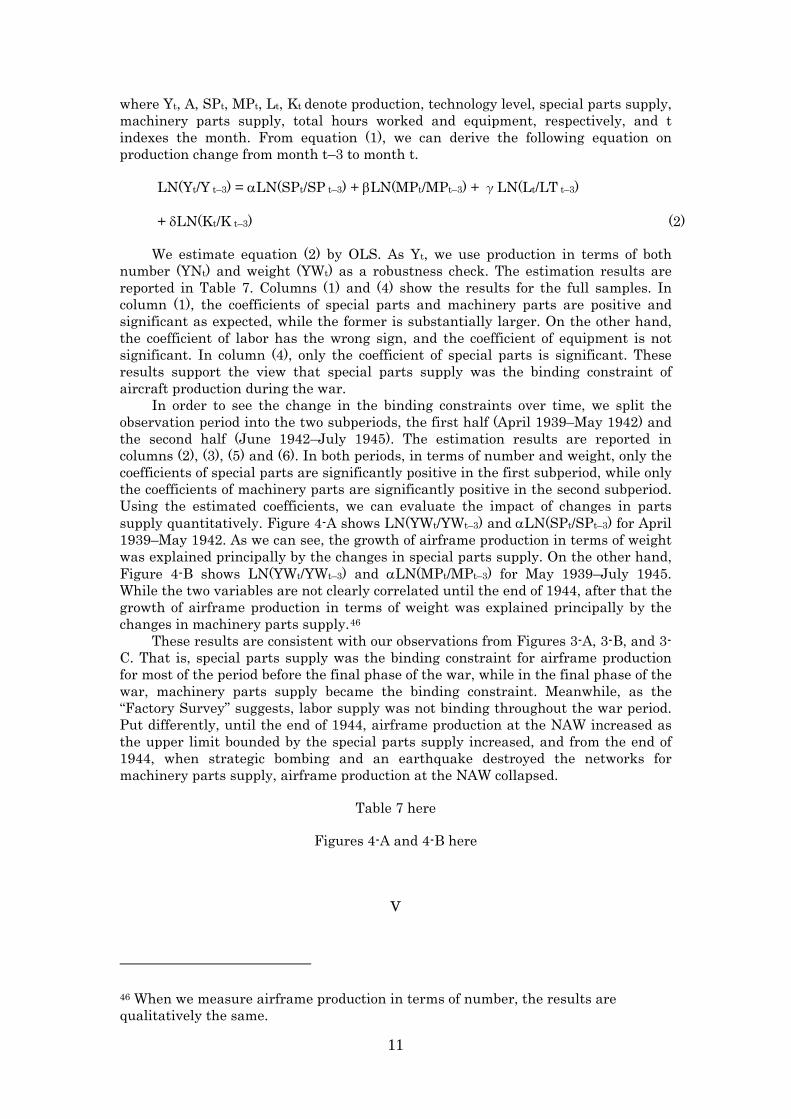
ber (YNt) and weight (YWt) as a robustness check. The estimation results are reported in Table 7. Columns (1) and (4) show the results for the full samples. In column (1), the coefficients of special parts and machinery parts are positive and significant as expected, while the former is substantially larger. On the other hand, the coefficient of labor has the wrong sign, and the coefficient of equipment is not significant. In column (4), only the coefficient of special parts is significant. These results support the view that special parts supply was the binding constraint of aircraft production during the war.
In order to see the change in rvation period into the two subperiods, the first half (April 1939–May 1942) and
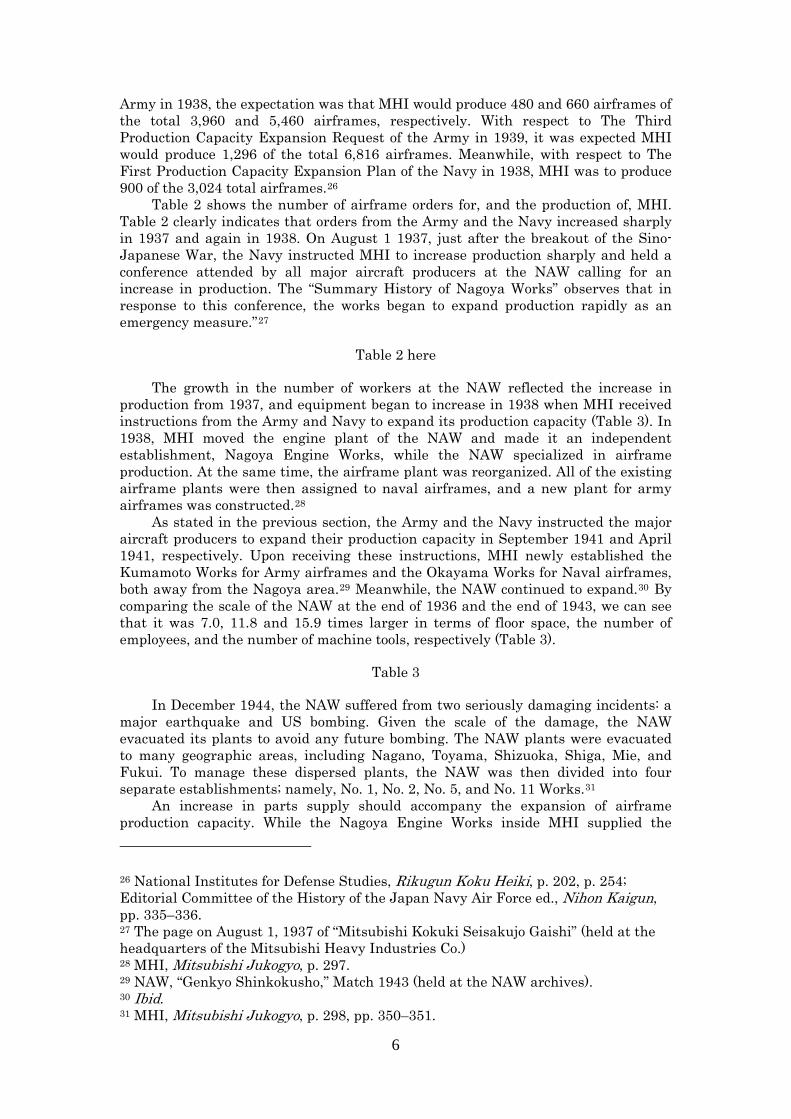
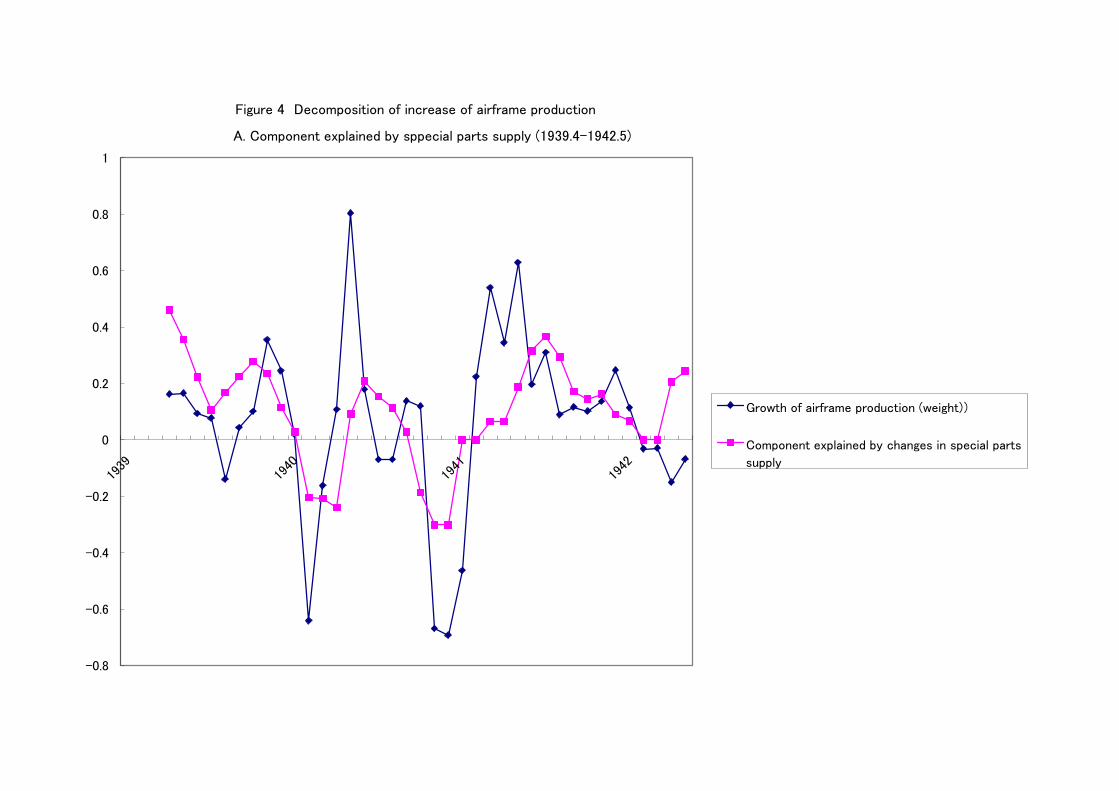
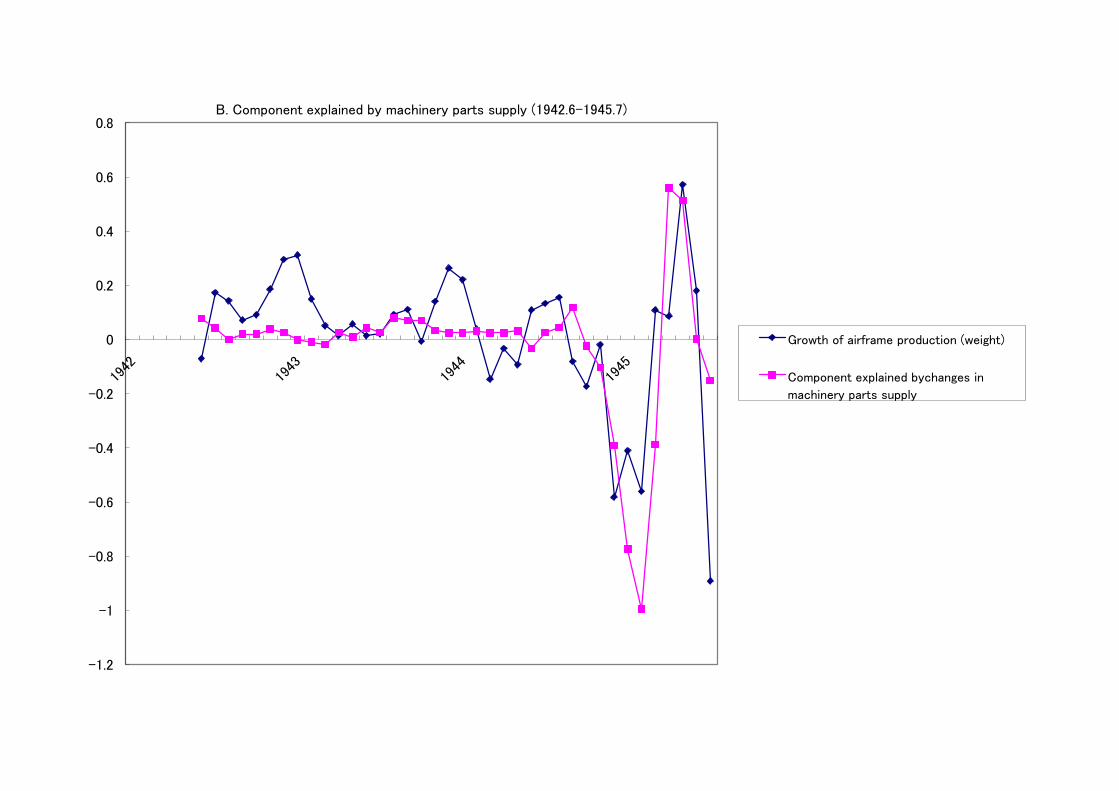
the second half (June 1942–July 1945). The estimation results are reported in columns (2), (3), (5) and (6). In both periods, in terms of number and weight, only the coefficients of special parts are significantly positive in the first subperiod, while only the coefficients of machinery parts are significantly positive in the second subperiod. Using the estimated coefficients, we can evaluate the impact of changes in parts supply quantitatively. Figure 4-A shows LN(YWt/YWt–3) and LN(SPt/SPt–3) for April 1939–May 1942. As we can see, the growth of airframe production in terms of weight was explained principally by the changes in special parts supply. On the other hand, Figure 4-B shows LN(YWt/YWt–3) and LN(MPt/MPt–3) for May 1939–July 1945. While the two variables are not clearly correlated until the end of 1944, after that the growth of airframe production in terms of weight was explained principally by the changes in machinery parts supply.46
These results are consistent withhat is, special parts supply was the binding constraint for airframe production
for most of the period before the final phase of the war, while in the final phase of the war, machinery parts supply became the binding constraint. Meanwhile, as the “Factory Survey” suggests, labor supply was not binding throughout the war period. Put differently, until the end of 1944, airframe production at the NAW increased as the upper limit bounded by the special parts supply increased, and from the end of 1944, when strategic bombing and an earthquake destroyed the networks for machinery parts supply, airframe production at the NAW collapsed.
46 When we measure airframe production in terms of number, the results are qualitatively the same.
11
The rapid growth of the Japanese aircraft industry during World War II has attracted the interest of many researchers since immediately after the end of the war. In this paper, we explored the source of this growth by focusing on the No. 5 Works of Mitsubishi Heavy Industries Co. Our findings indicate that the supply of basic inputs increased sharply and that the labor force and equipment, once effectively mobilized and expanded, were not binding constraints on production. The supply of machinery parts from medium and small suppliers was also not a binding constraint, at least until the final phase of the war. In fact, the binding constraint on aircraft production was the supply of special parts from large firms. Put differently, the expansion of production at No. 5 Works took place with an increase in the supply of special parts. In turn, the increase in the supply of special parts and the more rapid increase in the supply of machinery parts were achieved through an expansion in the supplier network, in terms of both the number of suppliers and the geographical area where they were located. In this sense, extensive specialization among firms was a basis for rapid expansion of the Japanese aircraft industry during World War II. Correspondingly, destruction of supplier networks caused a decline in aircraft production in the later phase of the war. That is, airframe production began to fall because of the decline in special parts supply from early 1944, and it was finally destroyed by a sharp decline in the supply of machinery parts at the end of 1944.
As stated in the introduction, Budrass et al. stressed that outsourcing was one of the major factors of production and productivity growth in the German armament industry during World War II. In this paper, we revealed that outsourcing also played a key role in aircraft production in wartime Japan and contributed to an “armament miracle” there. It is remarkable that outsourcing was based on a network of many small firms as well as large firms in Japan. This point is related to another strand of literature; namely, the literature on the evolution of institutions and organizations. Okazaki and Okuno-Fujiwara argued that systemic changes in institutions and organizations occurred in wartime Japan, including regulations, industrial associations, financial systems, corporate governance, production organizations, and labor relations, and that these changes generated path dependence in the postwar period.47 Concerning the production organization, Minato and Nishiguch pointed out that the supplier system that characterizes the postwar development of the Japanese automobile industry has a historical origin in the wartime experience.48 This paper contributed to this strand of literature in that it has made clear the actual features and workings of a supplier network.
Footnote references Budrass, L. J. Schrener and J. Streb, “Fixed Price Contracts, Learning, and
Outsourcing: Explaining the Continuous Growth of Output and Labor Productivity in the German Aircraft Industry during the Second World War, The Economic History Review, 63(1) (2010), pp.107-135.
Cohen, J. B., Japan’s Economy in War and Reconstruction (Minneapolis, 1949). Editorial Committee of the History of the Japan Navy Air Force (Nihon Kaigun
Kokushi Hensan Iinkai) ed., Nihon Kaigun Kokushi (History of the Japan Navy Air Force), vol.3 (Tokyo, 1969).
Hara, A., “Senji Tosei,” (Wartime Economic Control) in Takafusa Nakamura ed. ‘Keikakuka’ to ‘Minshuka’ (‘Planning’ and ‘Democratization’) (Tokyo, 1989), pp.69-105
47 Okazaki, “’’Voice’”; Okazaki and Okuno-Fujiwara, “Japan’s”; Okazaki and Okuno-Fujiwara, “Evolution.” 48 Minato, ”Ryotaisenkan”; Nishiguch, Strategic, pp.31–44.
12
Kasai, M., “Senjika niokeru Kokuki Sangyo no Kenkyu Kaihatsu to Seisan Shisutemu: A Case of the Aircraft Section of Mitsubishi), Nagoya Gakuin Daigaku Ronshu (Volumes of Social Sciences), 37(3) (2001), pp.93-103.
Maeda, H., Senjiki Kokuki Kogyo to Fukao Junji (Wartime Aircraft Industry and Junji Fukao”) (Tokyo, 2001).
Minato, T. “Ryotaisenkan niokeru Nihongata Shitauke Seisan Shisutemu no Tenkai Katei” (Development of the Japanese Type Subcontracting System between the Two World Wars) Aoyama Kokusai Seikei Ronshu, 7 (1987), pp.87-118.
Ministry of International Trade and Industry (Tsusho Sangyo Sho) ed. Kogyo Tokei 50nen Shi (50 Years History of Census of Manufactures) (Tokyo, 1961).
Mitsubishi Heavy Industries Co.(Mitsubishi Jukogyo Kabushikigaisha), Mitsubishi Jukogyo Kabushigaiha Shi (History of Mitsubishi Heavy Industries Co.) (Tokyo, 1956).
National Institutes for Defense Studies (Boei Cho Boei Kenshujo), Rikugun Koku Heiki no Kaihatsu, Seisan, Hokyu (Development, Production and Distribution of Army Aircrafts) (Tokyo, 1975) .
National Institute for Defense Studies (Boei Cho Boei Kenshujo), Kaigun Koku Gaishi (Outline History of the Navy Air Force) (Tokyo, 1976).
Nishiguchi, T., Strategic Industrial Sourcing: The Japanese Advantage (Oxford, 1994).
Okazaki, T., “Nihon: Senji Keizai to Keizai Shisutemu no Tenkan” (Japan: War Economy and Transformation of the Economic System), Shakai Keizai Shigaku, (Socio-Economic History) 60(1) (1994), pp.10-41.
Okazaki, T., “’Voice’ and ‘Exit’ in Japanese Firms during the Second World War: Sanpo Revisited,” Economic History Review 59(2), pp. 374-395.
Okazaki, T. and M. Okuno-Fujiwara, “Evolution of Economic Systems: The Case of Japan,” in Y. Hayami and M. Aoki eds., The Institutional Foundations of East Asian Development (London, 1998), pp. 482-521.
Okazaki, T. and M. Okuno-Fujiwara, “Japan’s Present-Day Economic System and Its Historical Origins,” in T. Okazaki and M. Okuno-Fujiwara eds. The Japanese Economic System and Its Historical Origins (Oxford, 1999), pp. 1-37.
Overy, R. J., War and Economy in the Third Reich (Oxford, 1994). Rockoff, H., “The United States: From Ploughshares to Swords,” in Mark Harrison ed., The Economics of World War Ⅱ : Six Great Powers in International Comparison (Cambridge, 1998) , pp. 81-121.
Sasaki, S., Kagakuteki Kanri no Nihonteki Tenkai (Japanese Style Development of Scientific Management) (Tokyo, 1998).
Takahashi, Y., Nakajima Hikoki no Kenkyu (Research on Nakajima Aircraft Co.) (Tokyo, 1988).
Toyo Keizai Shinposha, Showa Sangyo Shi (Industrial History of Showa Era), vol.1 (Tokyo, 1950).
Toyo Keizai Shinposha, Kanketsu Showa Kokusei Soran (Complete Statistical Handbook of Showa Era) (Tokyo, 1991).
Ueda, H., Senjiki Nihon no Shitauke Kogyo: Chusho Kigyo to ‘Shitauke=Kyoryoku Kogyo’ Seisaku, (Subcontractors in Wartime Japan: Medium and Small-sized Firms and ‘Subcontractors=Cooperative Factories’ Policy), (Kyoto, 2004).
United States Strategic Bombing Survey, “Final Reports of the United States Strategic Bombing Survey,” Aircraft division (1947).
Wada, K., “Nihon niokeru ‘Nagare Sagyo’ Hoshiki no Tenkai: Toyota Seisan Hoshiki no Rikai no Tameni,” 1・2 (Development of ‘Production Line System’ in Japan: For Understanding the Toyota Production System), Keizaigaku Ronshu, 61(3・4)(1995), pp.20-40, pp.94-117.
Yamamoto, K. Nihon niokeru Shokuba no Gijutsu Rodo Shi (History of Technology and Work on the Japanese Shop Floor) (Tokyo, 1994)
13
14
Yamazaki, S., “Taiheiyo Senso Kohanki niokeru Kokuki Zosan Seisaku,” (Production Expansion Policy in the Late Pacific War Period), Tochi Seido Shigaku, 130 (1991), pp. 16-34.
Yamazaki, S., “Taiheiyo Sensoki no Kogyo Doin Taisei,” (Industrial Mobilization System during the Pacific War), Keizai to Keizaigaku, 81 (1996), pp. 15-108.
0.0
10.0
20.0
30.0
40.0
50.0
60.0
0
500,000
1,000,000
1,500,000
2,000,000
2,500,000
3,000,000
Number of employees
Percentage in the manufacturing industry
Note: See the text.
Persons %Figure 1 Growth of machinery industry
0
500
1,000
1,500
2,000
2,500
3,000
Figure 2 Monthly airframe production
Source:USSBS, "Final report," p.161;Toyo Keizai Shinposha, Showa, p.608。
Note:The monthly production before 1940 was estimated by interpolation, assuming that avarage
monthly
0
100
200
300
400
500
600
700
airframe production
airframe production (weight)
Figure 3 Airframe production and supply of inputs at No.5 Works of NAW(1939.1=100)
A. Production
0
100
200
300
400
500
600
700
800
900
1,000
Special parts
Machinery parts
B. Parts supply
0
100
200
300
400
500
6001939
1940
1941
1942
1943
1944
1945
Total hours worked
Number of machine tools
C. Labor and capital
-0.8
-0.6
-0.4
-0.2
0
0.2
0.4
0.6
0.8
1
Growth of airframe production (weight))
Component explained by changes in special parts
supply
Figure 4 Decomposition of increase of airframe production
A. Component explained by sppecial parts supply (1939.4-1942.5)
-1.2
-1
-0.8
-0.6
-0.4
-0.2
0
0.2
0.4
0.6
0.8
Growth of airframe production (weight)
Component explained bychanges in
machinery parts supply
B. Component explained by machinery parts supply (1942.6-1945.7)
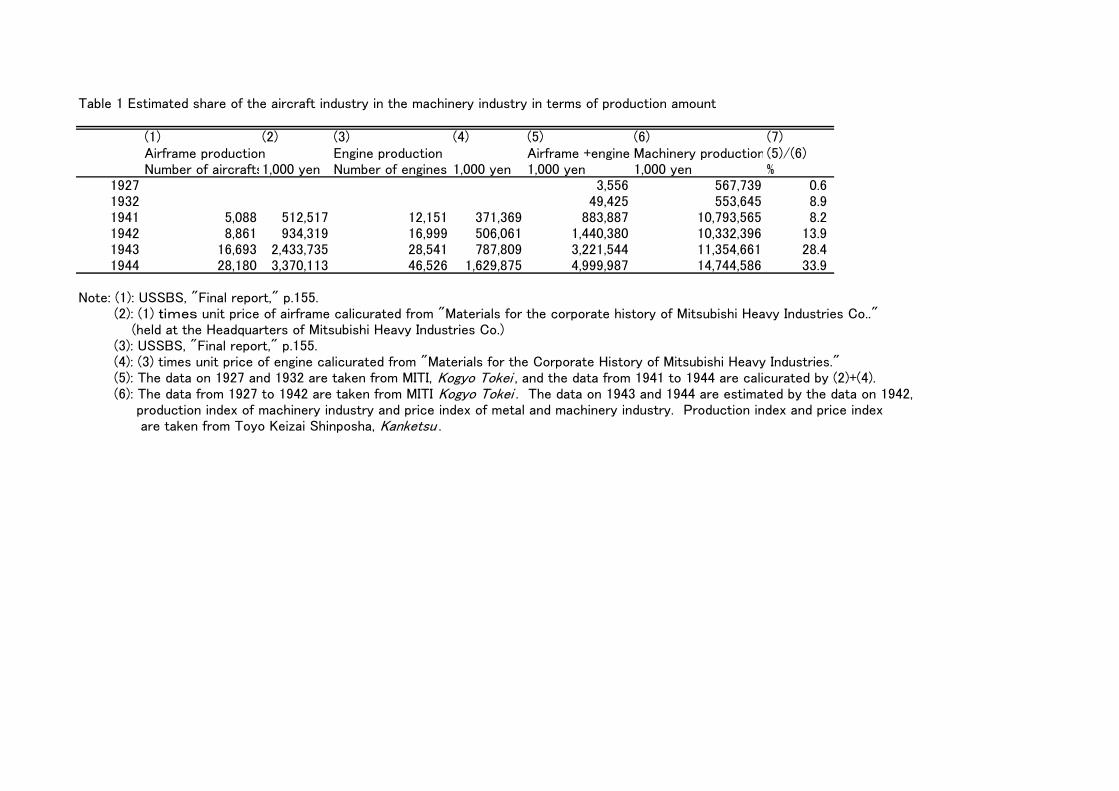
Table 1 Estimated share of the aircraft industry in the machinery industry in terms of production amount
(1) (2) (3) (4) (5) (6) (7)Airframe production Engine production Airframe +engine Machinery production (5)/(6)Number of aircrafts1,000 yen Number of engines 1,000 yen 1,000 yen 1,000 yen %
1927 3,556 567,739 0.61932 49,425 553,645 8.91941 5,088 512,517 12,151 371,369 883,887 10,793,565 8.21942 8,861 934,319 16,999 506,061 1,440,380 10,332,396 13.91943 16,693 2,433,735 28,541 787,809 3,221,544 11,354,661 28.41944 28,180 3,370,113 46,526 1,629,875 4,999,987 14,744,586 33.9
Note: (1): USSBS, "Final report," p.155. (2): (1) times unit price of airframe calicurated from "Materials for the corporate history of Mitsubishi Heavy Industries Co.." (held at the Headquarters of Mitsubishi Heavy Industries Co.) (3): USSBS, "Final report," p.155. (4): (3) times unit price of engine calicurated from "Materials for the Corporate History of Mitsubishi Heavy Industries." (5): The data on 1927 and 1932 are taken from MITI, Kogyo Tokei , and the data from 1941 to 1944 are calicurated by (2)+(4). (6): The data from 1927 to 1942 are taken from MITI Kogyo Tokei . The data on 1943 and 1944 are estimated by the data on 1942, production index of machinery industry and price index of metal and machinery industry. Production index and price index are taken from Toyo Keizai Shinposha, Kanketsu .
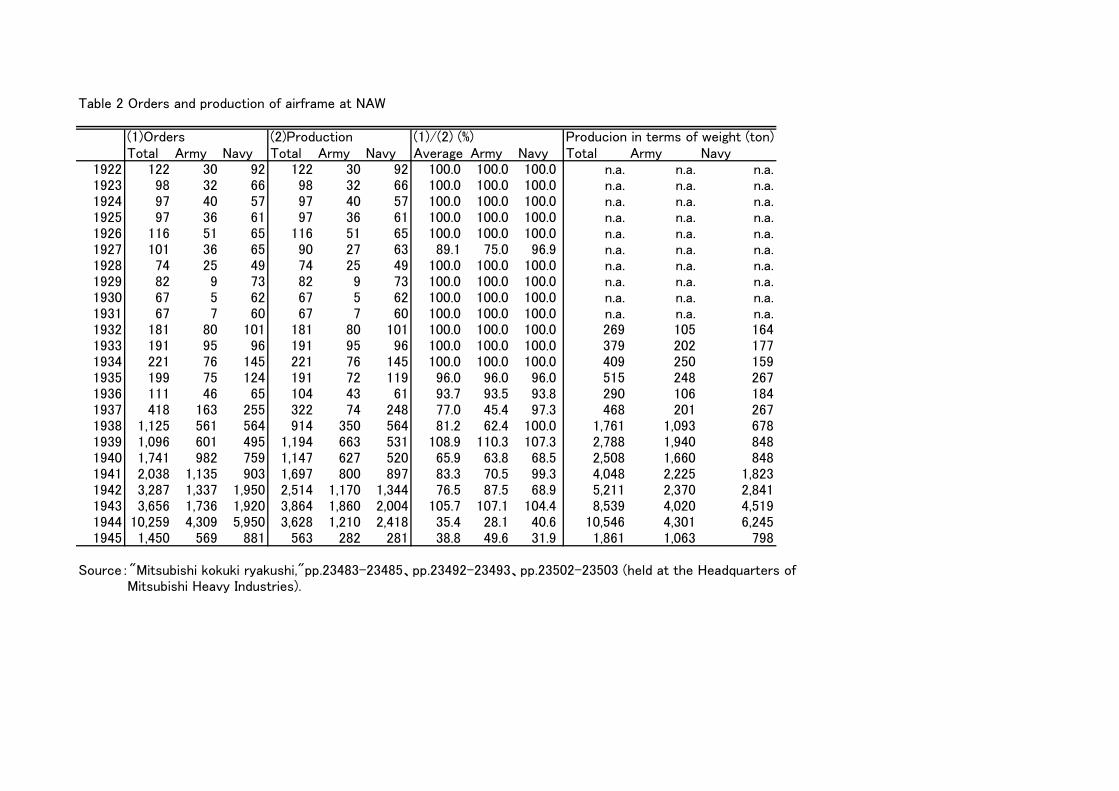
Table 2 Orders and production of airframe at NAW
(1)Orders (2)Production (1)/(2) (%) Producion in terms of weight (ton)Total Army Navy Total Army Navy Average Army Navy Total Army Navy
1922 122 30 92 122 30 92 100.0 100.0 100.0 n.a. n.a. n.a.1923 98 32 66 98 32 66 100.0 100.0 100.0 n.a. n.a. n.a.1924 97 40 57 97 40 57 100.0 100.0 100.0 n.a. n.a. n.a.1925 97 36 61 97 36 61 100.0 100.0 100.0 n.a. n.a. n.a.1926 116 51 65 116 51 65 100.0 100.0 100.0 n.a. n.a. n.a.1927 101 36 65 90 27 63 89.1 75.0 96.9 n.a. n.a. n.a.1928 74 25 49 74 25 49 100.0 100.0 100.0 n.a. n.a. n.a.1929 82 9 73 82 9 73 100.0 100.0 100.0 n.a. n.a. n.a.1930 67 5 62 67 5 62 100.0 100.0 100.0 n.a. n.a. n.a.1931 67 7 60 67 7 60 100.0 100.0 100.0 n.a. n.a. n.a.1932 181 80 101 181 80 101 100.0 100.0 100.0 269 105 1641933 191 95 96 191 95 96 100.0 100.0 100.0 379 202 1771934 221 76 145 221 76 145 100.0 100.0 100.0 409 250 1591935 199 75 124 191 72 119 96.0 96.0 96.0 515 248 2671936 111 46 65 104 43 61 93.7 93.5 93.8 290 106 1841937 418 163 255 322 74 248 77.0 45.4 97.3 468 201 2671938 1,125 561 564 914 350 564 81.2 62.4 100.0 1,761 1,093 6781939 1,096 601 495 1,194 663 531 108.9 110.3 107.3 2,788 1,940 8481940 1,741 982 759 1,147 627 520 65.9 63.8 68.5 2,508 1,660 8481941 2,038 1,135 903 1,697 800 897 83.3 70.5 99.3 4,048 2,225 1,8231942 3,287 1,337 1,950 2,514 1,170 1,344 76.5 87.5 68.9 5,211 2,370 2,8411943 3,656 1,736 1,920 3,864 1,860 2,004 105.7 107.1 104.4 8,539 4,020 4,5191944 10,259 4,309 5,950 3,628 1,210 2,418 35.4 28.1 40.6 10,546 4,301 6,2451945 1,450 569 881 563 282 281 38.8 49.6 31.9 1,861 1,063 798
Source:"Mitsubishi kokuki ryakushi,"pp.23483-23485、pp.23492-23493、pp.23502-23503 (held at the Headquarters of Mitsubishi Heavy Industries).
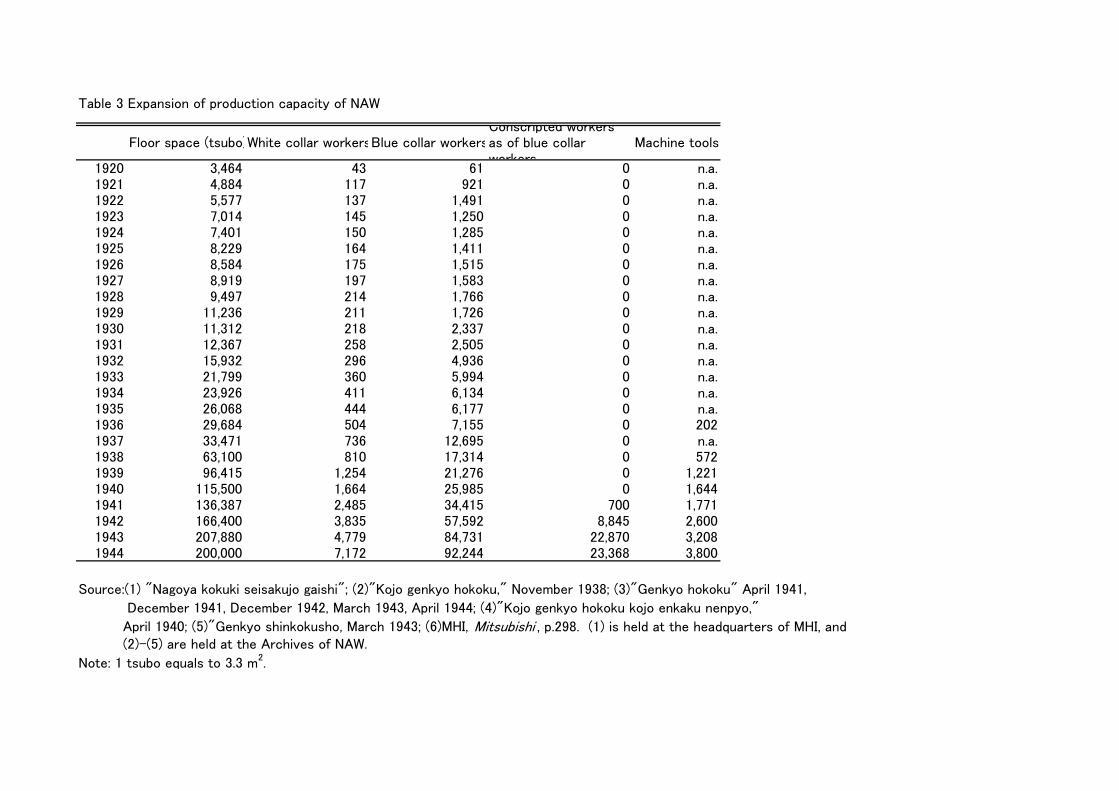
Table 3 Expansion of production capacity of NAW
Floor space (tsubo)White collar workersBlue collar workersConscripted workersas of blue collarworkers
Machine tools
1920 3,464 43 61 0 n.a.1921 4,884 117 921 0 n.a.1922 5,577 137 1,491 0 n.a.1923 7,014 145 1,250 0 n.a.1924 7,401 150 1,285 0 n.a.1925 8,229 164 1,411 0 n.a.1926 8,584 175 1,515 0 n.a.1927 8,919 197 1,583 0 n.a.1928 9,497 214 1,766 0 n.a.1929 11,236 211 1,726 0 n.a.1930 11,312 218 2,337 0 n.a.1931 12,367 258 2,505 0 n.a.1932 15,932 296 4,936 0 n.a.1933 21,799 360 5,994 0 n.a.1934 23,926 411 6,134 0 n.a.1935 26,068 444 6,177 0 n.a.1936 29,684 504 7,155 0 2021937 33,471 736 12,695 0 n.a.1938 63,100 810 17,314 0 5721939 96,415 1,254 21,276 0 1,2211940 115,500 1,664 25,985 0 1,6441941 136,387 2,485 34,415 700 1,7711942 166,400 3,835 57,592 8,845 2,6001943 207,880 4,779 84,731 22,870 3,2081944 200,000 7,172 92,244 23,368 3,800
Source:(1) "Nagoya kokuki seisakujo gaishi"; (2)"Kojo genkyo hokoku," November 1938; (3)"Genkyo hokoku" April 1941,
December 1941, December 1942, March 1943, April 1944; (4)"Kojo genkyo hokoku kojo enkaku nenpyo,"
April 1940; (5)"Genkyo shinkokusho, March 1943; (6)MHI, Mitsubishi , p.298. (1) is held at the headquarters of MHI, and (2)-(5) are held at the Archives of NAW.
Note: 1 tsubo equals to 3.3 m2.
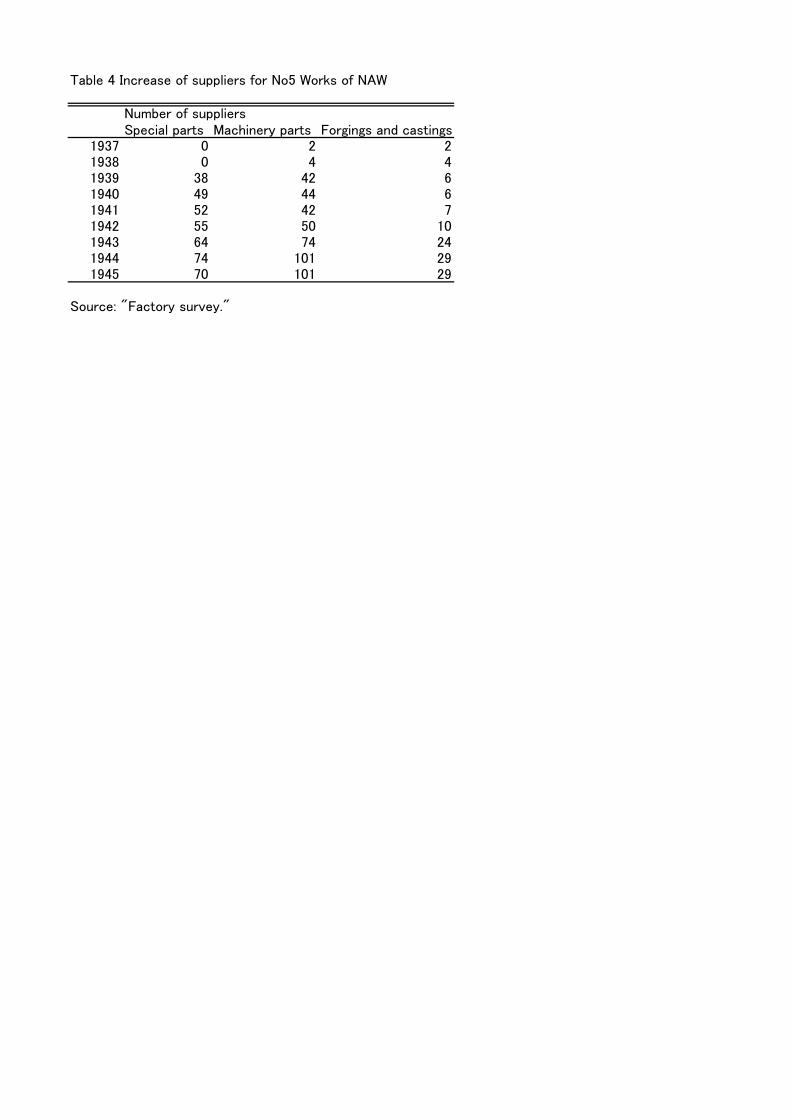
Table 4 Increase of suppliers for No5 Works of NAW
Number of suppliersSpecial parts Machinery parts Forgings and castings
1937 0 2 21938 0 4 41939 38 42 61940 49 44 61941 52 42 71942 55 50 101943 64 74 241944 74 101 291945 70 101 29
Source: "Factory survey."
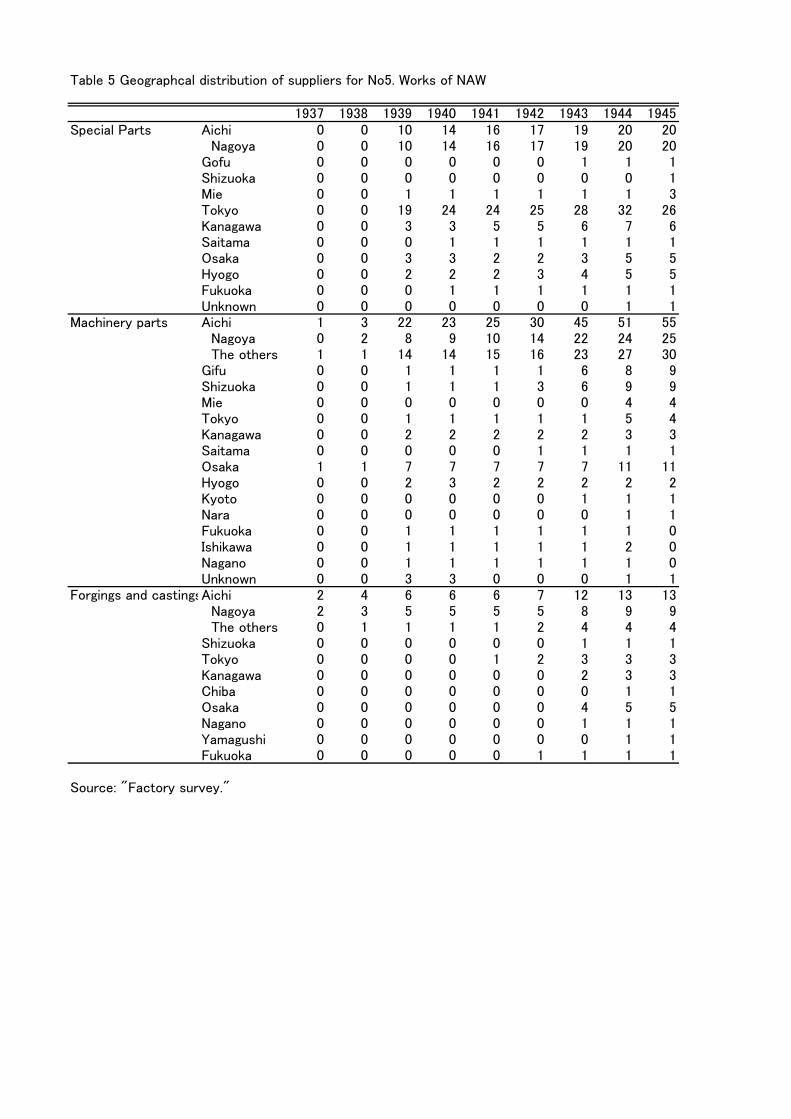
Table 5 Geographcal distribution of suppliers for No5. Works of NAW
1937 1938 1939 1940 1941 1942 1943 1944 1945Special Parts Aichi 0 0 10 14 16 17 19 20 20
Nagoya 0 0 10 14 16 17 19 20 20Gofu 0 0 0 0 0 0 1 1 1Shizuoka 0 0 0 0 0 0 0 0 1Mie 0 0 1 1 1 1 1 1 3Tokyo 0 0 19 24 24 25 28 32 26Kanagawa 0 0 3 3 5 5 6 7 6Saitama 0 0 0 1 1 1 1 1 1Osaka 0 0 3 3 2 2 3 5 5Hyogo 0 0 2 2 2 3 4 5 5Fukuoka 0 0 0 1 1 1 1 1 1Unknown 0 0 0 0 0 0 0 1 1
Machinery parts Aichi 1 3 22 23 25 30 45 51 55 Nagoya 0 2 8 9 10 14 22 24 25 The others 1 1 14 14 15 16 23 27 30Gifu 0 0 1 1 1 1 6 8 9Shizuoka 0 0 1 1 1 3 6 9 9Mie 0 0 0 0 0 0 0 4 4Tokyo 0 0 1 1 1 1 1 5 4Kanagawa 0 0 2 2 2 2 2 3 3Saitama 0 0 0 0 0 1 1 1 1Osaka 1 1 7 7 7 7 7 11 11Hyogo 0 0 2 3 2 2 2 2 2Kyoto 0 0 0 0 0 0 1 1 1Nara 0 0 0 0 0 0 0 1 1Fukuoka 0 0 1 1 1 1 1 1 0Ishikawa 0 0 1 1 1 1 1 2 0Nagano 0 0 1 1 1 1 1 1 0Unknown 0 0 3 3 0 0 0 1 1
Forgings and castingsAichi 2 4 6 6 6 7 12 13 13 Nagoya 2 3 5 5 5 5 8 9 9 The others 0 1 1 1 1 2 4 4 4Shizuoka 0 0 0 0 0 0 1 1 1Tokyo 0 0 0 0 1 2 3 3 3Kanagawa 0 0 0 0 0 0 2 3 3Chiba 0 0 0 0 0 0 0 1 1Osaka 0 0 0 0 0 0 4 5 5Nagano 0 0 0 0 0 0 1 1 1Yamagushi 0 0 0 0 0 0 0 1 1Fukuoka 0 0 0 0 0 1 1 1 1
Source: "Factory survey."
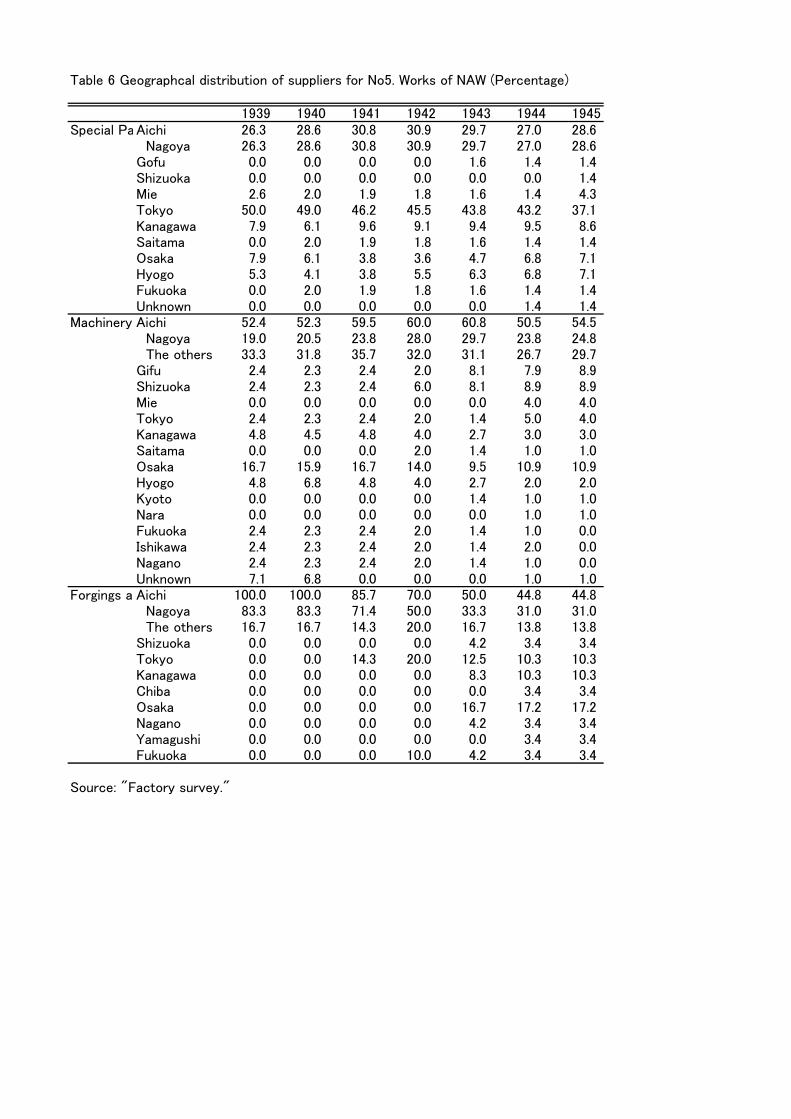
Table 6 Geographcal distribution of suppliers for No5. Works of NAW (Percentage)
1939 1940 1941 1942 1943 1944 1945Special PaAichi 26.3 28.6 30.8 30.9 29.7 27.0 28.6
Nagoya 26.3 28.6 30.8 30.9 29.7 27.0 28.6Gofu 0.0 0.0 0.0 0.0 1.6 1.4 1.4Shizuoka 0.0 0.0 0.0 0.0 0.0 0.0 1.4Mie 2.6 2.0 1.9 1.8 1.6 1.4 4.3Tokyo 50.0 49.0 46.2 45.5 43.8 43.2 37.1Kanagawa 7.9 6.1 9.6 9.1 9.4 9.5 8.6Saitama 0.0 2.0 1.9 1.8 1.6 1.4 1.4Osaka 7.9 6.1 3.8 3.6 4.7 6.8 7.1Hyogo 5.3 4.1 3.8 5.5 6.3 6.8 7.1Fukuoka 0.0 2.0 1.9 1.8 1.6 1.4 1.4Unknown 0.0 0.0 0.0 0.0 0.0 1.4 1.4
Machinery Aichi 52.4 52.3 59.5 60.0 60.8 50.5 54.5 Nagoya 19.0 20.5 23.8 28.0 29.7 23.8 24.8 The others 33.3 31.8 35.7 32.0 31.1 26.7 29.7Gifu 2.4 2.3 2.4 2.0 8.1 7.9 8.9Shizuoka 2.4 2.3 2.4 6.0 8.1 8.9 8.9Mie 0.0 0.0 0.0 0.0 0.0 4.0 4.0Tokyo 2.4 2.3 2.4 2.0 1.4 5.0 4.0Kanagawa 4.8 4.5 4.8 4.0 2.7 3.0 3.0Saitama 0.0 0.0 0.0 2.0 1.4 1.0 1.0Osaka 16.7 15.9 16.7 14.0 9.5 10.9 10.9Hyogo 4.8 6.8 4.8 4.0 2.7 2.0 2.0Kyoto 0.0 0.0 0.0 0.0 1.4 1.0 1.0Nara 0.0 0.0 0.0 0.0 0.0 1.0 1.0Fukuoka 2.4 2.3 2.4 2.0 1.4 1.0 0.0Ishikawa 2.4 2.3 2.4 2.0 1.4 2.0 0.0Nagano 2.4 2.3 2.4 2.0 1.4 1.0 0.0Unknown 7.1 6.8 0.0 0.0 0.0 1.0 1.0
Forgings a Aichi 100.0 100.0 85.7 70.0 50.0 44.8 44.8 Nagoya 83.3 83.3 71.4 50.0 33.3 31.0 31.0 The others 16.7 16.7 14.3 20.0 16.7 13.8 13.8Shizuoka 0.0 0.0 0.0 0.0 4.2 3.4 3.4Tokyo 0.0 0.0 14.3 20.0 12.5 10.3 10.3Kanagawa 0.0 0.0 0.0 0.0 8.3 10.3 10.3Chiba 0.0 0.0 0.0 0.0 0.0 3.4 3.4Osaka 0.0 0.0 0.0 0.0 16.7 17.2 17.2Nagano 0.0 0.0 0.0 0.0 4.2 3.4 3.4Yamagushi 0.0 0.0 0.0 0.0 0.0 3.4 3.4Fukuoka 0.0 0.0 0.0 10.0 4.2 3.4 3.4
Source: "Factory survey."

Table 7
(1) (2) (3) (4) (5) (6)
Dependent variable LN(YNt/YNt-3) LN(YNt/YNt-3) LN(YNt/YNt-3) LN(YWt/YWt-3) LN(YWt/YWt-3) LN(YWt/YWt-3)
Sample period Full samples 1939.4-1942.5 1942.6-1945.7 Full samples 1939.4-1942.5 1942.6-1945.7LN(SPt/SPt-3) 0.803 *** 1.071 *** 0.512 0.714 ** 1.558 *** -0.026
(3.47) (3.61) (1.65) (2.20) (4.02) (-0.10)LN(MPt/MPt-3) 0.293 *** -0.228 0.347 *** 0.194 -0.284 0.373 ***
(3.88) (-1.32) (3.34) (1.63) (-1.19) (2.94)LN(Lt/Lt-3) -0.704 ** 0.053 -0.817 ** 0.241 -0.8 0.641
(-2.33) (0.15) (-2.10) (0.58) (-1.44) (1.33)LN(Kt/Kt-3) -0.136 -0.26 -0.034 -0.533 0.349 -0.558
(-0.31) (-0.45) (-0.06) (-1.09) (0.42) (-1.49)Number of obs. 76 38 38 76 38 38
R2 0.554 0.248 0.737 0.240 0.363 0.484
Note: Heteroskedasticity robust t-values in parentheses. ***: Statistically significant at 1% level. ** : Statistically significant at 5% level.