supporting online material for -...
TRANSCRIPT

www.sciencemag.org/cgi/content/full/332/6037/1571/DC1
Supporting Online Material for Inducing Sleep by Remote Control Facilitates Memory Consolidation in
Drosophila Jeffrey M. Donlea, Matthew S. Thimgan, Yasuko Suzuki, Laura Gottschalk, Paul J.
Shaw*
*To whom correspondence should be addressed. E-mail: [email protected]
Published 24 June 2011, Science 332, 1571 (2011) DOI: 10.1126/science.1200514
This PDF file includes:
Materials and Methods Figs. S1 to S16 Table S1 References
1
Supplemental Online Material
Materials and Methods
Flies
The flies were cultured at 25˚C with 50-60% relative humidity and kept on a diet
of yeast, dark corn syrup and agar under a 12-hour light:12-hour dark cycle.
104y, C5 and 78y flies were obtained from M. Heisenberg (University of
Wurzburg), Cs flies were obtained from T. Zars (University of Missouri), UAS-
NaChBac flies were obtained from A. Sehgal (University of Pennsylvania),
NP6510 and NP6561 flies were obtained from Drosophila Genetic Resource
Center (Kyoto Institute of Technology), and C232, UAS-TrpVr1 and UAS-TrpA1
flies were obtained from Bloomington Stock Center (Bloomington, Indiana).
Pharmacology
Caffeine was administered at dosages of 2.5 mg/mL or 7.5 mg/mL in standard fly
media starting at 8:00 AM (lights-on) for 1h at 25˚C. Sleep was then observed
while 104y/+>UAS-TrpA1/+ flies were housed at 31˚C for 2 hours. Caffeine was
delivered to 104y/+>UAS-NaChBac/+, UAS-NaChBac/+, and 104y/+ flies at 2.5
mg/mL in standard fly media and sleep was measured for the subsequent 2
hours.
Capsaicin was administered to 104y/+>UAS-TrpVr1/+ flies and to genetic
controls at 100 mM in standard fly media.
Immunohistochemistry

2
Brains were removed from the head casing and fixed in 4% paraformaldehyde in
phosphate buffer solution (PBS) (1.86 mM NaHPO, 8.41 mM NaHPO, and 175
mM NaCl) for 1 hour and washed in PBS. Following a 2- hour pre-incubation in
3% normal goat serum in PBS-TX (PBS containing 0.3% Triton X-100), brains
were washed in PBS-TX. Brains were incubated in the following primary antibody
concentrations in PBS-TX: 1:1000 Rabbit anti-GFP (Invitrogen), 1:100 Mouse
anti-TH (ImmunoStar), 1:1000 Rabbit anti-5HT (Sigma), 1:1000 Mouse anti-
ChAT (Developmental Studies Hybridoma Bank, University of Iowa), 1:1000
Rabbit anti-sNPF (Gift from P. Taghert, Washington University), 1:1000 Rabbit
anti-dTK (Gift from P. Taghert, Washington University), 1:100 Rabbit anti-
leucokinin (Gift from B. Al-Anzi, California Institute of Technology), 1:100 Rabbit
anti-LkR (Gift from B. Al-Anzi, California Institute of Technology), then washed in
PBS-TX and incubated in the appropriate fluorescent secondary antibodies
(Invitrogen). Confocal stacks were acquired with a 1µm slice thickness using a
laser scanning confocal microscope and processed. Synaptic terminal number
was quantified using an automated threshold algorithm.
Quantitative PCR
Total RNA was isolated from fly heads by using TRIzol following the
manufacturer’s protocol. Reverse-transcription (RT) reactions were carried out in
parallel on Dnase I-digested total RNA as described (29). RT products were
stored at –80˚C until use. PCRs to measure levels of artificial transcript were
performed to confirm uniformity of RT within sample groups and between

3
samples. All reverses were performed in triplicate. At least two quantitative PCR
replications were performed for each condition. Values were expressed as a
percentage of socially isolated animals and were evaluated by using a Student’s
T-Test.
Behavioral Analysis
Drosophila sleep and activity patterns were assessed as described previously
(29). In summary, flies were placed into individual 65 mm tubes and all activity
was continuously measured. Locomotor activity was measured in 1-minute bins
and sleep was defined as periods of quiescence lasting at least 5 minutes. Sleep
in mins/hour data is plotted as a function of zeitgeber time (ZT). That is, ZT0
represents the beginning of the fly’s subjective day (lights-on) and ZT12
represents the transition to the subjective night (lights-off).
Sleep Deprivation – 4-7 day old females were placed into individual 65 mm tubes
and the sleep-nullifying apparatus (SNAP) was used to sleep deprive these flies
for 12 hours during the dark phase (lights out to lights on) as previously
described (30). Sleep rebound was calculated for each individual as a ratio of the
minutes of sleep gained above baseline during recovery divided by the total
minutes of sleep lost during sleep deprivation (min gained/min lost).
Arousal Thresholds – 4-7 day old females were placed into individual 65 mm
tubes. Arousal was tested during the night by exposing flies to either a 1-min or
4
5-min long light pulse at ZT18. To test arousability during the day when lights
were on, flies were exposed to a physical perturbation using the SNAP. The
SNAP was activated for 1, 2, 3 or 5 cycles and the number of flies that were
awakened was tabulated.
Social Enrichment – 1-2 day old males were housed either in social isolation
(singly in 65mm tubes) or in an intensive socially enriched environment (with 90
siblings) for five days. Following 5 days, all flies were individually transferred to
fresh glass tubes for Courtship Conditioning LTM experiments.
Courtship Conditioning – Training for 4–8 day old males was based on previously
described methods (31). The males were exposed to pheromonally-feminized
Tai2 males in either a spaced training protocol consisting of three one-hour
training sessions, each separated by one hour, or a massed training protocol
consisting of one three-hour training session. Long-term memory was tested
forty-eight hours after the beginning of training, when trained and naive males
were exposed to Tai2 males for a 10-minute testing period. The Courtship Index
is defined as the percent of time that each subject male spends participating in
courtship behavior during the 10-minute testing period.
Statistics
All comparison were done using a Student’s t-test or, if appropriate, ANOVA and
subsequent modified Bonferroni comparisons unless otherwise stated. All

5
statistically different groups are defined as p < 0.05.
6
Figure S1

7
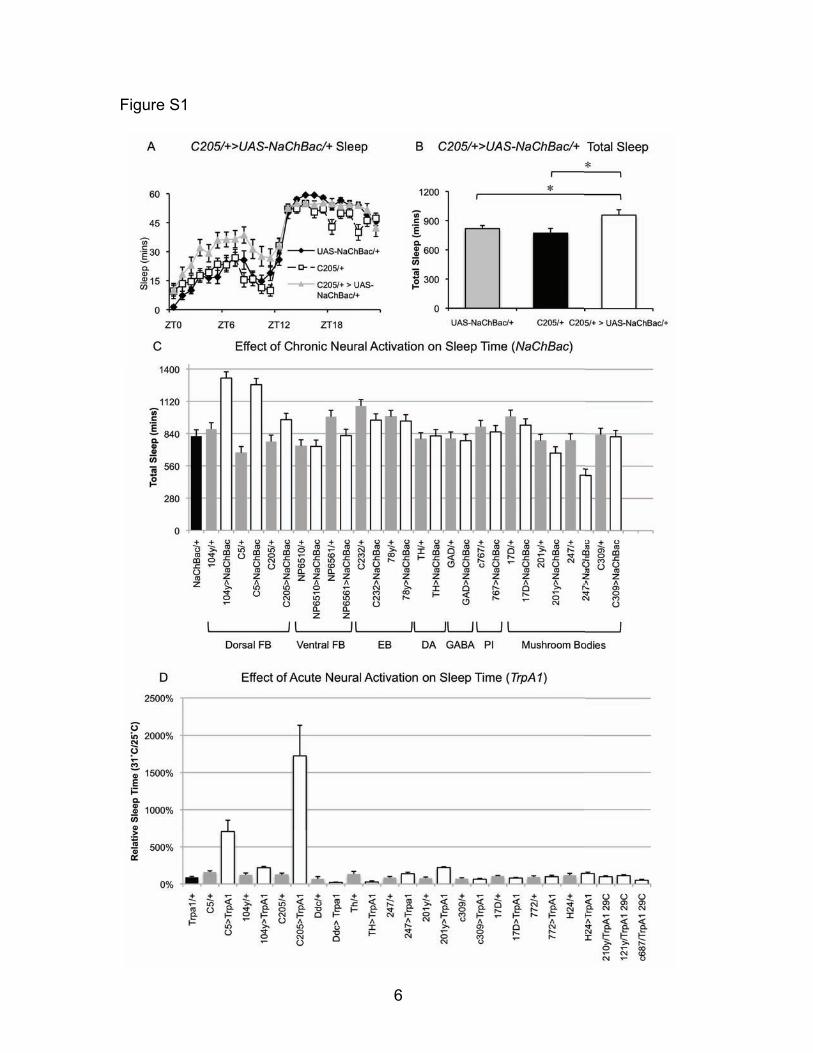
Figure S1 – Sleep during activation of neural circuits (A) Expressing UAS-NaChBac using C205-GAL4 increases sleep. Repeated measures ANOVA reveals a significant Genotype x Hour interaction (F(44,1058)=2.31, p=4.1x10⁻⁶, n=16 each group). (B) Total sleep time is increased in C205/+>UAS-NaChBac/+ flies compared to UAS-NaChBac/+ and C205/+ controls. One-way ANOVA reveals a significant main effect for genotype (F(2,45)=4.54, p=0.016, n=16 each group). * p<0.05 by modified Bonferroni test. (C) Total sleep time is increased when UAS-NaChBac is expressed using C5, 104y and C205. No increase in sleep is detected when UAS-NaChBac is expressed in the ventral FB using NP6510 or NP6561, in the EB using C232 or 78y, in dopaminergic neurons using TH-GAL4, in GABAergic neurong using GAD-GAL4, in the Pars Intercerebralis using C767, or in the Mushroom Bodies using 17D, 201y, 247, or C309. (D) Sleep is strongly increased during transient activation when TrpA1 is expressed using GAL4 drivers that express in the dorsal FB (C5, 104y, C205), but not using a variety of drivers that express in other neural clusters throughout the brain.
8
Figure S2

9
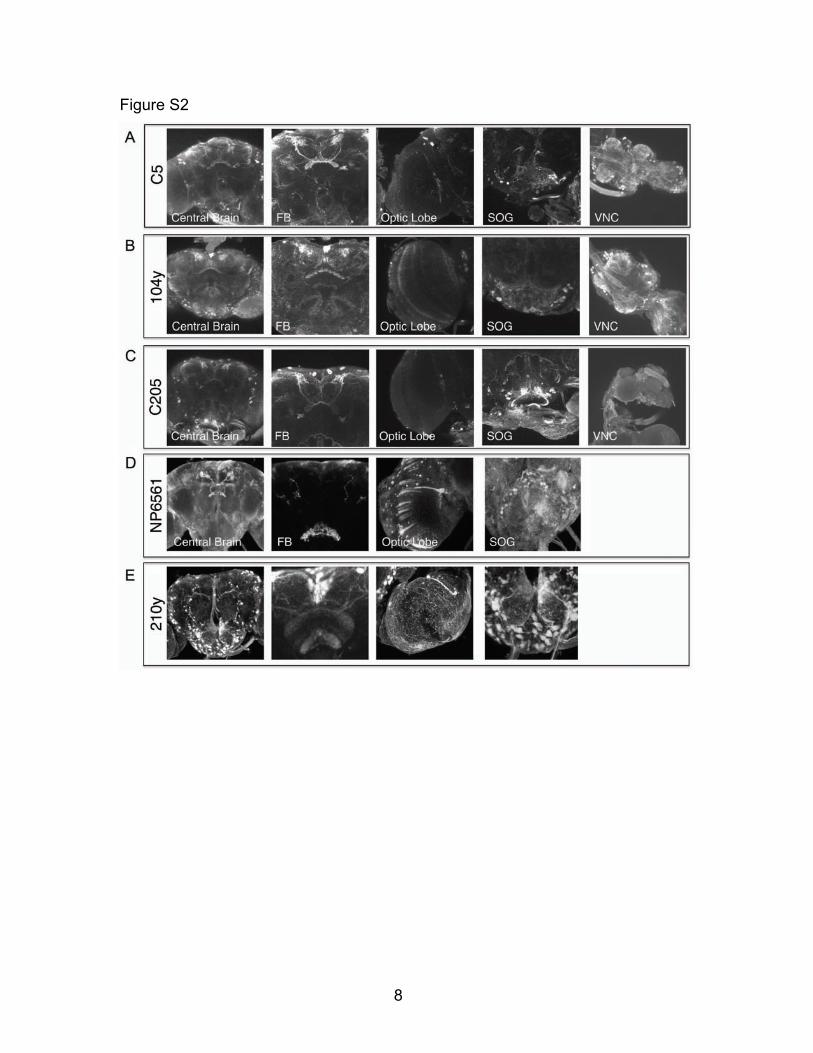
Figure S2- Expression patterns of utilized GAL4 drivers Expression of UAS-CD8:GFP under the control of C5 (A), 104y (B), C205 (C), NP6561 (D), and 210y (E) in the central brain, FB, optic lobes, suboesophogeal ganglion (SOG), and ventral nerve cord (VNC). Expression of C5, 104y, and C205 is present in a variety of cells throughout the CNS, but strongly overlap in the dorsal FB. Expression of NP6561 in the FB is limited to ventral strata.
10
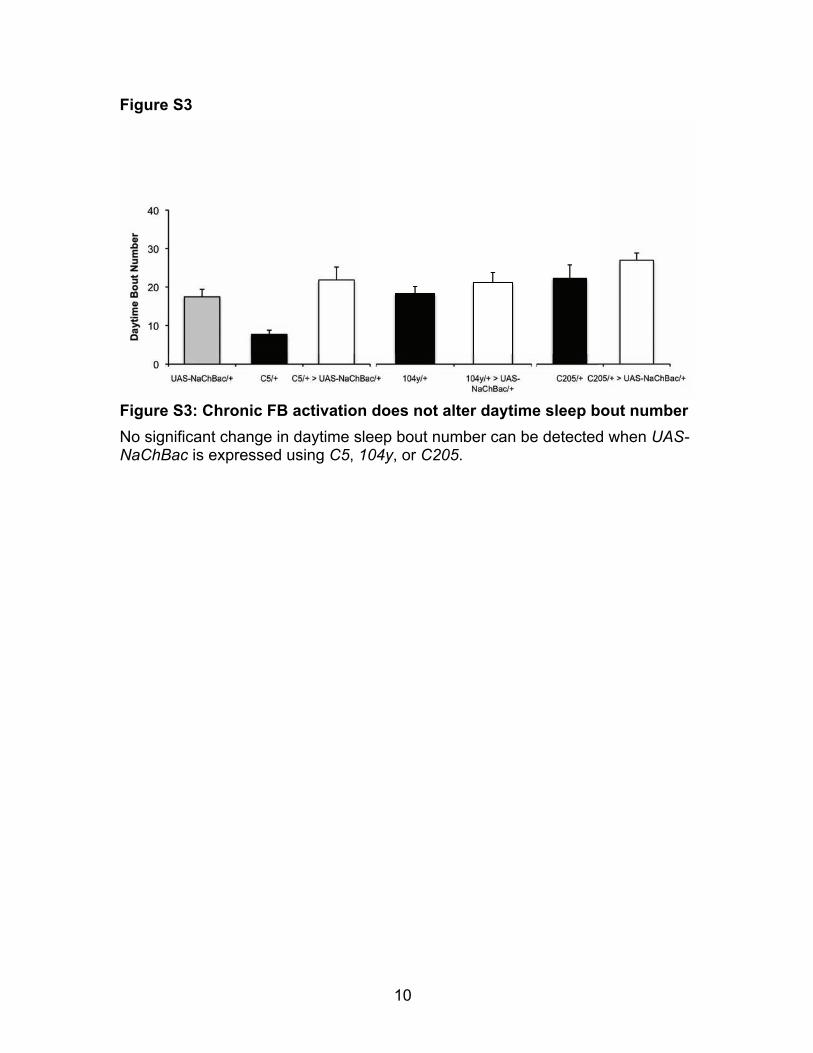
Figure S3
Figure S3: Chronic FB activation does not alter daytime sleep bout number No significant change in daytime sleep bout number can be detected when UAS-NaChBac is expressed using C5, 104y, or C205.

11
Figure S4
Fig. S4: Activity is increased when quiescent flies are exposed to increasing durations of light. A brief 1-min light pulse administered at zeitgeber time 18 (ZT-18) increases activity levels in C5/+, UAS-NaChBac/+ and C5/+>UAS-NaChBac/+ flies compared to circadian-matched unstimulated controls. Activity levels are increased further in C5/+, UAS-NaChBac/+ and C5/+>UAS-NaChBac/+ flies when the duration of light exposure is increased to 5 min. ANOVA reveals a significant main effect for duration of light exposure (no light, 1 min, and 5 min) (F(2,126)=66.219, p=1.69x10⁻¹¹, *p<.05 by modified Bonferroni test, n=15/group). Previously quiescent 104y/+ flies show increased activity following both 1-min and 5-min of light exposure while activity levels are increased in 104y/+>UAS-NaChBac/+ flies after 5-min of light exposure. ANOVA reveals a significant main effect for duration of light exposure (F(2,124)=61.928, p=1.71x10⁻¹¹, *p<.05 by modified Bonferroni test, n=14-15/group).

12
Figure S5�
Figure S5: Caffeine attenuates sleep during activation of the dorsal Fan-Shaped Body. Sleep was evaluated in flies maintained on 2.5 mg/mL caffeine for 6 h between 8am-2pm. Caffeine maximally reduced sleep time in 104y/+>NaChBac/+ flies as well as in genetic controls, NaChBac/+ and 104y/+, compared to vehicle-treated siblings. An ANOVA reveals a significant main effect for Drug (Vehicle and caffeine) (F(2,181)=53.857, p=1.8x10⁻¹¹, *p<.05 by modified Bonferroni test, n=32/group). These data indicate that exposure to wake-promoting compounds decreases quiescence during FB activation.
13
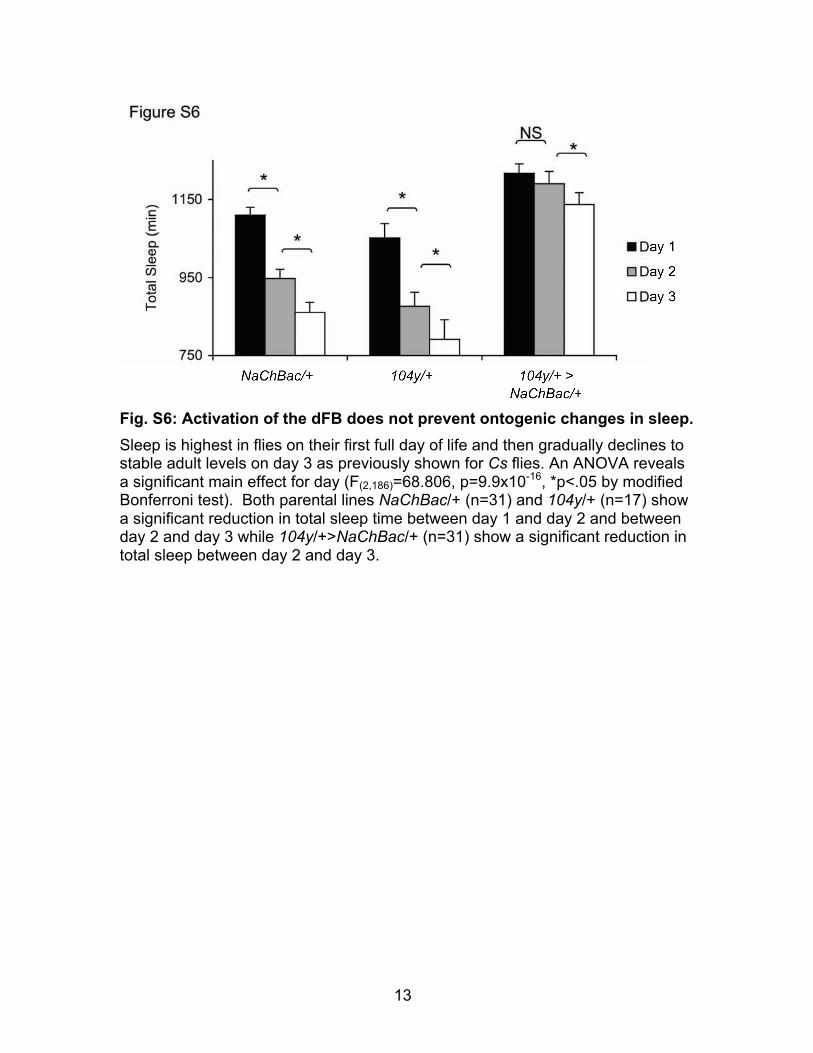
Fig. S6: Activation of the dFB does not prevent ontogenic changes in sleep. Sleep is highest in flies on their first full day of life and then gradually declines to stable adult levels on day 3 as previously shown for Cs flies. An ANOVA reveals a significant main effect for day (F(2,186)=68.806, p=9.9x10⁻¹⁶, *p<.05 by modified Bonferroni test). Both parental lines NaChBac/+ (n=31) and 104y/+ (n=17) show a significant reduction in total sleep time between day 1 and day 2 and between day 2 and day 3 while 104y/+>NaChBac/+ (n=31) show a significant reduction in total sleep between day 2 and day 3.
14
15
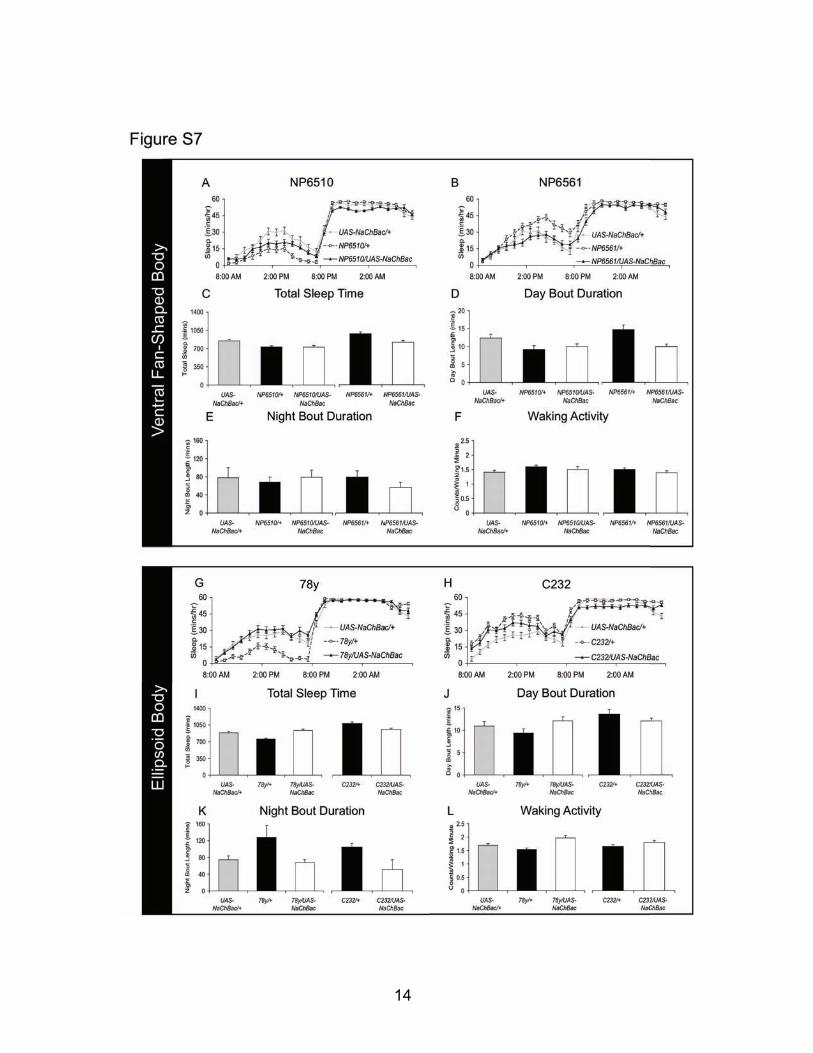
Fig. S7: Excitation of ventral FB and EB do not alter sleep. (A) Constitutive expression of NaChBac with NP6510 does not alter sleep. Sleep shown in minutes/hour (n=30-32 each group). (B) No significant change in sleep is detected when UAS-NaChBac is expressed using NP6561-GAL4 (n=30-32 each group). (C) Expression of NaChBac with neither NP6510 nor NP6561 alters total daily sleep time (n=30-32 each group). (D) Daytime sleep consolidation is not changed in NP6510/+>UAS-NaChBac/+ or NP6561/+>UAS-NaChBac/+ flies. (E) Night-time sleep bout duration is not altered in NP6510/+>UAS-NaChBac/+ or NP6561/+>UAS-NaChBac/+ flies. (F) Intensity of waking locomotor activity is not increased in NP6510/+>UAS-NaChBac/+ or NP6561/+>UAS-NaChBac/+ flies. (G) Constitutively expressing NaChBac with 78y to excite Ellipsoid Body neurons does not alter sleep. Data is shown in minutes/hour (n=32 each group). (H) No change in sleep is detected when NaChBac is driven by C232 in Ellipsoid Body neurons (n=32 each group). (I) Total daily sleep is not altered by Ellipsoid Body excitation in 78y/+>UAS-NaChBac/+ and C232/+>UAS-NaChBac/+ flies. (J) Daytime sleep consolidation is not altered in 78y/+>UAS-NaChBac/+ or C232/+>UAS-NaChBac/+ flies compared to genetic controls. (K) Sleep consolidation is not altered during the night by Ellipsoid Body excitation in 78y/+>UAS-NaChBac/+ or C232/+>UAS-NaChBac/+ flies. (L) Intensity of waking locomotor activity is not altered in 78y/+>UAS-NaChBac/+ or C232/+>UAS-NaChBac/+ flies compared to genetic controls.
16
17
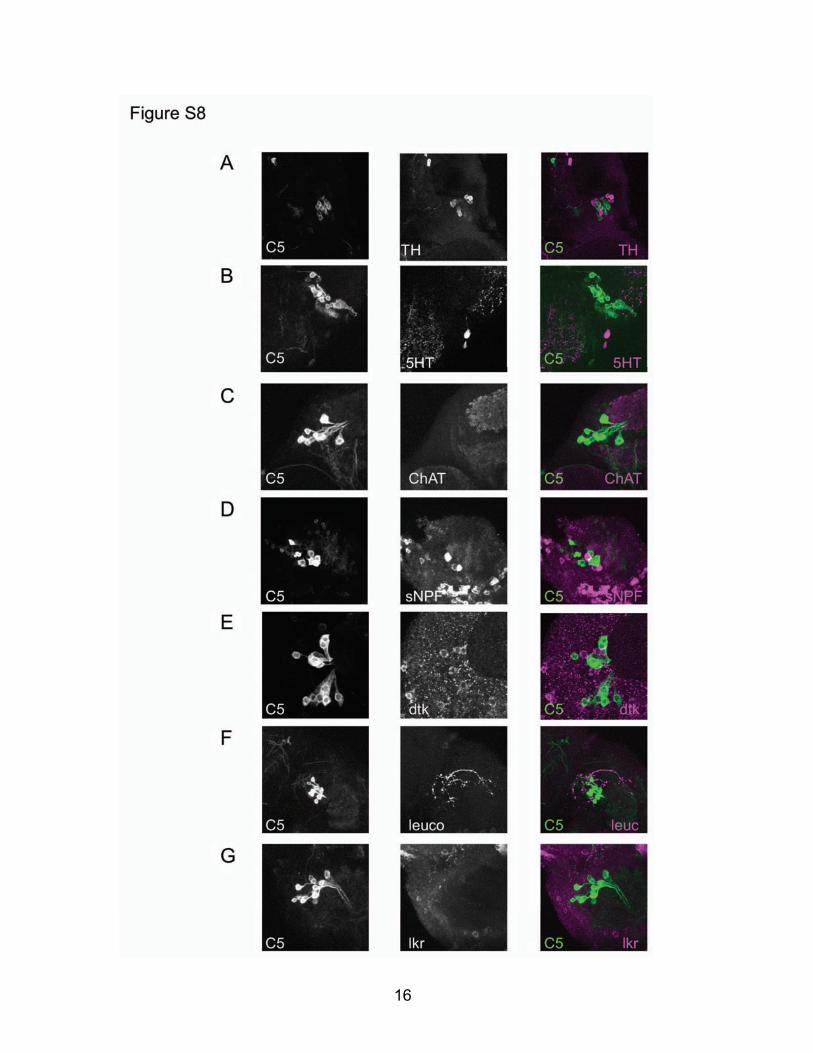
Fig. S8: Immunohistochemical examination of dFB neurons. (A) TH immunolabeling neighbors, but does not overlap with, C5/+>UAS-egfp/+ expression. (B) 5HT immunolabeling reveals a single 5HT-positive soma ventral to C5-expressing neurons that project into the Fan-Shaped Body. (C) ChAT immunolabels neuropil in the dorsal brain, but not C5-positive neurons. (D) sNPF is expressed in a variety of neurons in the dorsal brain, but not C5-positive neurons. (E) dtk immunolabeling does not colocalize with C5/+>UAS-egfp/+. (F-G) Leucokinin immunolabeling reveals leuc-positive projections nearby C5-positive neurons (F), but immunostaining for lkr reveals no expression in C5-positive cells (G).

18

19
Fig. S9: Excitation of leucokinin-expressing neurons does not change sleep. (A) Constitutive expression of NaChBac in leucokinin-expressing cells using leuc-GAL4 does not increase sleep compared to genetic controls. Sleep is shown in minutes/hour (n=16 each group). (B) Excitation of neurons expressing leucokinin receptor (lkr) in lkr-GAL4/+ > UAS-NaChBac/+ flies does not change sleep relative to genetic controls (n=16 each group). (C) No change in sleep can be detected when lkr is overexpressed in the Dorsal Fan-Shaped body in 104y/+ > UAS-lkr/+ flies compared to genetic controls (n=16 each group).
20

21
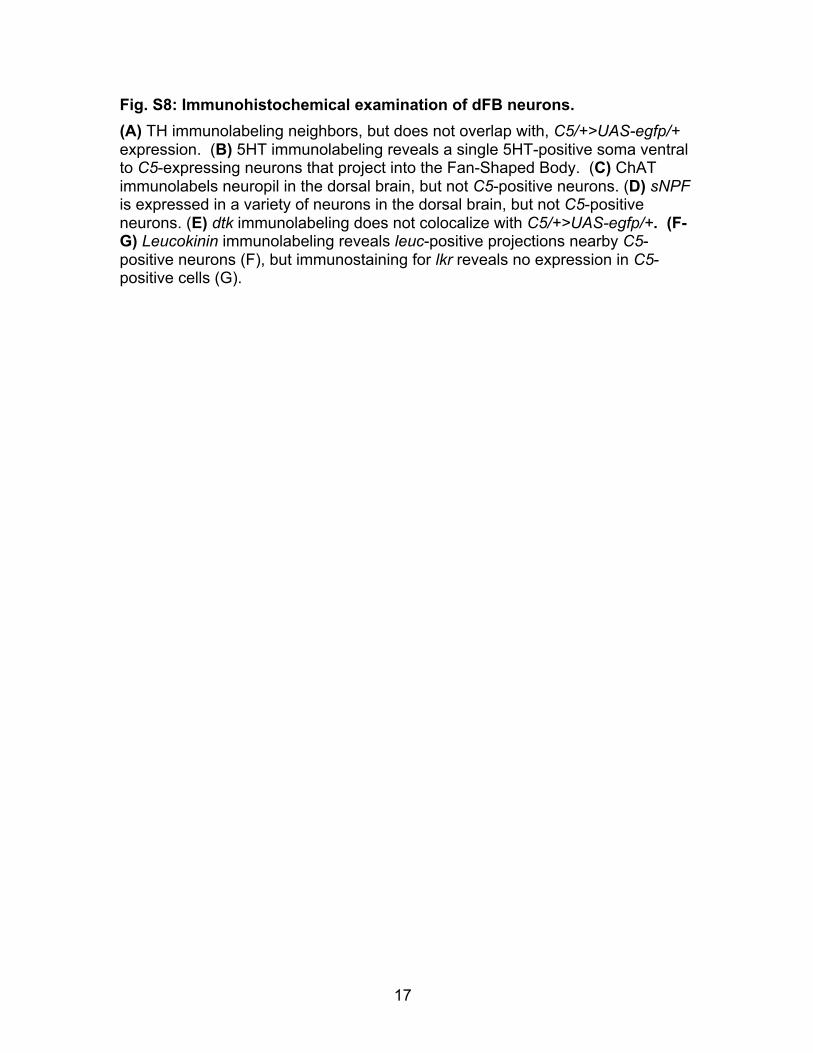
Fig. S10: Disrupted tachykinin signaling does not alter sleep. (A) Sleep is not altered in dtkEy2017/Df(3R)Exel6162 transheterozygotes compared to genetic controls (n=12-16 each group). (B) No change in sleep can be detected in takR99DMB09356/Df(3R)Exel6213 transheterozygotes compared to genetic controls (n=16 each group). (C) Similarly, takR86CMB01381/Df(3R)Exel6159 transheterozygotes show no change in sleep compared to genetic controls (n=15-16 each group).
22
23
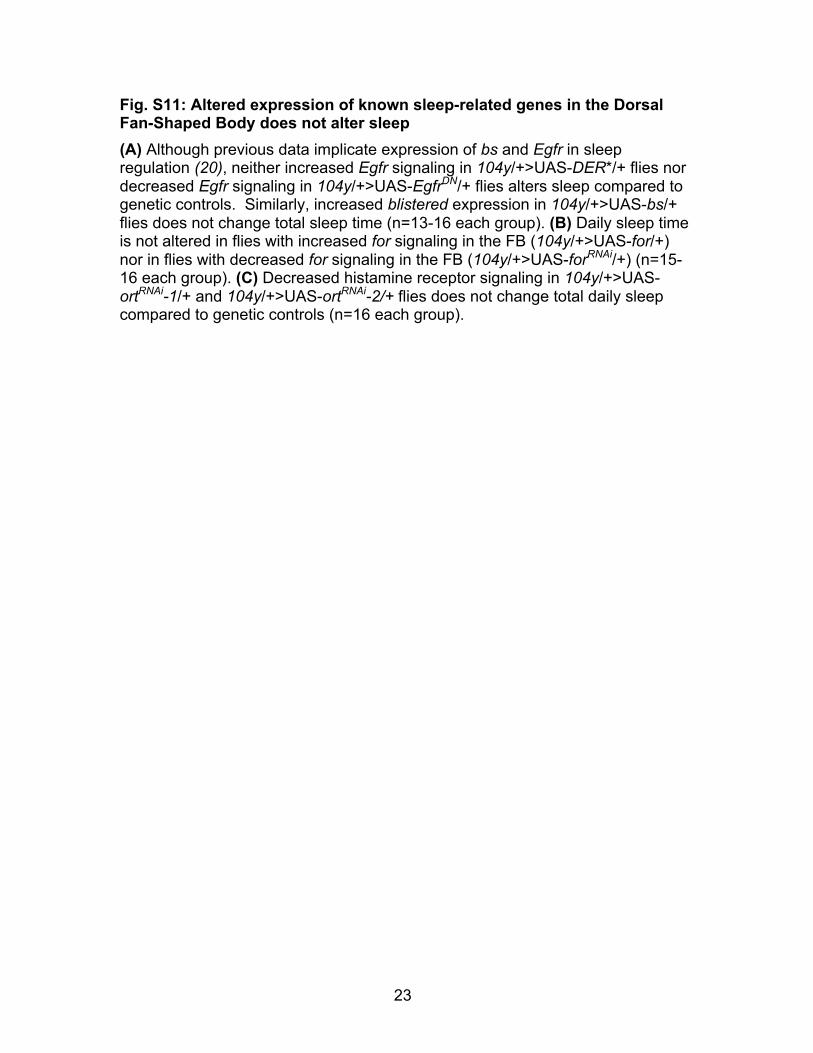
Fig. S11: Altered expression of known sleep-related genes in the Dorsal Fan-Shaped Body does not alter sleep (A) Although previous data implicate expression of bs and Egfr in sleep regulation (20), neither increased Egfr signaling in 104y/+>UAS-DER*/+ flies nor decreased Egfr signaling in 104y/+>UAS-EgfrDN/+ flies alters sleep compared to genetic controls. Similarly, increased blistered expression in 104y/+>UAS-bs/+ flies does not change total sleep time (n=13-16 each group). (B) Daily sleep time is not altered in flies with increased for signaling in the FB (104y/+>UAS-for/+) nor in flies with decreased for signaling in the FB (104y/+>UAS-forRNAi/+) (n=15-16 each group). (C) Decreased histamine receptor signaling in 104y/+>UAS-ortRNAi-1/+ and 104y/+>UAS-ortRNAi-2/+ flies does not change total daily sleep compared to genetic controls (n=16 each group).
24

25
Figure S12: Altered expression of known sleep-related genes in the Dorsal Fan-Shaped Body does not alter sleep (A) Althoough previous data implicate expression of bs and Egfr in sleep regulation (8), neither increased Egfr signaling in 104y/+>UAS-DER*/+ flies nor decreased Egfr signaling in 104y/+>UAS-EgfrDN/+ flies alters sleep compared to genetic controls. Similarly, increased blistered expression in 104y/+>UAS-bs/+ flies does not change total sleep time (n=13-16 each group). (B) Daily sleep time is not altered in flies with increased for signaling in the FB (104y/+>UAS-for/+) nor in flies with decreased for signaling in the FB (104y/+>UAS-forRNAi/+) (n=15-16 each group). (C) Decreased histamine receptor signaling in 104y/+>UAS-ortRNAi-1/+ and 104y/+>UAS-ortRNAi-2/+ flies does not change total daily sleep compared to genetic controls (n=16 each group).
26

27
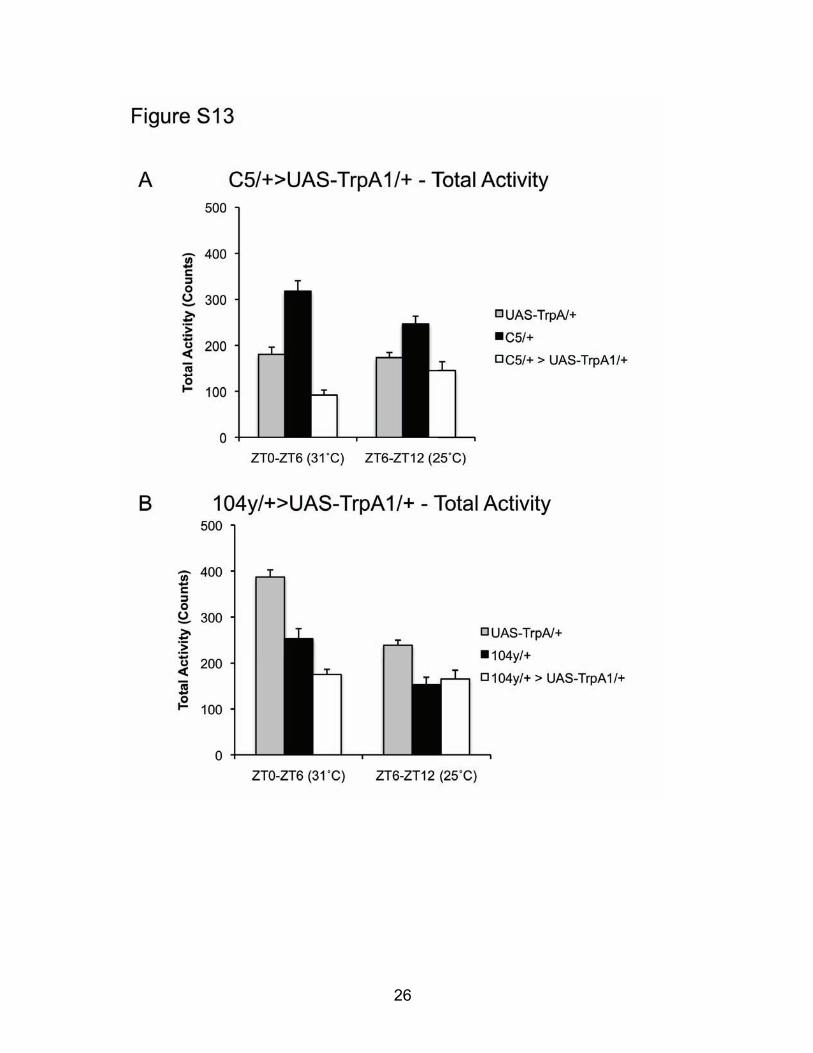
Figure S13: TrpA1 Activation of dFB temporarily decreases total locomotor activity (A-B) Locomotor activity is temporarily decreased during exposure to 31˚C from ZT0-ZT6 compared to genetic controls, but not when flies are returned to 25˚C for the following 6h (ZT6-ZT12). C5/+>UAS-TrpA1 (A) and 104y/+>UAS-TrpA1/+ flies (B) compared to controls. Activity quantified as Total Counts.

28
Figure S14
29
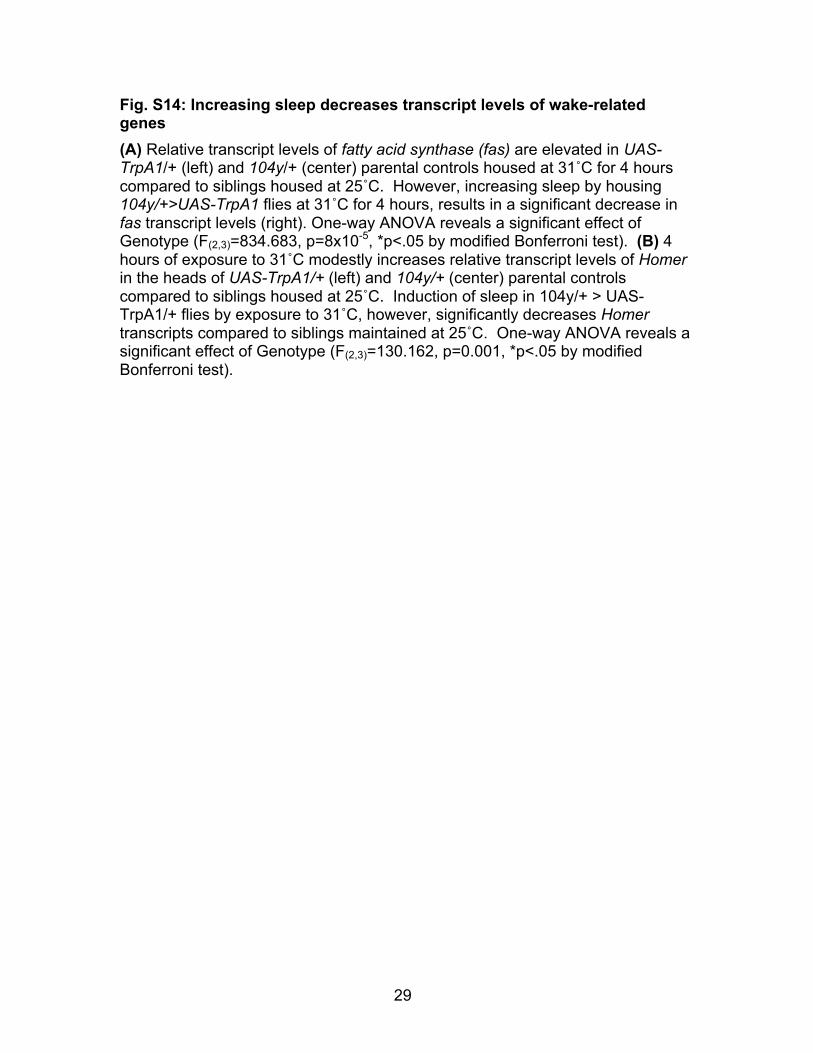
Fig. S14: Increasing sleep decreases transcript levels of wake-related genes (A) Relative transcript levels of fatty acid synthase (fas) are elevated in UAS-TrpA1/+ (left) and 104y/+ (center) parental controls housed at 31˚C for 4 hours compared to siblings housed at 25˚C. However, increasing sleep by housing 104y/+>UAS-TrpA1 flies at 31˚C for 4 hours, results in a significant decrease in fas transcript levels (right). One-way ANOVA reveals a significant effect of Genotype (F(2,3)=834.683, p=8x10⁻⁵, *p<.05 by modified Bonferroni test). (B) 4 hours of exposure to 31˚C modestly increases relative transcript levels of Homer in the heads of UAS-TrpA1/+ (left) and 104y/+ (center) parental controls compared to siblings housed at 25˚C. Induction of sleep in 104y/+ > UAS-TrpA1/+ flies by exposure to 31˚C, however, significantly decreases Homer transcripts compared to siblings maintained at 25˚C. One-way ANOVA reveals a significant effect of Genotype (F(2,3)=130.162, p=0.001, *p<.05 by modified Bonferroni test).
30
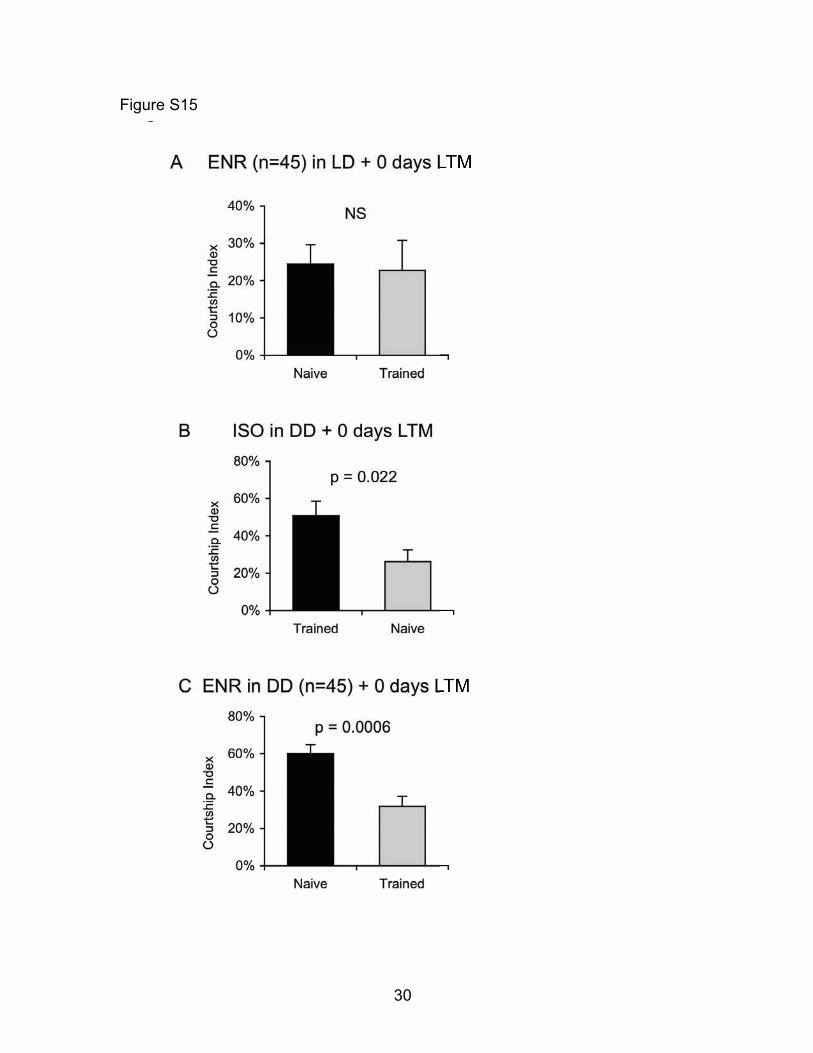
Figure S15
31
Fig. S15: Flies socially enriched in Dark Dark (DD) maintain their ability to develop LTM following courtship conditioning (A) Cs flies previously housed in a socially enriched environment with only 45 siblings do not exhibit a reduction in courtship 48 hours after spaced training (t-test p=0.86, n=14-16). These data indicate that previous experience in a low-density social group can prevent the formation of LTM. It is important to note that while the effects of social enrichment on the formation of Courtship Conditioning memory has not been previously described per se, classic papers describing the development of the assay specifically used protocols in which flies were socially isolated during the time between eclosion and training for Courtship Conditioning (32-34). Thus, social isolation may be an important precondition for male flies to reliably from LTM following courtship conditioning. (B) Cs flies that had been housed in social isolation in DD for 5 days retain robust memory consolidation as exhibited by a significant reduction in courtship 48 hours after spaced training and testing in the light (t-test p=0.022, n=8-12). These data indicate that exposure to DD does not alter the formation of LTM following courtship conditioning. (C) Cs males that had been housed in a socially enriched environment (n=45) in constant darkness for 5 days maintain intact memory formation as measured by a reduction in courtship 48-hours following spaced training and testing in the light (t-test p=0.0006, n=13-14).

32
Figure S16

33
Fig. S16: Inducing sleep for 4 h following social enrichment is associated with a significant reduction in the number of PDF-positive terminals (A) Experimental design for quantifying the effect of sleep induction on the number of PDF-positive terminals following social enrichment. Briefly, 104y/+>UAS-TrpA1/+ flies were housed in a socially enriched environment for 5 days. Flies were then transferred to tubes and 1 group was maintained at 25˚C while a second was shifted to 31˚C for 4 h to induce sleep. All flies were then maintained at 25 C and brains were dissected from both groups on the morning of day 6 for PDF immunohistochemistry. (B) PDF immunohistochemistry reveals that the number of PDF-positive punctae is significantly reduced in previously enriched flies in which sleep was induced during 4 h of exposure to 31˚C compared to siblings maintained at 25˚C. (n=9-10 each group, t-test p=0.015). (C) Although expressing UAS-dlgWT-gfp in the LNvs provides a robust reporter of terminal number, the use of the GAL4-UAS system for this labeling precludes simultaneous modulation of neuronal activation in other regions, such as the dorsal FB, using other GAL4 lines. To test whether similar labeling of terminals could be obtained using immunohistochemistry for PDF, we co-stained pdf-GAL4/+>UAS-dlgWT-gfp/+ brains for GFP and PDF and found that the punctae labeled by both reporters strongly overlap. (B) Given this overlap, we tested whether exposure to social enrichment would result in comparable increases in the number of both PDF-immunopositive and dlgWT-gfp-positive punctae in pdf-GAL4/+>UAS-dlgWT-gfp/+ flies. A significant increase can be detected in both dlgWT-gfp-positive punctae (left, n=11-12 each group, t-test p= 0.003) and PDF-immunopositive varicosities (right, n=11-12 each group, t-test p= 0.005).
34
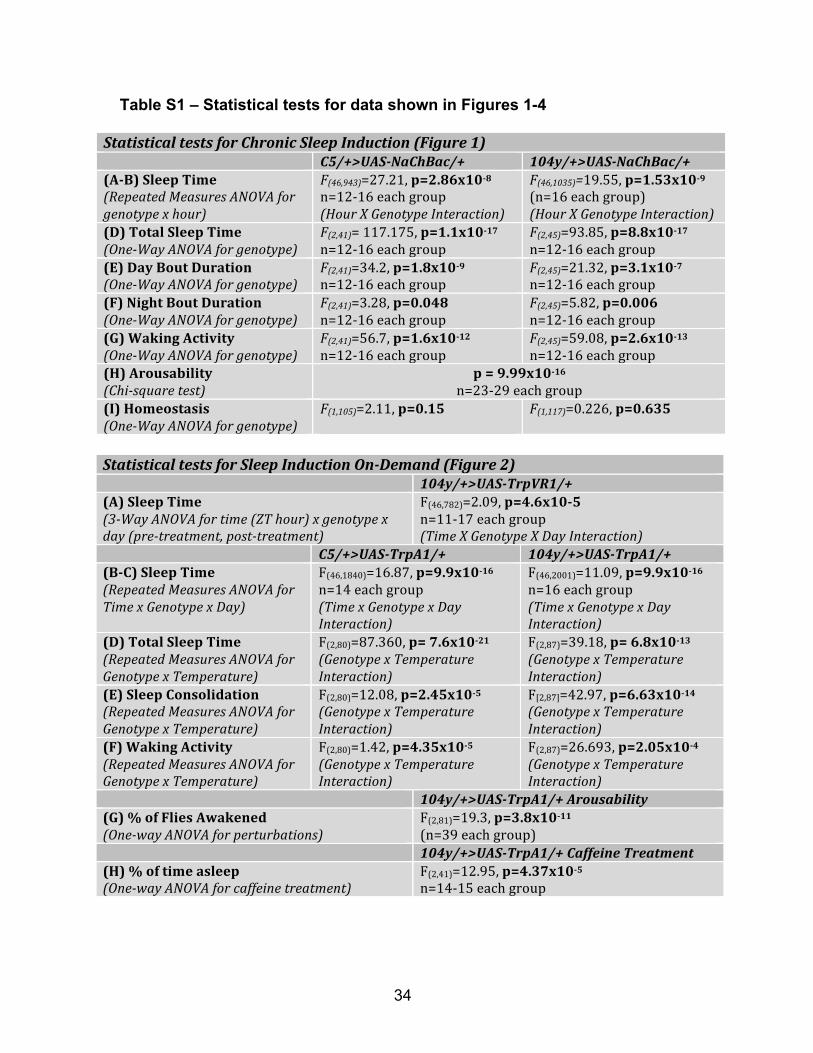
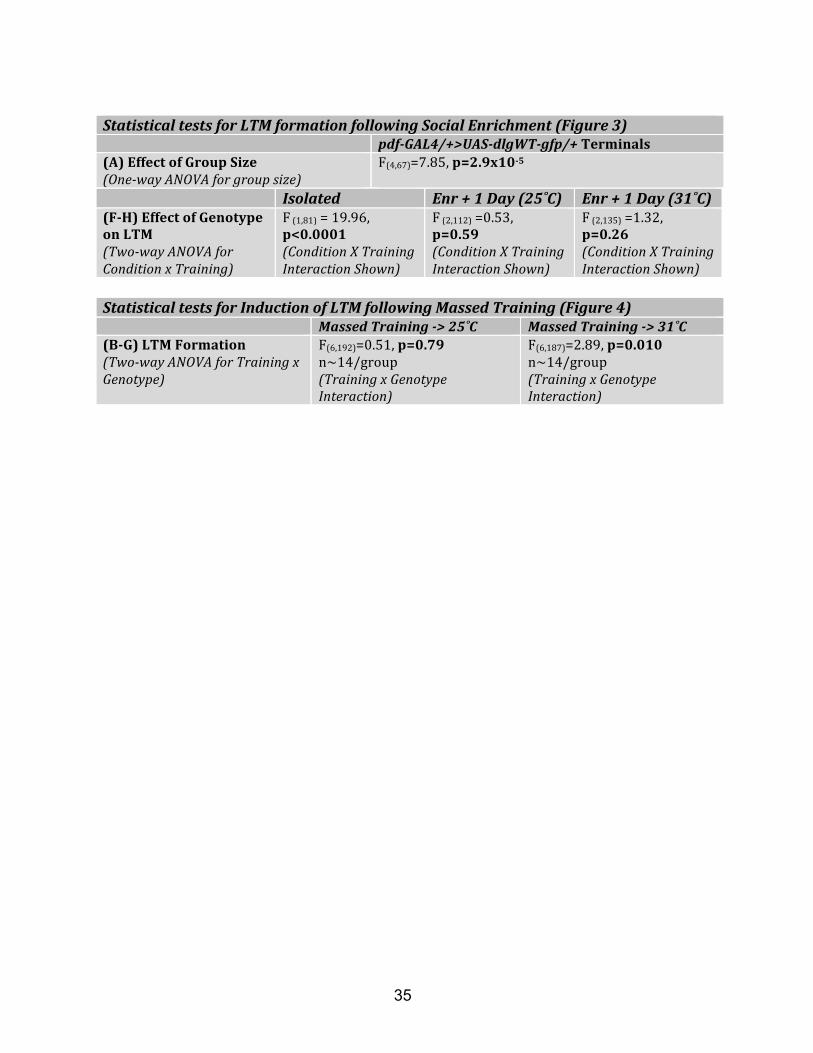
Table S1 – Statistical tests for data shown in Figures 1-4
Statistical tests for Sleep Induction On-Demand (Figure 2) 104y/+>UAS-TrpVR1/+ (A) Sleep Time (3-Way ANOVA for time (ZT hour) x genotype x day (pre-treatment, post-treatment)
F(46,782)=2.09, p=4.6x10⁻⁵ n=11-‐17 each group (Time X Genotype X Day Interaction)
C5/+>UAS-TrpA1/+ 104y/+>UAS-TrpA1/+ (B-C) Sleep Time (Repeated Measures ANOVA for Time x Genotype x Day)
F(46,1840)=16.87, p=9.9x10⁻¹⁶ n=14 each group (Time x Genotype x Day Interaction)
F(46,2001)=11.09, p=9.9x10⁻¹⁶ n=16 each group (Time x Genotype x Day Interaction)
(D) Total Sleep Time (Repeated Measures ANOVA for Genotype x Temperature)
F(2,80)=87.360, p= 7.6x10⁻²¹ (Genotype x Temperature Interaction)
F(2,87)=39.18, p= 6.8x10⁻¹³ (Genotype x Temperature Interaction)
(E) Sleep Consolidation (Repeated Measures ANOVA for Genotype x Temperature)
F(2,80)=12.08, p=2.45x10⁻⁵ (Genotype x Temperature Interaction)
F[2,87]=42.97, p=6.63x10⁻¹⁴ (Genotype x Temperature Interaction)
(F) Waking Activity (Repeated Measures ANOVA for Genotype x Temperature)
F(2,80)=1.42, p=4.35x10⁻⁵ (Genotype x Temperature Interaction)
F(2,87)=26.693, p=2.05x10⁻⁴ (Genotype x Temperature Interaction)
104y/+>UAS-TrpA1/+ Arousability (G) % of Flies Awakened (One-way ANOVA for perturbations)
F(2,81)=19.3, p=3.8x10⁻¹¹ (n=39 each group)
104y/+>UAS-TrpA1/+ Caffeine Treatment (H) % of time asleep (One-way ANOVA for caffeine treatment)
F(2,41)=12.95, p=4.37x10⁻⁵ n=14-‐15 each group
Statistical tests for Chronic Sleep Induction (Figure 1) C5/+>UAS-NaChBac/+ 104y/+>UAS-NaChBac/+ (A-B) Sleep Time (Repeated Measures ANOVA for genotype x hour)
F(46,943)=27.21, p=2.86x10⁻⁸ n=12-‐16 each group (Hour X Genotype Interaction)
F(46,1035)=19.55, p=1.53x10⁻⁹ (n=16 each group) (Hour X Genotype Interaction)
(D) Total Sleep Time (One-Way ANOVA for genotype)
F(2,41)= 117.175, p=1.1x10⁻¹⁷ n=12-‐16 each group
F(2,45)=93.85, p=8.8x10⁻¹⁷ n=12-‐16 each group
(E) Day Bout Duration (One-Way ANOVA for genotype)
F(2,41)=34.2, p=1.8x10⁻⁹ n=12-‐16 each group
F(2,45)=21.32, p=3.1x10⁻⁷ n=12-‐16 each group
(F) Night Bout Duration (One-Way ANOVA for genotype)
F(2,41)=3.28, p=0.048 n=12-‐16 each group
F(2,45)=5.82, p=0.006 n=12-‐16 each group
(G) Waking Activity (One-Way ANOVA for genotype)
F(2,41)=56.7, p=1.6x10⁻¹² n=12-‐16 each group
F(2,45)=59.08, p=2.6x10⁻¹³ n=12-‐16 each group
(H) Arousability (Chi-square test)
p = 9.99x10⁻¹⁶ n=23-‐29 each group
(I) Homeostasis (One-Way ANOVA for genotype)
F(1,105)=2.11, p=0.15
F(1,117)=0.226, p=0.635
35
Statistical tests for LTM formation following Social Enrichment (Figure 3) pdf-GAL4/+>UAS-dlgWT-gfp/+ Terminals (A) Effect of Group Size (One-way ANOVA for group size)
F(4,67)=7.85, p=2.9x10⁻⁵
Isolated Enr + 1 Day (25˚C) Enr + 1 Day (31˚C) (F-H) Effect of Genotype on LTM (Two-way ANOVA for Condition x Training)
F (1,81) = 19.96, p<0.0001 (Condition X Training Interaction Shown)
F (2,112) =0.53, p=0.59 (Condition X Training Interaction Shown)
F (2,135) =1.32, p=0.26 (Condition X Training Interaction Shown)
Statistical tests for Induction of LTM following Massed Training (Figure 4) Massed Training -> 25˚C Massed Training -> 31˚C (B-G) LTM Formation (Two-way ANOVA for Training x Genotype)
F(6,192)=0.51, p=0.79 n~14/group (Training x Genotype Interaction)
F(6,187)=2.89, p=0.010 n~14/group (Training x Genotype Interaction)

References and Notes
1. J. M. Siegel, Clues to the functions of mammalian sleep. Nature 437, 1264 (2005). doi:10.1038/nature04285 Medline
2. A. Rechtschaffen, Current perspectives on the function of sleep. Perspect. Biol. Med. 41, 359 (1998). Medline
3. B. M. Bergmann et al., Sleep deprivation in the rat: II. Methodology. Sleep 12, 5 (1989). Medline
4. M. P. Walker, R. J. Stickgold, D. Alsop, N. Gaab, G. Schlaug, Sleep-dependent motor memory plasticity in the human brain. Neuroscience 133, 911 (2005). doi:10.1016/j.neuroscience.2005.04.007 Medline
5. S. Diekelmann, J. Born, Nat. Rev. Neurosci. XX, 1 (2010).
6. Materials and methods are available as supporting material on Science Online.
7. H. Luan et al., Functional dissection of a neuronal network required for cuticle tanning and wing expansion in Drosophila. J. Neurosci. 26, 573 (2006). doi:10.1523/JNEUROSCI.3916-05.2006 Medline
8. M. N. Nitabach et al., Electrical hyperexcitation of lateral ventral pacemaker neurons desynchronizes downstream circadian oscillators in the fly circadian circuit and induces multiple behavioral periods. J. Neurosci. 26, 479 (2006). doi:10.1523/JNEUROSCI.3915-05.2006 Medline
9. P. J. Shaw, C. Cirelli, R. J. Greenspan, G. Tononi, Correlates of sleep and waking in Drosophila melanogaster. Science 287, 1834 (2000). doi:10.1126/science.287.5459.1834 Medline
10. J. C. Hendricks et al., Rest in Drosophila is a sleep-like state. Neuron 25, 129 (2000). doi:10.1016/S0896-6273(00)80877-6 Medline
11. J. M. Young, J. D. Armstrong, Structure of the adult central complex in Drosophila: organization of distinct neuronal subsets. J. Comp. Neurol. 518, 1500 (2010). doi:10.1002/cne.22284 Medline
12. G. Liu et al., Distinct memory traces for two visual features in the Drosophila brain. Nature 439, 551 (2006). doi:10.1038/nature04381 Medline
13. R. Andretic, P. J. Shaw, Essentials of sleep recordings in Drosophila: moving beyond sleep time. Methods Enzymol. 393, 759 (2005). doi:10.1016/S0076-6879(05)93040-1 Medline
14. Z. Wang et al., Visual pattern memory requires foraging function in the central complex of Drosophila. Learn. Mem. 15, 133 (2008). doi:10.1101/lm.873008 Medline
15. Y. Pan et al., Differential roles of the fan-shaped body and the ellipsoid body in Drosophila visual pattern memory. Learn. Mem. 16, 289 (2009). doi:10.1101/lm.1331809 Medline

16. L. Kahsai, A. M. E. Winther, Chemical neuroanatomy of the Drosophila central complex: distribution of multiple neuropeptides in relation to neurotransmitters. J. Comp. Neurol. 519, 290 (2011). doi:10.1002/cne.22520 Medline
17. L. Kahsai, J.-R. Martin, A. M. E. Winther, Neuropeptides in the Drosophila central complex in modulation of locomotor behavior. J. Exp. Biol. 213, 2256 (2010). doi:10.1242/jeb.043190 Medline
18. A. M. E. Winther, A. Acebes, A. Ferrús, Tachykinin-related peptides modulate odor perception and locomotor activity in Drosophila. Mol. Cell. Neurosci. 31, 399 (2006). doi:10.1016/j.mcn.2005.10.010 Medline
19. B. Al-Anzi et al., Curr. Biol. XX, 1 (2010).
20. J. M. Donlea, N. Ramanan, P. J. Shaw, Use-dependent plasticity in clock neurons regulates sleep need in Drosophila. Science 324, 105 (2009). doi:10.1126/science.1166657 Medline
21. F. N. Hamada et al., An internal thermal sensor controlling temperature preference in Drosophila. Nature 454, 217 (2008). doi:10.1038/nature07001 Medline
22. S. Marella et al., Imaging taste responses in the fly brain reveals a functional map of taste category and behavior. Neuron 49, 285 (2006). doi:10.1016/j.neuron.2005.11.037 Medline
23. C. Cirelli, C. M. Gutierrez, G. Tononi, Extensive and divergent effects of sleep and wakefulness on brain gene expression. Neuron 41, 35 (2004). doi:10.1016/S0896-6273(03)00814-6 Medline
24. G. F. Gilestro, G. Tononi, C. Cirelli, Widespread changes in synaptic markers as a function of sleep and wakefulness in Drosophila. Science 324, 109 (2009). doi:10.1126/science.1166673 Medline
25. L. A. Graves, E. A. Heller, A. I. Pack, T. Abel, Sleep deprivation selectively impairs memory consolidation for contextual fear conditioning. Learn. Mem. 10, 168 (2003). doi:10.1101/lm.48803 Medline
26. V. V. Vyazovskiy et al., Cortical firing and sleep homeostasis. Neuron 63, 865 (2009). doi:10.1016/j.neuron.2009.08.024 Medline
27. L. Appelbaum et al., Circadian and homeostatic regulation of structural synaptic plasticity in hypocretin neurons. Neuron 68, 87 (2010). doi:10.1016/j.neuron.2010.09.006 Medline
28. G. Tononi, C. Cirelli, Sleep function and synaptic homeostasis. Sleep Med. Rev. 10, 49 (2006). doi:10.1016/j.smrv.2005.05.002 Medline
29. P. J. Shaw, G. Tononi, R. J. Greenspan, D. F. Robinson, Stress response genes protect against lethal effects of sleep deprivation in Drosophila. Nature 417, 287 (2002). doi:10.1038/417287a Medline
30. L. Seugnet, Y. Suzuki, L. Vine, L. Gottschalk, P. J. Shaw, D1 receptor activation in the mushroom bodies rescues sleep-loss-induced learning impairments in Drosophila. Curr. Biol. 18, 1110 (2008). doi:10.1016/j.cub.2008.07.028 Medline
31. I. Ganguly-Fitzgerald, J. M. Donlea, P. J. Shaw, Waking experience affects sleep need in Drosophila. Science 313, 1775 (2006). doi:10.1126/science.1130408 Medline
32. R. W. Siegel, J. C. Hall, Conditioned responses in courtship behavior of normal and mutant Drosophila. Proc. Natl. Acad. Sci. U.S.A. 76, 3430 (1979). doi:10.1073/pnas.76.7.3430 Medline
33. D. A. Gailey, F. R. Jackson, R. W. Siegel, Male courtship in Drosophila: The conditioned response to immature males and its genetic control. Genetics 102, 771 (1982). Medline
34. D. A. Gailey, J. C. Hall, R. W. Siegel, Reduced reproductive success for a conditioning mutant in experimental populations of Drosophila melanogaster. Genetics 111, 795 (1985). Medline