sure dividend · while the strategy as a whole still has more losers than ... and dollar store...
TRANSCRIPT

Sure Dividend HIGH QUALITY DIVIDEND STOCKS, LONG-TERM PLAN
October 2014 Edition
By Ben Reynolds

Table of Contents
Opening Thoughts ......................................................................................................................... 3
The Top 10 List ............................................................................................................................. 4
Stocks to Sell .................................................................................................................................. 5
Stocks to Hold ................................................................................................................................ 5
Review of October’s Top 10 Stocks ............................................................................................. 6
Wal-Mart (WMT) ....................................................................................................................... 6
PepsiCo (PEP) ............................................................................................................................. 7
General Mills (GIS) .................................................................................................................... 8
Coca-Cola (KO) .......................................................................................................................... 9
McDonald’s (MCD) .................................................................................................................. 10
Becton Dickinson (BDX) .......................................................................................................... 11
ExxonMobil (XOM) ................................................................................................................. 12
Philip Morris International (PM) .............................................................................................. 13
Abbott Laboratories (ABT) ....................................................................................................... 14
Ecolab (ECL) ............................................................................................................................ 15
List of All Stocks ......................................................................................................................... 16
Performance ................................................................................................................................ 17
Portfolio Building Guide ............................................................................................................ 18
Examples ................................................................................................................................... 18
Ending Thoughts ......................................................................................................................... 19

Page 3
Opening Thoughts
Over the last month, the S&P500 (measured by SPY) lost about 2% of its
value. The S&P Low Volatility Index (measured by SPLV) and the
Dividend Aristocrats Index (measured by NOBL) each lost less than 1%
over the same time-period. Higher quality businesses tend to be less
volatile. When the overall market is trending lower, low volatility stocks
have historically outperformed.
Common sense tells us that if a stock doesn’t fall as far, it has less ground
to make up in order to recover. Less intuitive but even more impactful is
how much ground stock prices have to make up when they fall. If a stock
price falls 10%, a 10% recovery will not get you back to where you started.
You need an 11.11% return to fully recover. The effect is worse with
larger drops. A stock that loses 50% of its value needs a 100% return to
recover1. A stock that loses 70% of its value needs a massive 333.33%
recovery to get back to break even2. This is why volatility matters in
compounding returns.
Several Sure Dividend stocks’ total returns moved ahead of total market
returns this month. While the strategy as a whole still has more losers than
winners, the results do not reflect a full business cycle. Based on historical
results and studies, I believe that high quality businesses will compound
investor wealth at a slightly faster rate than the S&P500, in part because
high quality businesses give up less ground during recessions.
The October edition of Sure Dividend marks the first month maximum
drawdown figures are included for each of our Top 10 stocks. Maximum
drawdown is calculated using stock prices from 2000 onward to show
relatively recent maximum losses over the last few business cycles.
1 Here’s an example: If a stock is worth $1.00 and losses 50% of its value, it is now worth $0.50. If the stock then
goes up 50%, it is only worth $0.75, not $1.00. It would take a 100% return to get back to $1.00 from $0.50. 2 To find the return needed to recover from a loss, use the following formula: 1 / (1 - % lost) - 1
For example, if a stock price declined 20%, then your calculation would look like this: 1 / (1 - 20%) – 1 = 25%, so
you would need a 25% return to recover from a 20% loss.
Page 4
The Top 10 List
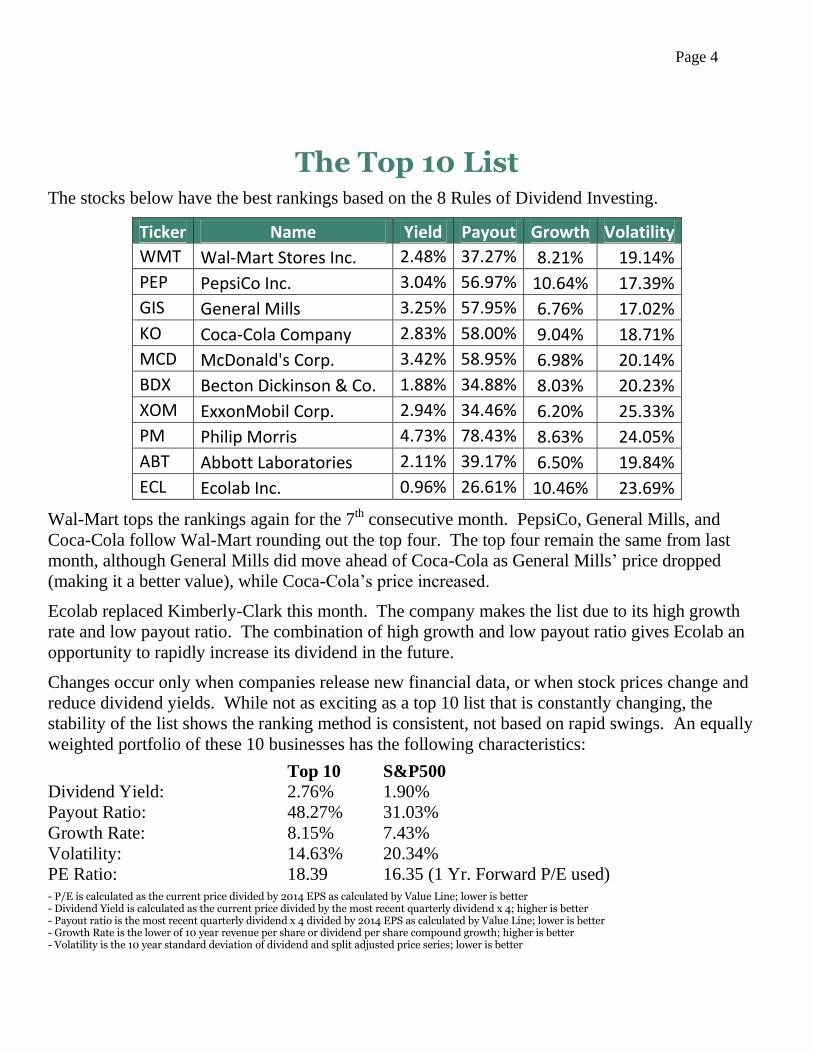
The stocks below have the best rankings based on the 8 Rules of Dividend Investing.
Ticker Name Yield Payout Growth Volatility
WMT Wal-Mart Stores Inc. 2.48% 37.27% 8.21% 19.14%
PEP PepsiCo Inc. 3.04% 56.97% 10.64% 17.39%
GIS General Mills 3.25% 57.95% 6.76% 17.02%
KO Coca-Cola Company 2.83% 58.00% 9.04% 18.71%
MCD McDonald's Corp. 3.42% 58.95% 6.98% 20.14%
BDX Becton Dickinson & Co. 1.88% 34.88% 8.03% 20.23%
XOM ExxonMobil Corp. 2.94% 34.46% 6.20% 25.33%
PM Philip Morris 4.73% 78.43% 8.63% 24.05%
ABT Abbott Laboratories 2.11% 39.17% 6.50% 19.84%
ECL Ecolab Inc. 0.96% 26.61% 10.46% 23.69%
Wal-Mart tops the rankings again for the 7th consecutive month. PepsiCo, General Mills, and
Coca-Cola follow Wal-Mart rounding out the top four. The top four remain the same from last
month, although General Mills did move ahead of Coca-Cola as General Mills’ price dropped
(making it a better value), while Coca-Cola’s price increased.
Ecolab replaced Kimberly-Clark this month. The company makes the list due to its high growth
rate and low payout ratio. The combination of high growth and low payout ratio gives Ecolab an
opportunity to rapidly increase its dividend in the future.
Changes occur only when companies release new financial data, or when stock prices change and
reduce dividend yields. While not as exciting as a top 10 list that is constantly changing, the
stability of the list shows the ranking method is consistent, not based on rapid swings. An equally
weighted portfolio of these 10 businesses has the following characteristics:
Top 10 S&P500
Dividend Yield: 2.76% 1.90%
Payout Ratio: 48.27% 31.03%
Growth Rate: 8.15% 7.43%
Volatility: 14.63% 20.34%
PE Ratio: 18.39 16.35 (1 Yr. Forward P/E used)
- P/E is calculated as the current price divided by 2014 EPS as calculated by Value Line; lower is better - Dividend Yield is calculated as the current price divided by the most recent quarterly dividend x 4; higher is better - Payout ratio is the most recent quarterly dividend x 4 divided by 2014 EPS as calculated by Value Line; lower is better - Growth Rate is the lower of 10 year revenue per share or dividend per share compound growth; higher is better - Volatility is the 10 year standard deviation of dividend and split adjusted price series; lower is better

Page 5
Stocks to Sell
The stocks below were previously on the top 10 list, and should now be sold.
NONE
Stocks to Hold
The stocks below were previously on the top 10 list. They have since fallen off the top
10 but should be held, not sold.
Clorox (CLX) – Added April 2014, replaced by GPC
Target (TGT) – Added April 2014, replaced by MMM
Genuine Parts Co. (GPC) – Added May 2014, replaced by PM
3M (MMM) – Added May 2014, replaced by T
AFLAC (AFL) – Added April 2014, replaced by BDX
AT&T (T) – Added June 2014, replaced by ABT
Chubb (CB) – Added April 2014, replaced by BDX
J.M. Smucker (SJM) – Added August 2014, replaced by KMB
Kimberly-Clark (KMB) – Added April 2014, replaced by ECL

Page 6
Review of October’s Top 10 Stocks
Wal-Mart (WMT)
Overview & Current Events
Wal-Mart serves over 245 million customers each week from 11,000+ locations in 27 countries. It is
by far the largest retailer in the world, with a market capitalization of $241 billion, and annual sales of
over $470 billion per year.
Wal-Mart’s most recent quarterly results saw constant currency revenue grow 3.4%. Wal-Mart US
increased revenue 3.1%, and Sam’s Club grew revenues 2.3%. Wal-Mart International grew constant
currency revenue a strong 5.3%. The company reversed its trend of negative same store earnings
growth in the US, where Wal-Mart same store sales growth was flat this quarter.
Next Dividend Record Date: December 5th
, 2014 Next Earnings Release: Mid November, 2014
Competitive Advantage & Recession Performance
Wal-Mart’s competitive advantage comes from its massive scale and operating efficiency. The
company pressures suppliers to lower their prices and then passes the savings on to consumers which
results in an even greater size advantage for Wal-Mart.
The company’s low prices are appealing to consumers during times of economic hardship, thus
insulating the company from recessions. The Great Recession of 2007 to 2009 did not affect Wal-
Mart’s operations. The company grew revenue, earnings, and dividends each year through the
recession.
Growth Prospects, Valuation, & Catalyst
Wal-Mart’s future growth will come from further penetration into international markets. Wal-Mart
grew comparable store sales significantly faster internationally than domestically in its most recent
quarter. The company will realize growth in the US from its burgeoning e-commerce business (up
27% year over year) and new store layouts. Wal-Mart is establishing several hundred hybrid stores
1/10 the size of a supercenter that combine a pharmacy, gas station, and dollar store pricing.
The company is currently trading at a P/E ratio of under 16, well below the market and its historical
average P/E ratio. Wal-Mart is the cheapest publicly traded discount retailer in the US, well below the
P/E ratio of its competitors Costco (P/E of 27), Target (P/E of 25) and Dollar General (P/E of 19). The
company will likely see its valuation multiples revised upwards when comparable store sales in the US
begin increasing.
Maximum Drawdown (starting in year 2000): -37% in October of 2000
Dividend Stats Dividend Yield: 2.52%
10 Year Dividend Growth Rate: 14.00% per year
Most Recent Dividend Increase: 2.13%
Dividend History: 41 Consecutive years of dividend increases

Page 7
PepsiCo (PEP)
Overview & Current Events
PepsiCo manufactures and sells snacks and food items primarily under its Frito-Lay and Quaker
brands, and non-alcoholic beverages under its drink brands which include Pepsi, Mountain Dew,
Gatorade, 7 Up, Aquafina, and Tropicana. In total, The company has 22 brands with over $1 billion in
annual sales.
PepsiCo’s growth continued in its most recent quarter. The company posted 3.6% constant currency
revenue growth, and constant currency EPS growth of 9%. Its constant currency revenue growth by
division is listed below. The company grew fastest in emerging markets:
PepsiCo Americas Foods 4% PepsiCo Americas Beverages 1%
Europe 5% Asia, Middle East, & Africa 7%
Next Dividend Record Date: Early December, 2014 Next Earnings Release: October 9th
2014
Competitive Advantage & Recession Performance
PepsiCo’s competitive advantage lies in its highly recognizable brands. It reinforces brand awareness
through its large advertising spending. The company is entrenched in consumer minds throughout the
world thanks to its marketing. PepsiCo’s strong branding and low priced consumer food and beverage
products insulate it from much of the effects of recessions.
PepsiCo’s operating performance was stellar over the 2007 to 2009 Great Recession. The company ‘s
revenue dipped very slightly from 2008 to 2009, and earnings had a small dip from 2007 to 2008.
Recessions have historically slowed PepsiCo’s growth, but have done little to impact its profitability.
Growth Prospects, Valuation, & Catalyst
PepsiCo’s flagship Pepsi brand and other carbonated beverages are experiencing stagnant growth as
consumers change their beverage preferences to non-carbonated drinks. The company’s growth
potential lies with its Frito-Lay and non-carbonated beverage brands coupled with increased growth
and market penetration in the developing world.
PepsiCo’s current P/E ratio is about 21, which is close to its historical average. The company is
slightly more expensive than the overall market, but is of a higher quality than the overall market.
PepsiCo has had double-digit revenue and dividend growth over the last ten years and has positioned
itself well to take advantage of growth in the developing world through strong branding.
Maximum Drawdown (starting in year 2000): -40% in March of 2009
Dividend Stats
Dividend Yield: 2.81%
10 Year Dividend Growth Rate: 11.00% per year
Most Recent Dividend Increase: 15.32%
Dividend History: 42 Consecutive years of dividend increases

Page 8
General Mills (GIS)
Overview & Current Events
General Mills sells branded food products in over 100 countries around the world. The company’s
brands include: Cheerios, Yoplait, Pilsbury, Betty Crocker, Valley Fresh, Nature Valley, and
Progresso.
On September 8th
, General Mills announced plans to acquire the natural food company, Annie’s. The
deal will boost General Mill’s natural and organic products revenues from $330 million to $540
million. The acquisition shows General Mills is allocating more capital to natural and organic
products. The company’s 1st quarter earnings were released on September 17
th. As the company’s
management expected, sales were down 1% on a constant currency basis. The international division
saw strong growth, while U.S. sales declined. Management expects high single digit earnings per share
growth and mid-digit revenue growth for the full fiscal year.
Next Dividend Record Date: Mid October, 2014 Next Earnings Release: Mid December, 2014
Competitive Advantage & Recession Performance
General Mills is able to sell its grocery products at premium prices because of their strong brand
names. The company’s brands are ubiquitous in grocery stores and easily recognizable by consumers.
General Mills sells staple food products. Food is one of the few items people can’t cut back on during
recessions. General Mills increased revenue, earnings, and dividends each year from 2007 through
2009 during the Great Recession. The company is highly insulated from the effects of economic
downturns.
Growth Prospects, Valuation, & Catalyst
General Mills currently generates the bulk of its revenue from US retail sales. The company has the
following plans to return its US operations to growth:
Renovating its flagship cereal brands and yogurt brands
Capitalizing on increasing Hispanic brand sales
Focusing on “better-for-you” snacking through its LARA, Nature Valley, and Fiber One brands
In addition to renovating its US brands, General Mills has significant growth opportunities overseas.
The company has grown international sales at a 16% CAGR since 2009, and currently generates 35%
of sales internationally. General Mills currently has a P/E ratio of about 19 which is in line with the
general market. The company is likely trading near fair value. Investors should expect returns from
growth and dividends, not an increase in the P/E multiple.
Maximum Drawdown (starting in year 2000): -32% in March of 2009
Dividend Stats Dividend Yield: 3.25%
10 Year Dividend Growth Rate: 9.53% per year
Most Recent Dividend Increase: 7.89%
Dividend History: 114 consecutive years without a reduction
Page 9
Coca-Cola (KO)
Overview & Current Events
Coca-Cola is the world’s leading carbonated beverage company based on sales. Coca-Cola has 17
brands that sell over $1 billion annually including its flagship Coca-Cola, Sprite, and Fanta. The
company boasts a strong non-carbonated brand portfolio as well including: Simply, Minute Made,
Vitamin Water, Dasani, and Powerade.
Coca-Cola increased constant currency revenue 3% for its most recent quarter. The company grew
volume by geography as follows:
Asia Pacific 8% Euraisa & Africa 5% North America 0%
Europe 0% Latin America 0%
Coca-Cola’s most recent quarterly results show the company is expanding in the faster growing
emerging markets. The company is stagnating in the developed world as consumers slowly switch
from sodas to still beverages. The company also recently purchased a 16.7% equity stake in Monster
Beverage and entered into a long-term strategic partnership with the company. Coca-Cola also
announced it will produce Honest Tea hot K-Cups in partnership with Keurig/Green Mountain Coffee
Roasters. These two moves show the company is looking to capitalize on new growth trends in the
beverage industry through partnerships.
Next Dividend Record Date: Mid December, 2014 Next Earnings Release: October 21st, 2014
Competitive Advantage & Recession Performance
Coca-Cola’s competitive advantage comes from its highly recognizable brands. The company’s brands
are developed through large advertising campaigns globally. Coca-Cola is the gold standard in
advertising for the beverage industry. Coca-Cola was minimally affected by the Great Recession of
2007 to 2009. The company’s earnings per share dipped slightly in 2009, but overall performance was
not severely impacted.
Growth Prospects, Valuation, & Catalyst
Coca-Cola’s future growth will come from market share gains and growth in emerging markets. The
company will experience strong growth in its non-carbonated brands and flat growth in carbonated
beverages going forward; Coca-Cola has captured 33% of global juice growth since 2007.
Coca-Cola trades at a P/E ratio of 22.8 which is slightly above its 10 year historical average. The
company is currently sitting at the high end of its fair valuation. Investors should expect gains from
dividends, share repurchases, and organic growth, not valuation multiple expansion.
Maximum Drawdown (starting in year 2000): -42% in March of 2003
Dividend Stats
Dividend Yield: 2.86%
10 Year Dividend Growth Rate: 9.33% per year
Most Recent Dividend Increase: 8.93%
Dividend History: 52 consecutive years of dividend increases

Page 10
McDonald’s (MCD)
Overview & Current Events
McDonald’s is the largest publicly traded restaurant in the world; nearly 3 times as large as its closest
competitor by market cap. The company serves a variety of low-cost burgers and sides through its
35,000+ locations around the world.
McDonald’s recently increased its dividend 5%, which is the same as last year’s increase of about 5%.
The company plans to return an additional $15 billion to $17 billion to shareholders in dividends and
share repurchases through 2016, which is a total return of between 16% and 18%. The company’s
August sales results were poor. Constant currency sales decreased 1.1%. U.S. constant currency sales
were down 1.8%, while European constant currency sales increased 2%. Sales in the rest of the world
were down 10.7% on a constant currency basis due to the meat supplier issues in China. The sales
decline in the rest of the world is temporary, and will likely correct itself in several quarters.
McDonald’s declining U.S. sales show the company needs to evaluate its marketing strategy.
Next Dividend Record Date: Early December, 2014 Next Earnings Release: October 21, 2014
Competitive Advantage & Recession Performance
McDonald’s derives its competitive advantage from its strong brand and franchising business model.
The company’s golden arches are recognized throughout the world. McDonald’s franchising model
allows it to grow quickly and realize higher return on assets than a store-owned business model. The
company generates significant cash flows which it uses to repurchase shares, pay dividends, and invest
in new franchise locations.
The Great Recession of 2007 to 2009 did not impact McDonald’s. The company grew revenue per
share, earnings per share, and dividends per share each year throughout the recession. The company’s
low priced food items tend to do well in recessions as consumers switch from more expensive
restaurants to cheaper options.
Growth Prospects, Valuation, & Catalyst
McDonald’s long-term growth prospects are more favorable than negative current events indicate.
McDonald’s can improve its US same store sales through product innovation and a cleaner menu
layout. The China meat supplier debacle is a one-time event. Despite recent setbacks, the company
has high growth potential in the developing world.
The company currently trades at a P/E ratio of about 17. The median P/E ratio for mid and large cap
restaurant companies is about 27.5. McDonald’s has significant upside potential that will likely be
realized when the company returns to positive comparable store sales growth.
Maximum Drawdown (starting in year 2000): -70% in March of 2003
Dividend Stats
Dividend Yield: 3.42%
10 Year Dividend Growth Rate: 19.40% per year
Most Recent Dividend Increase: 5.00%
Dividend History: 38 consecutive years of dividend increases

Page 11
Becton Dickinson (BDX)
Overview & Current Events
BDX is a global producer of medical, diagnostic, and bioscience products. The company is one of the
oldest in the medical equipment industry; BDX was founded in 1897. BDX’s proprietary medical
technology makes the company a leading provider of medical products.
BDX grew constant currency revenue 4.6% for its most recent quarter and EPS 10.9%. The company
saw its most rapid growth in emerging markets, which were up 12% on the quarter, and over 20% in
China. BDX now generates 25% of its total sales from emerging markets.
Next Dividend Record Date: Early December, 2014 Next Earnings Release: November 4th
, 2014
Competitive Advantage & Recession Performance
The company’s competitive advantage comes from its existing contacts and distribution network in the
global health care industry coupled with its excellent new product pipeline. BDX currently generates
about 60% of its revenues internationally, and is growing revenue fastest in developing markets.
BDX operates in the health care industry which has traditionally done well through recessions. BDX
grew revenue, earnings, and dividends from 2007 through 2009, throughout the Great Recession. The
company is only minimally affected by economic downturns.
Growth Prospects, Valuation, & Catalyst
BDX has excellent future growth prospects. The company has a long history of innovating new
products to grow revenue. It is also adept at international expansion, generating more than 60% of
revenue from international markets. The company has a long growth runway ahead due to an aging
global population and significant exposure to quickly growing emerging markets.
The company is trading near its average P/E 10 ratio (also known as Shiller P/E). The company is also
trading near the median P/E ratio for its industry. BDX is trading near fair value at this time. Its
current 2014 EPS estimate is $6.25, giving the company a P/E of about 18 for the full fiscal year 2014.
Shareholders will benefit from continued growth and share repurchases from BDX, rather than a bump
in price from valuation multiple reversion.
Maximum Drawdown (starting in year 2000): -35% in July of 2002
Dividend Stats
Dividend Yield: 1.92%
10 Year Dividend Growth Rate: 11.72% per year
Most Recent Dividend Increase: 10.10%
Dividend History: 42 consecutive years of dividend increases

Page 12
ExxonMobil (XOM)
Overview & Current Events
ExxonMobil is the world’s largest publicly traded oil company, and 2nd
largest publicly traded
corporation overall with a market cap of $401 billion. Nearly 90% of ExxonMobil’s profits come from
its highly lucrative upstream business. The company also has smaller downstream and chemical
business units.
Next Dividend Record Date: Mid November, 2014 Next Earnings Release: End of October, 2014
ExxonMobil’s earnings per share increased 32% up to $2.05 in the most recent quarter versus the same
quarter a year ago. Earnings increased in each of the company’s business units. ExxonMobil is well
positioned for the future with a globally diversified portfolio of oil and gas assets.
Competitive Advantage & Recession Performance
ExxonMobil’s competitive advantage comes from its size, history, and technical knowledge in its
highly profitable upstream business. The company is efficient at finding and producing oil and natural
gas. ExxonMobil’s massive size coupled with its history working with the US government and other
oil companies give it access to lucrative oil & gas investment opportunities that smaller companies do
not have the connections or resources in which to invest. Despite its strong competitive advantage,
ExxonMobil is affected by recessions.
ExxonMobil’s earnings took a significant dip from $11.58/share to $6.60/share in 2008. The
company’s profit margins are somewhat sensitive to recessions, as oil prices tend to decline during
times of economic hardship. The company’s long-term outlook is not impacted by short term (or even
multiyear) recessions.
Growth Prospects, Valuation, & Catalyst
ExxonMobil’s future growth will come from increasing demands for energy brought on by global GDP
per capita growth. Energy demand for oil is expected to rise as far out as 2040. The company is well
positioned to take advantage of rising global energy demand.
ExxonMobil is undervalued with a P/E ratio of 12. The company is also trading near the bottom of its
historical P/E 10 ratio range, despite a shareholder friendly management and long-growth runway.
ExxonMobil shareholders will likely benefit from gains due to an increase in the company’s P/E ratio
when the business reports increasing volume growth.
Maximum Drawdown (starting in year 2000): -37% in July of 2010
Dividend Stats
Dividend Yield: 2.93%
10 Year Dividend Growth Rate: 9.84% per year
Most Recent Dividend Increase: 9.52%
Dividend History: 32 consecutive years of dividend increases

Page 13
Philip Morris International (PM)
Overview & Current Events
Philip Morris is the world’s largest cigarette company, with a market cap of $130 billion. The
company sells Marlboro, Parliament, Virginia Slims, and other cigarette brands internationally. Its
parent company Altria sells the same brands in the US.
Next Dividend Record Date: End of December, 2014 Next Earnings Release: October 16th
, 2014
Philip Morris grew constant currency revenue 4.5% for its most recent quarter. In addition to revenue
growth, Philip Morris has repurchased about 8% of its shares outstanding over the last 12 months. The
company achieved solid growth in the most recent quarter by gaining market share over its competitors
and raising prices. The company makes up for volume declines in the overall cigarette industry by
raising prices faster than increased government taxation and by effectively marketing its products to
gain market share from competitors. The company has proven it can grow revenue despite declines in
overall cigarette volume. Philip Morris recently increased its dividend by 6.4%, up to $4.00 per share.
Competitive Advantage & Recession Performance
Philip Morris’ competitive advantage comes from its strong brands. Marlboro is one of the most
valuable global cigarette brands. In addition, Philip Morris sells a highly addictive product and can
increase prices to offset additional taxes levied by governments around the world due to the inelastic
demand curve for its products.
Philip Morris was spun-off from its parent company Altria during the most recent recession. Tobacco
businesses have traditionally performed well through recessions, as consumers tend to smoke the same
amount (or more) of cigarettes during times of economic hardship.
Growth Prospects, Valuation, & Catalyst
Philip Morris shareholders will receive strong returns from the company’s high dividend yield, strong
share repurchases, and organic growth. The company’s long-term growth will come from the e-vapor
industry, which is still in its infancy. Philip Morris has partnered with Altria to create new products
and to license each other’s current offerings in the burgeoning e-Vapor industry, which is expected to
grow rapidly.
The company trades at a P/E ratio of about 17, which is in line with its historical P/E average. Philip
Morris is a high quality business trading at about its fair value. Its management’s capital allocation
skills are first class, which will likely result in continued strong returns for shareholders.
Maximum Drawdown (starting in year 2000): -41% in March of 2009
Dividend Stats Dividend Yield: 4.84%
10 Year Dividend Growth Rate: 10.82% for past 5 years, per year (10 year data not available)
Most Recent Dividend Increase: 6.40%
Dividend History: 31 consecutive years of dividend increases
(Counting Altria history before spin-off)

Page 14
Abbott Laboratories (ABT)
Overview & Current Events
Abbott Laboratories designs and produces nutritional products, medical devices, pharmaceuticals, and
diagnostic equipment in the health care industry. Abbott Laboratories has positioned itself to take
advantage of emerging market growth, with 40% of sales coming from emerging markets, 30% from
the US, and 30% from other developed economies.
Abbott Laboratories saw strong EPS growth for its second quarter. The company’s EPS were $0.54 for
the quarter, beating its guidance of $0.50 to $0.52. Abbott also announced it will sell its developed
market branded pharmaceutical business, and acquire pharmaceutical companies in Latin America and
Russia. The acquisitions more clearly focus the company on emerging market growth.
Next Dividend Record Date: October 15th
, 2014 Next Earnings Release: October 22nd
, 2014
Competitive Advantage & Recession Performance
Abbott Laboratories’ competitive advantage comes from its ability to develop new medical products,
devices, and pharmaceuticals, as well as have its products approved and marketed throughout the
world. The company’s product and global diversification allows it to allocate more capital where
returns are highest.
The company managed to grow revenue, earnings, and dividends each year through the Great
Recession of 2007 to 2009. Health care is one of the few areas that consumers and governments do not
cut back on, even in times of economic trouble.
Growth Prospects, Valuation, & Catalyst
Abbott Laboratories’ strong emerging market penetration gives it excellent long-term growth
prospects. As emerging markets grow, their GDP spending on health care will increase. Additionally,
the average age of people around the world is increasing. The combination of emerging market
economic growth and aging populations make an excellent macroeconomic environment to promote
Abbott Laboratories’ growth.
Abbott Laboratories is trading at a P/E ratio of about 19 (using its more accurate operating EPS, not
GAAP EPS). The company appears to be fairly valued at this point as it is trading at about the same
P/E ratio as the overall market. Gains from Abbott will come primarily from growth and dividends, not
valuation multiple increases.
Maximum Drawdown (starting in year 2000): -46% in July of 2002
Dividend Stats
Dividend Yield: 2.12%
10 Year Dividend Growth Rate: 5.84%
Most Recent Dividend Increase: 57.14%
Dividend History: 42 consecutive years of dividend increases

Page 15
Ecolab (ECL)
Overview & Current Events
Ecolab is the global leader in water, hygiene, and energy technologies and services that protect and
clean. The $33 billion dollar company provides safe food services, clean environment services, and
operational efficiencies for customers in the food, healthcare, energy, hospitality, and industrial
markets in over 170 countries throughout the world.
The company reported a sales increase of 7% and an earnings per share increase of 20% for its most
recent quarter. The company is realizing strong growth in its global energy segment due to the
company’s acquisition of energy specialty product provider Champion Technologies, and the related
synergies that have accompanied the acquisition.
Next Dividend Record Date: Mid December, 2014 Next Earnings Release: October 28th
, 2014
Competitive Advantage & Recession Performance
Ecolab’s competitive advantage comes from its excellent research and development department,
dedication to customer service, and customer trust. Ecolab has over 1,600 research and development
engineers who create new solutions for customers. The company has realized double digit new product
growth for 5 years in a row. Ecolab is also a trusted provider of energy conservation and cleaning
services for customers.
Ecolab was minimally impacted by the recession of 2007 to 2009. The company saw earnings per
share increase each year of 2007 through 2009. Revenue per share dipped slightly in 2009, but
otherwise the company was unaffected. The company’s diversified revenue stream and reliance on
large corporate clients helps insulate it from recessionary effects.
Growth Prospects, Valuation, & Catalyst
Ecolab has excellent growth prospects ahead. The company is benefiting from the global push for
cleaner food, cleaner energy, and waste reduction. Ecolab has a long growth runway ahead by
capitalizing on the macro economic trends that are currently propelling growth.
Ecolab is expected to have earnings per share of $4.15 for full fiscal 2014. The company trades at
about $113 a share, for a P/E ratio of 27 which is well above the other businesses on this list. The
company’s fantastic growth prospects and rapid growth in recent history are what will propel
shareholder returns in the future. Over time, the P/E ratio will decrease, but shareholders will likely
see solid returns from the company’s growth.
Maximum Drawdown (starting in year 2000): -42% in March of 2009
Dividend Stats
Dividend Yield: 0.96%
10 Year Dividend Growth Rate: 12.07% per year
Most Recent Dividend Increase: 19.57%
Dividend History: 40 years without a reduction, 22 consecutive years of increases

Page 16
List of All Stocks
The following 131 businesses all have 25+ years of dividend payments without a
reduction. The list is ranked in order based on the 8 Rules of Dividend Investing, with
the highest ranked stocks first. International stocks are denoted in Blue.
1. WMT 2. PEP 3. GIS 4. KO 5. MCD 6. BDX 7. XOM 8. PM 9. ABT 10. ECL 11. SJM 12. KMB 13. BCR 14. CB 15. GWW 16. HRL 17. MDT 18. MO 19. MKC 20. JNJ 21. CBSH 22. SIAL 23. MMM 24. TGT 25. SHW 26. CVX 27. CTAS
28. VAL 29. AFL 30. PNR 31. KRFT 32. WAG 33. CL 34. T 35. PG 36. HSY 37. VFC 38. UTX 39. ENB 40. GPC 41. MDLZ 42. BMS 43. ADP 44. BCE 45. HP 46. CLX 47. FTS.TO 48. ED 49. IMO 50. COP 51. ITW 52. TROW 53. DOV 54. ABBV
55. LOW 56. FFIN 57. ADM 58. TMP 59. UVV 60. SON 61. UGI 62. PH 63. SYY 64. CU.TO 65. FDO 66. MHFI 67. AWR 68. NDSN 69. BF-B 70. SWK 71. BEN 72. EV 73. BKH 74. ATO 75. FUL 76. WGL 77. EMR 78. VVC 79. AJG 80. PPG 81. MGEE
82. RLI 83. CSVI 84. TR 85. DCI 86. CTBI 87. ABM 88. RAVN 89. CLC 90. CSL 91. NWN 92. PNY 93. WEYS 94. EMP-A.TO 95. CAH 96. LANC 97. SCL 98. MSEX 99. SRCE 100. NTRS 101. EFSI 102. CTWS 103. BRC 104. JCI 105. GRC 106. MCY 107. UHT 108. RPM
109. CINF 110. STR 111. THFF 112. APD 113. OTTR 114. BWL.A 115. HCP 116. EGN 117. HARL 118. NFG 119. CWT 120. UBSI 121. SJW 122. LEG 123. DBD 124. NC 125. ORI 126. TNC 127. MSA 128. FRT 129. NUE 130. NESN 131. TDS 132. HNI
Page 17
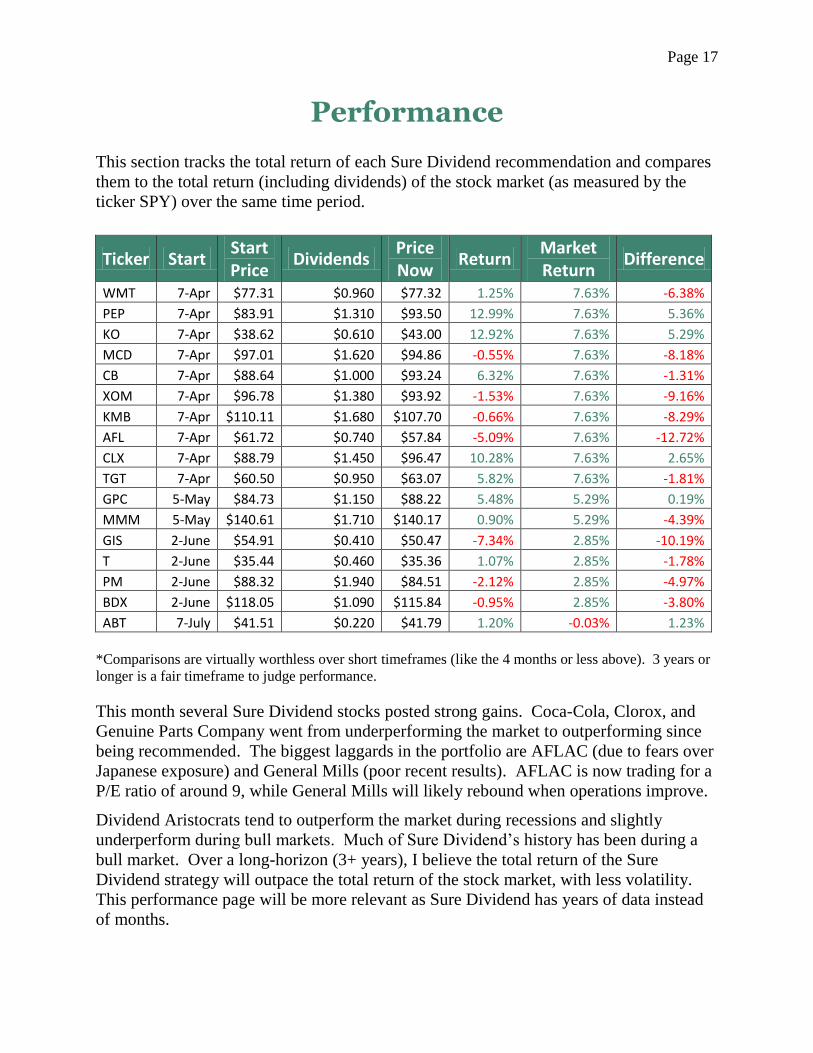
Performance This section tracks the total return of each Sure Dividend recommendation and compares
them to the total return (including dividends) of the stock market (as measured by the
ticker SPY) over the same time period.
Ticker Start Start Price
Dividends Price Now
Return Market Return
Difference
WMT 7-Apr $77.31 $0.960 $77.32 1.25% 7.63% -6.38%
PEP 7-Apr $83.91 $1.310 $93.50 12.99% 7.63% 5.36%
KO 7-Apr $38.62 $0.610 $43.00 12.92% 7.63% 5.29%
MCD 7-Apr $97.01 $1.620 $94.86 -0.55% 7.63% -8.18%
CB 7-Apr $88.64 $1.000 $93.24 6.32% 7.63% -1.31%
XOM 7-Apr $96.78 $1.380 $93.92 -1.53% 7.63% -9.16%
KMB 7-Apr $110.11 $1.680 $107.70 -0.66% 7.63% -8.29%
AFL 7-Apr $61.72 $0.740 $57.84 -5.09% 7.63% -12.72%
CLX 7-Apr $88.79 $1.450 $96.47 10.28% 7.63% 2.65%
TGT 7-Apr $60.50 $0.950 $63.07 5.82% 7.63% -1.81%
GPC 5-May $84.73 $1.150 $88.22 5.48% 5.29% 0.19%
MMM 5-May $140.61 $1.710 $140.17 0.90% 5.29% -4.39%
GIS 2-June $54.91 $0.410 $50.47 -7.34% 2.85% -10.19%
T 2-June $35.44 $0.460 $35.36 1.07% 2.85% -1.78%
PM 2-June $88.32 $1.940 $84.51 -2.12% 2.85% -4.97%
BDX 2-June $118.05 $1.090 $115.84 -0.95% 2.85% -3.80%
ABT 7-July $41.51 $0.220 $41.79 1.20% -0.03% 1.23%
*Comparisons are virtually worthless over short timeframes (like the 4 months or less above). 3 years or
longer is a fair timeframe to judge performance.
This month several Sure Dividend stocks posted strong gains. Coca-Cola, Clorox, and
Genuine Parts Company went from underperforming the market to outperforming since
being recommended. The biggest laggards in the portfolio are AFLAC (due to fears over
Japanese exposure) and General Mills (poor recent results). AFLAC is now trading for a
P/E ratio of around 9, while General Mills will likely rebound when operations improve.
Dividend Aristocrats tend to outperform the market during recessions and slightly
underperform during bull markets. Much of Sure Dividend’s history has been during a
bull market. Over a long-horizon (3+ years), I believe the total return of the Sure
Dividend strategy will outpace the total return of the stock market, with less volatility.
This performance page will be more relevant as Sure Dividend has years of data instead
of months.

Page 18
This information is not personalized advice. It is for informational purposes only. Please see disclaimer at end of newsletter for more.
Portfolio Building Guide
Each month invest in the top ranked stock in which you own the smallest dollar amount. Over
time, you will build a well-diversified portfolio of great businesses purchased at attractive prices.
Examples
Portfolio 1 Portfolio 2
Ticker Name Amount Ticker Name Amount
WMT Wal-Mart Stores Inc. $ 1,002 WMT Wal-Mart Stores Inc. $ 4,374
PEP PepsiCo Inc. $ - PEP PepsiCo Inc. $ 4,878
GIS General Mills $ - GIS General Mills $ 4,353
KO Coca-Cola Company $ - KO Coca-Cola Company $ 2,952
MCD McDonald's Corp. $ - MCD McDonald's Corp. $ 3,309
BDX Becton Dickinson & Co. $ - BDX Becton Dickinson & Co. $ 4,864
XOM ExxonMobil Corp. $ - XOM ExxonMobil Corp. $ 6,660
PM Philip Morris $ - PM Philip Morris $ 2,367
ABT Abbott Laboratories $ - ABT Abbott Laboratories $ 2,818
ECL Ecolab Inc. $ - ECL Ecolab Inc. $ 6,243
If you had portfolio 1, you would buy PepsiCo, the top ranked stock you own least.
If you had portfolio 2, you would buy Philip Morris, the top ranked stock you own least.
If you have an existing portfolio, switch over to the Sure Dividend strategy over a period of 20
months. Each month, take 1/20 of your initial portfolio value, and buy the top ranked stock you
own the least (as per the examples above).
When you sell a stock, use the proceeds to purchase the top ranked stock you own the least.
Reinvest dividends in the same manner.
This simple investing process will build a diversified portfolio of high quality dividend stocks
over a period of less than 2 years. Further, higher ranked stocks will receive proportionately
more investment dollars as they will stay on the rankings longer. You will build up large
positions in the highest quality stocks over your investing career.
Alternatively, the Top 10 list is also useful as an idea generation tool for those with a different
portfolio allocation plan.
Disclaimer Nothing presented herein is, or is intended to constitute, specific investment advice. Nothing in this newsletter should be construed as a
recommendation to follow any investment strategy or allocation. Any forward looking statements or forecasts are based on assumptions and
actual results are expected to vary from any such statements or forecasts. No reliance should be placed on any such statements or forecasts when making any investment decision. While Sure Dividend has used reasonable efforts to obtain information from reliable sources, we make no
representations or warranties as to the accuracy, reliability or completeness of third-party information presented herein. No guarantee of
investment performance is being provided and no inference to the contrary should be made. There is a risk of loss from an investment in securities. Past performance is not a guarantee of future performance.
Ending Thoughts As discussed in the opening of this newsletter, stocks with lower volatility tend to
see less drastic price declines than higher volatility stocks. Besides the
mathematical advantage to low volatility, there are several psychological
advantages to investing in low volatility high and quality businesses.
One such advantage is the ‘sleep well at night’ psychological benefit you get from
investing in less risky assets. It is much easier to convince yourself that Coca-Cola
will not fail when times get tough than it is to be convinced that a highly leveraged
mortgage REIT will, for example. This is one of the benefits of high quality stocks
that are often overlooked.
Stocks with less volatility and strong business models need less maintenance and
monitoring. It may be necessary to check into the operations of a business that is
in the middle of a turnaround frequently. High quality businesses simply take less
time to monitor for the individual investor. You can be fairly certain that Wal-
Mart’s operations will be about the same six months from now as they are today.
Less time analyzing investments means more time doing things that you enjoy
more than researching which companies make the soundest investments.
I believe a systematic approach to dividend growth investing is one of the few
opportunities in efficient capital markets to increase return while reducing both real
business risk and price volatility.
You can reach me at [email protected] with any comments, suggestions,
feedback, or reviews.
Thanks,
Ben Reynolds