survey of 2020 inspection findings
TRANSCRIPT
Survey of Inspection Findings
2020 This report, released on March 15, 2021, presents information collected by IFIAR through its ninth annual survey of the results of its member regulators’ inspections of the six largest audit firm networks.

www.ifiar.org 1
This report on IFIAR’s 2020 Survey of Inspection Findings includes an overview of IFIAR’s annual survey of audit inspection findings and highlights of the 2020 survey results. A more complete description of the survey’s methodology and details of the 2020 and prior survey results are included in the following appendices:
A Firm-wide Systems of Quality Control Inspection Results
B Engagement-level Inspection Results
C About IFIAR and the Survey of Inspection Findings
1 Overview
IFIAR, a membership organization of 54 independent audit regulators (“Members”), conducted its ninth annual survey of Members’ inspection results and programs during 2020. The survey collects data about inspection findings arising from its Members’ individual inspections of individual audit firms (“member firms”) affiliated with the six largest global audit firm networks (“GPPC networks”).1 IFIAR Members from 50 jurisdictions participated in the survey, providing data on inspection reports generally issued to the GPPC networks’ member firms during the twelve months ended June 30, 2020.2
IFIAR publishes the results of its annual survey of inspection findings to provide transparency about the results of Members’ inspection programs for stakeholders with the shared goal of consistently high quality audits globally. The annual survey of inspection findings is one of the various inputs into IFIAR’s dialogue among regulators about oversight experiences, challenges, and approaches. It also features in IFIAR’s ongoing engagement with international audit and ethics standard setters, and with the global audit firm networks about the networks’ efforts to strengthen their member firms’ systems of quality control and to drive consistent execution of high quality audits throughout the world.
1 Each of the GPPC networks is comprised of a group of legally separate firms operating locally in countries
or regions around the world. The GPPC networks participate in the Global Public Policy Committee (GPPC), represented by the following entities: BDO International Limited, Deloitte Touche Tohmatsu Limited, Ernst & Young Global Limited, Grant Thornton International Limited, KPMG International Cooperative, and PricewaterhouseCoopers International Limited.
2 IFIAR Members from the following jurisdictions participated in the 2020 survey: Australia, Austria, Belgium, Botswana, Brazil, Bulgaria, Canada, Cayman Islands, Chinese Taipei, Croatia, Cyprus, Czech Republic, Denmark, Dubai International Financial Centre, Finland, France, Georgia, Germany, Gibraltar, Greece, Indonesia, Ireland, Italy, Japan, Korea, Lithuania, Luxembourg, Malaysia, Mauritius, Netherlands, New Zealand, Norway, Philippines, Portugal, Romania, Russia, Saudi Arabia, Singapore, Slovakia, Slovenia, South Africa, Spain, Sri Lanka, Sweden, Switzerland, Thailand, Turkey, Ukraine, United Kingdom, and United States.

www.ifiar.org 2
The recurrence and level of findings reflected in the survey continue to indicate a lack of consistency in the execution of high quality audits and the need for a sustained focus on continuing improvement. IFIAR continues to encourage audit firms, on an ongoing basis, to identify areas for improvement to the systems of quality control that support their audit practices; implement responsive actions; monitor the impact of such actions; and leverage the results to adjust or refine their improvement strategies. This cycle of continuous improvement has been – and will remain – a prominent aspect of IFIAR’s dialogue with the GPPC networks.
However, the survey is not designed to – and does not – provide a complete measure of firms’ progress in improving audit quality. Inspection findings should not be the sole measure of progress in audit quality as they do not serve as “balanced score cards” or overall rating tools. Deficiencies identified and reported over the course of an inspection are nevertheless an important metric provided by independent audit regulators, forming one of the many indicators used to assess audit quality. Other quantitative and qualitative indicators also should be considered in conjunction with inspection results.
The survey provides historical, quantitative information about inspection results as one means to identify general trends in areas of findings. The survey’s information neither measures empirically changes in audit quality nor assesses the degree of severity of individual deficiencies that meet IFIAR’s definition of a finding. Trends may be impacted by variations across survey years in the composition of Members participating in the survey, the topics of focus in those Members’ inspection programs, and the mix of member firms inspected.3 In addition, changes in Members’ inspection programs may lead to variability in reporting results to the survey. IFIAR monitors the impact of changes to ensure that findings are consistently reflected in the survey. To date, no reporting changes have significantly influenced the findings or results being reported.
Effects of COVID-19
The inspection results included in the 2020 survey are for inspections of audits that concluded prior to the advent of the pandemic. The pandemic’s effects on inspection activity may be reflected in the 2021 and subsequent surveys.
During 2020, many regulators adjusted their inspection programs in response to office closures and to accommodate remote working environments and the additional challenges placed on resources. Whereas prior to the pandemic approximately three-quarters of Members responding to the survey primarily conducted inspections at the audit firms’ offices, during 2020 approximately 70% of Members reported increased use of remote inspections. The challenges presented by the pandemic required several Members to delay or reduce the number of inspections conducted in 2020, or are expected to result in delayed reporting of results. In some cases, Members indicated that risks related to the pandemic and its economic consequences will affect the profile of audits or focus areas selected for inspection. Nearly half of Members had either determined that, or were still evaluating whether, the 2020 inspection situation may affect results reported in future surveys
3 The composition of Members responding to the survey, though largely consistent across recent survey
years, can impact survey trends. To better understand the impact of changes in reporting Members, IFIAR determined that 28 Members had reported inspection findings on listed PIE audits for each of the past three survey years (2018-2020). Responses from these 28 Members account for 90% of the listed PIE audits inspected and reported on in the 2020 survey.
www.ifiar.org 3
(e.g., the timing of finalized inspection results, or the number of firms or audits inspected). IFIAR is following the effects of the COVID-19 pandemic on inspection programs. In addition to facilitating knowledge-sharing among its Members during this disruptive period, IFIAR will monitor the pandemic’s effects on inspection results through the annual inspection findings survey .
2 2020 Survey
As with prior years’ surveys, IFIAR collected information about two categories of inspection activities – those that relate to firm-wide systems of quality control and those that relate to individual audit engagements. Systems of quality control are an area of focus for many audit regulators and audit firms, as these systems serve as the foundation for executing quality audits. For insight into the effectiveness of audit firms’ systems of quality control in supporting audit quality, IFIAR also tracks the percentage of listed public interest entity (PIE) audits inspected with at least one finding. Since first tracking this statistic in 2014, the percentage of audits with findings declined from 47% to 34% as of the 2020 survey. With the exception of a one percentage point increase in the findings rate in the 2020 survey, all other survey years in this period reflected year-over-year reductions. IFIAR monitors general trends in survey findings over time, rather than seeking to evaluate year-over-year changes in aggregate results. The rate of findings remains high, and the need remains for audit firms to make continued efforts to address the high level of findings and inconsistencies. IFIAR urges the GPPC networks and their member firms to continue efforts to address the high level of findings to achieve consistently high quality audit performance. The economic uncertainty created by the global pandemic highlights the importance that independent audits provide confidence in the reliability of financial reporting.
For purposes of the survey, a finding is a significant deficiency in satisfying the requirements of auditing standards. It is important to note that a finding from an inspection of an audit engagement does not necessarily indicate that the audited financial statements are misstated or that the audit firm necessarily has a deficient system of quality control related to the finding. 4
4 For purposes of this survey, a finding is a significant deficiency in satisfying the requirements of auditing
standards. With respect to audit engagement findings related to a financial statement balance or disclosure, a deficiency is either a matter with respect to which the member firm did not obtain sufficient audit evidence to support its opinion or a failure to identify or address a material, or likely potential material, error in the application of an accounting principle. With respect to all other themes, a deficiency is a departure from auditing standards or requirements, including standards on quality control and ethics and independence requirements that may or did have an effect on audit quality, either due to the significance or systemic nature of the departure. An inspection finding related to an audit engagement does not necessarily indicate that the financial statements are misstated; the audited entity’s accounting and disclosure may have been appropriate, whether or not the auditor satisfied the requirements of auditing standards. IFIAR has not sought to quantify misstatements associated with Member findings because 1) the transparency and manners of addressing errors in financial statements vary in Members’ jurisdictions, including in some cases not restating, and 2) the regulatory mandates of many IFIAR Members do not extend to the determination of whether or not financial statements are misstated. Appendix C provides further information about the survey methodology, including information about what constitutes a finding, and Appendices A and B present details of the results compiled from past annual surveys.

www.ifiar.org 4
The sections below briefly highlight the 2020 survey’s data on inspections of firm-wide systems of quality control and on engagement-specific audit inspections. See appendices A and B for additional 2020 survey data on inspection results.
Inspections of Firm-wide Systems of Quality Control
Inspections performed on firm-wide systems of quality control address those policies and processes established by audit firms to support audit quality, including by monitoring audits for compliance with independence requirements. Appendix A of this report includes the comprehensive set of data on inspections of firm-wide systems of quality control collected through IFIAR’s 2020 and prior surveys. The chart on the left summarizes the percentage of member firms inspected with at least one finding in the indicated areas of systems of quality control.
A strong system of quality control is a critical element in improved and sustained audit quality; accordingly, quality control systems are a primary focus of many inspection programs. The variability of, and absence of a sustained trend of improvements in, quality control inspection outcomes over time continues to be of concern. IFIAR plans to continue its dialogue with the GPPC networks about each network’s initiatives to make continual improvement to systems of quality control. In addition, the International Auditing and Assurance Standards Board (IAASB) approved International Standard on Audit Quality Management 1, Quality Management for Firms that Perform Audits or Reviews of Financial Statements, or Other Assurance or Related Services Engagements (ISQM1). With an effective date of December 15, 2022, ISQM1 presents an opportunity for the GPPC networks to revisit their quality control systems with the goal of identifying the applicable risks that affect audit quality, and designing and implementing controls that best address those risks.
Inspections of Individual Audit Engagements
Inspections of individual audit engagements assess an audit firm’s execution of auditing standards on a selected audit. (As mentioned, a finding is not necessarily indicative of a financial statement misstatement.) IFIAR’s survey collects data on inspections of listed PIE audits and audits of systemically-important financial institutions (SIFIs). Appendix B of this report provides the comprehensive set of data on inspections of listed PIE and SIFI audit engagements collected through IFIAR’s 2020 and prior surveys.
IFIAR continues to track, as illustrated below, the percentage of listed PIE audits inspected with at least one finding, as one metric to understand the collective effect on engagement-level performance of member firms’ initiatives related to systems of quality controls. Although IFIAR follows the trend of survey findings over time as a measure of audit quality, for the reasons indicated at page 2 of this report, year-over-year changes are not necessarily indicative of improvements or deterioration of audit quality.

www.ifiar.org 5
2014 2015 2016 2017 2018 2019 2020
47% 43% 42% 40% 37% 33% 34%
The chart below summarizes historical survey results for the 2020 survey’s five inspection areas with the highest frequency of inspection findings for listed PIE audits.
Members’ Reporting and Follow Up of Inspection Outcomes
In addition to data on inspection findings, the 2020 survey gathered information about the 50 IFIAR Members’ inspection reporting and follow up practices.
Reporting before the inspection begins: Sixteen Members indicated that they publish the areas of focus for engagement inspections, and twelve Members indicated that they publish the areas of focus for quality control reviews.
Reporting inspection results: Local laws, regulations, and practices determine the extent to which inspection results can be disclosed to parties other than the inspected firms (for example, reported publicly or to audit committees). The following summarizes the number of surveyed Members that report inspection results to various stakeholders.
Quality Control Inspection Findings:
• 48 Members report to firm leadership
• 44 Members issue public reports, of which 11 Members identify results by individual audit firm while 33 Members do not
• 4 Members report results to audit committees / those charged with governance
Engagement Inspection Findings:
Of the 40 Members who report engagement inspections publicly:
• 29 Members do not identify results by individual audit firm
• 10 Members identify individual audit firms
• 1 Member identifies the audit firm and the audited entity

www.ifiar.org 6
Ratings:
• 10 Members report overall firm ratings based on inspections outcomes (3 publicly)
• 9 Members report ratings of quality control systems (2 publicly)
• 16 Members report ratings of audit engagement files (4 publicly)
Follow up practices: The vast majority of Members (45) indicated that they require audit firms to report back on the actions taken to address inspection findings. Thirty Members indicated that firms conduct root cause analysis, on which the firms report back to the Member. Most Members (43) have a process to determine whether they should re-inspect the firm and similar focus areas at the firm in subsequent years. All Members have the ability to refer inspection findings for investigation or enforcement.
3 Promotion of Audit Quality
Expanding upon and learning from its Members’ initiatives taken in their respective jurisdictions, IFIAR undertakes various activities in the interest of improving audit quality around the world. While responsibility for improving audit quality rests with the audit firms, IFIAR continuously promotes and influences progress towards consistent, high quality audits globally through knowledge sharing among its Members, which in turn enhance audit oversight globally. IFIAR’s Annual Reports provide details of IFIAR initiatives aimed at improving audit quality. In addition, in 2020 IFIAR issued an Information Paper, Facilitating Oversight of Global Audit Firm Networks, that, among other things, describes how IFIAR acts as a platform for Members to share knowledge and experiences and engage with global network firms to encourage the ongoing pursuit of audit quality improvements.
As part of that engagement, IFIAR’s Global Audit Quality (GAQ) Working Group uses the results of the annual inspection findings surveys to monitor efforts of the GPPC networks to improve the rate of inspection findings over time. In 2019, the GAQ Working Group renewed an initiative to measure the percentage of listed PIE audits inspected with one or more findings over a four year period between 2019 and 2023. Approximately half of IFIAR’s members participate in this initiative. The GAQ Working Group and the GPPC networks agreed that the aim is for the GPPC member firms’ collective performance to result in a reduction in the percentage of inspected audits with findings of at least 25% by the end of the measurement period. The baseline for measuring the reduction is the 2019 Survey results of 32% of audits with at least one finding reported by the participating IFIAR members. While inspection findings are an important measure of audit quality, the initiative contributes to a deeper dialogue between member firms and their local regulators, and between the GPPC networks and IFIAR, about all parties’ common interest in the continued improvement in the quality and consistency of audit performance globally. IFIAR urges the GPPC networks and their member firms to continue efforts to achieve improved audit performance while following the guidance in response to the COVID-19 issued by their relevant local regulators and applicable standard setters.

www.ifiar.org A-1
Appendix A:
Firm-wide Systems of Quality Control Inspection Results
This appendix provides information on results of the current survey, and selected data from the 2016-2019 surveys, regarding inspections of firm-wide systems of quality control. For additional information, including prior reports and related press releases, please visit ifiar.org. The first survey was conducted in 2012.
An audit firm’s system of quality control serves as a foundation for executing quality audits. Under international standards on quality control, as well as many of the national standards in place in IFIAR Member jurisdictions, audit firms are required to establish a system of quality control. A system of quality control involves a firm's organizational structure and the policies and procedures in place to provide reasonable assurance that:
▪ the firm and its personnel comply with professional standards and applicable legal and regulatory requirements, and
▪ reports issued by the firm or engagement partners are appropriate in the circumstances.
For purposes of the survey, quality control findings are departures from quality control or ethics standards, or from independence requirements, that may have had an effect on audit quality due to the significance or the systemic nature of the departure.
Quality control findings addressed in this appendix do not relate to specific audit engagements, but instead address the policies and procedures in place at the member firm to provide for overall quality control. Quality control findings are more systemic in nature; they are relevant in general to the firm’s audit practice and therefore there is an interaction between engagement-level and quality control findings. While quality control findings are attributed to a firm in general, deficiencies in its quality control system may impact the firm’s environment for individual audit engagements or for internal monitoring and oversight of audit engagements. Consequently, a deficient system of quality control would likely be manifested in engagement-level findings. In addition, issues observed in inspections of specific engagements determined to be systemic (not engagement-specific) in nature may be considered deficiencies in the effectiveness of a firm’s system of quality control.
The survey’s categories or inspection themes for quality control findings are based on the different elements of ISQC 1.5 Inspections of firm-wide systems of quality controls address
5 See IAASB International Standard on Quality Control (ISQC) 1, Quality Control for Firms that Perform
Audits and Reviews of Financial Statements, and Other Assurance and Related Services Engagements. ISQC 1 is required in many, but not all, IFIAR Member jurisdictions. In 2020, the IAASB approved the replacement of ISQC 1 with a restructured and enhanced ISQM 1, with firms being required to design and implement compliant systems of quality management by December 15, 2022.

www.ifiar.org A-2
Appendix A: Firm-wide Systems of Quality Control Inspection Results
topics such as systems and processes to manage compliance with auditor independence requirements; procedures to assess risk before accepting or continuing an audit engagement; and personnel systems regarding staff development, promotion, and assignment of audit engagement teams.
Forty-five Members reported the results of their inspections of 139 member firms’ systems of quality control in the 2020 survey, continuing the upward trend in the survey’s year-over-year increases in Member participation, as illustrated in the table below.
Table A.1
IFIAR Members Reporting and Member Firms Inspected, 2016-2020 Surveys
Table A.2 below provides information about the number and rates of member firms with findings by inspection theme. Tables A.3 and A.4 provide additional details about the number of findings by descriptive sub-categories for each theme. IFIAR began collecting findings data by sub-category for four quality control inspection themes in 2016 (see Table A.3) and for the remaining two quality control inspection themes in 2018 (see Table A.4).
Table A.2
2016-2020 Survey Results: Member Firms with at Least One Finding by Inspection Theme
As a summary, Figure A.1 below presents historical survey results for findings related to firm-wide systems of quality control.
2020 2019 2018 2017 2016IFIAR Members Submitting Findings 45 42 37 32 33Audit Firms Inspected 139 143 132 111 127
Inspection Theme # % # % # % # % # %
Engagement Performance 58 43% 60 43% 69 53% 60 55% 55 49%
Independence and Ethical
Requirements37 32% 56 42% 41 32% 45 41% 43 40%
Monitoring 35 30% 31 24% 27 21% 40 36% 29 28%
Human Resources 31 25% 33 28% 35 31% 39 38% 29 31%
Client Risk Assessment, Acceptance,
and Continuance22 20% 29 23% 20 18% 23 21% 26 25%
Leadership Responsibilities for Quality
within the Firm14 12% 22 17% 16 14% 17 16% 12 12%
Audit Firms with at
Least One Quality
Control Finding
Audit Firms with at
Least One Quality
Control Finding
2017 20162020
Audit Firms with at
Least One Quality
Control Finding
2019
Audit Firms with at
Least One Quality
Control Finding
2018
Audit Firms with at
Least One Quality
Control Finding

www.ifiar.org A-3
Appendix A: Firm-wide Systems of Quality Control Inspection Results
Figure A.1:
Percentage of Inspected Member Firms with Quality Control Findings

Appendix A: Firm-Wide Systems of Quality Control Inspection Results
www.ifiar.org A-4
Table A.3
2016-2020 Supplemental Details on Nature of Findings for Select Inspection Themes
2020 2019 2018 2017 2016
Failure to establish and/or implement policies and procedures for sufficient, timely
engagement supervision and review New in 201727 37 25 68
Insufficent depth / extent of engagement quality control review (EQCR) New in 2017 24 23 26 85
Audit methodology and guidance 12 39 32 30 12
Failure to perform a timely EQCR, although required by firm or other applicable policies New
in 20179 18 10 9
Failure to establish policies and procedures for EQCR that provides an objective evaluation of
the significant judgements made by the engagement team8 15 8 6 99
Consultations 6 5 9 14 6
Failure to monitor effectively Firm staff and partner personal independence 20 58 32 15 17
Failure to consider and evaluate nonaudit and/or auditrelated services provided to issuer 16 22 17 14 23
Failure to communicate to the audit committee certain relationships that, in the firm's
professional judgment, bear on independence8 10 7 9 6
Failure to appropriately consider applicable firm or partner rotation rules 8 11 5 15 2
Failure to maintain independence due to existence of financial relationships including failure
to appropriately address those circumstances as impairments of the Firm’s independence 7 7 7 20 0
Failure to implement a reliable system for tracking business relationships, audit firm financial
interests, and corporate family trees, and/or failure to keep the related information up to
date New in 2017
6 10 8 11
Failure to maintain independence due to a business relationship that existed during the
professional engagement period4 2 0 1 1
Failure to maintain independence due to an individual on the audit engagement entering into
an employment relationship with the former audit client0 1 1 1 4
Compliance with the firm training and learning plan 13 10 12 22 6
Evaluation of audit quality as part of partner performance evaluations and admissions 10 21 12 19 13
Assignment of engagement team 5 14 10 10 13
Impact of audit quality deficiencies in partner remuneration and assignments 2 5 5 12 5
Failure to identify audit performance issues when performing internal inspections in order to
effectively monitor audit quality and respond to possible systemic deficiencies concerning
the performance of audits
16 14 21 25 23
Failures in the area of root cause analysis / remedial actions 13 10 7 27 41
Failure to effectively design and implement preissuance reviews to monitor the
effectiveness of the remedial actions4 3 2 6 5
Theme Sub CategoryInspection Theme
Monitoring
Human Resources
Engagement
Performance
Independence and
Ethical Requirements
Number of Findings

Appendix A: Firm-Wide Systems of Quality Control Inspection Results
www.ifiar.org A-5
Data for the following quality control themes was collected for the first time in 2018.
Table A.4
2018-2020 Supplemental Details on Nature of Findings for Select Inspection Themes
2020 2019 2018
Failure in the procedures and systems implemented to identify actual of perceived conflicts
of interest or independence issue with an actual or prospective client (including failures in
the reliability/updates of the databases used)7 4 4
Failure to address actual or perceived conflicts of interest or independence issue 7 1 1
Insufficient procedures were performed and/or reliable information obtained to objectively
assess the integrity of a new client6 10 10
Failure to assess the engagement risk associated with a new client, a new service or a service
requested under specific circumstances4 1 3
Failure to assess at least on a yearly basis the acceptance of continuance of an engagement 3 3 0
Continuance assessment did not include consideration of significant matters that had arisen
during the current or previous engagements 1 6 2
An engagement was accepted in an industry where the firm did not have sufficient personnel
with the necessary experience and skills1 0 0
Failure to consult with the risk management function or equivalent when the risk is assessed
as being high0 6 1
Failure to implement procedures to monitor personal and firm independence or business
relationships0 1 1
Failure of firm leadership to promote high audit quality as a nonnegotiable/principal aim of
the firm6 14 6
Failure of firm leadership to communicate on a regular basis examples and demonstrations of
positive values and behavior4 3 3
Failure of firm leadership to demonstrate the values identified as key to the organization 2 4 3
Client Risk
Assessment,
Acceptance and
Continuance
Leadership
Responsibilities for
Quality within the
Firm (i.e., Tone at the
Top)
Theme Sub CategoryInspection ThemeNumber of Findings

www.ifiar.org B-1
Appendix B: Engagement-level Inspection Results
This appendix provides information on results from the current survey, and selected data from the 2016-2019 surveys, regarding inspections of listed PIE and SIFI audit engagements. For additional information, including prior reports and related press releases, please visit ifiar.org. The first survey was conducted in 2012.
The survey collects data on inspections of audits of listed public interest entities and of systemically important financial institutions. The global population of SIFIs is somewhat limited, such that the number of SIFI audits inspected annually and reported on in the IFIAR survey is significantly smaller than the number of listed PIE audits inspected.
IFIAR collects data on 17 inspection themes for listed PIE audit inspections and on 16 themes for SIFI audit inspections; six of the SIFI inspection themes differ from the listed PIE themes, to gather more specific information about aspects of audits that typically are more prevalent in SIFI audit engagements. Survey responses provide data about the number of audits in which each theme was inspected; the number of inspected audits with at least one finding; and the total number of findings (as one inspected audit can have more than one finding per theme).
IFIAR has observed that the average rate of inspections with findings varies considerably across IFIAR Members and between years. This may be due to a number of factors unrelated to the actual state of audit quality in Members’ jurisdictions. For example, the member firms and the individual listed PIE audits inspected vary year to year. Most Members participating in the 2020 survey do not inspect each GPPC or each Big Four firm annually. Some Members are requiredto inspect the audits of certain companies within a certain frequency (e.g., at least once every three years). Other Members may choose to select certain engagements based on factors other than risk. Findings rates may be impacted when more engagements are selected (i.e., with an increased sample size) or, related to the point above, the greater diversity in risk profiles of audits selected (i.e., diversification of the sample population’s characteristics).

www.ifiar.org B-2
Appendix B: Engagement-level Inspection Results
Section 1: Listed PIE Audits Inspected
A. Data on Members Reporting and Audits Inspected
Table B.1
IFIAR Members Reporting and Listed PIE Audits Inspected, 2016-2020 Surveys
Figures B.1 and B.2
Geographic Distribution of Members and Listed PIE Audits Inspected, 2020 Survey
In 2020, IFIAR collected information about the size and industries of the listed PIEs whose audits were inspected and reported on in the survey. Recognizing the wide disparity in the sizes of IFIAR Members’ equity markets, IFIAR used three categories of market capitalization, determined by each IFIAR Member relative to its own market. Members provided information about relative market size for 97% of the listed PIE audits inspected, summarized in the two figures below.
2020 2019 2018 2017 2016IFIAR Members Submitting File Inspection Findings 42 42 39 33 34 Audit Firms Inspected 131 134 141 120 121 Listed PIE Audits Inspected 898 926 921 918 855 Inspected Listed PIE Audits with at Least One Finding 301 309 343 366 363
Frequency of Inspections with at Least One Finding 34% 33% 37% 40% 42%
B.1: Members Providing Listed PIE Audit Inspections Data
B.2: Listed PIE Audits Inspected

www.ifiar.org B-3
Appendix B: Engagement-level Inspection Results
Figure B.3
Listed PIE Audits Inspected by Market Capitalization, 2019 and 2020 Survey
Figure B.4
Percentage of Listed PIE Audits Inspected with and without Findings by Market Capitalization, 2018-2020 Survey
2019 2020

www.ifiar.org B-4
Appendix B: Engagement-level Inspection Results
Figure B.5
Listed PIE Audits Inspected by Industry, 2020 Survey

www.ifiar.org B-5
Appendix B: Engagement-level Inspection Results
Figure B.6
Percentage of Listed PIE Audits Inspected with and without Findings by Industry, 2019 and 2020 Survey
The survey data may not reflect the most current state of audit performance. This is in part due to the time necessary, after completion of a financial statement audit, for the inspection to occur and for the inspected member firm and the audit regulator to complete any required processes that precede issuance of a final inspection report. As a result of this reporting time lag, actions undertaken to improve audit quality may not be reflected immediately in IFIAR’s published survey results. The chart below illustrates this time lag, allocating the inspected audits reported in the 2020 survey by the fiscal year end of the listed PIEs’ audited financial statements.

www.ifiar.org B-6
Appendix B: Engagement-level Inspection Results
Figure B.7
Fiscal Year Ends of Listed PIE Audits Inspected, 2020 Survey
www.ifiar.org
Appendix B: Engagement-level Inspection Results
B-7
B. Data on Inspection Results
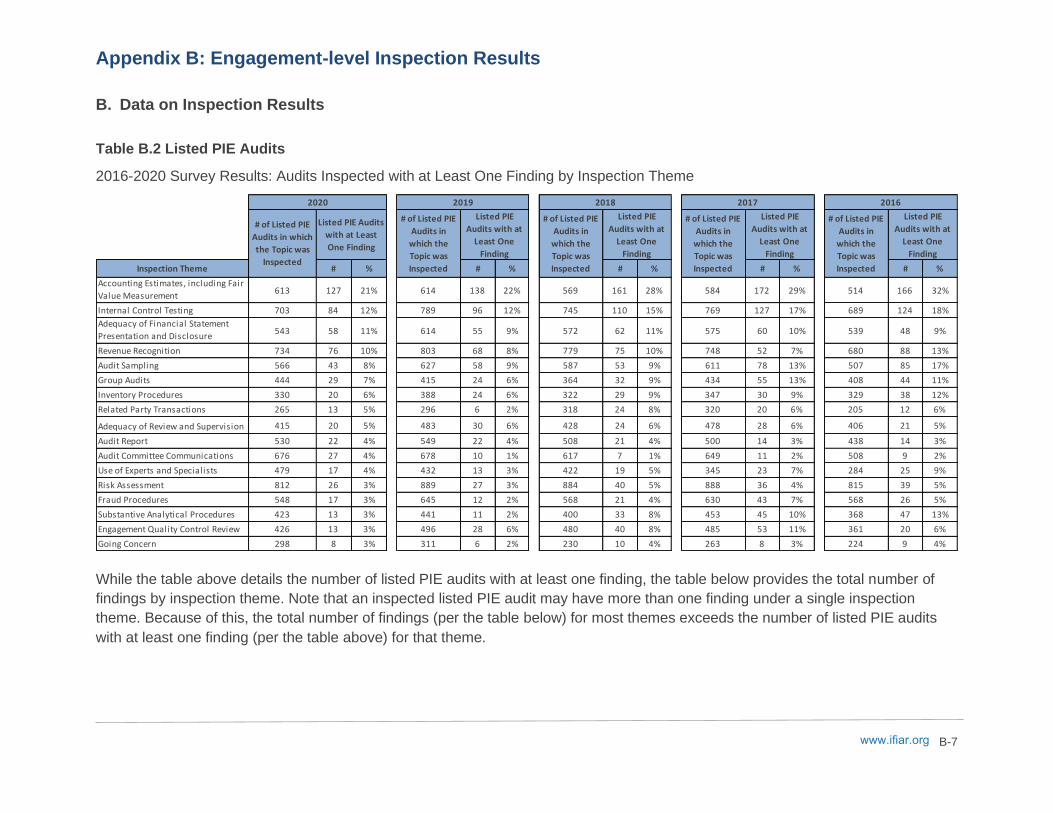
Table B.2 Listed PIE Audits
2016-2020 Survey Results: Audits Inspected with at Least One Finding by Inspection Theme
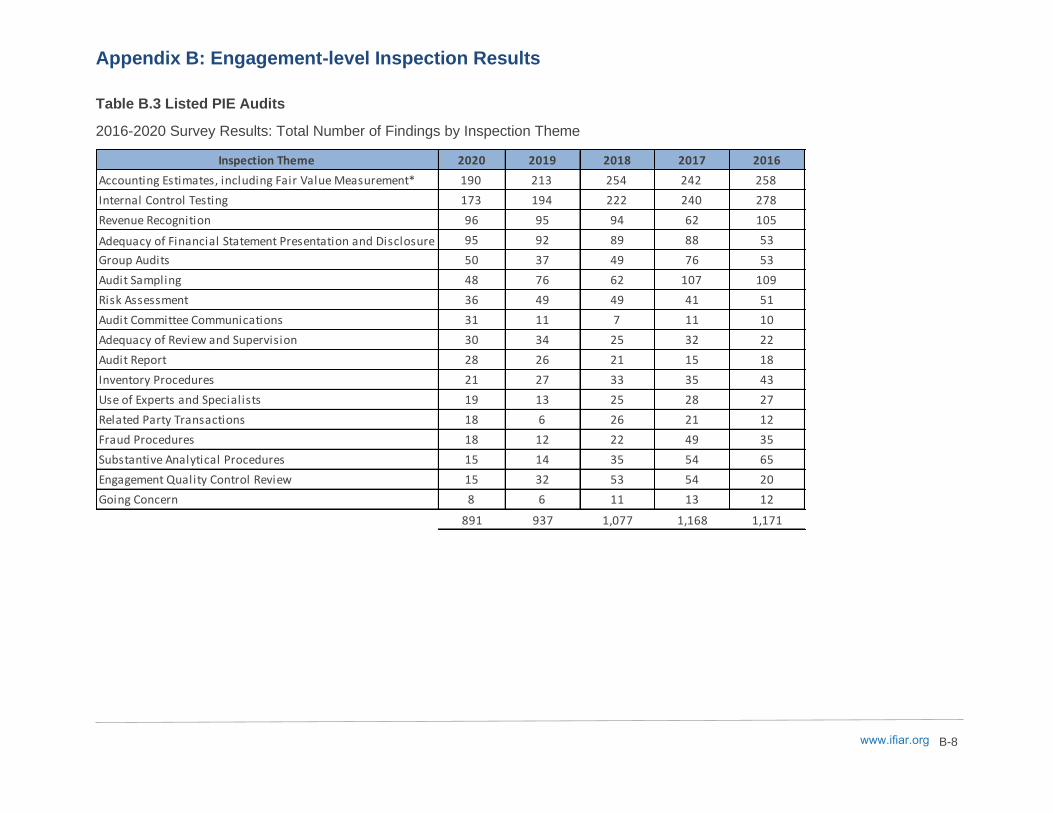
While the table above details the number of listed PIE audits with at least one finding, the table below provides the total number of findings by inspection theme. Note that an inspected listed PIE audit may have more than one finding under a single inspection theme. Because of this, the total number of findings (per the table below) for most themes exceeds the number of listed PIE audits with at least one finding (per the table above) for that theme.
Inspection Theme # % # % # % # % # %
Accounting Estimates, including Fair
Value Measurement613 127 21% 614 138 22% 569 161 28% 584 172 29% 514 166 32%
Internal Control Testing 703 84 12% 789 96 12% 745 110 15% 769 127 17% 689 124 18%
Adequacy of Financial Statement
Presentation and Disclosure543 58 11% 614 55 9% 572 62 11% 575 60 10% 539 48 9%
Revenue Recognition 734 76 10% 803 68 8% 779 75 10% 748 52 7% 680 88 13%
Audit Sampling 566 43 8% 627 58 9% 587 53 9% 611 78 13% 507 85 17%
Group Audits 444 29 7% 415 24 6% 364 32 9% 434 55 13% 408 44 11%
Inventory Procedures 330 20 6% 388 24 6% 322 29 9% 347 30 9% 329 38 12%
Related Party Transactions 265 13 5% 296 6 2% 318 24 8% 320 20 6% 205 12 6%
Adequacy of Review and Supervision 415 20 5% 483 30 6% 428 24 6% 478 28 6% 406 21 5%
Audit Report 530 22 4% 549 22 4% 508 21 4% 500 14 3% 438 14 3%
Audit Committee Communications 676 27 4% 678 10 1% 617 7 1% 649 11 2% 508 9 2%
Use of Experts and Specialists 479 17 4% 432 13 3% 422 19 5% 345 23 7% 284 25 9%
Risk Assessment 812 26 3% 889 27 3% 884 40 5% 888 36 4% 815 39 5%
Fraud Procedures 548 17 3% 645 12 2% 568 21 4% 630 43 7% 568 26 5%
Substantive Analytical Procedures 423 13 3% 441 11 2% 400 33 8% 453 45 10% 368 47 13%
Engagement Quality Control Review 426 13 3% 496 28 6% 480 40 8% 485 53 11% 361 20 6%
Going Concern 298 8 3% 311 6 2% 230 10 4% 263 8 3% 224 9 4%
2020
# of Listed PIE
Audits in which
the Topic was
Inspected
Listed PIE Audits
with at Least
One Finding
2019
# of Listed PIE
Audits in
which the
Topic was
Inspected
Listed PIE
Audits with at
Least One
Finding
2016
# of Listed PIE
Audits in
which the
Topic was
Inspected
Listed PIE
Audits with at
Least One
Finding
2018
# of Listed PIE
Audits in
which the
Topic was
Inspected
Listed PIE
Audits with at
Least One
Finding
2017
# of Listed PIE
Audits in
which the
Topic was
Inspected
Listed PIE
Audits with at
Least One
Finding
www.ifiar.org
Appendix B: Engagement-level Inspection Results
B-8
Table B.3 Listed PIE Audits
2016-2020 Survey Results: Total Number of Findings by Inspection Theme
Inspection Theme 2020 2019 2018 2017 2016
Accounting Estimates, including Fair Value Measurement* 190 213 254 242 258
Internal Control Testing 173 194 222 240 278
Revenue Recognition 96 95 94 62 105
Adequacy of Financial Statement Presentation and Disclosure 95 92 89 88 53
Group Audits 50 37 49 76 53
Audit Sampling 48 76 62 107 109
Risk Assessment 36 49 49 41 51
Audit Committee Communications 31 11 7 11 10
Adequacy of Review and Supervision 30 34 25 32 22
Audit Report 28 26 21 15 18
Inventory Procedures 21 27 33 35 43
Use of Experts and Specialists 19 13 25 28 27
Related Party Transactions 18 6 26 21 12
Fraud Procedures 18 12 22 49 35
Substantive Analytical Procedures 15 14 35 54 65
Engagement Quality Control Review 15 32 53 54 20
Going Concern 8 6 11 13 12
891 937 1,077 1,168 1,171

www.ifiar.org
Appendix B: Engagement-level Inspection Results
B-9
In the 2016-2020 surveys, certain IFIAR Members provided additional details regarding findings in the areas of Internal Control Testing, Accounting Estimates and Revenue Recognition. In 2019, IFIAR began collecting additional details on three more topics – Group Audits, Adequacy of Financial Statement Presentation and Disclosure, and Audit Sampling – to provide information on those inspection themes with higher rates of findings. Not all Members reporting listed PIE audit inspection findings provided this supplemental information.
Table B.4 Listed PIE Audits
2016-2020 Supplemental Details on Nature of Findings for Select Inspection Themes
2020 2019 2018 2017 2016
Reasonableness of assumptions When testing an accounting estimate, failure to assess the
reasonableness of assumptions including consideration of contrary or inconsistent evidence
where applicable
102 115 131 128 117
Failure to sufficiently test the accuracy of the data 34 34 45 45 25
Failure to perform sufficient risk assessment procedures 28 24 38 25 38
Failure to adequately consider indicators of bias 11 16 4 11 5
Failure to take relevant variables into account 6 8 17 19 17
Failure to evaluate how management considered alternative assumptions 4 10 12 13 8
Failure to obtain sufficient persuasive evidence to support reliance on manual internal
controls71 76 95 88 106
Failure to sufficiently test controls over, or the accuracy and completeness of, data or reports
produced by management38 54 48 56 77
Failure to sufficiently evaluate the severity of control deficiencies 14 16 11 15 1
Failure to sufficiently test information technology general and application controls 8 14 20 25 19
Failure to appropiately adjust testing as a result of ineffective controls 5 3 10 9 2
Failure to adequately assess the appropriateness of placing reliance on the work of others 0 7 3 5 9
Failure to sufficiently understand the terms and conditions of complex arrangements and the
impact on the accounting37 29 22 10 13
Failure to perform procedures to determine whether revenue was recorded in the
appropriate period17 14 20 10 26
Failure to appropriately assess and respond to the risk of fraud in revenue recognition 13 19 27 25 36
Failure to sufficiently consider the adequacy of footnote disclosures (excluding segment data) 46 44
Failure to identify or assess appropriateness of financial statement classification or
presentation, including the Statement of Cash Flows44 37
Failure to evaluate and test segment data presentation 3 6
Insufficient sample to reduce sampling risk to an acceptable low level 35 37
Failure to design appropriate procedures to achieve the test objective, and/or to perform
suitable alternative procedures when necessary6 25
Sample selected for testing is biased and/or not representative of the population 3 9
Failure to investigate the nature and cause of any deviations and project misstatement to the
population0 4
Failure to sufficiently consider the nature, timing and extent of involvement with the
component auditor’s work including evidence of reviews performed23 13
Failure to develop a group audit plan (e.g. scoping) and/or appropriately communicate
instructions to the component auditor8 12
Failure to appropriately calculate materiality for the group and the related component audits 3 4
Failure to appropriately resolve issues identified by the component auditor 2 2
Adequacy of Financial
Statement
Presentation and
Disclosures
Audit Sampling
Group Audits
Data not collected
Theme Sub Category
Accounting Estimates,
including Fair Value
Measurement
Internal Control
Testing
Number of Findings
Revenue Recognition
Inspection Theme

www.ifiar.org
Appendix B: Engagement-level Inspection Results
B-10
When aggregating Members’ survey data, the percentage of audits inspected with findings generally is higher for Members that inspect relatively fewer audits annually than for those Members inspecting larger numbers of audits. Figure B.8 below illustrates these variations. The large majority of Members participating in the survey reported results from inspections of between 1 and 20 listed PIE audits. It is important to note that the inspection findings rates within each grouping below also varies considerably. Additionally, the composition of the groupings changes between years due to variability in Members’ inspections activities and their participation in the annual survey. As a result, year-over-year trends for each group below are not necessarily indicative of trends for a consistent population.
Figure B.8:
2014-2020 Percentage of Listed PIE Audits Inspected with Findings by Size of Inspection Program

www.ifiar.org
Appendix B: Engagement-level Inspection Results
B-11
Section 2: SIFI Audits Inspected
The IFIAR survey collects inspection data specific to audits of SIFIs. These SIFIs include both banks and insurance companies. Some of these SIFIs are considered global SIFIs.6 Many are listed companies and, therefore, the findings from inspections of these SIFIs also are included in the survey’s listed PIE inspection results.
The number of SIFI audits inspected is lower than listed PIE audits inspected due to the limited number of financial institutions deemed to be SIFIs. Trends in survey data for this limited population therefore provide limited information.
SIFI Audit Inspection Findings
Globally, the number of SIFIs is significantly smaller than the number of listed PIEs. The small number of SIFIs in certain jurisdictions may introduce confidentiality considerations that prevent a Member from reporting SIFI inspection results for purposes of the survey. Further, in some jurisdictions, the IFIAR Member responsible for audit oversight of listed PIE audits may not have authority for oversight of financial institution audits. For these reasons, the survey reports on a significantly lower number of inspected SIFI audits than of inspected listed PIE audits. While IFIAR’s cautions on seeking to analyze trends in survey results apply to all areas of the survey, this is particularly important with the relatively small population of SIFIs.
2020 2019 2018 2017 2016 Members reporting SIFI results 16 14 15 12 12 Number of SIFI audits 27 35 40 37 35 Number of audits with at least one inspection finding
14 9 17 20 17
Percentage of SIFI audits with at least one inspection finding
52% 26% 43% 54% 49%
The table below provides details from the 2016-2020 surveys for the calculation by inspection theme of the percentage of SIFI audits with at least one inspection finding.
6 Based on the most recent data as of the survey data collection period published by the Financial Stability
Board regarding financial institutions that are considered systemically-important globally, or G-SIFIs (see the FSB press releases on global systemically important banks and global systemically important insurers).

www.ifiar.org
Appendix B: Engagement-level Inspection Results
B-12
Table B.5 SIFI Audits
2016-2020 Survey Results: Audits Inspected with at Least One Finding by Inspection Theme
While the table above details the number of SIFI audits with at least one finding, the table below provides the total number of findings by inspection theme for each year the survey was conducted. Note that an inspected SIFI audit may have more than one finding
Inspection Theme# % # % # % # % # %
Audit of Allowance for Loan Losses
and Loan Impairments 26 11 42% 30 3 10% 27 8 30% 25 9 36% 25 3 12%
Internal Control Testing 18 7 39% 33 4 12% 32 7 22% 33 10 30% 32 8 25%
Valuation of Investments and
Securities 16 4 25% 32 2 6% 30 4 13% 18 2 11% 20 3 15%
Substantive Analytical Procedures 12 2 17% 23 1 4% 25 4 16% 22 4 18% 23 3 13%
Testing of Customer Deposits and
Loans 12 2 17% 24 4 17% 19 2 11% 7 5 71% 21 3 14%
Insufficient Challenge and Testing
of Management's Judgments and
Assessments 13 2 15% 25 2 8% 31 5 16% 22 7 32% 22 3 14%
Group Audits 7 1 14% 15 1 7% 12 0 0% 13 0 0% 15 1 7%
Use of Experts and Specialists 15 2 13% 26 0 0% 32 4 13% 18 2 11% 16 5 31%
Risk Assessment 17 2 12% 33 2 6% 35 6 17% 33 2 6% 26 0 0%
Fraud Procedures 12 1 8% 29 2 7% 31 3 10% 26 0 0% 19 3 16%
Audit Committee Communications 17 1 6% 26 0 0% 31 0 0% 28 1 4% 27 0 0%
Adequacy of Financial Statement
Presentation and Disclosures 19 0 0% 27 3 11% 37 11 30% 25 2 8% 25 2 8%
Audit Report 19 0 0% 26 1 4% 28 3 11% 24 0 0% 25 2 8%
Audit Methodology, including
Programs and Tools 11 0 0% 25 1 4% 17 0 0% 14 1 7% 19 3 16%
Going Concern 3 0 0% 22 0 0% ** ** ** ** ** ** ** ** **
Audit of Insurance Contract
Liabilities 2 0 0% 11 0 0% 17 3 18% 15 4 27% 12 2 17%
** Data for this theme was not collected during the survey year
2020
Number of
SIFI Audits in
which the
Topic was
Inspected
SIFI Audits
with at Least
One Finding
2019
Number of
SIFI Audits in
which the
Topic was
Inspected
SIFI Audits
with at Least
One Finding
Number of
SIFI Audits in
which the
Topic was
Inspected
2018
Number of
SIFI Audits in
which the
Topic was
Inspected
SIFI Audits
with at Least
One Finding
2017
SIFI Audits
with at Least
One Finding
2016
Number of
SIFI Audits in
which the
Topic was
Inspected
SIFI Audits
with at Least
One Finding

www.ifiar.org
Appendix B: Engagement-level Inspection Results
B-13
under a single inspection theme. Because of this, the total number of findings for some themes (per the table below) exceeds the number of SIFI audits with at least one finding (per the table above) for that theme.
Table B.6 SIFI Audits
2016-2020 Survey Results: Total Number of Findings by Inspection Theme
Inspection Theme 2020 2019 2018 2017 2016
Audit of Allowance for Loan Losses and Loan Impairments 20 5 17 17 3
Internal Control Testing 17 10 14 11 10
Risk Assessment 4 4 6 2 0
Valuation of Investments and Securities 4 2 5 3 3
Use of Experts and Specialists 4 0 4 2 6
Insufficient Challenge and Testing of Management's Judgments
and Assessments 3 3 6 10 3
Testing of Customer Deposits and Loans 2 6 9 5 3
Substantive Analytical Procedures 2 1 4 5 3
Audit Committee Communications 2 0 0 1 0
Fraud Procedures 1 2 3 0 3
Group Audits 1 1 0 0 1
Adequacy of Financial Statement Presentation and Disclosure 0 3 12 2 2
Audit Report 0 1 3 0 2
Audit Methodology, including Programs and Tools 0 1 0 6 5
Audit of Insurance Contract Liabilities 0 0 4 6 2
Going Concern 0 0 ** ** **
60 39 87 70 46
** Data for this theme was not collected during the survey year.

www.ifiar.org C-1
Appendix C: About IFIAR and the Survey of Inspection Findings
About IFIAR
IFIAR is a membership organization of audit regulators that are independent from the audit profession.7 IFIAR’s membership includes 54 audit regulators from jurisdictions in Africa, the Americas, Asia-Pacific, Europe, and the Middle East. IFIAR focuses on the following activities:
• Sharing knowledge of the evolving audit environment and practical experience of independent audit regulatory activity with a focus on inspections of auditors and audit firms,
• Promoting collaboration and consistency in regulatory activity, and
• Providing a platform for dialogue with other international organizations that have an interest in audit quality.
An audit firm network is composed of individual audit firms that are members of a global organization. Many audits today involve practitioners from network member firms in a number of countries. The audit of a multinational company may involve significant work performed by many, legally separate audit firms that operate as a network. The audit firms within the network often have a common name and common auditing, quality control, and ethics policies and requirements. The multinational aspects of audit, and the involvement of many local audit firms that are members of a global firm network, call for collaboration by regulators globally.
Through IFIAR, audit regulators seek to coordinate their understanding and assessments of trends in and challenges to audit quality. IFIAR’s work positions its Members to evaluate the various issues discussed at the global level with the member firms in their own jurisdictions. Exchanges of perspectives and experiences with fellow IFIAR Members reinforces audit regulators’ efforts to promote an audit function that provides the expected degree of confidence in financial reporting.
The Inspection Findings Survey
In 2012, IFIAR initiated an annual survey of findings resulting from its Members’ inspections of audit firms affiliated with the six largest global audit firm networks.8 The aim of the survey is not to measure empirically, or for statistically significant, changes in audit quality; rather, the survey indicates areas of common audit shortcomings and their trends over time, and informs IFIAR’s
7 More information on IFIAR and its activities can be found at ifiar.org.
8 See here for past survey reports. Prior to the 2015 survey, Members also could choose to report inspection findings related to other firms considered significant in the reporting Members’ jurisdictions (see footnote 10 of the 2015 survey report for information about the impact of this change).

www.ifiar.org C-2
Appendix C: About IFIAR and the Survey of Inspection Findings
efforts to identify areas for discussion among regulators and with audit firm networks and other stakeholders in audit quality.
The survey relates to two types of findings communicated in writing to an inspected member firm in a formal inspection report at the conclusion of an inspection: (1) those related to audit engagements and (2) those related to the member firms’ firm-wide systems of quality control. With respect to audit engagement findings related to a financial statement balance or disclosure, a deficiency is either a matter with respect to which the member firm did not obtain sufficient audit evidence to support its opinion or a failure to identify or address a material, or likely potential material, error in the application of an accounting principle. With respect to all other themes, a deficiency is a departure from auditing standards or requirements, including standards on quality control and ethics and independence requirements that may or did have an effect on audit quality, either due to the significance or systemic nature of the departure. Quality control findings relate to processes and procedures employed on a firm-wide basis by the firm subject to inspection, rather than to work performed on specific audit engagements.
There may be a substantial passage of time from when an audit is completed until an inspection is performed, a final report issued, and the inspections results are reported in IFIAR’s survey. Because of this reporting time lag, actions already under way or taken now to improve audit quality may take time to be reflected in IFIAR’s published survey results. Therefore, the survey is a lagging indicator and may not reflect the state of the auditing profession at the current time. (See Appendix B, Figure B.7 for information collected in the 2020 survey to understand the extent of the lag.)
IFIAR Members are instructed not to report findings from more than one annual inspection cycle, and to report only on findings related to member firms located in their jurisdiction. Therefore, the findings from no more than one inspection report per member firm are submitted for the survey.
All IFIAR Members are asked to respond to IFIAR’s surveys of inspection findings. The surveys solicit data on Members’ findings from inspections of:
• member firms’ firm-wide systems of quality control;
• audits of listed PIEs, including any listed SIFIs; and
• audits of SIFIs, whether or not a listed entity.9
In all years, information was collected on the total number of inspection findings by inspection theme. Respondents reported findings categorized into 17 inspection themes for audits of listed PIEs. Separately, the survey solicited data on findings from inspections of audits of G-SIFIs and other SIFIs, reported using 16 inspection themes relevant to audits of financial institutions. For each inspection theme, Members reported 1) the number of audits inspected, 2) the number of inspected audits with at least one finding, and 3) the total number of findings. The frequency of
9 The survey also collected findings data on inspections of global SIFIs, or G-SIFIs. Due to national
confidentiality limitations and the limited number of G-SIFIs, IFIAR does not publish the results of G-SIFI audit inspections but considers this information for internal purposes.

www.ifiar.org C-3
Appendix C: About IFIAR and the Survey of Inspection Findings
findings by theme is calculated as the number of inspected audits with at least one finding divided by the number of audits inspected for that theme. Findings from inspections of firm-wide systems of quality control were reported using six themes. For each quality control inspection theme, Members reported 1) the number of member firms inspected, 2) the number of inspected member firms with at least one finding, and 3) the total number of findings. The frequency of findings by quality control theme is calculated as the number of inspected member firms with at least one finding divided by the number of member firms inspected for that quality control theme.
The survey also included questions about Members’ observations from their inspection activities, with particular focus on practices related to root cause analysis.
The approach taken for the 2020 survey was generally consistent with that used in prior surveys. Previously, various changes were made to the engagement inspection themes.
▪ For SIFI audits, a new theme of “Going Concern” was added in 2019 in light of the increased scrutiny that audits of financial institutions have received.
▪ For listed PIE audits, “Audit Sampling” was added in the 2016 survey to collect better information on findings related to specific audit procedures. In prior surveys, sampling was an example listed under both the “Revenue Recognition” and “Inventory” themes. Certain audit regulators have observed that deficiencies in sampling occur irrespective of the income statement or balance sheet accounts that are the subject of the audit procedure; accordingly, IFIAR Members sought to collect specific information on the frequency of findings related to sampling.10,11 IFIAR Members were asked to indicate whether the addition of the Audit Sampling theme resulted in an increase in the total number of findings reported; all participating Members confirmed that the new theme did not affect the total number of findings reported in the survey, as compared to the Members’ approaches to reporting data for prior surveys.
▪ For SIFI audits, a new theme of “Audit of Insurance Contract Liabilities” was added in 2016. This is an area with anticipated forthcoming changes in accounting standards and disclosures, increasing interest in understanding the extent of audit issues currently identified by regulators.
▪ In the 2016 survey, the listed PIE inspection themes called “Fair Value Measurement” and “Allowance for Loan Losses” in previous surveys were combined; the revised description of this theme is “Accounting Estimates, including Fair Value Measurement”. This renamed theme is broader than the prior themes; for example, accounting estimates related to a
10 Note that Audit Sampling findings reported on listed PIE audit engagements relate to deficiencies in a
specific audit engagement in the application of audit standards on sampling. Findings related to a firm’s audit methodology for sampling would be considered a firm-wide quality control finding and reported as an “Engagement Performance” finding.
11 Related to this change, the theme previously called “Inventory” was revised to “Inventory Procedures” to better reflect auditing standards that require specific procedures to test inventory quantities. Findings related to sampling approaches used when testing inventory are reported under the Audit Sampling theme, and findings related to inventory valuation or reserves are reported under the Accounting Estimates theme.

www.ifiar.org C-4
Appendix C: About IFIAR and the Survey of Inspection Findings
provision or reserve that is accounted for at an amount other than fair value would be included under this description. This change does not apply to reporting on SIFI audit inspection findings. Findings related to accounting estimates for SIFI audits are reported by more detailed themes to enable more specific reporting on customary matters addressed in financial institution audits. These more detailed accounting estimate themes include “Valuation of Investments and Securities”, “Insufficient Challenge and Testing of Management’s Judgments and Assessments”, and “Audit of Allowance for Loan Losses”.
▪ In the 2015 survey, a new category of findings, “Audit Report”, was added. For those audits conducted using ISAs, a new standard for audit reporting, ISA 701, Communicating Key Audit Matters in the Independent Auditor’s Report, is applicable to audits of financial statements for periods ended on or after December 15, 2016.12 In some jurisdictions, expanded reporting by auditors already had begun prior to ISA 701’s implementation date. IFIAR started collecting survey data on findings related to the Audit Report to monitor trends in findings in this area as the form and content of the auditor’s report evolves.
Individual Members’ classification of findings may change over time, due in part to clarifications and additional instructions provided to assist Members in determining how to classify a finding that relates to multiple themes. For example, a finding about risk assessment related to fraud procedures in the area of revenue recognition could be placed under one of three themes (indicated in bold). To minimize differences in judgment between Members completing the survey, Members periodically are provided additional instructions to improve consistency of individual Members’ approaches to reporting for purposes of the survey (in the example provided, under the “Revenue Recognition” theme).
Beginning with the 2016 survey, IFIAR provides additional guidance to Members to assist in their determination of which financial institutions are considered to be SIFIs in their jurisdiction. This effort is aimed at collecting data about this important category of reporting companies with aspects of financial reporting that require extensive judgment and estimates and, therefore, present particular audit considerations.
Beginning with the 2015 survey, reporting on findings is limited to inspections of a member firmof one of the six GPPC networks.13 Not all GPPC networks’ audit practices are of significant size in all IFIAR Member jurisdictions, and other firms not covered by this survey may play a
12 For more information about ISA 701, see here.
13 IFIAR does not collect data by firm for the survey’s inspection findings themes. Because of this, it has not adjusted prior survey information to remove findings related to audit firms that are not part of a GPPC network. To assess the general impact non-GPPC network audit firms had on survey results prior to 2015, IFIAR considered the total number of audit firms and listed PIE audits inspected, and the frequency at which those audits had at least one finding. The 2014 survey included findings from 62 listed PIE audits inspected at 18 non-GPPC network audit firms. Had these inspection results been excluded from the 2014 survey, the frequency of listed PIE audit files inspected and with at least one finding would have been 46%; this compares to 47% with these non-GPPC network audit firms included, as reported in the report on the 2014 survey. The exclusion of findings from inspections of non-GPPC network audit firms in the 2015 survey is not expected to have a significant impact on general trends or frequency of inspection themes.

www.ifiar.org C-5
Appendix C: About IFIAR and the Survey of Inspection Findings
significant role in certain jurisdictions. However, the GPPC networks include the six audit firm networks that are most common across IFIAR Members’ jurisdictions, and IFIAR’s discussions with audit firms to date have focused on the GPPC networks. Through its GAQ Working Group, IFIAR has deepened its discussions with the GPPC networks on findings, root cause analysis, and the networks’ plans to take responsive action to improve audit quality. Collecting data about findings only on the member firms that are part of the GPPC networks should assist IFIAR in a targeted discussion with the networks on trends in findings and audit quality.