surveys in applied economics: models of consumer …agecon2.tamu.edu/people/faculty/capps-oral/agec...
TRANSCRIPT

Surveys in Applied Economics: Models of Consumer Behaviour
Alan Brown; Angus Deaton
The Economic Journal, Vol. 82, No. 328. (Dec., 1972), pp. 1145-1236.
Stable URL:
http://links.jstor.org/sici?sici=0013-0133%28197212%2982%3A328%3C1145%3ASIAEMO%3E2.0.CO%3B2-1
The Economic Journal is currently published by Royal Economic Society.
Your use of the JSTOR archive indicates your acceptance of JSTOR's Terms and Conditions of Use, available athttp://www.jstor.org/about/terms.html. JSTOR's Terms and Conditions of Use provides, in part, that unless you have obtainedprior permission, you may not download an entire issue of a journal or multiple copies of articles, and you may use content inthe JSTOR archive only for your personal, non-commercial use.
Please contact the publisher regarding any further use of this work. Publisher contact information may be obtained athttp://www.jstor.org/journals/res.html.
Each copy of any part of a JSTOR transmission must contain the same copyright notice that appears on the screen or printedpage of such transmission.
The JSTOR Archive is a trusted digital repository providing for long-term preservation and access to leading academicjournals and scholarly literature from around the world. The Archive is supported by libraries, scholarly societies, publishers,and foundations. It is an initiative of JSTOR, a not-for-profit organization with a mission to help the scholarly community takeadvantage of advances in technology. For more information regarding JSTOR, please contact [email protected].
http://www.jstor.orgWed Jan 23 13:09:58 2008

THE ECONOMIC JOURNAL DECEMBER 1972
SURVEYS IN APPLIED EC0NOMICS:l MODELS O F CONSUMER BEHAVIOUR 2 9 3
I. Brief History and Introduction 11. The Theory of Consumer Behaviour and its Relevance to
Demand Analysis
1 The static theory of consumer preference 2 Separability and homogeneity 3 Aggregation
111. The Analysis of Household Budgets
1 The measurement of Engel curves 2 The effects of household composition
IV. Complete Systems of Demand Equations
1 Introduction 2 Models for testing the theory 3 The linear expenditure system 4 The indirect addilog system 5 Price elasticities from budget data 6 Other models of demand 7 Specification and estimation problems
V. Attempts to Construct Models for Durable Goods Bibliography
1 This is the fourth of a series sponsored jointly by the Social Science Research Council and the Royal Economic Society.
2 The authors are indebted to many colleagues for help and discussion but in particular wish to record their gratitude to Richard Stone and to the editors of JOURNAL. The greater part of Sections I11 and V was written by Brown while Section IV was written by Deaton; otherwise the authors accept joint responsibility.
Our coverage is of the applications of models of consumer behaviour; attention is paid to the theory of consumer demand only in so far as it is relevant to applied work. We thus do not cover the welfare aspects of consumer theory and this is taken to include the problems of index numbers of the cost of living. Readers interested in the latter may refer to items [77], [201] and [811 in the bibliography; modern developments in the pure theory of consumer preference are well covered in the symposium [37]. For different reasons, mainly those relating to space, we are not concerned with the consumption function itself but only with the allocation of total expenditure over different goods.
No. 328.-~0~. 82. 1145 4 F

1146 THE ECONOMIC JOURNAL [DEC.
INthe history of demand analysis two threads, related but separable, can be discerned. These are first the work of economists interested in the discovery of general laws governing the operation of markets, particularly agricultural markets; and second the work of those, originally statisticians, interested in the psychological laws governing what has come to be called consumer preference. This dichotomy continues to characterise the subject. As computing opportunities and skills have expanded, empirical research has produced more sophisticated demand equations while, at the same time, theoretical economists and mathematicians have enormously increased our knowledge of the pure mathematics of preference relations. While these two activities have not always been in balance, the great strength of empirical demand analysis has been the existence of strong theoretical foundations which could be drawn upon or modified as practice demanded. This interplay between the theory and reality has been perhaps more fruitful in this than in any other branch of economics.
Of the two strands, the empirical may claim historical precedence in the work of Davenant [48] who published in 1699 a numerical schedule of the demand for wheat derived three years earlier by Gregory King [I 191. In the eighteenth century such writers as Verri [236] and Lloyd [I411 gradually sorted out the independent influences of demand and supply on market prices, and by 1776 Adam Smith could write " price varies directly as the quantity demanded, which depends on price; and inversely as the quantity supplied, which also depends on price " [195].
Meanwhile it may be claimed that in 1730 Daniel Bernouilli [2 11 had laid the foundation of preference theory by writing that " any increase in wealth, no matter how insignificant, will always result in an increase in utility which is inversely proportional to the quantity of goods already possessed " [21]. This idea, namely that of a logarithmic utility function, was extended to the response of human beings to a physical stimulus by Weber in 1834 [238] and as such has played an important role in applied psychology. Later in the nineteenth century the specific elements of preference theory in economics were constructed by various writers whose aim was to provide a secure axiomatic foundation for the model of market equilibrium suggested by Smith. An essential part of this is the proposition that demand curves slope downwards, and it seemed acceptable to mathe- matical economists such as Gossen, Jevons, Walras, and Edgeworth to rest this proposition on a generalisation of Bernouilli's concept of utility. Thus Edgeworth defined a cardinal utility function in which the purchased quantities of each good are arguments and the marginal utility of each good is a decreasing function of the quantity. Edgeworth, however, also origi- nated the concept of indifference curves, and Fisher and Pareto were able to establish the essence of the modern theory on the assumption of ordinal

19721 1147MODELS OF CONSUMER BEHAVIOUR
rather than cardinal utility, and diminishing marginal rates of substitution rather than decreasing marginal utilities. The scene was then set for a mathematically rigorous exposition of the theory by Slutsky in 1915 [194]. We shall return to this later.
Throughout the eighteenth and nineteenth centuries the empirical approach had made little or no progress in the measurement of demand curves despite its early and promising beginning. In large part this was due to the fact that the techniques of correlation and regression were not developed by statisticians until late in the nineteenth century. Significant progress was however made in the investigation of the influence of income on consumption patterns, and the credit for this goes to such statisticians as Baxter, Ducpetiaux, Dieterici, and LePlay who collected and tabulated family budgets. In particular an outstanding contribution was made by Engel who in 1857 formulated what turned out to be enduring empirical laws governing the relation between income and particular categories of expenditure.
In the late nineteenth century the fusion of the theoretical and empirical approaches in the writings of Marshall was perhaps the catalyst which encouraged agricultural economists to apply the newly discovered technique of correlation to the analysis of single markets. In our present context Marshall's great contribution was the clarification and elaboration of the concept of elasticity of demand which offered a precise framework within which numerical measurement of market characteristics could be effected.
I t was, of course, no accident that agricultural commodities were the first to be studied and indeed have provided econometricians with some of their most convincing successes. For partial equilibrium analysis based on fitting single equations requires, ideally, a homogeneous commodity with a simple quantity dimension, stable consumer preferences, and relatively large fluctuations or trends in supply which are independent of the current market price; and these conditions are most nearly met by many agricul- tural staples. In 1907 Benini [19] used multiple regression analysis to esti- mate a demand function for coffee in Italy with the prices of coffee and sugar as arguments. In 1910 Pigou [I661 was doubtful of the possibility of extend- ing what he called this (( direct " method to many commodities, where shifting demand schedules and the influence of price expectations would violate the necessary conditions for success; he therefore suggested an " indirect " method of deriving price elasticities from family budget data, which he illustrated by an analysis of expenditure on food and on clothing. In this he foreshadowed much later work based on the " independent wants " hypothesis, to which we shall refer later. But his idea had no immediate impact, and most of the progress made in the next forty years was along the line pioneered by Benini.
In 1914 Lehfeldt [128] estimated the elasticity of the demand for wheat in England under the direct inspiration of Marshall, the first major work in

1148 THE ECONOMIC JOURNAL [DEC.
this field since Davenant and King. But the serious progress in the econo- metric study of demand was achieved by agricultural economists in the United States, beginning with Moore, who published a number of important studies between 1914 and 1929. Anticipated by the neglected work of Lenoir published in 19 13, Moore explicitly discussed the problem of shifting supply and demand curves and of short- and long-run positions of market equilibrium. Moore's work stimulated not only statisticians interested in estimation techniques and the relation between correlation analysis and causal models but also economists interested in the construction of many- equation models describing the total operation of markets. Among the former we may mention in particular Yule and Hotelling, and among the latter Working, Schultz, Ezekiel and Leontief, though there is a large over- lap between the work of the two groups. During the 1930s modern sampling theory also began to make its contribution to measurement problems, or more precisely to the measurement of estimation and forecasting error, since most of the work of this period was based on relatively short time series. In this context we may again mention Hotelling, together with Snedecor and Frisch, the last of whom drew attention to some of the specific pathological problems of economic time-series, notably that of multi-collinearity. Also at this time there were two important developments in England. First there was the independent rediscovery of the Slutsky model of consumer preference by Allen and Hicks in 1934 which firmly established this theory among English-reading economists and econometricians; and second the work of Allen and Bowley on the analysis of British family bud- gets, which marks the first major analysis of cross-section data based on a theoretical model.
By 1939, then, most of the strengths and weaknesses of what we may call classical demand analysis had been probed and most of the techniques still in use had been discovered. We may characterise this classical approach as consisting of the application of variations in least-squares single-equation fitting, to both time-series and cross-section data, of market models based as far as possible on the theoretical results of Slutsky, Allen and Hicks. Much of this work, together with a great deal of empirical analysis, was drawn together by Schultz in 1938 [I 9 I]. However, because of the Second World War it was not until the 1950s that fully systematic treatments of this approach were published. The books by Wold [240] and Stone [203] can be regarded as a consolidation of the theoretical and empirical work on static demand models in the first half of this century.
Since then there have been a number of important developments. On the theoretical side many of these derive directly or indirectly from an earlier stimulus, Samuelson's introduction in 1938 of the language of re- vealed preference theory [184]. Though this did not in the end lead to a new theory of consumer demand, it did succeed in increasing our under- standing of the properties of the old. The debate which eventually estab-
19721 MODELS OF CONSUMER BEHAVIOUR 1149
lished the equivalence of the two models yielded a number of important by-products. Not least of these was the solution in 1950 by Houthakker [I031 and Samuelson [I881 of the long-standing consistency or integrability problem, or the derivation of conditions under which demand functions may lead back to a preference mapping. Furthermore, as Houthakker has pointed out [110], the discussion of revealed preference focused much more attention on the observable consequences of demand theory. More recently, the analytical tools which were first tried out in this debate have been much refined: most of preference theory today makes little use of the methods of differential calculus which were the basis of the classical treatment, using instead the methods of modern mathematical topology. We shall not follow these developments; though the techniques are undoubtedly of great power, they do not seem as yet to have yielded empirically useful material over and above that provided by the old theory.
On the empirical side, developments since the early 'fifties have not always taken the course which might have been expected. Taking for example the work of Stone as a starting point, certain topics stand out clearly as areas for further investigation. In particular, three might be mentioned: the extension of the analysis to a wider range of commodities, the treatment of the special problems associated with durable goods and application of the more sophisticated computational and econometric techniques which have since become available. Though work has been done in each of these areas, it is only in the analysis by Houthakker and Taylor [113] of a wide range of commodities in the United States that there exists an updating of the Stone methodology in this direction. This contribution and its applica- tions to other countries will be dealt with in section V of this survey. How-ever, this has not been the main direction of research in the last twenty years.
While the questions to which the classical approach addressed itself were of the type " what is the income or price elasticity of good X ? "
more recent investigations have posed and begun to answer some more fundamental questions. These are basically questions of methodology: for example, how should demand functions be specified ? what is the best way of allowing for changes in prices? These are questions of how to go about measuring elasticities rather than questions about what numerical values these coefficients should take. In particular attention has focused on the theory of demand and its relevance to applied demand analysis. In this context the theory is regarded not as part of general equilibrium analysis or of welfare theory but as a tool of empirical investigation. These develop- ments have not taken place consciously or deliberately; in the first instance it was undoubtedly the development of electronic computation facilities which made ~ossible the estimation of complete systems of demand equations derived from theoretical considerations. Though the main object of this work was originally the estimation of the parameters of these models, more recently attention has turned rather to the testing of the empirical validity

1150 THE ECONOMIC: JOURNAL [DEC.
of the models themselves. This latter endeavour, much the more difficult of the two, is welcomed not only by those who continually search for new scope to apply more powerful statistical techniques, but also by those who deplore the uncritical proliferation of models and parameter estimates made possible by the computer. I t is these developments in the analysis of models of demand rather than in demand analysis itself which will provide our main concern in this survey. I t is thus convenient to lay out in some detail in this introduction what such investigations are designed to achieve and how they relate to the basic objectives of applied demand analysis.
The problem with which demand analysts are fundamentally concerned is to find out how the demand for a commodity will alter as certain specified variables change. This information is usually required for a specified moment in time and for some aggregation of individuals, either for all consumers or for some sub-group. If we decide to work in per tapita terms in order to neutralise changes of scale in the population, the problem is to discover how the allocation of the average budget over different commodities will respond to outside changes. In particular we are interested in the effects of changes in real income per head, the structure of relative prices and the distribution of income, and we should like to have a means of allowing for the introduction of new commodities and changes in tastes. All this is of considerable importance; the increase in the number of large econometric models and the general increase in interest in models for plan- ning and policy formulation offers a wide area for the positive application of any results which are achieved. Consumers' expenditure is the largest item in the gross domestic product of most economies and thus the usefulness of disaggregated planning or prediction is likely to depend on its correct allocation. The changing structure of industry over time depends crucially on the evolution of the elements of consumers' expenditure in response to increasing income while knowledge of price responses is an important element in the formulation of fiscal policy or any other type of economic control.
For many practical purposes it may be sufficient to estimate separately a set of single equation models, one for each category of consumers' expendi- ture. For example, each equation might express the quantity purchased of each good per head of population as a function of average per capita income, the price of the good relative to some overall price index, and time as a catch-all for changes in the distribution of income, the introduction of new products and steady changes in tastes. A functional form must be chosen for the demand equations; it is very convenient to think in terms of elasticities which are dimensionless, and so we might choose a double log- arithmic function which gives the elasticities directly as coefficients. Thus we write

19721 MODELS OF CONSUMER BEHAVIOUR 1151
where as, bs, el and esd are constants, the latter two being interpreted as income and own price ela~ticities,~ qs is the quantity purchased of the ith good per head of population, pt is its price, p is total money expenditure per head, .rr is a price index of all prices and t is time. If good i is supposed to be a close substitute or complement for some other good then we may include the price of that good in the demand function; we then estimate another parameter, which is interpreted as a cross price elasticity. This is essentially the method of analysis used by Stone and by others in the early 'fifties and we shall refer to it as the " pragmatic " approach. I t is prag- matic in the sense that it includes those variables in which we are directly interested, ignoring or summarising others.
However, there are a number of difficulties with such a treatment. Take, for example, the assumption embodied in equation ( I ) , that the elasticities are the same at all values of the exogenous variables. Although this is convenient methodologically we should not expect it to be true over any but the shortest range, and when working with time series, for econometric purposes we should like our time span to be as long as possible. Typically nations become richer over time, and we might expect goods which are luxuries on average when the inhabitants of the country are poor to become more and more necessities as real incomes increase. But there is an even more basic problem: if all income elasticities were really constant, those goods with elasticities greater than unity would, as real income increased, come to dominate the budget and eventually would lead to the sum of expenditures on each of the categories being greater than the total expendi- ture being allocated, an obvious absurdity. Thus even if the model fits the data well when estimated, we know that if it is used to project forward it will eventually lead to silly results. Although this can in practice be avoided by a suitable scaling of the projections, confidence in such a model is naturally diminished. Obviously we need a model with changing elasticities and we need some theory of how we might expect them to change.
But even if we choose an alternative form for the demand equations which surmounts these difficulties we shall be faced with problems of another kind. Though, strictly, aper capita demand equation depends upon the distribution of income as well as upon the behaviour of individuals, it is tempting to ignore this factor and to consider what type of behaviour on the part of a single consumer would give rise to a demand function of the type under consideration. And even though, as we shall see, the characteristics of individual behaviour are unlikely to be reproduced in the aggregate, that is not in itself any justification for using an aggregate demand function which at the level of the individual implies implausible behaviour. O n the contrary it could be argued that the " representative " consumer is
Strictly eri is not the own price elasticity since a change in& also affects nand thus real income: the error may be taken to be small.

1152 THE ECONOMIC JOURNAL [DEC.
likely to be represented somewhere in the population. To take the case in hand, we may write the demand function in the more general form
where the function is chosen so that the aggregation difficulties are met and such that the elasticities for each good change in a sensible way. Even now, there are strong restrictions on the type of behaviour allowed. For example, if income and all prices were to change by the same proportion, real income and relative prices would not change and the quantities bought would remain the same. This absence of money illusion is an attractive property for demand functions to possess; nevertheless it may not be true. Consumers may suffer from money illusion and it could be argued that it is part of the task of demand analysis to discover whether or not it exists rather than to use as a starting point a model which precludes it. The assumption that all prices, except that of the good itself and perhaps those of one or two closely related goods, may be subsumed into a general price index is clearly even more restrictive. The testing of an assumption of this magnitude is of considerable interest.
I t should then be clear that the choice of demand model itself has important implications; strong a priori notions are built into the analysis by the choice of model and these will interact with the data to yield results which to some extent will be affected by the model chosen. At the same time such strong preconceptions are inevitable; some functional form must serve as a basis for estimation, and even then when it has been chosen it will in most circumstances be possible to estimate only a few parameters for each commodity. This constraint, which is due to the lack of independent varia- tion between the prices and income in most time series, rules out the possi- bility of overcoming some of the specification problems by estimating an equation involving all the prices simultaneously. Faced with all these con- siderations, and with the necessity of justifying the demand function chosen, it is perhaps natural that investigators have turned to the theory of demand as a tool for deriving the necessary constraints and for organising their a prior; assumptions. Because the theory is well worked out and well under- stood, demand equations which embody it will be guarded from some of the absurdities and inconsistencies which may arise from pragmatic models if the latter are used without considerable care and expertise. In addition it may be possible to derive aggregate models based oi a plausible aggrega- tion of individual behaviour according to the theory, and this would be an excellent basis for estimation and testing. But even failing this last possi- bility, a model based on preference theory still offers a practicable alternative to the pragmatic approach and it is this alternative which has been most extensively explored in recent years.
We thus begin the main body of this survey in section I1 with a review

19721 1153MODELS OF CONSUMER BEHAVIOUR
of the theory of consumer demand and how it may be applied and used in demand analysis. This section falls into three parts. The first is a descrip- tion of the conventional utility theory of consumer preference as applied to the single individual, using the now standard matrix notation; this derives the results of maximising a utility function subject to a budget constraint and shows what limits are placed on the behaviour of the individual by his observing the postulates of the theory. The second part deals with the effects of assuming particular structures for the consumer's preferences; we discuss the empirical consequences of grouping commodities by the type of < c use-value " they yield to the consumer. Finally we deal with the rela- tionship between the theory, which relates to a single consumer purchasing a large number of homogenous goods, and the application of that theory, which must be to groups of consumers purchasing relatively few commodity groupings; this relationship poses the problems of aggregation over con- sumers and commodities. I t is worth summarising the main conclusions of each of these three parts.
By and large the theory is very successful at generating empirically useful restrictions on behaviour, at least at the individual level. The first two of these we have already discussed; expenditures on each of the commodities must add up to total expenditure and a proportionate change in income and prices must leave all quantities unaltered. Further restric- tions relate to the substitution effects of price changes : these responses measure the effects of prices other than those which operate through changes in real income. If the consumer is to behave consistently then it turns out that the substitution effect on the number of units bought of good i in response to a change in the price per unit of good j must be the same as the substitution effect on good j of the same change in the price per unit of good i, no matter how the units are defined. Finally, an increase in the price of a good must depress the quantity of it purchased if, once again, real income changes are corrected for. These conditions may be strengthened further if a priori knowledge suggests that it is possible to break up the utility function into more or less independent c c sub "-utility functions each relating to some group of goods, perhaps because such goods serve some particular need. This procedure can be carried on to generate as many restrictions as may be desired; in the limit, if we impose the assumption that preferences are additive so that the marginal utility of each good is independent of the quantities consumed of all of the other goods-and this is only plausible for broad categories of goods-it is possible to derive the magnitudes of all the substitution responses from the income responses and one price response only. These assumptions about the structure of preferences can also be used to provide a solution to the problem of how to combine goods into groups.
Clearly then the conventional theory is a fertile source of ideas about how to choose assumptions which place restrictions on behaviour, and it provides

1154 THE ECONOMIC JOURNAL [DEC.
a powerful tool for organising apriori notions about behaviour and the nature of various goods. Certainly it is sufficiently powerful in practice to offer a viable alternative in applied work to the pragmatic approach. But the question remains as to whether we are really entitled to use the theory as a basis for models of aggregate demand. I n the last part of section I1 we shall see that, in general, per capita aggregate demand models need not obey the restrictions which apply to individuals even if each individual member of the aggregate does in fact obey them. The trouble lies not only in changes in the distribution of income but also in differences of conception between aggregate and individual substitution effects. For the change in money income required to keep real income per head constant in the face of a price change is not the same in general as the sum of the changes in money incomes necessary to compensate each individual separately. I n conse-quence of both of these factors additional terms to deal with distributional effects have to be brought into the per capita equation if such a model is to be properly based upon the theory.
However, this is not a line of attack which has been followed by many authors; instead most have implicitly ignored the aggregation problem and have used utility functions or the constraints of the theory as if average per capita data were generated by one single consumer possessed of average per capita income and behaving according to demand theory. Though this might be justified as an approximation in certain circumstances, in particular when the distribution of income is relatively constant, it does ignore important considerations. For example, this methodology could not dis- tinguish a good which was extremely income elastic but which was consumed evenly throughout the population from a good, perhaps newly introduced, the consumption of which was rapidly spreading among the consuming public. In summary then, the theory does not provide, what might have been expected, the ideal way of setting up experiments in demand analysis; instead it provides one way of investigating demand phenomena, a way which has some advantages over alternatives and some disadvantages. Although it provides a coherent methodology for progress and organisation of research, the elegance with which it handles some problems is purchased at the price of ignoring others altogether.
The application of this methodology is less useful in some areas than in others. In particular the restrictions implied by the theory, with the excep- tion of the adding-up constraint, relate to price rather than income responses, and for many practical purposes the effects of changes in income are of greater importance than those of changes in prices. In many circumstances it may even be possible to ignore the substitution effect of prices altogether and deal with the income effect only, by working with real rather than with money income. Indeed, in many forecasting and planning situations this must be done of necessity since the economist often has a much clearer idea of the future course of real income than he has of likely changes in relative
19721 1155MODELS OF CONSUMER BEHAVIOUR
prices. When this simplification is introduced, the single equation method is freed from many of the difficulties met in dealing with price effects, and interest centres now on the precise nature of one relationship, the Engel curve, or the relationship between purchases and income when prices are held constant. A great number of possibilities have been suggested and some of these are graphed in the diagrams on pages 1177-1 179. Section I11 of this survey reviews the analysis of this relationship using cross-section informa- tion on the budget decisions of households. This section falls into two parts; the first discusses the shapes of the Engel curves themselves while the second examines means for allowing for the effects of different house- hold composition and size.
Even here, where a relatively small number of influences are being studied, no final set of conclusions has yet been reached. Indeed, the double logarithmic is still the most popular form of Engel curve'in practical use and this contradicts the sole restriction (i.e., aggregation) which does apply to budget studies. Nor has recent research discovered more enduring or more complex " universal laws " relating to income elasticities than those put forward by Engel and Schwabe more than a century ago. Thus it is difficult here to highlight general numerical results other than those which are fairly obvious a priori. As a typical example, Houthakker [107], analysing some sixty budget inquiries from thirty-three countries gathered at widely differing times, could find relatively few regularities: food always had an income elasticity less than one (Engel's law), housing usually did so (Schwabe's law), and the elasticity of demand for clothes was usually higher than unity though rarely by very much. However there existed very considerable variation from sample to sample and though in some cases there seemed to be evidence of an inverse relationship between elasticity and income-food elasticities close to unity for India contrasted with values as low as one third for some of the British samples-this tendency was contra- dicted often enough to rule out obvious generalisations.
In section I V we return to the analysis of the full range of price effects and it is here that the methodology based on demand theory has its most important applications. I n the first part of the review we concentrate on those models which have been set up to test various postulates based on the theory; there are a number of these and it is possible from the results of their application to make fairly general statements about the performance of demand theory in this type of empirical application. Of the postulates of the standard model only one, the absence of money illusion, has given consistent trouble; there is however some evidence to suggest that this result can be traced to individual anomalies. Otherwise, the aggregate data do not seem to show any features which are visibly inconsistent with what would be expected from the postulates derived from demand theory, plus the assumption that the pattern of average consumption per head at different dates can be taken as being generated by the unchanging

1156 THE ECONOMIC JOURNAL [DEC.
preferences of a single consumer. This test cannot, of its nature, prove that these assumptions hold good, in the normal sense of the term, nor that the values of parameters deduced from them would prove a good guide to what would happen if, for example, there were a major change in the distribution of incomes. But this is, of course, a general problem and goes well beyond the special problems of demand analysis; the best we can hope for is that theoretical constructs are consistent with the best observations available. We may never prove their validity nor expect them to hold good in worlds different from those we observe.
I t also seems to be a fairly general result that further restrictions on the structure of demand are contradicted by the evidence. In particular the data discredit the postulate that the wants satisfied by broad categories of goods are independent. This is an important result because in many practical situations there are so few effective degrees of freedom that only models embodying very strong restrictions may be estimated at all. Want independence is a favourite way of generating these restrictions and many widely applied models incorporate this hypothesis; there must therefore be doubts as to whether such models allow for price effects in an appropriate way.
Having thus obtained some " feel )'for the general properties of demand systems we continue this section with reviews of other important models. I n particular we survey the linear expenditure system, the indirect addilog model and attempts to derive price from income elasticities dating from Pigou onwards. The section concludes with a brief review of the econometric problems. I n discussing these models we emphasise the internal structure of each of the systems since it is this as much as the data to which it is applied that determines the results which are finally achieved. Since few authors use similar commodity classifications and since a wide range of estimation procedures are still in use, we have not attempted to compare or to summar- ise the numerical values of their parameter estimates. We concentrate instead on the prior methodological issues of model construction and attempt to draw conclusions about the models themselves rather than to use the models to draw simple numerical conclusions from the data.
In Section V we discuss some of the more important attempts to build models which can deal with the special problems of durable goods. I n the models discussed so far, purchases have been assumed to be indistinguishable from consumption, but with durable goods this is not true; purchases in one period are not fully consumed and so are still partially present in subsequent periods to affect future purchases and consumption. The way in which this interaction takes place can be formulated in a number of different ways and we shall review models which allow stocks of goods to afFect current behaviour as well as those which analyse a simple form of habit formation. Such models are known as dynamic demand models.
Though there do exist complete dynamic demand models, and several

1157 19721 MODELS OF CONSUMER BEHAVIOUR
of these have been estimated, they are less advanced and somewhat less satisfactory than their static counterparts. Most of the more successful work with dynamic models rests on the single equation pragmatic approach with which we began; the problems of allowing for the dynamic effects are sufficient in themselves without complicating matters by worrying overmuch about the specification of price effects. This work has shown quite clearly that, for some goods at least, it is important to fit equations of a type which permit long-run responses to differ from short-run. The usefulness of dynamic models is not confined to studies of purchases of durable goods: they may be equally useful for studies of non-durable goods when purchases of these are affected by habit formation. We conclude this part with some discussion of the way in which new goods are absorbed into the pattern of consumption.
Returning to our starting point-the synthesis of demand analysis represented by the works of Schultz, Stone and Wold-we may review the progress made since then. In so far as the practical objective of applied demand analysis is the definitive tabulation of elasticities for a wide range of commodities, countries and circumstances, we have not moved significantly forward in the last twenty years. On the other hand, considerable progress has been observed in the examination of different methods for attempting to reach this objective and we have increased our understanding of the tools and methodology of demand analysis. tVe have a greater grasp of the type of model which is likely to be appropriate in a given situation and of the sort of postulate which is likely to prove fruitful in fitting econometric models. This is important since the validity of any set of estimated elasticities must depend upon the appropriateness of the postulates adopted in the models used to derive these estimates. As we have seen, it is never possible to fit parameter estimates to models without assumptions and in most cases these must be both numerous and restrictive. The estimation of parameters in models becomes more and more a routine exercise as rapid computing facili- ties become more accessible: the economist's attention will accordingly be less directed to the statistical and computing problems and more directed to the selection of appropriate data, and to specification of appropriate models involving reasonable postulates which can themselves be tested: these are the fundamental problems of consumer demand analysis.
One may perhaps question the fruitfulness of this recent concentration of research effort on the analysis of complete demand systems, since, super- ficially at least, it scems to have achieved relatively little. The main difficulty for the present from a practical point of view is the overemphasis on the substitution effects of price changes; most available resources both of research time and data information are devoted to the study of this limited area. Accordingly it is difficult to allow for other factors within this framework or to permit any but the simplest specification of the effects of income changes. Single equation models, even if less satisfactory from a

1158 THE ECONOMIC JOURNAL [DEC.
theoretical point of view, may still be able to out-perform complete models in terms of fit to past experience and ability to project the future. But to take this as a final judgment on the usefulness of the analysis of complete demand systems may well be less than fair both to the potential of the approach for the future and to its broader significance as of now. For such work has given economists experience of testing and applying a relatively sophisticated set of theoretically derived postulates to actual data and this is not an opportunity which is often available to the social scientist. The fact that these possibilities exist in economics and have been successfully applied in at least one field is likely to lead economic theorists to pay greater attention to the observable counterparts of their theoretical models and will encourage those econometricians who know and understand the data avail- able to build models of their own and to modify existing models in the light of their detailed experience. There are still ample opportunities in applied demand analysis for both theoretical and empirical work of a high order in the successful combination of the theoretical elegance of one approach with the pragmatic functionalism of the other.
One important area to which this further work could usefully be applied is the integration of the budget study and time-series approaches. This will involve the construction of data consistent from both points of view where this does not already exist, but this should not be impossible given the considerable amount of unused data in this field. successful research here could answer some of the most important of the unanswered questions of demand analysis. In particular i t could investigate the relationship between income elasticities calculated by observing a group of consumers moving forward through time as incomes increase, and income elasticities derived by comparing, at one instant in time, the behaviour of families of different incomes. Equally, information on households at different income levels observed as the circumstances of all groups change, would cast con- siderable light on the problem of how changes in the distribution of income affect average per capita consumption behaviour. And it is perhaps this that is the most important missing link in the construction of an adequate empirically applicable theory of consumer demand.
1 . The Static Theory o f Consumer Preference
I t seems useful to distinguish two different attitudes to consumer theory. The first, to be found in most textbooks of economics, is that appropriate for a theorist interested in general equilibrium analysis or in welfare. From this point of view the more specific the assumptions which have to be made, the more limited is the applicability of the final theorems. From the second
19721 MODELS OF CONSUMER BEHAVIOUR 1159
viewpoint, that of the demand analyst interested in measurement, the more specific the final theorems the better. For if an assumption turns out to be inappropriate and its consequences conflict with evidence, it may be modified or replaced. This opportunity is rarely available to the welfare theorist. And thus, though more general theories are valuable in that they may be used to interpret a wider range of events, the measurement of our understanding of consumer behaviour is the specificity of the theory we can attach to it.
From such a standpoint, the fruitfulness of an economic theory lies in the number of restrictions on behaviour which it can suggest. For example, to the demand analyst a debate as to whether or not utility functions may be satisfactorily approximated by quadratic forms is of greater interest than the controversy over ordinality and cardinality. In this sense, progress in demand analysis can be largely gauged by the extent to which empirical generalisation can be used to cut down the range of admissible utility func- tions. In its turn, much of the progress in preference analysis has taken the form of suggesting likely restrictions on the form of the utility functions and working out their implications for models of demand.
We begin with a statement of the basic model and its modifications. Until a few years ago it would have been unnecessary in such a survey to recapitulate this theory. Whereas the classic expositions of Slutsky [194], Hicks [97] and Samuelson [I861 are all set out in the notation of deter- minants, in the 1960s the theory has been discussed in the much more powerful language of matrix algebra, first by Barten [8] and later by Dhrymes [52]. This development has an importance beyond a gain in formal ele- gance. I t offers a straightforward and powerful method of deriving the standard theorems of demand and so allows an easier assessment and exposi- tion of the debates and contributions in the field. And from a broader viewpoint it is notationally consistent with modern regression analysis, econometrics and computing techniques in general. This aspect has un- doubtedly acted as a spur to empirical application.
We do not attempt to provide a comprehensive treatment of demand theory, only to demonstrate those propositions which are necessary for our later discussion. Nevertheless we hope that this will be coherent enough and complete enough to act as a useful summary; the algebra is essentially that of Barten.l
We start with a single consumer with given money income p who purchases n commodities represented by the vector q at prices p. He chooses q so as to maximise the value of a utility function or index v which
Notation: We shall denote vectors by lower-case Roman and matrices by upper-case Roman letters; scalar quantities by Greek letters with the exception of the Greek iota which is reserved for the vector of units. The prime denotes transposition and a superimposed circumflex denotes a diagonalised vector. The (scalar) elements of a vector or matrix are denoted by subscripts to Roman letters, e.g., It or It5.

1160 THE ECONOMIC JOURNAL [DEC.
is dependent upon the quantities. Thus the consumer's object is to maximise
v(q) subject to q B 0 and p'q < p (3) In the calculus-based treatment, the non-negativity constraint is ignored, and perfect divisibility is assumed in order to allow the second inequality to be replaced by an equality. If in addition v is allowed to be sufficiently differentiable, we may write the first-order maximisation conditions,
where u is the vector of partial differentials of v with respect to q. The Lagrange multiplier, A, may be interpreted as the marginal utility of income, sometimes the marginal utility of money, corresponding to the (cardinal) utility index v, i.e.,
A = avlap (6)
The n equations (4)) stating that relative marginal utilities must equal relative prices, together with the budget constraint (5)) may be used to eliminate h and thus to give the quantities q in terms of the known prices p and income p. Formally,
4 = q(p,P) . (7) represent the n demand equations.
At this point we may remark that if we now replaced v by some function of v, f (v) say, with the proviso that the ordering of alternative bundles defined by v is not altered by the substitution, then equation (7) would be unchanged, though the value of h in (4) would not remain constant. This justifies the use of v as one cardinal representation of an ordinal preference ordering or indifference mapping. In what follows we could work through- out with f (v) rather than with v itself, but this would complicate the algebra unnecessarily. When we are dealing with properties of a particular utility function which do not apply to the ordinal mapping as a whole, we shall say SO.
In order to derive the restrictions on the demand equations which are implied by the maximisation process, we write down the total differential of equations (2) and (3) in matrix form. This gives
where U is the matrix of second derivatives (or Hessian) of v, i.e.,
Goldberger, [81, p. 71 reports Barten as calling equation (8) the " funda-mental matrix equation of the theory of consumer demand in terms of infinitesimal changes."

19721 MODELS OF CONSUMER BEHAVIOUR 1161
Now, if the demand equation (7) represents a maximum (rather than a minimum) of the utility function, small changes in q near the optimum must lead to a decrease in utility. Formally, we must have
x'Ux < 0 for all x such that p'x = 0 . (10)
I t may be shown (see [13]) that this second-order maximisation condition is sufficient to ensure that the matrix on the left-hand side of (8) is non-singular. Thus, if we also make the convenient assumption that U is non- singular,l we may write
From this equation, we may directly calculate, for given v, p, p and q, the way in which the chosen bundle of goods will change in response to changes in prices and income. Introducing first the matrix of price derivatives Q , and the vector of income derivatives q,, we have immediately
where -1-l from (15) . (16)a 1% P
Equation (1 3) is the Slutsky decomposition of price responses into substi- tution and income effects. The "compensated" nature of the former follows from setting the change in utility equal to zero in equation (I I ) . For, applying (4) and (5), we have
i.e., the last element of the vector on the right-hand side of (1 1) is zero. Thus if S is the matrix of price derivatives when income is set so that utility is left unaltered after a price change (a compensating variation in income), then from (11)
S = AU-l - q,q,'4p = Q p + q,q' . (18) i.e., the matrix in round brackets in (13). Note that though the interpreta- tion of S is in terms of utility and in terms of movements along indifference surfaces, it is not necessary to be able to measure utility or to draw indifference surfaces in order to calculate these derivatives. We see from (18) that the matrix is observable in the same way that price and income derivatives are; furthermore, it is also intuitively clear from (18) and from what has already been said that S is invariant with respect to transformations of v.
U may always be made non-singular by an appropriate transformation of v ; alternatively, but at the cost of some extra complexity, the main results may be derived directly without use of the inverse; again see Barten, Kloek and Lempers [13].
No. 328.-~0~. 82. q G

1162 THE ECONOMIC JOURNAL [DEC.
The same cannot be said of the further disaggregation of S represented by the two terms in round brackets in equation (13). These are often re-ferred to as specific and general substitution effects respectively, e.g., Houthak-ker [log]. However here again there is a " compensation " interpretation; from (I 1) we may calculate by how much income would have to alter in order to compensate for a price change by keeping marginal (rather than total) utility constant. Setting dA = 0 gives
which if substituted in the quantity-change equation gives
This price derivative, or specific substitution effect, though not invariant under transformations in v, is useful for interpreting the " constancy of marginal utility " assumption employed by Marshall and by Pigou, and we shall return to it below.
The quantity 4 and its inverse, denoted 6,
have appeared under various names in the literature. Frisch, who first used the concepts, [75], called 6 the income flexibility of the marginal utility of money; more recently writers have referred to 4 as the inverse of the (income) elasticity of the marginal utility of money. Though both 4 and 6 are invariant under only linear transformations of utility, we shall see that in special cases they have important ordinal interpretations.
Having dealt with the interpretation of the derivatives we may now see what restrictions on the demand function are implied by their form. In order to be able to express these in the more common elasticities as well as in derivatives, we define e, the vector of income elasticities as well as E and E* the matrices of uncompensated and compensated price elasticities. We shall also require a notation for the vector of average budget shares w, where
so that
where L is the unit vector of length n. First we derive the aggregation restrictions. Pre-multiplying equation (12)
by p' gives
pfqP= 1 or w'e = I (23)
and likewise with equation (13)
fif[Qp+ qPqf]= 0 or w 'E + w' = 0 . (24)
{or pfs= 0 wlE* = 0

19721 MODELS OF CONSUMER BEHAVIOUR 1163
These equations are consequences of the budget constraint and state that reallocations of the budget due to income and price changes respectively must continue to exhaust total income; they are sometimes referred to as Engel and Cournot aggregation conditions.
To derive homogeneity restrictions we post-multiply equation (13) by the price vector to give,
[Qp+qPq1]p=0} o r E ~ + e = O (25) or Sp = 0 E*L= 0
These restrictions follow from the condition that proportional changes in all prices and money income leave the choice of commodities unchanged. I n other words the demand equations are homogeneous of degree zero in income and prices; equation (25) could be derived directly from the application of Euler's theorem to equation (7).
The symmetry restriction is immediate from equation (18). The Hessian of the utility function is symmetric, and thus so is its inverse which is pro- portional to the specific substitution effect; the general effect is by definition symmetric. Thus we may write
s = ,$I or E*G-~= G-~E*' . (26)
The symmetric matrix given as an alternative in this equation is the matrix of Allen partial elasticities of substitution [5, p. 5031; their symmetric properties can make them more useful in some applications than the more obvious compensated elasticities.
The final restriction on the demand equations is that of negativity and this follows from the second order condition (10). These, together with the fundamental equation, imply that the substitution matrix is negative semi- definite, or more exactly that
x'Sx < 0 for all x, the equality holding . (27)
when x = ap for some a.
A similar restriction holds for the partial elasticities of substitution. This condition implies a number of inequality constraints on the elements of the substitution matrix, the most familiar being that the diagonal terms are negative. This is the famous " law of demand " that own-price compen- sated elasticities of demand are negative or that compensated demand curves slope downwards. But It must be remembered that the full conditions imply much more; perhaps one way of interpreting the other conditions is to say that the compensated demand curve of any fixed proportion bundleof goods slopes downwards.
Though these four conditions, aggregation, homogeneity, symmetry and negativity are in a sense complete, if we are to work with first differences, and this is often very convenient, one more restriction is required. This is that of integrability of the first difference equation and is necessary if that

1164 THE ECONOMIC JOURNAL [DEC.
equation is to be derivable from a demand equation at all. In other words, if the fundamental equations (8) or their solution (1 1) are to be derivable from the functions (7), then by Young!s theorem we must have
We shall see that the omission of this constraint can lead to considerable confusion.
The symmetry condition may also be regarded as an integrability con- dition in that, given demand functions which satisfy it, a utility indicator may be constructed (see Samuelson [188]). The economic meaning of the mathematical idea of integrability is consistency of choice. What the symmetry conditions rule out is the possibility that the individual's demand functions are such that there exists a sequence of price and income changes which will lead the consumer through a series of positions each of which is preferred to the previous one but which in the end leads back to the starting point. If in addition negativity holds then the demand equation may be derived from the maximisation of the indicator which integrability has allowed us to construct. Consequently if demand functions exist satisfying the four constraints or if differential demand functions exist satisfying all five, then for all practical purposes we may regard the utility theory as valid and we are guaranteed that there is no conflict between that theory and the evidence before us. Equally we may be sure that the conditions we have derived are the full observable analogue of the underlying deductive model.
Just how potentially fruitful the model is we may now assess. Clearly we have a considerable interpretative gain; for example, we can now recog- nise consistent behaviour and administer tests for the presence of inconsist- ency. But from a restrictive point of view we have done even better. Starting from the demand functions (7), there are n income responses and n2 price responses which are of immediate interest; the data would be asked to yield n(n + 1) pieces of information if these equations were estimated without further prior information. But aggregation gives n + 1 restrictions, homogeneity n, symmetry +n(n - 1) and negativity n inequalities, though if all are applied together the dependency between homogeneity, aggregation and symmetry reduces the total number to (n + I) + +n(n - 1). Thus, even ignoring the inequalities, the theory has reduced the original n(n + 1) responses to (n - 1) ( in + I), a very considerable improvement. Even so, if n is large and data are not plentiful this is likely to be too many. In the next section we shall examine those developments of the theory which have even greater restrictive power; this is also necessary before we can consider applying the model to data other than that on the behaviour of individual consumers.
19721 1165MODELS OF CONSUMER BEHAVIOUR
2. Separability and Homogeneity
The concept of separability arises from the independent work of Leontief [I331 and of Sono [200]. The basic idea is simple and arises naturally out of the ordinary properties of goods. Broadly, it is supposed that commodities may be grouped such that goods which interact closely in the yielding of utility are grouped togetherwhile goodswhich are in different groups interact, if at all, only in a general way. The intuitive appeal of this supposition lies in the fact that it is easy to imagine such groupings: for example, different types of food go into one group, different entertainments into another. We might then expect that if there exists a relationship between one type of food and one type of entertainment, then that relationship will be much the same for all pairs of commodities chosen from the two groups. The ease with which counter-examples may be constructed (e.g., Pearce's examples of television- watching toffee eaters and cinema-going peanut lovers), indicates the dangers of casual introspection more than it detracts from the basic principle. From an empirical point of view, if goods belong to different branches of the utility function then the scope for substitution between them must also be limited. We have then a possible way of further reducing the number of responses which must be estimated. Exactly how this is done depends on precisely which assumption is used. In what follows we indicate briefly the main types of separability and state their empirical consequences; the reader interested in proofs is referred to the excellent summary by Goldman and Uzawa [84].
The least restrictive form is weak separability. This states that if two goods belong to a group the ratio of their marginal utilities is independent of the quantity consumed of any good outside that group. In this case we may write the utility function
"(4) =f{vl(ql), 7~2(q2), . . VN(IIN)) . (29)
where q, is a vector of the quantities of goods in the Rth group. The observable analogue of this is given by
su = XRsq,,q,,, for i E R, j e S, R # S . (30)
i.e., if goods i and j belong to two distinct groups, then their compensated cross-price derivatives are proportional to the product of their income derivatives, the constant of proportionality depending only on the groups involved. We see that substitution between goods within groups is un-restricted as is substitution between the groups as a whole, but reactions of specific goods between groups must conform to the group norms. These assumptions probably accord with the way in which goods tend to be grouped in practice on informal intuitive principles. The concept may also be justified in terms of commodities producing, according to " production functions " vI(qI), certain consumption outputs which are then the basis of the utility function, see Muth [150].
1166 THE ECONOMIC JOURNAL [DEC.
A more rigorous assumption is that of strong separability. Here it is assumed that if two goods belong to different groups each of their marginal utilities is independent of the quantities consumed of the other. I n this case the utility function may be written
which accounts for the alternative name of this assumption, additive separ-ability. Clearly from (31) there is a transformation of v which leaves the Hessian (and thus its inverse) block diagonal yielding, from (18))
saj = xq,,qP, for i E R, j E S, R +S (32) where x = -4p. Equation (32) is the same as (30) with all interactions between the groups identical. Furthermore since (32) is measurable, x is measurable and we thus have an ordinal interpretation of 4, the inverse of Frisch's flexibility. In words, 4 is the inverse of the income flexibility of the marginal utility of money corresponding to the (unique) representation of the preference mapping which allows independence of marginal utilities between groups, though the reader may not feel that this is particularly helpful. The alternative offered by Pearce [I611 for x (and for xRS) as measures of the substitution possibilities between groups may be more useful; it is certainly devoid of unnecessary welfare connotations.
Additiuity or want-independence occurs when the marginal utility of every good is independent of the quantity consumed of all other goods; this may be thought of as additive separability with one good in each group. In this case the utility function is a transformation of a sum of functions each of which has only one good for argument, i.e.,
~ ( q )=f{vi(qi) + ~ Z ( Q Z )+ . - . + vn(qn)) (33) If (33) holds the Hessian and its inverse are diagonal, and for any pair of goods, we have
~ $ 3= x ~ P $ ~ P , (i - (34)
This form of separability, though the most restrictive, has been the most used. Indeed, in the early days of preference analysis, utility functions were invariably written in this form. But note now just how few indepen-dent responses are left; if we know the n - 1 independent income derivatives q,, and the parameter x (or 4, since p is given), we may calculate from equa-tion (34) all the cross-price compensated derivatives. Equation (18) may then be used to calculate the uncompensated cross-price slopes while Cournot aggregation or homogeneity can be used to calculate the remaining unknowns, the own-price slopes. Want-independence thus reduces the number of independent derivatives to n, the number of goods; this is as far as it is necessary to go. With so few parameters, estimation can go forward with very little information; as we shall see it is even possible to calculate price elasticities without observing any variation in prices.

1167 19721 MODELS OF CONSUMER BEHAVIOUR
One further separability concept which has been used is neutral-want association or Pearce-separability, [16 I], [I 621, [163]. The definition is similar to that of weak separability except that the ratio of marginal utilities is supposed independent of the quantity consumed of any third good whether inside or outside the group. The utility function is a mixture of weak separability between groups with additivity within groups (unless there are only two goods in the group) and in consequence the restrictions on substitution are identical to (30) above save that the proviso that the two goods should belong to different groups is no longer necessary.
Finally it is convenient to discuss in this section the consequences of homogeneity of the utility function. The assumption of constant returns to scale has not been found helpful in demand analysis in sharp distinction to applied work with production functions. However, since the demand functions derived from a model based on this assumption are an important limiting case in many of the applications we shall discuss, it is useful to be aware of their properties.
If v is homogeneous of any positive degree, p, say, then by Euler's theorem,
or differentiating again and inverting the Hessian
q = (p - 1)U-'U = h(p - 1)U-'$= (p- I)&qq, . (36)
Hence, applying the aggregation identity, we obtain
e = ~ , 4 - l = p - I (37)
i.e. all income elasticities are unity. This is the case of expenditure propor- tionality, examined by Bergson [20], and the corresponding demand functions are often referred to as the Bergson functions. These may be derived from the utility function
v (q) = b' log q giving f5q = bp (38)
The most casual empiricism reveals that these functions are not acceptable as a description of the behaviour of consumers.
3. Aggregation
If the theory we have discussed is to have practical applications, two difficulties must be met. In the first place, data almost inevitably relate to groups of consumers, sometimes all consumers, and not to the single in- dividuals of the theory. In the second place we cannot hope to deal with the hundreds of thousands of distinguishable commodities which would correspond to single homogeneous goods. The theory must therefore be extended so as to relate to aggregate demand for aggregated commodities. This is, of course, a general problem in many fields of economics and it is not our purpose here to survey the general theory of aggregation. We shall present only those approaches to the problem which have been used in

1168 THE ECONOMIC JOURNAL [DEC.
the context of demand analysis. Let us first deal with aggregation over indivi- duals.
The oldest and still most common approach is to ignore the problem altogether by formulating aggregate relationships directly from the micro- theory. Indeed it is possible to make a case for this: clearly we are not interested in the vagaries of the individual consumer, only in behaviour with the disturbing factors averaged out. To quote Hicks [98, p. 551 " the preference hypothesis only acquires a prima facie plausibility when it is applied to a statistical average. To assume that the representative con-sumer acts like an ideal consumer is a hypothesis worth testing; to assume that an actual person, the Mr. Brown or Mr. Jones who lives round the corner, does in fact act in such a way does not deserve a moment's considera- tion." I t is therefore reasonable to regard the theory as no more than a fable (or in modern jargon, a paradigm) which suggests restrictiohs enabling the solution of an otherwise intractable problem of estimation and inter- pretation: the theorist becomes entirely the servant of the econometrician.
However much sympathy one has with this approach (and it is at least as justifiable as most of the alternatives) it is impossible not to feel that too much detail is being lost. We may not be interested in individuals but we may be very interested in groups of individuals who differ, say, in social class or income distribution. Equally, if the postulates of the theory turn out to be rejected by aggregate data, we may not wish to reject the basic model but rather to reconsider the appropriateness of the implicit method of aggrega- tion. And it is clear that even if every consumer were to behave exactly according to the theory then there may well not exist any macro-economic relationship between total consumption, income and prices satisfying the constraints of the theory. An excellent example of this is given by Hicks [98, Chap. VI].
This is not just an aberrant case unlikely to be met with in practice. The conditions under which perfect aggregation of consumer demand equa- tions may be made have been investigated by Gorman [86] and by Green [93] and these turn out to be very stringent. In order that all consumers together should behave as the single consumer of the theory, it is necessary for all consumers' Engel curves to be parallel straight lines. This not only imposes constraints upon the demand functions for each individual but also requires an unreasonable degree of uniformity between individuals.
he question then arises as to what errors should be expected if aggregate models are used when the true conditions for aggregation are not met. All applied work is subject to errors, and errors of aggregation may not signifi- cantly add to the errors of measurement and omission which are inevitably present. To examine this possibility we write the first difference demand equation for the ithconsumer in the form,
19721 1169MODELS OF CONSUMER BEHAVIOUR
where is a vector of errors. Since
we may write
This decomposes the change in the ithindividual's choice into a response due to a change in real income (using a Divisia price deflator) and a sub- stitution response due to changes in relative prices. We assume that all consumer units are faced by the same prices.
The first problems are those associated with even linear aggregation, (see e.g., Theil [222]). Since the change in income and the income response appear in multiplicative form in (41), summing over households will lead to a macro-response coefficient which depends not only upon the individual micro-responses but also upon the distributions of the responses and incomes over consumers. The usual way out of this problem is to assume independent distributions of the coefficient and the variable over the population: indeed this device may be used to yield an aggregate version of (39) with averages replacing the individual values. But there are further difficulties: as shown by (40), the problem is not a linear one. Though each of the in- dividual substitution matrices is symmetric, the overall substitution matrix calculated according to (40) with averages of all the variables will not in general be symmetric. This difficulty can be sidestepped by using (41) as a basis for aggregation and assuming independence between the income response and the change in real income. But now the non-linearity of (40) appears in another form via the integrability condition (28). Though the aggregation of (41) would be an aggregate relation satisfying the postulates of aggregation, homogeneity, symmetry and negativity, it would not be the first difference of an aggregate demand equation.
Nevertheless, several possibilities have been suggested. Pearce [163, Ch. 31 has discussed the case where changes in money income are propor- tional to the level of money income for all consumers, thus leaving the distribution of income unchanged. If this holds, he has shown that the substitution matrix will be symmetric and negative in aggregate given certain weak conditions on the individual Engel curves. Theil [228, Ch. 111 has discussed aggregation within a rather more sophisticated version of the demand equation (41). He divides the substitution matrix into specific and general effects and takes into account the covariances of the income responses over the population; this leads to a differential demand equation with an extra price term which is finally absorbed giving an equation analogous to the micro-equations. This would appear to abrogate the integrability condition in general in the same way as does the aggregation of (41); however Theil is working within the Rotterdam framework (see below) and this criticism can be levelled at all forms of that model.

1170 THE ECONOMIC JOURNAL [DEC.
In short, it would seem that, special cases apart, the balance of prob- ability is against individuals or groups of individuals acting " ideally " so as to give rise to aggregate equations which satisfy, even approximately, the conditions for correct aggregation. Thus, the empirical use of an aggregate utility function probably cannot be justified as a short-cut to the aggregation of micro-relations. Given this, we may either fall back on our first approach and ignore all but aggregate behaviour; or alternatively modify the demand equations so as to include explicitly terms arising through aggregation. Though studies exist which use variables which can be justi- fied on aggregation grounds (e.g., the proportion of old people in the popula- tion) we are not aware of any thoroughgoing attempts to build truly aggre- gate systems of demand relations. This is perhaps the more surprising since there exists a considerable body of information, derived from cross- section analysis, on the way in which various factors affect the budget decision at least as regards the effects of income changes. This would seem to be a fruitful area for further research.
O n the aggregation of commodities we are perhaps on firmer ground. Though once again the formal restrictions for such groupings are very stringent, informally there exist approximation procedures which need much weaker assumptions and are likely to be sufficiently accurate in most contexts. Until recently the formal justification for dealing with groups of commodities lay in the Leontief-Hicks composite commodity theorem [97 and 1321 which states that commodities whose relative prices do not change may be treated as a single commodity for the purposes of the theory. Though formally correct, this is of limited usefulness.
Alternative conditions omre their origin to the work of Gorman and Strotz on utility trees [87], [88], [214] and [215]. The full set of necessary and sufficient conditions is too long to reproduce here; the most important case is that the utility function should be strongly or additively separable into " branches " each of which is homogeneous. This is what Green [93] calls additive homogeneous separability. The force of this is clear from our earlier discussion: the assumption ensures that no matter what happens to prices and incomes the expenditures on each good within the group remain in the same proportions. In these circumstances we have fixed weights for defining aggregate commodities and their prices; the demand functions for these groups must then obey the restrictions of additivity. Thus, as in the case of individuals, we are faced with strong restrictions on both the behaviour of individual expenditures and of the groups as a whole. We shall see that there must be considerable doubt as to whether these restrictions are sup- ported by the evidence.
More recently, Barten and Turnovsky [lo], assuming only additive separability showed that, provided we are prepared to deal with two price indices for each aggregate commodity, satisfactory aggregate demand equa- tions can be developed. They also suggested from experience with Dutch
19721 MODELS OF CONSUMER BEHAVIOUR 1171
data that the two price indices are likely to be indistinguishable in practice. Additive separability is still a strong assumption, however, and Barten has now extended the analysis [15] so as only to depend upon the much more satisfactory assumption of weak se@arability.
This results from a substitution of the weak separability condition (30) into the real demand equation (41). Differential quantity indices are defined by weighting each quantity change by its value share as a percentage of the group value share, and two differential price indices are defined. The first also uses the group value shares as weights and corresponds to the quantity index; this is used for deflating the change in income in the aggregated equation and corresponds to the income effect of a price change. The second price index uses the marginal budget shares for each group (also adding to unity) as weights and is used in the substitution part of the equa- tion. The cells of the new substitution matrix are closely related to the general substitution coefficients XRS of weak separability, the diagonal elements being chosen so as to assure homogeneity and Cournot aggregation. The aggregate first difference equations have all the properties of the in- dividual ones including the integrability condition. As for the two price indices, these will only be identical if within each group the marginal and average budget shares are equal. This implies that all income elasticities (with respect to total group expenditure) within the group are unity and we are back to additive homogeneous separability. However, at least in time series the collinearity of many of the prices renders most price indices relatively insensitive to the weights used to compute them and, in any case, in many applications marginal budget shares do not greatly differ from average budget shares. These two factors can well explain Barten and Turnovsky's result for the Dutch data and suggest that it is likely to be repeated elsewhere.
To sum up, provided that commodities can be grouped according to the differing needs they satisfy, and that no commodity is included in more than one group, then it is possible without great error to work with a coarser rather than with a finer classification. Our discussion has provided little more than a justification for what has always been done in practice-some aggregation is always necessary-but is none the less important for that.
1. The Measurement of Engel Curves
From the static theory of section I1 we obtain the result that the demand by a single consumer for each commodity can be written as a function of the consumer's income and all market prices. If prices are held constant we have from equation (7),
q i = q i ( ~ I P 1 , . . . p n ) . (42)

1172 THE ECONOMIC JOURNAL [DEC.
expressing demand as a function solely of the consumer's income, a relation nowr generally known as the consumer's Engel curve for commodity i. This relation is taken as the starting point for the analysis of household budgets, though several assumptions need to be made to link preference theory with practical analysis, after which it appears that theory can still make only a minor contribution to technique. However, the broad features of experience accumulated from the work of Engel and his many successors throws some light on utility theory itself, in particular limiting the class of plausible forms of the utility function.
The estimation of the form and parameters of functions of type (42) from a cross-section of budget data rests on the assumption that on average the differences in consumption patterns between rich and poor households can be ascribed to their differences in current income. Other differences between the consumption patterns of individual households are regarded as stochastic and adequately described by a selected probability distribution. Notionally therefore we must begin with a group of households in which there is as little variation as possible in factors which might have a significant effect on preferences; these include the educational and cultural background, social attitudes as reflected for example by occupation, and in particular the age and sex composition of the household. Since prices are assumed constant, the budgets must be collected over the shortest practical period of time, and from a sufficiently small region for geographical differences in price to be negligible. Needless to say, all these conditions are rarely fulfilled in practice, though a relaxation of some is made possible by tech- niques we shall discuss later.
I t is however necessary to pay special attention to the concept of income and its representation by the statistical measures typically available. Given the ideal conditions for the selection of the sample of households described above, it is still clear that a household's wealth, both in total and in terms of its ownership of particular assets, will influence its current consumption pattern. Since in a cross-section of households wealth is in general positively correlated with current income, the calculation of Engel curves without allowance for the separate influence of wealth is likely to be misleading if the relationship is used for prediction through time, since a sudden increase in income will not be matched by a similar increase in wealth. This, however, leads on to the dynamic specification of demand relationships and is deferred to a later section of this paper. In a similar way we shall ignore for the time being both the effect of the household's past income and con- sumption history and the effect of its expectations. Indeed it will be simplest also to ignore the problem of savings altogether, and to treat the income variable as though it were identical with total expenditure on con- sumer goods and services.
Given all the above simplifying assumptions the main advantages which household budgets have over time-series data are: (a) the quasi-experi-
19721 MODELS OF CONSUMER BEHAVIOUR 1173
mental condition that we can study the income-consumption relation in isolation from price changes; and (b) the wide variation in income between households which allows us to draw inferences about the nature of consumer preferences in the large, since the pure theory is confined to small changes from an initial equilibrium position. From the pure theory, or rather directly from the budget restraint itself, we draw the conclusion that Engel curves should possess the property of aggregation: predicted expenditures for each good should add up to the given total. This is the only help that theory gives us, and it is at first sight odd that this is the one property of Engel curves which, since Allen and Bowley, has most consistently been ignored. The reason appears to be that, as Nicholson and Champernowne have shown, if ordinary least squares estimation is used, the most general form of Engel curve which satisfies the restriction must contain a linear term in income. In general other equations have for various reasons been preferred. Since, as we shall see, there is need to build in other complica- tions, such as the effect of household composition, round the basic Engel curve, there is much to be said for keeping the latter as simple as possible, and indeed for finding one which can be reduced to linear form by a trans- formation which involves no unknown parameters. Let us look therefore at the most important characteristics which the mathematical form of the curve should have.
Ideally an Engel curve ought to be capable of representing luxuries, necessities and inferior goods. There is a good deal of empirical evidence to support the proposition that for a wide range of commodities, income elasticities are declining functions of income. Certainly we might extend Engel's law for food consumption, namely that its income elasticity is less than unity, by the further proposition that the income elasticity of food consump- tion (and of the consumption of individual foods) declines as income increases. For evidence on this point the reader may refer for example to Goreaux [85] ; the evidence consists partly of the fact that, as Prais and Houthakker [178] noted, Engel curves with declining income elasticities fit budgetary data better than curves with constant elasticities, and partly that, over time or across countries, the results of a number of budget studies display a negative association between average income and the elasticity at average inc0me.l The tendency to declining elasticity might indeed more accurately be related to the increasing level of consumption of the commodity in question than to income, since in this form the hypothesis embraces a further phenomenon, namely that many new commodities enter the market with a high income elasticity, and this elasticity declines as consumption increases, whether as the effect of increasing income, decreasing price, or simply as a trend in preferences. The hypothesis of declining income elasticity is consistent with but weaker than the hypothesis of a saturation level of demand, which in
According to the National Food Survey Committee [235], the income elasticity of total house- hold food expenditure in Britain fell fairly steadily from 0.30 in 1955 to 0.20 in 1969.

1174 THE ECONOMIC JOURNAL [DEC.
turn may be based on physiological or technical considerations, and which certainly seems to apply at least to a sub-class of commodities. I t is worth distinguishing between two variations of the saturation hypothesis, which may be called the absolute and relative saturation hypotheses respectively. The absolute hypothesis means that for the commodity in question there exists (on average for a group of consumers) a finite level of demand which is not exceeded, either as income increases indefinitely or as prices decrease indefinitely; this hypothesis reflects the fact that the marginal utility of the commodity becomes zero, or turns negative, at a finite level of consumption. In discussing the demand for water Marshall suggested that the uses of water may be arrayed in a utility hierarchy (drinking, cooking, personal washing, cleaning) so that demand increases as the price falls until " when the water is supplied not by meter but at a fixed annual charge . . . the use of it for every purpose is carried to the full satiety limit." Mathemati-cally therefore, for this case of absolute saturation, we have:
qi=qi(p ,Pl . Pi . p n ) (43) qi -+ K{ as p -+ co given pi or as
pi -+ 0, given p.
Consider for example a utility function for two goods:
with the budget restraint written
The first order conditions are:
K - q l - A p = o
a/q2- h = 0 . (46)
P41-I- q2 - II. = 0
where h is the marginal utility of income, as in equations (4) and (6), from which
q l = ~ - A p . (47)
q2 = alh
By solving the first order conditions for h it can be shown that Ap -+0 as p -+ m, or asp 3 0, SO that ql tends to the absolute saturation level K.
The relative saturation hypothesis on the other hand relates only to Engel curve behaviour: consumption tends to a saturation level as income increases at a given price, but the saturation level is itself a function of price. As price falls, the relative saturation level in general increases, but it may or may not tend to an absolute saturation level.
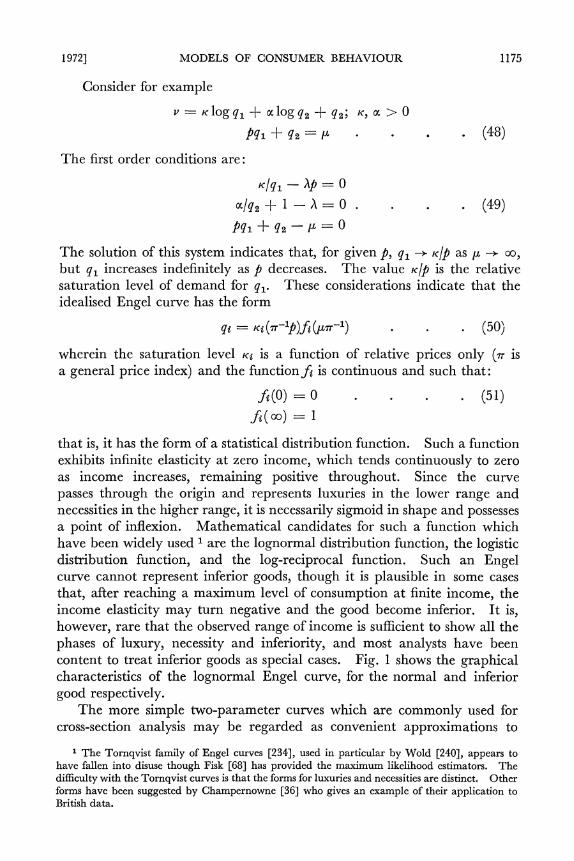
19721 MODELS OF CONSUMER BEHAVIOUR
Consider for example
The first order conditions are:
The solution of this system indicates that, for given p, q, --+ KIP as p -+ a, but q , increases indefinitely as p decreases. The value ~ / pis the relative saturation level of demand for q,. These considerations indicate that the idealised Engel curve has the form
wherein the saturation level K i is a function of relative prices only (n is a general price index) and the functionji is continuous and such that:
that is, it has the form of a statistical distribution function. Such a function exhibits infinite elasticity at zero income, which tends continuously to zero as income increases, remaining positive throughout. Since the curve passes through the origin and represents luxuries in the lower range and necessities in the higher range, it is necessarily sigmoid in shape and possesses a point of inflexion. Mathematical candidates for such a function which have been widely used are the lognormal distribution function, the logistic distribution function, and the log-reciprocal function. Such an Engel curve cannot represent inferior goods, though it is plausible in some cases that, after reaching a maximum level of consumption at finite income, the income elasticity may turn negative and the good become inferior. I t is, however, rare that the observed range of income is sufficient to show all the phases of luxury, necessity and inferiority, and most analysts have been content to treat inferior goods as special cases. Fig. 1 shows the graphical characteristics of the lognormal Engel curve, for the normal and inferior good respectively.
The more simple two-parameter curves which are commonly used for cross-section analysis may be regarded as convenient approximations to
The Tornqvist family of Engel curves [234], used in particular by Wold [240], appears to have fallen into disuse though Fisk [68] has provided the maximum likelihood estimators. The difficulty with the Tornqvist curves is that the forms for luxuries and necessities are distinct. Other forms have been suggested by Champernowne [36] who gives an example of their application to British data.

1176 THE ECONOMIC JOURNAL [DEC. 1972
different ranges of the full sigmoid curve. Over the range in which the elasticity is greater than unity the double-logarithmic, or constant elasticity form, is useful (Prais and Houthakker [178]) :
In the region where the elasticity is around unity, the linear form:
is a good approximation, though it should be noted that if the intercept is positive (yielding an elasticity less than unity) the elasticity then tends upwards towards unity as income increases. In the first part of the range of necessities the semi-logarithmic form :
qa = at + Pi logp; at, ~ t ,> o (54)
is useful, since, although this form does not possess a saturation value, its elasticity continuously declines towards zero. For commodities where the demand approaches saturation, however, the log-reciprocal form
log qi = az - Pip-I (55)
is better, as this possesses the saturation level
Looked at from the point of view of their ability to represent inferior goods, the double-logarithmic form has the most to commend it. The linear form implies negative consumption for income p > ai/Pz, the semi- logarithmic likewise for income p > exp{-at/pi), while the log-reciprocal form possesses a minimum consumption level qt = em{. The double-logarithmic form is, however, asymptotic to both the q and p axes, which makes it perhaps the safest form to use.
All four forms have the property that simple regression techniques can be applied after the appropriate transformation, so that the basic model may easily be elaborated in other directions. A point worth noting here is that it is usual, where transformation is needed, to assume that the error term may be similarly transformed. For example, the double-logarithmic form is usually fitted as
where the stochastic vector ug is assumed to have the usual properties of zero expectation, constant variance and independence sf p. Not only, of course, does this need independent justification, but it has the effect that the goodness of fit of those forms which require a transformation of gi cannot be

Normal goods lnferior goods
4/K q =W~Ifi,4 '/K q = K A (P-11-ji,a2)
FIG. 1. Lognormal Engel curves.
Normal goods lnferior goods b < 0 )(b >0) 0 r l = o ( 0 ~ 0 ,'h
Equations: q = a + 6p. 7 = ( q - a ) / q= 1 / j l + a/bp) FIG.2. Linear Engel curves.
Normal goods lnferior goods
(b >0) ( b < 0 )
/ necessity /
/ luxury q =b everywhere
log q = a + 6 log p, q = eapb,7 = 6 FIG.3. Double Logarithmic Engel curves
No. 328.-VOL. 82. 4'3
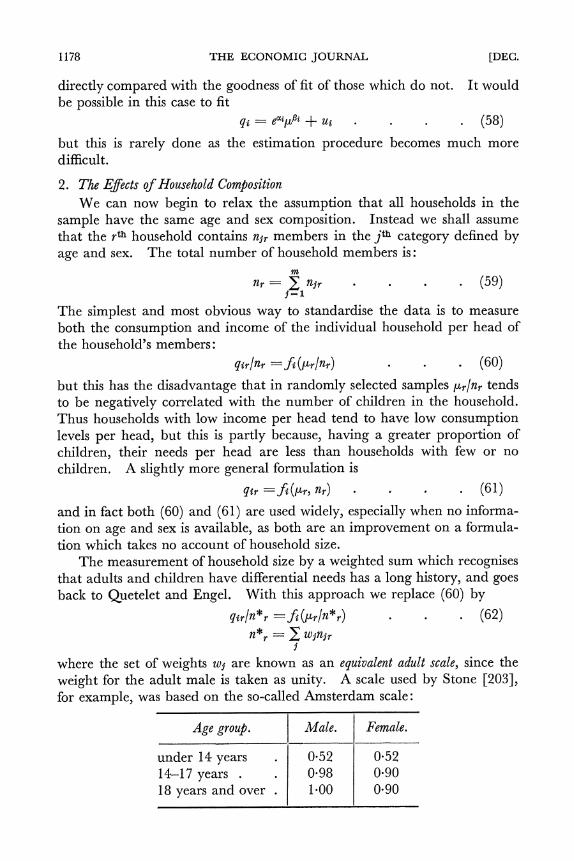
1178 THE ECONOMIC JOURNAL [DEC.
directly compared with the goodness of fit of those which do not. I t would be possible in this case to fit
qi = eaipot + ut . (58)
but this is rarely done as the estimation procedure becomes much more difficult.
2. The Efects of Household Composition We can now begin to relax the assumption that all households in the
sample have the same age and sex composition. Instead we shall assume that the rth household contains nj, members in the j t h category defined by age and sex. The total number of household members is:
The simplest and most obvious way to standardise the data is to measure both the consumption and income of the individual household per head of the household's members :
qirinr =fi(pr/nr) (60)
but this has the disadvantage that in randomly selected samples p,/n, tends to be negatively correlated with the number of children in the household. Thus households with low income per head tend to have low consumption levels per head, but this is partly because, having a greater proportion of children, their needs per head are less than households with few or no children. A slightly more general formulation is
Q Z ~=fi(pr, nr) . (61)
and in fact both (60) and (61) are used widely, especially when no informa- tion on age and sex is available, as both are an improvement on a formula- tion which takes no account of household size.
The measurement of household size by a weighted sum which recognises that adults and children have differential needs has a long history, and goes back to Quetelet and Engel. With this approach we replace (60) by
qirin*r =fi(p,/n*,) (62) n*, =2 wjnj,
j
where the set of weights w j are known as an equivalent adult scale, since the weight for the adult male is taken as unity. A scale used by Stone [203], for example, was based on the so-called Amsterdam scale:
Age group. Male. Female.I 1 under 14 years . 0.52 0.52 14-1 7 years . . 0.98 0.90 18 years and over . 1.00 0.90
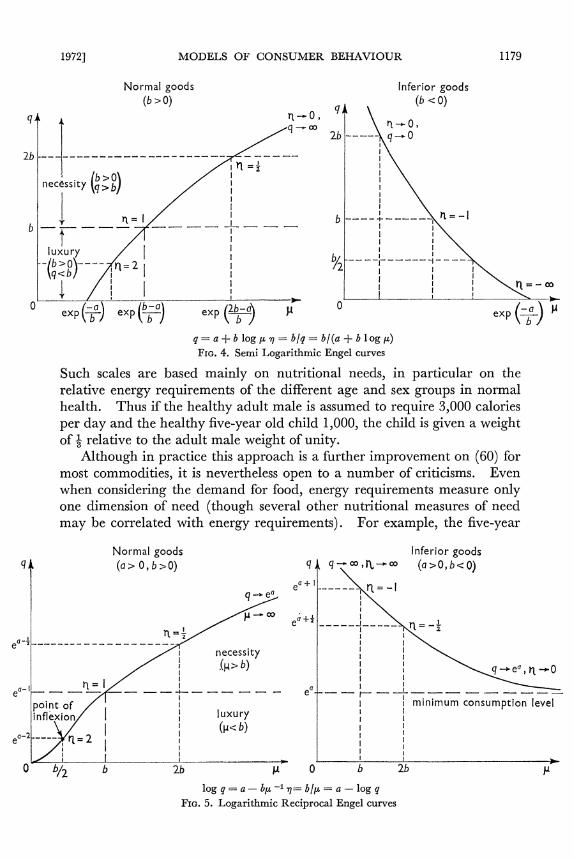
19721 MODELS OF CONSUMER BEHAVIOUR
Normal goods
(b >0 )
luxury
1
q = a + b logp 7 = b/q= b/(a + b logp) FIG. 4. Semi Logarithmic Engel curves
Such scales are based mainly on nutritional needs, in particular on the relative energy requirements of the different age and sex groups in normal health. Thus if the healthy adult male is assumed to require 3,000 calories per day and the healthy five-year old child 1,000, the child is given a weight of & relative to the adult male weight of unity.
Although in practice this approach is a further improvement on (60) for most commodities, it is nevertheless open to a number of criticisms. Even when considering the demand for food, energy requirements measure only one dimension of need (though several other nutritional measures of need may be correlated with energy requirements). For example, the five-year
Normal goods Inferior goods
T ( a > O , b > O )
l o g q = a - b p - l ~ = b / p = a - l o g q FIG.5. Logarithmic Reciprocal Engel curves

1180 THE ECONOMIC JOURNAL [DEC.
old child may require twice as much milk as the adult male so that his weight in the household demand for milk should be 2 rather than 4.
This problem could conceivably be overcome by using different scales for each food. The daily nutritional requirements are expressed in terms of calories, protein, calcium, vitamin C content and so on, so that the scale for a particular food would need to be a weighted average of scales based on food factors, the weights depending on the composition of the food. But for many food factors optimum levels of intake are much less well defined than for energy requirements. Even then, similar scales would be required for clothing, travel, entertainment and so on, and there is little hope of finding objective measures of relative needs for most of these. A more fundamental objection from the point of view of the demand analyst is that all such scales, including the nutritional scales, are based on normative judgments rather than on market behaviour. Thus though nutritionists may believe that children require more milk than adults, this does not assist the demand analyst unless parents also believe it and reflect their belief in their pattern of purchases.
However, these considerations do suggest a generalisation of equivalent adult scales which can be based on market behaviour. This generalisation was due to Sydenstricker and King [216] but independently rediscovered by Prais and Houthakker [178]. I n this approach the Engel curve is written
where
and w j is defined in (64) below; and, as before, i refers to the commodity, r to the household, and j to the type of person. A specific type of person is characterised by the set of weights [wij] for each commodity, the set for the adult male being the unit vector. These weights are used to calculate the speciJic size of the household for a particular commodity; but the income of the household is divided by a measure using weights w j which represent a general scale. For a person of type j the general weight w j is a weighted average of the speciJic weights,
where Prais and Houthakker have shown that the weights as are approxi- mately proportional to expenditure on commodity i.
The statistical problem is then to estimate equation (63) from household budgetary data, treating the weights [will, {wj) as unknown parameters, together with any other parameters of the functions& which are common to all types of household. For data we have the consumption expenditures,

19721 MODELS OF CONSUMER BEHAVIOUR 1181
incomes and details of household composition for a cross-section of house- holds.
Since the problem is a difficult one, the way it is approached must depend on the primary object of the analysis. The main object may be the measurement of income responses, in which case the existence of house- hold composition effects is an unwanted complication, and we are concerned with it only in so far as it may bias the measurement of income elasticities and so on. We shall outline two approaches along these lines.
Suppose first that the basic form of the Engel curve is double-logarithmic. Then
q{r/C = at (pr/C wjnjr)BZ . . (65)1 ' I
which can be written in linear form
log qi, = {log ai + log 2 wanjr - Pi log wjnjr) + Pg log l i r . (66)I
Equation (66) shows that, if we classify households into sub-samples defined by the composition of the household, the Engel curves for each sub-sample should form a set of parallel lines, the effect of the differences in household composition between each sub-sample being confined to the values of the intercepts. Since each sub-sample should yield an unbiased estimator of the parameter pi, this hypothesis can be tested by the technique of covariance analysis. If the null hypothesis (no significant differences between the estimates of pi from the different sub-samples) can be accepted, a pooled estimate of pi can be found, without attempting to estimate any of the house- hold composition parameters. This technique is described by Brown [25] and has been regularly used since then for the analysis of the continuous inquiry conducted by the Ministry of Agriculture [235]. In this survey, 75% of the total sample is classified into 15 well-defined types of household, the definition being based on a classification of persons into children, adolescents, young adult males, young adult females, old adult males and old adult females. The remaining 25% of households cannot be classified into homogeneous groups large enough for statistical analysis (cf. also Islam
[1151). The second approach is to use a sigmoid Engel curve under the accept-
ance of a saturation level hypothesis, for example, either the log-reciprocal or the lognormal Engel curves:
where pi* is a parameter. With either of these formulations (in which KC is the saturation level of demand of a household consisting of one adult male), the specific size of the

1182 THE ECONOMIC JOURNAL [DEC.
household acts as a scale factor on the saturation level parameter, while the general size acts as a scale factor only on income. If estimates are found by fitting the functions, again to a number of sub-samples defined by household composition, scale factors can be found which reduce all Engel curves to a common form, without the necessity of knowing beforehand, or estimating, the equivalent adult scales themselves.
1 -family w i thout children beer
consumption --- family w i t h children
~i Ap; the income compensation required
at the level o f beer consumption q ,
FIG. 6. The income effect of children.
I t may be, however, that the object of the analysis is directly centred on the estimation of the scales themselves. This was the case with the studies of Henderson [95], [96] and Nicholson [I541 who were interested in the problems of family allowances and dependents' allowances for taxation purposes. From the latter point of view it is the general scale which is of first importance, but we can consider the wider question of estimating both the specific and the general scales. First we discuss the approach of Hender- son and Nicholson. If a commodity can be found, such as beer, which is known not to be consumed by children, then, if households with children are compared with those without, we should expect Engel curves (with /.J,r as axis) of the households with children to lie uniformly to the right of those of households without children. The horizontal distances between the two curves then in effect provides an estimate of the contribution of the children to the general size of the household (Fig. 6). The estimates will

19721 MODELS OF CONSUMER BEHAVIOUR 1183
differ for each level of income, unless the two Engel curves are parallel. Assuming they are parallel, the incomes of both types of household can be standardised, whereafter estimates can be made of the specific scales for other commodities, by comparing the Engel curves for these (Fig. 7) .
-family without children food 1
consumption ---family wi th children
Aq,;the increase in demand for food attributable to children at a given standardised income. FIG.7. The specific effect of children.
The approach of Sydenstricker and King (and later Prais and Houthak- ker) is more systematic, though it leads to a doubly iterative procedure. We discuss it in terms of a double logarithmic Engel curve, though it may be adapted to other forms. A preliminary estimate is made of the scale {wj) so that we can compute:
p*r = p r / x Wjnjr . (69)
and, for the Engel curve,
If also a preliminary estimate of bz is available, the matrix [wsj] may be estimated by a set of multiple regressions (one for each commodity). Given estimates of [wzj] the Engel curves can be rewritten
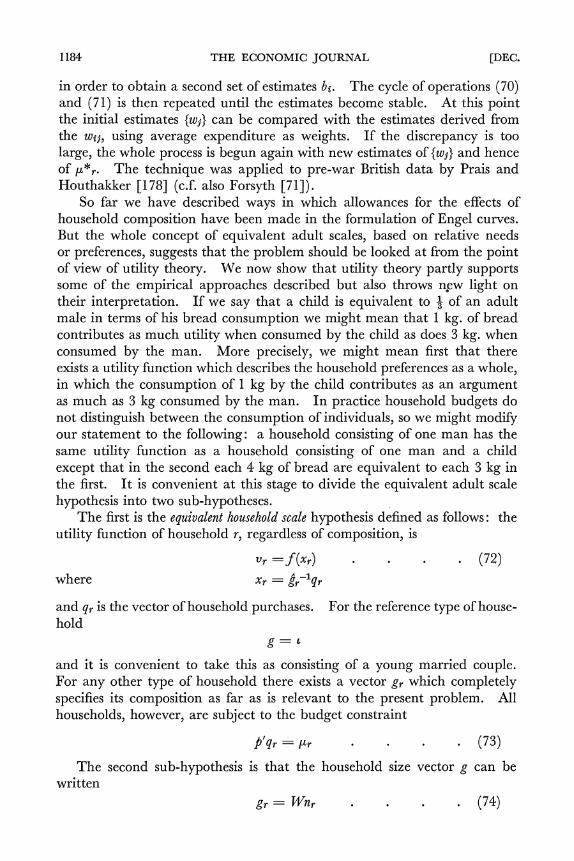
- -
1184 THE ECONOMIC JOURNAL [DEC.
in order to obtain a second set of estimates bt. The cycle of operations (70) and (71) is then repeated until the estimates become stable. At this point the initial estimates {wj) can be compared with the estimates derived from the wzj, using average expenditure as weights. If the discrepancy is too large, the whole process is begun again with new estimates of {wj) and hence of p*r. The technique was applied to pre-war British data by Prais and Houthakker [I 781 (c.f. also Forsyth [7 I]).
So far we have described ways in which allowances for the effects of household composition have been made in the formulation of Engel curves. But the whole concept of equivalent adult scales, based on relative needs or preferences, suggests that the problem should be looked at from the point of view of utility theory. We now show that utility theory partly supports some of the empirical approaches described but also throws n,ew light on their interpretation. If we say that a child is equivalent to Q of an adult male in terms of his bread consumption we might mean that I kg. of bread contributes as much utility when consumed by the child as does 3 kg. when consumed by the man. More precisely, we might mean first that there exists a utility function which describes the household preferences as a whole, in which th; consumption of 1 kg by the child contributes as an argument as much as 3 kg consumed by the man. I n practice household budgets do not distinguish between the consumption of individuals, so we might modify our statement to the following: a household consisting of one man has the same utility function as a household consisting of one man and a child except that in the second each 4 kg of bread are equivalent to each 3 kg in the first. I t is convenient at this stage to divide the equivalent adult scale hypothesis into two sub-hypotheses.
The first is the equivalent household scale hypothesis defined as follows: the utility function of household r, regardless of composition, is
where
and qr is the vector of household purchases. For the reference type of house- hold
g = L
and it is convenient to take this as consisting of a young married couple. For any other type of household there exists a vector gr which completely specifies its composition as far as is relevant to the present problem. All households, however, are subject to the budget constraint
The second sub-hypothesis is that the household size vector g can be written
gr = W n r (74)

19721 MODELS OF CONSUMER BEHAVIOUR 1185
i.e., as a linear function of the vector n, showing the numbers of different types of person in the household. Both sub-hypotheses are necessary parts of the full equivalent adult scale hypothesis but (74) is the less important and could for example be replaced by one which allowed for economies of scale, following Prais and Houthakker. We shall therefore concentrate on the first.
The household's choice problem, namely to maximise (72) subject to (73) and (74), can be written equivalently:
maximise v r = ~ ( x r )
subject to $J*,'x, = pr . (75)
where p*r brp
Since both g, and @ are exogenous to the problem the solution is formally identical to that of the classical model with the adjusted price vector p*, substituted for p. We therefore have the theorem:
Under the equivalent household scale hypothesis, a change in household com@osition, with market prices constant, is formally equivalent to a change in all market prices, with household com@osition constant. Thus the effect of adding a child to a household would, according to this hypothesis, be first to cause an adverse income effect, since no elements of g will decrease and most will increase, and second to cause a complex of substitution effects, since many elements of g will change by different factors. I t follows that the demand equation can be written
q6r = girx6r (76)
= garfi (@*r, ~ r )
and if it can be further assumed that all price elasticities of substitution are independent of real income we can write
where n, is an appropriate (scalar) index of the adjusted prices P*,. We can now re-arrange (77) in the form
By comparison of this with (65) we see that we can identify gtrfiz(p*,/n-,) as the specific size of the household, and n-, as the general size of the house- hold, and have thus found the link between the theoretical and empirical models. Equation (78) does, however, reveal a source of confusion in empirical work. Suppose a household evaluates the relative needs of children and adults in accordance with the best nutritional advice, for example that a child requires twice as much milk as an adult. In general the consumption of milk of the household will be less than this ratio suggests even after full income compensation, for the adjusted price of milk will be

1186 THE ECONOMIC JOURNAL [DEC.
higher relative to the adjusted price of commodities the child does not con- sume, such as beer, than in households without children; that is the effect of the function f,,which may be said to convert the prior measure of the household size gt, into a posterior measure n*t,. The model could there- fore be used to justify specific subsidies on items of children's consumption, such as milk and school meals.
Further, this model suggests that the basic assumption of the analysis of Henderson and Nicholson is invalid. Although there are commodities for which children add nothing to the prior specific measure of household size, we should, given the assumptions of this model, expect a substitution effect in favour of these commodities so that the method of equating consumption levels will lead to an underestimate of the general effect of children on household size.
The formal equivalence of household composition and price effects has led Barten [9] to develop a model for the estimation of price elasticities from cross-section data. The procedure requires the simultaneous fitting of Engel curves to complete budgetary data and an iterative process is devised. Since the procedure is simultaneous and rests on the assumption that the full equivalent adult scale hypothesis holds for every commodity, it is doubt- ful whether it will be successful in practice, and it is not known whether any full-scale attempt has yet been made.
I t is evident from the theoretical discussion above that it is most unlikely that the equivalent household scale hypothesis holds rigorously. There must at least be some parents whose preference scales are altered in a more fundamental way than the hypothesis suggests, on the arrival of children, especially in the sense that they then give more priority to commodities of importance to children than they did when they were the sole consumers of the same commodities. There are also likely to be dynamic elements involved, as for example in the anticipation of future needs in the purchase of housing. In many households, again, the assumption that all purchases are made according to a single utility function for the whole household will be invalid. Nevertheless the complete abandonment of the hypothesis means that each type of household must be analysed separately, which is a daunting prospect; and from a pragmatic point of view the hypothesis is a good working one for most items of personal consumption such as food and clothing.
IV. COMPLETE OF EQUATIONSSYSTEMS DEMAND
1. Introduction We can now review the applications of the theory to models incorporating
price behaviour, and in the following sections we shall discuss the principal models which have received attention. Almost all are either directly based upon the theory or are designed so as to subject one or more of its postulates

19721 MODELS OF CONSUMER BEHAVIOUR 1187
to empirical test. Given this common basis, one might expect rather more similarity between the models than in fact exists. But there are other factors which influence the results. First are the explicit assumptions upon which the demand equations are based; for example, we know from equation (34) that models which assume additivity or want independence share certain properties which are not shared by models based on weaker separability assumptions. Second are the implicit assumptions which arise because a particular functional form is chosen for the utility function or for the demand equations. The effects of these can be very important though they may not be at all obvious in advance; for example we shall examine two systems, both derived from additive utility functions, but which have quite different empirical properties. Thirdly there is the influence of the data on which the model is tested and estimated. Ideally we should like to disentangle the respective influences of these three factors on each of the systems, but this will not always be possible because as yet the number of comparative studies is small. We shall therefore examine the different models in turn, discussing their theoretical properties, and attempting to discern empirical uniformities in their application.
We shall lay the emphasis on model construction and estimation rather than upon a comparison and analysis of the elasticities or other coefficients which have resulted from particular studies. Since elasticities are in a sense the final product of demand analysis the fact that their publication generates more scepticism than delight needs some comment. For one thing, there are a very large number of them-a small system of twenty commodi- ties contains four hundred uncompensated price elasticities, four hundred compensated price elasticities and twenty income elasticities-and it is difficult to focus attention on this sort of information. With some excep- tions, such discussion as has taken place tends only to point up anomalies and to indicate the general acceptability from an a priori point of view of the magnitudes currently being presented. This would seem to be unavoidable for the present. To set up econometric models which produce estimates of elasticities is not difficult, and it is easier to do so with single equations than with complete systems. What the authors think is more useful, though much more difficult, is to analyse the problems which are logically prior to this, namely, those involved in the choice of assumptions on which the model is based. When there is general agreement on the appropriate choice of assumptions, discussion of the elasticities and other parameters which the models generate will be both valid and important.
Some assumptions are common to all of the models and may be con- veniently disposed of in advance. First, we shall not discuss the problem of savings at all in this section and thus, unless stated otherwise, income is used to mean total expenditure and we are discussing models concerned with the allocation of that quantity and not of income. This reflects little more than a division of our field from that of the consumption function proper.
1188 THE ECONOMIC JOURNAL [DEC.
The conditions which must hold to make such a division valid correspond to separability in the utility function of the services yielded by savings from those yielded by current consumption; whether or not such an assumption is valid it must be accepted for the purposes of this survey if only to limit the scope of the discussion.
he other assumptions which can be made in advance relate to the problem of identification. Unless strong assumptions are made about supply conditions the estimation of demand equations is impossible; instead the function estimated may be a supply curve or mixture of the two. This problem has been known to demand analysts since it was faced by Moore and Working in the 1920s though a formal and systematic treatment had to wait till Haavelmo's paper in 1943. The usual approach is to assume that prices are fixed by producers or on world markets and that . -supply is forthcoming at that price; the equations are then written with quantity dependent on prices and income. Given the time-periods involved in most applications this is an eminently realistic assumption. However, occasionally the opposite has been assumed, that quantities are fixed by supply conditions: the demand equations are then written with price as the dependent variable (see e.g., Theil [230, Ch. 71). The only attempts we know to make explicit allowance for the influence of the demand pattern on price formation have been as part of a simultaneous economic model, for example [34] and 1731, but this is not fundamentally part of demand analysis. In what follows we shall discuss demand models on the assumption that they are correctly identified.
2. Models for Testing the Theory
Though the systems we discuss first are among the recent developments in demand analysis it is logically convenient to begin with attempts to assess the validity and applicability of the models we have been discussing. This is important for at least two reasons. First, if it turns out that investigations using aggregate data have produced results which are consistent with many of the postulates of the micro-theory, then the problem of aggregation over consumers may be ignored with fewer misgivings than otherwise. Second, a knowledge of the weight of evidence for or against special aspects of the theory such as additivity or homogeneity will help when we come to assess those other models which have used such assumptions without submitting them to test.
Most applied work has in fact emphasised estimation rather than testing; however, all econometricians apply informal tests, even if only by checking the plausibility of their results. More rigorous testing had to wait until it became possible to estimate complete systems of demand functions, since
1- The theory of rationing and its applications are beyond our scope. The interested reader is referred to the article by Tobin and Houthakker [232] and the survey [233].

19721 MODELS OF CONSUMER BEHAVIOUR 1189
most of the postulates have no consequences for single equations. Here the homogeneity constraint is the exception. Say that we choose to study the single demand function
log qi = a,, + a,, log p + a,, log Pi + a,, log n (79)
where n is some price index of all prices (including that of good i). If we enforce the homogeneity constraint (25) we find that we must have
Whether or not this holds could, in principle, be investigated for a wide variety of goods; in practice, the restriction has more commonly been used to increase the number of degrees of freedom for estimation and to reduce the collinearity between income and the two prices by writing (79) as
leaving aa3to be estimated from (80). The symmetry restriction was tested by some investigators, notably
Schultz [191, Ch. 191 and Wold and Jureen [240, Ch. 171, but techniques at that time did not permit great sophistication. Prices of closely related commodities were included in demand functions and the different estimates of the Slutsky terms compared; Schultz did this with beef, pork and mutton expenditures on U.S.A. data, obtaining quite encouraging results. How-ever, the main stimulus to recent activity in formal testing came from the publication in 1965 by Theil [223] of what has since come to be known as the Rotterdam demand system.
We may begin from the real demand equation (41), i.e.,
decomposing demand changes into real income and substitution responses. If we multiply through by p - 9 and use the transformation dx = f dlog x so as to reformulate the equation in terms of logarithmic changes, we have
d d log q = b[d log p - w'd logp] + C d log@ (83)
where b is the vector of marginal budget shares or marginal propensities to consume, i.e.,
b = p-lfiqN (84)
and C is related to S by the formula
1 Stone [203] made some rough calculations along these lines with outcomes generally in favour of the homogeneity postulate.

1190 THE ECONOMIC JOURNAL [DEC.
The dependent variable of this model is the vector of changes in logarithms of the quantities weighted by the corresponding value shares and this may perhaps seem less commendable than the normal quantity or value changes. However, Theil emphasises that demand theory relates to the allocation of the consumer's budget and that from this point-of view the value shares w, not the quantities consumed, are the main object of interest. Using the identity,
d w = & d l o g q + & d l o g p - d d l o g p . (86)
he points out that the first term on the right-hand side is the only part of the change in the value shares which is behaviourally determined; it is thus a proper and interesting object for study.
The term in square brackets in (83) is an index of the change in real income, and Theil uses this as the basis for a chain index of the Divisia type. I t can also be shown that, to a very satisfactory degree of approximation, the sum of the dependent variables is equal to this differential real income index. For applied work it is convenient to make the substitution and write
d log ii = w'd log q Z d log p - w'd logp . (87)
giving the Rotterdam model
hd logq = bdlogji $ Cdlogp . (88)
Taking b and C as parameters, this model offers a straightforward method of estimating price and income derivatives, but as such it has few advantages over simpler models. Its unique advantage lies in the fact that the con- straints of the theory are the same for all values of income andprices when applied to (88) and the most important of them are linear. Referring back to these and using the definitions of b and C, (84) and (85)) we have:
Aggregation: c'b = L'C= 0 . (89)
Homogeneity: Cc = 0 . (90)
Symmetry: C = C' . (91)
Negativity: x'Cx < 0 (< 0 if x # EL) . (92)
The constraints of separability can also be written in items of relations between C and b, in particular:
Additivity: C = 4 (8 - bb') (93)
I n principle then, each of the constraints (89)-(93) can be applied to equa- tion (88) in turn. At each stage test statistics for the validity of the con- straint may be calculated and the more of the constraints that can be im- posed the greater the precision of the parameter estimates and thus of the elasticities.
I t would seem that such a system is an enormously powerful tool of

1191 19721 MODELS OF CONSUMER BEHAVIOUR
analysis; it is not necessary to assume a particular utility function and it is seemingly possible to investigate the theory in its full generality in a simple manner. But there is a difficulty, which seems to have been first pointed out by McFadden; the integrability condition (28) is not in general satisfied. We can substitute for Q, and q,, perform the differentiation to give
C = B - bb'
as the condition corresponding to equation (28). This very strong restric- tion reduces the Rotterdam model to the Bergson functions (38) implying constant budget shares and robbing it of any empirical interest. On the other hand, if the restriction is not imposed the system can hardly be called a system of demand functions. I n response to this criticism Barten has argued in [I41 that the model can be justified as the first terms in a Taylor expansion of an arbitrary demand function and that the approximation will be good enough provided real income and relative prices do not change too much over the period of estimation. This is unfortunate since from an econometric point of view the results are liable to be better the more variation there is in the independent variables. Nevertheless the reaction of rejecting the model altogether as some authors have done, e.g. Yoshihara [243], would seem too strong.
The modelhas by now been widely used for testing; it has been applied over a wide range of countries and time periods, producing results which are plausible, conform to other evidence and show, in some respects, con- siderable uniformity between studies. At the same time the results have not always been as expected. The results of the first tests with the model were as consistent with the theory as those of the early experiments of Schultz had been thirty years before. Barten 1111 using pre- and post-war data for Holland for four broad groups of commodities (food, pleasure goods, durables and remainder) found that the symmetry conditions (and thus also homogeneity, since aggregation is a property of the data) were not rejected. However, later experiments [14] with a much finer classification of sixteen commodities did indicate rejection. Using maximum likelihood estimators and taking proper account of the singularity problem (see below), Barten computed the likelihood values for the model under the assumption of no constraint, and under the constraints of homogeneity, symmetry and additivity; these values are reproduced in the table. Though there were estimation problems with the symmetric case and though there remain unsolved difficulties over small sample correction for likelihood ratio tests in multivariate models, the force of Barten's results remain clear. Not only do the equations (88) require intercepts but the homogeneity conditions (and by inference the stronger restrictions) are rejected at a very high level of significance. The presence of constant terms, reflecting trends in tastes or in social factors, is perhaps not serious, but the presence of money illusion is not so easy to explain. Nor is this an isolated result: though tests on a
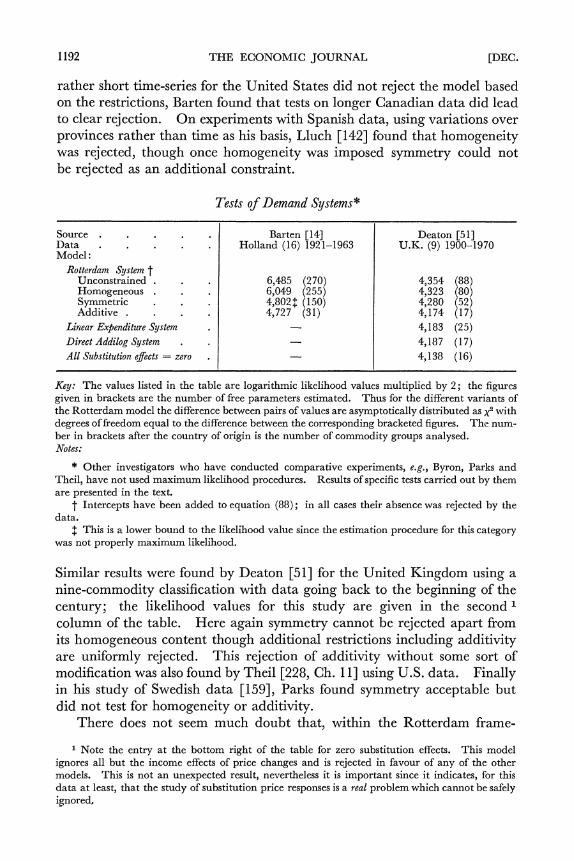
1192 THE ECONOMIC JOURNAL [DEC.
rather short time-series for the United States did not reject the model based on the restrictions, Barten found that tests on longer Canadian data did lead to clear rejection. On experiments with Spanish data, using variations over provinces rather than time as his basis, Lluch [I421 found that homogeneity was rejected, though once homogeneity was imposed symmetry could not be rejected as an additional constraint.
Tests of Demand Systems*
Source Data Model :
. . . . .
. : 1 Barten [14] Holland (16) 1921-1963
Deaton [51] U.K. (9) 1900-1970
Rotterdam System t Unconstrained . . Homogeneous . Symmetric . . Additive . . .
Linear Expenditure System Direct Addilog System . All Substitution effects = zero
Key: The values listed in the table are logarithmic likelihood values multiplied by 2; the figures given in brackets are the number of free parameters estimated. Thus for the different variants of the Rotterdam model the difference between pairs of values are asymptotically distributed as ~"ith degrees of freedom equal to the difference between the corresponding bracketed figures. The num- ber in brackets after the country of origin is the number of commodity groups analysed. Notes:
* Other investigators who have conducted comparative experiments, e.g., Byron, Parks and Theil, have not used maximum likelihood procedures. Results of specific tests carried out by them are presented in the text.
t Intercepts have been added to equation (88); in all cases their absence was rejected by the data.
$ This is a lower bound to the likelihood value since the estimation procedure for this category was not properly maximum likelihood.
Similar results were found by Deaton [51] for the United Kingdom using a nine-commodity classification with data going back to the beginning of the century; the likelihood values for this study are given in the second 1 column of the table. Here again symmetry cannot be rejected apart from its homogeneous content though additional restrictions including additivity are uniformly rejected. This rejection of additivity without some sort of modification was also found by Theil [228, Ch. 1 I] using U.S. data. Finally in his study of Swedish data [159], Parks found symmetry acceptable but did not test for homogeneity or additivity.
There does not seem much doubt that, within the Rotterdam frame-
Note the entry at the bottom right of the table for zero substitution effects. This model ignores all but the income effects of price changes and is rejected in favour of any of the other models. This is not an unexpected result, nevertheless it is important since it indicates, for this data a t least, that the study of substitution price responses is a real problem which cannot be safely ignored,

19721 1193MODELS OF CONSUMER BEHAVIOUR
work, homogeneity is not an acceptable restriction. That this may be due to the integrability problem is always possible but it is hard to see why this should occur and why the much stronger additional restrictions to guarantee symmetry are not also rejected. The trouble may lie with particular goods or with a poor series for one good and there is some evidence from the studies quoted that the rejection can be traced to the behaviour of one or two individual commodities. Nevertheless, it is very difficult to see why, to take the U.K. case, a doubling of all prices and incomes should cause a significant shift in expenditure away from food consumption to the consump- tion of transport and communication services. If a rejection of homogeneity were to occur in tests using an equation which predicted the levels of pur- chases the result might be explicable in terms of changes in taste taking place over the period of observation; since all observations on high incomes are at the end of the period and those on low incomes at the other, this would be quite plausible. However, since the Rotterdam model explains weighted rates of change of purchases and not levels, a simple explanation of this nature is unlikely to provide the answer. More likely perhaps is the presence of biases in behaviour due to changes in the distribution of income. I t is possible that when rapid increases in income take place these are distributed in favour of consumers of particular categories of goods; however, this is a highly tentative hypothesis. All this poses a suitable problem for further research; certainly insufficient work has been done on the influences of omitted variables, particularly the distribution of incomes, dynamic factors and the effects of stocks, for it to be possible for us to assert that money illusion exists as a well-established phenomenon.
The postulates of symmetry will probably survive the tests if non-homo- geneity is explained but those of additivity seem too strong for most of the data over which the model has been tested. There is less mystery about this; there exist substitution effects between even quite broad categories of goods which are too specific to be allowable under the independent wants hypo- thesis. I n this context, Barten's [8] assumption of " almost additivity " might be useful; this allows the investigator to permit limited interaction between certain commodities specified in advance. This makes it difficult to use as a tool of general investigation but it may well be a practical solution in particular instances. The negativity postulate has as yet been little subject to formal test; it is no simple matter to estimate the model subject to the necessary inequalities. We are thus limited to inspection of the results produced and though there are certainly anomalies most studies have yielded the expected signs for the coefficients in the model.
The difficulties over integrability and interpretation of the Rotterdam model render it fortunate that other investigators have attempted to test demand theory using a rather different model. This is the constant elasticity of demand or double-log model and has been used for testing the same postu- lates in a series of articles by Byron [31], [32], [33] and also by Lluch [I421
No. 328.-~0~. 82. 4 1

1194 THE ECONOMIC JOURNAL [DEC.
and by Court [41]. These studies start from the double logarithmic formu- lation
logq = + elogp -+ E l o g p . (95)
where y is a vector of intercepts, and estimate subject to the usual restrictions. However, the constraints on the elasticity terms involve the average budget shares and these are not in general constant through time. Indeed, as has often been pointed out, the constant elasticity system is itself incompatible with the theory; for example, if all income elasticities are constant, the value shares of luxuries will constantly increase and this will lead, eventually at least, to the violation of the budget constraint. Only in the degenerate case when all income elasticities are unity-the Bergson functions-will the model satisfy the adding-up criterion and be acceptable. Nevertheless, as with the Rotterdam system, the model can be justified as an approximation or by its ability to generate plausible results. The studies quoted have applied the constraints to the model at one particular point, usually the mean of the value shares, arguing that the constraints will be approximately satisfied elsewhere. This, though perhaps no closer to the ideal than the Rotterdam model, involves a different set of approximations and thus gives a useful cross check on the results.
Byron has applied this technique to a five-sector disaggregation of Australian consumption data and to Barten's Dutch data for sixteen com- modities. Using the former, though some difficulties with the homogeneity restrictions on clothing were encountered, the basic postulates seemed quite acceptable. Further restrictions, involving attempts to collect the com-modities into separable groups were rejected by the tests, though once again the extremely odd behaviour of the clothing category must cast some doubt on the reliability of the results. FVith the Dutch data, Byron's results seem to confirm Barten's; the theory and its extensions are consistently rejected, homogeneity being one of the worst offenders. But in this study the approxi- mate nature of the methods has some strange effects: for from data which by construction satisfy the budget constraint at each observation, Byron's methods lead to a rejection of the Engel aggregation restriction. This seeming paradox merely shows that the approximations to the restrictions which are used are very poor in this case; in consequence it may be the choice of model rather than any lack of realism of the theory which leads to the rejection of the other hypotheses, a possibility which Byron fully recog- nises.
The other studies referred to also reject the theoretical postulates. Lluch reaches the same conclusions with this model as with the Rotterdam system; and Court, using a sub-model for the demand for meats in New Zealand, finds that the symmetry restrictions are discredited by his evidence. Thus though the evidence could hardly be called conclusive, the results with the constant elasticity model tend to support those of the Rotterdam system.
19721 MODELS OF CONSUMER BEHAVIOUR 1195
However, the provisional nature of these results must be emphasised; there is still considerable disagreement both in practice and in theory about the estimation methods and test statistics which should be used for these models. And even if this problem were to be solved there would remain the key question of whether rejections are due to functional mis-specification, aggregation bias, or to the general invalidity of existing demand theory. This topic remains for the future.
Finally we must mention more direct attempts to test the model. One such is the experimental determination of indifference curves by offering subjects combinations of goods for choice; a recent example using pens, pastries and cash was conducted by MacCrimmon and Toda [143]. Though such maps tend to reflect the individual's money rather than use valuation of the alternatives and are of doubtful validity in market rather than laboratory situations, they may be of some value in testing the ability of individuals to makes consistent choices. I n another type of study Koo [I261 used data collected from 215 Michigan households over thirteen four-week periods in 1958 to test less directly for consistency: by evaluating each bundle of choices at the prices of the other periods, he calculated for each family the number of choices out of the thirteen which were internally consistent. The distribution of this indicator was quite strongly peaked with 30% of families scoring 9 out of 13 and a further 40% scoring 8 or 10. The inconsistencies themselves were peaked in the summer (holiday?) months. Given the possibility of changing preferences and of holiday preferences being different from workaday preferences, these results do not seem to cast much doubt on the theory.
3. The Linear Expenditure System
Though it has been convenient to deal with other models first, the linear expenditure system can perhaps claim precedence among demand models, if not historically, certainly in popularity and frequency of use. As with any model satisfying all the restrictions of the theory it is possible to begin the discussion either with the utility function or with the demand functions. Following the latter course we postulate that expenditures are a linear func-tion of income and prices, i.e.,
1;q = bp + Bp - - (96) or 4 =$- lbp f j-1Bp where b and B are parameters and we retain the notation b for the marginal budget shares from the Rotterdam model. If expenditures are to add up to income, we must have ~ ' b= 1 and L'B= 0; homogeneity is assured by the choice of function and symmetry remains to be imposed. The substitution matrix can be derived from (96) by differentiation and after some manipula-tion it can be shown to be symmetric only if
B = [ I - b ~ ' ] t . (97)

1196 THE ECONOMIC JOURNAL [DEC.
for some vector c such that the differential of ce with respect to pj is equal to the differential of cj with respect to pi. If homogeneity is to be retained then in addition each element of c must be homogeneous of degree zero in the prices. In the standard model the original linearity is preserved by making the c vector constant to give the linear expenditure system,
(The Slutsky matrix will be negative semi-definite if the b parameters are positive and income I*, is greater than p'c.)
The model which was first developed by Klein and Rubin [I201 and later by Stone [204] has a simple interpretation: the elements of c are supposed to be necessary or committed quantities which the consumer buys
c cfirst; his residual money income, EL -P'c, supernumerary " or uncom- mitted income is then spent in fixed proportions b between the goods. This interpretation, though often useful, can be over-restrictive. There is no reason to expect the elements of c always to be positive and we shall later wish to discuss cases where c is a function of prices.
The utility function from which the system may be derived was worked out by Samuelson [I871 and by Geary [80] and it may be written
which may be compared with the very similar Bergson form (38). The functionf (x) is often given the exponential form to write
I t is a simple matter to check that the constrained maximisation of (99) or (100) leads to the system (98). Since v can be written as the transform of an additive utility function we know from (34) that
In this case, from the actual demand equations we can calculate, if (i # j )
~ $ 3 ‘=--bibj ( p-p'c) and thus c j = - ( E L -P'c) . (I,,)
PiPj EL
Thus, if S is to be negative semi-definite, sij must be negative for all pairs of goods; the system, because of its additive properties, does not permit complementary goods (in the Hicks-Allen sense). I t may seem odd that, since complementary goods are defined in terms of the theory, a system which starts from the full generality of (96) and which enforces only the postulates of the theory, should be unable to take account of this pheno-

19721 MODELS OF CONSUMER BEHAVIOUR 1197
menon. The answer is that the assumption of linearity is itself very strict; we shall discuss its modification below.
From (98) we may calculate the elasticities:
and
From these we see that inferior goods are impossible and that goods which are price elastic will have c parameters less than zero. Note also that all price elastic goods are gross substitutes with all price inelastic goods in the sense that an increase in their price increases the demand for all price- inelastic goods.
JYe can now see how this model is likely to operate in practice. In most time series applications there exist strong collinear trends between the various expendituresptqt and total income p ; these will determine the values of the bt parameters and thus the income elasticities with some precision. Given these, all price information in the data is absorbed into the ca para-meters, which via equation (102) determine the substitution and other price elasticities. Note however that the structure of the substitution matrix, as opposed to its scale, is determined without reference to the ct parameters. Thus if the income information is dominant over the price information in the data, the linear expenditure system, like other additive models, will impose a structure on estimated price effects largely independently of the structure of actual price effects. Such a system does not, in the normal sense of the word, measure price responses: this is the effect of the additivity assumption in practice. This could be beneficial if we could be sure, measurement errors apart, that the additivity assumption was a valid one, but as we have pointed out in the previous section, such studies as have been done have not tended to confirm it.
Nevertheless this model has been applied more extensively than any other. The original application by Stone in 1954 [204] was to British data from 1920 to 1938, and Stone and his colleagues in Cambridge have con- tinued to use the system in one of its forms as an integral part of the Cam- bridge growth model [34], [212]. Since then Paelinck [156] has applied the model to the analysis of consumption in Belgium, Parks [I591 to a very long time series for Sweden, Pollack and Wales [167] to post-war United States data, Yoshihara [243] to Japanese data, Leoni [130] to Italian data and Dahlman and Klevmarken [47] to Swedish data. There have also been a number of cross-country comparative studies, notably by Baschet and Debreu [17], Goldberger and Gamaletsos [83], Solari [I971 (these three
The second order conditions do not strictly imply that all elements of b should be positive; one may be negative. For discussion of this aspect of additivity, see Green [92].
2 In the sense that variations in real income are much larger than variations in relative prices.

1198 THE ECONOMIC JOURNAL [DEC.
covering thirteen countries in all) and by Theil [230] for the United King- dom and Holland. Though these studies do not all use the same stochastic assumptions, estimation techniques or even model specification, they provide a broad spectrum of results from which to assess the model's performance.
With a few exceptions, mainly when supernumerary income has become negative,l investigators seem to have been satisfied that their results were plausible. Though occasionally negative estimates of the b's occur, the vast majority are positive as are those of the c's, reflecting the fact that most analy- sis has been conducted in terms of demand for broad categories of goods which, in the absence of substitutes, tend to be price inelastic. At the same time the multiple-R2 statistics of fit have been satisfactorily high, rarely drop- ping below 0.95 when estimated in the basic version (98). This system has other obvious advantages: no complete demand system is easily estimated, but the linear expenditure system is probably the most easily estimated, and once it has been estimated its linearity renders it very easy to use, especially as part of a larger econometric model where ease of use is important.
In many situations, too, the restrictiveness of the system is an advantage in spite of the difficulties we have already discussed. If reliable data are few, as often, only few responses may be measured directly, and it is important to focus on the most important, allowing strong assumptions to look after the rest. The linear expenditure system places emphasis on the important income responses and, because it conforms to theory and has a simple inter- pretation, is an attractive way of making the additional assumptions needed to handle price responses. This aspect of the model comes out strongly in the study by Goldberger and Gamaltesos [83], which compares the elasticities yielded by the linear expenditure system with those given in a study by Houthakker [ l l 11 who had used a more conventional double logarithmic model involving income, each commodity's own price and a general price index. For thirteen O.E.C.D. countries they concluded that though the double log model (after appropriate correction) fits the data better, it uses more parameters in doing so, and so has little practical advantage over the theoretically more consistent system. Although the additivity assumption is strong, allowing for the effects of prices in this limited way improves the performance of the model compared with allowing no price substitution effects at all. This result is also found using United Kingdom data [51] and is shown in the table on page 1192.
Some doubts remain whether the linear expenditure system really is the best that can be used. In those studies where authors have calculated the goodness of fit of the quantities predicted by the system, rather than of the expenditures, such high coefficients of determination are no longer obtained. Also, it seems from most of the diagrams published that the system often does little more than follow the general trends in expenditures. Indeed in many
1 This is usual only for the first few observations. The results reported by Pollack and Wales and by Goldberger and Gamaletsos for four countries would thus seem to be unusual.

19721 1199MODELS OF CONSUMER BEHAVIOUR
comparative studies the model has been outperformed by other systems; in the results given in the table for the United Kingdom, a higher likelihood value is reached for several of the other models.
Suggestions, then, for extending the scope of the model are of interest and a number of these have been advanced. The most common of these is the replacement of the vector c by some lagged values of past consumption or weighted sums of such, see e.g., [167], [47] and [49]. This seems not to help much, probably because there is a uniform tendency in practice for the b parameters to be much better determined than the c's, indicating that likelihood values will be increased more by altering income responses or the structure of the substitution matrix rather than by altering its scale. I t is also clear from (102) that unless substitution possibilities are increased, the contribution of individual ti's to the performance of the model is small. This would account for the high standard errors which have occurred in practice. Alternatively it has been suggested by Stone at various times that in order to allow for changes in tastes, time trends (either linear, quadratic or sigmoid) should be introduced into the model. Though there are severe difficulties in accommodating sigmoid trends, the introduction of the others, especially when applied to the marginal budget shares, does improve the performance of the system. These modifications allow the system to take greater account of the relatively abundant income information which is otherwise ignored and allow much more movement in the scale of the substitution matrix over time; nevertheless they do not affect the basic problem of additivity.
A modification which does do so involves the abandonment of the linear- ity assumption which restricted the vector c to be constant. If this is ignored, one may write the system
where -act = -
ac, and ~ ( p ) is liomogeneous of degree zero. This makes a
a j 3 ~ P z very considerable difference for if we now calculate the substitution matrix, we have
which is just the sort of modification we need. If a suitable form can be chosen for the vector c, it should be possible to use (105) to study a wider range of substitution possibilities. Note that the dependence of c on prices does not make the underlying utility function depend on prices; since all the integrability and other conditions are satisfied we know that a perfectly proper utility function exists corresponding to the system.
If the b vector is the same for each consumer then this is the most general system which allows consistent aggregation over individuals, i.e., the most general system with constant marginal budget shares, see Gorman [88]. The conditions on c allow integration into the model given by Gorman.

1200 THE ECONOMIC JOURNAL [DEC.
Two suggestions have so far been made for the form of c. Stone [213] suggested the expression
c = (a?) -ID@ . . (106)
for some symmetric matrix D and proposed a special form for D which guaranteed homogeneity and required relatively few parameters. Unfor-tunately this gives rise to a rather clumsy expression for the substitution matrix and to the best of our knowledge the model has not been applied. Nasse in an elegant paper [I511 has proposed
c = P-lDr where rt =pii . . (107)
and again D is some symmetric matrix. This time we may write
The importance of this is that the cells of the matrix D can be restricted in accordance with the postulates of separability and Nasse does this. Using French post-war data on both a broad and fine classification he compares his model, taking D as block-diagonal (i.e., assuming strong separability) with the normal linear expenditure system. But the results are disappointing, for Nasse finds little improvement over the normal model except at the higher level of disaggregation. Nasse's data covered a relatively short period and the restrictions that were consequently required on the matrix D may have precluded any great improvement on the basic model; this applies especially to block diagonality which implies additivity of the broad groups. But this seems a very promising approach and if this model can be applied elsewhere it may be able to perform the role for which the Rotterdam model was designed without any of the disadvantages of that system.
Finally there are methods of modifying the model by making the mar- ginal budget shares price-sensitive but these seem to have led to no empirical studies. These methods essentially are based on the more general utility functions
which have the linear expenditure system as a special case when all tend to zero. The special case where cri = v. for all i has been discussed by Pollack [I701 and the relationship between (109) and many other models of demand has been explored by Johansen [118]. Finally, a multi-level version has been proposed by Brown and Heien [29], the S-branch utility tree, but like the others, this model seems to present more estimation dif3- culties than opportunities for any useful development of demand analysis.
4. The Indirect Addilog System In some applications it is converlient to work not from the utility function
directly but from the function which relates the maximum utility attainable

19721 MODELS O F CONSUMER BEHAVIOUR 1201
to the level of prices and income. If we know the direct utility function v(q) and we know the demand functions, q(p, p), we may express utility indirectly as a function of prices and income. We thus write the indirect utility function
*(P>P) = v C ~ C P , PI 1 . (110)
These functions and their properties have been studied by a number of economists and original contributions were made by Hotelling [102], Koniis [124], Court [40] and Roy [183]. To take an example, the indirect utility function associated with the linear expenditure system is given by
Since any such function is the dual of the direct utility function, its minimisa- tion subject to given quantities and the budget constraint will lead back to the demand equations. Further, if # is held constant, we may calculate p as a function ofp, i.e., p = 0 (+,p), and this function has an interpretation as an ideal cost-of-living index number. Since the Hessian of this function is the Slutsky substitution matrix we are given a convenient interpretation of Hicks-Allen complementarity and substitutability which mirrors the classical definition of Edgeworth and Pareto in terms of the direct utility function. For example, good x is said to be a substitute for good y if an increase in the price of x has a greater impact on the cost of living the higher is the price of y.
However, the main empirical application of indirect utility arises through " Roy's identity " which states,
Thus given any function of prices and income which is homogeneous of degree zero in all its arguments, demand functions, fully consistent with utility theory, may be immediately generated by use of (1 12). Since $ is homogeneous of degree zero, we may write it in terms of the ratios of each price to income and Houthakker [log] has examined the case where it may be written as an additive function of these arguments, i . e . ,
This assumption, like direct additivity, implies strong constraints on be-haviour. I n fact for all indirectly additive models the uncompensated cross- price elasticities are identical for all goods affected and only depend on the good whose price has changed. This assumption which in turn implies
Note that indirect additivity is not the same as direct additivity; only the Bergson functions have both propertim. The relationship between the two concepts has been discussed also by Samuelson [189] and more recently by Lau [127].

1202 THE ECONOMIC JOURNAL [DEC.
indirect additivity, was first used by Leser 11351 in an application which we shall discuss in the next section.
Houthakker goes on to suggest the particular function
( ) = ( (Pi > - 1)i=1 P a Pi
the indirect addilog model, which has formed the basis of much empirical work. If we apply Roy's identity to (114) and take logs, we get the demand equations
log qi = log .i + 1% { F a k ( i ) 8 x )+ (Pi + 1) log (i) (115)
This is rather clumsy and we may instead take the rather more appealing relationship between pairs of goods,
log " (;)1) log +[(Pilog qi - log q j = - (P, + l ) l o g ( i ) (116)a1
In most applications one or the other of these two equations has been the basis of estimation. Elasticities may be derived from the differentiation of (116) and the application of Engel and Cournot aggregation; this gives
e = ~ + p - w ' P and
E = L@' - (P + I) . . (1 17)
The Pi paxameters may be interpreted as " reaction " or " urgency " para-meters in the sense that if the for a good is greater than the weighted sum of all the reaction coefficients then its income elasticity is greater than unity. Similarly a good is price-elastic or price-inelastic as its reaction parameter is positive or negative. For this model inferiority, though limited, is possible, as is complementarity. This flexibility of the model, along with the considerable range of Engel curves permitted by the formulation of the income response has led to considerable claims being made for it, e.g., by Somermeyer and Langhout [199] ; the reader interested in the possibilities is referred to this paper and to the excellent diagrams given by Solari [197]. However, it must be emphasised that the system is no less restrictive than the linear expenditure system, even though the constraints are imposed on different responses. Equations (1 17) show that all responses are determined by the n parameters P and with time series one would again expect the price behaviour to be largely determined by income information though in a different way than with the linear expenditure system. Thus one would
An identical functional form was suggested twenty years earlier by Konus [124] for a cost- of-living index number. He also deduced demand functions but these are compensated demand equations and differ in interpretation from Houthakker's. Houthakker's [108] identification of Konus equation with the indirect addilog utility function is thus incorrect. (Dr. Koniis has con- firmed this interpretation in private correspondence.)

19721 MODELS OF CONSUMER BEHAVIOUR 1203
expect similar income responses from applications of both systems but quite different price effects.
I t is particularly fortunate that many of the applications of this model have taken place in comparison with the linear expenditure system (and sometimes others). Both models have been estimated in the studies by Parks [159] (Swedish data), Yoshihara [243] (Japan), Solari [197], Baschet and Debreu [17] (both on data for several O.E.C.D. countries) and Theil [230, Ch. 51 (Holland and the United Kingdom). The indirect addilog system has also been extensively used in the Netherlands by Somermeyer and others [198], [199], [239], [221]. Not all these studies have led to the same conclusions; the results of Parks, Yoshihara and Theil suggest that the linear expenditure system does much the better of the two, while Solari and Baschet and Debreu find little difference between them. Though we shall discuss estimation problems later, there are particular difficulties with this model and some of these results may be affected by this; in particular in Yoshihara's study, the model does so badly not only relative to the linear expenditure system but also relative to its own performance in other circum- stances that one suspects that estimation difficulties may be the cause. Parks computes the linear expenditure system, with and without time trends in the parameters, as well as the Rotterdam model with the symmetry condition imposed. Though by the criteria he uses the Rotterdam model does best, it uses many more degrees of freedom than either of the other two models. The linear expenditure system, which can be much further improved by the addition of time trends, is superior even in its original form to the indirect addilog model. This result is eclioed by Theil who before estimation trans- forms the systems so that they predict value shares directly thus aiding the comparison. O n both Dutch and British statistics he finds that the indirect addilog is more inaccurate than either the linear expenditure system or the Rotterdam model even when this latter is estimated subject to additivity. However on a prediction test using British data the linear expenditure system fared the worst; since the models were estimated on pre-war data and the prediction period was 1950-55 when many goods were still rationed or in short supply, this result should not be given too much weight.
The studies by Solari and by Baschet and Debreu use less sophisticated tests to differentiate between the two models; on the other hand they present a wealth of information on elasticities for the various countries and various time periods. The outstanding impression from both of these is the similarity between the results of both models. These extend, with some exceptions, not only to the income elasticities as one might expect but also to the own price elasticities which is less to be expected. The explanation of this phenomenon seems to be that for both systems the own price uncompensated elasticity must be equal to minus the income elasticity with a correcting factor, additive for the indirect addilog and multiplicative for the linear
1 Theil's average information inaccuracy; this is discussed in part 6 (iv) below.

1204 THE ECONOMIC JOURNAL [DEC.
expenditure system. Here of course the similarity ends; the cross-price elasticities are quite different, as indeed they must be given the different implications of direct and indirect additivity.
In summary this system seems to have no clear advantages over the linear expenditure system: it is much more difficult to compute, more difficult to use, and apparently fits the data worse in situations where direct tests have been tried. Even if the results had shown that there was no difference in terms of performance, then the linear expenditure system would have won on grounds of computational ease. These results conform with one's intuition: the inherent plausibility of the want independence or direct additivity assumption for broad groups of goods is not matched by the assumption of indirect additivity.
Before moving from this model one more similarity between it and the linear model may be noted. We have shown how the latter model may be derived from general linear demand functions by imposing the constraints of the theory and the indirect addilog model may by a somewhat similar process be derived from a double-logarithmic model. The derivation is due to Houthakker [lo81 and Arrow [6] though a somewhat similar discussion is given in the much earlier paper by Leser [135]. Houthakker " corrects " the double-log demand function in order to make it satisfy the aggregation conditions and then by imposing the postulates of the theory reaches the indirect addilog demand equations. Thus if we begin with a linear demand model and impose the theory we reach the linear expenditure system and direct additivity; while if we start from a logarithmic demand model and do likewise we reach the indirect addilog model and indirect additivity. This is a good illustration of the fact that strong assumptions may be implied by an incautious choice of functional form.
5. Price Elasticities from Budget Data
We have already seen that direct additivity may be used to write all price elasticities in terms of the income elasticities and one additional para- meter and it is evident from the restrictiveness of indirect additivity that that assumption may be used for the same purpose. These models offer an " indirect" method of calculating price responses which may be very useful when price information is scarce. Many authors have found these models particularly interesting for their ability to estimate price elasticities without the obvious requirement, data on price variation!
The first study of this kind was the 1910 paper [166] by Pigou to which we have already referred. What Pigou suggested was that if wants were independent, and if over the range of observation the marginal utility of money could be taken to be constant, then the ratio of own-price elasticities for two goods would be equal to the ratio of their income elasticities. In an
See also the correction to Arrow's paper by Gorman [go]; this extends the argument to allow a hierarchic version of the model.

19721 1205MODELS OF CONSUMER BEHAVIOUR
example he calculated this ratio for food and clothes at various income levels. The assumption of constant marginal utility has caused considerable debate in the literature, (see particularly the papers by Friedman [74] and by Samuelson [185]), and it has generally been concluded that Pigou's method cannot be sustained except under highly restrictive conditions. However, if we look back to equation (20) and interpret the constancy of marginal utility in terms of a compensating variation in income, then we have in general
EL= 4e (A = constant) . . (118)
and in the particular case of additive utility where the off-diagonal elasticities are zero,
eft = 4es (A = constant) . . (119)
which is precisely Pigou's conclusion. The weakness of this approach, in modern terms, is that the specific substitution elasticities, which is what Pigou's method measures, are not in themselves of great practical interest. Nevertheless (119) may well be a reasonable approximation to the full substitution elasticity since the missing term is proportional to the square of the income response. And in addition it can be shown that even for the uncompensated elasticities the average value of the ratio of e f t to ef is approxi- mately 4. So the Pigou method may give a useful and easily applied rule of thumb in the case of broad commodity groups when other information is lacking.
Modern versions of this method are based on the work of Frisch, espe- cially his 1959 paper [79]. Assuming additivity, he proves the relationship (101) which we may write
st* = p6-l--84s 843. for i + j . ~ E . L8,
where o' is the income flexibility of the marginal utility of money. Frisch attaches great importance to this quantity since he regards it as an indicator of welfare (poor people have high negative values for 6, rich people small negative values), but from an empirical point of view the main concern is with its measurement. The first attempts were made by Frisch himself nearly thirty years previously [75]; in these he worked with a single com- modity and a price index of other goods rather than with a complete system. Though the approximations involved can probably be justified,l Frisch's estimates seem to be inconsistent with later results, perhaps because his empirical work was too narrowly based.
In general we may see from equation (18) that the measurement of 4, and thus of o', involves the disaggregation of the substitution effect, and this may be done by means of known constraints on the Hessian U. For
In the same terms as the use of weak separability for commodity aggregation, i.e., by the use of two price indices. Bergson [20] correctly pointed out that, taken strictly, Frisch's assumptions imply expenditure proportionality.
1206 THE ECONOMIC JOURNAL [DEC.
example, if it is known that a particular element of the inverse is zero, the value of 4 which is implied may be calculated from observable data. In particular, any assumption of preference independence can be used to lead to an estimate of the flexibility. Since many investigators have used such assumptions in conditions where price movements have occurred, there have by now been published a fairly large number of estimates of J from a wide range of countries and circumstances. Though not all of these conform to Frisch's prediction that J decreases and 4 increases with real income, there is considerable uniformity in the estimates, certainly enough to suggest that the method is practicable.
For example, the linear expenditure system, since it is an additive model, yields estimates for the flexibility &; we see from (102) that it is given by the ratio of total to supernumerary income with the sign changed. Though estimates obtained this way fluctuate considerably and some are very large, an average value of -2 for J seems consistent both with most such studies and with the results from fitting other models. The Rotterdam and constant elasticity models when estimated subject to additivity, again yield estimates of 4; and again the flexibility has been estimated in the same range, e.g., -1.8 for Holland [14], [227], [228], -2.8 for the United Kingdom [51], -2.1 for Australia [31] though to list the exception, Lluch reaches a figure of -0.4 on his Spanish regional data [142]. The " model of additive preferences " (see below) used by Powell et al. has given estimates for J of -1.6 for Canada [171], -1.5 for the United States [I731 and in [I721 Powell comments that experience with other data, including Chilean, led to estimates of 6 in the range -1.5 to -2.5. Johansen [117], after examining results of the linear expenditure system and of a method using budget data combined with time series feels that for Norway " the ' correct ' value of o' probably lies somewhere in the interval between -5.0 and -3.0." Hoa [I 001, again using Powell's model, calculated the flexibility for six Australian regions obtaining estimates in the range -1.7 to -4.3 though he could find PO evidence of a relationship between flexibility and real income, a conclu- sion repeated for Holland by Theil and Brooks [227].
Mention should also be made here of an ingenious attempt to calculate o' from Chilean budget data by Betancourt [22]. Since wage rates vary over households and since these may be regarded as the price of leisure, the one price elasticity which is needed to give an estimate of 6may be estimated. Perhaps not surprisingly this estimate is difficult to make with any precision and Betancourt can only suggest a wide band for 6.
Given these results and the fact that it is +,the reciprocal of o', which is used to calculate price- from income-elasticities, there would seem to be fair agreement on the use of a value for 4 around minus one half. Thus, though the precise relationship for all elasticities may be written
E = +(e" - ee'w) - ew' . . (121)

19721 1207MODELS OF CONSUMER BEHAVIOUR
if we return to the modification of Pigou's rule, we have the result that, on average, for broad commodity groupings, the ratio of own price elasticities to income elasticities is approximately minus one half. However convenient such a rule may appear to be, its usefulness would depend on its validity which, as we have seen, is open to considerable doubt. Nevertheless, as a rough guide, as a means of organising prior information, or as a method for use when price information is unobtainable, the method can perhaps be used. But when price information is available, it is liable to contradict (121) at least in some respects, and certainly price information should be used whenever possible.
The alternative method, based on indirect additivity, has been less used. Apart from the pioneering paper of Leser [I351 who used U.S. budget material and the work on the indirect addilog model already discussed, we are not aware of applications of this technique. Though the algebra of the connection between the elasticities is different, the principle is the same, and once again doubts over the validity of the postulate of indirect additivity, even more so than in the case of direct additivity, should dictate caution in the use of this method.
6. Other Models of Demand Though the models we have discussed so far are the most important in
the sense that they have to date been the most used, there exist a number of other formulations of utility and demand which have appeared at various times. Before going on to discuss the problems of specification and estima- tion we shall present the main features of each of these other models.
(i) "Australian " Models. We take this title as conveniently covering the models suggested and estimated by Leser [136], [I371 and [I381 and the similar " model of additive preferences " put forward by Powell [I721 and used by him and others in various applications [I 7 I], [173], [I 001, [lo I]. All these models, in a manner similar to the derivation of the linear expendi- ,ture system, begin with expenditures expressed as a linear function of in- comes and prices (and sometimes a time trend). Various constraints are then enforced; Leser applies the constraints of the theory and in addition imposes the equality of all Allen partial elasticities of substitution while Powell imposes additivity. This latter might be expected to lead to the linear expenditure system and it would do so save for Powell's imposition of a particular relationship between the flexibility, income and prices which rules out the relationship (102). Thus, for both models, global compliance with the restrictions is precluded and these restrictions are exactly satisfied only for values equal to the means of the observations. As in the case of the double logarithmic model, the properties of these systems will depend on how good or bad the approximations turn out to be for values covering the range of experience. However, unlike the case of that model, it is difficult to see the need for being content with any degree of approximation.

1208 THE ECONOMIC JOURNAL [DEC.
As we have seen, the linear expenditure system is euerywhere consistent with demand theory, and requires no approximation. I t could, however, be argued that these Australian models do permit greater price sensitivity than the standard model and indeed as Goldberger [81] has indicated, the Powell model may be derived from the linear expenditure system by making the c parameters become functions of prices and average quantities. This is a property shared by Leser's models but in both cases the symmetry condition on the derivatives is not met so that the models may not be derived from utility functions. Here too there are models (e.g., the Nasse version of the linear expenditure system) which allow price variation of the c's within the theory. Thus to argue for these models requires a justification in their own terms independently of the theory rather than as approximations to it and we are not aware that such arguments have been put. For one of the models, the constant elasticity model of Leser [137], linear estimation is possible; though this is a considerable practical advantage it is perhaps less so now than when the model was first suggested.
All this makes it difficult to interpret the empirical results derived from these models, especially since they have not been directly compared on the same data with other formulations. The estimates of the flexibility cii have been discussed in the previous section and these are in line with other estimates. Though the investigators have been satisfied with the results in most of the applications, there does not seem to be any obvious reason to prefer these to the more usual versions of the linear expenditure system.
(ii) The Rotterdam Model in Relative Prices. This model may be derived from the absolute price version (88) by decomposing the substitution matrix into general and specific effects. Using the notation of the Rotterdam model, we see that the decomposition (18) may be written
where N bears the same relationship to the specific substitution matrix as C does to the total substitution matrix, i.e.,
From the adding-up constraint it is clear that
NL= $6 and L'NL= $ . . (124)
These may be used to substitute for C in the model to give eventually
&d log q = bd log p + Nd log$ . (125)
where d log $ = d log p - ~b'dlog p . (126)
This latter is a differential " real " price index deflating each price by an index of all other prices; this gives the model its " relative price " name. Note now that the model gives the behavioural change in the value shares as a function of real income (using a price deflator based on average value

19721 1209MODELS OF CONSUMER BEHAVIOUR
shares) and of relative prices (using a price deflator based on marginal value shares). Because of the non-ordinal nature of the decomposition (122)) the equation (125) is not measurable since any arbitrary multiple of 66' may be added to N without altering the value of the expression. Thus the model can only be used in the case of preference independence where it is known in advance that one or more of the elements of N is zero.
The model has been used in this form by Barten [12] and more exten- sively by Theil [226] and [228]. The latter, in his applications to Dutch and British data, has made great use of the flexibility of this model to impose diagonality on the matrix N where possible, while allowing particular elements to be non-zero when it became clear that additivity was not every- where applicable. For example in [226, Ch 11.81, on the four-commodity Dutch data, variants of the additive model allowing in one case specific interaction between durables and the remainder, and in the other between all non-food combinations, considerably improved the basic model. The sum of the elements of the matrix also gives an easily obtained estimate of + and thus of the income flexibility d. This model might also be used to analyse price effects for large numbers of commodities; if the marginal budget shares could be determined elsewhere, say from budget data, all the time-series information could be used to investigate the structure of N. This matrix is much more useful for the purpose than any other since its intimate relationship with the Hessian allows the theory to restrict it very directly.
(iii) The Direct Addilog Model. This is another model suggested by Houthakker [log] and is the direct utility analogue of his indirectly additive model. The utility function is a specialisation of (109) and may be written
Once again the demand functions are written in terms of pairs of commodi- ties, i.e.
(Pi - 1) log q8 - (pr - 1) log q j = log pi - log@*- log 2 (128)E l
which has obvious similarities to the indirect equation (1 15). Apart from the original application by Houthakker, this model seems only to have been applied to U.K. data [49] and 1511 and the reader is referred there for derivations of the flexibility and the elasticities. From the table on page 1192, we see that on the U.K. experience, the direct addilog model fitted better than either the linear expenditure system or the Rotterdam model with additivity imposed. This is probably due to the fact that the direct addilog system allows the income elasticities to decrease slowly as income increases. Even so this model fits worse than other models where additivity is not im- posed; thus, though this may fit better than other additive models it does not remove one's doubts about the validity of additivity itself.
No. 328.-~0~. 82. 4 K
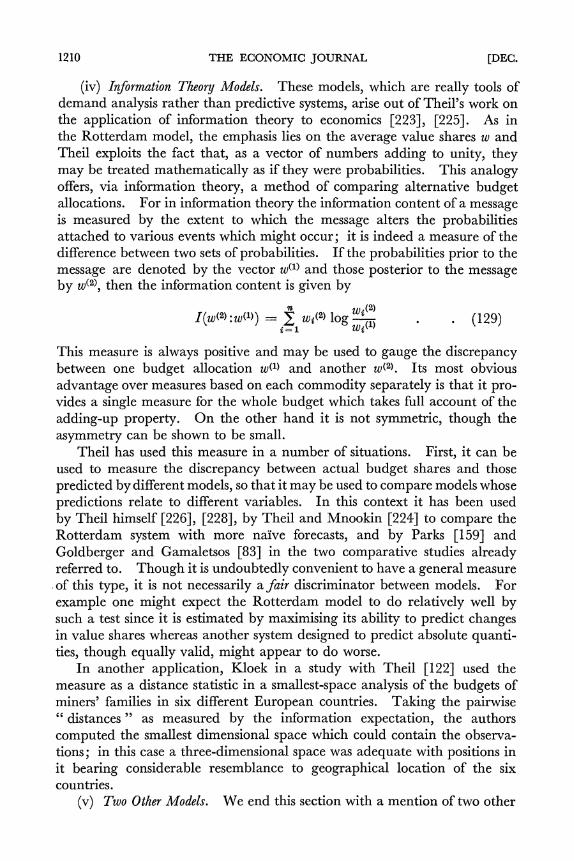
1210 THE ECONOMIC JOURNAL [DEC.
(iv) Information Theory Models. These models, which are really tools of demand analysis rather than predictive systems, arise out of Theil's work on the application of information theory to economics 12231, 12251. As in the Rotterdam model, the emphasis lies on the average value shares w and Theil exploits the fact that, as a vector of numbers adding to unity, they may be treated mathematically as if they were probabilities. This analogy offers, via information theory, a method of comparing alternative budget allocations. For in information theory the information content of a message is measured by the extent to which the message alters the probabilities attached to various events which might occur; it is indeed a measure of the difference between two sets of probabilities. If the probabilities prior to the message are denoted by the vector w(l) and those posterior to the message by w(~) , then the information content is given by
I(w(2):w(l)) = Cn ~ $ 2 )log
Wi(2) - . (129)
i = l wi(l)
This measure is always positive and may be used to gauge the discrepancy between one budget allocation wcl) and another w ( ~ ) . Its most obvious advantage over measures based on each commodity separately is that it pro- vides a single measure for the whole budget which takes full account of the adding-up property. On the other hand it is not symmetric, though the asymmetry can be shown to be small.
Theil has used this measure in a number of situations. First, it can be used to measure the discrepancy between actual budget shares and those predicted by different models, so that it may be used to compare models whose predictions relate to different variables. In this context it has been used by Theil himself 12261, [228], by Theil and Mnookin 12241 to compare the Rotterdam system with more naive forecasts, and by Parks 11591 and Goldberger and Gamaletsos 1831 in the two comparative studies already referred to. Though it is undoubtedly convenient to have a general measure of this type, it is not necessarily a fair discriminator between models. For example one might expect the Rotterdam model to do relatively well by such a test since it is estimated by maximising its ability to predict changes in value shares whereas another system designed to predict absolute quanti- ties, though equally valid, might appear to do worse.
In another application, Kloek in a study with Theil 11221 used the measure as a distance statistic in a smallest-space analysis of the budgets of miners' families in six different European countries. Taking the pairwise " distances " as measured by the information expectation, the authors computed the smallest dimensional space which could contain the observa- tions; in this case a three-dimensional space was adequate with positions in it bearing considerable resemblance to geographical location of the six countries.
(v) Two Other Models. We end this section with a mention of two other
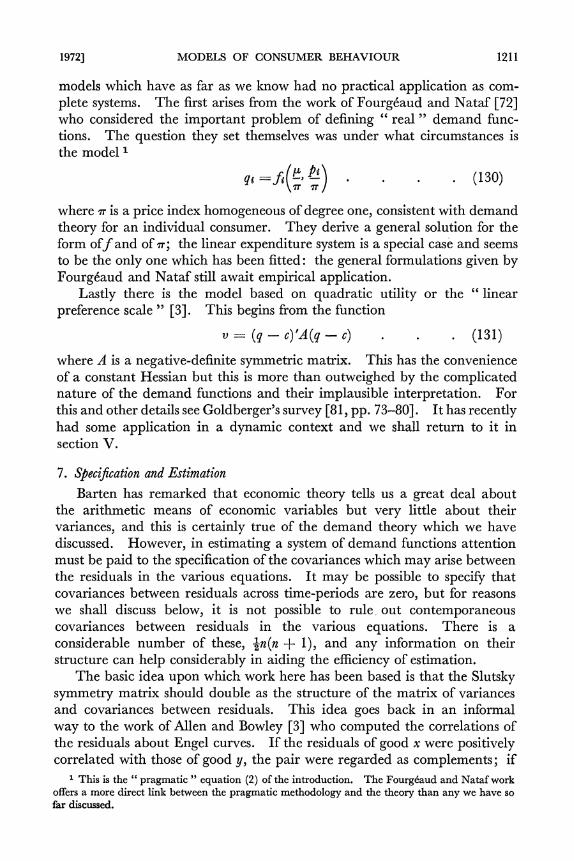
19721 1211MODELS OF CONSUMER BEHAVIOUR
models which have as far as we know had no practical application as com- plete systems. The first arises from the work of FourgCaud and Nataf [72] who considered the important problem of defining " real " demand func- tions. The question they set themselves was under what circumstances is the model l
where T is a price index homogeneous of degree one, consistent with demand theory for an individual consumer. They derive a general solution for the form off and of T ; the linear expenditure system is a special case and seems to be the only one which has been fitted: the general formulations given by Fourgtaud and Nataf still await empirical application.
Lastly there is the model based on quadratic utility or the " linear preference scale " [3]. This begins from the function
where A is a negative-definite symmetric matrix. This has the convenience of a constant Hessian but this is more than outweighed by the complicated nature of the demand functions and their implausible interpretation. For this and other details see Goldberger's survey [81, pp. 73-80]. I t has recently had some application in a dynamic context and we shall return to it in section V.
7. SFeciJication and Estimation Barten has remarked that economic theory tells us a great deal about
the arithmetic means of economic variables but very little about their variances, and this is certainly true of the demand theory which we have discussed. However, in estimating a system of demand functions attention must be paid to the specification of the covariances which may arise between the residuals in the various equations. I t may be possible to specify that covariances between residuals across time-periods are zero, but for reasons we shall discuss below, it is not possible to rule out contemporaneous covariances between residuals in the various equations. There is a considerable number of these, +n(n + 1), and any information on their structure can help considerably in aiding the efficiency of estimation.
The basic idea upon which work here has been based is that the Slutsky symmetry matrix should double as the structure of the matrix of variances and covariances between residuals. This idea goes back in an informal way to the work of Allen and Bowley [3] who computed the correlations of the residuals about Engel curves. If the residuals of good x were positively correlated with those of good y, the pair were regarded as complements; if
This is the " pragmatic " equation (2) of the introduction. The Fourgtaud and Nataf work offers a more direct link between the pragmatic methodology and the theory than any we have so far discussed.

1212 THE ECONOMIC JOURNAL [DEC.
they were negatively correlated, as substitutes. Theil and Neudecker [218] attempted to formalise this result using a quadratic utility function with stochastic variation in the linear part but were unable to reach the desired solution. However in [12], Barten does use a model based on this formula- tion and he attributes the proof to an unpublished paper by Theil. More recently in [229] Theil himself has discussed his model in some detail. We confine ourselves here to an outline.
In general we may assume that the maximisation process is carried out, not exactly, but subject to some margin of error. The first order condition (4) is then modified, the budget constraint being assumed still to hold exactly. The fundamental equation (8) is then modified to read
where z is a vector of errors. The result of this is that the demand functions are now subject to an error E, say, given by
This method can be used quite generally to introduce omitted variables into the demand function whether they be stochastic or not. The Theil model goes further and specifies a structure for the random items. He assumes that there is a cost to the consumer in getting the maximisation exactly right and that this must be balanced against the loss of utility when he is wrong. Taking a quadratic approximation to the latter and using the generalised variance of E as a measure of the consumer's freedom of action, he makes an " efficiency" assumption, exactly parallel to that used in portfolio theory, that the consumer maximises the variance for any expected loss of utility. Thus if Z is the variance of z, we find using the expectation operator b ( ),
for some 02, and thus that
and this is the desired result. The variance-covariance matrix is propor- tional to the Slutsky substitution matrix (with the signs changed).
Though this specification is of possible significance in gaining degrees of freedom it is not easily enough estimated to have been used to any great extent. However, even without it, the fact that demand functions are subject to an exact, i.e., non-stochastic, adding-up constraint, presents certain problems of specification. T o see this, let us write the demand function at time t, in the form
and write

19721 1213MODELS OF CONSUMER BEHAVIOUR
as the matrices of variances and covariances between residuals. Since the model represented by f must satisfy the aggregation constraint, then
ptlqt = pt = ~ ' f t giving L ' E ~= 0 . (138)
Thus "att' L ' & { E ~ , elt') = & { L ' E ~ , = 0 . . (139)= ~ ' ~ 1 )
i.e., all of the covariance matrices are singular. This problem, which must occur in some form in all demand systems, has occurred frequently in demand analysis but until recently most investigators noted the problem but ignored it, often assuming structures for Q such as the identity matrix which could not be singular. The immediate problem is, of course, that if this moment matrix is singular the likelihood function of the sample is not defined nor are the generalised least-squares Aitken estimators which are best linear unbiased in this situation.
In what we may call the normal case, when the matrices Qttl are assumed zero when t # t' and constant otherwise, the problem has been dealt with by a number of economists including Barten [14], Parks [159] and [160], Theil [228, Ch. 61, Solari [197], Powell [174] and Deaton [50]. Most of these studies have dealt with either the linear expenditure system or the Rotterdam model, each of which has an exact linear dependency. Briefly the conclusions may be summarised as follows. I t is possible to drop one of the equations and deal with the model as a linearly independent set; which equation is omitted makes no difference and the one which is not estimated may be calculated from the adding-up condition. Similarly, the likelihood function is perfectly well defined if one of the functions is excluded and its value can be shown to be the same no matter which. Alternatively and perhaps more elegantly, some form of the generalised inverse may be used to give the likelihood function and the Aitken estimators; this preserves the symmetry of the model and is perhaps easier computationally. This gives us the modifications we need and the singularity problem can now be said to have been solved.
Other stochastic specifications have been made and in many cases it is not very realistic to assume that the matrix Q is constant over time. For example, Pollack and Wales [I671 examined various different formulations of the error structure for the linear expenditure system and Parks [158] has dealt with and applied the very difficult case when there is both serial and contemporaneous correlation. Though it is often difficult to avoid the charge that Q is often specified for reasons of convenience in a form difficult to justify on theoretical grounds, there is no particular virtue in the normal specification; the recognition of the best form for each system will have to wait until we have considerably more experience with the different possibilities.
Another problem, which is not unique to demand analysis but should be briefly mentioned here, is the question of how to estimate Q. Unless the specification (135) is chosen or there exists other prior information, the
1214 THE ECONOMIC JOURNAL [DEC.
parameters of this matrix must be estimated simultaneously with the other parameters of the model. The normal way of doing this at present is to condense the likelihood function, maximising with respect to the elements of Cl first. This gives an estimator of a,in terms of the basic parameters, which may be substituted into the likelihood function leaving a maximisation problem in terms of the model parameters only; see for example Rothenburg and Leenders [182]. This may in some cases render an otherwise linear model non-linear but as most of the models are non-linear in any case this is not a severe drawback.
The non-linearity problem in demand analysis is, in a sense, inevitable. For as we have seen, models which are linear either in logarithms or natural quantities are either inconsistent with the theory or over-abundant in para- meters. In consequence we are continually faced with models which are theoretically satisfactory but give rise to severe practical difficulties. Early attempts to estimate these models relied heavily on special tricks. For example, Stone in his first paper on the linear expenditure system [204] suggested a two stage procedure. If values are known for the c parameters, estimation of the vector b is linear and vice versa; thus, starting from some arbitrary values we can proceed, at every stage increasing the likelihood function, till convergence is reached. This method, though giving very slow convergence after the first few iterations, employs standard computer packages and is still used for the linear expenditure system and some of its variants including for example the Australian models. Increasingly, how- ever, use is being made of modern minimisation algorithms usually based on the Gauss-Newton process (see particularly Marquardt [144], Fletcher and Reeves [70] and Fletcher and Powell [69]). Since the likelihood functions of these non-linear models appear to be elongated along one or more axes in the neighbourhood of the minimum, these more sophisticated techniques are needed in order to guarantee good estimates of the less well determined parameters. For example, experience with the linear expenditure system would indicate that all methods yield similar estimates of the b parameters but that considerable variation exists in the estimates of c. Since the standard errors are usually computed from an approximation to the slopes of the likelihood function at the final point they may also for practical purposes be regarded as indicating likely convergence errors.
Though considerable experience in operating these techniques has now accumulated relatively little is known about the statistical properties of the corresponding estimators. This is due on the one hand to the analytical intractability of the estimation formulae and on the other to the considerable expense of carrying out a large number of simulations. On this last point it is only Solari [I971 who seems to have rapid enough computing facilities to attempt Monte Carlo studies and his results are not encouraging. Using the linear expenditure system with b's and c's given, Solari calculated from British prices and income skries for expenditures on various categories.

19721 1215MODELS OF CONSUMER BEHAVIOUR
He did this both for a long time series (1900-67) and a short one (1948-67) and estimated in 500 trials by ordinary least squares and by maximum likelihood, the latter using a maximum likelihood estimator of Q. The maximum likelihood estimators performed better than ordinary least squares in terms of both bias and variation, the reduction in variation being more noted for the c's than for the 6's. But what is really serious is that, except for the maximum likelihood estimators over the long time series, .the hypo- thesis that the parameters and elements of the variance-covariance matrix were equal to their true values was rejected at a high level of significance. Thus not only do the methods give rise to bias, but the standard errors of the estimates do not give a fair idea of the magnitudes of the errors involved.
I t is quite likely that as computing standards rise, more studies of this nature involving other models will be undertaken. The results so far obtained hardly induce complacency yet undoubtedly similar problems will arise elsewhere. The time is rapidly passing when investigators are happy to get any estimates they can of the parameters of their models; standards of acceptability will rise with the speed of the computers.
Other less central econometric problems have arisen in demand analysis. First, since many price series are obtained by dividing current price series by constant price series, errors in the latter will induce spurious correlation in quantity on price regressions. In multi-equation demand systems this biases the estimated substitution matrix towards negative-definiteness. I t is hard to see what can be done about this in the absence of knowledge of the size of the errors but this point should be borne in mind when assessing the validity of the negativity criterion. Secondly there is the problem of multi- collinearity and though we have rarely explicitly named it, it has underlain much of our discussion. The existence of strong correlations between in- come and price series is symptomatic of the lack of genuinely independent price information and it is to circumvent this lack that the strong assump- tions of the theory are used. In a particular situation the investigator must select a model which uses the information which does exist and substitute assumptions for that which does not.
But there are a number of devices of estimation which we have not discussed. One of these is the use of direct prior information, usually in the form of budget study elasticities, in time series analysis. Setting aside the problem of whether cross-section income elasticities are interpretable as time-series income ela~ticities,~this method has been applied frequently, as early for example as Stone's 1953 study [203]. The statistical methods involved have been discussed by Durbin [57] and by Theil and Theil and Goldberger [219] and [220]. An example of the application of the latter
The problem has been stated often enough, e.g., Houthakker [ I l l ] but we know of no model linking them. The problem is theoretically one of aggregation; in practice progress has probably been hampered by the lack of consistent time-series and cross-section data.

1216 THE ECONOMIC JOURNAL [DEC.
is given by Barten [8] who uses Stone's estimates as prior information for his " almost-additive " model of Dutch consumption.
Finally, use may be made of quarterly or even monthly time series to yield more price information. Brown [27] has developed a technique based on covariance analysis which disentangles the seasonal effects from the price and income effects which are to be observed. This has been applied to obtain estimates of price and income elasticities for a number of commodities from the monthly data generated by the British National Food Survey and the results are published in their annual reports [235].
When we consider the determination of the proportion of income devoted to the purchase of various categories of durable good a set of new problems has to be faced. For the stock of durables already held will at the same time influence present expenditure and depend upon past expenditure. Further-more, it is no longer realistic to write the budget constraint in the way we have done so far: the consumer may be prepared to borrow in order to finance purchases and the existence of some second-hand markets may allow him to realise at least part of the value of his stocks. Many of these difficulties arise out of the intertemporal nature of the problem and one way of proceeding is to extend the static theory of consumer demand to take explicit cognisance of the presence of time by dating the arguments of the utility function. In this way the consumer makes an allocation plan for any number of periods ahead instead of once and for all. If at time 6' he wishes to plan for T years ahead, he will maximise
where the q's now refer to quantities consumed which are now distinct from purchases. Maximisation is subject to the intertemporal budget constraint that his current wealth plus the discounted value of his income should not exceed the present value of his consumption. This approach was pioneered by Tintner [231] in 1938 but has had its most fruitful application in the work of Modigliani and Brumberg [147], [I481 on the life-cycle model of the consumption function. In this latter the arguments of the utility function are taken as total consumption levels thus directing attention towards the temporal allocation of expenditures and away from the commodity alloca- tion. In spite of the well-known difficulties with this type of model, e.g., over measuring variables such as permanent income, over the possible inconsist- ency of plans, and over the treatment (or non-treatment) of uncertainty, it provides a justification of permanent income models and a framework for analysing the effects of population and real income growth on the proportion of income saved. However, it is doubtful whether there are additional

19721 MODELS OF CONSUMER BEHAVIOUR 1217
empirical insights beyond these to be gained by considering the allocation of expenditures within this framework.
One possible simplification of (140) is to assume that the utility function is separable into functions for each period; in the simplest case it may be taken as the sum of time-invariant utility functions discounted by some rate of time preference. This gives a complete dichotomy between the intertemporal and the inter-commodity allocation problems; the allocation over commodities depends only on total expenditure for that period, this latter being determined within a life-cycle or permanent income model. Stochastic specification apart, this may be regarded as a justification for the use of static models such as those we have discussed.
To allow for specific intertemporal effects such as those occurring when stocks of durable goods affect current expenditure it is necessary to allow interactions in the utility function between consumption at different time periods. Once again there is a considerable difficulty of specification and the art of constructing these models clearly depends on finding some way of allowing these interactions which is both simple and stable through time. This is especially true since the data from which the parameters of such models must be estimated are mostly the same, with all their imperfections, as those available for the estimation of the static models. Many different writers have made many different attempts to capture what for them appears to be the essence of the durable goods expenditure process. For the purpose of this survey it is necessary to apply fairly stringent criteria of selection, and to avoid the tabulation of many examples which differ from the ones included in only minor detail. Our approach will be to concentrate (a) on models for the explanation of the demand for individual goods, omitting any detailed discussion of the aggregate consumption function as such; (b) on models which have been reasonably tested against data; and (c) more subjectively, on models which seem to promise most possibilities for development.
The natural approach to the problem of durable goods expenditure analysis is to allow stocks of goods to affect current expenditure decisions: these current decisions in turn affect the future levels of the stocks and thus set up a dynamic relationship between consumption and its previous values. The specification may make utility a function of the stocks or may rely more directly on a demand function in which stocks play some role. A notable attempt to set up a model of the former type was made by Boulding [24] in 1950 and was picked up by Cramer in 1957 [42].
I n this model the utility function is written in terms of stocks only and the consumer attempts to maximise
where s is the vector of stocks subject to a wealth constraint
w =P'S . (142)
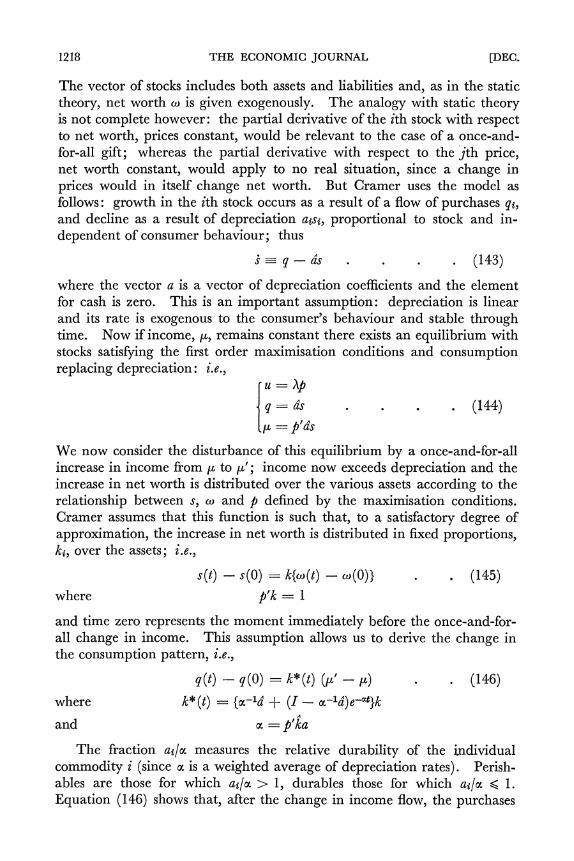
1218 THE ECONOMIC JOURNAL [DEC.
The vector of stocks includes both assets and liabilities and, as in the static theory, net worth w is given exogenously. The analogy with static theory is not complete however: the partial derivative of the ith stock with respect to net worth, prices constant, would be relevant to the case of a once-and- for-all gift; whereas the partial derivative with respect to the jth price, net worth constant, would apply to no real situation, since a change in prices would in itself change net worth. But Cramer uses the model as follows: growth in the ith stock occurs as a result of a flow of purchases q g , and decline as a result of depreciation atst, proportional to stock and in- dependent of consumer behaviour; thus
where the vector a is a vector of depreciation coefficients and the element for cash is zero. This is an important assumption: depreciation is linear and its rate is exogenous to the consumer's behaviour and stable through time. Now if income, p, remains constant there exists an equilibrium with stocks satisfying the first order maximisation conditions and consumption replacing depreciation : i.e.,
u = hp q = cis . (144)
p =p'cis
We now consider the disturbance of this equilibrium by a once-and-for-all increase in income from p to P'; income now exceeds depreciation and the increase in net worth is distributed over the various assets according to the relationship between s, w and p defined by the maximisation conditions. Cramer assumes that this function is such that, to a satisfactory degree of approximation, the increase in net worth is distributed in fixed proportions, kt, over the assets; i.e.,
~ ( t )- ~ ( 0 )= k{w (t) - w (0))
where P'k = 1
and time zero represents the moment immediately before the once-and-for- all change in income. This assumption allows us to derive the change in the consumption pattern, i.e.,
~ ( t )-- = k* (t) (P' - P) . (146)
where k*(t) = {a-la" + (I- ~-ld)e-~t)k
and a =p'ka
The fraction atla measures the relative durability of the individual commodity i (since a is a weighted average of depreciation rates). Perish-ables are those for which atla > 1, durables those for which at/a < 1. Equation (146) shows that, after the change in income flow, the purchases
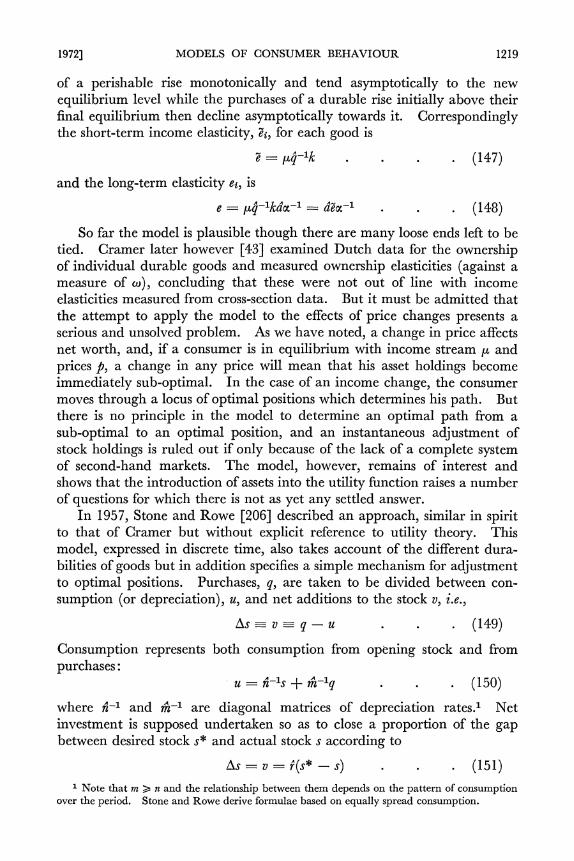
19721 MODELS OF CONSUMER BEHAVIOUR 1219
of a perishable rise monotonically and tend asymptotically to the new equilibrium level while the purchases of a durable rise initially above their final equilibrium then decline asymptotically towards it. Correspondingly the short-term income elasticity, Zi, for each good is
and the long-term elasticity ea, is
So far the model is plausible though there are many loose ends left to be tied. Cramer later however [43] examined Dutch data for the ownership of individual durable goods and measured ownership elasticities (against a measure of w ) , concluding that these were not out of line with income elasticities measured from cross-section data. But it must be admitted that the attempt to apply the model to the effects of price changes presents a serious and unsolved problem. As we have noted, a change in price affects net worth, and, if a consumer is in equilibrium with income stream p and prices p, a change in any price will mean that his asset holdings become immediately sub-optimal. I n the case of an income change, the consumer moves through a locus of optimal positions which determines his path. But there is no principle in the model to determine an optimal path from a sub-optimal to an optimal position, and an instantaneous adjustment of stock holdings is ruled out if only because of the lack of a complete system of second-hand markets. The model, however, remains of interest and shows that the introduction of assets into the utility function raises a number of questions for which there is not as yet any settled answer.
I n 1957, Stone and Rowe [206] described an approach, similar in spirit to that of Cramer but without explicit reference to utility theory. This model, expressed in discrete time, also takes account of the different dura- bilities of goods but in addition specifies a simple mechanism for adjustment to optimal positions. Purchases, q, are taken to be divided between con- sumption (or depreciation), u, and net additions to the stock v, i.e.,
Consumption represents both consumption from opening stock and from purchases :
u = A-1s + A-lq . (150)
where A-I and A-I are diagonal matrices of depreciation rates.l Net investment is supposed undertaken so as to close a proportion of the gap between desired stock s* and actual stock s according to
Note that m > n and the relationship between them depends on the pattern of consumption over the period. Stone and Rowe derive formulae based on equally spread consumption.

1220 THE ECONOMIC JOURNAL [DEC.
where s* is determined by a set of functions, usually with prices and income as arguments. Two basic parameters characterise each commodity there- fore, the technical depreciation rate and the urgency ra with which the consumer acts to close the gap between his desired and actual stock positions. Stone and Rowe use this latter parameter to meet the deficiency of the Cramer model, though the way in which it is introduced is arbitrary and not based on any fundamental theory of behavi0ur.l
I n most practical applications where information on stocks is unavailable it is necessary to combine the equations of the model to derive a difference equation in the quantities purchased; this gives
The precise nature of the price and income response depends on the formula- tion of the desired stock but the general outline is clear. An increase in the desired stock (due to an increase in income or a decrease in price) leads to an immediate increase in purchases, the size of which depends largely on the adjustment speed rr. I n subsequent periods, though there is still some leeway to make up, the new increased stock is now exerting a down- ward influence on further purchases. The relative size of the short- and long-run responses is determined by the balance between the rate of depre- ciation and the rate of adjustment; the ratio of short- to long-run elasticity, both for price and income, is given by the product of ri and nt. This is reasonable; in the model, a rapid rate of depreciation has much the same effect on the relationship between short- and long-run behaviour as does an urgent desire to close the gap between actual and desired stocks.
If desired stock is made to be a function of more than one variable, e.g., income and price, then (152) gives rise to a non-linear estimation problem; this may be resolved either by assuming values for the depreciation rate and calculating the other parameters or more directly by using some non-linear minimisation algorithm. I n either case the resulting constrained minimum could be compared with that yielded by linear estimation to yield information on the validity of the constraint. This would test directly the fundamental premise of the model that exogenous variables act only on purchases via the interaction of desired and actual stocks. I t is of course this premise which gives rise to the existence of the same relationship between the long- and short-run elasticities for all exogenous variables. I n practice, however, it is difficult to differentiate between this and other dynamic models since most formulations give rise to a lagged dependent variable plus contemporaneous and lagged values of the other regressors.
An ingenious justification has been put forward by Feige [65]. If the consumer experiences costs of being out of long run equilibrium and costs of change each of which may be represented by quadratic functions then total cost minimisation leads to the partial adjustment mechanism (151).
And possibly examining different values to see which gives the best fit, see Nerlove [I531 and Stone and Rowe [209].

19721 MODELS OF CONSUMER BEHAVIOUR 122 1
Indeed partial adjustment to the static model would give an estimating equation which would in practice be difficult to differentiate from (152). In this context it is particularly interesting to examine the plausibility of the estimates obtained from this model and although the dynamic formulation offers considerable improvement over the performance of the static formula- tion, the Stone-Rowe model in its first applications [205] and [209] yielded implausibly high depreciation rates (i.e., low values for n). For example in their studies of furniture, radio and electrical goods, and household hardware for the United Kingdom, Stone and Rowe found that these goods were 90%-depreciated in between one and two years. They suggest that this may reflect a premium on newness, but their results were achieved over fairly short time periods and their methods do not yield estimates of standard errors.
However, in the last few years the same model, though under a different name, has been extensively applied to time-series data of considerable length for the United States, Canada and Sweden yielding a large body of empirical results. These studies are based on the state-adjustment model proposed by Houthakker and Taylor [113] and used by them for the analysis of demand for eighty-one commodities in the United States from 1929 to 1964. This work can be regarded as returning to the methodology of Stone's 1954 analysis of food demand in the United Kingdom; though now the analysis is in dynamic terms allowing separate short- and long-run elasti- cities, the main concern is to estimate a " satisfactory " equation for each commodity and to use it to project ten years or so ahead. Though this approach is theoretically unsophisticated and can provide no precautions against mis-specification, it has the advantage, like the earlier work of Stone, of yielding plausible estimates of elasticities for a large number of detailed commodities in a way which is as yet out of the reach of most of the complete models of demand. It is thus worth spending some time on their description of the model and on the results achieved by applying it.
Unlike the Stone-Rowe model, the state-adjustment model is initially specified in continuous time. There are two structural equations: first, the depreciation assumption
is the continuous analogue of (149) and (150) with the parameter 6 replacing n . Instead of the partial adjustment mechanism, however, Houthakker and Taylor postulate a direct relationship between purchases, stocks and the exogenous variables : we may write this
where z represents the exogeneous variables, usually a constant and income. The parameter P and an extension to the interpretation of s play a key role in the subsequent analysis. Instead of taking a typical element of s as

1222 THE ECONOMIC JOURNAL [DEC.
exclusively representing the stock of a durable good, it may here be regarded also as representing a psychological " stock of habits " or in many cases a combination of both; the concept is thus relabelled a " state." Equation (153) thus has an additional interpretation in terms of purchases reinforcing habits which would otherwise wear off at a constant proportional rate. Since in most applications the stock of habits is no less observable than the stock of physical goods, the admission of such a concept widens the inter- pretation and applicability of the model, especially to perishable goods, without introducing any additional complications. Each good now is characterised by the two parameters P and 6 : the former, if positive, indicates that the higher the stock the higher are purchases and the good is there- fore regarded as habit-forming; if negative, the stock exerts a downward influence and the good is said to be subject to (net) inventory effects. Note that the formulation in continuous time avoids problems with goods that depreciate completely within the period of observation.
If the two equations are combined an estimating equation may be derived;
d = ( P - 6 ) q + y ( f ( z ) + S f ( i ) ) . . (155)
This equation is the continuous form of equation (152) and is empirically indistinguishable from it; 6 plays the part of nr-l as one would expect and the quantity 6 - P is equivalent to the response coefficient r$. Clearly then, the Houthakker-Taylor model in reduced form is indistinguishable from the Stone-Rowe model; only the interpretation of the results is different. This identity allows us to interpret the results of each model in terms of the other; for example if rz in the Stone-Rowe model is greater than unity an acceptable explanation may exist in terms of the state model; while if a durable good turns out to have a positive P coefficient in the state model this may be ascribed to a depreciation rate in excess of adjustment speed.
In order to estimate their model Houthakker and Taylor derive a discrete time version of (155), the parameters of which can be used to calculate the structural coefficients. As stated, 81 commodities were analysed and for 65 of these the state model offered the most satisfactory equation; for all these the inequality 0 < 6 - P < 1 was satisfied. This result, not strictly required by the state interpretation, implies that all of these equations can be interpreted according to the stricter Stone-Rowe formulation. A check through Schweitzer's results for 38 Canadian commodities 1926-75, [I931 and Taylor's results for 64 Swedish commodities 1931-58 [217] g'lves a similar resu1t.l I t would seem then that dynamic behaviour in consumption may equally well be described by partial adjustment to desired stocks or states as by the more direct influence of habits and inventories.
Two of Schweitzer's equations break the rule; only one-clothing in kind supplied to the armed forces-significantly so. Six of Taylor's results do so; only one--electricity consumption-is significant.

19721 MODELS OF CONSUMER BEHAVIOUR 1223
Though a general rapidity of depreciation is not found in these studies, there would still seem to be some doubt over the correct interpretation of this parameter. The authors present only the instantaneous depreciation rate 6 which is difficult to interpret; a more useful measure is the number of years required for 90% decay of a given stock; some sample results are given in the table below:
Number of Years Required for 90% Decay of a Given Stock
Category of goods. United States. Canada. Sweden.
Furniture , , . . Cars . . . . Men's clothing . Women's clothing . . . . Various household appliances .
62.9 14.7 36.8 3.8 7.5 I
00
8.0 87.6 9.3
10.9 }
24.7 2.6 3.3
1.4,3 1.9 *
1 Radio and television. a All household appliances. Radio sets. * Vacuum cleaners.
The Swedish figures alone appear plausible in spite of the rather high depre- ciation rate of cars estimated for that country. However, the very low depreciation rates for the other countries, under the state model, could be ascribed to the persistence of habit formation: even though cars themselves depreciate rapidly, the car-owning habit is extremely long-lived. The difficulty with this interpretation is that by using it any value of 6 can be justified and the estimated values become of much less interest than they would be if they could be accepted simply as physical rates of depreciation. Of considerably more importance is the sign of the parameter P, or in the Stone-Rowe model the sign of ns-l - Ti, since it is this which determines the relative size of long- and short-run elasticities.
In the United States, 46 out of the 65 goods analysed by the model had positive values for p and thus had greater long-run than short-run elasticities. These 46 accounted for over 60% of total consumers' expenditure in 1964, whereas less than 30% of total expenditure was on goods with long-run elasticities less than short-run. For Sweden the proportions are quite different; in 1958 Taylor found that some 57% of expenditure was subject to net inventory effects with only 43% subject to habit formation. The comparable figures for Canada cannot be deduced from the published results but in terms of numbers of commodities it seems to occupy an inter- mediate position. Houthakker and Taylor suggest tentatively that habit formation is likely to become more prevalent as income increases; this makes some sense since a consumer must be reasonably well-off before he can allow himself to be relatively insensitive to economic forces. This interpretation would also be consistent with the very low estimated depre- ciation rate for the United States shown in the above table; the depreciation rates for Sweden reflect a higher proportion of genuine physical depreciation whereas " stocks " in the United States represent habits more than physical
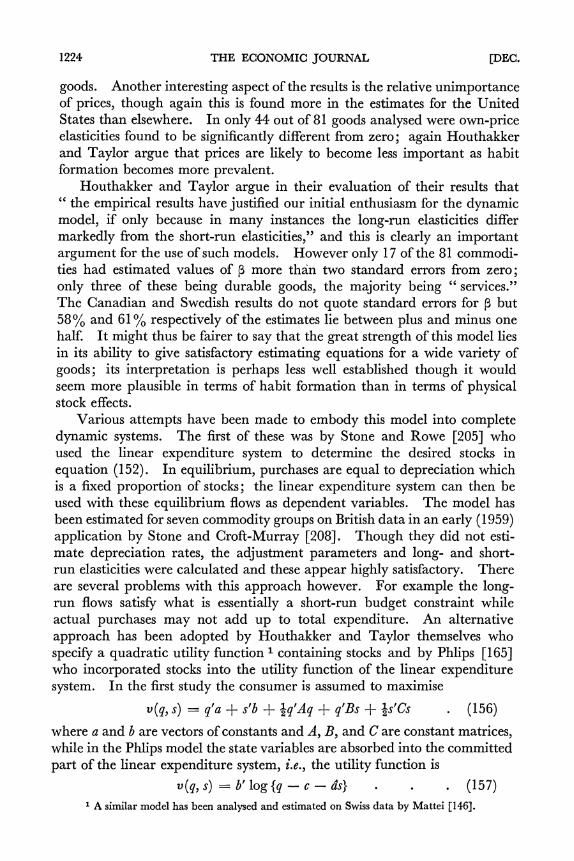
1224 THE ECONOMIC JOURNAL [DEC.
goods. Another interesting aspect of the results is the relative unimportance of prices, though again this is found more in the estimates for the United States than elsewhere. In only 44 out of 81 goods analysed were own-price elasticities found to be significantly different from zero; again Houthakker and Taylor argue that prices are likely to become less important as habit formation becomes more prevalent.
Houthakker and Taylor argue in their evaluation of their results that " the empirical results have justified our initial enthusiasm for the dynamic model, if only because in many instances the long-run elasticities differ markedly from the short-run elasticities," and this is clearly an important argument for the use of such models. However only 17 of the 81 commodi- ties had estimated values of P more than two standard errors from zero; only three of these being durable goods, the majority being " services." The Canadian and Swedish results do not quote standard errors for P but 58% and 61 % respectively of the estimates lie between plus and minus one half. I t might thus be fairer to say that the great strength of this model lies in its ability to give satisfactory estimating equations for a wide variety of goods; its interpretation is perhaps less well established though it would seem more plausible in terms of habit formation than in terms of physical stock effects.
Various attempts have been made to embody this model into complete dynamic systems. The first of these was by Stone and Rowe [205] who used the linear expenditure system to determine the desired stocks in equation (152). In equilibrium, purchases are equal to depreciation which is a fixed proportion of stocks; the linear expenditure system can then be used with these equilibrium flows as dependent variables. The model has been estimated for seven commodity groups on British data in an early (1959) application by Stone and Croft-Murray 12081. Though they did not esti- mate depreciation rates, the adjustment parameters and long- and short- run elasticities were calculated and these appear highly satisfactory. There are several problems with this approach however. For example the long- run flows satisfy what is essentially a short-run budget constraint while actual purchases may not add up to total expenditure. An alternative approach has been adopted by Houthakker and Taylor themselves who specify a quadratic utility function 1 containing stocks and by Phlips [165] who incorporated stocks into the utility function of the linear expenditure system. In the first study the consumer is assumed to maximise
v(q, S) = q'a + s'b + Qq'Aq + q'Bs $ Qs'Cs . (156)
where a and b are vectors of constants and A, Byand Care constant matrices, while in the Phlips model the state variables are absorbed into the committed part of the linear expenditure system, i.e., the utility function is
v (q, s) = b' log (q - c - ds} . . (157) A similar model has been analysed and estimated on Swiss data by Mattei [146].

19721 MODELS OF CONSUMER BEHAVIOUR 1225
where a, b and c are vectors of constants. Houthakker and Taylor make A and B diagonal; thus both models are additive. In each case the depreciation assumption is as before, i.e.,
and maximisation is carried out according to the budget constraint
This distinguishes these models from the Cramer model where the budget constraint includes assets and liabilities; in theory the Cramer approach is preferable since (159) is not the valid budget constraint if any of the com- ponents of s may be sold. However, since both Houthakker and Taylor and Phlips are interested in durable goods only and use the " state "
rather than the " stocks " interpretation, the error is probably acceptable. Both models have been estimated on U.S. data for eleven commodities both pre- and post-war. As was the case with static models there is much greater similarity between the income elasticities, both short- and long-run, than between the price elasticities even though both models are additive. The agreement between the income elasticities is nevertheless interesting in that it indicates that there is considerable income information in the data beyond that revealed by static models and this would tend to support Houthakker and Taylor's case for making dynamic equations an integral part of demand analysis. Yet these dynamic complete systems are very much in their infancy; the estimation problems are very difficult and Phlips' work suggests that estimates of some of the structural parameters depend crucially on the stochastic specification. Furthermore, as with most of the work described in this section, these models are not as yet satisfactorily based on the theory of consumer behaviour. Cramer's attempt to take such a model as a starting point is incomplete and the other systems mentioned graft dynamic considerations into the static utility model rather than rooting them in an intertemporal maximisation process.
In constructing models for individual durable goods, and for perishable goods which are used in association with durables, many special features have been introduced; but these models are in the main based on the same two principles, those of inventory effects and of non-instantaneous adjust- ment, as are the more comprehensive attempts described above. For example Cramer [45] linked the demand for petrol to the ownership of motor cars, the latter being determined by an ownership model suggested by Farrell [64] and by Aitchison and Brown [2]. For each individual there is supposed to exist a tolerance level of income which is just sufficiently large to induce him to buy the durable good. Until his actual income exceeds this tolerance level he does not buy the good; and the tolerance level is randomly distributed in the population. For a group of individuals with a given income the expected proportion of owners can be calculated from
No. 328.-VOL. 82. 4 L

1226 THE ECONOMIC JOURNAL [DEC.
the distribution function of the random tolerance income; and this propor- tion can be integrated over the statistical distribution of actual incomes in the population to provide an overall estimate of ownership. The technique is closely related to the technique of biological assay and in practice both the economic and biological applications rely heavily on the assumption that the tolerance distribution is lognormal, so that the estimation procedures of probit analysis can be used. To this model Cramer added an Engel curve for petrol which applied to car owners only. In this Engel curve the demand for petrol contained a minimum element, inversely related to the tolerance income, and an element which varied proportionately with the excess of actual over tolerance income. Cramer fitted the ownership part of his model to cross-section data and the Engel curve to time series, both for the United Kingdom.
Often analysts have been interested in the way in which the demand for a new durable is diffused through the population, either as its real price falls or simply by the spread of knowledge of the new durable much like that of an epidemic. Typically the process first accelerates and then decelerates as a saturation level of ownership is approached; purchases, which originally consist entirely of net investment, eventually stabilise at the level where they just offset depreciation on the saturation level of the stock owned. Such a process has often been represented by a logistic function with time as the argument, in which case the growth curve is symmetric about the date at which the 50% level of ownership is reached. But Bain showed that for the growth of television ownership the process is asymmetric; for example, the time taken for ownership to increase from, say, 59% to 61 %, is greater than that from 39% to 41 %. In his model he therefore substituted the lognormal for the logistic function, as the former has the necessary character- istic of skewness. Bain introduced economic variables to determine, at any one point of time, and in any given television reception area, the saturation level to which ownership was growing. Similar studies with a great variety of diffusion patterns have more recently been carried out by Boniis [23] on German data.
An entirely novel approach to the problem of ownership was used by Pyatt [I 791. Within a defined set of durable goods the individual consumer is characterised by two probabilities: first the probability ad that durable i is the next durable on his list of priorities, and second the probability bt
that he makes a purchase in the time interval (t, t + dt). At any moment the individual is in a state of ownership c, of the subset s of the defined total set of durables, and this state in particular affects the set of probabilities at. From this starting point Pyatt was able to construct measurable models of ownership and investment both for cross-section and time series analysis. An important element in these models was the concept of the velocity with which a household moves from one ownership situation to another.
"ee Finney [66].


1228 THE ECONOMIC JOURNAL [DEC.
the solution of problems in aero-space technology. In economic applications and particularly in demand analysis, the essential problem is to specify the time profile with as few parameters as possible. This accounts for the success of such techniques as those based on exponentially distributed lags. We shall not discuss them further in this survey: they are widely known and the problems involved are mainly those of statistical estimation; further developments await the application to demand analysis of an economic theory of the lag itself. Though some work has been done in inventory theory we are not aware of any applications of optimal lag techniques in this field.
ALAN BROWN Institute of Economics and Statistics,
Oxford. ANGUS DEATON
Department of Applied Economics, Cambridge.
Date of rece$t of jnal tyfiescript : July 1972
BIBLIOGRAPHY
This list is not intended to be exhaustive. I t contains only material referred to directly in the text or used indirectly in the compilation of the survey.
1. Aitchison, J., and J. A. C. Brown, " A Synthesis of Engel Curve Theory," Review of Economic Studies, Vol. 22, 1954-55.
2. Aitchison, J., and J. A. C. Brown, The Lognormal Distribution, Cambridge University Press, 1957.
3. Allen, R. G. D., and A. Bowley, Family Expenditure, P. S. King and Son, London, 1935. 4. Allen, R. G. D., and J. R. Hicks, " A Reconsideration of the Theory of Value," Economica, Vol.
1, 1934. 5. Allen, R. G. D., Mathematical Analysis for Economists, Macmillan, London, 1947. 6. Arrow, K.J., " Additive Logarithmic Demand Functions and the Slutsky Conditions," Review
of Economic Studies, Vol. 28, 1960-61. 7. Bain, A. D., The Growth of Television Ownership in the United Kingdom, Cambridge University
Press, 1964. 8. Barteq, A. P., " Consumer Demand Functions under Conditions of Almost Additive
Preferences," Econornetrica, Vol. 32, 1964. 9. Barten, A. P., " Family Composition, Prices and Expenditure Patterns," in Econometric Analysis
for National Economic Planning, P. E. Hart, G. Mills and J. K. Whitaker (eds.), Butterworth, 1964.
10. Barten, A. P., and S. J. Turnovsky, " Some Aspects of the Aggregation Problem for Composite Demand Equations," International Economic Review, Vol. 7, 1966.
11. Barten, A. P., "Evidence on the Slutsky Conditions for Demand Equations," Review of Economics and Statistics, Vol. 49, 1967.
12. Barten, A. P., "Estimating Demand Equations," Econornetrica, Vol. 36, 1968. 13. Barten, A. P., T. Kloek, and F. B. Lempers, "A Note on a Class of Utility and Production
Functions Yielding Everywhere Differentiable Demand Functions," Review of Economic Studies, Vol. 36, 1969.
14. Barten, A. P., "Maximum Likelihood Estimation of a Complete System of Demand Equations," European Economic Review, Vol. 1, 1969.
15. Barten, A. P., " RCflexions sur la construction d'un systtme empirique des fonctions de demande," Cahiers du S4minaire d'l?conome'trie, No. 12, 1970.
16. Bartlett, M. S., " The Use of Transformations," Biometries, Vol. 3, 1947.

19721 MODELS OF CONSUMER BEHAVIOUR 1229
17. Baschet, J., and P. Debreu, " Systtmes de lois de demande: une comparaison internationale," AnnalesdelYI.N.S.E.E. (Institutnationaldelastatistiqueetdesetudes tconomiques),No. 6,1971.
18. Baxter, R. D., The Budget and the Income Tax , Macmillan, London, 1860. 19. Benini, R., " Sull'uso delle formole empiriche nell'economia applicata," Giornale degli econo-
misti, 2nd series, Vol. 35, 1907. 20. Bergson (Burk), A., "Real Income, Expenditure Proportionality, and Frisch's 'New Methods
of Measuring Marginal Utility,' " Review of Economic Studies, Vol. 4, 1936. 2 1. Bernouilli, D., " Specimen theoriae novae de mensura sortis," Commentorii academiae Scientiarum
imperialis Petropolitanae, 1738. (English translation by L. Sommer, "Exposition of a New Theory on the Measurement of Risk," Econometrica, Vol. 22, 1954.)
22. Betancourt, R. R., "The Estimation of Price Elasticities from Cross Section Data under Additive Preferences," International Economic Review, Vol. 12, 1971.
23. Boniis, H., Die Awbreitung des Fernsehens, Anton Hain, Meisenham am Glan, 1968. 24. Boulding, K. E., A Reconstruction of Economics, John Wiley, New York, 1950. 25. Brown, J. A. C., "The Consumption of Food in Relation to Household Composition and
Income," Econometrica, Vol. 22, 1954. 26. Brown, J. A. C., " Economics, Nutrition, and Family Budgets," Proceedings of the Nutrition
Society, Vol. 14, 1955. 27. Brown,J. A. C., " On the Use of Covariance Technique in Demand Analysis," FAOIECE
Study Group on the Demand for Agricultural Products, 1958 (mimeographed). 28. Brown, J. A. C., " Seasonality and Elasticity of Demand for Food in Great Britain since
Derationing," Journal of Agricultural Economics, Vol. 13, 1958. 29. Brown, M. and D. M. Heien, "The S-branch Utility Tree: a Generalization of the Linear
Expenditure System," State University of New York at Buffalo, Economics Department Discussion Paper, No. 18, 1968 (mimeographed).
30. Brown, T. M., "Habit Persistence and Lags in Consumer Behaviour," Econometrica, Vol. 32, 1952.
31. Byron, R. P., "Methods for Estimating Demand Equations using Prior Information: a Series of Experiments with Australian Data," Australian Economic Papers, Vol. 7, 1968.
32. Byron, R. P., " A Simple Method for Estimating Demand Systems under Separable Utility Assumptions," Review of Economic Studies, Vol. 37, 1970.
33. Byron, R. P., "The Restricted Aitken Estimation of Sets of Demand Relations," Econometrica, Vol. 38, 1970.
34. Cambridge, Department of Applied Economics, A Programme for Growth, Vols 1-1 1, Chapman and Hall, London, 1962-71.
35. Champernowne, D. G., "The General Form of the Adding-up Criterion," Journal of the Royal Statistical Society, Series A (General), Vol. 120, 1957.
36. Champernowne, D. G., Uncertainty and Estimation in Economics, Vol. 2, Oliver and Boyd, Edinburgh, 1969.
37. Chipman, J. S., L. Hurwicz, M. K. Richter, and H. F. Sonnenschein (eds.), Preferences, Utility and Demand, Harcourt Brace Jovanovich, 197 1.
38. Cole, D. E., "The Income, Expenditure and Saving of Old People Households in Cambridge- shire," Proceedings of the Fourth Congress International Association of Gerontology, 1957.
39. Cournot, A. A,, Rbcherches sur les Principes Mathe'matique de la The'orie des Richesses, L. Hachette, Paris, 1838. (English translation by N. T. Bacon, Researches into the Mathematical Principles of the Theory of Wealth, Macmillan, New York, 1897.)
40. Court, L. M., "Entrepreneurial and Consumer Demand Theories for Commodity Spectra," Econometrica, Vol. 9, 1941.
41. Court, R. H., "Utility Maximization and the Demand for New Zealand Meats," Econornetrica, Vol. 35, 1967.
42. Cramer, J. S., " A Dynamic Approach to the Theory of Consumer Demand," Review of Economic Studies, Vol. 24, 1956-57.
43. Cramer,J. S., "Ownership Elasticities of Durable Consumer Goods," Review of Economic Studies, Vol. 25, 1957-58.
44. Cramer, J. S., "The Depreciation and Mortality of Motor Cars," Journal of the Royal Statistical Society, Series A (General), Vol. 121, 1958.
45. Cramer, J. S., " Private Motoring and the Demand for Petrol," Journal of the Royal Statistical Society, Series A (General), Vol. 122, 1959.

1230 THE ECONOMIC JOURNAL [DEC.
46. Cramer, J. S., A Statistical Model of the Ownership of Major Consumer Durables with an Application to Some Findings of the 1953 Oxford Savings Survey, Cambridge University Press, 1962.
47. Dahlman, C. J., and A. Klevmarken, Den Privata Konsumtionen 1931-1975, Uppsala, 1971. 48. Davenant, C., A n Essay upon the Probable Methods o f Making a People Gainers in the Balance of
Trade, London, 1699. 49. Deaton, A. S., and K. J. Wigley, "Econometric Models for the Personal Sector," Bulletin
o f the Oxford Institute of Statistics, Vol. 33, 1971. 50. Deaton, A. S., "The Estimation and Testing of Systems of Demand Equations," European
Economic Review, forthcoming. 51. Deaton, A. S., "The Analysis of Consumer Demand in the United Kingdom, 1900-1970,"
Cambridge University Department of Applied Economics working paper, 1972 (mimeo- graphed).
52. Dhrymes, P. J., " On a Class of Utility and Production Functions yielding Everywhere Differentiable Demand Functions," Review of Economic Studies, Vol. 34, 1967.
53. Dieterici, K. F. W., Statistische ubersicht der wichtigsten Gegestande des Verkehrs und Verbrauchs im preussischen Staate und im deutschen Zollverbande, Berlin, 1838-57.
54. Divisia, F., L'indice monttaire et la thtorie de la monnaie," Revue d'l?conomie Politique, Vol. 39, 1925.
55. Downie, J., "A Note on the Demand for Food," ECONOMIC Vo1. 62, 1952. JOURNAL,
56. Ducpetiaux, E., Budgets Economiques des Classe Ouvridres en Belgique, Brussels, 1855. 57. Durbin, J., " A Note on Regression when there is Extraneous Information about one of
the Coefficients," Journal of the American Statistical Association, Vol. 48, 1953. 58. Edgeworth, F. Y., Mathematical Psychics, Kegan Paul, London, 1881. 59. Engel, E., " Die productions- und consumptionsverhaltnisse des Konigreichs Sachsen," in
Zeitschrift des Statischen Bureaus des Kiiniglich Sdchsischen Ministerium des Inneren, Nos. 8 and 9, 1857 (reprinted in Bulletin de I'Institut International de Statistique, Vol. 9, 1895).
60. Ezekiel, M., Methods of Correlation Analysis, John Wiley, New York, 1930. 61. Ezekiel, M., and K. A. Fox, Methods o f Correlation and Regression Analysis, John Wiley, New York,
1959. 62. Farrell, M. J., " Irreversible Demand Functions," Econometrica, Vol. 20, 1952. 63. Farrell, M. J., "Some Aggregation Problems in Demand Analysis," Review of Economic Studies,
Vol. 2 1, 1953-54. 64. Farrell, M. J., " The Demand for Motor Cars in the United States," Journal o f the Royal
Statistical Society, Series A (General), Vol. 117, 1954. 65. Feige, E. L., " Expectations and Adjustments in the Monetary Sector," American Economic
Review (papers and proceedings), 1967. 66. Finney, D. J., Probit Analysis. A Statistical Treatment of the Sigmoid Response Curve, Cambridge
University Press, 1947 (2nd ed. 1952). 67. Fisher, I., "Mathematical Investigations in the Theory of Value and Prices," Tramactiom of
Connecticut Academy of Arts and Sciences, Vol. 9, 1892. (Augustus M. Kelley, New York, 1965.) 68. Fisk, P. R., " Maximum Likelihood Estimation of Tornqvist Demand Equations," Review
of Economic Studies, Vol. 26, 1958-59. 69. Fletcher, R., and M. J.D. Powell, "A Rapidly Convergent Descent Method of Minimization,"
Computer Journal, Vol. 6, 1963. 70. Fletcher, R., and G. M. Reeves, "Functional Minimization by Conjugate Gradients," Computer
Journal, Vol. 7, 1964. 71. Forsyth, F. G., "The Relationship between Family Size and Family Expenditure," Journal o f
the Royal Statistical Society, Series A (General), Vol. 123, 1960. 72. Fourgtaud, C., and A. Nataf, "Consommation en prix et revenu rtels et theorie des choix,"
Econometrica, Vol. 27, 1959. 73. Fox, K. A., "A Submodel of the Agricultural Sector," in The Brookings Quarterly Econometric
Model of the United States, J. S. Duesenberry, G. Fromm, L. R. Klein, E. Kuh (eds.), North- Holland, 1965.
74. Friedman, M., "Professor Pigou's Method for Measuring Elasticities of Demand from Budgetary Data," Quarterly Journal of Economics, Vol. 50, 1935-36.
75. Frisch, R., New Methods o f Measuring Marginal Utility, J . C. B. Mohr, Tiibingen, 1932. 76. Frisch, R., ConJluence Analysis by Means of Complete Regression Systems, Publication No. 5 of the
Universitetets @konomiske Institutt, Oslo, 1934.

1231 19721 MODELS OF CONSUMER BEHAVIOUR
77. Frisch, R., "Annual Survey of Economic Theory: the Problem of Index Numbers," Econornetrica, Vol. 4, 1936.
78. Frisch, R., " Linear Expenditure Functions, an Expository Article," Econometrica, Vol. 22, 1954. 79. Frisch, R., "A Complete Scheme for Computing all Direct and Cross Demand Elasticities
in a Model with Many Sectors," Econornetrica, Vol. 27, 1959. 80. Geary, R. C., "A Note on ' A Constant Utility Index of the Cost of Living,' " Review of
Economic Studies, Vol. 17, 1950-5 1. 81. Goldberger, A. S., "Functional Form and Utility: a Review of Consumer Demand
Theory," Social' Systems Research Institute, University of Wisconsin: Systems For- mulation, Methodology, and Policy Workshop Paper No. 6703, 1967 (mimeographed).
82. Goldberger, A. S., "Directly Additive Utility and Constant Marginal Budget Shares," Review of Economic Studies, Vol. 36, 1969.
83. Goldberger, A. S., and T. Gamaletsos, "A Cross-country Comparison of Consumer Expendi- ture Patterns," European Economic Review, Vol. 1, 1970.
84. Goldman, S. M. and H. Uzawa, "A Note on Separability in Demand Analysis," Econometrica, Vol. 32, 1964.
85. Goreaux, L. M., " Projections de la demande des produits agricoles en Europe Occidentale en 1970," in Europe's Future Consumption, (ed. J. Sandee), North Holland, 1964.
86. Gorman, W. M., " Community Preference Fields," Econometrica, Vol. 21, 1953. 87. Gorman, W. M., " Separable Utility and Aggregation," Econometrica, Vol. 27, 1959. 88. Gorman, W. M., "The Empirical Implications of a Utility Tree: a Comment," Econornetrica,
Vol. 27, 1959. 89. Gorman, W. M., " On a Class of Preference Fields," Metroeconomica, Vol. 13, 1961. 90. Gorman, W. M., "Additive Logarithmic Preferences: a Further Note," Review of Economic
Studies, Vol. 30, 1963. 91. Gossen, H. H., Entwickelung der Gesetze des menschlichen Verkers, und der darausjliessenden Regeln fur
menschliches Handeln, Druck und Verlag von Friedrich Vieweg und Sohn, Braunschwieg, 1854.
92. Green, H. A. J., "Direct Additivity and Consumers' Behaviour," OxfordEconomic Papers, Vol. 13, 1961.
93. Green, H. A. J., Aggregation in Economic Analysis, Princeton, 1964. 94. Haavelmo, T., "The Statistical Implications of a System of Simultaneous Equations," Econo-
metric~, Vol. 11, 1943. 95. Henderson, A. M., "The Cost of a Family," Review of Economic Studies, Vol. 17, 1949-50. 96. Henderson, A. M., "The Cost of Children," Parts 1-111, PopulationStudies, Vols, 3-4, 1949-50. 97. Hicks,J. R., Value and Capital, Oxford University Press, 1936. 98. Hicks,J. R., A Revision of Demand Theory, Oxford University Press, 1956. 99. Hirsch, W. Z., "A Survey of Price Elasticities," Review of Economic Studies, Vol. 19, 1951-52.
100. Hoa, T. V., " Inter-regional Elasticities and Aggregation Bias: a Study of Consumer Demand in Australia," Australian Economic Papers, Vol. 7, 1968.
101. Hoa, T. V., "Additive preference and Cost-of-living indexes: an Empirical Study of Australian Consumers' Welfare," Economic Record, Vol. 45, 1969.
102. Hotelling, H., " Edgeworth's Taxation Paradox and the Nature of Demand and Supply Functions," Journal of Political Economy, Vol. 40, 1932.
103. Houthakker, H. S., "Revealed Preference and the Utility Function," Economica, Vol. 17, 1950. 104. Houthakker, H. S., " The Econometrics of Family Budgets," Journal of the Royal Statistical
Society, Series A (General), Vol. 115, 1952. 105. Houthakker, H. S., "Compensated Changes in Quantities and Qualities Consumed," Review of
Economic Studies, Vol. 19, 1951-52. 106. Houthakker, H. S., " La forme des courbes d'Enge1," Cahiers du Siminaire d'zconometrie, No. 2,
1954. 107. Houthakker, H. S., " An International Comparison of Household Expenditure Patterns
Commemorating the Centenary of Engel's Law," Econornetrica, Vol. 25, 1957. 108. Houthakker, H. S., "The Influence of Prices and Incomes on Household Expenditures,"
Bulletin of the International Institute of Statistics, Vol. 37, 1960. 109. Houthakker, H. S., "Additive Preferences," Econometrica, Vol. 28, 1960. 110. Houthakker, H. S., "The Present State of Consumption Theory," Econometrica, Vol. 29, 1961. 11 1. Houthakker, H. S., "New Evidence on Demand Elasticities," Econometrica, Vol. 33, 1965.

1232 THE ECONOMIC JOURNAL [DEC.
112. Houthakker, H. S., " A Note on Self-dual Preferences," Econometrica, Vol. 33, 1965. 113. Houthakker, H. S., and L. D. Taylor, Coruumer Demand in the United States 1929-70, Analysis
and Projections, Harvard University Press, 1966 (2nd ed. 1970). 114. Ironmonger, D., New Commodities and Consumer Behaviour, Cambridge University Press, 1972. 115. Islam, N., Studies in Consumer Demand, Dacca University, Bureau of Economic Research, Vol. 1,
1965, Vol. 2, 1966. 116. Jevons, W. S., The Theory o f Polztical Economy, Macmillan, London, 1871. 117. Johansen, L., " Explorations in Long-term Projections for the Norwegian Economy," Economics
of Planning, Vol. 8, 1968. 118. Johansen, L., " On the Relationships Between Some Systems of Demand Functions,"
Liiketaloudellinen Aikakauskirja, No. 1, 1969. 119. King, G., " Natural and Political Observations and Conclusions upon the State and Condition
of England," (1696) in Two Tracts by Gregory King (ed. G. E. Barnett), Johns Hopkins Press, Baltimore, 1936.
120. Klein, L. R., and H. Rubin, " A Constant Utility-index of the Cost of Living," Review of Economic Studzes, Vol. 15, 1947-48.
121. Klein, L. R., and J. B. Lansing, " Decisions to Purchase Consumer Durable Goods," Journa of Marketing, Vol. 20, 1955.
122. Kloek, T., and H. Theil, " International Comparisons of Prices and Quantities Consumed," Econometrica, Vol. 33, 1965.
123. Knox, F., " Some International Comparisons of Consumers' Durable Goods," Bulletin o f the Oxford Institute o f Statzstics, Vol. 21, 1959.
124. Konus, A. A,, " On the Theory of Means," Acta Universitatis Asiae Mediae (Tashkerrt), Series Va, hfathematica, Fasc. 24, 1939.
125. Konus, A. A., " Consumer Price Indexes and Demand Functions," Rdvuede I'Institut Intenzational de Statistique, Vol. 26, 1958.
126. Koo, A. Y. C., " An Empirical Test of Revealed Preference Theory," Econometrica, Vol. 31, 1963.
127. Lau, L. J., " Duality and the Structurc of Utility Functions," Journal of Economic Theory,Vol. 1, 1969.
128. Lehfeldt, R. A,, " JOURNAL,The Elasticity of the Demand for Wheat," ECONOMIC Vol. 24, 1914. 129. Lenoir, M., gtudes sur la Formation et le Mozlvement des Prix, Paris, 1913. 130. Leoni, R., " An Analysis of Expenditures on Private Consumption," Revista di Politica Economica
(selected papers), 1967. 131. Leontief, W., " Ein Versuch zur Statistischen analyse von Angebot und Nachfrage," Welt-
wirtschaftliches Archiv, Vol. 30, 1929. 132. Leontief, W., " Composite Commodities and the Problem of Index Numbers," Econometrica,
Vol. 4, 1936. 133. Leontief, W., " Introduction to a Theory of the Internal Structure of Functional Relationships,"
Econometrica, Vol. 15, 1947. 134. Le Play, P. G. F., Les Ouvriers Europdens, Paris, 1855. 135. Leser, C. E. V., "Family Budget Data and Price Elasticities of Demand," Review of Economic
Studies, Vol. 9, 1941-42. 136. Leser, C. E. V., " The Pattern of Australian Demand," Economic Record, Vol. 34, 1958. 137. Leser, C. E. V., " Demand Functions for Nine Commodity Groups in Australia," Australian
Journal of Statistics, Vol. 2, 1960. 138. Leser, C. E. V., " Commodity Group Expenditure Functions for the United Kingdom, 1948-
1957," Econometrica, Vol. 29, 1961. 139. Leser, C. E. V., " Forms of Engel Functions," Econornetrica, Vol. 31, 1963. 140. Leser, C. E. V., Econometric Techniques and Problems, Griffin, 1966. 141. Lloyd, G. H., An Essay on the Theory o f Money, London, 177 1. 142. Lluch, C., " Consumer Demand Functions, Spain, 1958-64," Eurojean Economic Rpuiew, V01.2,
1971. 143. MacCrimmon, K. R. and M. Toda, "The ExperimentalDeterminationof Indifference Curves,"
Review of Economic Studies, Vol. 36, 1969. 144. Marquardt, D. W., "An Algorithm for Least-squares Estimation of Non-linear Parameters,"
Journal of the Society o f Industrial and Applied Mathematics, Vol. 1 I , 1963. 145. Marshall, A., Principles of Economics, Macmillan, London, 1890.
19721 MODELS OF C O N S U M E R B E H A V I O U R 1233
146. Mattei, A., "A Complete System o f Dynamic Demand Functions," European Economic Review, V o l . 2, 1971.
147. Modigliani, F., and R. Brumberg, "Util i ty Analysis and the Consumption Function: a n Interpretation o f Cross Section Data," i n Post Keynesian Economics, K . K . Kurihara (ed.), Allen and Unwin , 1955.
148. Modigliani, F., and R . Brumberg, "Utility Analysis and the Aggregate ConsumptionFunction: a n Attempt at Integration," 1954 (mimeographed).
149. Moore, H. L., Synthetic Economics, Macmillan, New York , 1929. 150. Muth , R. F., "Household Production and Consumer Demand Functions," Econometrica, V o l .
34, 1966. 151. Nasse, P., "Analyse des effets de substitution dans u n systhme complet de fonctions de
demande," Annales de l'insbb (Institut national de la statistique et des Ctudes tconomiques), No. 5, 1970.
152. Nerlove, M., Distributed Lags and Demand Analysis, Agricultural Handbook No. 141, U.S. Department o f Agriculture, 1958.
153. Nerlove, M., " T h e Market Demand for Durable Goods: a Comment," Econometrica, V o l . 28, 1960.
154. Nicholson, J . L., "Variations i n Working Class Family Expenditure," Journal of the Royal Statistical Society, Series A (General), V o l . 112, 1949.
155. Nicholson, J . L., "T h e General Form o f the Adding-up Criterion," Journal of the Royal Statistical Society, Series A (General), V o l . 120, 1957.
156. Paelinck, J., Fonctions de Consommation pour la Belgique 1948-59, Facultts Universitaires N-D de la Paix, Namur, 1964.
157. Pareto, V., Manuale di Economia Politics, con una Introduzione alla Scienza Soziale, Societi Editrice Libraria, Milan, 1906. Second edition: Manuel d'&conomiepolitique, V .Giard et E. Brihre, Paris, 1909. (English translation b y A . S. Schwier, Manual of Political Economy, Macmillan, 1972.)
158. Parks, R. W., "Efficient Estimation o f a System o f Regression Equations when Disturbances are both Serially and Contemporaneously Correlated," Journal of the American Statistical Association, V o l . 62, 1967.
159. Parks, R. W., " Systems o f Demand Equations: a n Empirical Comparison o f Alternative Functional Forms," Econometrica, V o l . 37, 1969.
160. Parks, R. W., " Maximum Likelihood Estimation o f the Linear Expenditure System," Journal of the American Statistical Association, V o l . 66, 1971.
161. Pearce, I. F., "A n Exact Method o f Consumer Demand Analysis," Econometrica, V o l . 29, 1961. 162. Pearce, I. F., " A Method o f Consumer Demand Analysis Illustrated," Economica, V o l . 28,
1961. 163. Pearce, I. F., A Contribution to Demand Analysis, Oxford University Press, 1964. 164. Phlips, L., " Substitution, /Complementarity, and the Residual Variation around Dynamic
Demand Equations," American Economic Review, Vol . 6 1 , 197 1. 165. Phlips, L., "A Dynamic Version o f the Linear Expenditure Model," Review of Economics and
Statistics, forthcoming. 166. Pigou, A . C., " A Method o f Determining the Numerical Value o f Elasticities o f Demand,"
ECONOMICJOURNAL, V o l . 20, 1910. 167. Pollack, R. A, , and T .J . Wales,"Estimation o f the Linear Expenditure System," Econometrica,
V o l . 37, 1969. 168. Pollack, R. A,? " H a b i t Formation and Dynamic Demand Functions," Journal of Political
Economy, Vol . 78, 1970. 169. Pollack, R. A., " Conditional Demand Functions and the Implications o f Direct Separable
utility," Southern Economic Journal, V o l . 37, 1971. 170. Pollack, R. A., " Additive Utility Functions and Linear Engel Curves," Review of Economic
Studies, V o l . 38, 1971. 171. Powell, A . A., "Post-war Consumption i n Canada: a First Look at the Aggregates," Canadian
Journal of Economics and Political Science, V o l . 31, 1965. 172. Powell, A . A, , " A Complete System o f Consumer Demand for the Australian Economy fitted
b y a Model o f Additive Preferences," Econometrica, V o l . 34, 1966. 173. Powell, A. A., T . V .Hoa, and R. H. Wilson, "A Multi-sectoral Analysis o f Consumer Demand
i n the Post-war Period," Southern Economic Journal, V o l . 35, 1968.

1234 THE ECONOMIC JOURNAL [DEC.
174. Powell, A. A,, "Aitken Estimators as a Tool for the Allocation of Predetermined Aggregates," Journal o f the American Statistical Association, Vol. 64, 1969.
175. Prais, S. J., "The Estimation of Equivalent Adult Scales from Family Budgets," ECONOMIC JOURNAL,Vo1. 63, 1953.
176. Prais, S. J., "Non-linear Estimates of the Engel Curves," Review of Economic Studies, Vol. 20, 1953.
177. Prais, S. J., andJ. Aitchison, " The Grouping of Observations in Regression Analysis," Review of the International Statistical Institute, Vol. 22, 1954.
178. Prais, S. J., and H. S. Houthakker, The Analysis o f Family Budgets, Cambridge University Press, 1955 (2nd ed. 1971).
179. Pyatt, F. G., Priority Patterns and the Demand for Household Durable Goods, Cambridge University Press, 1964.
180. Quetelet, A., Physique Sociale, Paris, 1869. 181. Rajaoja, V., A Study in the Theory o f Demand Functions and Price Indexes, Societas Scientarium
Fennica: Commentationes Physico-Mathematicae XXI, Helsinki, 1958. 182. Rothenburg, T. J., and C. T. Leenders, " Efficient estimation of simultaneous equation
systems," Econometrica, Vol. 32, 1964. 183. Roy, R., De lYUtilitL, Contribution d la Thiorie des Choix, Hermann, Paris, 1942. 184. Samuelson, P. A,, " A Note on the Pure Theory of Consumer Behaviour," Economica, Vol. 5,
1938. 185. Samuelson, P. A., " Constancy of the Marginal Utility of Income," in Studies in Mathematical
Economics and Econometrics, 0. Lange, F. McIntyre and T. 0. Yntema (eds.), Chicago University Press, 1942.
186. Samuelson, P. A., Foundations o f Economic Analysis, Harvard University press, 1947. 187. Samuelson, P. A., "Some Implications of Linearity," Review of Economic Studies, Vol. 15, 1947-
48. 188. Samuelson, P. A., " The Problem of Integrability in Utility Theory," Economica, Vol. 17, 1950. 189. Samuelson, P. A., "Using full Duality to Show that Simultaneously Additive Direct and
Indirect Utilities implies Unitary Price Elasticity of Demand," Econometrica, Vol. 33, 1965.
190. Schultz, H., Statistical Laws of Demand and Supply with Special Application to Sugar, Chicago University Press, 1928.
191. Schultz, H., The Theory and Measurement of Demand, Chicago University Press, 1938. 192. Schwabe, H., " Das Verhaltniss von Miethe und Einkommen in Berlin," in Berlin und seine
entwickelung fur 1868, Berlin, 1868. 193. Schweitzer, T. T., Personal Consumer Exjenditures in Canada, Economic Council of Canada,
Staff Study No. 26, Part 1, 1969, Part 2, 1970. 194. Slutsky, E., " Sulla teoria del bilancio del consomatore," Giornale degli Econornisti, Vol. 51,
1915. (English translation in Readings in Price Theory, G. J . Stigler and K. E. Boulding (eds.), Chicago University Press, 1952.)
195. Smith, A., A n Inquiry into the Nature and Causes of the Wealth of Nations, W. Strahan and T. Cadell, London, 1776.
196. Snedecor, G. W., Statistical Methods, University of Iowa Press, Ames, Iowa, 1938. 197. Solari, L., ThLorie des Choix et Fonctions de Consommation Semi-agrdgLes-Moddles Statiques, Librairie
Droz, Geneva, 1971. 198. Somermeyer, W. H., G. M. Hilhorot, and J. W. W. A. Wit, " A Method of Estimating Price
and Income Elasticities from Time Series and its Application to Consumers' Expenditures in the Netherlands, 1949-1959," Netherlands Central Bureau of Statistics, Statistical Studies, No. 13, 1962 (mimeographed).
199. Somermeyer, W. H., and A. Langhout, " Shapes of Engel Curves and Demand Curves: Impli- cations of the Expenditure Allocation Model, Applied to Dutch data," Netherlands School of Economics, Econometric Institute, Report 7102, 1971 (mimeographed).
200. Sono, M., "The Effect of Price Changes on the Demand and Supply of Separable Goods," International Economic Review, Vol. 2, 1960.
201. Staehle, H., " A Development of the Economic Theory of Index Numbers," Review of Economic Studies, Vol. 2, 1935.
202. Stigler, G. J., " The Early History of Empirical Studies of Consumer Behaviour," Journa of Political Economy, Vol. 62, 1954.

19721 1235MODELS OF CONSUMER BEHAVIOUR
203. Stone, J. R. N., The Measurement of Consumers' Expenditure and Behaviour in the United Kingdom, 1920-1938, Vol. I, Cambridge University Press, 1953.
204. Stone, J. R. N., "Linear Expenditure Systems and Demand Analysis: an Application to the Pattern of British Demand," ECONOMIC Vol. 64, 1954. JOURNAL,
205. Stone, J. R. N., and D. A. Rowe, "Aggregate Consumption and Investment Functions for the Household Sector Considered in the Light of British Experience," Nationalvkonomisk Tidsskrift, Vol. 94, 1956.
206. Stone, J. R. N., and D. A. Rowe, "The market Demand for Durable Goods," Econometrica, Vol. 25, 1957.
207. Stone, J. R. N., and D. A. Rowe, "Dynamic Demand Functions: some EconometricResults," ECONOMIC Vo1. 68, 1958. JOURNAL,
208. Stone, J. R. N., and G. Croft-Murray, Social Accounting and Economic Models, Bowes and Bowes, London, 1959.
209. Stone,J.R. N., and D. A. Rowe, "The Durability of Consumers' Durable Goods," Econometrica, Vol. 28, 1960.
210. Stone, J. R. N., "A dynamic model of demand," Przeglad Statystyczny, Vol. 7, 1960. 2 11. Stone, J.R. N., "Consumers' Wants and Expenditures: a Survey ofBritish Studies since 1945,"
in L'&valuation et la RBle des Besoins de Biens de Consommation duns les Divers Rigimes Economiques, fiditions de Centre National de la Recherche Scientifique, Paris, 1963.
2 12. Stone, J.R. N., J.A. C. Brown, and D. A. Rowe, "Demand Analysis and Projections for Britain 1900-1970: a Study in Method," in Europe's Future Consumption, J . Sandee (ed.), North Holland, 1964.
213. Stone, J. R. N., "Models for Demand Projections," in Essays in Econometrics and Planning, C. Rao (ed.), Pergamon, Oxford, 1964.
214. Strotz, R. H., " The Empirical Implications of a Utility Tree," Econometrica, Vol. 25, 1957. 215. Strotz, R. H., " The Utility tree-a Correction and Further Appraisal," Econometrica, Vol. 27,
1959. 216. Sydenstricker, E., and W. I. King, " The Measurement of the Relative Economic Status of
Families," Journal of the American Statistical Association, Vol. 17, 192 1. 217. Taylor, L. D., "Personal Consumption Expenditure in Sweden 1931-1958," Review of the
International Statistical Institute, Vol. 36, 1968. 218. Theil, H., and H. Neudecker, " Substitution, Complementarity, and Residual Variation
Around Engel Curves," Review of Economic Studies, Vol. 25, 1957-58. 219. Theil, H., "On the Use of Incomplete Prior Information in Regression Analysis," Journal
of the American Statistical Association, Vol. 58, 1963. 220. Theil, H., and A. S. Goldberger, " On Pure and Mixed Estimation in Economics," International
Economic Review, Vol. 2, 1963. 22 1. Theil, H., " Some Developments of Economic thought in the Netherlands," American Economic
Review, Vol. 54, 1964. 222. Theil, H., Linear Aggregation of Economic Relations, North Holland, Amsterdam, 1965. 223. Theil, H., " The Information Approach to Demand Analysis," Econometrica, Vol. 33, 1965. 224. Theil, H., and R. H. Mnookin, "The Information Value of Demand Equations and Predic-
tions," Journal of Political Economy, Vol. 74, 1966. 225. Theil, H., Economics and Information Theory, North Holland, Amsterdam, 1967. 226. Theil, H., "Value Share Transitions in Consumer Demand Theory," Econometrica, Vol. 38,
1970. 227. Theil, H., and R. B. Brooks, " How does the Marginal Utility of Income Change when Real
Income Changes?," European Economic Review, Vol. 2, 1970. 228. Theil, H., Principles of Econometrics, North Holland, Amsterdam, 1971. 229. Theil, H., " An Economic Theory of the Second Moments of Disturbances of Behavioural
Equations," American Economic Review, Vol. 6 1, 197 1. 230. Theil, H., " Introduction to Demand and Index Number Theory," University of Chicago,
Centre for Mathematical Studies in Business and Economics, Report 7126, 1971 (mimeo- graphed).
231. Tintner, G., "The Theoretical Derivation of Dynamic Demand Curves," Econometrica, Vol. 6, 1938.
232. Tobin, J., and H. S. Houthakker, " The Effects of Rationing on Demand Elasticities," Review of Economic Studies, Vol. 18, 1950-5 1.
1236 THE ECONOMIC JOURNAL [DEC. 1972
233. Tobin, J., "A Survey of the Theory of Rationing," Econornetrica, Vol. 20, 1952. 234. Tornqvist, L., " Review article," Ekonomisk Tidskr f t , Vol. 43, 1941. 235. U.K. Ministry of Agriculture, Fisheries and Food, Domestic Food Consumption and Expenditure,
Annual Reports of the National Food Survey Committee, H.M.S.O., London, annually since 1952.
236. Verri, P., Meditazioni sull'economia politics, Livorno, 1771. 237. Walras, L., Elements d'&conomie Politique Pure, L. Corbas & Cie, Lausanne, 1874. (English
translation by W. Jaffk, Elements of Pure Economics, or The Theory of Social Wealth, George Allen and Unwin, London, 1954.)
238. Weber, H., "De pulsa resorptione auditu et tactu," Annotationes Anatomicae et Physiologicae, Leipzig, Koehler, 1834.
239. Wit, J. W. W. A,, "Income Elasticities in 1935136 and 1951 in the Netherlands: an Applica- tion of a Model for Income Spending," Netherlands Central Bureau of Statistics, Statistical Studies, No. 10, 1960 (mimeographed).
240. Wold, H., and L. Jureen, Demand A~zalysis, Almqvist and Wicksells, Uppsala, 1952. 241. Working, E. J., " What do Statistical Demand Curves Show?," Quarterly Journal of Economics,
Vol. 61, 1927. 242. Worswick, G. D. N., and D. G. Champernowne, " A Note on the Adding-up Criterion,"
Review of Economic Studies, Vol. 22, 1954-55. 243. Yoshihara, K., " Demand Functions: an Application to the Japanese Expenditure Pattern,"
Econometrica, Vol. 37, 1969. 244. Yule, G. U., "Why do we sometimes get Nonsense Correlations between Time-series?,"
Journal of the Royal Statistical Society, Vol. 89, 1926.

You have printed the following article:
Surveys in Applied Economics: Models of Consumer BehaviourAlan Brown; Angus DeatonThe Economic Journal, Vol. 82, No. 328. (Dec., 1972), pp. 1145-1236.Stable URL:
http://links.jstor.org/sici?sici=0013-0133%28197212%2982%3A328%3C1145%3ASIAEMO%3E2.0.CO%3B2-1
This article references the following linked citations. If you are trying to access articles from anoff-campus location, you may be required to first logon via your library web site to access JSTOR. Pleasevisit your library's website or contact a librarian to learn about options for remote access to JSTOR.
[Footnotes]
3 A Development of the Economic Theory of Price Index NumbersH. StaehleThe Review of Economic Studies, Vol. 2, No. 3. (Jun., 1935), pp. 163-188.Stable URL:
http://links.jstor.org/sici?sici=0034-6527%28193506%292%3A3%3C163%3AADOTET%3E2.0.CO%3B2-O
1 A Note on a Class of Utility and Production Functions Yielding Everywhere DifferentiableDemand FunctionsA. P. Barten; T. Kloek; F. B. LempersThe Review of Economic Studies, Vol. 36, No. 1. (Jan., 1969), pp. 109-111.Stable URL:
http://links.jstor.org/sici?sici=0034-6527%28196901%2936%3A1%3C109%3AANOACO%3E2.0.CO%3B2-4
1 Maximum Likelihood Estimation of Tornqvist Demand EquationsP. R. FiskThe Review of Economic Studies, Vol. 26, No. 1. (Oct., 1958), pp. 33-50.Stable URL:
http://links.jstor.org/sici?sici=0034-6527%28195810%2926%3A1%3C33%3AMLEOTD%3E2.0.CO%3B2-S
1 A Survey of the Theory of RationingJames TobinEconometrica, Vol. 20, No. 4. (Oct., 1952), pp. 521-553.Stable URL:
http://links.jstor.org/sici?sici=0012-9682%28195210%2920%3A4%3C521%3AASOTTO%3E2.0.CO%3B2-2
http://www.jstor.org
LINKED CITATIONS- Page 1 of 18 -
NOTE: The reference numbering from the original has been maintained in this citation list.
1 Direct Additivity and Consumers' BehaviourH. A. John GreenOxford Economic Papers, New Series, Vol. 13, No. 2. (Jun., 1961), pp. 132-136.Stable URL:
http://links.jstor.org/sici?sici=0030-7653%28196106%292%3A13%3A2%3C132%3ADAACB%3E2.0.CO%3B2-B
1 Using Full Duality to Show that Simultaneously Additive Direct and Indirect Utilities ImpliesUnitary Price Elasticity of DemandPaul A. SamuelsonEconometrica, Vol. 33, No. 4. (Oct., 1965), pp. 781-796.Stable URL:
http://links.jstor.org/sici?sici=0012-9682%28196510%2933%3A4%3C781%3AUFDTST%3E2.0.CO%3B2-J
1 Additive Logarithmic Preferences A Further NoteW. M. GormanThe Review of Economic Studies, Vol. 30, No. 1. (Feb., 1963), pp. 56-62.Stable URL:
http://links.jstor.org/sici?sici=0034-6527%28196302%2930%3A1%3C56%3AALPAFN%3E2.0.CO%3B2-T
1 Expectations and Adjustments in the Monetary SectorEdgar L. FeigeThe American Economic Review, Vol. 57, No. 2, Papers and Proceedings of the Seventy-ninthAnnual Meeting of the American Economic Association. (May, 1967), pp. 462-473.Stable URL:
http://links.jstor.org/sici?sici=0002-8282%28196705%2957%3A2%3C462%3AEAAITM%3E2.0.CO%3B2-K
2 The Market Demand for Durable Goods: A CommentMarc NerloveEconometrica, Vol. 28, No. 1. (Jan., 1960), pp. 132-142.Stable URL:
http://links.jstor.org/sici?sici=0012-9682%28196001%2928%3A1%3C132%3ATMDFDG%3E2.0.CO%3B2-I
2 The Durability of Consumers' Durable GoodsRichard Stone; D. A. RoweEconometrica, Vol. 28, No. 2. (Apr., 1960), pp. 407-416.Stable URL:
http://links.jstor.org/sici?sici=0012-9682%28196004%2928%3A2%3C407%3ATDOCDG%3E2.0.CO%3B2-Y
http://www.jstor.org
LINKED CITATIONS- Page 2 of 18 -
NOTE: The reference numbering from the original has been maintained in this citation list.

Bibliography
1 A Synthesis of Engel Curve TheoryJ. Aitchison; J. A. C. BrownThe Review of Economic Studies, Vol. 22, No. 1. (1954 - 1955), pp. 35-46.Stable URL:
http://links.jstor.org/sici?sici=0034-6527%281954%2F1955%2922%3A1%3C35%3AASOECT%3E2.0.CO%3B2-N
4 Review: [Untitled]Reviewed Work(s):
Pitfalls in the Statistical Construction of Demand and Supply Curves by Ragnar FrischR. G. D. AllenEconomica, New Series, Vol. 1, No. 3. (Aug., 1934), pp. 342-344.Stable URL:
http://links.jstor.org/sici?sici=0013-0427%28193408%292%3A1%3A3%3C342%3APITSCO%3E2.0.CO%3B2-V
6 Additive Logarithmic Demand Functions and the Slutsky RelationsKenneth J. ArrowThe Review of Economic Studies, Vol. 28, No. 3. (Jun., 1961), pp. 176-181.Stable URL:
http://links.jstor.org/sici?sici=0034-6527%28196106%2928%3A3%3C176%3AALDFAT%3E2.0.CO%3B2-K
10 Some Aspects of the Aggregation Problem for Composite Demand EquationsA. P. Barten; S. J. TurnovskyInternational Economic Review, Vol. 7, No. 3. (Sep., 1966), pp. 231-259.Stable URL:
http://links.jstor.org/sici?sici=0020-6598%28196609%297%3A3%3C231%3ASAOTAP%3E2.0.CO%3B2-K
11 Evidence on the Slutsky Conditions for Demand EquationsA. P. BartenThe Review of Economics and Statistics, Vol. 49, No. 1. (Feb., 1967), pp. 77-84.Stable URL:
http://links.jstor.org/sici?sici=0034-6535%28196702%2949%3A1%3C77%3AEOTSCF%3E2.0.CO%3B2-P
http://www.jstor.org
LINKED CITATIONS- Page 3 of 18 -
NOTE: The reference numbering from the original has been maintained in this citation list.
12 Estimating Demand EquationsA. P. BartenEconometrica, Vol. 36, No. 2. (Apr., 1968), pp. 213-251.Stable URL:
http://links.jstor.org/sici?sici=0012-9682%28196804%2936%3A2%3C213%3AEDE%3E2.0.CO%3B2-J
13 A Note on a Class of Utility and Production Functions Yielding Everywhere DifferentiableDemand FunctionsA. P. Barten; T. Kloek; F. B. LempersThe Review of Economic Studies, Vol. 36, No. 1. (Jan., 1969), pp. 109-111.Stable URL:
http://links.jstor.org/sici?sici=0034-6527%28196901%2936%3A1%3C109%3AANOACO%3E2.0.CO%3B2-4
16 The Use of TransformationsM. S. BartlettBiometrics, Vol. 3, No. 1. (Mar., 1947), pp. 39-52.Stable URL:
http://links.jstor.org/sici?sici=0006-341X%28194703%293%3A1%3C39%3ATUOT%3E2.0.CO%3B2-6
22 The Estimation of Price Elasticities from Cross-Section Data Under Additive PreferencesRoger R. BetancourtInternational Economic Review, Vol. 12, No. 2. (Jun., 1971), pp. 283-292.Stable URL:
http://links.jstor.org/sici?sici=0020-6598%28197106%2912%3A2%3C283%3ATEOPEF%3E2.0.CO%3B2-I
30 Habit Persistence and Lags in Consumer BehaviourT. M. BrownEconometrica, Vol. 20, No. 3. (Jul., 1952), pp. 355-371.Stable URL:
http://links.jstor.org/sici?sici=0012-9682%28195207%2920%3A3%3C355%3AHPALIC%3E2.0.CO%3B2-M
32 A Simple Method for Estimating Demand Systems Under Separable Utility AssumptionsR. P. ByronThe Review of Economic Studies, Vol. 37, No. 2. (Apr., 1970), pp. 261-274.Stable URL:
http://links.jstor.org/sici?sici=0034-6527%28197004%2937%3A2%3C261%3AASMFED%3E2.0.CO%3B2-B
http://www.jstor.org
LINKED CITATIONS- Page 4 of 18 -
NOTE: The reference numbering from the original has been maintained in this citation list.

33 The Restricted Aitken Estimation of Sets of Demand RelationsR. P. ByronEconometrica, Vol. 38, No. 6. (Nov., 1970), pp. 816-830.Stable URL:
http://links.jstor.org/sici?sici=0012-9682%28197011%2938%3A6%3C816%3ATRAEOS%3E2.0.CO%3B2-L
35 The General Form of the Adding-Up Criterion: A RejoinderD. G. Champernowne; J. L. NicholsonJournal of the Royal Statistical Society. Series A (General), Vol. 120, No. 4. (1957), pp. 457-458.Stable URL:
http://links.jstor.org/sici?sici=0035-9238%281957%29120%3A4%3C457%3ATGFOTA%3E2.0.CO%3B2-E
41 Utility Maximization and the Demand for New Zealand MeatsRobin H. CourtEconometrica, Vol. 35, No. 3/4. (Jul. - Oct., 1967), pp. 424-446.Stable URL:
http://links.jstor.org/sici?sici=0012-9682%28196707%2F10%2935%3A3%2F4%3C424%3AUMATDF%3E2.0.CO%3B2-S
42 A Dynamic Approach to the Theory of Consumer DemandJ. S. CramerThe Review of Economic Studies, Vol. 24, No. 2. (Feb., 1957), pp. 73-86.Stable URL:
http://links.jstor.org/sici?sici=0034-6527%28195702%2924%3A2%3C73%3AADATTT%3E2.0.CO%3B2-Z
43 Ownership Elasticities of Durable Consumer GoodsJ. S. CramerThe Review of Economic Studies, Vol. 25, No. 2. (Feb., 1958), pp. 87-96.Stable URL:
http://links.jstor.org/sici?sici=0034-6527%28195802%2925%3A2%3C87%3AOEODCG%3E2.0.CO%3B2-N
44 The Depreciation and Mortality of Motor-CarsJ. S. CramerJournal of the Royal Statistical Society. Series A (General), Vol. 121, No. 1. (1958), pp. 18-59.Stable URL:
http://links.jstor.org/sici?sici=0035-9238%281958%29121%3A1%3C18%3ATDAMOM%3E2.0.CO%3B2-I
http://www.jstor.org
LINKED CITATIONS- Page 5 of 18 -
NOTE: The reference numbering from the original has been maintained in this citation list.

45 Private Motoring and the Demand for PetrolJ. S. CramerJournal of the Royal Statistical Society. Series A (General), Vol. 122, No. 3. (1959), pp. 334-347.Stable URL:
http://links.jstor.org/sici?sici=0035-9238%281959%29122%3A3%3C334%3APMATDF%3E2.0.CO%3B2-Z
52 On a Class of Utility and Production Functions Yielding Everywhere Differentiable DemandFunctionsP. J. DhrymesThe Review of Economic Studies, Vol. 34, No. 4. (Oct., 1967), pp. 399-408.Stable URL:
http://links.jstor.org/sici?sici=0034-6527%28196710%2934%3A4%3C399%3AOACOUA%3E2.0.CO%3B2-1
55 A Note on the Demand for FoodJ. DownieThe Economic Journal, Vol. 62, No. 248. (Dec., 1952), pp. 936-939.Stable URL:
http://links.jstor.org/sici?sici=0013-0133%28195212%2962%3A248%3C936%3AANOTDF%3E2.0.CO%3B2-G
57 A Note on Regression when There is Extraneous Information about One of the CoefficientsJ. DurbinJournal of the American Statistical Association, Vol. 48, No. 264. (Dec., 1953), pp. 799-808.Stable URL:
http://links.jstor.org/sici?sici=0162-1459%28195312%2948%3A264%3C799%3AANORWT%3E2.0.CO%3B2-P
62 Irreversible Demand FunctionsM. J. FarrellEconometrica, Vol. 20, No. 2. (Apr., 1952), pp. 171-186.Stable URL:
http://links.jstor.org/sici?sici=0012-9682%28195204%2920%3A2%3C171%3AIDF%3E2.0.CO%3B2-Z
63 Some Aggregation Problems in Demand AnalysisM. J. FarrellThe Review of Economic Studies, Vol. 21, No. 3. (1953 - 1954), pp. 193-203.Stable URL:
http://links.jstor.org/sici?sici=0034-6527%281953%2F1954%2921%3A3%3C193%3ASAPIDA%3E2.0.CO%3B2-C
http://www.jstor.org
LINKED CITATIONS- Page 6 of 18 -
NOTE: The reference numbering from the original has been maintained in this citation list.
64 The Demand for Motor-Cars in the United StatesM. J. FarrellJournal of the Royal Statistical Society. Series A (General), Vol. 117, No. 2. (1954), pp. 171-201.Stable URL:
http://links.jstor.org/sici?sici=0035-9238%281954%29117%3A2%3C171%3ATDFMIT%3E2.0.CO%3B2-O
65 Expectations and Adjustments in the Monetary SectorEdgar L. FeigeThe American Economic Review, Vol. 57, No. 2, Papers and Proceedings of the Seventy-ninthAnnual Meeting of the American Economic Association. (May, 1967), pp. 462-473.Stable URL:
http://links.jstor.org/sici?sici=0002-8282%28196705%2957%3A2%3C462%3AEAAITM%3E2.0.CO%3B2-K
68 Maximum Likelihood Estimation of Tornqvist Demand EquationsP. R. FiskThe Review of Economic Studies, Vol. 26, No. 1. (Oct., 1958), pp. 33-50.Stable URL:
http://links.jstor.org/sici?sici=0034-6527%28195810%2926%3A1%3C33%3AMLEOTD%3E2.0.CO%3B2-S
72 Consommation en Prix et Revenu Reels et Theorie des ChoixC. Fourgeaud; A. NatafEconometrica, Vol. 27, No. 3. (Jul., 1959), pp. 329-354.Stable URL:
http://links.jstor.org/sici?sici=0012-9682%28195907%2927%3A3%3C329%3ACEPERR%3E2.0.CO%3B2-Q
74 Professor Pigou's Method for Measuring Elasticities of Demand From Budgetary DataMilton FriedmanThe Quarterly Journal of Economics, Vol. 50, No. 1. (Nov., 1935), pp. 151-163.Stable URL:
http://links.jstor.org/sici?sici=0033-5533%28193511%2950%3A1%3C151%3APPMFME%3E2.0.CO%3B2-4
79 A Complete Scheme for Computing All Direct and Cross Demand Elasticities in a Modelwith Many SectorsRagnar FrischEconometrica, Vol. 27, No. 2. (Apr., 1959), pp. 177-196.Stable URL:
http://links.jstor.org/sici?sici=0012-9682%28195904%2927%3A2%3C177%3AACSFCA%3E2.0.CO%3B2-J
http://www.jstor.org
LINKED CITATIONS- Page 7 of 18 -
NOTE: The reference numbering from the original has been maintained in this citation list.
80 A Note on "A Constant-Utility Index of the Cost of Living"R. C. GearyThe Review of Economic Studies, Vol. 18, No. 1. (1950 - 1951), pp. 65-66.Stable URL:
http://links.jstor.org/sici?sici=0034-6527%281950%2F1951%2918%3A1%3C65%3AANO%22CI%3E2.0.CO%3B2-W
82 Directly Additive Utility and Constant Marginal Budget SharesA. S. GoldbergerThe Review of Economic Studies, Vol. 36, No. 2. (Apr., 1969), pp. 251-254.Stable URL:
http://links.jstor.org/sici?sici=0034-6527%28196904%2936%3A2%3C251%3ADAUACM%3E2.0.CO%3B2-M
84 A Note on Separability in Demand AnalysisS. M. Goldman; H. UzawaEconometrica, Vol. 32, No. 3. (Jul., 1964), pp. 387-398.Stable URL:
http://links.jstor.org/sici?sici=0012-9682%28196407%2932%3A3%3C387%3AANOSID%3E2.0.CO%3B2-B
86 Community Preference FieldsW. M. GormanEconometrica, Vol. 21, No. 1. (Jan., 1953), pp. 63-80.Stable URL:
http://links.jstor.org/sici?sici=0012-9682%28195301%2921%3A1%3C63%3ACPF%3E2.0.CO%3B2-9
90 Additive Logarithmic Preferences A Further NoteW. M. GormanThe Review of Economic Studies, Vol. 30, No. 1. (Feb., 1963), pp. 56-62.Stable URL:
http://links.jstor.org/sici?sici=0034-6527%28196302%2930%3A1%3C56%3AALPAFN%3E2.0.CO%3B2-T
92 Direct Additivity and Consumers' BehaviourH. A. John GreenOxford Economic Papers, New Series, Vol. 13, No. 2. (Jun., 1961), pp. 132-136.Stable URL:
http://links.jstor.org/sici?sici=0030-7653%28196106%292%3A13%3A2%3C132%3ADAACB%3E2.0.CO%3B2-B
http://www.jstor.org
LINKED CITATIONS- Page 8 of 18 -
NOTE: The reference numbering from the original has been maintained in this citation list.

94 The Statistical Implications of a System of Simultaneous EquationsTrygve HaavelmoEconometrica, Vol. 11, No. 1. (Jan., 1943), pp. 1-12.Stable URL:
http://links.jstor.org/sici?sici=0012-9682%28194301%2911%3A1%3C1%3ATSIOAS%3E2.0.CO%3B2-N
95 The Cost of a FamilyA. M. HendersonThe Review of Economic Studies, Vol. 17, No. 2. (1949 - 1950), pp. 127-148.Stable URL:
http://links.jstor.org/sici?sici=0034-6527%281949%2F1950%2917%3A2%3C127%3ATCOAF%3E2.0.CO%3B2-G
99 A Survey of Price ElasticitiesW. Z. HirschThe Review of Economic Studies, Vol. 19, No. 1. (1951 - 1952), pp. 50-60.Stable URL:
http://links.jstor.org/sici?sici=0034-6527%281951%2F1952%2919%3A1%3C50%3AASOPE%3E2.0.CO%3B2-O
102 Edgeworth's Taxation Paradox and the Nature of Demand and Supply FunctionsHarold HotellingThe Journal of Political Economy, Vol. 40, No. 5. (Oct., 1932), pp. 577-616.Stable URL:
http://links.jstor.org/sici?sici=0022-3808%28193210%2940%3A5%3C577%3AETPATN%3E2.0.CO%3B2-O
103 Revealed Preference and the Utility FunctionH. S. HouthakkerEconomica, New Series, Vol. 17, No. 66. (May, 1950), pp. 159-174.Stable URL:
http://links.jstor.org/sici?sici=0013-0427%28195005%292%3A17%3A66%3C159%3ARPATUF%3E2.0.CO%3B2-J
104 The Econometrics of Family BudgetsH. S. HouthakkerJournal of the Royal Statistical Society. Series A (General), Vol. 115, No. 1. (1952), pp. 1-28.Stable URL:
http://links.jstor.org/sici?sici=0035-9238%281952%29115%3A1%3C1%3ATEOFB%3E2.0.CO%3B2-7
http://www.jstor.org
LINKED CITATIONS- Page 9 of 18 -
NOTE: The reference numbering from the original has been maintained in this citation list.

105 Compensated Changes in Quantities and Qualities ConsumedH. S. HouthakkerThe Review of Economic Studies, Vol. 19, No. 3. (1952 - 1953), pp. 155-164.Stable URL:
http://links.jstor.org/sici?sici=0034-6527%281952%2F1953%2919%3A3%3C155%3ACCIQAQ%3E2.0.CO%3B2-6
110 The Present State of Consumption TheoryH. S. HouthakkerEconometrica, Vol. 29, No. 4. (Oct., 1961), pp. 704-740.Stable URL:
http://links.jstor.org/sici?sici=0012-9682%28196110%2929%3A4%3C704%3ATPSOCT%3E2.0.CO%3B2-%23
120 A Constant-Utility Index of the Cost of LivingL. R. Klein; H. RubinThe Review of Economic Studies, Vol. 15, No. 2. (1947 - 1948), pp. 84-87.Stable URL:
http://links.jstor.org/sici?sici=0034-6527%281947%2F1948%2915%3A2%3C84%3AACIOTC%3E2.0.CO%3B2-B
122 International Comparisons of Prices and Quantities ConsumedT. Kloek; H. TheilEconometrica, Vol. 33, No. 3. (Jul., 1965), pp. 535-556.Stable URL:
http://links.jstor.org/sici?sici=0012-9682%28196507%2933%3A3%3C535%3AICOPAQ%3E2.0.CO%3B2-P
126 An Empirical Test of Revealed Preference TheoryAnthony Y. C. KooEconometrica, Vol. 31, No. 4. (Oct., 1963), pp. 646-664.Stable URL:
http://links.jstor.org/sici?sici=0012-9682%28196310%2931%3A4%3C646%3AAETORP%3E2.0.CO%3B2-X
128 The Elasticity of Demand for WheatR. A. LehfeldtThe Economic Journal, Vol. 24, No. 94. (Jun., 1914), pp. 212-217.Stable URL:
http://links.jstor.org/sici?sici=0013-0133%28191406%2924%3A94%3C212%3ATEODFW%3E2.0.CO%3B2-J
http://www.jstor.org
LINKED CITATIONS- Page 10 of 18 -
NOTE: The reference numbering from the original has been maintained in this citation list.

132 Composite Commodities and the Problem of Index NumbersWassily LeontiefEconometrica, Vol. 4, No. 1. (Jan., 1936), pp. 39-59.Stable URL:
http://links.jstor.org/sici?sici=0012-9682%28193601%294%3A1%3C39%3ACCATPO%3E2.0.CO%3B2-2
133 Introduction to a Theory of the Internal Structure of Functional RelationshipsWassily LeontiefEconometrica, Vol. 15, No. 4. (Oct., 1947), pp. 361-373.Stable URL:
http://links.jstor.org/sici?sici=0012-9682%28194710%2915%3A4%3C361%3AITATOT%3E2.0.CO%3B2-6
135 Family Budget Data and Price-Elasticities of DemandC. E. V. LeserThe Review of Economic Studies, Vol. 9, No. 1. (Nov., 1941), pp. 40-57.Stable URL:
http://links.jstor.org/sici?sici=0034-6527%28194111%299%3A1%3C40%3AFBDAPO%3E2.0.CO%3B2-1
138 Commodity Group Expenditure Functions for the United Kingdom, 1948-1957C. E. V. LeserEconometrica, Vol. 29, No. 1. (Jan., 1961), pp. 24-32.Stable URL:
http://links.jstor.org/sici?sici=0012-9682%28196101%2929%3A1%3C24%3ACGEFFT%3E2.0.CO%3B2-J
139 Forms of Engel FunctionsC. E. V. LeserEconometrica, Vol. 31, No. 4. (Oct., 1963), pp. 694-703.Stable URL:
http://links.jstor.org/sici?sici=0012-9682%28196310%2931%3A4%3C694%3AFOEF%3E2.0.CO%3B2-I
143 The Experimental Determination of Indifference CurvesK. R. MacCrimmon; M. TodaThe Review of Economic Studies, Vol. 36, No. 4. (Oct., 1969), pp. 433-451.Stable URL:
http://links.jstor.org/sici?sici=0034-6527%28196910%2936%3A4%3C433%3ATEDOIC%3E2.0.CO%3B2-4
http://www.jstor.org
LINKED CITATIONS- Page 11 of 18 -
NOTE: The reference numbering from the original has been maintained in this citation list.

150 Household Production and Consumer Demand FunctionsRichard F. MuthEconometrica, Vol. 34, No. 3. (Jul., 1966), pp. 699-708.Stable URL:
http://links.jstor.org/sici?sici=0012-9682%28196607%2934%3A3%3C699%3AHPACDF%3E2.0.CO%3B2-6
153 The Market Demand for Durable Goods: A CommentMarc NerloveEconometrica, Vol. 28, No. 1. (Jan., 1960), pp. 132-142.Stable URL:
http://links.jstor.org/sici?sici=0012-9682%28196001%2928%3A1%3C132%3ATMDFDG%3E2.0.CO%3B2-I
154 Variations in Working Class Family ExpenditureJ. L. NicholsonJournal of the Royal Statistical Society. Series A (General), Vol. 112, No. 4. (1949), pp. 359-418.Stable URL:
http://links.jstor.org/sici?sici=0035-9238%281949%29112%3A4%3C359%3AVIWCFE%3E2.0.CO%3B2-S
155 The General Form of the Adding-Up CriterionJ. L. NicholsonJournal of the Royal Statistical Society. Series A (General), Vol. 120, No. 1. (1957), pp. 84-85.Stable URL:
http://links.jstor.org/sici?sici=0035-9238%281957%29120%3A1%3C84%3ATGFOTA%3E2.0.CO%3B2-I
158 Efficient Estimation of a System of Regression Equations when Disturbances are BothSerially and Contemporaneously CorrelatedRichard W. ParksJournal of the American Statistical Association, Vol. 62, No. 318. (Jun., 1967), pp. 500-509.Stable URL:
http://links.jstor.org/sici?sici=0162-1459%28196706%2962%3A318%3C500%3AEEOASO%3E2.0.CO%3B2-V
159 Systems of Demand Equations: An Empirical Comparison of Alternative Functional FormsRichard W. ParksEconometrica, Vol. 37, No. 4. (Oct., 1969), pp. 629-650.Stable URL:
http://links.jstor.org/sici?sici=0012-9682%28196910%2937%3A4%3C629%3ASODEAE%3E2.0.CO%3B2-N
http://www.jstor.org
LINKED CITATIONS- Page 12 of 18 -
NOTE: The reference numbering from the original has been maintained in this citation list.

160 Maximum Likelihood Estimation of the Linear Expenditure SystemRichard W. ParksJournal of the American Statistical Association, Vol. 66, No. 336. (Dec., 1971), pp. 900-903.Stable URL:
http://links.jstor.org/sici?sici=0162-1459%28197112%2966%3A336%3C900%3AMLEOTL%3E2.0.CO%3B2-V
161 An Exact Method of Consumer Demand AnalysisI. F. PearceEconometrica, Vol. 29, No. 4. (Oct., 1961), pp. 499-516.Stable URL:
http://links.jstor.org/sici?sici=0012-9682%28196110%2929%3A4%3C499%3AAEMOCD%3E2.0.CO%3B2-2
162 A Method of Consumer Demand Analysis IllustratedI. F. PearceEconomica, New Series, Vol. 28, No. 112. (Nov., 1961), pp. 371-394.Stable URL:
http://links.jstor.org/sici?sici=0013-0427%28196111%292%3A28%3A112%3C371%3AAMOCDA%3E2.0.CO%3B2-S
164 Substitution, Complementarity, and the Residual Variation Around Dynamic DemandEquationsLouis PhlipsThe American Economic Review, Vol. 61, No. 4. (Sep., 1971), pp. 586-597.Stable URL:
http://links.jstor.org/sici?sici=0002-8282%28197109%2961%3A4%3C586%3ASCATRV%3E2.0.CO%3B2-B
171 Post-War Consumption in Canada: A First Look at the AggregatesAlan PowellThe Canadian Journal of Economics and Political Science / Revue canadienne d'Economique et deScience politique, Vol. 31, No. 4. (Nov., 1965), pp. 559-565.Stable URL:
http://links.jstor.org/sici?sici=0315-4890%28196511%2931%3A4%3C559%3APCICAF%3E2.0.CO%3B2-O
172 A Complete System of Consumer Demand Equations for the Australian Economy Fitted bya Model of Additive PreferencesAlan PowellEconometrica, Vol. 34, No. 3. (Jul., 1966), pp. 661-675.Stable URL:
http://links.jstor.org/sici?sici=0012-9682%28196607%2934%3A3%3C661%3AACSOCD%3E2.0.CO%3B2-M
http://www.jstor.org
LINKED CITATIONS- Page 13 of 18 -
NOTE: The reference numbering from the original has been maintained in this citation list.

173 A Multi-Sectoral Analysis of Consumer demand in the Post-War PeriodAlan A. Powell; Tran Van HoaSouthern Economic Journal, Vol. 35, No. 2. (Oct., 1968), pp. 109-120.Stable URL:
http://links.jstor.org/sici?sici=0038-4038%28196810%2935%3A2%3C109%3AAMAOCD%3E2.0.CO%3B2-C
174 Aitken Estimators as a Tool in Allocating Predetermined AggregatesAlan PowellJournal of the American Statistical Association, Vol. 64, No. 327. (Sep., 1969), pp. 913-922.Stable URL:
http://links.jstor.org/sici?sici=0162-1459%28196909%2964%3A327%3C913%3AAEAATI%3E2.0.CO%3B2-0
176 Non-Linear Estimates of the Engel CurvesS. J. PraisThe Review of Economic Studies, Vol. 20, No. 2. (1952 - 1953), pp. 87-104.Stable URL:
http://links.jstor.org/sici?sici=0034-6527%281952%2F1953%2920%3A2%3C87%3ANEOTEC%3E2.0.CO%3B2-D
187 Some Implications of "Linearity."P. A. SamuelsonThe Review of Economic Studies, Vol. 15, No. 2. (1947 - 1948), pp. 88-90.Stable URL:
http://links.jstor.org/sici?sici=0034-6527%281947%2F1948%2915%3A2%3C88%3ASIO%22%3E2.0.CO%3B2-V
188 The Problem of Integrability in Utility TheoryPaul A. SamuelsonEconomica, New Series, Vol. 17, No. 68. (Nov., 1950), pp. 355-385.Stable URL:
http://links.jstor.org/sici?sici=0013-0427%28195011%292%3A17%3A68%3C355%3ATPOIIU%3E2.0.CO%3B2-4
189 Using Full Duality to Show that Simultaneously Additive Direct and Indirect UtilitiesImplies Unitary Price Elasticity of DemandPaul A. SamuelsonEconometrica, Vol. 33, No. 4. (Oct., 1965), pp. 781-796.Stable URL:
http://links.jstor.org/sici?sici=0012-9682%28196510%2933%3A4%3C781%3AUFDTST%3E2.0.CO%3B2-J
http://www.jstor.org
LINKED CITATIONS- Page 14 of 18 -
NOTE: The reference numbering from the original has been maintained in this citation list.

200 The Effect of Price Changes on the Demand and Supply of Separable GoodsMasazo SonoInternational Economic Review, Vol. 2, No. 3. (Sep., 1961), pp. 239-271.Stable URL:
http://links.jstor.org/sici?sici=0020-6598%28196109%292%3A3%3C239%3ATEOPCO%3E2.0.CO%3B2-M
201 A Development of the Economic Theory of Price Index NumbersH. StaehleThe Review of Economic Studies, Vol. 2, No. 3. (Jun., 1935), pp. 163-188.Stable URL:
http://links.jstor.org/sici?sici=0034-6527%28193506%292%3A3%3C163%3AADOTET%3E2.0.CO%3B2-O
204 Linear Expenditure Systems and Demand Analysis: An Application to the Pattern of BritishDemandRichard StoneThe Economic Journal, Vol. 64, No. 255. (Sep., 1954), pp. 511-527.Stable URL:
http://links.jstor.org/sici?sici=0013-0133%28195409%2964%3A255%3C511%3ALESADA%3E2.0.CO%3B2-D
206 The Market Demand for Durable GoodsRichard Stone; D. A. RoweEconometrica, Vol. 25, No. 3. (Jul., 1957), pp. 423-443.Stable URL:
http://links.jstor.org/sici?sici=0012-9682%28195707%2925%3A3%3C423%3ATMDFDG%3E2.0.CO%3B2-H
207 Dynamic Demand Functions: Some Econometric ResultsRichard Stone; D. A. RoweThe Economic Journal, Vol. 68, No. 270. (Jun., 1958), pp. 256-270.Stable URL:
http://links.jstor.org/sici?sici=0013-0133%28195806%2968%3A270%3C256%3ADDFSER%3E2.0.CO%3B2-K
209 The Durability of Consumers' Durable GoodsRichard Stone; D. A. RoweEconometrica, Vol. 28, No. 2. (Apr., 1960), pp. 407-416.Stable URL:
http://links.jstor.org/sici?sici=0012-9682%28196004%2928%3A2%3C407%3ATDOCDG%3E2.0.CO%3B2-Y
http://www.jstor.org
LINKED CITATIONS- Page 15 of 18 -
NOTE: The reference numbering from the original has been maintained in this citation list.

214 The Empirical Implications of a Utility TreeRobert H. StrotzEconometrica, Vol. 25, No. 2. (Apr., 1957), pp. 269-280.Stable URL:
http://links.jstor.org/sici?sici=0012-9682%28195704%2925%3A2%3C269%3ATEIOAU%3E2.0.CO%3B2-1
215 The Utility Tree--A Correction and Further AppraisalRobert H. StrotzEconometrica, Vol. 27, No. 3. (Jul., 1959), pp. 482-488.Stable URL:
http://links.jstor.org/sici?sici=0012-9682%28195907%2927%3A3%3C482%3ATUTCAF%3E2.0.CO%3B2-4
218 Substitution, Complementarity, and the Residual Variation around Engel CurvesH. H. Theil; H. NeudeckerThe Review of Economic Studies, Vol. 25, No. 2. (Feb., 1958), pp. 114-123.Stable URL:
http://links.jstor.org/sici?sici=0034-6527%28195802%2925%3A2%3C114%3ASCATRV%3E2.0.CO%3B2-K
219 On the Use of Incomplete Prior Information in Regression AnalysisH. TheilJournal of the American Statistical Association, Vol. 58, No. 302. (Jun., 1963), pp. 401-414.Stable URL:
http://links.jstor.org/sici?sici=0162-1459%28196306%2958%3A302%3C401%3AOTUOIP%3E2.0.CO%3B2-R
220 On Pure and Mixed Statistical Estimation in EconomicsH. Theil; A. S. GoldbergerInternational Economic Review, Vol. 2, No. 1. (Jan., 1961), pp. 65-78.Stable URL:
http://links.jstor.org/sici?sici=0020-6598%28196101%292%3A1%3C65%3AOPAMSE%3E2.0.CO%3B2-I
221 Some Developments of Economic Thought in the NetherlandsH. TheilThe American Economic Review, Vol. 54, No. 2, Part 2, Supplement, Surveys of Foreign PostwarDevelopments in Economic Thought. (Mar., 1964), pp. 34-55.Stable URL:
http://links.jstor.org/sici?sici=0002-8282%28196403%2954%3A2%3C34%3ASDOETI%3E2.0.CO%3B2-4
http://www.jstor.org
LINKED CITATIONS- Page 16 of 18 -
NOTE: The reference numbering from the original has been maintained in this citation list.
223 The Information Approach to Demand AnalysisH. TheilEconometrica, Vol. 33, No. 1. (Jan., 1965), pp. 67-87.Stable URL:
http://links.jstor.org/sici?sici=0012-9682%28196501%2933%3A1%3C67%3ATIATDA%3E2.0.CO%3B2-F
224 The Information Value of Demand Equations and PredictionsH. Theil; Robert H. MnookinThe Journal of Political Economy, Vol. 74, No. 1. (Feb., 1966), pp. 34-45.Stable URL:
http://links.jstor.org/sici?sici=0022-3808%28196602%2974%3A1%3C34%3ATIVODE%3E2.0.CO%3B2-O
226 Value Share Transitions in Consumer Demand TheoryHenri TheilEconometrica, Vol. 38, No. 1. (Jan., 1970), pp. 118-127.Stable URL:
http://links.jstor.org/sici?sici=0012-9682%28197001%2938%3A1%3C118%3AVSTICD%3E2.0.CO%3B2-G
229 An Economic Theory of the Second Moments of Disturbances of Behavioral EquationsHenri TheilThe American Economic Review, Vol. 61, No. 1. (Mar., 1971), pp. 190-194.Stable URL:
http://links.jstor.org/sici?sici=0002-8282%28197103%2961%3A1%3C190%3AAETOTS%3E2.0.CO%3B2-H
233 A Survey of the Theory of RationingJames TobinEconometrica, Vol. 20, No. 4. (Oct., 1952), pp. 521-553.Stable URL:
http://links.jstor.org/sici?sici=0012-9682%28195210%2920%3A4%3C521%3AASOTTO%3E2.0.CO%3B2-2
241 What Do Statistical "Demand Curves" Show?E. J. WorkingThe Quarterly Journal of Economics, Vol. 41, No. 2. (Feb., 1927), pp. 212-235.Stable URL:
http://links.jstor.org/sici?sici=0033-5533%28192702%2941%3A2%3C212%3AWDS%22CS%3E2.0.CO%3B2-A
http://www.jstor.org
LINKED CITATIONS- Page 17 of 18 -
NOTE: The reference numbering from the original has been maintained in this citation list.

242 A Note on the Adding-up CriterionG. D. N. Worswick; D. G. ChampernowneThe Review of Economic Studies, Vol. 22, No. 1. (1954 - 1955), pp. 57-60.Stable URL:
http://links.jstor.org/sici?sici=0034-6527%281954%2F1955%2922%3A1%3C57%3AANOTAC%3E2.0.CO%3B2-1
243 Demand Functions: An Application to the Japanese Expenditure PatternKunio YoshiharaEconometrica, Vol. 37, No. 2. (Apr., 1969), pp. 257-274.Stable URL:
http://links.jstor.org/sici?sici=0012-9682%28196904%2937%3A2%3C257%3ADFAATT%3E2.0.CO%3B2-4
244 Why do we Sometimes get Nonsense-Correlations between Time-Series?--A Study inSampling and the Nature of Time-SeriesG. Udny YuleJournal of the Royal Statistical Society, Vol. 89, No. 1. (Jan., 1926), pp. 1-63.Stable URL:
http://links.jstor.org/sici?sici=0952-8385%28192601%2989%3A1%3C1%3AWDWSGN%3E2.0.CO%3B2-L
http://www.jstor.org
LINKED CITATIONS- Page 18 of 18 -
NOTE: The reference numbering from the original has been maintained in this citation list.