sustainability: spatial computing challenges shashi shekhar mcknight distinguished university...
Post on 19-Dec-2015
220 views
TRANSCRIPT
Sustainability: Spatial Computing ChallengesSustainability: Spatial Computing ChallengesShashi Shekhar
McKnight Distinguished University Professor
University of Minnesota
www.cs.umn.edu/~shekhar
NSF Workshop on Information and Communication Technologies for Sustainability (WICS)(http://www.cs.ucdavis.edu/~liu/WICS/WICS.htm)
June 27rd, 2011.
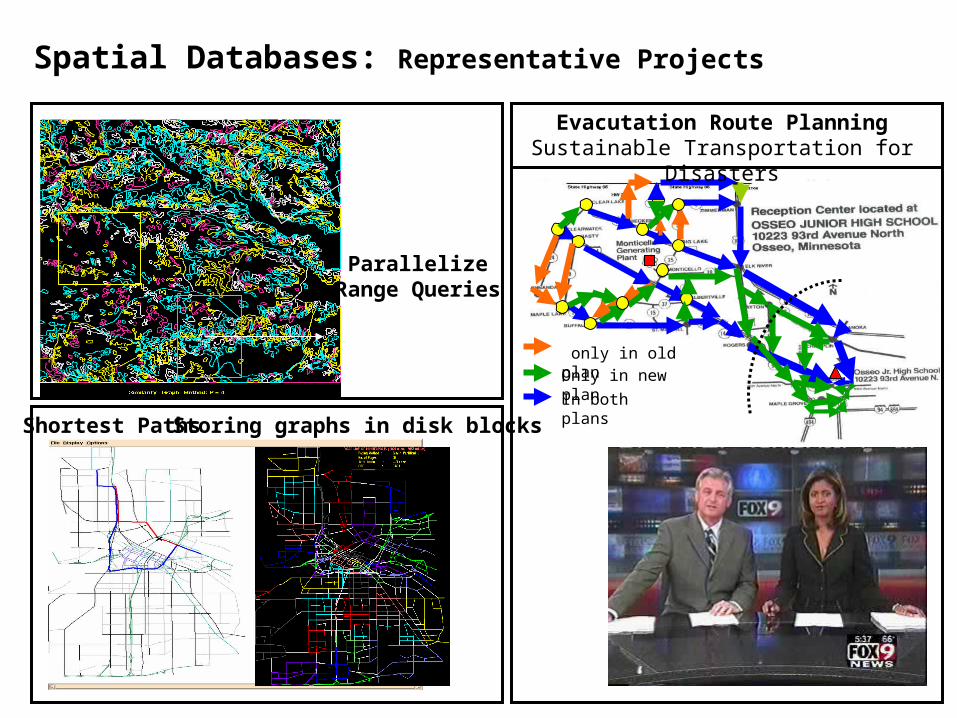
Spatial Databases: Representative Projects
only in old plan
Only in new plan
In both plans
Evacutation Route PlanningSustainable Transportation for Disasters
Parallelize Range Queries
Storing graphs in disk blocksShortest Paths
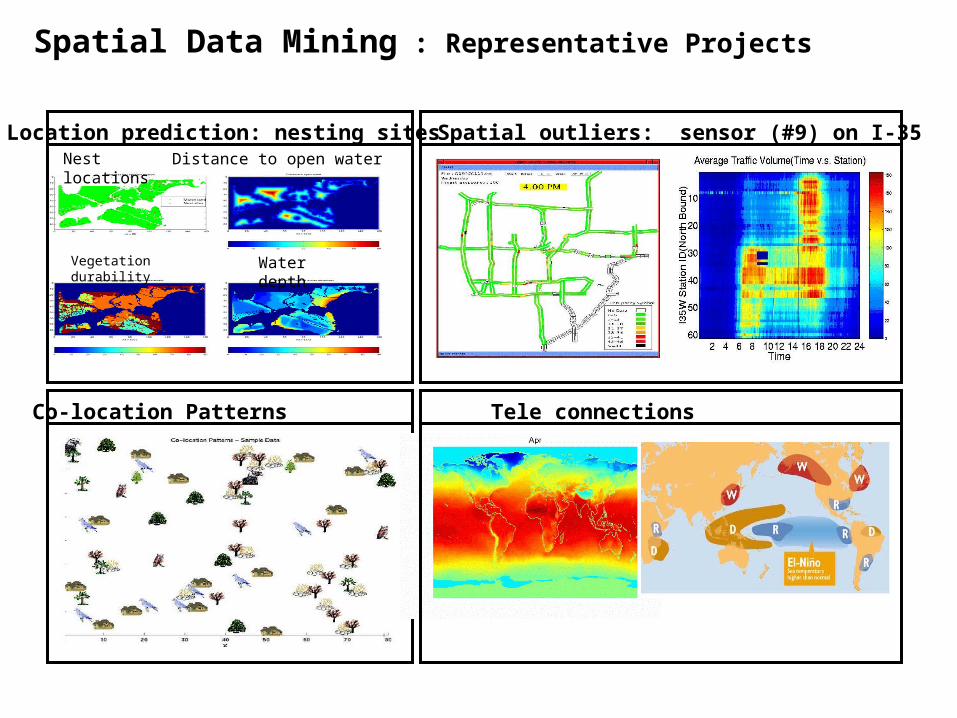
Spatial Data Mining : Representative Projects
Nest locations Distance to open water
Vegetation durability Water depth
Location prediction: nesting sites Spatial outliers: sensor (#9) on I-35
Co-location Patterns Tele connections

Why Sustainability?Next Decade Global Challenges [World Fed. Of United Nations Asso.]
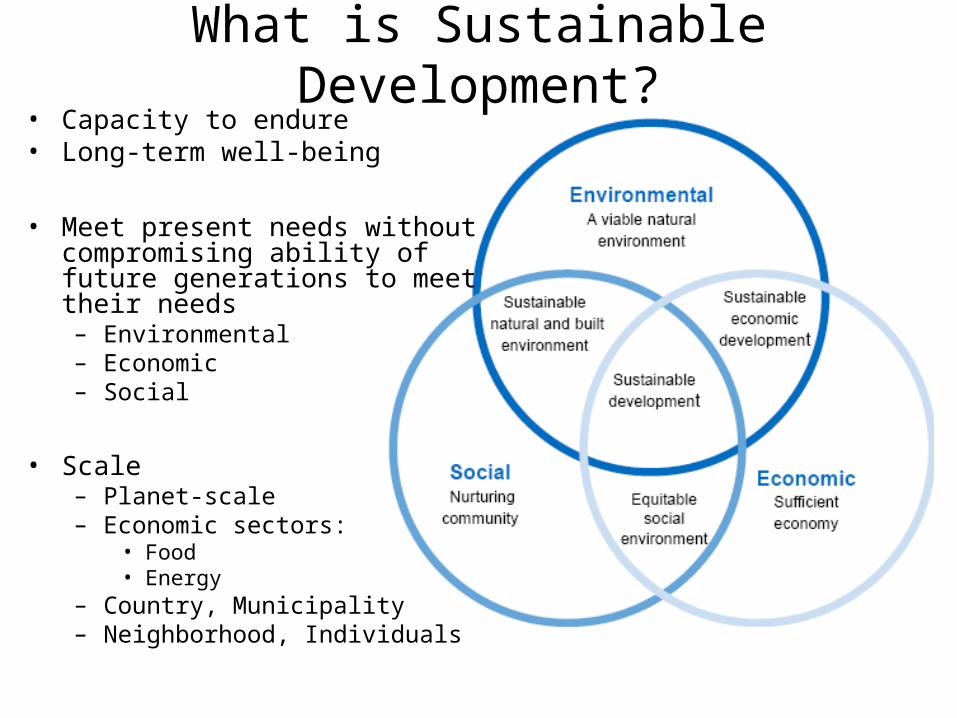
What is Sustainable Development?• Capacity to endure• Long-term well-being
• Meet present needs without compromising ability of future generations to meet their needs– Environmental– Economic– Social
• Scale – Planet-scale– Economic sectors:
• Food• Energy
– Country, Municipality– Neighborhood, Individuals

What is Spatial Computing?What is Spatial Computing?
6
SmarterPlanet
SIG SPATIAL
Intersecting Spatial-Computing & Sustainability
• Spatial computing for sustainability– Spatial location bring rich context using other GIS layers
– Sustainability-Sciences– Sustainable Development
• Economy• Society• Environment
• Sustainability of Spatial Computing – Geo-Data Collection, geo-registration, digitization is expensive & labor-intensive!– Challenge: Persistent Surveillance– Trends: Volunteered Geographic Information, e.g. OpenStreetMap
• Sustainability of Spatial Constructs– Urban plans, Regional economies, transportation planning, …– Are urban plans for US cities sustainable?– Is regional economy of rural areas sustainable with increased urbanization?
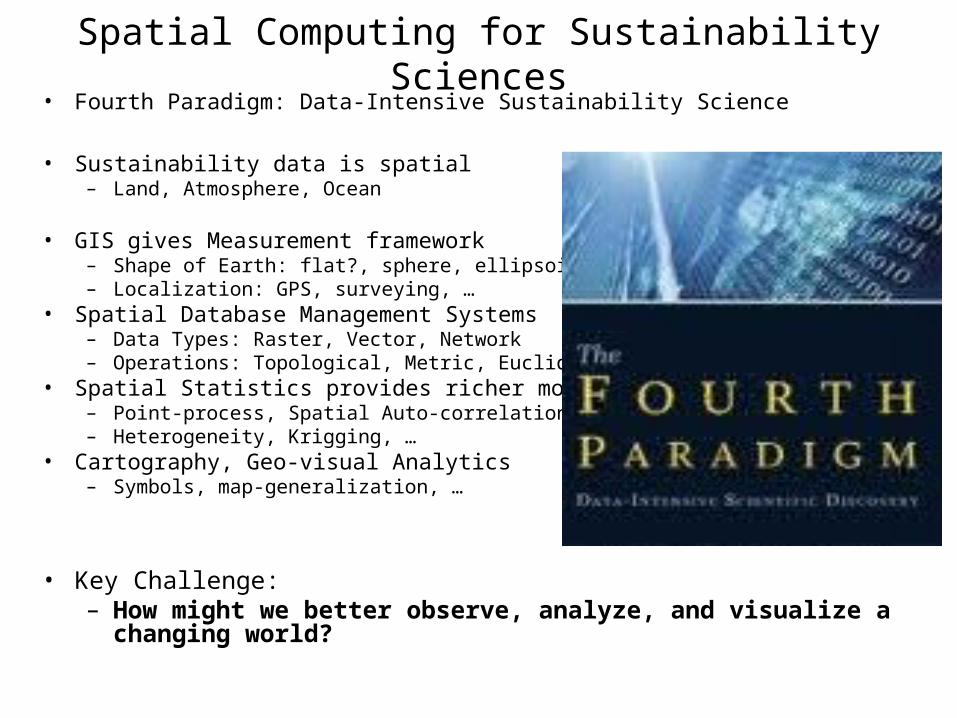
Spatial Computing for Sustainability Sciences• Fourth Paradigm: Data-Intensive Sustainability Science
• Sustainability data is spatial– Land, Atmosphere, Ocean
• GIS gives Measurement framework – Shape of Earth: flat?, sphere, ellipsoid, …– Localization: GPS, surveying, …
• Spatial Database Management Systems– Data Types: Raster, Vector, Network– Operations: Topological, Metric, Euclidean
• Spatial Statistics provides richer models– Point-process, Spatial Auto-correlation, …– Heterogeneity, Krigging, …
• Cartography, Geo-visual Analytics– Symbols, map-generalization, …
• Key Challenge:– How might we better observe, analyze, and visualize a changing world?
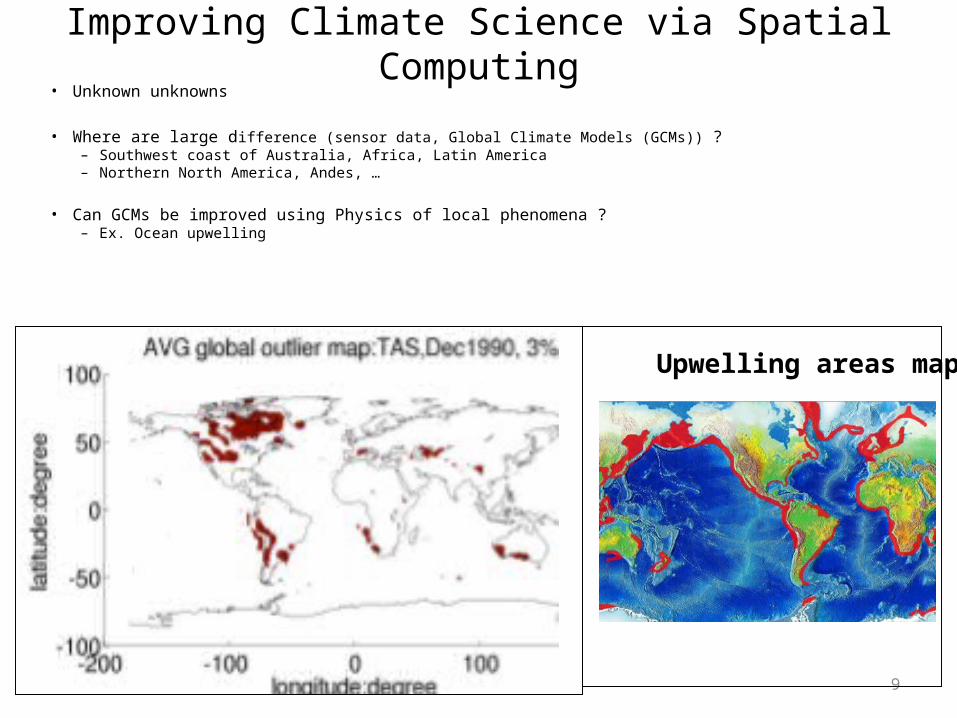
Improving Climate Science via Spatial Computing• Unknown unknowns
• Where are large difference (sensor data, Global Climate Models (GCMs)) ?– Southwest coast of Australia, Africa, Latin America– Northern North America, Andes, …
• Can GCMs be improved using Physics of local phenomena ?– Ex. Ocean upwelling
9
Upwelling areas map
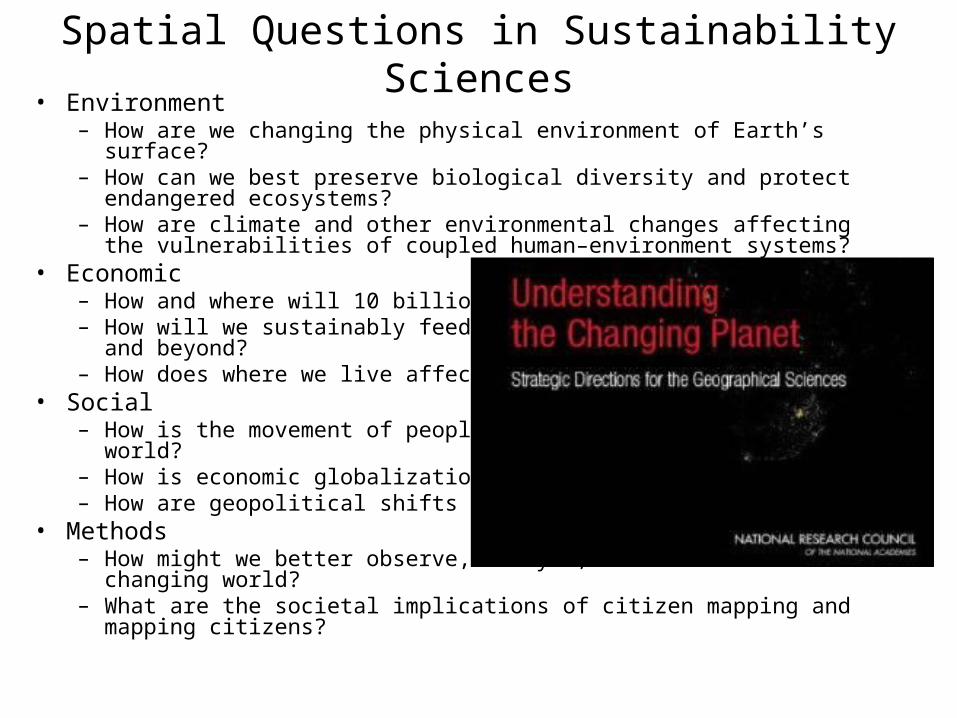
Spatial Questions in Sustainability Sciences• Environment
– How are we changing the physical environment of Earth’s surface?– How can we best preserve biological diversity and protect endangered
ecosystems?– How are climate and other environmental changes affecting the vulnerabilities of
coupled human–environment systems?• Economic
– How and where will 10 billion people live?– How will we sustainably feed everyone in the coming decade and beyond?– How does where we live affect our health?
• Social– How is the movement of people, goods, and ideas changing the world? – How is economic globalization affecting inequality?– How are geopolitical shifts influencing peace and stability?
• Methods– How might we better observe, analyze, and visualize a changing world?– What are the societal implications of citizen mapping and mapping citizens?
Intersecting Spatial-Computing & Sustainability
• Spatial location bring rich context using other GIS layers
• Sustainability-Sciences
• Sustainable Development
– Economy
– Society
– Environment
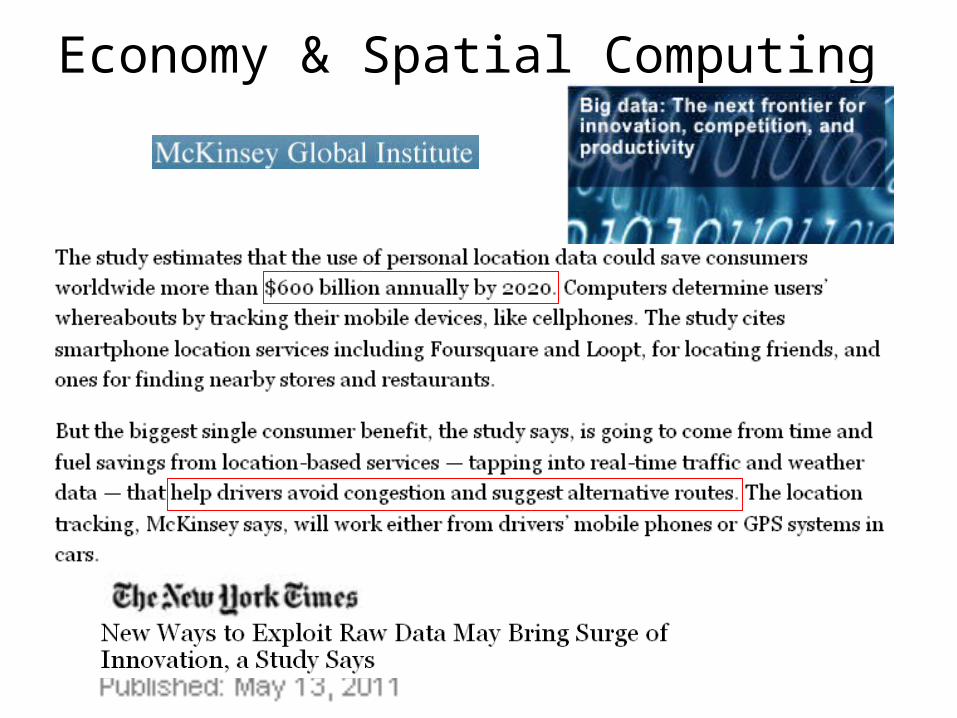
Economy & Spatial Computing

Real-time and Historic Travel-time DatasetsReal-time and Historic Travel-time Datasets
13
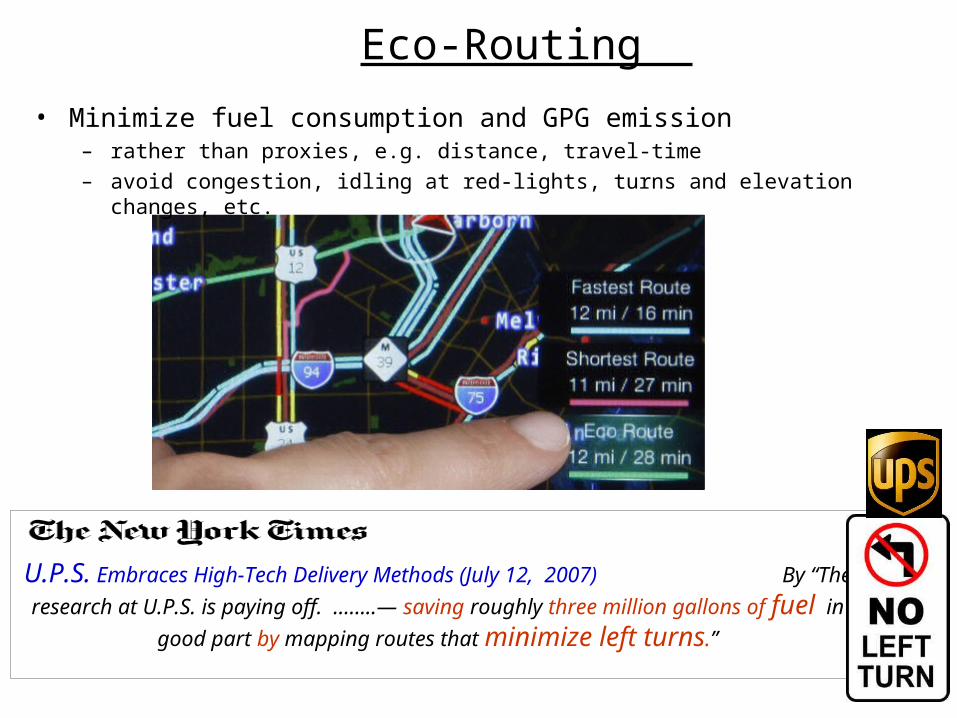
Eco-Routing
U.P.S. Embraces High-Tech Delivery Methods (July 12, 2007) By “The research at U.P.S. is paying off. ……..— saving roughly three
million gallons of fuel in good part by mapping routes that minimize left turns.”
• Minimize fuel consumption and GPG emission
– rather than proxies, e.g. distance, travel-time– avoid congestion, idling at red-lights, turns and elevation changes, etc.
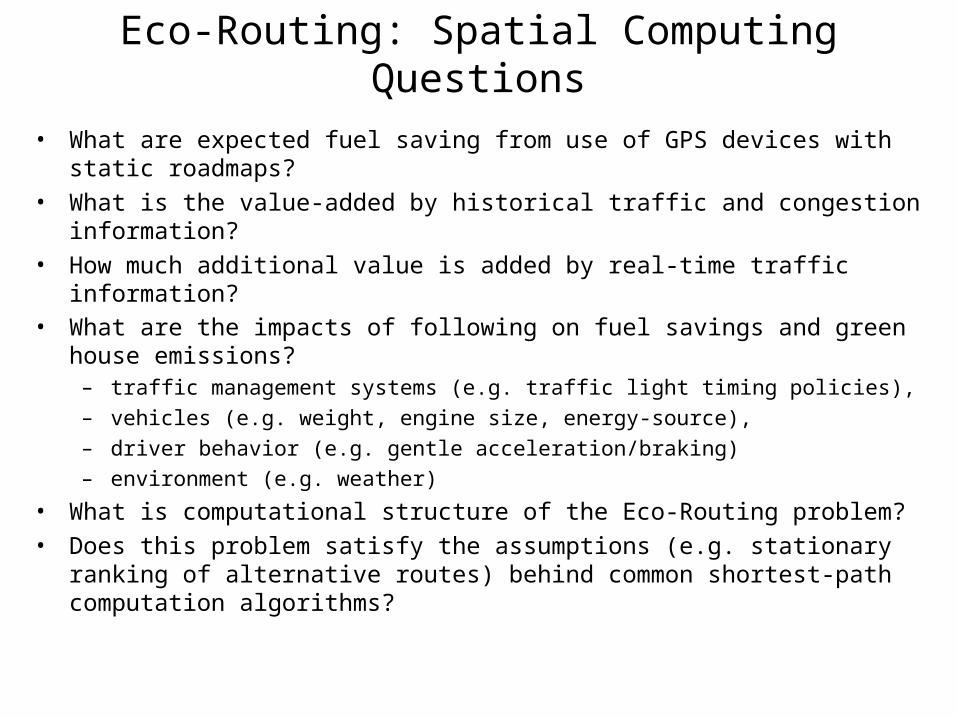
Eco-Routing: Spatial Computing Questions
• What are expected fuel saving from use of GPS devices with static roadmaps?
• What is the value-added by historical traffic and congestion information?
• How much additional value is added by real-time traffic information? • What are the impacts of following on fuel savings and green house emissions?
– traffic management systems (e.g. traffic light timing policies), – vehicles (e.g. weight, engine size, energy-source), – driver behavior (e.g. gentle acceleration/braking) – environment (e.g. weather)
• What is computational structure of the Eco-Routing problem?
• Does this problem satisfy the assumptions (e.g. stationary ranking of alternative routes) behind common shortest-path computation algorithms?
Intersecting Spatial-Computing & Sustainability
• Spatial location bring rich context using other GIS layers
• Sustainability-Sciences
• Sustainable Development
– Economy
– Society
– Environment
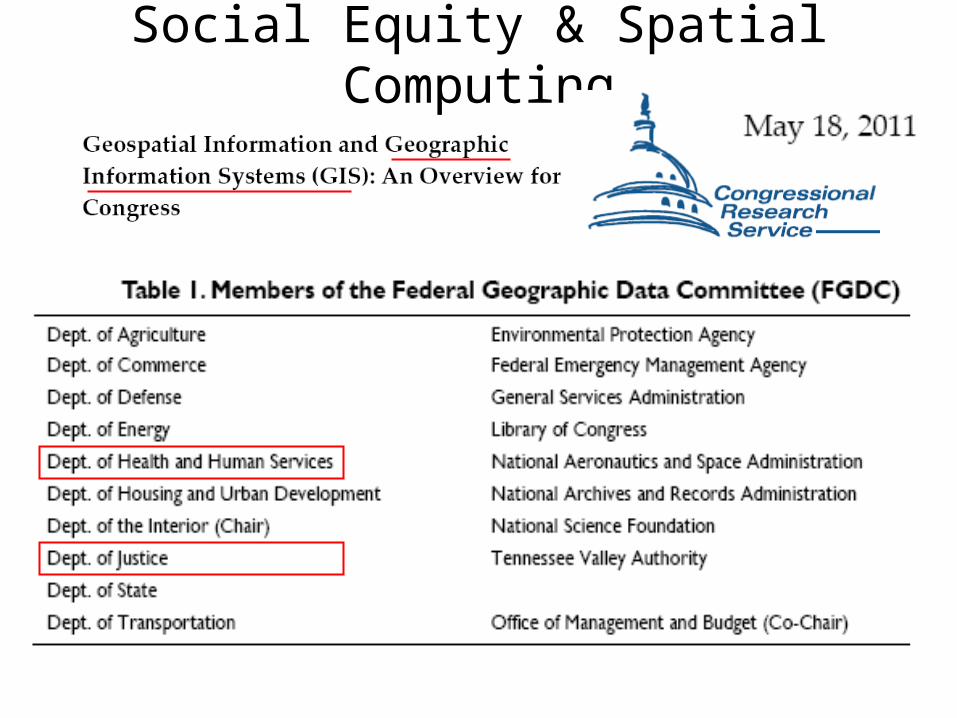
Social Equity & Spatial Computing

Public Health Questions• Sample Local Questions from Epidemiology [TerraSeer]
– What’s overall pattern of colorectal cancer?– Is there clustering of high colorectal cancer incidence anywhere in the study area?– Where is colorectal cancer risk significantly elevated?– Where are zones of rapid change in colorectal cancer incidence?
Geographic distribution of male colorectal cancer in Long Island, New York (Courtesy: TerraSeer)
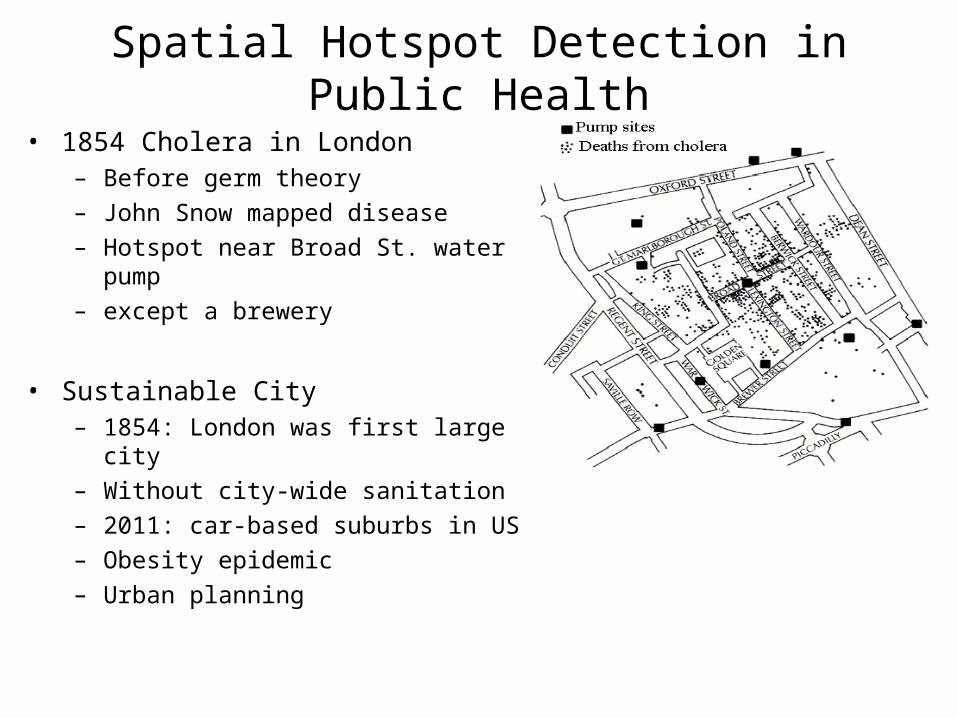
Spatial Hotspot Detection in Public Health
• 1854 Cholera in London– Before germ theory
– John Snow mapped disease
– Hotspot near Broad St. water pump
– except a brewery
• Sustainable City– 1854: London was first large city
– Without city-wide sanitation
– 2011: car-based suburbs in US
– Obesity epidemic
– Urban planning
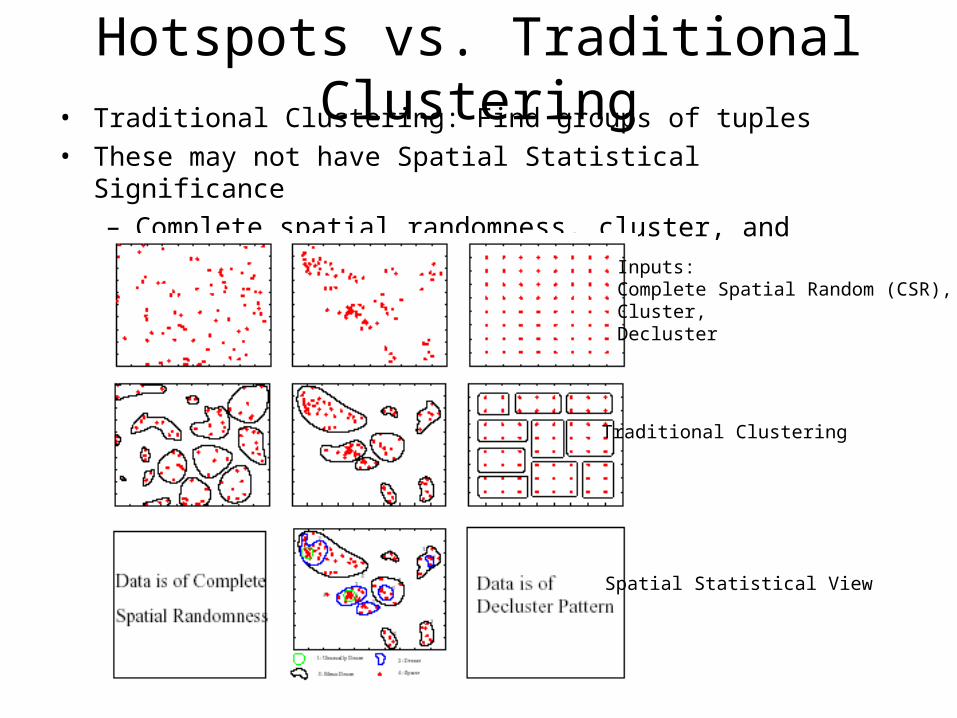
Hotspots vs. Traditional Clustering• Traditional Clustering: Find groups of tuples• These may not have Spatial Statistical Significance
– Complete spatial randomness, cluster, and decluster
Inputs: Complete Spatial Random (CSR),Cluster,Decluster
Traditional Clustering
Spatial Statistical View
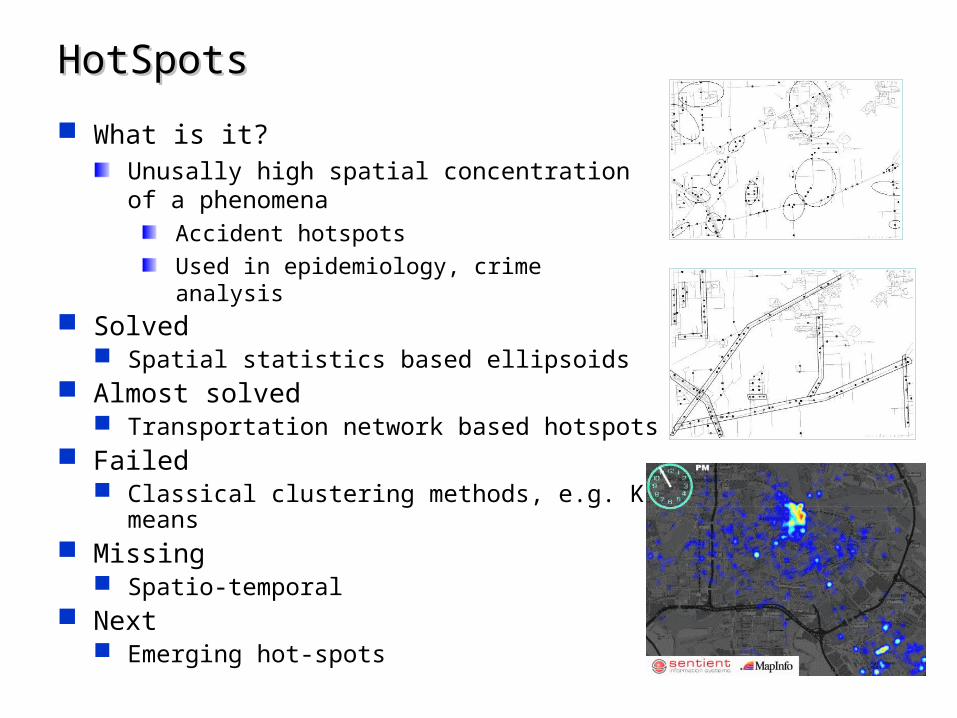
HotSpotsHotSpots
What is it?Unusally high spatial concentration of a phenomena
Accident hotspots
Used in epidemiology, crime analysis Solved
Spatial statistics based ellipsoids Almost solved
Transportation network based hotspots Failed
Classical clustering methods, e.g. K-means Missing
Spatio-temporal Next
Emerging hot-spots
Intersecting Spatial-Computing & Sustainability
• Spatial location bring rich context using other GIS layers
• Sustainability-Sciences
• Sustainable Development
– Economy
– Society
– Environment
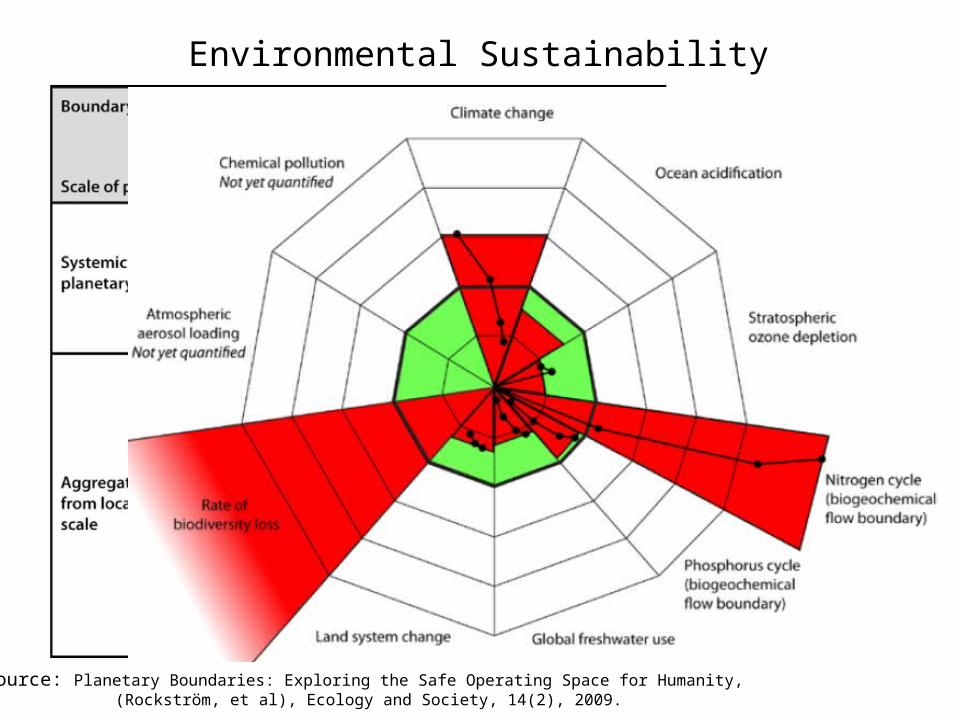
Environmental Sustainability
Source: Planetary Boundaries: Exploring the Safe Operating Space for Humanity, (Rockström, et al), Ecology and Society, 14(2), 2009.
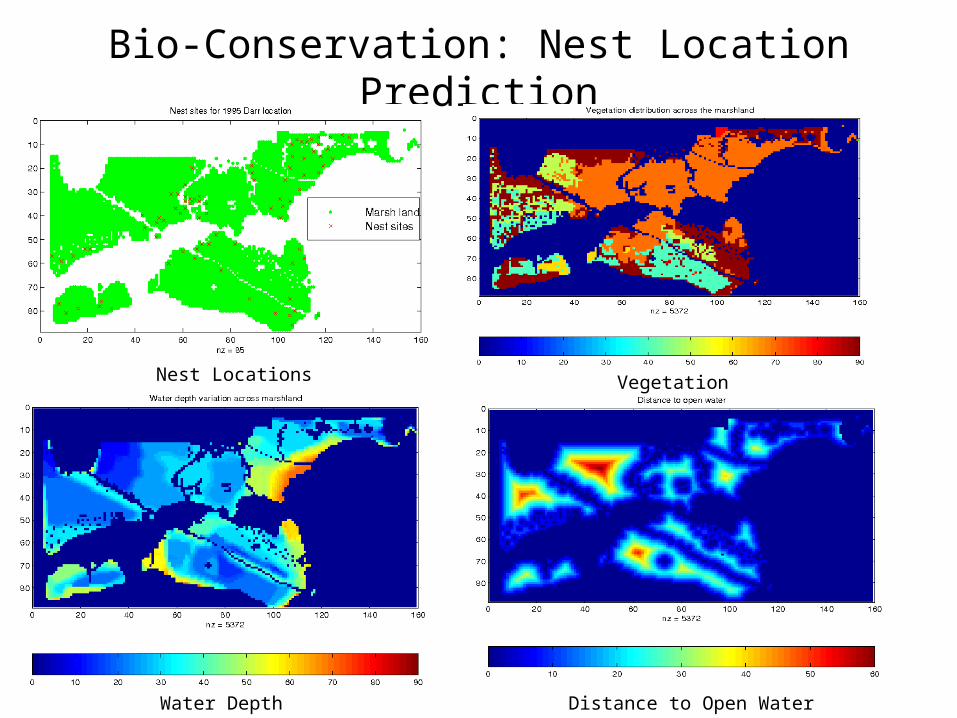
Bio-Conservation: Nest Location Prediction
Nest Locations Vegetation
Water Depth Distance to Open Water
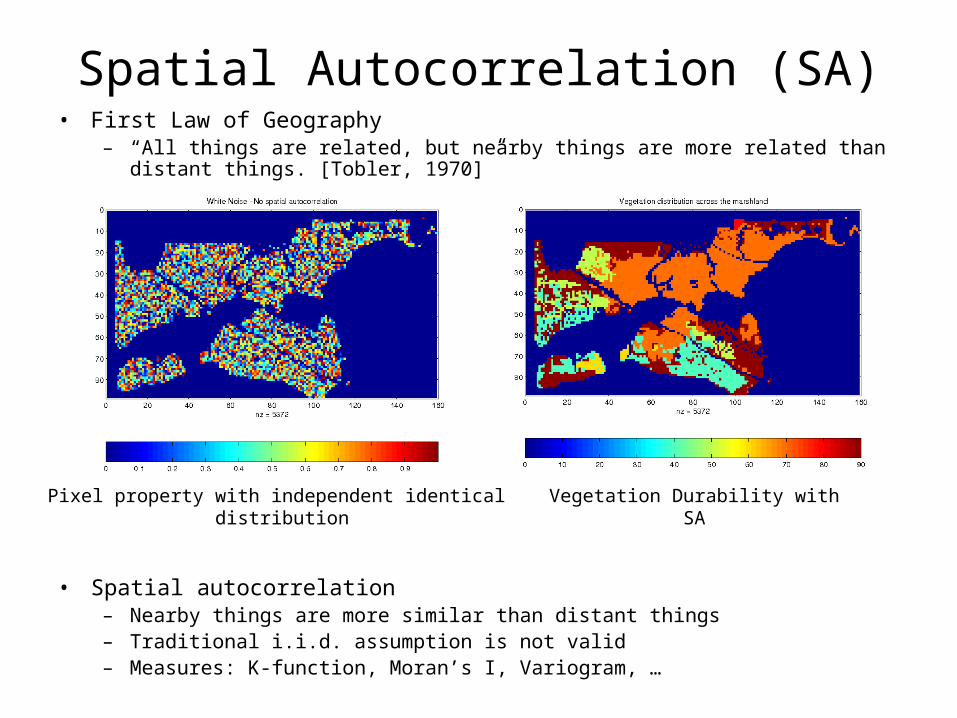
Spatial Autocorrelation (SA)• First Law of Geography
– “All things are related, but nearby things are more related than distant things. [Tobler, 1970]”
• Spatial autocorrelation– Nearby things are more similar than distant things– Traditional i.i.d. assumption is not valid– Measures: K-function, Moran’s I, Variogram, …
Pixel property with independent identical distribution
Vegetation Durability with SA
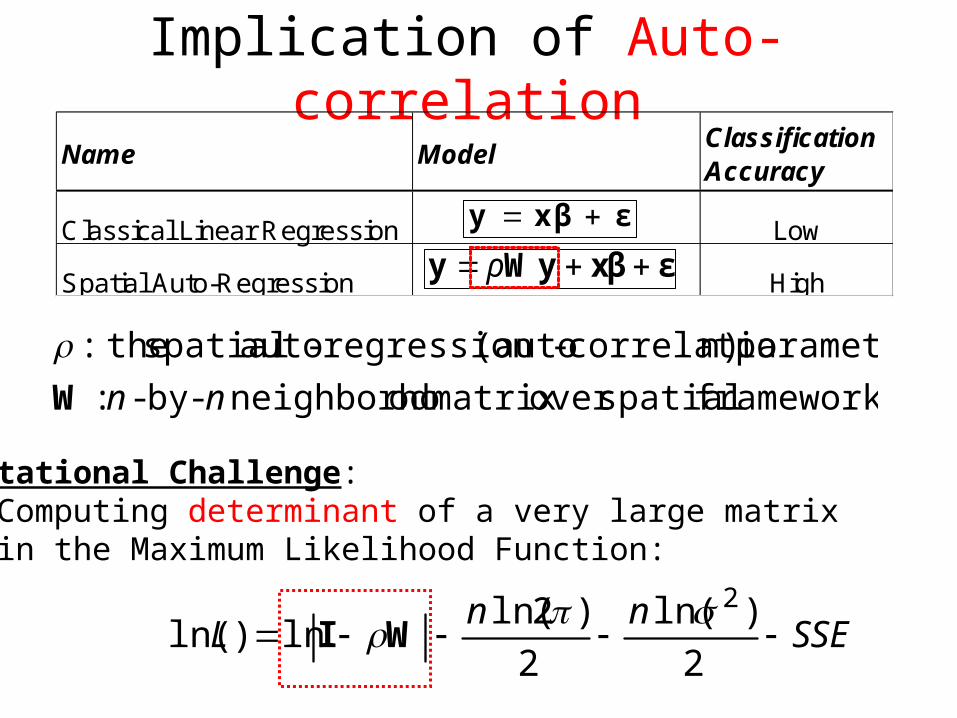
Implication of Auto-correlation
Classical Linear Regression Low
Spatial Auto-Regression High
Name ModelClassification Accuracy
εx βy
εxβWyy ρ
framework spatialover matrix odneighborho -by- :
parameter n)correlatio-(auto regression-auto spatial the:
nnW
SSEnn
L 2
)ln(
2
)2ln(ln)ln(
2WI
Computational Challenge: Computing determinant of a very large matrix in the Maximum Likelihood Function:
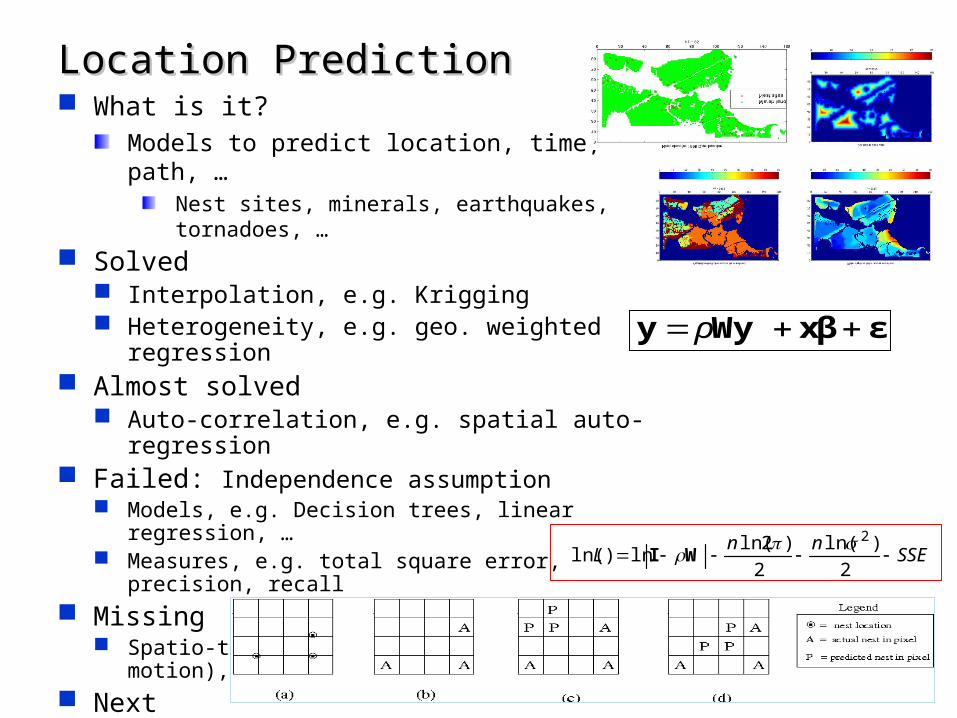
Location PredictionLocation Prediction What is it?
Models to predict location, time, path, …Nest sites, minerals, earthquakes, tornadoes, …
Solved Interpolation, e.g. Krigging Heterogeneity, e.g. geo. weighted regression
Almost solved Auto-correlation, e.g. spatial auto-regression
Failed: Independence assumption Models, e.g. Decision trees, linear regression, … Measures, e.g. total square error, precision, recall
Missing Spatio-temporal vector fields (e.g. flows, motion), physics
Next Scalable algorithms for parameter estimation Distance based errors
εxβWyy ρ
SSEnn
L 2
)ln(
2
)2ln(ln)ln(
2WI

Summary
• Spatial Computing is critical for sustainability– Sustainability-Sciences: Fourth Paradigm– Sustainable Development
• Economy, e.g. eco-routing• Society, e.g. public health• Environment, e.g. conservation
• New spatial computing challenges– Eco-routing– Emerging hotspot– Auto-correlation– Non-stationarity– …
IGERT: Non-equilibrium dynamics across space and time: a common approach for
engineers, earth scientists, and ecologists
PI: S. Shekhar University of Minnesota
Fall 2005 – Summer 2012.
Sponsor: NSF
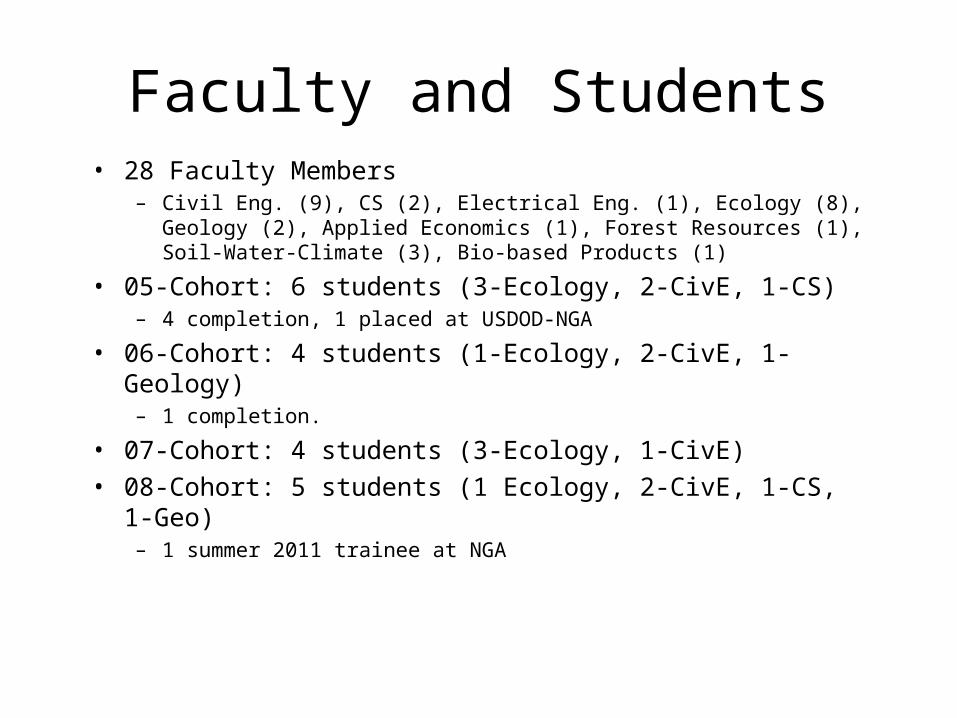
Faculty and Students• 28 Faculty Members
– Civil Eng. (9), CS (2), Electrical Eng. (1), Ecology (8), Geology (2), Applied Economics (1), Forest Resources (1), Soil-Water-Climate (3), Bio-based Products (1)
• 05-Cohort: 6 students (3-Ecology, 2-CivE, 1-CS)– 4 completion, 1 placed at USDOD-NGA
• 06-Cohort: 4 students (1-Ecology, 2-CivE, 1-Geology)– 1 completion.
• 07-Cohort: 4 students (3-Ecology, 1-CivE)• 08-Cohort: 5 students (1 Ecology, 2-CivE, 1-CS, 1-Geo)
– 1 summer 2011 trainee at NGA
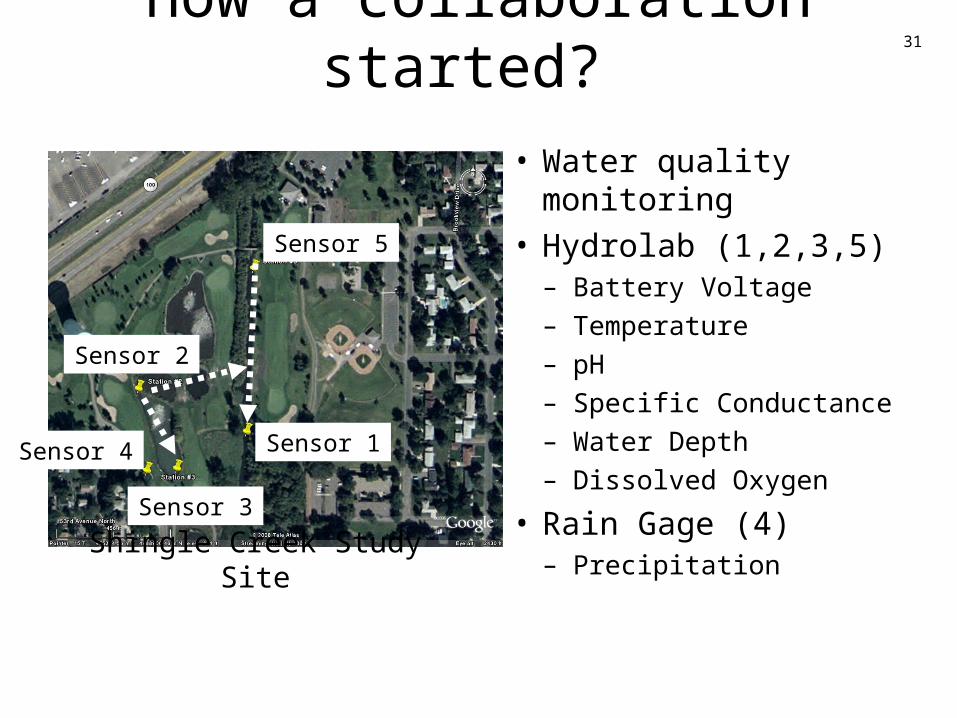
How a collaboration started?
• Water quality monitoring• Hydrolab (1,2,3,5)
– Battery Voltage– Temperature– pH– Specific Conductance– Water Depth– Dissolved Oxygen
• Rain Gage (4)– Precipitation
Sensor 5
Sensor 1
Sensor 2
Sensor 4
Sensor 3
31
Shingle Creek Study Site
What is Interdisciplinary Research?
• Is it multiple Disciplines working on a single project?• Is it one discipline helping another? • My Thoughts:
– Ideally: Perform research that enhances all disciplines involved.• Not just a subset!
– Very Hard To Do!!!– A lot of asking questions back and forth
32

Communication Barriers
• Language & terminology differences• Goal differences• Mis-understanding of what each discipline really is
– e.g., “I thought Civil Eng. was all about building bridges!”– e.g., “I thought Computer Sc. was all about programming!”
• Break down barriers– Keep talking to each other and have an open mind when
discussing each others interest
33
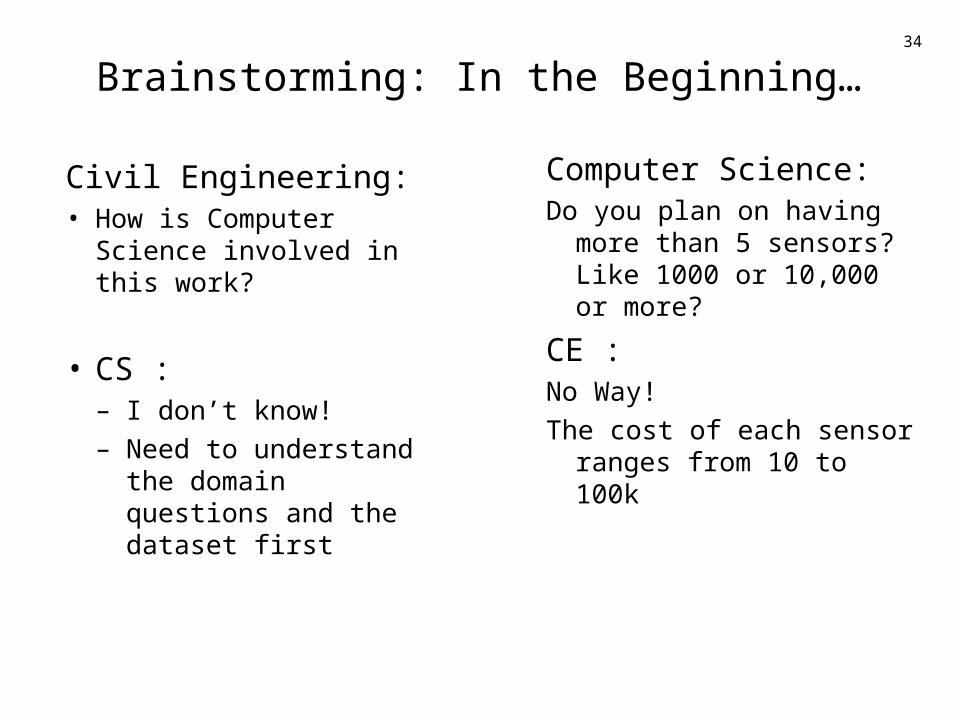
Brainstorming: In the Beginning…
Civil Engineering:• How is Computer Science
involved in this work?
• CS :– I don’t know!– Need to understand the
domain questions and the dataset first
34
Computer Science:Do you plan on having more
than 5 sensors? Like 1000 or 10,000 or more?
CE :No Way!
The cost of each sensor ranges from 10 to 100k
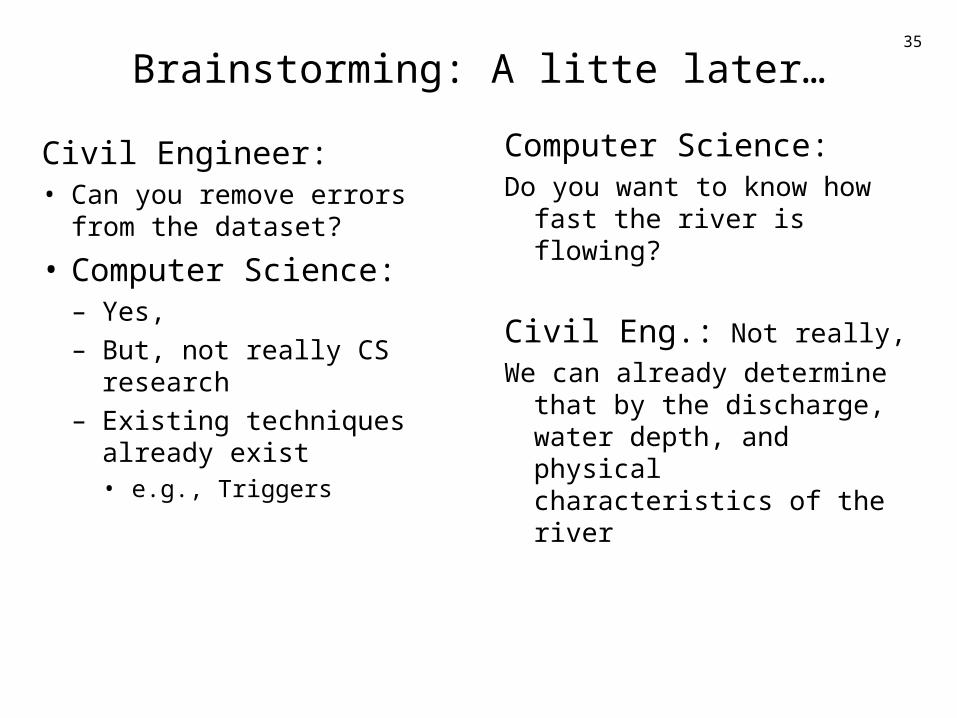
Brainstorming: A litte later…
Civil Engineer:• Can you remove errors from
the dataset?
• Computer Science:– Yes,– But, not really CS research– Existing techniques already
exist• e.g., Triggers
35
Computer Science:Do you want to know how fast the
river is flowing?
Civil Eng.: Not really,
We can already determine that by the discharge, water depth, and physical characteristics of the river
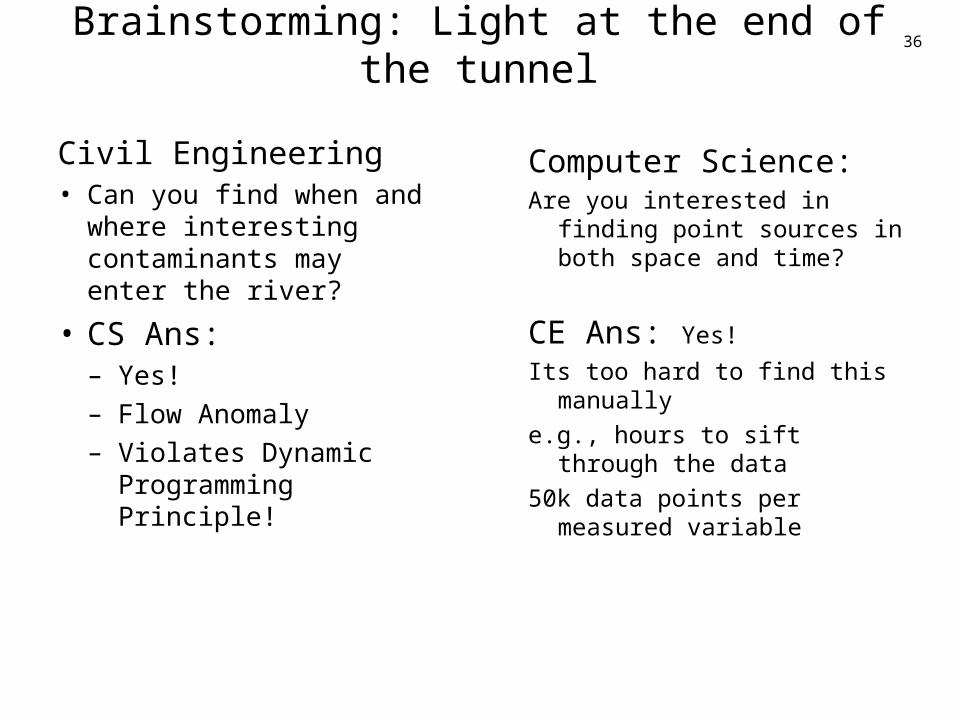
Brainstorming: Light at the end of the tunnel
Civil Engineering• Can you find when and
where interesting contaminants may enter the river?
• CS Ans:– Yes! – Flow Anomaly– Violates Dynamic
Programming Principle!
36
Computer Science:Are you interested in finding point
sources in both space and time?
CE Ans: Yes!
Its too hard to find this manually
e.g., hours to sift through the data
50k data points per measured variable
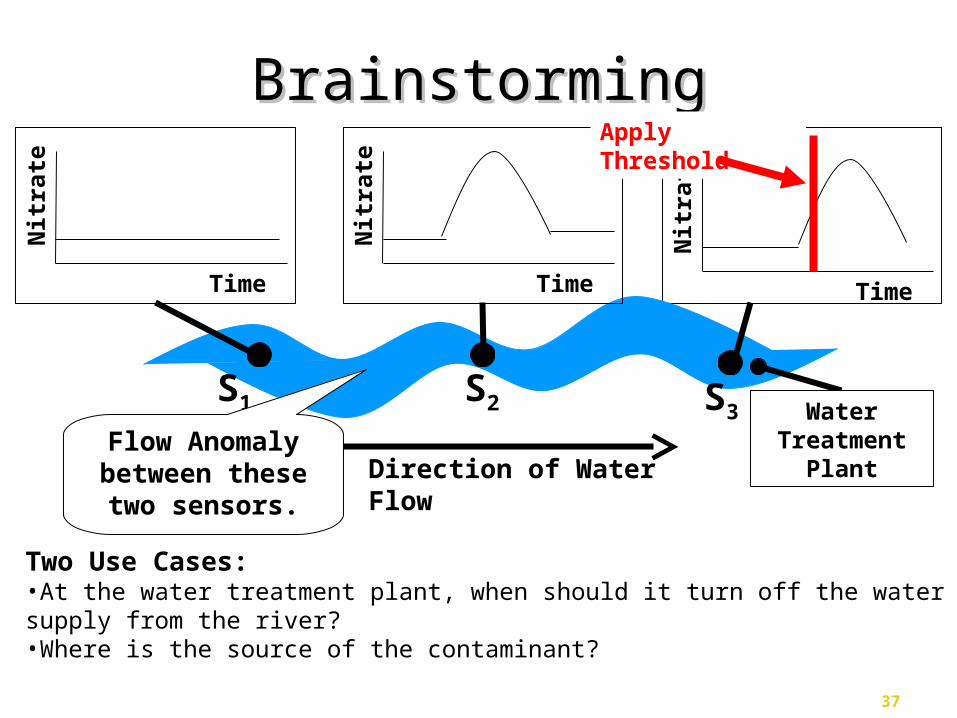
BrainstormingBrainstorming
37
Time
Nit
rate
Time
Nit
rate
Time
Nit
rate
Two Use Cases:•At the water treatment plant, when should it turn off the water supply from the river?•Where is the source of the contaminant?
Apply Threshold
S1 S2 S3
Direction of Water FlowFlow Anomaly
between these two sensors.
Water Treatment
Plant
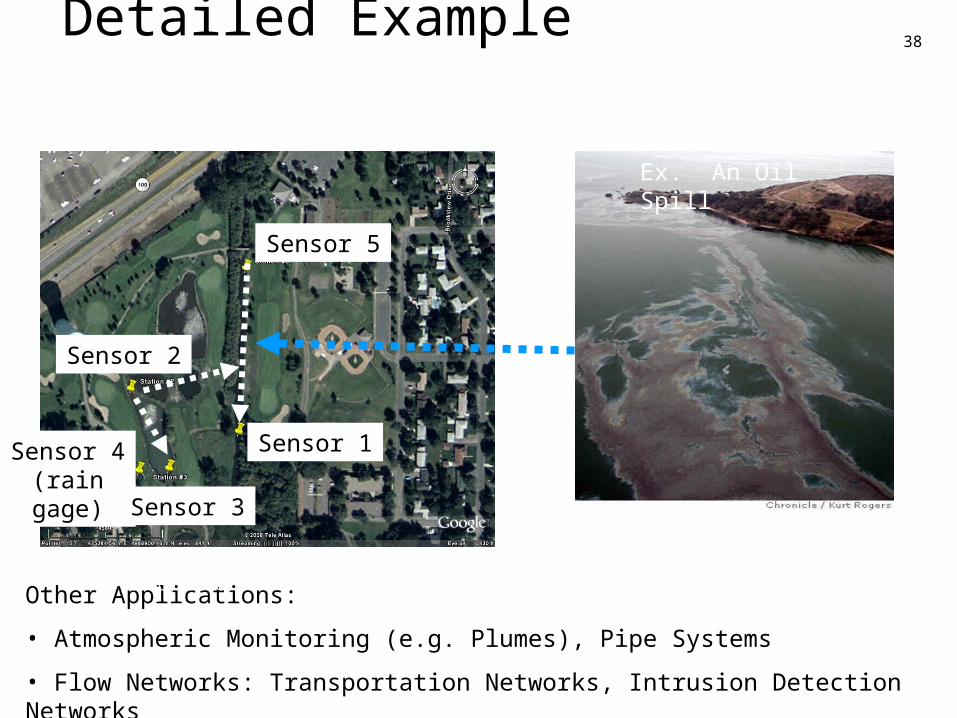
38
Detailed Example events between sensors?
Sensor 5
Sensor 1
Sensor 2
Sensor 4 (rain gage) Sensor 3
Other Applications:
• Atmospheric Monitoring (e.g. Plumes), Pipe Systems
• Flow Networks: Transportation Networks, Intrusion Detection Networks
Ex. An Oil Spill
(Source: http://www.sfgate.com/cgi-bin/news/oilspill/busan)
(Source: Shingle Creek, MN Study Site)
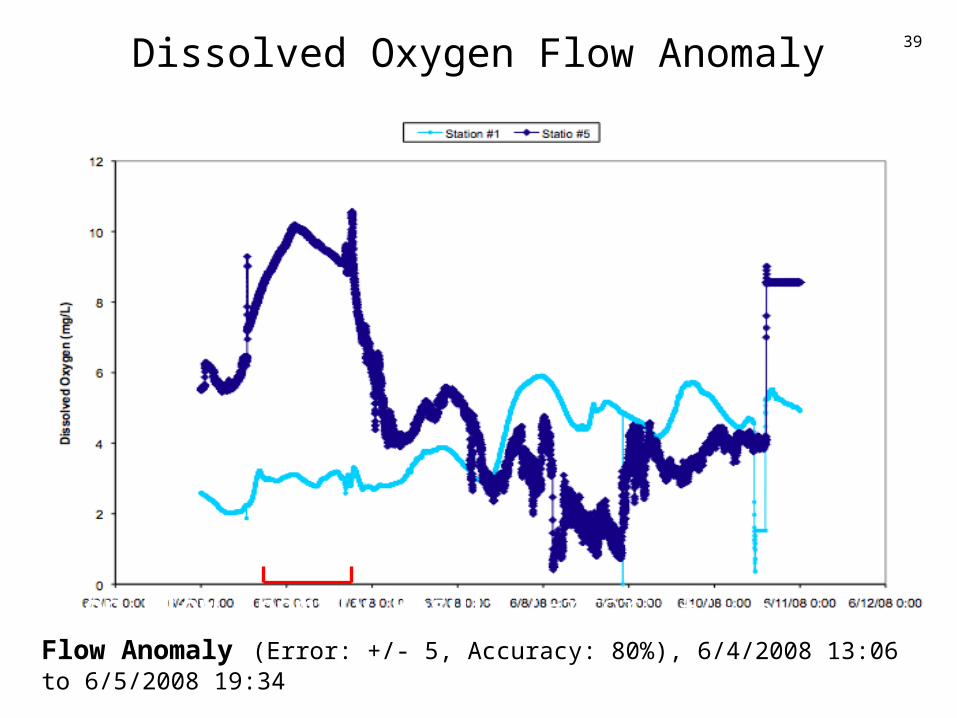
Dissolved Oxygen Flow Anomaly
Top Flow Anomaly Result (Error: +/- 5, Accuracy: 80%)Start: 6/4/2008 13:06 End: 6/5/2008 19:34
39
Flow Anomaly (Error: +/- 5, Accuracy: 80%), 6/4/2008 13:06 to 6/5/2008 19:34

Lessons Learned
• Interdisciplinary Research is HARD• Hardest part is trying to understand the other domain• Crucial that both sides understand each other before
research can begin• A lot of trial and error between both sides• Once an “Ah-ha” moment occurs
– The number of opportunities can be unlimited!
40