sustainable city practices
DESCRIPTION
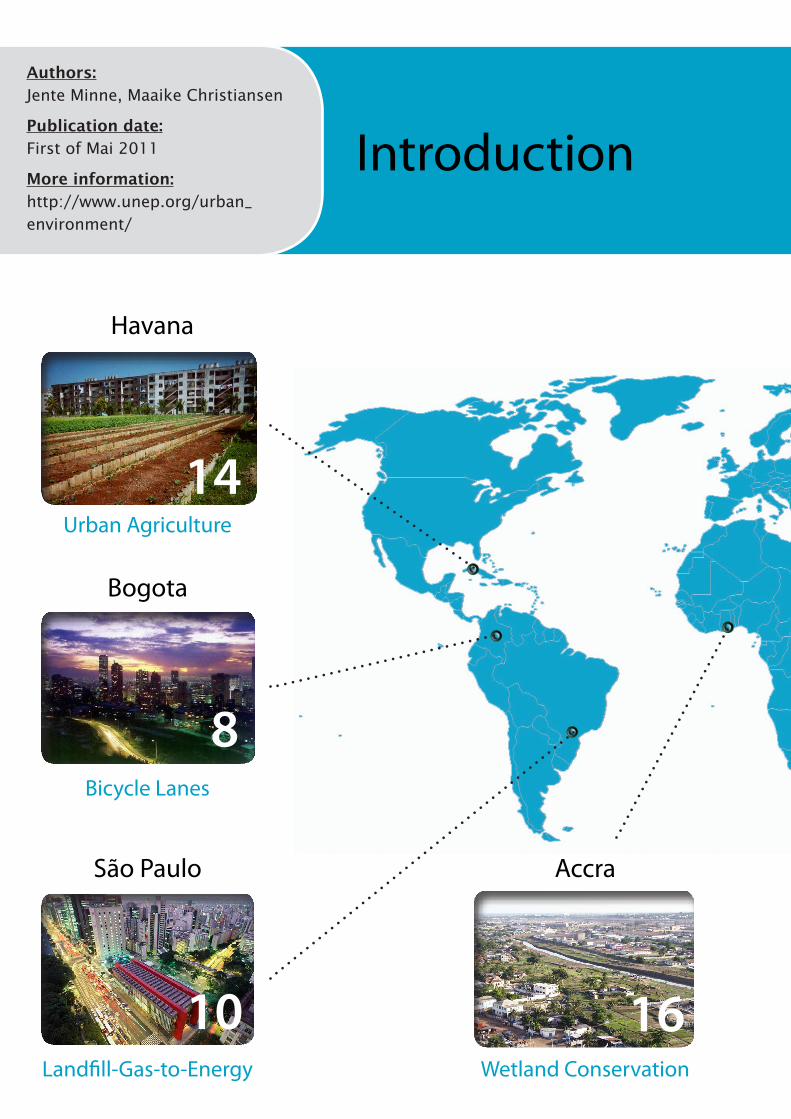
This report contains 8 succesfull cases of sustainable urban planning, highlighting the ecological, social and economical benefits as well as the lessons learnt and the replicability of the cases. This report is the result of a co-operation with the UNEP Urban programme of the Division of Technology, Industry and Economics, in Paris.TRANSCRIPT

Sustainable City Practices
Eight Examples of Sustainable Urban Planning
São Paulo
Landfill-Gas-to-Energy
Introduction
Authors: Jente Minne, Maaike Christiansen
Publication date:
First of Mai 2011
More information:
http://www.unep.org/urban_environment/
Bogota
Bicycle Lanes
8
Wetland Conservation
Havana
Urban Agriculture
Accra
10
14
16

Guanghzou
Renewable Energy
Urban Transport
Jakarta
Motorcycle Restrictions
This report contains 8 succesfull cases of sustainable urban planning, highlighting the ecological, social and economical benefits as well as the lessons learnt and the replicability of the cases.
This report is the result of a co-operation
with the UNEP Urban programme of the
Division of Technology, Industry and
Economics, in Paris.
Rationalized Water Use
6
Singapore
Rhizao
4
12
18

4 Rizhao’s achievements highlight the great potential for local government policy and legislation to achieve major changes within 15 years.
City ProfileRizhao, which means city of Sunshine, is a city located in the Shandong Province in Northern China. It had a population of 3 million inhabitants in 2010. Shandong Province has an average GDP per capita of US$ 4,700 (HKTDC, 2010). The city is rich in mineral resources such as silver, copper, asbestos, granite and gold. The proven gold ore reserves in Rizhao exceeded 88,600 tonnes in 2009.
Rizhao’s major industries are metallurgy, agricultural and aquatic products processing, petrochemicals, chemicals and textiles. In 2009, the city produced 9.9 million tonnes of steel and 9.6 million tonnes of steel-related products. However, port-related industries have also experienced rapid growth. In 2009, Cargo trade grew by 20.1 per cent year on year, while container traffic saw an increase of 15.9 per cent year on year. Extensive efforts by Mayor Lizhaoqian have improved the city’s air quality and Rizhao achieved a ranking under the top ten cities in China with the cleanest air. Additionally, the Chinese Ministry of Environmental Protection nominated the city a National Role Model City in 2005. In June 2007, Rizhao was awarded the World Clean Energy Award by the Transatlantic 21 Association.
Highlights and key aspects of the implementationRizhao was among the first four cities in the world joining the UNEP Climate Neutral Network to become climate neutral.Since 2001, Mayor Lizhaoqian and the Rizhao Municipal Government have adopted several measures and policies aimed at promoting and mainstreaming clean energy technologies, in particular solar. These focused on a) subsidies in Research and Development (R&D) to increase efficiency of solar powered appliances, such as solar water heaters and b) new regulatory instruments requiring the implementation of solar powered technologies in the construction sector
to create demand and thus lower the costs of clean technology products. Particularly the integration of solar water heaters in new buildings was a key component. The Shandong provincial government was innovative in the way they provided subsidies by funding the R&D activities of the local solar water heater industry instead of funding the end users. Since 2007, the local government has been able to reduce the cost of solar water heaters to electric alternatives, while offering energy cost-saving opportunities to the end-user. The government has also promoted solar energy by using it for public purposes as for traffic signals, streetlights and lighting in city schools.
Furthermore, awareness programmes were set up by the local government that focus on solar energy. A series of publicity activities were undertaken to promote energy efficiency in buildings, such as solar energy products exhibitions that guide and promote the use of solar energy products. Awareness campaigns were mainly targeted at real estate developers and residents. Under Li Zhaoqian’s leadership, a new rural community project implemented methane or marsh gas, which was extracted from farm wastewater and used to generate electricity. Rural households were able to extract up to 230,000 cubic meters of gas on a daily basis. The adoption of this new technology was encouraged by the government through subsidies and resulted in the uptake of marsh gas energy by 15,000 farms in 2007.
Results and impactsSince 2007, 99 per cent of the households in the central districts use solar water heaters and more than 30 per cent do so in the outlying villages, resulting in 560,000 m² of solar water heating panels, most of them installed on walls (French and Webb, 2009).Almost all traffic signals, street lights and park illuminations are powered by photovoltaic solar cells and 6,000 households have adopted solar cooking facilities.
Country: China
Population: 2.8 million (2010)
GDP/capita: US$ 4,700 (2010)
Density: 527 inhabitants/km²
Climate zone: Humid Monsoon Climate
RhizaoPolicy instruments: Construction Regulations
Economic instruments: Financial incentives, in particular Research and Development (R&D) funding of the local solar industry
Education instruments: Exhibitions of solar products and awareness campaigns
5- 3,250,000 tonnes of C02 reduction and 21,300 tonnes of SO
2 reduction
- Cost reductions and health benefits for 1.5 million residents
Recommended Literature:
Kick the HabitA UN Guide to Climate Neutrality (2008)
http://sn.im/unep_urban1
Additionally, more than 60,000 greenhouses are heated by solar panels in the Rizhao municipal (World Clean Energy Awards, 2007).
The uptake of solar power on a large scale has effectively reduced conventional coal derived electricity usage by 348 million kilowatt-hours (kWh) per year, while the 32 installed marsh gas generating units resulted in an annual generating capacity that exceeds 90 million kWh. It has been estimated that, through this efforts, Rizhao’s CO2 emissions can be reduced by 3,250,000 tonnes, SO2 by 21,300 tonnes, and ash dust by 20,000 tonnes (World Clean Energy Awards, 2007).
The city’s new policies and regulations have helped to create new technologies, companies and jobs, improving economic status of its inhabitants, their quality of life and their living environment. The projects have notably reduced the yearly energy costs of more than 1.5 million residents (World Clean Energy Awards, 2007).
The popularisation and wide spread use of solar energy and marsh gas have strengthened the awareness of sustainable development in Rizhao’s society. This, in turn, has also promoted the development and use of geothermal energy and wind energy. As a result, energy shortages have been alleviated and resources for the sustainable development of the city have been strengthened. The well-received publicity and educational campaigns have enhanced public understanding of clean energy. This is important since the increased use of sustainable energy will depend on the awareness and acceptance of the consumers (World Clean Energy Awards, 2007).
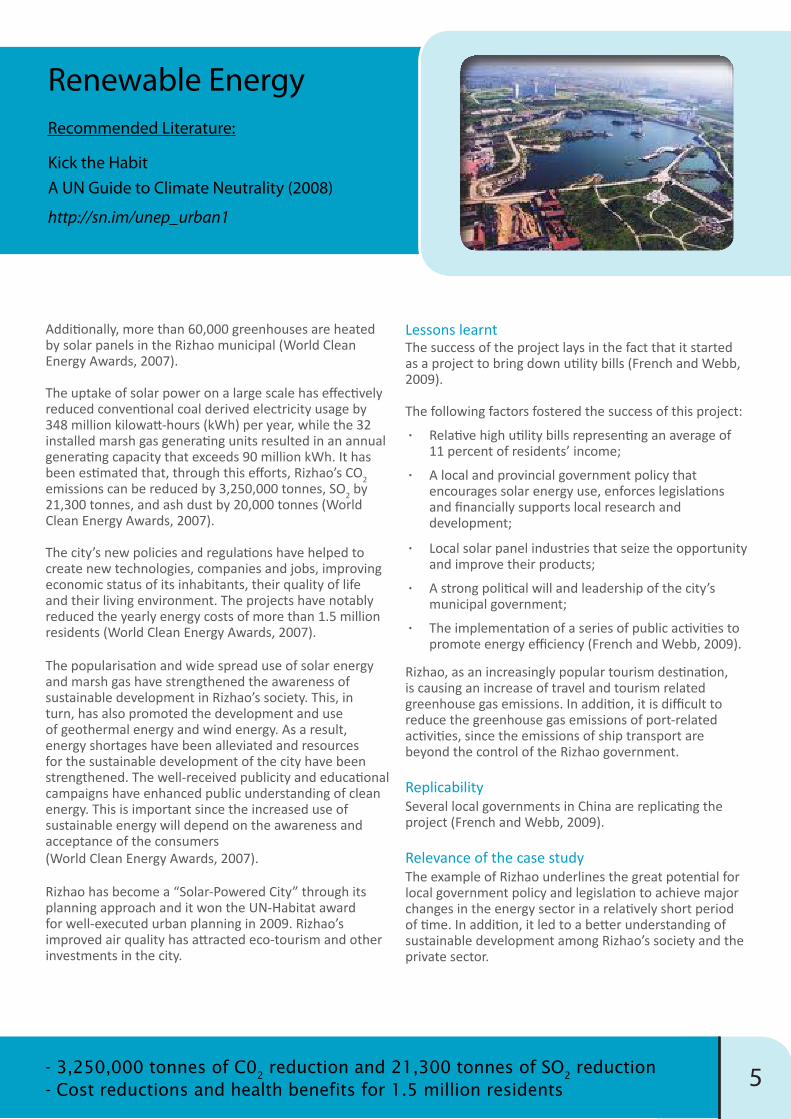
Rizhao has become a “Solar-Powered City” through its planning approach and it won the UN-Habitat award for well-executed urban planning in 2009. Rizhao’s improved air quality has attracted eco-tourism and other investments in the city.
Lessons learntThe success of the project lays in the fact that it started as a project to bring down utility bills (French and Webb, 2009).
The following factors fostered the success of this project:
• Relative high utility bills representing an average of 11 percent of residents’ income;
• A local and provincial government policy that encourages solar energy use, enforces legislations and financially supports local research and development;
• Local solar panel industries that seize the opportunity and improve their products;
• A strong political will and leadership of the city’s municipal government;
• The implementation of a series of public activities to promote energy efficiency (French and Webb, 2009).
Rizhao, as an increasingly popular tourism destination, is causing an increase of travel and tourism related greenhouse gas emissions. In addition, it is difficult to reduce the greenhouse gas emissions of port-related activities, since the emissions of ship transport are beyond the control of the Rizhao government.
ReplicabilitySeveral local governments in China are replicating the project (French and Webb, 2009).
Relevance of the case studyThe example of Rizhao underlines the great potential for local government policy and legislation to achieve major changes in the energy sector in a relatively short period of time. In addition, it led to a better understanding of sustainable development among Rizhao’s society and the private sector.
Renewable Energy
6
City ProfileJakarta is located on the northwest coast of Java Island, at the mouth of the Ciliwung River. As the capital of Indonesia, it dominates Indonesian’s administrative, economic and cultural activities and it is a major commercial and transportation hub within Asia.
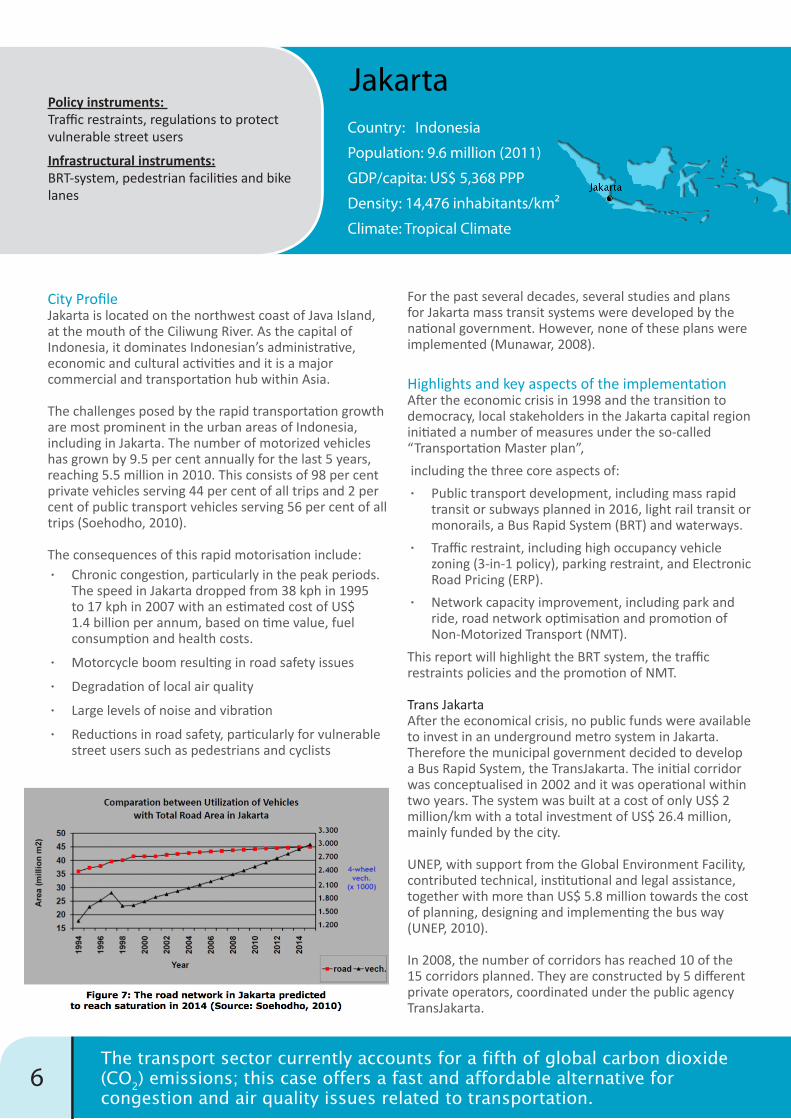
The challenges posed by the rapid transportation growth are most prominent in the urban areas of Indonesia, including in Jakarta. The number of motorized vehicles has grown by 9.5 per cent annually for the last 5 years, reaching 5.5 million in 2010. This consists of 98 per cent private vehicles serving 44 per cent of all trips and 2 per cent of public transport vehicles serving 56 per cent of all trips (Soehodho, 2010).
The consequences of this rapid motorisation include:• Chronic congestion, particularly in the peak periods.
The speed in Jakarta dropped from 38 kph in 1995 to 17 kph in 2007 with an estimated cost of US$ 1.4 billion per annum, based on time value, fuel consumption and health costs.
• Motorcycle boom resulting in road safety issues
• Degradation of local air quality
• Large levels of noise and vibration
• Reductions in road safety, particularly for vulnerable street users such as pedestrians and cyclists
For the past several decades, several studies and plans for Jakarta mass transit systems were developed by the national government. However, none of these plans were implemented (Munawar, 2008).
Highlights and key aspects of the implementationAfter the economic crisis in 1998 and the transition to democracy, local stakeholders in the Jakarta capital region initiated a number of measures under the so-called “Transportation Master plan”,
including the three core aspects of:
• Public transport development, including mass rapid transit or subways planned in 2016, light rail transit or monorails, a Bus Rapid System (BRT) and waterways.
• Traffic restraint, including high occupancy vehicle zoning (3-in-1 policy), parking restraint, and Electronic Road Pricing (ERP).
• Network capacity improvement, including park and ride, road network optimisation and promotion of Non-Motorized Transport (NMT).
This report will highlight the BRT system, the traffic restraints policies and the promotion of NMT.
Trans Jakarta After the economical crisis, no public funds were available to invest in an underground metro system in Jakarta. Therefore the municipal government decided to develop a Bus Rapid System, the TransJakarta. The initial corridor was conceptualised in 2002 and it was operational within two years. The system was built at a cost of only US$ 2 million/km with a total investment of US$ 26.4 million, mainly funded by the city.
UNEP, with support from the Global Environment Facility, contributed technical, institutional and legal assistance, together with more than US$ 5.8 million towards the cost of planning, designing and implementing the bus way (UNEP, 2010).
In 2008, the number of corridors has reached 10 of the 15 corridors planned. They are constructed by 5 different private operators, coordinated under the public agency TransJakarta.
Country: Indonesia
Population: 9.6 million (2011)
GDP/capita: US$ 5,368 PPP
Density: 14,476 inhabitants/km²
Climate: Tropical Climate
JakartaPolicy instruments: Traffic restraints, regulations to protect vulnerable street users
Infrastructural instruments:BRT-system, pedestrian facilities and bike lanes
The transport sector currently accounts for a fifth of global carbon dioxide (CO
2) emissions; this case offers a fast and affordable alternative for
congestion and air quality issues related to transportation.

7
Recommended Literature:
Air Quality Management Toolbookhttp://sn.im/unep_urban53 (Handbook)http://sn.im/unep_urban53b (Toolkit)
Traffic Restraints and the 3-in-1 Scheme Jakarta has also implemented traffic restraints policies, such as the 3-in-1 Scheme. This allows only vehicles with three or more passengers to enter the restricted areas. Because of enforcement issues explained further in the text, this policy is replaced by Electronic Road Pricing (ERP), a road toll system in cities. ERP has been implemented in other parts of the world, including Singapore and London, mainly to reduce congestion levels.
After the implementation of the ERP, the restricted zone will be expanded to the east west connection. During rush hours, ERP targets cars and motorcycles alike.
Encouragement of the Use of non-motorized vehiclesTraffic safety is a big Issue in Indonesia. In 2007, 87 fatalities per day were measured, resulting in an economic loss of US$ 4.45 billion or 2.91 per cent of its GDP. In order to promote the use of non-motorized vehicles, the national and local government developed regulations, improved pedestrian facilities and bike lines and facilities for disabled persons.
Results and impacts14 per cent of the car users shifted to public transport and the number of bus way passengers increase significantly every year. Each year, bus way operations reduce nitrogen oxide emission by 155 tonnes, particles by 23 tonnes and CO2 emission up to 20,000 tonnes (ITDP, 2010).TransJakarta was the first successful implementation of a the BRT system in Asia, and has brought significant reductions in travel time across the city, there is a potential of 26 minutes of savings during off peak periods and 59 minutes during peak periods, calculated on a trip from one end of the corridor to the other, being 12.8 kilometres.
The road pricing system is expected to pull out 20 per cent of the traffic from the area and the investment is expected to have a pay off in 4 years. The estimated fuel savings by bus way users amounted to 91 billion Indonesian rupiahs or US$ 100 million in 2009 (UNEP, 2010).
Lessons learntThe Institute for Transportation and Development Policy (ITDP) Indonesia notes that various constraints are holding back the further expansion of BRT. These include imbalances between authority and level of responsibility, weak legal bases, pressure on cost due to a lack of competitive bidding, limited infrastructure and low level of service quality (ITDP Indonesia, 2010). For instance, the BRT System was designed without exploring its potential demand. The System capacity was only 8,000 Passengers per hour per direction while the demand was around 12,000 Passengers per hour per direction. Building supporting institutions and regulatory structure seemed to be more difficult than physical BRT design issues. (Hook et Ernst, 2005).
With regards to the implementation of the 3-in-1 policy, children were observed earning money by accompanying drivers within the zone. This demonstrates how enforcement of the 3-in-1 policy has experienced some issues and therefore Jakarta decided on switching to an Electronic Road Pricing system.
ReplicabilityJakarta was the first city in Asia to have adopted the BRT system and since then, BRT systems have been successfully implemented in 21 Asian cities in China, Turkey, India, Indonesia, Japan, South Korea and Taiwan (2008).
Relevance of the case studyThis case study highlights the importance of reliable and efficient mass transport in big emerging cities and the ecological, social and economical benefits it offers, e.g. improved air quality, time saving and fuel cost savings.
Urban Transport Upgrade
- A reduction of 120,000 tonnes of CO2 emissions annually
- Improved air quality, faster transportation and economical benefits
8
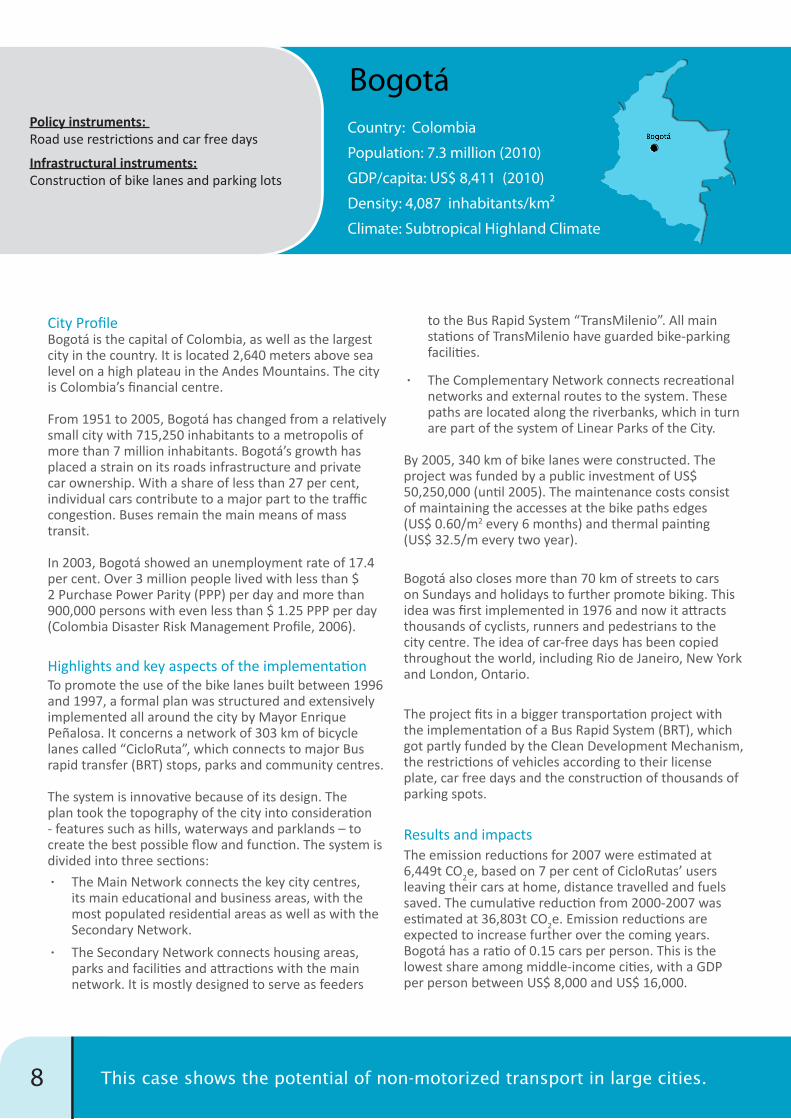
City ProfileBogotá is the capital of Colombia, as well as the largest city in the country. It is located 2,640 meters above sea level on a high plateau in the Andes Mountains. The city is Colombia’s financial centre.
From 1951 to 2005, Bogotá has changed from a relatively small city with 715,250 inhabitants to a metropolis of more than 7 million inhabitants. Bogotá’s growth has placed a strain on its roads infrastructure and private car ownership. With a share of less than 27 per cent, individual cars contribute to a major part to the traffic congestion. Buses remain the main means of mass transit.
In 2003, Bogotá showed an unemployment rate of 17.4 per cent. Over 3 million people lived with less than $ 2 Purchase Power Parity (PPP) per day and more than 900,000 persons with even less than $ 1.25 PPP per day (Colombia Disaster Risk Management Profile, 2006).
Highlights and key aspects of the implementationTo promote the use of the bike lanes built between 1996 and 1997, a formal plan was structured and extensively implemented all around the city by Mayor Enrique Peñalosa. It concerns a network of 303 km of bicycle lanes called “CicloRuta”, which connects to major Bus rapid transfer (BRT) stops, parks and community centres.
The system is innovative because of its design. The plan took the topography of the city into consideration - features such as hills, waterways and parklands – to create the best possible flow and function. The system is divided into three sections:
• The Main Network connects the key city centres, its main educational and business areas, with the most populated residential areas as well as with the Secondary Network.
• The Secondary Network connects housing areas, parks and facilities and attractions with the main network. It is mostly designed to serve as feeders
to the Bus Rapid System “TransMilenio”. All main stations of TransMilenio have guarded bike-parking facilities.
• The Complementary Network connects recreational networks and external routes to the system. These paths are located along the riverbanks, which in turn are part of the system of Linear Parks of the City.
By 2005, 340 km of bike lanes were constructed. The project was funded by a public investment of US$ 50,250,000 (until 2005). The maintenance costs consist of maintaining the accesses at the bike paths edges (US$ 0.60/m2 every 6 months) and thermal painting (US$ 32.5/m every two year).
Bogotá also closes more than 70 km of streets to cars on Sundays and holidays to further promote biking. This idea was first implemented in 1976 and now it attracts thousands of cyclists, runners and pedestrians to the city centre. The idea of car-free days has been copied throughout the world, including Rio de Janeiro, New York and London, Ontario.
The project fits in a bigger transportation project with the implementation of a Bus Rapid System (BRT), which got partly funded by the Clean Development Mechanism, the restrictions of vehicles according to their license plate, car free days and the construction of thousands of parking spots.
Results and impactsThe emission reductions for 2007 were estimated at 6,449t CO2e, based on 7 per cent of CicloRutas’ users leaving their cars at home, distance travelled and fuels saved. The cumulative reduction from 2000-2007 was estimated at 36,803t CO2e. Emission reductions are expected to increase further over the coming years. Bogotá has a ratio of 0.15 cars per person. This is the lowest share among middle-income cities, with a GDP per person between US$ 8,000 and US$ 16,000.
Country: Colombia
Population: 7.3 million (2010)
GDP/capita: US$ 8,411 (2010)
Density: 4,087 inhabitants/km²
Climate: Subtropical Highland Climate
BogotáPolicy instruments: Road use restrictions and car free days
Infrastructural instruments: Construction of bike lanes and parking lots
This case shows the potential of non-motorized transport in large cities.

9
Recommended Literature:
Planning and Implementation of Campaigns to Promote Bicycle Use in Latin American Countries
http://sn.im/unep_urban30
Model Results (source: C40 cities)Year Reductions of CO2E (in tonnes)2000 1,688 2001 3,6222002 4,4082003 4,8342004 5,1012005 5,2842006 5,4182007 6,449Cumulative 36,803
This programme is not only successful due to the fact that it has reduced car dependency and associated emissions, but it has also led to a fundamental change of behaviour in the city: In 2000, approximately 2 per cent of people used bikes, while in 2007, this percentage has doubled. In 2005, the CicloRuta facilitated 213,000 trips in the city each day. It was estimated that in 2007, it facilitated over 320,000 trips a day. Over 54 per cent of the homes in the city had bikes and an estimated 83,500 people used bikes daily.
Safety was mentioned as one of the main issues. Since the implementation of CicloRuta, a decrease of deaths relating to bikes was measured from 115 in 2001 to 77 in 2004 and a decrease of injuries of 8.8 per cent - despite the significant increase of bike use.
Another benefit of this project is a saving of US$ 40 million annually on avoided fuel costs for the users, resulting in an average monthly saving of US$ 40 per person (C40 Cities, 2010). The increased use of bicycles also resulted in new job opportunities as: bike parking services, bikes and spare parts and clothing shops and street workers needed for the construction and maintenance of the cycle lanes.
Surveys have shown that more than half of the citizens feel that the restriction of car use and car-free days increase their quality of life. With regard to Bogota’s urban planning strategies, more than 60 per cent of citizens perceived them as favourable to their quality of life;
mainly due to an improved access and recovery of public spaces.
An evaluation of CicloRuta found that adult women who participated frequently in CicloRuta were more likely to be active in their leisure time; in addition, the CicloRuta programme mobilises people across all socio-economic levels (Gomez, 2005). Finally, time saving is also considered as a co-benefit: the bikes mean speed was measured on a 17 km/h, while public non-massive transport runs at an average of 13 km/h.
Lessons learntSome of the challenges the city is still dealing with are: The inadequate evaluation of all of the interventions carried out, also for the normative and educational strategies; the improvement of the quality and design of the existing CicloRutas; and the need of improvement of road security by clearly separating car and bike lanes and improving signalisation (Gomez, 2005).
ReplicabilityThe main success factors of this project are the political will of the local government, the integrated planning and design of the bike lanes and the availability of guarded bike parking facilities in combination with other regulatory measures to promote biking and walking (C40 Cities).
Bogotá has published Design Manuals and Good Environmental Construction Practices Guidelines on its bicycle system to promote replication. The CicloRuta is becoming a popular scheme throughout Colombia and similar projects are planned in the Colombian cities Medellin and Cali. Also, the “Car-free days” have been copied throughout the world, including in New York and Rio de Janeiro.
Relevance of the case studyThis case study shows how rapidly growing cities can take measures to overcome infrastructure, social and ecological problems. Furthermore it highlights the social benefits of investments in green infrastructure as green jobs creation, more social cohesion, income savings and safety improvement.
Extended Cycling System
- A reduction of 36,803 tCO2e from 2000-2007
- A saving of US$ 40 million annually on avoided fuel costs for the public

10
City ProfileSão Paulo is the economic capital and the largest city of Brazil. It grew as a dynamic industrial hub, but its economy evolved in the recent decade towards a service economy. It is a major centre for multinational companies operating in Latin America. São Paulo generates around 12 per cent of the country’s GDP (Siemens, 2010) and it has experienced a massive population explosion over the past century, which has led to rapid and often chaotic urbanisation. The population of the urban agglomerations of Sao Paulo grew from 9.6 million in 1975 to 18.8 million in 2007 (UN Economic & Social affairs 2008).
During the past years, the citizens of Sao Paulo have been producing 15,000 tonnes of waste on a daily basis; with an average of 550 kg of waste per inhabitant per year (Siemens, 2010). While the city’s main landfills, “Bandeirantes” and “Sao Joao”, were reaching their maximum storage capacity, the local government had to deal with environmental concerns over the methane, produced by waste decaying, and complaints by the surrounding communities that wanted the landfills to beclosed down (C40 Cities, 2010).
Highlights and key aspects of the implementation“Bandeirantes” is a landfill site located to the northwest of São Paulo, covering an area of 1.5 km2 (Delbin, 2007). It began operating in 1979 and closed in 2007, receiving around 7,000 tonnes of waste per day (UNFCCC, 2005a). “São Joao” is a smaller landfill site located to the east of the city which received around 7,000 tonnes of waste per day until it was closed in 2009 (UNFCCC, 2005b). Both landfill sites are owned by the Municipality of São Paulo and for each site a municipal bid was held for a 15-year concession contract to develop landfill gas capture projects (Delbin, 2007).
São Paulo City Hall decided to give both of the concession contracts to the holding company Biogás Energia Ambiental S.A. (hereafter Biogás). This allowed them to build the thermoelectric power plants to burn the methane emitted by decaying waste from both of the landfills. Biogás is a joint venture of three private firms.
The cost of the landfill gas collection equipment at “Bandeirantes” was around 1.6 million € (BNamericas, 2004). The cost of the power plant was 12 million € (Caterpillar, 2004). Biogás financed these capital costs (Clapp, 2010).
By following all required procedures to certify the methodology used, it was possible to approve both landfills as Clean Development Mechanism (CDM) projects and to issue tradable Certified Emission Reductions units (CERs). According to the agreement on the concession, 100 per cent of the energy and 50 per cent of the carbon credits produced by the landfills belong to Biogás Co. to be traded in the market, while São Paulo City Hall has the right to sell the other half of the carbon credits in public auctions.
Results and impactsBy capturing and burning the methane gas, the landfills generate 7 per cent of the electricity consumed in the city or 175,000 MW/h in each power plant, which is enough to supply a 600,000 population for 10 years (C40, 2010). The “Bandeirantes” plant is the largest landfill gas recuperation plant in the world.
It was estimated that the “Bandeirantes” and “São Joao “projects would save 1,070,000 tCO2-eq and 820,000 tCO2-eq on average each year, respectively (UNFCCC, 2005a; UNFCCC, 2005b). Most of the emissions reductions come from the avoided emissions of methane gas directly into the atmosphere, which is assumed to have occurred in the absence of the projects due to the current lack of environmental regulations on landfill gas capture in Brazil. The remaining emissions reductions come from the electrical output of the power plants, which is assumed to displace fossil-fuel energy at the margin of the local electricity system.
The auctions of CERs issued for both landfills generated total revenue of 26.8 million € for the Municipality of São Paulo. This money was spent on local waste recovery facilities, waste awareness programmes and the creation of parks and playgrounds for communities in the neighbourhood of the landfill sites.
Country: Brazil
Population: 11.1 million (2010)
GDP/capita: US$ 15,090 (2008)
Density: 7,314 inhabitants/km²
Climate: Subtropical Climate
São PauloPolicy instruments:Public Private Partnership (PPP) management, Clean Development Mechanism (CDM) for financing, revenue spending
Infrastructural instruments: Building of gas collection equipment and power plants
This case illustrates one of the first successful carbon credit trade projects for cities in the world while creating significant social benefits.

11
Recommended Literature:
Closing an Open Dumpsite and Shifting from Open Dumping to Controlled Dumping and to Sanitary Land Fillinghttp://sn.im/unep_urban43
Furthermore, the auctions served to increase general public awareness and transparency regarding the project and the CERs collected.
Co-benefits of the projects include: a reduction of explosion risk at the landfill sites, reduction of odour in the vicinity of the landfill sites, the creation of new jobs during both project implementation and operation, and demonstration of the viability of landfill gas capture technology in the region. “Bandeirantes” was the first landfill gas capture project in Brazil.
Lessons learntThe partnership between the two sectors was especially important to São Paulo as Biogás took responsibility for the project’s costs and risks as well as the legal procedures that involved the CDM approval, a long 4-year process. Biogás was also in charge of finding finances for the project. This was a difficult task since the contract was approved in 2000, when the CDM issue was still incipient and the Kyoto Protocol had not been ratified yet (ICLEI, 2009).
Research prior to the project would have been effective in improving partner relations since negotiations between both parties regarding the distribution of the profits from the carbon credits sale were sometimes very intense (ICLEI, 2009).
For “Bandeirantes”, the cumulative CERs issued are approximately 50 per cent of those projected but still covering 100 per cent of the capital costs. The lower outcome was partly due to settling of the landfill, which caused some concrete wells to break, and poor landfill cover (Terraza et al, 2007).
A better involvement of all the stakeholders in the decision-making process would have fostered a better public acceptance of the project. Decisions about the spending of the money were determined without the involvement of the communities living in the areas surrounding the landfill and favoured environmental projects. Later studies revealed that the community felt disengaged and deprived because they thought their
health, education, housing and public transportation needs were not considered or met with the funds (ICLEI, 2009).
ReplicabilityThe “Bandeirantes” project was the first landfill gas to energy project implemented in Brazil. Its replication potential is high as well in the country as abroad, mainly due to the common problems waste disposal implies and the high amount of organic content in landfills. Another positive impact brought by the initiative is the development and promotion of the technology used for landfill gas capture and destruction through flaring and electricity generation. Biogás currently participates in another project with the same aims, located in the state of Rio de Janeiro at the Gramacho Landfill (ICLEI, 2009).
The main difficulty is to find (private) investors who are prepared to make the initial investment. The development and approval of the CDM methodology and the success of this project can help to convince other investors since it reduces significantly the costs and risks of future projects, as well as the time of the CDM methodology approval.
Relevance of the case studyThis case shows how the CDM can be useful for cities as well as the private sector to foster economic profits while improving the social and ecological situation of a city. Furthermore it highlights the importance of partnerships between city governments and the private sector to divide the responsibility for the project’s costs and risks.It shows a case, which can be replicated as well in Brazil as in other countries and gives some valuable lessons learnt to overcome potential issues.
Landfill-Gas-to-Energy
- Total revenue of 26.8 million € for the Municipality of São Paulo- 1,070,000 tCO
2-eq and 820,000 tCO
2-eq on average each year

12
City ProfileSingapore is an island city-state at the southern tip of the Malay Peninsula covering 700 km² and with a population of 4.8 million. It is the centre of commerce and industry in Southeast Asia and Singapore port is a global trading hub. An average GDP growth of 7.7 per cent per year during the last decade resulted in economic prosperity, which has been translated into notable improvements in the socio-economic conditions of the country (C.TORTAJADA, 2006).
Singapore’s comparably small size poses challenges related to the availability of land and natural resources. The city imports most of its natural resources, including food, water and industrial materials. It is considered a “water scarce” city-state and it imports water from neighbouring Malaysia (ECO2 cities, 2010).
Due to its natural setting, Singapore implemented innovative urban planning with efficient use of land and natural resources since 1992. In 2006, the Ministry of the Environment and Water Resources (MEWR) issued the Singapore Green Plan 2012 that addresses six main areas: Clean Air and Climate Change, Water, Waste Management, Conservation of Nature, Public Health, and International Environmental Relations (ECO2 cities, 2010).This case description focuses on Singapore’s water management.
Highlights and key aspects of the implementationIn order to reduce dependency on external water sources, Singapore has taken steps to improve water security through water “self supply”. After the independence of Singapore in 1965, the Public Utilities Board (PUB) took over the control of basic supplies including water.
In 2001, the responsibilities for sewerage and drainage were transferred to PUB from the Ministry of the Environment and since then, the PUB has developed and implemented comprehensive and holistic approaches to the water system, instead of managing each water function (water supply, sewage, drainage, etc.) individually. This made it possible to close the water loop and to implement its “Four National Taps” strategy, a long-term strategy that ensures sustainable water supplies, further explained under the topic “supply management”.
Supply management
The “Four National Taps” strategy considers the following different water sources:
• Water from local catchments: Water catchments provide about half of Singapore’s water need and two-thirds of Singapore’s land area is expected to participate in water catchments.
• Imported water: Singapore imports its water from the neighbouring Johor state of Malaysia. Imported water accounts for about a third of the country’s water needs (ECO2 cities, 2010).
• Desalinated water: In 2005, Singapore opened a desalination plant under a PPP, which provides around 10 percent of the country’s water needs (C.TORTAJADA, 2006). The cost of the desalinated water during its first year of operation was US$ 0.78/m3 (Lee, 2005).
• NEWater: Wastewater is collected through an extensive sewerage system and treated and purified, using membrane technology. The water is suitable for industrial use as precision equipment and IT manufacturing. NEWater satisfies 30 percent of Singapore’s total water needs. The price is significantly less than the price of desalinated water (C.TORTAJADA, 2006).
Beside the “Four National Taps” strategy, Singapore has optimised its water supply by reducing its non-revenue water (water lost because of leaks). Singapore has a very low percent share of non-revenue water of 5.18 per cent and since 2004, there are no Illegal connections to its water supply systems (C.TORTAJADA, 2006).
Demand ManagementThe PUB has a well-planned policy for managing water demand with several rates for different consumption levels. If domestic use surpasses more than 40 m3 per month, the unit charge becomes higher than the non-domestic tariff. In addition, a Water-borne Fee is charged to cover the costs of wastewater treatment and the maintenance and extension of the public sewerage system. As water bills are raised, water consumption decreases. The government provides direct subsidies to lower-income families to ensure equity.
Country: Singapore
Population: 4.8 million (2010)
GDP/capita: US$ 37,582.64 (2008)
Density: 6,814 inhabitants/km²
Climate: Tropical Climate
SingaporePolicy instruments:
Subsidies for the unprivileged, Public-Private-Partnership (PPP) management
Infrastructural instruments:
PPP investments in water catchment and purifying systems, reduction of non-revenue water
This case shows how Public Private Co-operation can be successful, even for the provision of basic needs, under certain conditions.

13
Recommended Literature:
Every Drop CountsEnvironmentally Sound Technologies for Urban and Domestic Water Use Efficiency (2008)http://sn.im/unep_urban31
Results and impactsThe efforts made by Singapore resulted in ecological benefits:
• Singapore successfully lowered its annual water demand from 454 million tonnes in 2000 to 440 million tonnes in 2004 - despite its population and GDP growth of respectively 3.4 and 18.3 per cent. It also reduced dependency on external water sources.
• Sewers cover 100 per cent of the city-state area, and all wastewater is collected. Excessive rainwater can be pumped from one reservoir to another to optimise storage capacity and prevent flooding during heavy rains (ECO2 cities, 2010).
• The man made reservoirs, mostly created from existing waterways, contain wide diversity of plant & animal life. In a study executed in the Mac Ritchie Reservoir, 288 species of organisms were recorded (Yao P. C., Wen L.E.).
Water subsidies are targeted for the poor who cannot afford to pay for the current water tariffs. 100 per cent of population has access to drinking water and sanitation and the entire water supply system is fully metered.
Lessons learntThe approach Singapore has developed and implemented is considered successful because of the city-state’s institutional effectiveness and its highly efficient control of water demand and supply. The overall governance of the water supply and wastewater management systems in Singapore is exemplary in terms of its performance, transparency and accountability.Corruption is considered an issue in many Asian utility companies. PUB dealt with this by emphasizing staff integrity as a key organisational requirement. It has taken measures to prevent corruption by competitive remuneration, incentives and benefits packages, staff training on Code of Governance and Code of Conduct, effective internal control processes, regular audits and strong and immediate sanctions against those who proved to be corrupt (C.Tortajada, 2006).
By also receiving the responsibility for sewerage and drainage, the PUB was able to set up an holistic system which resulted in a closed water loop system, allowing
the reuse of rain and waste water. Furthermore, The PPP allowed Singapore to invest a lot of money in their infrastructure, resulting in better access to water, less water loss and better metering.
Although, PPPs for water management have also caused several issues in cities as Paris, Brussels, Nairobi, Grenoble, etc. Some of these cities decided to fight for and obtained the remunicipalisation of their water. The main issues experienced with PPP were: loss of knowledge and capacity of the government to control water extraction, deprivation of water for the poor, higher water prices because of higher profit margins of the companies and abuse of their monopoly position, less quality control, externalisation of costs and a lack of responsibility for the environment. A clear and well-weighed agreement and a government that acts as a strong supervisory body are crucial for a successful PPP.
ReplicabilityPublic-Private-Partnerships for water management has been adopted in many cities all over the world with varying levels of success. The conditions when a PPP for water provision should be implemented has been a widely discussed topic between NGOs, governments and other organisations, differs from city to city and depends on the partner organisation. Pro PPP activists claim that PPPs are more cost efficient, allow bigger investments in infrastructure leading to more water access and less water loss, better metering of water use and a better water price validation.Anti PPP activist refer to the fact that it concerns a perfectly inelastic good, a primary need and a human right and given the importance and the issues mentioned above, it should not be within the power of private corporations.
Relevance of the case studySingapore shows how a city with limited resources can enhance economic productivity and growth, while minimising ecological impacts and maximising the efficiency of resource use. Strong leadership from Singapore’s Prime Minister was a major driver for the city-state’s sustainable development, complemented by an integrated “one-system” approach and active collaboration from stakeholders.
Efficient Resource Use
- 100 per cent of the population has access to drinking water and sanitation- A lower annual water demand despite population and GDP growth
14
City ProfileAdministratively, the city of Havana is one of the 14 provinces of Cuba. It is divided into 15 municipalities, which are subdivided into 104 people councils (consejos populares), the government structure at neighbourhood level (Novo and Murphy, 2005).
Since the revolution of 1959, food prices were subsidised and agrochemicals were intensively used. In the mid-1980s, over 50 per cent of the total foodstuffs consumed in Cuba were imported due to the favourable terms of trade with socialist countries. Urban agriculture was almost non-existent in Havana; there was no need to grow food, as food was distributed by the State.From 1989 until 1994, Cuba’s economy went into a slope with the import of oil cut by more than half and the import of food by 80 per cent. This period is referred to as the “special period” (Morgan, 2006).
It has been estimated that food availability declined as much as 60 per cent between 1991 and 1995. This severe crisis in food production, especially in Havana, led to a rise of urban agriculture. Urban production minimised transportation costs and smaller-scale production minimised the need for machinery.
Highlights and key aspects of the implementationThe strongly urbanised district of Havana searched for alternative food-supply programmes. A start was made to decentralise production in order to produce the agricultural products where they are consumed. The self-subsistence plan initiated in Cuba in the late 1980s. Since then, Land has been redistributed by the local government to citizens and cooperatives who wanted to set up gardens (popular gardens). In return the gardeners have had to make donations to the public institutions as schools and day care centres. Today, over 26,000 popular gardens cover 2,438.7 ha in Havana and produce 25,000 tonnes of food each year. Many of them are organised into Grupos de Horticultores - voluntary organisations of gardeners working in the same neighbourhood.
The majority of these gardeners already have a job. They grow food in the gardens in their spare time. Home and workplace gardens mainly produce fresh vegetables, roots and tubers (cassava, sweet potato and taro),
condiments and some fruit for self-consumption. Many also raise small animals for meat, milk, eggs, etc. Local food self-sufficiency reduces the need for transport, refrigeration and storage. This food is produced without pesticides since the city government passed a law prohibiting the use of chemical pesticides in agriculture within the city boundaries.
Havana has 26 agricultural store consultancies, and 11 Biological Pest-Control Centres which provide needed inputs for urban agriculture by producing, providing, and/or selling: seeds, organic fertilizers, biological pest control preparations, technical services and advice. Also, on a societal level, Havana made an effort to “dignify” urban agricultural work and workers. This work is increasingly seen as scientifically and technically challenging.
All over Havana, urban gardens were started. Havana also has individual farms, with an average of 13 ha; Co-operative Production Units, originating from the break up of state farms now containing 5-10 members; state farms; and areas where state enterprises produce food for their own workers.Research was stimulated and grassroots innovation was mainstreamed: e.g. organic intensive urban agriculture techniques as organopónicos and huertos intensivos (intensive gardens) were implemented in Havana. Today, 773 production units of organopónicos and huertos intensivos cover 386 ha with an average production of 21 kg/m2. They focus on providing complementary food that residents cannot obtain from the ration as lettuce, green onions, spinach, tomatoes and green beans.
Cuba’s urban agriculture is an integrated system organised by the municipalities, popular councils, research institutions, extension networks and service networks. The main tasks of the municipal are to set policy guidelines, mobilise the grassroots, give stimulus to all activity in urban agriculture, and supervise and control all local efforts.
Results and impactsSince 2007, 99% of the households in the central districts Food production has increased significantly: the production of food in Havana rose from 44,243 tonnes (1995) to 113,525 tonnes (1998) and the vegetable production increased from 20.7 to 272.0 tonnes between
Country: Cuba
Population: 2.1 million (2009)
GDP/capita: US$ 9,900 PPP (2010)
Density: 2,971 inhabitants/km² (2009)
Climate: Tropical Coastal Climate
HavanaPolicy instruments:
Decentralisation of food production, redistribution of land, regulations and restrictions of pesticides use, supervision and control of local efforts
Education instruments:
Stimulating research and mainstreaming grassroots practices of organic farming
This case study shows how cities can become less dependent on food from rural hinterlands for their food provisions and how they can cut transportation, conservation and food loss costs.

15
Recommended Literature:
Agriculture in the City, A Key to Sustainability in Havana, Cuba
http://idl-bnc.idrc.ca/dspace/bitstream/10625/33999/97/119290.pdf
1997 and 2005. Cubans eating habits have benefited from the introduction of locally produced, agricultural products without pesticides (Novo et Murphy, 1998). Food distribution takes place through direct sales at hundreds of sites of production and/or stands that belong to a unit of production at another location, as approved by local governments. This results in savings of transportation costs, storage and food loss.
The environment has also benefited from greening the city due to the cultivation of crops in an agro-ecological way: neglected plots have been transformed into productive land.
The labour intensive agriculture increased urban employment by providing income opportunities, in particular for women and young job seekers. The urban agricultural workforce in Havana has grown from 9,000 (1999) to 23,000 (2001) to more than 44,000 employees in 2006.
Although, the change to urban agriculture was slower in Havana than for the rest of the country. It has only recently achieved the minimum provision of 300 grammes of vegetables per capita per day, as prescribed by the Food and Agriculture Organization of the United Nations (FAO). The result for 2005 corresponds to 340 grammes per capita per day for Havana’s inhabitants. The lower production is because of a lower amount of agricultural land per person: 1 hectare per 200 persons compared to 1 hectare per 10 persons average of Cuba. More intensive urban agriculture techniques are needed to provide enough food and variation of food.
Lessons learntAn issue for the future of Havana is that it is slowly running out of cultivable land to put to use, while still not providing enough food for the expected city growth. Only 2,970 hectares of the 35,890 hectares wasn’t in use as pastures, forests and croplands in 2006. Additional gains in vegetable production will have to come from: (1) the reallocation of lands among the three competing uses (crops, animal raising, and forests); or (2) the better intermingling of the three; or (3) within the area dedicated to vegetable production, shifting more of that area to more intensive techniques as organopónicos and huertos intensivos.
Also water availability is a major issue for Havana’s gardens. The national water network does not bring in sufficient water to satisfy all household needs. In 2005, the local government restricted the use of urban water supply for agriculture, in order to conserve water for drinking, washing and sanitation. Alternative water sources for urban agriculture need to be found, together with methods to prevent water loss and to enhance soil moisture conservation. Some steps have been taken to solve the shortages, such as the micro-jet drip-irrigation systems, which use water more efficiently. Also, more wells are being dug.
ReplicabilityThe use of unused urban plots for agriculture purposes, the regulations, research and mainstreaming of pesticide free agriculture techniques and the incentives campaigns of home gardening are measures that can be adapted by other cities.
As for city farming techniques without pesticides, like the “organopónicos” and “huertos intensivos”, the local context - as climate, soil, pollution, free plots, natural vegetation, ... -has to be kept in mind and thus local research will be necessary.
The main limitation to urban agriculture is the availability of free plots, since ground is often more expensive in rural areas.
Relevance of the case studyHavana probably offers the most successful example for which the concept of urban agriculture was used as a response to a food crisis, not only by individual residents but also as a government-supported strategy.
It is also an inspiring case for cities that want to increase their food production in order to be less dependent on import from rural areas and to cut down transportation and conservation costs. It might be especially interesting for globally growing communities, e.g. the permaculture community, which embraces a lifestyle of local production, consumption and discharge.
This case highlights the economical and social benefits of urban agriculture, job creation, reduction of transportation, storage and food loss costs and the greening of the city.
Urban Agriculture
- Reduction of greenhouse gas emissions over the whole life cycle.- 35,000 extra jobs created because of urban agriculture

16
City ProfileAccra, Ghana‘s largest city and administrative and economic centre, is home to 1.7 million inhabitants. It is mainly governed by the national government; nearly all of the decision-making happens on national or local tribe level.
The city lies within the coastal plains of Ghana, 80 km west of the Volta River and it has three major wetlands: the Sakumonu Ramsar site, the Densu River delta and the Korle Lagoon wetlands.
The wetland ecosystems provide a variety of services that benefit the city and contribute to poverty alleviation and better quality of life. They provide services such as flood and erosion prevention, storm control, clean water provision, regulation of the microclimate, prevention of coastal erosion, eco-tourism as well as diversity in the city landscape and environment.
They particularly support the urban poor since they are used for fishing; crabbing; provision of raw materials like raffia for cottage industries; herbs for traditional medicine; and dry season urban vegetable farming. They also play an important role for salt production.
The wetlands in Accra are threatened mainly by human and natural factors including: Rapid conversion of wetlands for housing development; the expansion of slums; mining, land and soil degradation; sanitation and water pollution; and over-exploitation of wetland resources, resulting in salinisation.
Accra deals with a tension between the traditional system or order of the indigenous population and the modern order, which is a modernising centralised government. Land is an asset and a resource with economic, political, social and cultural ramifications, and an important problem of land tenure systems is endemic conflict, which has involved chiefs, family heads, government, individuals and groups.
Highlights and key aspects of the implementationA strong traditional base for protection of wetlands through local indigenous management (chieftaincy) systems exists in Accra. Most wetlands and their resources have been protected and regulated in the past through traditional practices, depending on the beliefs of the traditional area that claims ownership. These traditional practices involve customary laws or beliefs, which determine rights to land and resource use and include the enforcement of sanctions for violation by the responsible authority. Many wetlands have cultural value.
Management of the wetlands is governed by traditional knowledge systems and practices that have been developed by local populations. Every river, lake and lagoon (such as the Sakumo lagoon) is associated with a particular spirit or deity, and thus ‘preserved’ through the observance of restrictions and prohibitions on its use. Such indigenous management practices provide a strong traditional base for the protection of wetlands in Ghana. (UNEP, 2003)
In Ghana, decisions related to land use are a very complex process in which the local councils have a major influence, especially when it concerns sacred land.In this way, Local councils can play a role in protecting wetlands from being destroyed by national investments in infrastructure. There have been mounting tensions and protests in Accra by the Ga, the traditional land owners, over what they perceive to be the unfair lease of national government acquired lands for private development (Ayee et al., 2011).
Through the establishment of Site Management Committees in the RAMSAR site area and a series of awareness creation programmes, residents of Accra have been attracted to participate in their conservation (UNEP, 2006). Regarding the management of wetlands, the role of partnerships in conservation of the wetlands is important for transparency, accountability, knowledge-sharing leading to improvement in environmental governance and understanding and appreciating the importance of conservation.
Country: Ghana
Population: 1.7 million (2008)
GDP/capita: US$ 1,500 PPP (2009)
Density: 3,300 inhabitants/km²
Climate: Tropical Climate
AccraPolicy instruments:
Co-operation with indigenous population
Education instruments:
Awareness programmes for indigenous local policy makers
This case highlights how local structures can foster opportunities for biodiversity conservation.

17
Recommended Literature:
Viumbe HaiAfrican Cities, Ecosystems and Biodiversity
http://sn.im/unep_urban36
One of the awareness campaigns explains the indigenous tribes the relation between the over-exploitation of the wetlands and the extinction of wetland resources, often of religious value. This relation is not always obvious for the local tribes. A local study with the “Asafo” community revealed the two major reasons assigned for recent difficulties in getting catches of the bushbuck, a religious festival animal, were (1) anger of the gods (60 per cent) and (2) environmental degradation (30 per cent) (Wuver et Attuquayefio, 2006).
Results and impactsProtecting the mangroves has a long-term positive impact on tourism, the provision of agricultural and fishing resources, water supply, salt production, fuel wood and timber wood provision and sand and gravel provision. This results in a positive impact on dealing with economical, social and ecological issues of Accra as: poverty, floods, food shortage, water and wood shortage, coastal erosion, climatic issues, etc.
Lessons learntIn order to obtain local support for the conservation of the wetlands, the local decision makers need to be recognised and respected as equal partners by the conservation officers. Furthermore, they need to have ownership of the resources and being convinced of the benefits of the conservation of the resources.
The Metropolitan, Municipal and District Assemblies (MMDAs) should harmonise their policies and local (bye-) laws to avoid contradictions between laws on several levels and contradictions between the laws and their enforcement.
To be able to manage wetlands effectively and efficiently, it requires the understanding of the dynamics of human and environmental parameters. The success of any wetland management programmes will depend on the involvement of the local communities, since their activities directly affect the wetland ecosystem.
The role of local communities is to create regulations and enforces them and to protect the wetlands against private investments, damaging the wetlands.
To achieve the desired results, private sector participation in conservation matters is essential. Finally, continuous public education and awareness creation is required to help improve the bad perception on wetlands, as wastelands, in society.
Relevance of the case studyThe Accra study showcases that the benefits of healthy, functioning ecosystems are overwhelming and wetlands not only provide environmental and social benefits, but, if well managed, they also have the potential to be powerful economic assets to cities. Furthermore, it highlights the importance of ownership by local communities and cultural heritage in order to protect these areas.
Wetland Conservation
A positive impact on tourism, the provision of agricultural and fishing resources, water supply, salt production, fuel wood and other resources for Accra.
Coastal Sensibility Maps of the Densu Delta Wetlands Areas

18
City ProfileGuangzhou is a sub-provincial city and the capital of the Guangdong province in Southern China. Its city centre lies near the head of the Pearl River (Zhu Jiang) Delta, 145 km inland from the South China Sea. Benefiting from its strategic location close to inland rivers and the sea, it has developed to a key transportation hub and trading port. Guangzhou is the third largest city and one of the most densely populated areas in China with most of its residents living in the central districts of the city.
With increasing economic activities and hence living standards, motorcycles gradually entered millions of households. In the 1990s, citizens also began to use the motorcycles as taxis. Despite several policy measures, the amount of motorcycles kept rising until 2005. In 2000, the inventory of motorcycles in the Guangzhou urban area was estimated at 790,000 and more than 500,000 motorcycles were actually in use, while only 260,000 of them were registered by the Guangzhou government (Guangzhou Transportation Planning Research Institute).
Faced with these rapid increases, the city perceived a number of problems associated with motorcycles, including: noise and air pollution, traffic accidents, illegal motorcycle taxi operation, impact on traffic order, impact on the image of Guangzhou and snatch thefts (Fjellstrom 2008:4,5).
Research showed that motorbikes also accounted for 15.2 per cent of the carbon monoxide air pollution and 30.4 per cent of the hydrocarbon pollutants, which was more than the sum of goods vehicles and buses.Highlights and key aspects of the implementationThrough transport regulations, the local government implemented several measures to ban motorcycles in Guangzhou:
A) Legislative measuresFrom 1991 to 2007, the implementation of Guangzhou’s motorcycle ban started with a range of gradually tightening restrictions on the use of motorbikes and ended with a complete ban. The policy and strategic decisions were based on research and analysis.
The motorcycle ban was implemented in several phases, giving the public enough time to adapt.
In 1991, the Guangzhou Public Security Department announced motorcycle restrictions and driving restrictions for motorcycles not registered in the city. From 1995, no new motorcycle registrations were accepted in Guangzhou. In 1999, motorcycles not registered in the urban area were prohibited from operating in the city and from 2004-2007, a three phase plan was set up to ban all motorcycles from the urban area.
B) Promoting modal shift:In order to obtain the necessary support from the community, the local government implemented several supporting measures: It was necessary to improve public transport by ensuring adequate capacity to accommodate the modal shift from motorcycles to buses and by providing feeder routes or other minibus coverage to ensure access along narrow shared streets to bus stops and metro stations. These were areas previously served by motorcycle taxis. Another measure included the “Guangzhou City Compensation Incentive Plan for Motorcycles Scrapped or Moved out of Urban Areas”. It required the payment of a compensation for each motorcycle that was scrapped. By May 2006, more than 5,000 motorcycles had already been scrapped and the total compensation paid exceeded US$ 920,000 or around US$ 180 per motorcycle. The payment arrangement provided an economical incentive for owners to scrap motorcycles sooner rather than later . A third measure was the organisation of several labour fairs to support people previously employed as motorcycle taxi drivers or in the motorcycle sector to find new jobs.
C) Enforcement effortsJoint arrangements between the Public Security Bureau, police, urban management officials, district public security officials and other departments focused on special enforcement measures in locations where motorcycle-related problems were prominent, such as motorcycle gathering places. These measures included patrols, mobile equipment inventory, ambushes, and other methods to seize illegal vehicles.
Country: China
Population: 10.3 million (2009)
GDP/capita: US$ 13,000 (2009)
Density: 1,418 inhabitants/km²
Climate: Subtropical Monsoon Climate
Guanghzou Motorcycle RestrictionsPolicy instruments:Regulations
Economic instruments: Refunds on motorcycles
Infrastructural instruments: Construction of physical obstacles, improved public transportation network
Education instruments:Labour fairs for former employees of the motorbike sector
This case demonstrates how citizens in big developing cities are forced to adopt sustainable practices in a more radical way.

19
The city government also constructed physical obstacles, such as barriers, stairs, and poles, to restrict motorcycles in the city. These obstacles were designed in such a way that they allow only bicycles to pass.
Results and impactsSince 2007, 362,000 motorcycles have been taken off the roads, resulting in an annual carbon monoxide reduction of 24,000 tonnes. (China daily, 2010-11-09)
Other co-benefits of this project are:
• A reduction of noise pollution, especially in narrow alleyways and at night, and significant reductions of exhaust gases;
• A decrease of traffic crashes was measured in January to August 2007 compared to the same period a year before: crashes declined by 17.5 per cent, deaths by 2.2 per cent, injuries by 20.4 per cent, and property losses by 42.3 per cent;
• A decrease of criminal cases of 15.3 per cent and 44.3 per cent of snatch theft cases;
• Improved quality of the walking environment throughout the city;
• Improved public transport system.
Local informal actions were taken to restrict motorcycles by neighbours, e.g. the blocking of streets for motorcycles.
In a short time, 18 per cent of the motorcycle riders shifted to cars, 9 per cent shifted to walking and 51 per cent shifted to using the bus. As a result, traffic congestion has significantly worsened since the motorcycle ban was implemented. A significant drop in bus speed was measured between November 2006 and April 2007. Although, the increase of car ownership cannot only be linked to the motorcycle ban since the increase of car ownership was a long-term trend. Therefore, it is not possible to attribute the worsening congestion to the motorcycle ban only.
Lessons learntThe measures to adapt and expand the public transportation were not taken in time for the citywide
motorcycle ban. More than 50 short routes accessing narrow streets around bus stops and metro stations were added to the bus route network only a year after the citywide motorcycle ban came into effect. The result was that, since the ban, a variety of informal minibus services and cycle rickshaws have sprung up to serve the unmet demand.
These new cycle rickshaws and minibus services are generally tolerated by traffic police, but have not been legalised and are therefore subject to arbitrary confiscation.
As a result of the ban, buses became overcrowded: surveys show that around 50 per cent of motorcycle riders shifted to buses in the short term. The large increase in bus demand combined with lower bus speeds due to increasing congestion resulted in much higher bus occupancy rates. Overloaded buses in turn reduced bus speeds by increasing boarding and alighting times per passenger.
Overall, the impact of the motorcycle ban was limited since other factors, such as the rapid increase in car ownership and the introduction of informal minibuses, contributed dramatically to an increase in road congestion.
Relevance of the case studyThe case demonstrates how citizens in large developing cities are forced, because of ecological and social issues, to adopt sustainable practices in a more radical way. Furthermore, it highlights the importance of a long term, holistic planning and implementation strategy in order to gain the community support.
In addition, this case study illustrates well the problems of quick policy actions when the consequences of an action have not been thoroughly thought through. If the local government decides to restrict/ban the use of one mode of transportation, it has to provide alternatives (public transport network) to the population parallel to the ban. It also has to keep in mind that the ban of one type of transportation, results in the raise of other means of transportation, which aren’t always more environmental friendly.
Motorcycle Restrictions
- An annual carbon monoxide reduction of 24,000 tonnes - Reduction in noise pollution, traffic accidents and crime
Recommended Literature:
Share the RoadInvestment in Walking and Cycling Road Infrastructurehttp://sn.im/unep_urban27

20
Page 4: Renewable Energy in Rizhao, China
- UNEP, 2009. Sustainable Urban Energy Planning: A handbook for cities and towns in developing countries. pp21. [E-book] ICLEI-Local Governments for Sustainability, UNEP and UN-Habitat Available at: <http://www.unhabitat.org/pmss/download.aspx?page=download&alt=1&publicationID=2839#> [Accessed: 11 January 2011].
- World Changing, 2007. Mainstreaming Clean Energy in Rizhao, China. [Online] 31 July. Available at: <http://www.worldchanging.com/archives/007060.html> [Accessed: 11 January 2011].
- HKTDC, 2010. Profiles of China Provinces, Cities and Industrial Parks. [Online] 16 September Available at: <http://www.hktdc.com/info/mi/a/mpcn/en/1X0740II/1/Profiles-Of-China-Provinces-Cities-And-Industrial-Parks/Rizhao-Shandong-City-Information.htm> [Accessed: 11 January 2011].
- World Clean Energy, 2007. Winner of the Policy and Lawmaking Category 2007. [Online] Available at: <http://www.cleanenergyawards.com/top-navigation/nominees-projects/nominee-detail/project/64/?cHash=a79720575a> [Accessed: 11 January 2011].
- Climate Change Corp, 2009 Opinion China’s eco-towns: Green communities – To go eco, think small. [Online] 3 February. Available at: http://www.climatechangecorp.com/content.asp?ContentID=5942 [Accessed: 11 January 2011].
- Biello, D., 2008. Sunrise on China’s First Carbon-Neutral City. Scientific American, [Online] 4 August. Available at: <http://www.scientificamerican.com/article.cfm?id=sunrise-on-chinas-first-carbo-neutral-city> [Accessed: 11 January 2011].
- Starmass, 2010 Shandong demographic analysis and economy overview. [Online] Available at: <http://www.starmass.com/china_review/provincial_overview/shandong_demographic_economy.htm> [Accessed: 18 January 2011].
- French, P. and Webb, T, 2009 Eco-towns in China - Lessons from Dongtan, Huangbaiyu and Rizhao. [Podcast] Available at: <http://www.ethicalcorp.com/content.asp?ContentID=6302> [Accessed: 18 January 2011].
Page 6: Air Quality Control and Urban Transport Upgrade in Jakarta
- Rogat,J. 2010. Planning and Implementation of a Bus Rapid Transit System in Latin America - Summary Aimed at Decision Makers. [Online] UNEP. Available at: <http://unep.org/transport/PDFs/public_transport/BRT_guidereport.pdf>
- UNEP, 2010. 30Ways in 30 Days, UNEP’s Inspiring Action Towards a Low Carbon, Climate Resilient Future. [Online] Available at: <http://www.unep.org/pdf/30ways.pdf> [Accessed: 15 March 2011].
- Dalkmann, H., 2010. Case study of a transport MRV NAMA: TDM Measures in Jakarta, Indonesia Applicability of Post 2012 Climate Instruments to the Transport Sector (CITS) Project [Online] Available at: < www.slocat.net/wp-content/uploads/2009/11/TRL-Jakarta-final-report.pdf > [Accessed: 3 March 2011].
- Setiawati,I.,2010 Jakarta’s population surpasses 15-year forecast. [Online] The Jakarta Post 19 of August. Available at: <http://www.thejakartapost.com/news/2010/08/19/jakarta%E2%80%99s-population-surpasses-15year-forecast.html> [Accessed: 3 March 2011].
ReferencesUNEP work on Urban Environment
http://jenteminne.azuli.org/UNEP_Work_on_Urban_Environment.pdf

21
Page 8: CicloRuta, an Extended Cycling System in Bogotá
- Broselli, B. et al., 2010. Siemens Latin America green city index. The Economist Intelligence Unit, sponsored by Siemens [online] Available at: <http://www.siemens.com/press/pool/de/events/corporate/2010-11-lam/Study-Latin-American-Green-City-Index.pdf> [Accessed: 11 January 2011].
-C40, 2010. Bogotá’s CicloRuta is one of the most comprehensive cycling systems in the world. C40 cities [online] Available at: <http://www.c40cities.org/bestpractices/transport/bogota_cycling.jsp> [Accessed: 11 January 2011].
- Unknown, 2008. New world encyclopedia, Bogota. [Online] 3 December, Available at: <http://www.newworldencyclopedia.org/entry/Bogota,_Colombia> [Accessed: 11 January 2011].
- Unknown, 2006. Bogotá, Colombia Disaster Risk Management Profile, 3CD City Profiles Series [online] July.Available at: <http://emi.pdc.org/cities/CP-Bogota-update-July2006.pdf> [Accessed: 11 January 2011].
- Gomez, L. F., 2005. Global Strategy on Diet, Physical Activity and Health, Proceedings of the Biannual Meeting of the CARMEN Network, Santiago, Chile, pp.13, 14 Available at: <http://www.paho.org/english/ad/dpc/nc/carmen-2005.pdf > [Accessed: 11 January 2011].
Page 10: Landfill-Gas-to-Energy Projects in São Paulo
- Clapp,C., et al., 2010. Cities & Carbon Market finance: Taking stock of cities’ experience with Clean Development Mechanism (CDM) and Joint Implementation (JI). OECD Working papers. [online]. Available at: www.oecd.org/env/workingpapers [Accessed: 24 January 2011].
- Instituto Brasileiro de Geografia e Estatística, 2007. Contagem da População, 2007. [online]. Available at: http://www.ibge.gov.br/home/estatistica/populacao/contagem2007/defaulttab.shtm [Accessed: 24 January 2011]
- Broselli, B. et al., 2010. Siemens Latin America green city index. The Economist Intelligence Unit, sponsored by Siemens [online]. Available at: <http://www.siemens.com/press/pool/de/events/corporate/2010-11-lam/Study-Latin-American-Green-City-Index.pdf> [Accessed: 24 January 2011].
- C40 cities, 2010. Sao Paulo, Brazil Sao Joao and “Bandeirantes” Landfills. [online] Available at: < http://www.c40cities.org/bestpractices/waste/saopaulo_landfill.jsp> [Accessed: 24 January 2011].
- ICLEI, 2009, Turning pollution into profit: the “Bandeirantes” Landfill Gas to Energy Project.,[online], July. Available at: <http://www.local.ren21.net/local-practice/case-studies-descriptions> [Accessed: 24 January 2011].
-UN Economic & Social affairs.,2008. World Urbanization Prospects, The 2007 Revision. [online], February Available at: <http://www.un.org/esa/population/publications/wup2007/2007WUP_ExecSum_web.pdf> [Accessed: 16March 2011].
“The challenge of the world as a whole
is to cut global emissions by at least
60% between now and 2050 whilst
maintaining or enhancing growth and
overcoming poverty. Cities will be at the
center of this story.”
(Nicholas Stern, 2010)

22
Page 12: Efficient Resource Use in Singapore- Asian Development Bank, 2005. Country Water Action: Singapore. Technology turns Water Weakness to Strength, November. [Quoted by C. tortajada, 2006]
- Lee Poh Onn, 2005. Water management issues in Singapore, paper presented at Water in Mainland Southeast Asia, 29 November-2 December, Siem Reap Cambodia, conference organized by the International Institute for Asian Studies (IIAS), Netherlands, and the Centre for Khmer Studies (CKS), Cambodia. Quoted by [Quoted by C.tortajada, 2006]
- Tortajada, C., 2006. Water Management in Singapore, Third World Centre for Water Management, Atizapàn, Mexico, [online] Available at: <http://www.adb.org/water/knowledge-center/awdo/br01.pdf [Accessed: 21 January 2011].
- Asian Development Bank, 2006. Nonrevenue Water: A Governance Challenge, [online] October. Available at: <http://www.adb.org/water/topics/non-revenue/default.asp> [Accessed: 21 January 2011].
- Yao P. C., Wen L.E., Unknown. Active, Beautiful and Clean: A Sustainable Approach to Water Resource Management in Singapore. Singapore’s Public Utilities Board [Presentation]. Available at: <https://www.cbd.int/doc/meetings/nbsap/nbsapcbw-seasi-01/other/nbsapcbw-seasi-01-sg-water-en.pdf> [Accessed: 21 January 2011].
- Suzuki H., et all., 2010. ECO2 cities, Ecological Cities as Economic Cities. World bank [Online]. Available at: http://www.worldbank.org/pdt [Accessed: 21 January 2011].
Page 14: Urban Agriculture in Havana, Cuba- Novo,M.G. et Murphy,C,2005. URBAN AGRICULTURE IN THE CITY OF HAVANA: A POPULAR RESPONSE TO A CRISIS [online]. Available at: http://www.ruaf.org/node/82 [Accessed: 18 February 2011].
- Oficina Nacional de estadisticas,2010. Anuario estadistico de ciudad de la Habana , [online]. Available at: <http://www.one.cu/publicaciones/provincias_masinf/la%20habana.htm> [Accessed: 18 February 2011].
- Koont,S., 2009. Monthly review, The Urban Agriculture of Havana [online] January. Available at: <http://www.monthlyreview.org/090119koont.php> [Accessed: 18 February 2011].
- Chaplowe,S. 1998.,Cityfarmer, Havana’s Popular Gardens:Sustainable Urban Agriculture [online]. Available at: <http://www.cityfarmer.org/cuba.html > [Accessed: 18 February 2011].
- CIA,2010., Cuba [online]. Available at: <https://www.cia.gov/library/publications/the-world-factbook/geos/cu.html> [Accessed: 18 February 2011].
- María Caridad Cruz,M.C. et Medina,R,S. 2003. AGRICULTURE IN THE CITY, A Key to Sustainability in Havana, Cuba. International Development Research Centre 2003 Available at: <http://publicwebsite.idrc.ca/EN/Resources/Publications/Pages/IDRCBookDetails.aspx?PublicationID=219> [Accessed: 18 February 2011].
- Morgan, A. 2006. The Power of Community: How Cuba Survived Peak Oil. [online video] Available at: <http://www.powerofcommunity.org/cm/index.php> [Accessed: 13 April 2011].
Page 16: Wetland Conservation in Accra
- Anku,S.K., 2006. Managing Wetlands in Accra, Ghana. [Presentation] 18-24 September. Available at: <www.unep.org/urban_environment/PDFs/ManagingAccraWetlands.pdf> [Accessed: 2 March 2011].
- UNEP.,2008. Viumbe hai - African Cities, Ecosystems, and Biodiversity. [Online].Available at: <http://www.unep.org/urban_environment/PDFs/biodiversity-brochure.pdf > [Accessed: 2 March 2011].
ReferencesTowards a Green Economy
http://sn.im/unep_urban68

23
“Every individual counts, every individual
has a role to play, every individual
makes a difference.”
(Jane Goodall)
- Ametepe, E. 2010 Wetlands, Source of Clean Water [Online]. 19 of January Available at:<http://www.ghana.gov.gh/index.php?option=com_content&view=article&id=1139:wetlands-source-of-clean-water&catid=24:features&Itemid=167> [Accessed: 2 March 2011].
- Addae-Bosompra, E.,2009. Urban Sprawl: A new epidemic in Accra [online]. 19 October Available at: <http://www.modernghana.com/newsp/244438/5/pagenum2/urban-sprawl-a-new-epidemic-in-accra.html> [Accessed: 2 March 2011].
- Unknown, 2007. The largest cities in the world by land area, population and density. City mayors. [online] 6 January Available at: <http://www.citymayors.com/statistics/largest-cities-density-125.html> [Accessed: 2 March 2011].
- Unknown, 2010. Ghana GDP - per capita (PPP).Index Mundi. [Online] 30 December Available at: <http://www.indexmundi.com/ghana/gdp_per_capita_%28ppp%29.html> [Accessed: 2 March 2011].
- Ayee, J. A. R., et al., 2011. Local Power Struggles, Conflicts and Conflict Resolution in Ghana. [online] Available at: <http://www.codesria.org/IMG/pdf/CDP_Ghana2.pdf> [Accessed: 29 March 2011]
- UNEP, 2003. Composite Report on the Status and Trends Regarding the Knowledge, Innovations and Practices of Indigenous and Local Communities. Convention on Biological Diversity [Online] 30 September Available at: <http://www.cbd.int/doc/meetings/tk/wg8j-03/information/wg8j-03-inf-03-en.pdf> [Accessed: 18 April 2011].
- Wuver, A.M. et Attuquayefio, D.K.,2006. The Impact of Human Activities on Biodiversity Conservation in a Coastal Wetland in Ghana. West Africa Journal of Applied Ecology (WAJAE) [online] 6 January Available at: <http://www.ajol.info/index.php/wajae/article/viewFile/45690/29169>[Accessed: 18 April 2011].
Page 18: Motorcycle Regulations in Guangzhou, China- Fjellstrom, K., 2008. ITDP, Case study: motorcycles in Guangzhou, [online]. Available at: http://www.itdp.org/documents/Guangzhou%20Case%20Studies%20-%20Motorcycles%2015-Sep-08.pdf [Accessed: 11 January 2011].
- Unknown, 2010 Guangdong Statistical yearbook. Gdstats, [online] Available at: <http://www.gdstats.gov.cn/tjnj/ml_e.htm> [Accessed: 18 January 2011].
- Fact Index (2010) Sub-Provincial city. Available at: http://www.fact-index.com/s/su/sub_provincial_city_1.html [Accessed: 18 January 2011].
- C40 Cities, 2007. Jakarta, Indonesia, a 12.9 km Bus Rapid Transport system built in just 9 months at a cost of $2million/km[Online] Available at: <http://www.c40cities.org/bestpractices/transport/jakarta_bus.jsp> [Accessed: 3 March 2011].
- W. Hook and J. Ernst, 2005. Bus Rapid Transit in Jakarta, Indonesia: Successes and “Lessons Learned” March [Presentation] World Bank Available at: <http://siteresources.worldbank.org/INTURBANTRANSPORT/Resources/340136-1120662668760/hook.pdf> [Accessed: 3 March 2011].
- Munawar, A. Sustainable Urban Public Transport Planning in Indonesia, Case Studies in Yogyakarta and Jakarta. [Online] Gadjah Mada University Available at: <http://munawar.staff.ugm.ac.id/wp-content/munawardelftfinal.pdf> [Accessed: 3 March 2011].
- Ministry of Transportation & Ministry of Environment Republic of Indonesia,2008. Indonesian Country Report on Environmentally Sustainable Transport Implementation. [Presentation] Available at: <http://www.uncrd.or.jp/env/4th-regional-est-forum/Presentations/08_BS2_Indonesia.pdf> [Accessed: 3 March 2011].
- The Institute for Transportation and Development Policy, 2005. Making TransJakarta a World Class BRT System, Final Recommendations of. [Online] ITDP June 30, 2005 Available at: <http://www.itdp.org/documents/TransJakarta%20Final%20Report%205.pdf> [Accessed: 3 March 2011].
