synthetic fischer-tropsch (ft) jp-5/jp-8 … fischer-tropsch (ft) jp-5/jp-8 aviation turbine fuel...
TRANSCRIPT

SYNTHETIC FISCHER-TROPSCH (FT) JP-5/JP-8 AVIATION TURBINE
FUEL ELASTOMER COMPATIBILITY
FINAL REPORT
By Pat Muzzell
Leo Stavinoha Rebecca Chapin
U.S. Army Tank-Automotive Research, Development and Engineering Center -- Petroleum & Water Business Area, Fuels and Lubricants Technology Team
and the National Automotive Center, Fuel Cell Technology Team Warren, MI
February 2005

Report Documentation Page Form ApprovedOMB No. 0704-0188
Public reporting burden for the collection of information is estimated to average 1 hour per response, including the time for reviewing instructions, searching existing data sources, gathering andmaintaining the data needed, and completing and reviewing the collection of information. Send comments regarding this burden estimate or any other aspect of this collection of information,including suggestions for reducing this burden, to Washington Headquarters Services, Directorate for Information Operations and Reports, 1215 Jefferson Davis Highway, Suite 1204, ArlingtonVA 22202-4302. Respondents should be aware that notwithstanding any other provision of law, no person shall be subject to a penalty for failing to comply with a collection of information if itdoes not display a currently valid OMB control number.
1. REPORT DATE 16 FEB 2005
2. REPORT TYPE N/A
3. DATES COVERED
4. TITLE AND SUBTITLE Synthetic Fischer-Tropsch (FT) JP-8/JP-5 Aviation turbine FuelElastomer Compatibility
5a. CONTRACT NUMBER
5b. GRANT NUMBER
5c. PROGRAM ELEMENT NUMBER PE 0603750D8Z
6. AUTHOR(S) ; ; Muzzell /Patsy,AStavinoha /Leo,LChapin /Rebeccs
5d. PROJECT NUMBER
5e. TASK NUMBER
5f. WORK UNIT NUMBER
7. PERFORMING ORGANIZATION NAME(S) AND ADDRESS(ES) US Army RDECOM-TARDEC 6501 E 11 Mile Rd Warren, MI 48397-5000
8. PERFORMING ORGANIZATIONREPORT NUMBER 15043
9. SPONSORING/MONITORING AGENCY NAME(S) AND ADDRESS(ES) ADUSD/AS&C
10. SPONSOR/MONITOR’S ACRONYM(S)
11. SPONSOR/MONITOR’S REPORT NUMBER(S)
12. DISTRIBUTION/AVAILABILITY STATEMENT Approved for public release, distribution unlimited.
13. SUPPLEMENTARY NOTES The original document contains color images.
14. ABSTRACT When some elastomer (rubber) compounds, and specifically those used for seals in fuel-wetted componentsof vehicles and equipment, are suddenly ’switch-loaded’ from one kind of fuel to another, swell/shrinkissues relating to seal performance may arise, possibly leading to fuel leakage. The key objective of thisstudy was to compare and contrast the material compatibility of nitrile coupons and O-rings with selectedpetroleum-derived fuels, Fisher-Tropsch (FT) synthetic JP-5/JP-8 fuel, and blends of FT JP-5/JP-8 withvarious amounts of aromatic blend stock. This study provided a baseline for predicting the effects of staticelastomer swell to the potential degree of swell/shrink that can be expected when fuels are "switch-loaded"and a comparison of effects on coupons as well as O-rings which indicated similar overall trends and werein agreement with prior work. The use of an aromatic concentrate as a surrogate source of aromatics didnot reveal any significant bias when compared to petroleum derived JP-5 and diesel fuel, although it wasshown to have a reduced effect on elastomer change as compared to the petroleum fuels.
15. SUBJECT TERMS
16. SECURITY CLASSIFICATION OF: 17. LIMITATION OF ABSTRACT
SAR
18. NUMBEROF PAGES
41
19a. NAME OFRESPONSIBLE PERSON
a. REPORT unclassified
b. ABSTRACT unclassified
c. THIS PAGE unclassified
Standard Form 298 (Rev. 8-98) Prescribed by ANSI Std Z39-18

EXECUTIVE SUMMARY Problems and Objectives When some elastomer (rubber) compounds, and specifically those used for seals in fuel-wetted components of vehicles and equipment, are suddenly ‘switch-loaded’ from one kind of fuel to another, swell/shrink issues relating to seal performance may arise, possibly leading to fuel leakage. Studies conducted in 2003 indicated that nitrile elastomers were particularly sensitive to switching between various fuels, and that the magnitude and direction of these physical changes (swell/shrink) were dependent on the fuel composition, in particular aromatic content. The key objective of this study was to compare and contrast the material compatibility of nitrile coupons and O-rings with selected petroleum-derived fuels, Fischer-Tropsch (FT) synthetic JP-5/JP-8 fuel, and blends of FT JP-5/JP-8 with various amounts of aromatic blend stock. Nitrile elastomer is typically found in the fuel systems of Army tactical and combat vehicles and varies in composition giving a large range of compatibility with fuel composition. Importance of Project This project was completed under a joint DoD-DoE Memorandum of Agreement (MOA) to conduct collaborative research and development in the assessment of alternative fuels, particularly synthetic fuel produced from gas-to-liquid (GTL)/FT technology. This project is one of several second year efforts under this MOA to address the potential use of FT fuels by the military. Technical Approach To assess the compatibility of the selected elastomer in various fuels, coupons and O-rings were immersed in each fuel and held there, at elevated temperature of 40°C, for a period of up to 43 days. Prior to immersion, and then at several intervals of 3, 9 and 43 days, measurements were made on a significant sampling of coupons and O-rings to determine net changes in coupon dimensions of mass, volume, and hardness properties. Accomplishments The matrix of fuels tested, of varying aromatic content, provided a baseline for predicting the effects of static elastomer swell to the potential degree of swell/shrink that can be expected when these fuels are “switch-loaded.” The data set also provided a comparison of effects on coupons as well as O-rings which indicated similar overall trends and were in agreement with prior work. The use of an aromatic concentrate as a surrogate source of aromatics for blending in the paraffinic FT JP-5/JP-8 did not reveal any significant bias when compared to petroleum derived JP-5 and diesel fuel, although it was shown to have a reduced effect on elastomer change as compared to the petroleum fuels. Military Impact The possibility for the use of synthetic fuels by the U.S. Military opens up a whole new dimension in considering sources of supply and, most notably as a result, the associated potential for enhancing security of supply. Development of military specifications for fuel made from petroleum, as well as synthetic hydrocarbons, relies on military material evaluation data such as the elastomeric materials evaluations provided in this report.
ii

FOREWARD/ACKNOWLEDGMENTS This work was performed during FY04 at the labs of the Petroleum and Water Business Area (PWBA), part of the Tank-Automotive Research Development and Engineering Center (TARDEC) of the U.S. Army Research, Development and Engineering Command (RDECOM) located in Warren, MI. The funding for this work was provided through a FY04 Congressional Plus-up to study the concept of a barge-mounted plant for the production of synthetic JP-8/JP-5 fuel. This funding was allocated through the Office of the Secretary of Defense (OSD), Dr. Theodore K. Barna, Assistant Deputy Under Secretary of Defense/Advanced Systems and Concepts to the National Automotive Center (NAC), responsible for overall program management. The authors would like to acknowledge the efforts of several key contributors to this work. First of all, to PWBA Fuels & Lubricants Technology Team personnel, including Tonya Tant and Kathy Kline who performed the various tests involved in this evaluation. We also would like to acknowledge Mr. Herbert Dobbs, Jr., Team Leader of the Fuel Cell Technology Team, whose efforts in the arena of Fischer-Tropsch fuels for the military have furthered the impetus for advancing this new clean fuel and developing the data for its utilization.
iii

TABLE OF CONTENTS Page No.
I. OBJECTIVE .............................................................................................................. 5 II. BACKGROUND ....................................................................................................... 5 III. APPROACH ............................................................................................................ 6 A. Summary of Technical Approach .......................................................................................6 B. Fuels....................................................................................................................................6 C. Elastomers...........................................................................................................................7 D. Test Procedure ....................................................................................................................7 IV. RESULTS ............................................................................................................... 8 A. Effects on Swelling Behavior .............................................................................................8 B. Effects on Hardness ............................................................................................................10 V. DISCUSSION......................................................................................................... 11 VI. CONCLUSIONS & RECOMMENDATIONS.......................................................... 15 VII. REFERENCES..................................................................................................... 17 APPENDICES ............................................................................................................ 18
APPENDIX A Properties of S-5 Fuel.................................................................................19 APPENDIX B Link to Data Sheet for Aromatic Surrogate A150......................................21 APPENDIX C Properties of JP-5 and ECD-1 Fuels ..........................................................23 APPENDIX D Data Sheet for Nitrile N0674-70 Elastomer...............................................25 APPENDIX E Swelling Results, Changes in Mass and Volume .......................................28 APPENDIX F Fuel Effects on Hardness ............................................................................35 APPENDIX G Comparison of Swelling Results for Coupons and O-Rings......................38
LIST OF FIGURES
Figure 1. Average Mass Change (%) After 43 Days for Nitrile Elastomer N0674-70 Coupons ......... 9 Figure 2. Average Volume Change (%) After 43 Days for Nitrile Elastomer N0674-70 Coupons ..... 9 Figure 3. Average Mass Change (%) After 43 Days for Nitrile Elastomer N0674-74 O-rings ......... 10 Figure 4. Average Volume Change (%) After 43 Days for Nitrile Elastomer N0674-70 O-rings ..... 10 Figure 5. Average Hardness Change (%) After 43 Days for Nitrile Elastomer N0674-70 Coupons . 11 Figure 6. Comparison of Avg. Mass Changes (%) Between 2003 and 2004 Studies......................... 14 Figure 7. Comparison of Avg. Volume Changes (%) Between 2003 and 2004 Studies .................... 15
LIST OF TABLES
Table 1. List of Fuels ............................................................................................................................ 7 Table 2. Presence of Selected Fuel Components in Test Fuels ........................................................... 12 Table 3. Equilibrium Swell Results of Nitrile Specimens in Test Fuels ............................................ 13
iv

I. OBJECTIVE The overall goal of this study was to compare and contrast the material compatibility of a nitrile elastomer (typical of what might be found in the fuel systems of Army tactical and combat vehicles) with petroleum-derived diesel fuel and JP-5 (as reference fuels) and, synthetic GTL/FT JP-5 fuel of varing aromatic content (0%, 10% and 25% by volume). Underlying goals of this study were to: (1) evaluate and compare elastomer compatibility and swelling behavior of both coupons and O-rings in the selected fuels based on aromatic content (by volume) , (2) evaluate Aromatic A150 as a potential aromatic additive for neat FT fuels, and (3) evaluate reproducibility and repeatability of coupon results by comparison to prior coupon data.
II. BACKGROUND As the U.S. Military considers fuel sources around the world and into the future, it is very likely that fuels produced via non-conventional means become increasingly available and of growing importance. One such type of fuel, a synthetic fuel, can today be produced from a synthesis process first developed in the 1920’s known as Fischer-Tropsch. As a matter of fact, some limited production of coal-derived synthetic fuel has been a reality since the early 1970’s in South Africa, and starting in the early 1990’s synthetic fuel derived from natural gas has been produced in Bintulu, Indonesia. The possibility for the use of synthetic fuels by the U.S. Military opens up a whole new dimension in considering sources of supply. In turn, various scenarios for the production of synthetic fuel can be envisioned which could significantly contribute to increased energy security and enhanced mobility for the U.S. Military. With the developments now evolving in Qatar for construction of world-scale plants to produce fuels derived from natural gas via low temperature GTL/FT synthesis technologies, and the likelihood for these fuels to become increasingly available around the world, the potential use of these FT fuels by the U.S. Military needs to be considered. With this in mind, a joint-agency Memorandum of Agreement (MOA) to study the potential use of these fuels by the military was initiated in late 2002. This MOA, involving Department of Defense (DoD) fuels labs of the Army, Air Force, and Navy, along with the National Energy Technology Laboratory (NETL) of the Department of Energy (DoE), allows for “…cooperative research, development, testing, and evaluation (RDT&E) activities for innovative, alternative, and best-in-kind development and assessment of alternative fuels for the DoD and DoE programs. The principal technology of interest is synthetic JP-8/JP-5 fuel.” A synthetic JP-5 like fuel, produced by Syntroleum Corporation using their GTL process, was provided as the baseline synthetic fuel for investigation under a FY03 testing program agreed to by DoD and DoE labs. Elastomeric, or rubber-like, materials are used throughout the fuel distribution systems of air and ground vehicles and equipment as seals, coatings, for hoses and other various applications. These compounds have varying degrees of resistance and sensitivity to the fuels which they may encounter. Depending on the particular compound, some change in dimensions may result as the elastomer is exposed to the fuel. These changes in dimensions do not necessarily result in application performance issues, but may, for instance, when a dramatic change in the type of fuel being used in
5

the vehicle or equipment occurs. It is generally known that aromatic species in hydrocarbon fuels are primary contributors to elastomer swelling of Buna-N. In the case of a seal, aromatic constituents in the fuel will cause seals made from affected elastomers to increase in volume as absorption of the aromatic solute takes place. In likewise fashion, if that seal is then subjected to a fuel containing a much reduced level of aromatic solvents, the process may reverse itself and the seal may then decrease in size. Such a reduction in the size or volume of the seal at that point in time may result in poor sealing performance and possibly even leakage of fuel.
III. APPROACH
A. Summary of Technical Approach To assess the compatibility of the selected elastomeric compound in various fuels, a very fundamental approach was employed in this investigation. Coupons and O-rings of the selected elastomer material were immersed in each fuel, at elevated temperature (40°C), for a period of up to 43 days. Prior to immersion, and then at several intervals thereafter, measurements were made to determine net changes in mass, volume, and hardness properties. For the O-rings only, dimensional measurements were also made (inner diameter and cross-section) using an optical technique, and net changes in volume were also determined from this data. Measurements were made on a larger number of coupons and O-rings than required by the ASTM methods for determining changes in mass, volume and hardness to enhance the data sets for net changes in these properties.
B. Fuels The five fuels used in this study are indicated in Table 1. The first fuel listed, designated as ‘S-5’ is a high flash-point synthetic FT jet fuel meeting the physical/chemical properties of JP-5 and JP-8, but not containing additives required for JP-5 and JP-8. [1, 2, 3]1 JP-8 is the single battlefield fuel designated for use in all military aviation turbine engines and diesel engines, except for those used aboard ships where JP-5 is designated. JP-5 is essentially the same as JP-8, with one major difference being a higher flash point that provides added safety for shipboard use. The S-5 fuel was produced by Syntroleum Corporation using their gas-to-liquids FT technology to convert natural gas into liquid hydrocarbon fuel. The processes they employ include Fischer-Tropsch synthesis and synthetic crude upgrade to obtain the low freeze point temperature and other properties of JP-5/JP-8. [4] The fuel properties for the S-5 fuel are shown in Appendix A, Table A-1. A petroleum-based aromatic hyrdrocarbon fluid manufactured by ExxonMobil, Aromatic A150, was added to neat S-5 to produce the two other synthetic fuel blends used in this study, S-5 + 10% A150 and S-5 + 25% A150, with aromatic contents of 10% vol. and 25% vol., respectively. A link to the datasheet for Aromatic A150 is included in Appendix B. The two petroleum fuels used in the study are a Navy-provided JP-5 fuel, and Emission Control Diesel-1 (ECD-1) from the former Arco Refinery, near Los Angeles, now owned by BP. ECD-1 is
1 Numbers between brackets refer to References found at the end of the document.
6

a CARB-equivalent ultra-low sulfur fuel equivalent2 No. 2 Diesel, with sulfur < 15 ppm and approximately 19% vol. aromatics. [5] Laboratory tests indicate that JP-5 is approximately 18% vol. aromatics. The fuel properties for the JP-5 fuel are shown in Appendix C, Table C-1, along with data for the ECD-1 fuel. As shown in Table 1, the synthetic fuel, S-5, contains no aromatics. This is representative of synthetic fuels that are produced from FT synthesis utilizing low reactor temperatures and cobalt or iron based catalyst. ECD-1 is representative of diesel fuel derived from conventional sources, such as petroleum crude oil, in that they contain aromatics. The current specification for low sulfur diesel fuels [4] in the U.S. allows up to 35% vol. aromatics. Likewise, the current specifications for JP-8 and JP-5 allows up to 25% vol. aromatics. [2, 3]
Table 1. List of Fuels Fuel Name Fuel Description Sample ID Number
S-5 0% aromatics FL-11741-03 S-5 + 10% A150 10% vol. aromatics FL-11741-03 + 10% FL-11755-03
JP-5 18% vol. aromatics FL-11891-04 ECD-1 19% vol. aromatics, ultra-low sulfur FL-11749-03
S-5 + 25% A150 25% vol. aromatics FL-11741-03 + 25% FL-11755-03 A150 aromatic additive FL-11755-03
C. Elastomers Elastomer N0674-70, a general purpose 70-durometer nitrile elastomer, was chosen for this study. Properties of this material, a compound of the Parker O-Ring Division, are shown in Appendix D. Elastomer N0674-70 is a nitrile elastomer typically found in some fuel systems of Army tactical and combat vehicles. Studies conducted in 2003 indicated that this elastomer was particularly sensitive to swelling (related to aromatic hydrocarbons in test fuels) compared to the fuel resistant chlorinated carbon polymers. [7, 8]
D. Test Procedure Elastomer coupons (25 × 50 × 2.0 ± 0.1 mm), cut from sheets of the elastomer, and elastomer O-rings (9.12-9.37 mm inner diameter × 1.70-1.85 mm cross-section diameter) were stored in glass vessels containing each of the test fuels. The samples were stored at 40οC (104οF) and measurements were made at 0, 3, 9, and 43 days. For the determination of swelling response, volume change due to swell was determined based on a water displacement technique and according to ASTM D 471 procedures. [9] Mass change was also determined according to ASTM D 471. Measurements were made on 4 unique coupons and 4 unique O-rings, respectively, for each data point.
2 The term ‘fuel equivalent’ refers to fuels that meet emission requirements without meeting fuel property requirements.
7

In addition, physical measurements were made on each O-ring and averaged to calculate the % change in dimensions according to ASTM D 471 (section 17.3). This physical measurement data was deemed unreliable and not included in this report. For measuring hardness, the ASTM D 2240 test method was followed. [9] All data points were generated in triplicate.
IV. RESULTS Results are presented covering the effects of the five fuels on elastomer N0674-70 coupons and O-rings as evidenced by changes in mass, volume (for swelling behavior) and by changes in hardness. One aspect of this investigation related to fuel additives should be noted at this point. The synthetic fuel, S-5, was evaluated as a neat fuel and therefore it did not contain any antioxidants or other military JP-8/JP-5 additives. The S-5 fuel, being very iso-paraffinic in nature, would likely be susceptible to oxidation and in practice would contain antioxidant similar to the practice used for highly hydrotreated fuels. However, during the course of this investigation, no attempts were made to determine whether oxidation of this fuel had or was occurring. These results, then, are presented without any such knowledge regarding oxidation of the S-5 fuel or therefore, how such oxidation, if present, might impact the effects of the fuel on the elastomers. ECD-1 fuel, being commercially produced, may have contained antioxidants. Fuels made from regular petroleum crude would be less prone to oxidation than the S-5 fuel, unless they were highly hydrotreated and in such case the use of antioxidants is required.
A. Effects on Swelling Behavior The average coupon mass and volume change found after 43 days of immersion in the various fuels at 40°C is shown in Figures 1 and 2, respectively. Likewise, for the O-rings, the average mass and volume changes after 43 days of immersion are shown in Figures 3 and 4, respectively. This data is based on average values from measurements on four (4) coupons or O-rings. A tabular summary of this data, including standard deviations, is provided in Appendix E, Table E-1 and E-2. Also included in Appendix E are charts in Figures E-1 through E-4, showing changes in mass and volume at days 3, 9 and 43 days and Figures E-5 through E-8 showing changes in mass and volume over time. For both coupons and O-rings, the changes in volume as presented in the Figures 1-4, and Appendix E, were determined based on the water displacement method per ASTM D 471. The results determined for changes in volume of the O-rings, only, were also determined based on dimensional measurements. These results are presented in the Discussion Section of this report.
8

Nitrile Elastomer N0674-70 Coupons
0123456789
Ave
rage
Mas
s C
hang
eat
43
Day
s (%
)
Figure 1. Avera
0
2
4
6
8
10
12
14
16
Ave
rage
Vol
ume
Cha
nge
at 4
3 D
ays
(%)
Figure 2. Averag
40°C test temperature
S-5 S-5 +10%A150
JP-5 ECD-1 S-5 +25%A150
ge Mass Change (%) After 43 Days for Nitrile Elastomer N0674-70 Coupons
Nitrile Elastomer N0674-70 Coupons
40°C test temperatureS-5 S-5 +10%A150
JP-5 ECD-1 S-5 +25%A150
e Volume Change (%) After 43 Days for Nitrile Elastomer N0674-70 Coupons
9

Nitrile Elastomer N0674-70 O-rings
-0.5
0.0
0.5
1.0
1.5
2.0Av
erag
e M
ass
Cha
nge
at 4
3 Da
ys (%
)
Figure 3. Aver
-4
-2
0
2
4
6
8
10
Aver
age
Volu
me
Cha
nge
at 4
3 D
ays
(%)
Figure 4. Avera
B. Effects on H The average hardness fuels at 40°C is shown
40°C test temperature
S-5 S-5 +10%A150
JP-5 ECD-1 S-5 +25%A150
age Mass Change (%) After 43 Days for Nitrile Elastomer N0674-74 O-rings
Nitrile Elastomer N0674-70 O-rings
40°C test temperatureS-5 S-5 +10%A150
JP-5 ECD-1 S-5 +25%A150
ge Volume Change (%) After 43 Days for Nitrile Elastomer N0674-70 O-rings
ardness
changes found for each elastomer after 43 days of immersion in the various in Figure 5. This data is based on the average values from measurements on
10

three (3) coupons. A tabular summary of this data, including standard deviations, is shown in Appendix F, Table F-1. Also included in Appendix F are charts in Figures F-1 through F-7 showing changes in hardness versus time.
Nitrile Elastomer N0674-70 Coupons
-10
-9
-8
-7
-6
-5
-4
-3
-2
-1
0S-5 S-5+10%
A150JP-5 ECD-1 S-5+25%
A150
Ave
rage
Har
dnes
s Ch
ange
at 4
3 Da
ys (%
)
40°C test temperature
Figure 5. Average Hardness Change (%) After 43 Days for Nitrile Elastomer N0674-70 Coupons
V. DISCUSSION Based on prior work, it was determined that elastomer N0674-70 is particularly sensitive to swell in the presence of aromatic hydrocarbons. The approach in this investigation, therefore, was to determine the effects of petroleum-based fuels (JP-5 and ECD-1) on this elastomer and to compare these results with results of the same determinations for synthetic fuel containing 0% aromatics (S-5), and synthetic fuel (S-5) blended with Aromatic A150 to achieve levels of 10% vol. aromatics and 25% vol. aromatics, respectively. The fuels tested had aromatic contents in increasing amounts as follows: S-5 (0% vol.), S-5 + 10% A150 (10% vol.), JP-5 (18% vol.), ECD-1 (19% vol.), and S-5 + 25% A150 (25% vol.). Nitrile N0674-70 coupons experienced swelling when immersed in each test fuel. The overall trend was that the amount of swelling increased as the fuel aromatic content increased; i.e., the greatest amount of swell was measured for immersion in S-5 + 25% A150. By day 43, Nitrile N0674-70 coupons exposed to S-5 + 25% A150 had increased in volume by 14.7%. Some interesting observations can be made, however, in studying responses in more detail, particularly for coupons exposed to the petroleum-based fuels (JP-5 and ECD-1) versus the S-5 + 25% A150. Coupons exposed to JP-5 reached a change in volume approaching that of the coupons exposed to S-5 + 25% A150 (+11.0% and +14.7% respectively), even though significantly less aromatics are present in the JP-5 fuel versus the S-5 + 25% A150 (+18% vol. and 25% vol. respectively). On the other hand, coupons exposed to ECD-1 experienced slightly less change in volume to that of coupons exposed to JP-5 (+10.2% vol. and +11.0% vol. respectively), even though the aromatic content of ECD-1 is similar to that of JP-5 (19% vol. and 18% vol. respectively). These non-linear responses of swell for nitrile in these three fuels (S-5 + 25% A150, JP-5, and ECD-1) can be attributed to differences in
11

fuel composition as indicated by more than just aromatic “content” (concentration); i.e., not only is the concentration of aromatics present a factor in the degree of swell, but so too is the specific type of aromatics eg., degree of alkyl substitution. In research being conducted by the the University of Dayton Research Institute (UDRI) in conjunction with the Air Force Research Laboratory (AFRL), under the same MOA as the research performed by TARDEC documented herein, it has been shown that nitrile exhibits preferential absorption of the fuel components in the order aliphatics<aromatics<di-aromatics<di-EGME. [10] Note that the latter component in this hierarchy, di-EGME, is not a naturally-occurring component in JP (Jet Propulsion) fuels, but rather a required additive in JP-8/JP-5 fuels as a fuel system icing inhibitor. [1, 2, 11] The di-EGME, along with other components such as methyl phenols and methyl esters which do occur naturally in JP fuels, are polar in nature. As shown in the work by AFRL-UDRI, polar components in fuels, even at very low concentrations, particularly di-EGME, may significantly influence the swelling behavior of nitrile in such fashion as to make it “more easily swollen by the less polar components of the fuel such as the aromatics.” With this background, we have some plausible explanation for the non-linear response in nitrile swell found in the study herein. Table 2 lists selected fuel components and indicates their presence in the test fuels. As shown in Table 2, the JP-5 fuel used in this study does contain di-EGME (see Appendix C), in addition to aromatics and would be expected to also contain other polar components. ECD-1 would also be expected to contain polar components; neither ECD-1 nor S-5 + 25% A150 contain di-EGME (as deliberately added or as anticipated otherwise). Therefore, we would anticipate that the effectiveness of these fuels in swelling nitrile would be in the order JP-5>ECD-1>S-5+ 25% A150, and the data generated in this study supports this conclusion. There may be other factors relating to differences in aromatic composition, such as the degree of alkylation on the aromatic ring and the molecular weight of the alkyl-substituted monoaromatic rings, which would also explain the relative swelling effectiveness of these fuels.
Table 2. Presence* of Selected Fuel Components in Test Fuels Fuel Component
JP-5
ECD-1
S-5 + 25% A150
di-EGME + Polars (in addition to di-EGME) + + Diaromatics + + + Monoaromatics + + +
* As detected in testing or as anticipated. The results for equilibrium swell, expressed as % vol. change at day 7 and day 43, between the UDRI study and this study (TARDEC) respectively, are compared in Table 3. The tests were conducted with different nitrile compounds, and the duration of immersion and fuel temperature during immersion were different, so it is difficult to draw any strong conclusions regarding similarities or differences between the results. In the TARDEC study, the size of the O-rings used were specifed per SAE AS568-012, with as manufactured dimensions called out for inner diameters of 9.12-9.37 mm and cross sections of 1.70-1.85 mm, resulting in a range for O-ring volume (calculated), as manufactured, of 77.16-94.75 mm3 ; the O-ring size used in the UDRI study was not reported. In the TARDEC study the net swell of the nitrile O-ring immersed in S-5 was negative (-2.9%), where as in the UDRI study a +1.7% change occurred; note, however, that in this study the
12

change was +3.0% for the nitrile coupon. A notable difference is seen for the O-ring swell values in JP-5 fuel. In the UDRI study a +15.0% change was found, where as in the TARDEC study a change of only 4.9% was measured; note, however, that in this study a change of +11.0% was measured for the coupons.
Table 3. Equilibrium Swell Results of Nitrile Specimens in Test Fuels Results reported as % vol. change per water displacement method
in ASTM D 471 unless otherwise noted.
UDRI Study Nitrile N-602,
7 days at 21°C
TARDEC Study Nitrile N0674-70, 43 days at 40°C
Fuel (vol. aromatics) O-Rings O-Rings O-Rings1 CouponsS-5 (0%) 1.7% -2.9% -4.0% 3.0% S-5 + A150 (10%) 2.0%2 2.9% 5.0% 7.4% JP-5/S-5 (10%) 7.5%2 – – JP-5 (18%)3 15.0% 4.9% 8.7% 11.0% ECD-1 (19%) – 5.6% 4.4% 10.2% S-5 + A150 (25%) 10.5% 9.4% 13.4% 14.7% 1Results shown are calculated from O-ring inner diameter (ID) and O-ring cross-section (CS) dimensions determined via a video microscope (Photovolt Microwatcher VS-35H) at ×10 magnification where volume (V) is V = ¼π 2 × CS2 × (ID + CS). 2These values were interpreted from plots. 3The JP-5 aromatics level of 20% reported in the UDRI study is slightly different than the 18% determined by PWBA Lab, even though the samples are reported to be of the same sample lot held by Navy.
In the TARDEC study, Nitrile N0674-70 O-rings experienced swelling when immersed in each test fuel, with the exception of neat S-5. Unlike the nitrile coupons tested, the O-rings exposed to S-5 actually decreased slightly in volume (shrank) by 2.9% with a slight corresponding decrease in mass (0.3%). Differences in the TARDEC study between the volume changes for the coupons versus the O-rings might relate to the composition of the nitrile and the nitrile test specimen itself. Although both the O-rings and coupons are identified as being made of Nitrile N0674-70, they almost certainly were not produced from the same lot/batch of material (they were purchased from different suppliers), so there are may be some variations in composition. The nitrile’s properties, and thus response to its environment, may also be affected by the manufacturing processes employed. The coupon test specimens were fabricated (cut) from nitrile sheet material, which most likely was extruded, while the O-rings were molded. Still, the overall trend in the amount of nitrile swelling for the O-rings was similar to that found for the coupons, i.e., the greatest amount of swell was measured with S-5 + 25% A150 (+9.4% and +13.4% for O-rings and 14.7% for coupons). According to the coupon data, the most effective fuel in swelling, relative to aromatic content, occurred with JP-5 fuel (11.0% swell), then ECD-1 (10.2% swell), then S-5 + 25% A150 (14.7% swell). This overall trend did not hold as true for the O-ring data. For the O-ring data as derived by the water displacement method, the swell in JP-5 was only 4.9% and in ECD-1 only 5.6%, as compared to the swell in S-5 + 25% A150 of 9.4%. For the O-ring data as derived from dimensional measurements, the swell in JP-5 was 8.7%, as compared to the swell in ECD-1 of only 4.6% and in S-5 + 25% A150 of 13.4%. In this case, the O-ring data does support the JP-5 as being more effective in swelling than the ECD-1, but not more so than the S-5 + 25% A150.
13

For the TARDEC coupon and o-ring swelling results only, charts showing changes versus time can be found in Appendix G. Changes in durometer points were observed for all coupons after exposure to the fuels. At the end of 43 days, Nitrile N0674-70 coupons had decreases in durometer points in all fuels; i.e., the elastomer material softened. The trend was that the degree of softness measured increased with increasing aromatic content of the fuel. The largest change was measured in coupons exposed to the S-5 + 25% A150 with a change in durometer points of -8.7% at 43 days. In addition, the trend identified from the coupon data for swelling effectiveness of the fuels, JP-5>ECD-1>S-5+ 25% A150, also held for softening effectiveness as indicated by data for coupons (note: hardness data was not determined for O-rings since specimen geometry cannot accommodate such a measurement). A similar investigation, that included the same or similar fuels and the same elastomer as selected for this investigation, Nitrile N0674-70 coupons, was reported by TARDEC in November 2003 [8]. Comparisons of the average mass, volume and hardness results between the similar fuels used in both studies are shown in Figures 6 and 7, respectively. Both studies evaluated S-5 with 0% vol. aromatics, S-5 + 10% vol. aromatics, ECD-1 with 19% vol. aromatics, and S-5 + 25% vol. aromatics. Results are generally consistent between the two studies, although some changes, particularly for the measurements with S-5 and S-5 + 25% A150, are somewhat higher for the 2004 data than for the 2003 data. Since the S-5 fuel used in this study was produced in late 2002 and stored since without any antioxidant, some peroxide formation may have occurred. Peroxide attack of the nitrile might, then, be a possible explanation for the higher values seen with some of the S-5 data in 2004 versus 2003. Significant peroxide formation during 40°C storage is more likely than in sealed drum storage, in terms of magnitude.
Nitrile Elastomer N0674-70 Coupons
0
1
2
3
4
5
6
7
8
9
S-5 S-5 +10% A150 ECD-1 S-5 +25% A150
Aver
age
Mas
s Ch
ange
at 4
3 D
ays
(%)
2003 Data 2004 Data
40°C test temperature
Figure 6. Comparison of Avg. Mass Changes (%) Between 2003 and 2004 Studies
14

Nitrile Elastomer N0674-70 Coupons
0
2
4
6
8
10
12
14
16
S-5 S-5 +10% A150 ECD-1 S-5 +25% A150
Aver
age
Vol
ume
Cha
nge
at 4
3 D
ays
(%)
2003 Data 2004 Data
40°C test temperature
Figure 7. Comparison of Avg. Volume Changes (%) Between 2003 and 2004 Studies
VI. CONCLUSIONS & RECOMMENDATIONS In this investigation, the effects of the synthetic S-5 fuel, derived from low temperature GTL/FT synthetic crude upgraded by hydrocracking and hydrotreating, on nitrile type elastomer N0674-70 is contrasted with two fuels produced from petroleum crude oil and two blends containing 10% and 25% of an aromatic concentrate (Aromatic A150) in the S-5. The conventional petroleum JP-5 was provided by the Navy and the ECD-1 was a commercially available diesel fuel of ultra-low sulfur content (<15 ppm). All five fuels caused a significant change in nitrile elastomer N0674-70 for both coupons and O-rings. The trend in the amount of change generally increased with increasing aromatic content, however aromatic content (concentration) alone is not sufficient to explain the differences in response found between the petroleum fuels, JP-5 and ECD-1, and the fuel blends of S-5 with 25% by volume of the aromatic concentrate (Aromatic A150). The use of an aromatic concentrate as a surrogate source of aromatics for blending in the paraffinic FT JP-5/JP-8 did not reveal any significant bias when compared to petroleum derived JP-5 and diesel fuel, although it was shown to have a reduced effect on elastomer change as compared to the petroleum fuels. A more pronounced response was determined for the JP-5 and ECD-1 fuels (in case of coupon data and some of the O-ring data) than for the S-5 blends and this can be attributed to other compositional differences such as the presence of polar components in the petroleum fuels, especially the di-EGME in the JP-5 fuel. One of the key objectives of the DoD-DoE Team working together in assessing the potential use of FT fuel by the military is to determine a FT fuel formulation that is fully synthetic and is also freely interchangeable in the existing DoD fleet. With the type of FT fuel studied herein, one that is produced via a low temperature Fischer-Tropsch reaction, the resultant FT jet fuel will be free of aromatic and polar components. As supported by the work of the DoD-DoE Team, such a FT fuel
15

formulation is indicated to be short of the objective of being a freely interchangeable fuel due to the differences in some elastomer’s response to such a FT fuel and, as a result, the possibility for performance degradation, namely fuel leakage, in some equipment. One possible solution to developing a freely interchangeable FT fuel formulation is to develop an additive that can mitigate these differences in elastomer response. Such an approach is being investigated by the team, led by the research previously referenced being done at UDRI. [10] Once candidate additives are identified, those should be evaluated in the same fashion as done in the study herein, to determine elastomer response and to compare to the baseline work established from this study and the prior 2003 study. Note that the volume swell of the nitrile coupons were significantly larger than that of the O-rings. In order to further understand the possible implications of switch-loading fuels of significantly different aromatic compositions in the existing fleet of Army tactical and combat vehicles, elastomer material evaluations should be conducted with an expanded population of elastomer compounds, drawing elastomer components from rebuild kits across a representative array of the vehicles in the fleet. The elastomer compounds used for these components, then, would be the most reflective of what is currently being used in the fleet.
16

VII. REFERENCES
1. Muzzell, P.; Freerks, R.; Baltrus, J.; Link, D. “Composition of Syntroleum S-5 and Conformance to JP-5 Specification” Preprint Paper–American Chemical Society, Division of Petroleum Chemistry 2004, 49(4), 411-413.
2. Military Specification, MIL-DTL-5642U, “Detail Specification, Turbine Fuel, Aviation,
Grades JP-4 and JP-5”, 5 January 2004. 3. Military Specification, MIL-DTL-83133E, “Detail Specification, Turbine Fuels, Aviation,
Kerosene Types, NATO F-34 (JP-8), NATO F-35, and JP-8+100”, 1 April 1999.
4. Muzzell, P.; Freerks, R. “Production and Characterization of Synthetic Jet Fuel Produced from Fischer-Tropsch Hydrocarbons” Preprint Paper–American Chemical Society, Division of Petroleum Chemistry 2004, 49(4), 407-410.
5. Walls, M.; Montemayor, A.; Stavinoha, L.; Dobbs, H.; Williams, J. “Fuel Cell Introduction
into a Class 8 Truck” SAE Paper No. 2003-01-3410, October 2003.
6. ASTM International, ASTM D 975 – 03, “Standard Specification for Diesel Fuel Oils”, Approved 5/10/2003, Published July 2003.
7. Muzzell, P.; Stavinoha, L.; Villahermosa, L.; Chapin, R.; McKay, B. “Synthetic JP-5
Aviation Turbine Fuel Elastomer Compatibility” TARDEC Report No. 13978, November 2003.
8. Muzzell, P.; Stavinoha, L.; Villahermosa, L. “Elastomer Impact When Switch-Loading
Synthetic And Petroleum Fuel” TARDEC Report No. 14037, March 2004.
9. ASTM International, Annual Book of ASTM Standards, Section Five, Petroleum Products, Lubricants, and Fossil Fuels, 2003.
10. Graham, J.; Striebich, R.; Minus, D.; Harrison III, W. “The Swelling of Selected O-Ring
Materials in Jet Propulsion and Fischer-Tropsch Fuels” Preprint Paper–American Chemical Society, Division of Petroleum Chemistry 2004, 49(3&4).
11. Military Specification, MIL-DTL-85470B, “Detail Specification, Inhibitor, Icing, Fuel
System, High Flash NATO Code Number S-1745” 15 June 1999.
17

APPENDICES
18

APPENDIX A
Properties of S-5 Fuel
19

Table A-1 Properties of S-5 Fuel
Analysis by USARMY
Property, Units Test Method
S-5 X-03-001 Unadditized
Batch 0001, Lot 0002
Flash point, °C ASTM D 56 62
Freezing point, °C: ASTM D 5972 -50
Saybolt Color ASTM D 156 + 30
Total Sulfur, wt % ASTM D 5185 <1 ppm
Distillation temperature, °C: ASTM D 86
Initial boiling point 183
10% recovered 194
20% recovered 201
50% recovered 219
90% recovered 254
Final boiling point (end point) 267
residue, % vol. 1.3
loss, % 0
Density at 15°C, kg/m3 ASTM D 1298 0.764
Calculated Cetane Index ASTM D 976 (ASTM D 4737) 69.5/67.3*(74.0)
Aromatics, % vol. Internal method** <1
Kinematic Viscosity, mm2/s @ -20°C ASTM D 445 6.0
Total Acid Number, mg KOH/g ASTM D 664 0.0014
Total Water Content, % ASTM D 6304 0.0019
Conductivity, pS/m ASTM D 2624 1 Notes: * Results shown for Equation 1/Equation 2 calculations ** Internal Method
20

APPENDIX B
Link to Data Sheet for Aromatic Surrogate A150
21

http://www.exxonmobilchemical.com/Public_Products/Fluids/Aromatics_HeavyAromatics/Worldwide/Grades_and_DataSheets/Aro_HeavyAromatics_Solvesso_Grades_WW.asp
22

APPENDIX C
Properties of JP-5 and ECD-1 Fuels
23

Table C-1 Properties of JP-5 and ECD-1 Fuels
ASTM Test Method
Analysis by Army FL-11981-04
Analysis by Navy 1
FF-03-033
Analysis by SwRI FL-11749-03
Appearance D 156
Flash point, °C D 56 (D 93) N.A.2 (62) (48)
Freezing point, °C: D 5972 (D 2386) -47 (-50) (-8)
Saybolt Color D 156 22 26 N.A.
Total Sulfur, wt % D 2622 (D 4294) 0.11 (0.12) <0.001
Distillation temperature, °C: D 86
Initial boiling point 181 176 180
10% recovered 190 188 204
20% recovered 193 193 213
50% recovered 207 206 247
90% recovered 236 235 314
Final boiling point (end point) 251 252 343
residue, % vol. 1.3 N.A. 1.4
loss, % 0.9 N.A. N.A.
Density at 15°C, kg/m3 D 1298 (D 4052) 0.803 (0.803) 0.821
Calculated Cetane Index D 976 (ASTM D 4737) 46.0/46.0 (47.7) N.A. 52.6/N.A. (53.6)
Aromatics, % vol. (% wt.) D 1319 (D 5186) 18.4 19.8 -19.3
Kinematic Viscosity, mm2/s D 445
at -20°C 4.7 4.8 N.A.
at 40°C 1.4 N.A. 2.18
Total Acid Number, mg KOH/g D 664 (D 3242) <0.001 (0.003) <0.01
Total Water Content, % D 6304 0.005 N.A. 0.0125
Conductivity, pS/m D 2624 5 N.A. N.A.
Notes:
2 Pending repair of equipment.
Property, Units
1 The analysis provided by the Navy showed presence of Fuel System Icing Inhibitor, di-EGME, at 0.16% vol. as determined by ASTM D 5006.
JP-5 Fuel Data ECD-1 Data
24
APPENDIX D
Data Sheet for Nitrile N0674-70
Elastomer
25

Table D-1 • Parker Compound N0674-70 Data Sheet
Compound Data Sheet O-Ring Division United States
_______________________________________________________________
MATERIAL REPORT
REPORT NUMBER: KK2046 DATE: 2/06/90
TITLE: Evaluation of Parker Compound N0674-70 to ASTM D2000 2BG 720 EA
14 E014 E034.
PURPOSE: To document conformance to periodic test. CONCLUSION: Parker Compound N0674-70 meets the requirements of ASTM D2000 2
BG 720 EA14 E014 E034. Recommended Temperature Range: -30 to 250F
Recommended for: petroleum oils, water (up to 212F), Salt & Alkali solutions, weak acids Not Recommended for: aromatic fuels, strong acids, glycols, ozone, polar solvents
Parker O-Ring Division 2360 Palumbo Drive
Lexington, Kentucky 40509 (859) 269-2351
26

Table D-1 • Parker Compound N0674-70 Data Sheet
REPORT DATA
Report Number: KK2046 N0674-70 ATM D2000 PLATEN BASIC PROPERTIES 2BG720 EA14 E014 E034 RESULTS Hardness, Shore A, pts. 70 ± 5 71 Tensile Strength, psi. min. 2000 2546 Elongation, % min. 250 331 HEAT RESISTANCE 70 HRS. @ 212°F Hardness chg. pts. ±15 +6 Tensile Strength chg, % ±30 +6.3 Elongation chg, % max. -50 -30.2 COMPRESSION SET, 22 HRS. @ 212°F % of original deflection, max. 50 12.6 EA14 WATER RESISTANCE, 70 HRS. @ 212°F Hardness chg. pts. ±10 +1 Volume chg, % max. ±15 +1.1 EO14 ASTM #1 OIL, 70 HRS. @ 212°F Hardness chg. pts. -5 to +10 +3 Tensile Strength chg, % max -25 +5.5 Elongation chg, % max -45 -15.1 Volume chg, % -10 to +5 -2.3 EO34 ASTM #3 OIL, 70 HRS. @ 212°F Hardness chg. pts. -10 to +5 -7 Tensile Strength chg, % max -45 +2.9 Elongation chg, % max -45 -7.9 Volume chg, % 0 to +25 +13.5
27
APPENDIX E
Swelling Results, Changes in Mass and
Volume
28
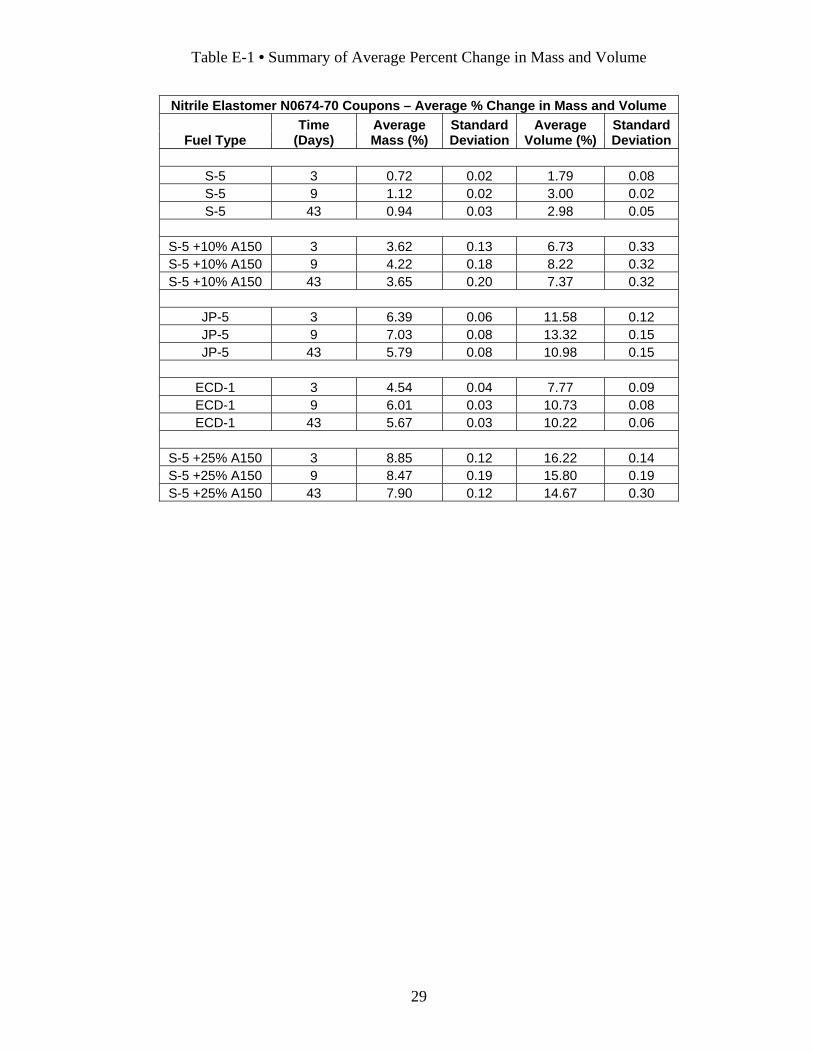
Table E-1 • Summary of Average Percent Change in Mass and Volume
Nitrile Elastomer N0674-70 Coupons – Average % Change in Mass and Volume
Fuel Type Time
(Days) Average Mass (%)
Standard Deviation
Average Volume (%)
Standard Deviation
S-5 3 0.72 0.02 1.79 0.08 S-5 9 1.12 0.02 3.00 0.02 S-5 43 0.94 0.03 2.98 0.05
S-5 +10% A150 3 3.62 0.13 6.73 0.33 S-5 +10% A150 9 4.22 0.18 8.22 0.32 S-5 +10% A150 43 3.65 0.20 7.37 0.32
JP-5 3 6.39 0.06 11.58 0.12 JP-5 9 7.03 0.08 13.32 0.15 JP-5 43 5.79 0.08 10.98 0.15
ECD-1 3 4.54 0.04 7.77 0.09 ECD-1 9 6.01 0.03 10.73 0.08 ECD-1 43 5.67 0.03 10.22 0.06
S-5 +25% A150 3 8.85 0.12 16.22 0.14 S-5 +25% A150 9 8.47 0.19 15.80 0.19 S-5 +25% A150 43 7.90 0.12 14.67 0.30
29

Table E-2 • Summary of Average Percent Change in Mass and Volume
Nitrile Elastomer N0674-70 O-rings - Average % Change in Mass and Volume
Fuel Type Time
(Days) Average Mass (%)
Standard Deviation
Average Volume (%)
Standard Deviation
S-5 3 0.11 0.03 1.24 0.47 S-5 9 -0.11 0.03 1.14 0.94 S-5 43 -0.30 0.06 -2.92 0.45
S-5 +10% A150 3 1.05 0.07 6.65 0.99 S-5 +10% A150 9 0.69 0.09 5.36 1.19 S-5 +10% A150 43 0.54 0.09 2.87 1.25
JP-5 3 1.67 0.06 9.00 1.26 JP-5 9 1.28 0.06 7.45 0.95 JP-5 43 1.19 0.05 4.87 0.44
ECD-1 3 1.53 0.02 7.45 0.88 ECD-1 9 1.34 0.03 7.45 0.99 ECD-1 43 1.26 0.03 5.61 0.90
S-5 + 25% A150 3 2.28 0.07 13.16 1.16 S-5 + 25% A150 9 1.86 0.11 10.93 1.38 S-5 + 25% A150 43 1.81 0.09 9.37 1.04
30

Nitrile Elastomer N0674-70 Coupons
0
1
2
3
4
5
6
7
8
9
10
Aver
age
Mas
s Ch
ange
(%)
Figu
0
2
4
6
8
10
12
14
16
18
Aver
age
Vol
ume
Chan
ge (%
)
Figur
40°C test temperature
S-5 S-5 +10% A150 JP-5 ECD-1 S-5 +25% A150
3 days 9 days 43 days
re E-1. Average Mass Change (%) at 3, 9 and 43 Days for Nitrile Elastomer N0674-70 Coupons
Nitrile Elastomer N0674-70 Coupons
40°C test temperatureS-5 S-5 +10% A150 JP-5 ECD-1 S-5 +25% A150
3 days 9 days 43 days
e E-2. Average Volume Change (%) at 3, 9 and 43 Days for Nitrile Elastomer N0674-70 Coupons
31

Nitrile Elastomer N0674-70 O-rings
-0.5
0.0
0.5
1.0
1.5
2.0
2.5
S-5 S-5 +10% A150 JP-5 ECD-1 S-5 +25% A150
Ave
rage
Mas
s C
hang
e (%
)
3 days 9 days 43 days
40°C test temperature
Figure E-3. Average Mass Change (%) at 3, 9 and 43 Days for Nitrile Elastomer N0674-70 O-rings
Nitrile Elastomer N0674-70 O-rings
-4
-2
0
2
4
6
8
10
12
14
16
S-5 S-5 +10% A150 JP-5 ECD-1 S-5 +25% A150
Ave
rage
Vol
ume
Cha
nge
(%)
3 days 9 days 43 days
40°C test temperature
Figure E-4. Average Volume Change (%) at 3, 9 and 43 Days for Nitrile Elastomer N0674-70 O-rings
32

Nitrile Elastomer N0674-70 Coupons
012
34567
89
10
0 5 10 15 20 25 30
Time (Days)
Ave
rage
Cha
nge
in M
ass
(%)
S-5 S-5 +10% A150 JP-5 ECD-1
Figure E-5. Average Mass Change (%) Over Time for Nitrile Ela
Nitrile Elastomer N0674-70 Coupons
0
2
4
6
8
10
12
14
16
18
0 5 10 15 20 25 30
Time (Days)
Aver
age
Chan
ge in
Vol
ume
(%)
S-5 S-5 +10% A150 JP-5 ECD-1
Figure E-6. Average Volume (%) Change Over Time for Nitrile El
33
40°C test temperature
35 40 45
S-5 +25% A150
stomer N0674-70 Coupons
40°C test temperature35 40 45
S-5 +25% A150
astomer N0674-70 Coupons

Nitrile Elastomer N0674-70 O-rings
-1
0
1
1
2
2
3
0 5 10 15 20 25 30 35 40 45
Time (Days)
Aver
age
Chan
ge in
Mas
s (%
)
S-5 S-5 +10% A150 JP-5 ECD-1 S-5 +25% A150
40°C test temperature
Figure E-7. Average Mass Change (%) Over Time for Nitrile Elastomer N0674-70 O-rings
Nitrile Elastomer N0674-70 O-rings
-4
-2
0
2
4
6
8
10
12
14
16
0 5 10 15 20 25 3
Time (Days)
Aver
age
Chan
ge in
Vol
ume
(%)
S-5 S-5 +10% A150 JP-5 ECD
Figure E-8. Average Volume Change(%) Over Time for Nitrile
34
40°C test temperature
0 35 40 45
-1 S-5 +25% A150
Elastomer N0674-70 O-rings
APPENDIX F
Fuel Effects on Hardness
35

Table F-1 Summary of Average Percent Change in Hardness
Elastomer N0674-70 Coupons - Change in Hardness
Fuel Type Time
(Days) Average
HardnessStandard Deviation
Average Hardness (%)
Standard Deviation
S-5 0 73.33 0.23 S-5 3 72.20 0.28 -1.55 0.01 S-5 9 72.50 0.14 -1.14 0.19 S-5 43 72.87 0.12 -0.64 0.41
S-5 + 10% A150 0 72.87 0.37 S-5 + 10% A150 3 69.60 0.49 -4.48 0.41 S-5 + 10% A150 9 69.30 0.35 -4.89 0.83 S-5 + 10% A150 43 69.77 0.15 -4.25 0.67
JP-5 0 73.20 0.35 JP-5 3 68.80 0.00 -6.01 0.55 JP-5 9 68.20 0.28 -6.83 0.39 JP-5 43 68.33 0.12 -6.65 0.54
ECD-1 0 73.07 0.12 ECD-1 3 70.70 0.71 -3.24 0.78 ECD-1 9 69.30 0.14 -5.16 0.01 ECD-1 43 68.73 0.12 -5.93 0.15
S-5+25% A150 0 73.20 0.28 S-5+25% A150 3 66.00 0.43 -9.84 0.79 S-5+25% A150 9 65.70 0.50 -10.25 0.80 S-5+25% A150 43 66.80 0.18 -8.74 0.32
36

Nitrile Elastomer N0674-70 Coupons
-12
-10
-8
-6
-4
-2
0S-5 S5+10% A150 JP-5 ECD-1 S5+25% A150
Ave
rage
Har
dnes
s C
hang
e (%
)
Figure F
Figu
40°C test temperature
3 Days 9 Days 43 Days
-1. Average Hardness Change (%) at 3, 9 and 43 Days for Nitrile Elastomer N0674-70 Coupons
Nitrile Elastomer N0674-70 Coupons
-12
-10
-8
-6
-4
-2
00 10 20 30 40
Time (Days)
Aver
age
Hard
ness
Cha
nge
(%)
S-5 S5+10% A150 JP-5 ECD-1 S5+25% A150
re F-2. Average Hardness Change (%) Over Time for Nitrile Elastomer N0674-70 Coupons
37
40°C test temperature

APPENDIX G
Comparison of Swelling Results for
Coupons and O-Rings
38

Nitrile N0674-70 Specimens
-10
-5
0
5
10
15
20
Ave
rage
Vol
ume
Cha
nge
(%)
Figure G-1. Avg.
-10
-5
0
5
10
15
20
Ave
rage
Vol
ume
Cha
nge
(%)
Figure G-2. Avg. Volum
40°C test temperature
0 3 9 43
Days in S-5
O-Ring (H2O Dspl.) O-Ring (Dimensions)Coupon (H2O) Dspl.)
Volume Change (%) Over Time for Nitrile N0674-70Specimens in S-5
Nitrile N0674-70 Specimens
0 3 9 43
Days in S-5 + 10%A150
O-Ring (H2O Dspl.) O-Ring (Dimensions)Coupon (H2O) Dspl.)
e Change (%) Over Time for Nitrile N0674-70 Specimens in S-5 +10%A150
39
40°C test temperature

Nitrile N0674-70 Specimens
-10
-5
0
5
10
15
20
0 3 9 43
Days in JP-5 Fuel
Ave
rage
Vol
ume
Cha
nge
(%)
O-Ring (H2O Dspl.) O-Ring (Dimensions)Coupon (H2O) Dspl.)
40°C test temperature
Figure G-3. Avg. Volume Change (%) Over Time for Nitrile N0674-70 Specimens in JP-5
Nitrile N0674-70 Specimens
-10
-5
0
5
10
15
20
0 3 9 43
Days in ECD-1 Fuel
Ave
rage
Vol
ume
Cha
nge
(%)
O-Ring (H2O Dspl.) O-Ring (Dimensions)Coupon (H2O) Dspl.)
40°C test temperature
Figure G-4. Avg. Volume Change (%) Over Time for Nitrile N0674-70 Specimens in ECD-1
40

Nitrile N0674-70 Specimens
-10
-5
0
5
10
15
20
0 3 9 43
Days in S-5 +25%A150
Ave
rage
Vol
ume
Cha
nge
(%)
O-Ring (H2O Dspl.) O-Ring (Dimensions)Coupon (H2O) Dspl.)
40°C test temperature
Figure G-5. Avg. Volume Change (%) Over Time for Nitrile N0674-70 Specimens in S-5 +25%A150
41