system dynamic modelling to assess economic viability and
TRANSCRIPT

1
System dynamic modelling to assess economic viability and risk trade-offs for ecological restoration in South Africa
Crookes, D.J.1,*, Blignaut, J.N.2, de Wit, M.P.3, Esler, K.J.4, Le Maitre, D.5, Milton, S.6, Mitchell S.7,
Cloete J. 8, de Abreu, P.9, Fourie (nee Vlok), H.10, Gull, K.11, Marx, D.9, Mugido, W.12, Ndhlovu, T.4,
Nowell, M.4, Pauw, M.4, and Rebelo, A.4.
1 Department of Economics, Stellenbosch University, Matieland, 7602, South Africa corresponding author:
2 Department of Economics, University of Pretoria, Pretoria, 0002, South Africa
3 School of Public Leadership, Stellenbosch University, Matieland, 7602, South Africa.
4 Department of Conservation Ecology and Entomology and Centre for Invasion Biology, Stellenbosch
University, Matieland, 7602, South Africa.
5 Council for Industrial and Scientific Research, P.O. Box 320, Stellenbosch, 7599, South Africa.
6 Sustainability Research Unit, Nelson Mandela Metropolitan University, George, 6530, South Africa, South
Africa.
7 Centre for Environmental Management, University of the Free State, P.O. Box 339, Bloemfontein, 9300,
South Africa.
8 Department of Animal, Wildlife and. Grassland Sciences. University of the Free State. P.O. Box 339.
Bloemfontein. South Africa. 9300
9 Percy FitzPatrick Institute, University of Cape Town, Rondebosch 7701, South Africa
10 Western Cape Department of Agriculture, Private Bag X1, Elsenburg, 7607, South Africa
11 Department of Economics, University of Cape Town, Rondebosch 7701, South Africa
12 Department of Agricultural Economics, Stellenbosch University, Matieland, 7602, South Africa
* Corresponding author
Contact details
Private bag X1, Matieland, 7602, South Africa
Tel: +27 73 1975 222
Fax: +27 21 8554453
Email address: [email protected]
2
Abstract
Can markets assist by providing support for ecological restoration, and if so, under what
conditions? The first step in addressing this question is to develop a consistent methodology for
economic evaluation of ecological restoration projects. A risk analysis process was followed in
which a system dynamics model was constructed for eight diverse case study sites where
ecological restoration is currently being pursued. Restoration costs vary across each of these
sites, as do the benefits associated with restored ecosystem functioning. The system dynamics
model simulates the ecological, hydrological and economic benefits of ecological restoration and
informs a portfolio mapping exercise where payoffs are matched against the likelihood of success
of a project, as well as a number of other factors (such as project costs and risk measures). This is
the first known application that couples ecological restoration with system dynamics and portfolio
mapping. The results suggest an approach that is able to move beyond traditional indicators of
project success, since the effect of discounting is virtually eliminated. We conclude that systems
dynamic modelling with portfolio mapping can guide decisions on when markets for restoration
activities may be feasible.
Keywords
Restoration; System dynamics; Portfolio mapping; Risk analysis; Water; Agriculture
1. Introduction
1.1. Overview
Legal requirements for restoring natural ecosystems have become the norm for many human
activities that alter or transform natural environments, such as mining (Holl 2002; Moreno-de las
Heras et al. 2008; Tischew et al. 2010). The pressure for such legislation arose because the on
and off-site impacts of damaged sites, such as dust and polluted runoff, adversely affected human
welfare and compelled society to enact laws and regulations (Milton et al. 2003). These impacts
were generally clear cut and evident but there is growing awareness that many other human
activities have adverse impacts, directly or indirectly, on natural environments and that these affect
the benefits, often termed ecosystem services, that society derives from such environments
(Aronson et al. 2007). Although these impacts often are subtle and insidious the consequences
can be significant and additive, particularly those that alter ecosystem functions such as water flow

3
regulation and soil stabilisation (Braumann et al. 2007). The cumulative effects of declines in the
ecosystem services delivered to society (e.g. good quality water, productive soils) can be
substantial, sufficient to justify the expense of restoring them. Returns on investments in
restoration have been found to be so high that several payments for ecosystem goods and
services (PES) schemes have been established around the world (e.g. South Africa: Turpie et al.
2008; Nepal: Navraj et al. 2010; Ecuador: De Koning et al. 2011; Europe: Van der Horst, 2011).
Although land degradation is widespread across South Africa, and severe in many cases (Hoffman
et al. 2000, Crookes 2003), a number have been proposed (Upper Tugela: Blignaut et al. 2008,
2010, Baviaanskloof: Mander et al. 2010) although there are few PES schemes in operation.
Restoration is generally a costly undertaking, partly because it is often only begun after the
environmental degradation is well-advanced and expensive to reverse, but also because it is often
labour and resource intensive (Milton et al. 2003; Aronson et al. 2006; Turpie et al. 2008).
Furthermore, restoration often requires large investments upfront and has long lags before
generating benefits. Construction of gabions, soil pollution amelioration and physical
establishment of vegetation are expensive interventions. Restoration can also be risky, for example
there may be little understanding of the ecological requirements for vegetation establishment or the
probability of a dry year, resulting in high plant mortality and failure to achieve targets. These
factors, among others, make most governments, organisations and individuals who are interested
in applying restoration very reluctant to commit resources to restoration unless they are compelled
to, despite these investments having potentially significant leverage effects (De Wit et al. 2012).
Given these constraints, the question we ask is, what role do markets, if any, play in ecological
restoration projects? It should be noted here that the term “markets” is used in the following way:
i) Hypothetically: since this is an ex post analysis of actual restoration projects
considering the possibility whether they could have considered market mechanisms,
i.e. that there is sufficient demand for the services the projects offered;
ii) Broadly: not in a technocratic sense favouring a specific market model, such as cap-
and-trade or tradable permits; and
iii) Non-prescriptively: not defining the institutional parameters or legal conditions for
the trade to take place.
This also implies that the specific ecosystem services considered are dominated by those that do
have either actual or potential market values for which there are direct benefits to people, such as

4
water and grazing. Ecosystem services that do not have easily quantifiable market values are
therefore excluded, leading to under-estimation of the benefits of restoration.
Here we use the Regional Economic SysTem dynamics mOdel for the Restoration of Ecosystems
and project Prioritisation (The RESTORE-P model, see Crookes 2012) to test the following
hypothesis:
The restoration of natural capital improves water flow and water quality, land productivity, in
some instances sequesters more carbon, and, in general, improves both the socio-
economic value of the land in and the surroundings of the restoration site as well as the
agricultural potential of the land.
The RESTORE-P model uses a market based approach to classify and prioritise restoration
projects that are subject to budgetary constraints. The standard economic approach for
determining if an ecological restoration project should proceed is the cost-benefit framework
involving the estimation of net present values (NPVs) through the use of discounting (e.g.
Schiappacasse et al. 2012). Although static cost benefit analysis combined with linear discounting
techniques has been useful, it is insufficient in environmental management contexts characterised
by complexity, risk and uncertainty. In this article a dynamic approach based on the risk analysis
(RA) framework proposed by David Hertz (Hertz and Thomas 1983, Aven 2003) is employed. The
risk analysis approach uses Monte Carlo simulation to assign a probability distribution to an output
variable which in turn is used to inform a portfolio mapping (PM) exercise (Matheson et al. 1989;
Matheson and Menke 1994; Cooper 2005; Wysocki 2009). The portfolio map is a bubble chart
where the potential payoff from a project is plotted against the probability of its technical success
(see Section 2.5 for a further elaboration). The maps are then used to select and prioritise
restoration projects. The approach adopted here is novel in that a system dynamics (SD) model of
the problem is first developed, and then used as part of the risk analysis process. Net present
values are still calculated, but using a system dynamics model to capture the underlying dynamics
of the system enables a better representation of the system than a static cost benefit analysis.
This is because nonlinearities and feedbacks are included as well as improved opportunities to
interrogate the data, for example through optimisation techniques and sensitivity analysis using
advanced tools such as Monte Carlo simulation. Additionally, the same discount rate is applied
across all sites, effectively nullifying its impact on the relative ranking among the sites.
Applying system dynamics to risk analysis in an environmental management context is not unique
(e.g. Dawadi and Ahmad 2012), and risk analysis has been employed in ecological restoration

5
projects in the past (see e.g. Yoe et al. 2009), however this is the first known application of risk
analysis, system dynamics and portfolio mapping to an environmental restoration problem. We
found no articles in Google Scholar or Science Direct that applied portfolio mapping to
environmental management or environmental restoration. One of the main reasons for this is that
organisations seldom possess the relevant ecological data (Vandaele and Decouttere 2012). In
this study the data problem was addressed by a unique data collection process that involved
twelve postgraduate students in the fields of ecology, hydrology and economics gathering primary
data from a range of sites where restoration is occurring, with a number of experts providing
external validation of the data and the model as well as additional insights. We begin by
introducing the system dynamic modelling approach we have adopted for economic assessment
and explain the benefits of this innovative approach to project assessment.
1.2. System dynamics and restoration
Ecological restoration is acknowledged as a complex and dynamic problem and no single simple
answer or single discipline is capable of addressing the problem in isolation (Aronson et al. 2007a).
Synthetic approaches are needed to integrate the dynamic and complex ecological and socio-
economic aspects linked to ecological restoration and system dynamics modelling provides an
appropriate tool for capturing and modelling the key components of such systems.
System dynamics models are used for a wide range of economic and environmental applications.
Although system dynamics modelling has been used to model restoration activities, its application
has largely been limited to wetland or watershed problems (e.g. Bendor 2009; Liu et al. 2008;
Arquitt and Johnstone 2008). Potential applications of system dynamics modelling to water,
agricultural and other environmental problems are, however, widespread and gaining prominence.
For example, Higgins et al. (1997) modelled the restoration of mountain fynbos ecosystems in the
Western Cape, Jogo and Hassan (2010) modelled wetland management in the Limpopo river
basin, and Fleming et al. (2007) modelled cholera health risk. Other published applications include
Wise and Cacho (2005) modelling the Indonesian agroforestry sector and Nobre et al. (2009)
modelling Chinese aquaculture. This is useful in order to capture biophysical variability and also to
move beyond a single (static) measure of assessing project viability based only on the present
value of a stream of costs and benefits, and thus overly influenced by the discount rate.
2. Material and methods

6
2.1 Study location and data
RESTORE-P is a localised system dynamics model that was used to investigate the impacts of
restoring natural capital across eight case study sites throughout South Africa (Figure 1) using the
Vensim modelling software.
Figure 1: Geographical distribution of case studies
Sites were selected based on a range of criteria, including site safety, social and economic
development potential, accessibility and market potential (see supplementary material for full list of
criteria). The sites span a range of vegetation biomes, from arid Nama Karoo and Succulent
Karoo, to more mesic Fynbos, Savanna, Grassland and Forest (Table 1). The majority of the sites
are in arid or semi-arid climatic zones, with mean annual precipitation of less than 700 mm per
year. Most of the restoration takes place on private land, although some have mixed ownership
while others are public or communal areas. The extent of degradation also varies quite
significantly across the sites, and although this is difficult to compare with any degree of objectivity,
many sites are significantly altered. Most notable are those transformed by mining activity (strip
mining) and those severely degraded by intensive ostrich farming and overgrazing.
1 Namaqualand2 Beaufort West3 Oudtshoorn4 Lephalale5 Agulhas Plain6 Kromme river7 Drakensberg8 Sand river
5
2
3
1
7
48
6

7
Primary data were derived from a range of studies conducted at the individual case study sites by
a number of the co-authors (see supplementary material). Most parameter values were obtained
from these published dissertations and other published sources, from unpublished data that
accompanied this research, or through personal communications obtained from a range of experts.
In a few cases where literature estimates were not available, the system dynamics model was
used to optimise decision variables in such a way that Net Present Values (NPVs) for a particular
case study were maximised. For example, the model indicated that optimal restoration period was
an initial high level of activity followed by a maintenance period, or a long term period of restoration
activity at relatively lower intensity. The optimisation results suggested that most of the financial
expenditure on restoration was incurred early on in the project lifespan, which was also consistent
with a priori expectations.
2.2. Conceptual model
The RESTORE-P model evaluates the effects of restoration on all four forms of natural capital
(Figure 2.1) as described in Aronson et al. (2007b). It is beyond the scope of this article to provide
full particulars of all eight case studies, but the interested reader is referred to the supplementary
material for more detail. This article provides information of one case study, namely Beaufort
West, to highlight the approach adopted. The Beaufort West case study was chosen as this was
8
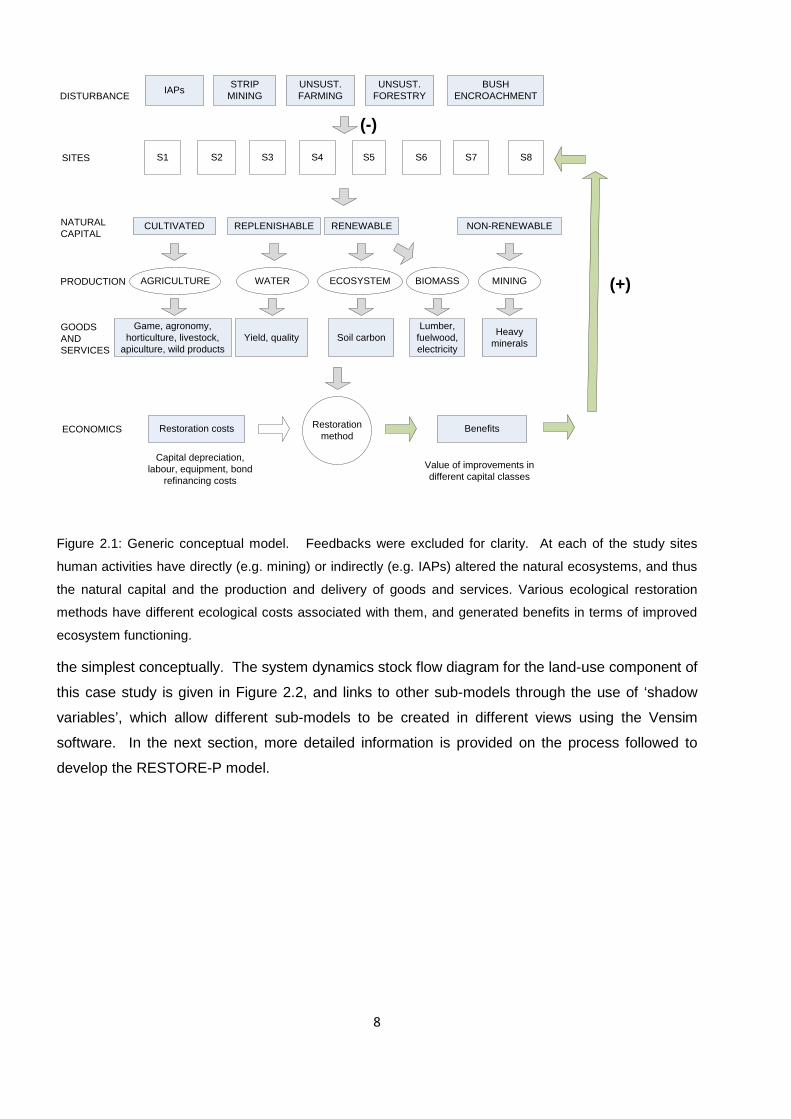
Figure 2.1: Generic conceptual model. Feedbacks were excluded for clarity. At each of the study sites
human activities have directly (e.g. mining) or indirectly (e.g. IAPs) altered the natural ecosystems, and thus
the natural capital and the production and delivery of goods and services. Various ecological restoration
methods have different ecological costs associated with them, and generated benefits in terms of improved
ecosystem functioning.
the simplest conceptually. The system dynamics stock flow diagram for the land-use component of
this case study is given in Figure 2.2, and links to other sub-models through the use of ‘shadow
variables’, which allow different sub-models to be created in different views using the Vensim
software. In the next section, more detailed information is provided on the process followed to
develop the RESTORE-P model.
S1 S2 S3 S4 S5 S6 S7 S8SITES
NON-RENEWABLE
Restoration method
RENEWABLENATURAL CAPITAL
REPLENISHABLECULTIVATED
ECOSYSTEMPRODUCTION WATERAGRICULTURE
IAPs STRIP MINING
UNSUST. FARMING
UNSUST. FORESTRY
BUSH ENCROACHMENT
BIOMASS
Soil carbonLumber,
fuelwood, electricity
GOODS AND SERVICES
Yield, qualityGame, agronomy,
horticulture, livestock, apiculture, wild products
ECONOMICS Restoration costs Benefits
DISTURBANCE
(+)
(-)
MINING
Heavy minerals
Capital depreciation, labour, equipment, bond
refinancing costsValue of improvements in different capital classes

9
Figure 2.2: Stock flow diagram for Beaufort West showing the land use sub-model. Other sub-models (for
brevity not shown here but included in the supplementary material) include grazing; clearing (alien removal);
biomass electricity; water and an economic sub-model.
2.3. Risk analysis process
The risk analysis process was conducted in three stages. In the first stage, a system dynamics
model was developed and used to maximise the net present value of each of the eight case
studies. This required optimising the input variables in the model, for example the intensity of
restoration and time period over which restoration was conducted. This is an established approach
in the system dynamics literature (Keloharju and Wolstenholme 1989). The model was developed
in Vensim DSS 5.9e (Ventana Systems, 2007). This platform provides an interactive modelling
environment for answering policy related questions.
The Vensim modelling platform enables the identification of key structural features in the model, as
well as conducting the Monte Carlo simulations used for sensitivity analysis (model validation) and
risk analysis. The system dynamics model was validated using a series of iterative expert
AreaProsopis annual clearance
INITIAL AREA
NO OF YEARS OFCLEARING ACTIVITY
rainfall event prosopis
regrowth
REGROWTHRATE
% AREA REGROWTHFOLLOWING RAINFALL
droughtevent
TIME TO CLEARAREA
<Time>condensed area
prosopis
<% CONDENSED>
prosopis density
to watersub-model
to grazingsub-model
tobio-electricityand clearingsubmodels
cumulativearea cleared
10
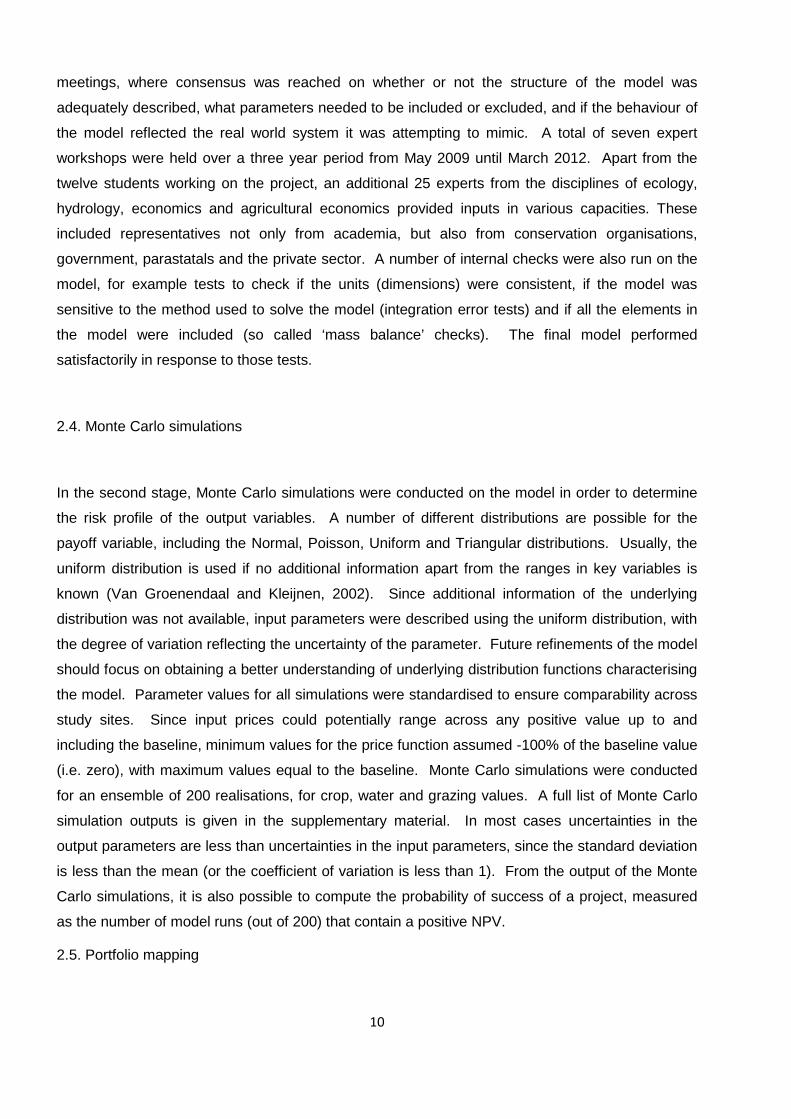
meetings, where consensus was reached on whether or not the structure of the model was
adequately described, what parameters needed to be included or excluded, and if the behaviour of
the model reflected the real world system it was attempting to mimic. A total of seven expert
workshops were held over a three year period from May 2009 until March 2012. Apart from the
twelve students working on the project, an additional 25 experts from the disciplines of ecology,
hydrology, economics and agricultural economics provided inputs in various capacities. These
included representatives not only from academia, but also from conservation organisations,
government, parastatals and the private sector. A number of internal checks were also run on the
model, for example tests to check if the units (dimensions) were consistent, if the model was
sensitive to the method used to solve the model (integration error tests) and if all the elements in
the model were included (so called ‘mass balance’ checks). The final model performed
satisfactorily in response to those tests.
2.4. Monte Carlo simulations
In the second stage, Monte Carlo simulations were conducted on the model in order to determine
the risk profile of the output variables. A number of different distributions are possible for the
payoff variable, including the Normal, Poisson, Uniform and Triangular distributions. Usually, the
uniform distribution is used if no additional information apart from the ranges in key variables is
known (Van Groenendaal and Kleijnen, 2002). Since additional information of the underlying
distribution was not available, input parameters were described using the uniform distribution, with
the degree of variation reflecting the uncertainty of the parameter. Future refinements of the model
should focus on obtaining a better understanding of underlying distribution functions characterising
the model. Parameter values for all simulations were standardised to ensure comparability across
study sites. Since input prices could potentially range across any positive value up to and
including the baseline, minimum values for the price function assumed -100% of the baseline value
(i.e. zero), with maximum values equal to the baseline. Monte Carlo simulations were conducted
for an ensemble of 200 realisations, for crop, water and grazing values. A full list of Monte Carlo
simulation outputs is given in the supplementary material. In most cases uncertainties in the
output parameters are less than uncertainties in the input parameters, since the standard deviation
is less than the mean (or the coefficient of variation is less than 1). From the output of the Monte
Carlo simulations, it is also possible to compute the probability of success of a project, measured
as the number of model runs (out of 200) that contain a positive NPV.
2.5. Portfolio mapping

11
In the third and final stage of the risk analysis process, the outputs from the system dynamics
model and Monte Carlo simulations are plotted on a portfolio map (e.g. Cooper et al. 1997, Cooper
2005). Portfolio maps are a common tool in the project portfolio management (PPM) literature
(e.g. Wysocki, 2009), as a visual means of planning and prioritising future capital expenditure on
projects. These portfolio maps are plotted on two axes, with the most common elements of the
axes being firstly a measure of reward (e.g. NPV, IRR, benefit after years of launch or market
value) and secondly a measure of risk (probability of technical or commercial success of the
project) (Cooper et al. 2001). These two axes divide the portfolio map into four quadrants (Cooper
et al. 1997, Cooper 2005):
• Oysters: high risk projects with uncertain merits,
• Pearls: projects with high likelihood of success,
• Bread and Butter: essential projects that enterprises cannot do without, and
• White elephant: projects which are preferable to avoid.
Portfolio maps communicate visually a range of additional information that would not have been
available had project selection been based solely on traditional decision-making methods (such as
NPV). Also known as ‘bubble plots’, these maps not only provide information on risk versus
reward, but the size of the ‘bubble’ for each of the individual projects conveys additional
information on the project such as project costs and risks measured through assessing the
variability in output variables in response to uncertainty in, amongst others, input costs. These
risks are measured through estimating the standard deviation or the coefficient of variation of the
output variable.
3. Results
In this paper we are primarily interested in developing a consistent methodology for the economic
evaluation of ecological restoration projects. Our proposed methodology is illustrated with actual
case studies, but space prohibits a reporting of results on each of the study sites. Such results are
already reported on elsewhere (Blignaut et al. 2012; Crookes 2012), but for ease of access also
published as supplementary material to this paper. To demonstrate methodology we provide here
the results of one site, namely Beaufort West.
3.1. Beaufort West model
12
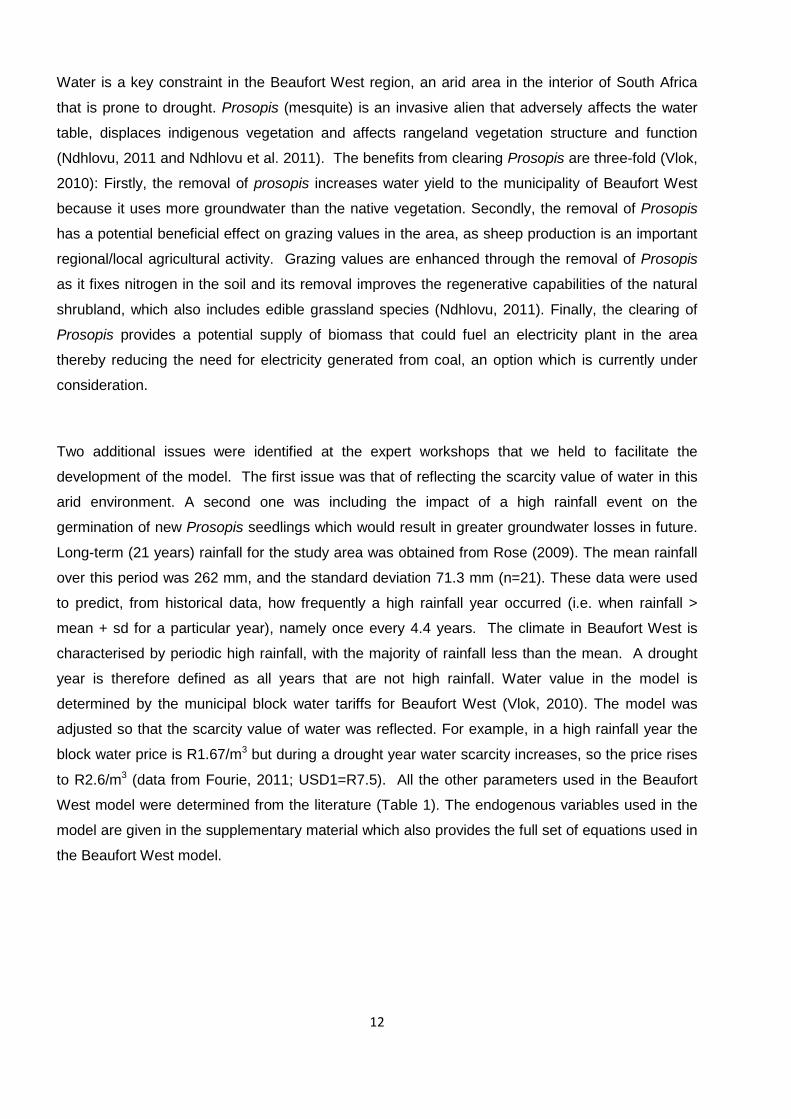
Water is a key constraint in the Beaufort West region, an arid area in the interior of South Africa
that is prone to drought. Prosopis (mesquite) is an invasive alien that adversely affects the water
table, displaces indigenous vegetation and affects rangeland vegetation structure and function
(Ndhlovu, 2011 and Ndhlovu et al. 2011). The benefits from clearing Prosopis are three-fold (Vlok,
2010): Firstly, the removal of prosopis increases water yield to the municipality of Beaufort West
because it uses more groundwater than the native vegetation. Secondly, the removal of Prosopis
has a potential beneficial effect on grazing values in the area, as sheep production is an important
regional/local agricultural activity. Grazing values are enhanced through the removal of Prosopis
as it fixes nitrogen in the soil and its removal improves the regenerative capabilities of the natural
shrubland, which also includes edible grassland species (Ndhlovu, 2011). Finally, the clearing of
Prosopis provides a potential supply of biomass that could fuel an electricity plant in the area
thereby reducing the need for electricity generated from coal, an option which is currently under
consideration.
Two additional issues were identified at the expert workshops that we held to facilitate the
development of the model. The first issue was that of reflecting the scarcity value of water in this
arid environment. A second one was including the impact of a high rainfall event on the
germination of new Prosopis seedlings which would result in greater groundwater losses in future.
Long-term (21 years) rainfall for the study area was obtained from Rose (2009). The mean rainfall
over this period was 262 mm, and the standard deviation 71.3 mm (n=21). These data were used
to predict, from historical data, how frequently a high rainfall year occurred (i.e. when rainfall >
mean + sd for a particular year), namely once every 4.4 years. The climate in Beaufort West is
characterised by periodic high rainfall, with the majority of rainfall less than the mean. A drought
year is therefore defined as all years that are not high rainfall. Water value in the model is
determined by the municipal block water tariffs for Beaufort West (Vlok, 2010). The model was
adjusted so that the scarcity value of water was reflected. For example, in a high rainfall year the
block water price is R1.67/m3 but during a drought year water scarcity increases, so the price rises
to R2.6/m3 (data from Fourie, 2011; USD1=R7.5). All the other parameters used in the Beaufort
West model were determined from the literature (Table 1). The endogenous variables used in the
model are given in the supplementary material which also provides the full set of equations used in
the Beaufort West model.

13
Table 1: Parameters used in model and units
Description Symbol Formula/Value Unit Reference
lifespan of plant Lp 50 Dmnl Crookes, 2012
Conversion from Kw to Rand
CkR 15000 Rand/Kw Fourie, 2011
Time to clear area
Tc 1 Year Crookes, 2012
Area regrowth following rain
PR 1 Dmnl Crookes, 2012
Regrowth rate RR 1 Year Crookes, 2012
Discount rate IR 0.08 1/Year Mullins et al., 2007
Prosopis water use
Pw 251.9 m3/hectare Fourie, 2011
Initial area of prosopis
A 781 Hectare Vlok, 2010
No of years of clearing activity
Ct 50 Year Crookes, 2012
Conversion to condensed prosopis area
Pc 0.19 Dmnl Vlok, 2010
Change in grazing capacity
Δgc 0.028 LSU/hectare Ndhlovu, 2011
Clearing cost Cc 817.5 Rand/hectare Vlok, 2010
Conversion of wood biomass to Kw
CBK 900 Kw/ton*hour Fourie, 2011
Price less opex GMb 0.345 Rand/Kw/hour Fourie, 2011
Profit margin PMg 0.2 Dmnl Fourie, 2011
Biomass produced per hectare
Bp 15.7 ton/hectare Fourie, 2011
Total hours in a year
Thrs 8760 Hour Calculation (24*365)
Value per LSU= Vg 4098.73 Rand/LSU Fourie, 2011
Key: Dmnl=dimensionless (no units); Kw=kilowatt; LSU=livestock standard unit; R1=7.5 USD

14
Figure 3: Monte Carlo simulations for: a. changes in water value and b. changes in grazing value; at Beaufort
West restoration site. These Monte Carlo simulations are used to calculate the risk parameters for the
portfolio maps: the width of the ‘plume’ indicates the degree of riskiness of the restoration project. The
probability of success of a project is the proportion of simulations that result in a positive NPV at time 2060.
Current 50% 75% 95% 100%
npv beaufort west 535,000
367,500
200,000
32,500
-135,000 2010 2016 2023 2029 2035 2041 2048 2054 2060
Time (Year)
0
Current 50% 75% 95% 100%
npv beaufort west 535,000
400,000
265,000
130,000
-5,000 2010 2016 2023 2029 2035 2041 2048 2054 2060
Time (Year)
15
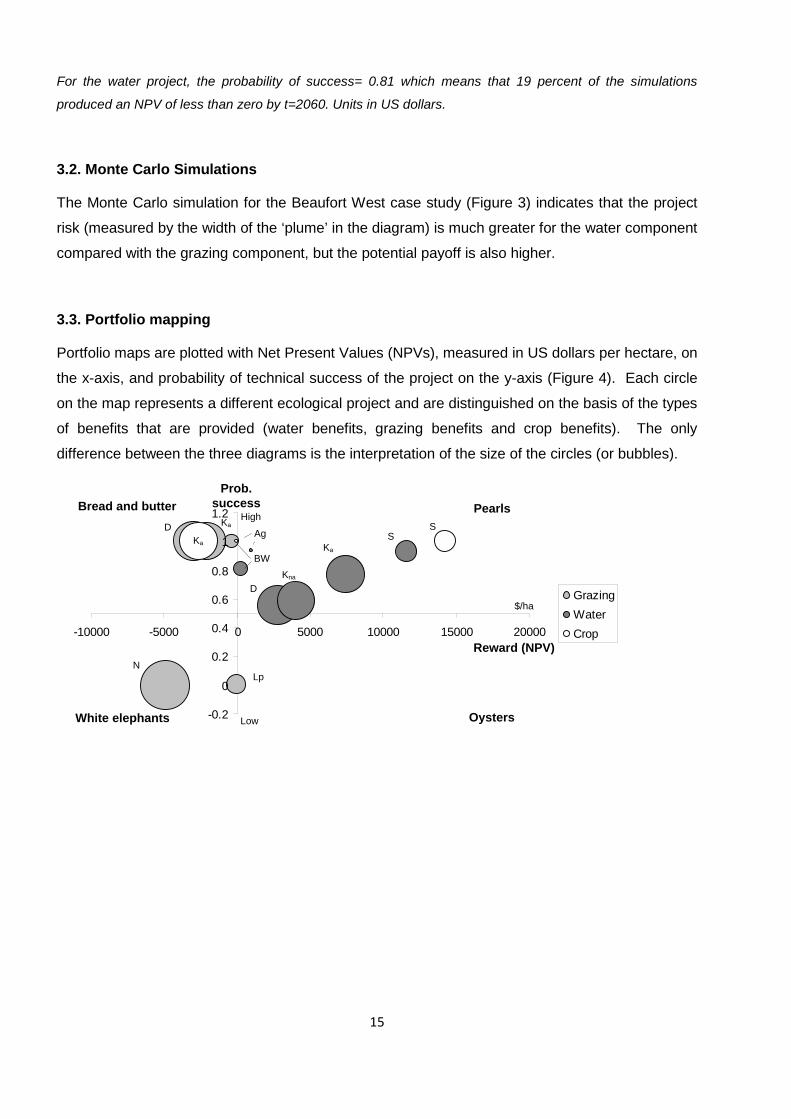
For the water project, the probability of success= 0.81 which means that 19 percent of the simulations
produced an NPV of less than zero by t=2060. Units in US dollars.
3.2. Monte Carlo Simulations
The Monte Carlo simulation for the Beaufort West case study (Figure 3) indicates that the project
risk (measured by the width of the ‘plume’ in the diagram) is much greater for the water component
compared with the grazing component, but the potential payoff is also higher.
3.3. Portfolio mapping
Portfolio maps are plotted with Net Present Values (NPVs), measured in US dollars per hectare, on
the x-axis, and probability of technical success of the project on the y-axis (Figure 4). Each circle
on the map represents a different ecological project and are distinguished on the basis of the types
of benefits that are provided (water benefits, grazing benefits and crop benefits). The only
difference between the three diagrams is the interpretation of the size of the circles (or bubbles).
-0.2
0
0.2
0.4
0.6
0.8
1
1.2
-10000 -5000 0 5000 10000 15000 20000
GrazingWaterCrop
Reward (NPV)
Prob. success
High
LowWhite elephants Oysters
Bread and butter Pearls
BW
Lp
D
N
DKna
SAgKa S
Ka
$/ha
Ka

16
Figure 4: Portfolio map for different ecosystem services showing the relative costs versus the probability of
success a. Bubble size indicates resources committed to restoration; b. Bubble size indicates standard
deviation of each project, and therefore the degree of volatility in the data; c. Bubble size indicates coefficient
of variation). Definitions for each of the quadrants (Oysters, Pearls, Bread and Butter, White elephants)
given in Section 2.5. Key to sites: Ag=Agulhas; BW=Beaufort West; D=Drakensberg; Ka=Kromme (with
agriculture); Kna=Kromme (without agriculture); Lp= Lephalale; N=Namaqualand; Ou=Oudtshoorn; S=Sand.
3.3.1. Project cost
The standard and most commonly used portfolio map is the risk reward bubble plot (Figure 4a),
with the size of the bubble indicating resources committed to it. Projects across different sites (e.g.
Kromme, Beaufort West, Agulhas) have different project costs, while projects within a site have the
same project costs but different benefits. While some projects indicate a negative NPV, this is only
because the project costs are compared with one ecosystem benefit at a time (e.g. water benefit),
rather than the entire range of EGS that were assessed for the project as a whole. Also,
-0.2
0
0.2
0.4
0.6
0.8
1
1.2
-10000 -5000 0 5000 10000 15000 20000
GrazingWaterCrop
Reward (NPV)
Prob. success
High
LowWhite elephants Oysters
Bread and butter Pearls
BW
LpN
DKna
S
AgKa
S
Ka
$/ha
Ka
-0.2
0
0.2
0.4
0.6
0.8
1
1.2
-10000 -5000 0 5000 10000 15000 20000
GrazingWaterCrop
Reward (NPV)
Prob. success
High
LowWhite elephants Oysters
Bread and butter Pearls
BW
DKna
SAgS
Ka
$/ha
KaOu

17
discounting can be problematic when benefits are realised over a longer period compared with
those projects where benefits are achieved in the short to medium term.
Results indicate that projects where there are significant gains in the values delivered by water are
the ‘pearl’ projects, with high expected success likelihoods and high payoffs. Those projects where
grazing and crops are the primary benefits are mostly the bread and butter projects. There is one
white elephant, the Namaqualand mining project, with large resources committed to it. It should
however be noted that this excludes the value of the benefits from mining, which would affect the
financial feasibility of restoration. Mining benefits are omitted from the analysis since mineral
extraction is not a renewable resource and therefore not sustainable under a strong sustainability
perspective. Furthermore, a negative NPV does not imply that restoration should not occur, merely
that it fails the ‘economics’ test. There are other tests that are equally, if not more important, such
as legislative requirements, social and ecological imperatives. Lephalale (grazing) is a potential
oyster, with untested and therefore uncertain long term benefits from restoration. Fairly low levels
of resources are committed to this activity.
The portfolio map is useful in illustrating rewards and probability of success but it does not illustrate
the risks inherent in each project outcome. The next portfolio map shows the impact of variations
in the system inputs.
3.3.2. Standard deviation
The second portfolio map is plotted against the same two axes, but the size of the bubbles now
represents the standard deviation of each project (Figure 4b). The standard deviation indicates
the degree of volatility in the inputs and shows that, for the most part, the higher the potential
reward the higher the risk. The projects with the most volatility are the water service dominated
projects, as well as the irrigated agriculture scenario in the Sand project. Most projects with low
NPV (the so called ‘bread and butter’ projects) exhibit very low project volatility.
3.3.3. Coefficient of variation
The final portfolio map gives the coefficient of variation (CV) as bubble size, which has the
advantage over the standard deviation estimates in that it ‘standardises’ the values (the differences
between the values of the means are removed and the proportional variation is now equalised).
Negative means are harder to interpret so are omitted from the analysis (Figure 4c). CVs are
appropriate when the project means show a wide range of dispersion. The results are somewhat

18
different from the standard deviation plots, and suggest that the Drakensberg water project, and
the Kromme water project (no agriculture scenario) are perhaps better classified as oysters rather
than pearls, given the high degree of volatility.
3.3.4. Combined portfolio mapping results
The risk analysis process revealed that no individual measure of risk (success probability, standard
deviation, CV) is sufficient for selecting and classifying projects. A combination of measures
provides an improved means of selection. A summary of information from three risk profile maps
(success probability, standard deviation and coefficient of variation), (Table 3), suggests that the
projects with the highest potential payoffs (and therefore are pearl projects) are the water projects,
in other words those projects where downstream water consumers benefit from the restoration
project. Agulhas, Beaufort West, Kromme and Sand are all examples of this.
However, the results also indicate that water projects alone are not sufficient to mitigate the risks
associated with the project. Those projects that include agriculture (in the mix) are subject to lower
risk (Table 2). For example, Kromme without agriculture is classified as oyster (in other words,
more risky) compared with Kromme (with agriculture), which is classified as a pearl. Furthermore,
in the Sand study, in the case where Sabie Sand Game Reserve only benefits from the water is a
higher risk project compared with restoration where irrigated agriculture also benefits. Another
restoration study which is too reliant on water for benefits is the Drakensberg study, which is also
classified as an oyster. Communal agricultural benefits and carbon values are not sufficient to
increase resilience in the system. Lephalale on the other hand, is too reliant on grazing, and the
introduction of a biomass electricity plant could potentially mitigate that risk and even push the
project into an oyster or bread and butter project. The bread and butter projects are almost entirely
crop or grazing projects, but these are only profitable if combined with either water or biomass
projects. These project benefits are essential to ensure the success of restoration activities.
Table 2: Summary of projects classified by type
Oyster Pearl Bread and Butter White elephant
Description
High risk projects with uncertain merits
Projects with high likelihood of success
Essential projects that enterprises cannot do without
Projects which are preferable to avoid
Water projects
Drakensberg; Kromme (no agriculture)
Agulhas, Beaufort West, Kromme (with agriculture),

19
Sand
Crop projects Sand Agulhas, Kromme (with agriculture)
Grazing projects Lephalale Oudshoorn (passive only)
Beaufort West, Drakensberg, Kromme (with agriculture) Namaqualand
The results indicate that, for most of the restoration sites in this analysis, a market based approach
to restoration is appropriate. Total project Net Present Values are positive for all sites except the
Namaqualand site. In the latter case, legislation is required to govern compliance rather than
market instruments. The portfolio mapping framework enables restoration projects to be classified
in terms of the degree of marketability based both on financial criteria (payoffs, costs), as well as
environmental risks criteria and project success expectations. This approach has the advantage of
communicating a wide range of information to decision-makers in contrast to static cost benefit
analysis which only provides a dichotomous yes/no decision rule. Furthermore, utilising a range of
different risk measures such as coefficient of variation and standard deviation enables further
information about project volatility than would be achieved through a single measure. In the
context of Payment for Ecosystem Services, decisions are now based on a range of decision
criteria and not only reward. Linking these portfolio maps to an underlying system dynamics model
enables the capturing of ecological and hydrological complexity through the incorporation of
feedbacks and non-linear dynamics. The system dynamics modelling approach also has the
advantage that a relatively robust model may be developed in a data poor environment
characterised by primary (mainly cross-sectional) source data, and validated through a panel of
experts, rather than having to rely on validation through statistical analysis based on historical time
series data. More often than not, ecological restoration projects are characterised by the former
(cross-sectional or survey source data) rather than the latter (lengthy historical time series data)
(e.g. Downs and Thorne, 2000).
4. Discussion
Here we work within the framework of eight existing restoration projects and therefore, a priori,
accept the need for restoration. However, these projects lacked the context of an operating market
for restoration and, prior to this investigation, had not considered the potential contribution
payments for ecosystem goods and services rendered by restoration could offer. We therefore
reflect and ask the question: Can markets assist by providing support for restoration and, if so,

20
under which conditions? We focus on this question as natural resource management in South
Africa has been, for the most part, regulation-based over the past century but recent evidence (see
Turpie et al. 2008, Blignaut et al. 2008, Blignaut et al. 2010) indicates that markets could be an
efficient, complementary mechanism for achieving environmental objectives, even though some
non-marketable ecosystem services were excluded from this study. Furthermore there are no legal
and/or institutional impediments and/or barriers to the establishment of markets in South Africa. As
a matter of fact market development is encouraged. This study included both the bio-physical and
socio-economic dimensions of the restoration because we wanted to assess both components and
their potential role in decision making.
Our analysis of projects using portfolio mapping suggests that this approach, coupled with risk
analysis and system dynamics modelling, is able to provide a means of selecting and prioritising
restoration projects deemed to be more market ready than others. In using this method we use
factors that determine project risk, often associated with biophysical attributes, and
economic/financial values and indicators. This is since a singular focus on NPV could, and indeed
does, lead to erroneous outcomes. A positive NPV should not be interpreted as a license to exploit
the natural environment (since restoration after exploitation would provide a positive return on
investment). Neither should a negative NPV be interpreted as an indicator that restoration should
not take place (as this is only considering the question with respect to the establishment of markets
and does not deal with the rationale for or against restoration per se). A more nuanced
assessment such as proposed here is required, especially when considering the development of
PES.
We demonstrate that an integrated multi-disciplinary approach to the ecology, hydrology and
economics of restoration is not only desirable, but also feasible. In doing so we used the
conventional economic calculus of costs and benefits as a starting point for evaluating restoration
interventions, while building on and integrating the empirical work in the fields of ecology and
hydrology. This is done in such a way as to internalise complexity and dynamic responses. Risk
has therefore been endogenised and although we conducted sensitivity analysis, this was not
added on at the end in an adjunct manner. We selected this approach since ecological systems
have a number of individual components that interact in non-linear ways over a multiplicity of
scales, while being heterogeneous across space (Wu 2002). To effectively manage (restoration as
one option) such systems we required at least an understanding of the properties and dynamics of
such systems (see for example Maler, 2000).
21
Contrary to some suggestions (Rees et al. 2007; Bullock et al. 2011) there is no need to abandon
conventional economic cost-benefit evaluation tools when considering restoration projects which
typically have a high degree of risk and uncertainly, particularly when they are PES-based. These
conventional tools, when enriched with an understanding of system properties and their dynamics,
can be used to shape decision-making regarding restoration priorities. Such an approach,
however, moves beyond standard static economic evaluation approaches as discussed, for
example, by Figueroa (2007) and provides a novel way to move beyond the contested use of an
exogenously determined discount rate as a single variable to linearly reflect the value of costs and
benefits over time (see Mills et al. 2007, Holmes et al. 2007 for an application of cost-benefit
analysis with exogenous discount rates in the context of restoration). By using an SD approach, it
is also feasible to simulate repeated random sampling of uncertain inputs, and therefore to
generate a measure of risks in restoration investment decisions. We demonstrate that the ensuing
risk/reward outcomes provide a far more nuanced and thorough way of evaluating any project,
including restoration projects, than the conventional net present value (NPV) outcomes favoured in
most natural resource economic evaluation projects.
The benefit of an SD approach is that decision-making about using or deploying a PES from
restored ecosystems are now driven by the known or expected changes in properties of that
system. This is quite different and much more sophisticated than the application of exogenously
determined discount rates. Discount rates are usually used in a static framework of costs and
benefits over time, often to account for much more than what they were originally intended for,
namely to act as a proxy for people’s preference of holding money over time. Although we used a
discount rate to reflect the value of money over time, it had no bearing on the relative ranking of
projects in terms of whether markets can or cannot contribute to restoration. That ranking was
decided on bio-physical and socio-economic complexities inherent in each project. The market-
development decision-making priority list is therefore discount rate neutral. This is a further
significant departure from conventional methods.
5. Conclusion
We develop a decision-making framework with respect to the development of markets/payment
systems for ecosystem goods and services following restoration which enables decisions to be
taken against the backdrop of the risk involved in achieving such rewards or benefits. Neither SD
approaches nor risk quantification by themselves are new, but applications to existing and on-
going restoration projects are novel. This study hopes to contribute to the science and practice of

22
restoration through such an evidence-based approach to integrating economic evaluation and
ecosystems dynamics.
This study did not seek to provide a motivation for restoration, but only sought to identify under
which conditions markets could contribute to restoration, we do not suggest that only monetary
values are of importance within the larger restoration decision-making picture. Those restoration
options that have high risk/low reward outcomes over time should not necessarily be abandoned;
we only suggest that markets are ill-equipped to assist in restoration under such conditions. This
modelling exercise considers only the economic viability of ecological restoration projects, not
priorities in terms of regional biodiversity persistence. We acknowledge that there may be a suite
of other drivers for doing restoration, such as legislation on mining for example, where restoration
needs to be conducted according to legal requirements and also socio-economic considerations
like job creation, and national commitments to conservation of biodiversity. Final decisions on
whether or not to proceed with restoration would need to take these factors into account.

23
Acknowledgements
This project was funded and commissioned by the Water Research Commission (WRC) – Key
Strategic Area, Water Utilisation in Agriculture (KSA4). This work forms part of the WRC project
entitled, ‘The impact of re-establishing indigenous plants and restoring the natural landscape on
sustainable rural employment and land productivity through payment for environmental services’
undertaken by Africa's Search for Sound Economic Trajectories (ASSET Research). Funding from
the WRC and ASSET Research is gratefully acknowledged.
References
Aronson, J., Clewell, A.F., Blignaut, J.N., Milton, S.J., 2006. Ecological restoration: a new frontier
for nature conservation and economics. J. Nat. Conserv. 14, 135–139.
Aronson J., Milton S.J., and Blignaut J.N. (Eds), 2007a. Restoring natural capital: business,
science, and practice. Island Press, Washington D.C., pp.3-8.
Aronson J., Milton S.J., and Blignaut J.N., 2007b. Restoring Natural Capital: Definitions and
Rationale. In: Aronson J., Milton S.J., and Blignaut J.N. (Eds), Restoring natural capital: business,
science, and practice. Island Press, Washington D.C., pp.3-8.
Arquitt S. and Johnstone R., 2008. Use of system dynamics modelling in design of an
environmental restoration banking institution. Ecol. Econ. 65, 63-75.
Aven T., 2003. Foundations of Risk Analysis: A Knowledge and Decision-Oriented Perspective.
John Wiley & Sons, Chichester.
Bendor T., 2009. A dynamic analysis of the wetland mitigation process and its effects on no net
loss policy. Landscape Urban Plann. 89, 17–27
Blignaut, J., de Wit M., Milton S., Esler K.J., Le Maitre D., Mitchell S.and Crookes D. (eds). 2012.
Determining the economic risk/return parameters for developing a market for ecosystem goods
24
and services following the restoration of natural capital: a system dynamics approach. Water
Research Commission and ASSET Research: Pretoria.
Blignaut, J., Mander, M., Schulze, R., Horan, M., Dickens, C., Pringle, K., Mavundla, K., Mahlangu,
I., Wilson, A., McKenzie, M. & McKean, S. 2010. Restoring and managing natural capital towards
fostering economic development: Evidence from the Drakensberg, South Africa. Ecol.
Econ., 69, 1313–1323.
Blignaut, J., Aronson J., Mander M., Marais C. 2008. Investing in natural capital and economic
development: South Africa's Drakensberg Mountains. Ecol. Restor. 26(2), 143–150.
Brauman, K.A., Daily, G.C., Duarte, T.K., Mooney, H.A., 2007. The nature and value of ecosystem
services: An overview highlighting hydrological services. Annu. Rev. Environ. Resour. 32, 6.1-6.32.
Bullock J.M., Aronson J., Newton A.C., Pywell R.F., Rey-Benayas J.M., 2011. Restoration of
ecosystem services and biodiversity: conflicts and opportunities. TREE 26, 10, 541-549.
Cloete, J. 2012. Restoration of an encroached semi-arid southern African savanna. An evaluation
of different tree thinning treatments. Unpublished Master's thesis. Bloemfontein: University of the
Free State.
Cooper, R.G., 2005. ‘Portfolio management for product innovation’. In: Levine, H.A. (Ed). Project
portfolio management. A practical guide to selecting projects, managing portfolios, and maximising
benefits. John Wiley & Sons: San Francisco, pp.318-355.
Cooper, R., Edgett, S. and Kleinschmidt, E. 2001. Portfolio management for new product
development: results of an industry practices study. R&D Manag., 31,4, 361–380.
Crookes D.J., 2003. The contribution of livelihood activities in the Limpopo province: case study
evidence from Makua and Manganeng. Dev. South. Af. 20,1, 143 – 159.

25
Crookes D.J., 2012. Modelling the ecological-economic impacts of restoring natural capital, with a
special focus on water and agriculture, at eight sites in South Africa. Unpublished Ph.D
dissertation, Stellenbosch University.
De Koning, F., Aguiñaga, M., Bravo, M., Chiu M., Lascano M., Lozada T., Suarez L. 2011. Bridging
the gap between forest conservation and poverty alleviation: the Ecuadorian Socio Bosque
program. Environ. Sci. Pol. 14, 531-542.
De Wit M., van Zyl H., Crookes D., Blignaut J., Jayiya T., Goiset V., Mahumani B., 2012. Including
the economic value of well-functioning urban ecosystems in financial decisions: Evidence from a
process in Cape Town. Ecosys. Serv. 2: 38-44.
Downs P.W. and Thorne C. R., 2000. Rehabilitation of a lowland river: Reconciling flood defence
with habitat diversity and geomorphological sustainability. J. Environ. Manag. 58, 249–268
Fourie (nee Vlok), H. 2011. CBA spreadsheets, email to D. Crookes [Online], 7 February. Available
email: [email protected].
Hertz D.B. and Thomas H., 1983. Risk Analysis and its Applications. John Wiley & Sons: New
York.
Higgins S.I., Turpie J.K., Costanza R., Cowling R.M., Le Maitre D.C., Marais C. and Midgley G.F.,
1997. An Ecological Economic Simulation Model of Mountain Fynbos Ecosystems: Dynamics,
Valuation and management. Ecol. Econ. 22, 155-169.
Hoffman T., Todd S., Ntshona Z., and Turner S. (eds), 2000. A national review of land degradation
in South Africa, unpublished report. South African National Biodiversity Institute, Pretoria. Online
at: http://www.nbi.ac.za/landdeg (accessed: 14 November 2012)
Holl K.D., 2002. Long-term vegetation recovery on reclaimed coal surface mines in the eastern
USA. J. Appl. Ecol. 39, 960–970.

26
Holmes P.M., Richardson D.M., Marais C., 2007. Costs and benefits of restoring natural capital
following alien plant invasions in Fynbos ecosystems in South Africa. In: Aronson J., Milton S.J.,
and Blignaut J.N. (Eds), Restoring natural capital: business, science, and practice. Island Press:
Washington D.C., pp. 188-197.
Jogo W. and Hassan R., 2010. Balancing the use of wetlands for economic well-being and
ecological security: The case of the Limpopo wetland in southern Africa. Ecol. Econ. 69, 1569–
1579.
Keloharju R. and Wolstenholme E.F., 1989. A Case Study in System Dynamics Optimization. The
J. Oper. Res. Soc. 40, 3, 221-230.
Liu Y., Guo H., Yu Y., Dai Y., Zhou F., 2008. Ecological–economic modeling as a tool for
watershed management: A case study of Lake Qionghai watershed, China. Limnologica 38, 89–
104.
Maler, K-G. 2000. Development, ecological resources and their management: A study of complex,
dynamic systems. Eur. Econ. Rev., 44, 4-6, 645-665.
Mander, M., Blignaut J., van Niekerk, M., Cowling, R., Horan, M., Knoesen, D., Mills, A., Powell, M.
and Schulze, R., 2010. Baviaanskloof-Tsitsikamma Payment for Ecosystem services: A feasibility
assessment – synthesis report. South Africa National Biodiversity Institute / Working for Water.
Online at: http://www.capeaction.org.za/index.php?C=bio&P=2001
Matheson, J.E and Menke, M.M. 1994. Using decision quality principles to balance your R&D
portfolio. Res. Tech. Manag. 37, 3, 38 – 43.
Matheson, J.E., Menke M.M. and Derby, S.L., 1989. Improving the quality of R&D decision: a
synopsis of the SDG approach”, J. Sci. Pol. Res. Manag. (in Japanese) 4, 400 - 412.

27
Mills A.J., Turpie J.K., Cowling R.M., Marais C., Kerley G.I.H., Lechmere-Oertel R.G., Sigwela
A.M., Powell M., 2007. Assessing costs, benefits, and feasibility of restoring natural capital in
subtropical thicket in South Africa. In: Aronson J., Milton S.J., and Blignaut J.N. (Eds), Restoring
natural capital: business, science, and practice. Island Press: Washington D.C., pp. 179-187.
Milton S.J., Dean R.J., Richardson D.M., 2003. Economic Incentives for Restoring Natural Capital
in Southern African Rangelands. Front. Ecol. Environ., 1, 5, 247-254.
Moreno-de las Heras M., Nicolau J.M., Espigares T. 2008. Vegetation succession in reclaimed
coal-mining slopes in a Mediterranean-dry environment. Ecol. Eng. 34, 168-178.
Mullins, D., Mosaka, D.D., Green, A.B., Downing, R. and Mapekula, P.G. 2007. A Manual for Cost
Benefit Analysis in South Africa with Specific Reference to Water Resource Development. Second
Edition. Report No. TT 305/07. Pretoria: WRC.
Navraj P., Providoli I., Bimal R. and Gandhiv K., 2010. Valuing Water and its Ecological Services
in Rural Landscapes: A Case Study from Nepal. Mountain Forum Bulletin 32-34. Available online:
http://www.forestrynepal.org/images/publications/pes_article_mountainforum_forcirculation.pdf
(accessed: 14 November 2012)
Ndhlovu T. 2011. Impact of Prosopis (mesquite) invasion and clearing on ecosystem structure,
function and agricultural productivity in semi-arid Nama Karoo rangeland, South Africa. M.Sc.
Thesis, Department of Conservation Ecology & Entomology, University of Stellenbosch
Ndhlovu, T., Milton, S.J. Esler, K.J. 2011. Impact of Prosopis (mesquite) invasion and clearing on
the grazing capacity of degraded semi-arid Nama Karoo rangeland, South Africa. African Journal
of Range and Forage Management, 28(3):129-137.
Nobre, A.M., Musango, J.K., De Wit, M.P. and Ferreira, J.G. 2009. A dynamic ecological-economic
modelling approach for aquaculture management. Ecol. Econ., 68, 3007–3017.

28
Rees, W.E., Farley J., Vesely É-T, and de Groot R., 2007. Valuing natural capital and the costs
and benefits of restoration. In: Aronson J., Milton S.J., and Blignaut J.N. (Eds), Restoring natural
capital: business, science, and practice. Island Press, Washington D.C., pp. 227–236
Rose R., 2009, Personal communication. Geohydrological and Spatial Solutions International (Pty)
Ltd, Stellenbosch, November.
Schiappacasse I., Nahuelhual L., Vásquez F., and Echeverría C., 2012. Assessing the benefits
and costs of dryland forest restoration in central Chile. J. Environ. Manag. 97: 38-45
Tischew, S., Baasch, A., Conrad, M., Kirmer, A., 2010. Evaluating restoration success of frequently
implemented compensation measures: results, and demands for control procedures. Restor. Ecol.
18, 467–480.
Turpie, J.K., Marais, C., Blignaut, J.N., 2008. The Working for Water Programme: evolution of a
payments for ecosystem services mechanism that addresses both poverty and ecosystem service
delivery in South Africa. Ecol. Econ. 65, 789–799.
Turpie, J.K., Clark, B.M., Cowley, P., Bornman, T & Terörde, A. 2008. Integrated ecological-
economic modelling as an estuarine management tool: a case study of the East Kleinemonde
Estuary. Volume II. Model construction, evaluation and user manual. WRC Report No. 1679/2/08.
Pretoria.
Vandaele N.J. and Decouttere C.J., 2012. Sustainable R&D portfolio assessment. Decision
Support Systems. In press.
Van der Horst D., 2011. Adoption of payments for ecosystem services: An application of the
Hägerstrand model. Appl. Geogr. 31, 668-676.
Van Groenendaal W.J.H., and Kleijnen J.P.C., 1997. On the assessment of economic risk:
factorial design versus Monte Carlo methods. Reliab. Eng. Syst. Saf. 57, 91-102.

29
Ventana Systems 2007. Vensim User’s Guide Version 5. Ventana Systems, Inc: Boston, MA.
Vlok, H., 2010. Cost-Benefit Analyses of Alien Removal and Natural Capital Restoration: Case
Studies of the Agulhas Plain and Beaufort West Local Municipality. Unpublished report, University
of Stellenbosch and Western Cape Department of Agriculture.
Wise, R.M. and Cacho, O.J., 2005. Tree-crop interactions and their environmental and economic
implications in the presence of carbon-sequestration payments. Environ. Model. Software 20,
1139-1148.
Wu, J. and David, J.L. 2002. A spatially explicit hierarchical approach to modeling complex
ecological systems: theory and applications. Ecol. Model., 153, 1, 7-26.
Wysocki R.K., 2009. Effective Project Management: Traditional, Agile, Extreme, Fifth Edition.
Wiley Publishing: Indianapolis, IN
Yoe C.E., Burks-Copes K., Schultz M.T. and Suedel B.C., 2009. Addressing Risk and Uncertainty
in Planning Ecological Restoration Projects. EMRRP Technical Notes Collection. ERDC TN
EMRRP-ER-13. Vicksburg, MS: U.S. Army Engineer Research and Development Center.
http://el.erdc.usace.army.mil/emrrp/emrrp.html (accessed: 14 November 2012)