using globally-corrected gps solutions to assess the · pdf fileusing globally-corrected gps...
TRANSCRIPT

Proceedings of the Canadian Hydrographic Conference and National Surveyors Conference 2008
Paper 4-2 Page 1 Ian Church
Using Globally-Corrected GPS Solutions to Assess the Viability of Hydrodynamic Modeling in the Bay of Fundy
Ian Church1, John E. Hughes Clarke1, Susan Haigh1, Marcelo Santos1, Mike Lamplugh2, Jon Griffin2 and Russell Parrott3
1. Ocean Mapping Group, Dept. Geodesy and Geomatics Engineering, University of New Brunswick
2. Canadian Hydrographic Service - Atlantic, Bedford Institute of Oceanography 3. Geological Survey of Canada - Atlantic, Natural Resources Canada
Abstract
Traditionally, hydrodynamic models are tuned to best reproduce observed tidal constituents within the model domain. Such observations are normally limited to coastlines at the edges of the model and are often in small bays cut off by constrictions that are not resolved by the model and thus may not be representative of the tides just offshore.
Now that Globally–corrected GPS (GcGPS) elevations are available at decimetre-level accuracy, it is possible to test the validity of hydrodynamic models in open water regions through comparison of instantaneous sea level variations from vessel transits. Rather than testing at a point location, transects can be made through critical choke point areas where phase and amplitude are predicted to change very rapidly. These observations can check on the fidelity of the model in these sensitive regions.
As part of the regional mapping operations within the Bay of Fundy under the Geoscience for Ocean Mapping program of NRCan, four different vessels have been collecting GcGPS using either Fugro Omnistar HP or C-Nav. Post Processed Kinematic (PPK) GPS was also obtained from the Princess of Acadia ferry which crosses the Bay of Fundy daily. Results of comparisons of the long period (minute+) vertical perturbations of these vessels is presented with respect to both the regional WebTide Scotian Shelf hydrodynamic model and nested higher resolution models.
Introduction
When hydrodynamic tidal models are developed, they are usually validated by comparing the output predicted tides from the model to predicted tides at coastal tide stations within the model domain. The predicted tide at the coastal stations is derived from analysis of the observed tides and is therefore taken as an accurate prediction of the tides. Tidal observations away from the coast are typically non-existent or very sparse.
The main added value of a hydrodynamic tidal model for hydrography is that it provides a way to account for cotidal variations across large bodies of water away from points of discrete observations. With the increasing interest in the continental shelf region for studies such as

Proceedings of the Canadian Hydrographic Conference and National Surveyors Conference 2008
Paper 4-2 Page 2 Ian Church
habitat or resource development, there is a growing need to have an adequate offshore tide solution.
The issues associated with validating a hydrodynamic model with coastal tide gauges are that the coastal gauges can be affected by shallow water tidal effects, which are not always included with the model, and may be separated from open water by a breakwater, bay or other constriction. These factors can modify the tidal regime and coastal tide observations may not be representative of the tides just offshore. Therefore, to appropriately validate a hydrodynamic model it must be compared to tides throughout the model domain, especially away from the coast.
With advancements in GPS positioning precision and geoid modelling, a vessel’s height above mean sea level can be determined for any point during transit. Being mindful of vessel squat, ignoring atmospheric or meteorological effects on sea level and accounting for the lever arm from the GPS antenna to nominal waterline, the deviations in the vessel’s height above mean sea level equates to the amplitude of the tides at that moment and location.
The determination of a real-time tide from a vessel’s GPS can be compared to the predicted tide at the same location from a hydrodynamic model [Church et al., 2007]. The model predictions can move with the vessel and are thus valid for transits. This comparison can help determine the accuracy of a hydrodynamic models prediction of tidal phase and amplitude at any point within the model domain. The vertical range of the GPS observations between high and low water can be compared to the predicted tidal amplitude and timing of high and low water can be used to access the phase output from a hydrodynamic model to compare observed and predicted tidal ranges.
A comparison has been made between three hydrodynamic models within the Bay of Fundy, in eastern Canada, and GPS observations from five vessels. Four of the vessels used GPS from Globally Corrected GPS (GcGPS) systems and one used Post Processed Kinematic (PPK) GPS positioning.
Background
Three hydrodynamic models, whose domains exist within the Bay of Fundy, on the east coast of Canada, have been examined. Two of the models, the Scotian Shelf Model and the Upper Fundy Model, were developed at the Department of Fisheries and Oceans, while the Grand Manan Model was developed at the University of New Brunswick. The extents of the three models are shown in Figure 1.
The Scotian Shelf model covers the entire Bay of Fundy, the Gulf of Maine and extends out from the south coast of Nova Scotia. It contains the diurnal and semi-diurnal harmonic tidal constituents of M2, K1, K2, N2, S2, O1, L2, M4, NU2 and 2N2 [Fisheries and Oceans Canada, 2007].
The Upper Fundy model extends from Saint John, New Brunswick, up into the Bay of Fundy. The Upper Fundy model is a high resolution model that uses wetting and drying to change the coastline based on the water level [Dupont et al., 2005]. It contains the diurnal and semi-diurnal harmonic tidal constituents of M2, K1, K2, N2, S2, O1, L2, M4, NU2 and 2N2 to create a tidal prediction [Fisheries and Oceans Canada, 2007]. The Upper Fundy model was created through

Proceedings of the Canadian Hydrographic Conference and National Surveyors Conference 2008
Paper 4-2 Page 3 Ian Church
forward modelling using boundary conditions from TOPEX/Poseidon and inverse modelling run through comparison of the model tidal prediction to the observed tides at coastal tide stations [Dupont et al., 2005].
The Grand Manan model was developed to account for the intricate islands and complex bathymetry around Grand Manan Island. It was developed as a high resolution model nested within the Scotian Shelf model and its purpose was primarily to look at current fields for sediment transport. Construction of the model was based on archives of CHS single beam data, new multibeam survey data and a high resolution coastline. It contains the diurnal and semi-diurnal harmonic constituents of M2, K1, N2, S2 and O1.
GPS data from five vessels has been obtained for comparison to the hydrodynamic models. The CCGS Matthew, CSL Pipit and CSL Plover are hydrographic survey vessels which use the Fugro OmniSTAR positioning system and worked throughout the Bay of Fundy in 2007. They are operated by the Canadian Hydrographic Service out of Dartmouth, Nova Scotia. The Heron is a hydrographic survey vessel operated by the Ocean Mapping Group at the University of New Brunswick in Fredericton, New Brunswick. The Heron uses the CNav GcGPS positioning system and worked around the southern tip of Grand Manan Island in the Bay of Fundy in 2007. The Princess of Acadia is a vehicle ferry which runs between Saint John, New Brunswick, and Digby, Nova Scotia. GPS data from the Princess of Acadia has been post processed using long baseline PPK GPS techniques [Santos et al., 2005]. The precision of the GcGPS system can be expected to be at the decimetre level while the PPK data is at approximately three centimetres [Roscoe Hudson and Sharp, 2001].
Grand Manan Model
Scotian Shelf Model Upper Fundy Model Figure 1 – Model Overview

Proceedings of the Canadian Hydrographic Conference and National Surveyors Conference 2008
Paper 4-2 Page 4 Ian Church
Data Processing
The GPS data from the vessels using GcGPS observations was collected in an ASCII NMEA format. The GPGGA strings from the NMEA files were extracted and used to determine the positions of the vessel antenna at one hertz. The PPK GPS data from the Princess of Acadia was obtained in ASCII formatted files with positions and associated standard deviations at one hertz.
The positions were extracted from the ASCII files and input to Ocean Mapping Group binary navigation files. The vertical heights above the WGS84 ellipsoid were low pass filtered using a cosine squared tapered weighted average of 60 seconds. This filtering smoothed the data and removed high frequency outliers, particularly heave motion. A median filter was applied to the low pass filtered data of 30 seconds to decrease the data density. The result was a filtered version of the original GPS ellipsoidal heights sampled every 30 seconds.
The ellipsoidal heights for each vessel were measured with respect to their associated GPS antennae. The positions therefore had to be shifted from the GPS antenna height to the waterline. This was done using the known height of the GPS antenna above the vessel reference point and the offset between the waterline and the reference point. As the data was smoothed over 30 seconds, the roll and pitch were assumed to average to zero for the lever arms. Any biases such as trim and list would result in a constant bias. For the Princess of Acadia, the height of GPS antenna above the water line was estimated using the average geoidal height.
The geoid to ellipsoid separation was determined using the Canadian HTv2.0 separation model [Earth Sciences Sector, NRCan, 2007]. The geoid ellipsoid separation was removed from the original ellipsoidal heights for each navigation file. The vertical component of the resulting navigation files were referenced to the geoid and sampled every 30 seconds.
Diffe
ren
ce (m
etre
s)
EGM96 – HTv2.0 Geoid Separation Model Difference
Figure 2 – Difference Map of EGM96 vs HTv2.0 Separation Models
To examine the importance of the geoidal separation model precision, the Princess of Acadia GPS data was reduced to the geoid using the longer wavelength, lower resolution, global egm96

Proceedings of the Canadian Hydrographic Conference and National Surveyors Conference 2008
Paper 4-2 Page 5 Ian Church
geoid ellipsoid separation model and the higher resolution, shorter wavelength, national HTv2.0 separation model [Earth Sciences Sector, NRCan, 2007; Lemoine et al., 1998]. When the vessel’s GPS data was processed using the egm96 model it was noted that the data was exhibiting a bulge when crossing the Bay of Fundy. The HTv2.0 separation model was then used to transform the GPS ellipsoid observations to the CGVD28 geoid and the artefact was removed [Earth Sciences Sector, NRCan, 2007]. Figure 2 displays the difference between the EGM96 and HTv2.0 separation models. The low in the difference map, which caused the artefact to be observed, is clearly visible between Saint John, NB, and Digby, NS.
The positions associated with each navigation file were input to a modified version of a program entitled Tidecor [Fisheries and Oceans Canada, 2007]. This program determines the tidal amplitude and phase for each modelled tidal harmonic constituent at every position in the input file from a specified hydrodynamic model. The sum of all the constituent heights, at a specified time, represents the predicted tide. For this project the hydrodynamic models of Scotian Shelf, Upper Fundy and Grand Manan were examined. The software outputs a new navigation file with the tidal amplitude associated with the time and position of the input navigation file.
The GPS geoidal heights associated with each navigation file were compared to the predicted tidal amplitudes from hydrodynamic models for the same location and time. The comparisons were divided into 24 hour (or less) periods for examination.
Results
CCGS Matthew The CCGS Matthew steamed throughout the Bay of Fundy during the 2007 survey season. The GPS data from the Matthew can therefore be compared to the Upper Fundy model, the Scotian Shelf model and the Grand Manan model as it stretches throughout the bay. As the Matthew operates 24 hours a day, full tidal curves can be observed. To simplify the analysis procedure, the Matthew GPS data was divided into 6 smaller sub regions, each of which lie within a region of similar tidal phase and amplitude. The exception is Area 1, within the Minas Passage, where extreme gradients in phase are known.

Proceedings of the Canadian Hydrographic Conference and National Surveyors Conference 2008
Paper 4-2 Page 6 Ian Church
0
1
234
5
Figure 3 – CCGS Matthew Areas
Area 0
Area 0 is located at the upper end of the Bay of Fundy within the Minas Basin where the tide decelerates past the constriction of Area 1. The phase of the GPS data, the Upper Fundy and Scotian Shelf models are close when observed from inflections in Figure 4, but amplitudes differ between the three. The Upper Fundy model over predicts the range of the tide within this region by approximately 0.7 metres. The Scotian Shelf model under predicts the range of the tide within the Minas Basin by approximately 0.9 metres. Therefore, there is a 1.6 metre difference in the tidal ranges output by the two models and the observed tidal range from the GPS data sits in between the two predictions.
GPS Data – Above Geoid
Upper Fundy Model
Scotian Shelf Model1 m0 m
2 m3 m4 m5 m
-1 m-2 m-3 m-4 m-5 m
Time (Hours)
Ele
vatio
n
Area 0 – Matthew GPS Data vs Hydrodynamic Models
Figure 4 – Matthew Area 0

Proceedings of the Canadian Hydrographic Conference and National Surveyors Conference 2008
Paper 4-2 Page 7 Ian Church
Area 1
Area 1 is located in the Minas Passage at the head of the Bay of Fundy. It includes one of the areas of highest current velocities within the bay, with current magnitudes reaching over 5 m/s. The change in phase of the tide as it travels through this constriction is immense and the ability of the hydrodynamic models to properly account for this extreme phase gradient is critically controlled by the models representation of the bathymetry. Within Area 1, the Matthew GPS data matches the Scotian Shelf very well, but discrepancies can be noted between the GPS data and the Upper Fundy model. There are no obvious phase differences between the GPS data and either model tidal prediction. The Upper Fundy model over predicts the tidal range in the Minas Passage by approximately 1.2 metres. The Scotian Shelf model provides a closer match to the Matthew GPS data, with an under prediction of the tidal range by approximately 0.4 metres.
Of particular interest are the anomalies on the flood tide, noted by the circled areas in Figure 5. In comparison to the GPS data, the models both show a hint of the anomaly but under predict it. The anomalies occur while the vessel is passing through the narrow constriction of the Minas Passage just off Cape Split and immediately downstream of a pronounced rock ridge, previously poorly described by the available bathymetric data. The locations of these anomalies are shown in Figure 6 and occur while the vessel is travelling from west to east.
GPS Data – Above Geoid
Upper Fundy Model
Scotian Shelf Model1 m0 m
2 m3 m4 m5 m
-1 m-2 m-3 m-4 m-5 m
Time (Hours)
Ele
vatio
n
Area 1 – Matthew GPS Data vs Hydrodynamic Models
Figure 5 – Matthew Area 1

Proceedings of the Canadian Hydrographic Conference and National Surveyors Conference 2008
Paper 4-2 Page 8 Ian Church
1
2
0 km 5 km
Figure 6 – Flood Tide Anomaly in Area 1 of Matthew Data (Arrow indicates direction of vessel transit)
Time (minutes)
Ele
vatio
n (m
)
Time (minutes)
Ele
vatio
n (m
)
GPS Data – Above Geoid
Upper Fundy Model
Scotian Shelf Model
GPS Data – Above Geoid
Upper Fundy Model
Scotian Shelf Model
Area 1 – Matthew GPS Data vs Hydrodynamic Model Close Ups (1 hour segment)
0.6 metres
0.4 metres
1
2
Figure 7 – Close Up of Matthew Anomalies (Green and Red Arrows Match Locations in Figure 6)

Proceedings of the Canadian Hydrographic Conference and National Surveyors Conference 2008
Paper 4-2 Page 9 Ian Church
The anomaly numbered 1, in Figures 5 though 7, describes the vessel dropping 0.6 metres over 3 kilometres as it steamed into the Minas Passage. Anomaly number 2, located to the north of anomaly 1, describes the vessel dropping 0.4 metres over 3.5 kilometres as it steamed into the passage. The Upper Fundy model does a better job of resolving the step like anomaly observed in Figure 7, presumably because the higher resolution grid better defines the rock ridge, yet the model does not resolve it to the extent described by the GPS data. The bathymetry used in the development of the hydrodynamic models is shown and compared to the actual bathymetry in Figure 8. The Upper Fundy model bathymetry resolves the channel passing through the Minas Passage better than the Scotian Shelf model, but does not account for the rock ridges shown by the black arrows in Figure 8.
Multibeam BathymetryUpper Fundy Model
BathymetryScotian Shelf Model
Bathymetry
Figure 8 – Actual Bathymetry of Minas Passage Compared to Upper Fundy and Scotian Shelf Model
Bathymetry
Area 2
Area 2 is located in the Minas Channel near the head of the Bay of Fundy, just south of the Minas Passage entrance. Area 2 appears to exhibit similar qualities as Area 1. The Scotian Shelf model provides a better approximation of the tidal amplitude than the Upper Fundy model within this area. The Upper Fundy model over compensates the tidal range by approximately 1.7 metres and the predicted phase from the Upper Fundy model appears to lag behind the GPS data at the inflection points. The Scotian Shelf model over predicts the tidal range by approximately 0.2 metres and the phase appears to match the GPS data at the inflection points.
GPS Data – Above Geoid
Upper Fundy Model
Scotian Shelf Model1 m0 m
2 m3 m4 m5 m
-1 m-2 m-3 m-4 m-5 m
Time (Hours)
Ele
vatio
n
Area 2 – Matthew GPS Data vs Hydrodynamic Models
Figure 9 – Matthew Area 2

Proceedings of the Canadian Hydrographic Conference and National Surveyors Conference 2008
Paper 4-2 Page 10 Ian Church
Area3
Area 3 is located in the centre of the Bay of Fundy, far from the constriction of the Minas Passage, but close to the boundary of the Upper Fundy model. Both models match the GPS data quite well at this location. The Upper Fundy model still over compensates the tidal range by approximately 0.4 metres and the predicted phase appears to lag behind the GPS data. The Scotian Shelf model under predicts the tidal range in this area by less than 0.4 metres, but the predicted phase matches the GPS data at the inflection points.
GPS Data – Above Geoid
Upper Fundy Model
Scotian Shelf Model1 m
0 m
2 m
3 m
4 m
5 m
-1 m
-2 m
-3 m
-4 m
-5 m
Time (Hours)
Ele
vatio
n
Area 3 – Matthew GPS Data vs Hydrodynamic Models
Figure 10 – Matthew Area 3
Area4
Area 4 is located to the east of Grand Manan Island. At this location the GPS data is compared to the Scotian Shelf model and the Grand Manan model outputs. The Grand Manan model was built as a nested model within the Scotian Shelf model and as such the phase and amplitude of the two models are similar, although the Grand Manan model includes fewer constituents. There is little difference between the amplitude of the GPS data and the model tidal prediction outputs but there does appear to be a small difference in phase, with the Grand Manan model predicted phase slightly ahead of the GPS data at the inflection points. The Scotian Shelf model under predicts the tidal range by less than 0.1 metres and the Grand Manan model under predicts the tidal range by 0.2 metres. The GPS data shows that there were occasionally problems with the GPS observations though out this region.

Proceedings of the Canadian Hydrographic Conference and National Surveyors Conference 2008
Paper 4-2 Page 11 Ian Church
GPS Data – Above Geoid
Grand Manan Model
Scotian Shelf Model
Time (Hours)
Area 4 – Matthew GPS Data vs Hydrodynamic Models
1 m
0 m
2 m
3 m
4 m
5 m
-1 m
-2 m
-3 m
-4 m
-5 m
Ele
vatio
n
Figure 11 – Matthew Area 4
Area5
Area 5 is located at the mouth of the Bay of Fundy, to the south of Grand Manan Island, on the southern flanks of the Murr Ledges. The GPS data, the Scotian Shelf model and the Grand Manan model all match quite closely in this area. The Scotian Shelf model under predicts the tidal range in this area by 0.2 metres and the Grand Manan model under predicts the tidal range by 0.1 metres. There are no obvious differences in phase between the three determinations. The tidal amplitudes in this region are smaller and the tidal regime is less complex than in the upper regions of the Bay of Fundy.
GPS Data – Above Geoid
Grand Manan Model
Scotian Shelf Model1 m
0 m
2 m
3 m
-1 m
-2 m
-3 m
Time (Hours)
Ele
vatio
n
Area 5 – Matthew GPS Data vs Hydrodynamic Models
Figure 12 – Matthew Area 5
Proceedings of the Canadian Hydrographic Conference and National Surveyors Conference 2008
Paper 4-2 Page 12 Ian Church
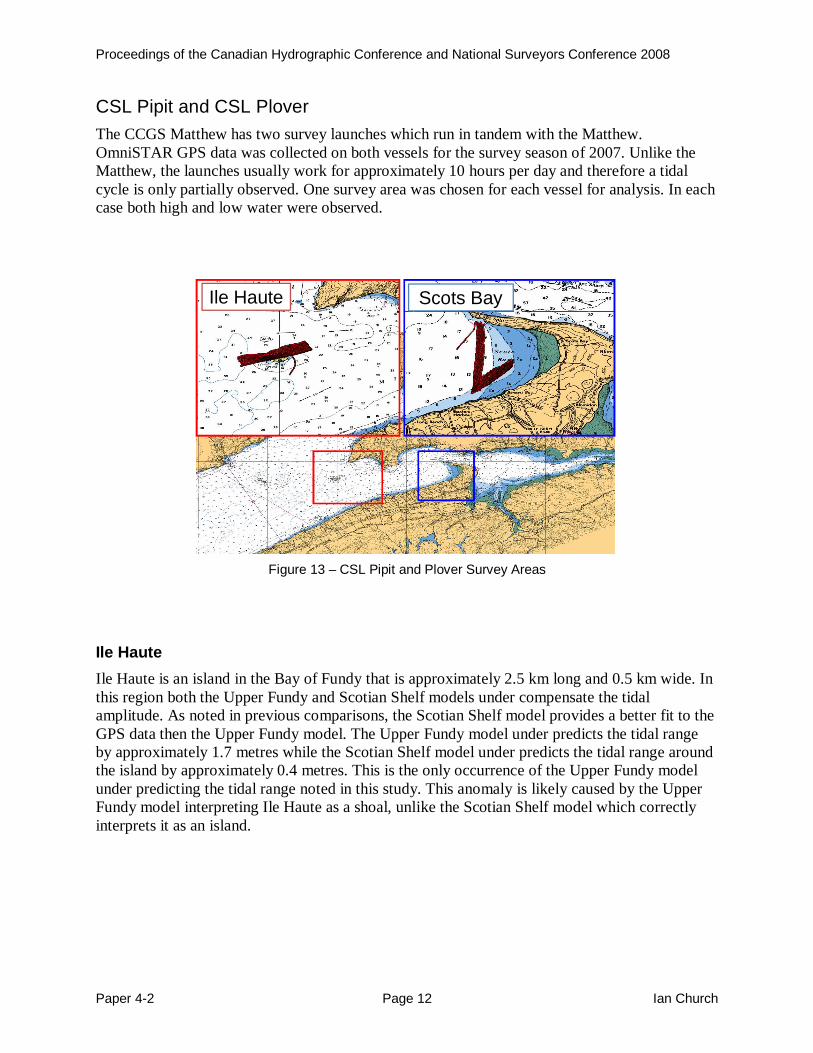
CSL Pipit and CSL Plover The CCGS Matthew has two survey launches which run in tandem with the Matthew. OmniSTAR GPS data was collected on both vessels for the survey season of 2007. Unlike the Matthew, the launches usually work for approximately 10 hours per day and therefore a tidal cycle is only partially observed. One survey area was chosen for each vessel for analysis. In each case both high and low water were observed.
Ile Haute Scots Bay
Figure 13 – CSL Pipit and Plover Survey Areas
Ile Haute
Ile Haute is an island in the Bay of Fundy that is approximately 2.5 km long and 0.5 km wide. In this region both the Upper Fundy and Scotian Shelf models under compensate the tidal amplitude. As noted in previous comparisons, the Scotian Shelf model provides a better fit to the GPS data then the Upper Fundy model. The Upper Fundy model under predicts the tidal range by approximately 1.7 metres while the Scotian Shelf model under predicts the tidal range around the island by approximately 0.4 metres. This is the only occurrence of the Upper Fundy model under predicting the tidal range noted in this study. This anomaly is likely caused by the Upper Fundy model interpreting Ile Haute as a shoal, unlike the Scotian Shelf model which correctly interprets it as an island.

Proceedings of the Canadian Hydrographic Conference and National Surveyors Conference 2008
Paper 4-2 Page 13 Ian Church
GPS Data – Above Geoid
Upper Fundy Model
Scotian Shelf Model1 m
0 m
2 m
3 m
4 m
-1 m
-2 m
-3 m
-4 m-5 m
Time (Hours)
Ele
vatio
nIle Haute – Plover GPS Data vs Hydrodynamic Models
Figure 14 – Plover Ile Haute
Scots Bay
Scots Bay is located within the Minas Channel along the Nova Scotia coast next to a large intertidal area. As the Upper Fundy model includes wetting and drying functionality, it would be expected that it would account for this intertidal area and provide an improved estimate of the predicted tides, but this is not the case. In contrast to the Ile Haute region, the Upper Fundy model over compensates the tidal range in this area by approximately 1.3 metres. The Scotian Shelf model still under compensates the tidal range by approximately 0.6 metres.
GPS Data – Above Geoid
Upper Fundy Model
Scotian Shelf Model1 m
0 m
2 m
3 m4 m5 m
-1 m
-2 m-3 m
-4 m-5 m
Time (Hours)
Ele
vatio
n
Scots Bay– Pipit GPS Data vs Hydrodynamic Models
Figure 15 – Pipit Scots Bay
Heron The Heron spent the summer of 2007 performing hydrographic surveys at the southern tip of Grand Manan Island, within the Bay of Fundy. CNav GcGPS was logged for the entire survey season. The Heron operated for approximately 8 hours per day, therefore a full tidal cycle was never observed. To simplify analysis, the Heron GPS data was divided into four smaller regions.

Proceedings of the Canadian Hydrographic Conference and National Surveyors Conference 2008
Paper 4-2 Page 14 Ian Church
Figure 16 – Heron Survey Areas
Area0
Area 0 is located in open water with no surrounding complex island regions. Within this area the Grand Manan model and the Scotian Shelf model both under compensate the tidal amplitude compared to the GPS data. The phases of the model tidal predictions appear to lag slightly behind the GPS data at the inflection point.
GPS Data – Above Geoid
Grand Manan Model
Scotian Shelf Model1 m
0 m
2 m
3 m
-1 m
-2 m
-3 m
Time (Hours)
Ele
vatio
n
Area 0 – Heron GPS Data vs Hydrodynamic Models
Figure 17 – Heron Area 0

Proceedings of the Canadian Hydrographic Conference and National Surveyors Conference 2008
Paper 4-2 Page 15 Ian Church
Area1
Area 1 is located in relatively open water with islands and shoals to the west and north of the region. As with Area 0, the tidal amplitude is under compensated by the Grand Manan and Scotian Shelf models. In this region, the predicted phase from both models appears to lag slightly behind the GPS data at the inflection point.
Figure 18 – Heron Area 1
Area2
Area 2 is located between Grand Manan Island and Wood Island. The region is long, narrow, open to the bay and almost closed off at the northern end. In this area the predicted phase from both models lag significantly behind the GPS data at the inflection point. The tidal amplitude appears to be over compensated by the models when compared to the GPS data.
Figure 19 – Heron Area 2
Area3
Area 3 is a shallow, coastal region along Grand Manan Island. Within this region the output prediction from the Grand Manan and Scotian Shelf models are very similar, even though the Grand Manan model resolves the currents and bathymetry around the region while the Scotian
GPS Data – Above Geoid
Grand Manan Model
Scotian Shelf Model 1 m
0 m
2 m
3 m
-1 m
-2 m
-3 m
Time (Hours)
Elevation
Area 2 – Heron GPS Data vs Hydrodynamic Models
GPS Data – Above Geoid
Grand Manan Model
Scotian Shelf Model 1 m
0 m
2 m
3 m
-1 m
-2 m
-3 m
Time (Hours)
Elevation
Area 1 – Heron GPS Data vs Hydrodynamic Models

Proceedings of the Canadian Hydrographic Conference and National Surveyors Conference 2008
Paper 4-2 Page 16 Ian Church
Shelf model does not. The models appear to under compensate the tidal range within this area. The differences in phase are difficult to interpret without sufficient data to display an inflection point between low and high water.
Figure 20 – Heron Area 3
Princess of Acadia In 2004 a project was established to collect GPS data on the Princess of Acadia ferry, operated by Bay Ferries, during its transit between Saint John, New Brunswick, and Digby, Nova Scotia, for one year. The data was post processed using observations from base stations at Saint John and Digby to achieve centimetre level precision [Santos et al., 2005]. One week of data was examined for analysis from May 16th, 2004 to May 21st, 2004, three days of which are shown here.
Figure 21 – Princess of Acadia Transit
The upper graph in Figures 22 through 24 show the Princess of Acadia speed (blue) and the difference between the Scotian Shelf hydrodynamic model and the GPS elevation data (green). Increases in speed indicate that the Princess of Acadia is crossing the Bay of Fundy. The lower graph in Figures 22 through 24 show the GPS elevation data from the Princess of Acadia and the Scotian Shelf model tidal prediction output.
GPS Data – Above Geoid
Grand Manan Model
Scotian Shelf Model 1 m
0 m
2 m
3 m
-1 m
-2 m
-3 m
Time (Hours)
Elevation
Area 3 – Heron GPS Data vs Hydrodynamic Models

Proceedings of the Canadian Hydrographic Conference and National Surveyors Conference 2008
Paper 4-2 Page 17 Ian Church
GPS Data – Above Geoid
Scotian Shelf Model
1 m
0 m
2 m
3 m
-1 m
-2 m
-3 m
Time (Hours)
Ele
vatio
n
May 16th, 2004 – Princess of Acadia – GPS Data vs. Hydrodynamic Models
4 m
-4 m
Time (Hours)
May 16th, 2004 – Princess of Acadia – Speed and Difference Between Model and GPS Data
0123456789
0
0.5
Spe
ed (
m/s
) Elevation (m
)
-0.5
Figure 22 – Princess of Acadia May 16th, 2004
Figure 22 shows that the difference between the GPS elevation data from the Princess of Acadia and the Scotian Shelf hydrodynamic model tidal output differ by up to +/- 0.5 metres. While the vessel was stationary at port, the Scotian Shelf model under predicted the high and low tide by up to 0.5 metres. There seems to be no visible phase shift between the observed GPS data and the output prediction from the hydrodynamic model. When the vessel is crossing the bay, indicated by the increase in velocity, it rises and then descends gradually through the crossing. This is not caused by squat as the vessel gets up to speed in minutes. It could either be caused by inaccuracies in the Scotian Shelf model tidal prediction through the centre of the Bay or from errors within the geoid ellipsoid separation model. The vessel appears to sink before leaving port and rises up again after arriving at the other side of the bay. This is most likely caused by the loading and unloading of vehicles from the ferry, as noted by the arrows in Figures 22 through 24.

Proceedings of the Canadian Hydrographic Conference and National Surveyors Conference 2008
Paper 4-2 Page 18 Ian Church
GPS Data – Above Geoid
Scotian Shelf Model
1 m
0 m
2 m
3 m
-1 m
-2 m
-3 m
Time (Hours)
Ele
vatio
n
May 17th, 2004 – Princess of Acadia – GPS Data vs. Hydrodynamic Models
4 m
-4 m
Time (Hours)
May 17th, 2004 – Princess of Acadia – Speed and Difference Between Model and GPS Data
0123456789
0
0.5
Spe
ed (
m/s
) Elevation (m
)
-0.5
Figure 23 – Princess of Acadia May 17th, 2004
Figure 23 displays similar traits to Figure 22. While the vessel is stationary the difference between the observed GPS elevation data and the hydrodynamic model tidal prediction is approximately +/- 0.25 metres. The model under predicted the amplitude of the tide while the vessel was stationary but the phase between the GPS observed elevation and the model prediction provides a close match. As with Figure 22, the vessel appears to sink before leaving port and rises again after arriving at the other side of the bay.

Proceedings of the Canadian Hydrographic Conference and National Surveyors Conference 2008
Paper 4-2 Page 19 Ian Church
GPS Data – Above Geoid
Scotian Shelf Model
1 m
0 m
2 m
3 m
-1 m
-2 m
-3 m
Time (Hours)
Ele
vatio
n
May 20th, 2004 – Princess of Acadia – GPS Data vs. Hydrodynamic Models
4 m
-4 m
Time (Hours)
May 20th, 2004 – Princess of Acadia – Speed and Difference Between Model and GPS Data
0123456789
0
0.5
Sp
eed
(m
/s) E
levation (m
)
-0.5
Figure 24 – Princess of Acadia May 20th, 2004
Figure 24 displays four crossings between Saint John, NB, and Digby, NS. While the vessel is stationary at either port, the Scotian Shelf hydrodynamic model under predicts the tidal amplitude when compared to the GPS elevation data by up to 0.5 metres but the phase difference between the GPS data and the model prediction provide a close match.
Discussion
In general, the Scotian Shelf hydrodynamic model tidal prediction matches the GPS elevation above mean sea level data better than either the Upper Fundy or Grand Manan models throughout the entire Bay of Fundy, despite the fact that it is a lower resolution model. It would be expected that the higher resolution hydrodynamic models of Upper Fundy and Grand Manan would outperform the Scotian Shelf model due to their improved bathymetry and coastline, but this is not the case. The Scotian Shelf model provides an improved prediction of tidal amplitude and phase, which in general matches the vessel GPS elevation data to within less than a metre throughout the Bay of Fundy.

Proceedings of the Canadian Hydrographic Conference and National Surveyors Conference 2008
Paper 4-2 Page 20 Ian Church
At the head of the bay, in the Minas Basin, the Upper Fundy model over predicts the tidal amplitude compared to the GPS data, while the Scotian shelf model under predicts the tidal amplitude. The tidal phase prediction from both models matches the GPS data closely in this area. This is the only region where the Upper Fundy hydrodynamic model provides a closer match to tidal range observed from the GPS data than the Scotian Shelf model, by approximately 0.2 metres.
In the Minas Passage, the Upper Fundy model begins to significantly over predict the tidal amplitude when compared to the GPS data. The passage is an area of complex currents and bathymetry which provides unusual effects, as shown by the steps observed during the flood tide in Figure 7, and a strong tidal phase gradient. The steps are seen when the vessel is moving from west to east and describe a decrease in the tidal amplitude in the centre of the Minas Passage by approximately half a metre. The Upper Fundy model resolves these anomalies better than the Scotian Shelf model, and is likely a result of the increased resolution of the Upper Fundy model partially taking into account the complex bathymetry of the Passage, as shown in Figure 8. Presumably, the imperfectly resolved rock ridge is generating a standing wave on the flood tide.
Outside the Minas Passage, within the Minas Channel, a phase lag between the Upper Fundy model and the GPS data becomes apparent. The Upper Fundy model still over compensates the tidal amplitude compared to the GPS data and there is a close match between the Scotian Shelf model and the GPS data. At Ile Haute, shown in Figure 13, an anomaly exists where the Upper Fundy model significantly under predicts the tidal amplitude compared to the GPS elevation data. This is the only location where the tidal amplitude is not over predicted by the Upper Fundy model.
In the centre of the Bay of Fundy, the Upper Fundy model over compensates the tidal amplitude and the Scotian Shelf model under compensates the tidal amplitude when compared to the GPS data. A phase lag exists in the Upper Fundy model, but the middle of the bay is close to the outer boundary of the Upper Fundy model, which could introduce errors.
Around Grand Manan Island, the differences between the modeled tidal predictions and the GPS elevations change depending on the location. The complex bathymetry and coastline surrounding Grand Manan Island suggest that the higher resolution Grand Manan model should outperform the Scotian Shelf model, but as discussed earlier, this is most often not the case. The complexity of the Murr ledges and small islands to the south of Grand Manan Island cause there to be phase discrepancies between the models and the GPS data in some areas and amplitude discrepancies in others. To the south of Grand Manan Island, at the entrance of the Bay of Fundy, the tidal amplitude is reduced and the bathymetry is simple and relatively smooth. In this area the Scotian Shelf and Grand Manan models both provide a close match to the GPS data.
The accuracy of the GPS height determination above the geoid is dependent on the accuracy of the geoid-ellipsoid separation model. In areas where there are rapid changes in geoid slope, this is an especially important consideration. When working in a small area, there is very little geoidal slope change, but when moving across large areas of the Bay of Fundy, as with the Princess of Acadia data, using an accurate geoidal model becomes an important consideration.
GPS position data can be used to validate hydrodynamic model predicted tides but there are limitations. The hydrodynamic models examined in this study do not take into account water level changes from atmospheric pressure or winds, while the GPS vessel data will take into account all factors affecting water levels. Modeling the effects of atmospheric pressure and

Proceedings of the Canadian Hydrographic Conference and National Surveyors Conference 2008
Paper 4-2 Page 21 Ian Church
meteorological events for inclusion to the hydrodynamic model tidal prediction output would allow for a fair comparison between GPS data and the model prediction. A vessel squat model would also need to be developed and used to adjust the hydrodynamic model to coincide with the GPS data. Taking into account the meteorological and squat factors, the differences between the GPS data and the hydrodynamic models could be used to adjust the models through inverse modelling and thus improve their tidal predictions.
Conclusions
Of the hydrodynamic models tested in this study, the Scotian Shelf model consistently outperformed the Upper Fundy and Grand Manan models in comparisons of the model tidal prediction to the vessel GPS data. The Upper Fundy model generally over predicted the tidal amplitude and phase lags were apparent in some locations when compared to the GPS data. As this model was designed specifically to predict coastal flooding, this could be of concern. The Grand Manan model was very similar to the Scotian Shelf model when compared to the Globally Corrected CNav GPS data from the Heron around Grand Manan Island. The difference between the observed tidal range from the reduced GPS data and the Scotian Shelf hydrodynamic model prediction was never greater than one metre and improved as one moved away from the head of the Bay of Fundy.
Using Globally Corrected GPS data from vessel transits can help validate the proper tidal amplitude and phase output from hydrodynamic models. Analyzing how the tidal regime is modified as the vessel transits through different regions by reducing GPS observations to mean sea level will aid in understanding the accuracy of the hydrodynamic model tidal amplitude and phase predictions throughout the model domain. The Globally Corrected GPS data observed on the Matthew, Pipit, Plover and Heron shows that with smoothing it can be superior to a hydrodynamic model in determining the actual water level with respect to mean sea level, but it does suffer from reliability issues with consistent outliers. Adjusting the hydrodynamic model parameters to match the observed tides from the reduced GPS data will improve the ability to use hydrodynamic models for applying predicted tides to hydrographic survey data.
Acknowledgements
The GPS data for this work was provided by the Canadian Hydrographic Service, Geological Survey of Canada and Dr. Marcelo Santos.
The WebTide hydrodynamic models were provided by the Department of Fisheries and Oceans thanks to Charles Hannah and Dave Greenberg.
Funding for this project was provided by an NSERC post graduate scholarship to the first author.
Data processing software was made possible thanks to the sponsors of the chair in Ocean Mapping at the University of New Brunswick (U.S. Geological Survey, Kongsberg Maritime, Fugros Pelagos, Royal (U.K) Navy, Rijkswaterstaat and the Route Survey Office of the Canadian Navy)

Proceedings of the Canadian Hydrographic Conference and National Surveyors Conference 2008
Paper 4-2 Page 22 Ian Church
References
Church, I., J. E. Hughes Clarke, and S. Haigh (2007). "Use of a nested finite-element hydrodynamic model to predict phase and amplitude modification of tide within narrow fjords." Proceedings of the US Hydrographic Conference, Norfolk, Virginia, 2007.
Dupont, F., C. G. Hannah, and D. Greenberg (2005). "Modelling the Sea Level of the Upper Bay of Fundy." Atmosphere-Ocean, 43(1), pp. 33.
Earth Sciences Sector, NRCan(2007). "Canadian Geodetic Service - Model." Natural Resources Canada. Canada. [On-line] 4/2, 2008. http://www.geod.rncan.gc.ca/apps/gpsh/help/model1_e.php?p=1 .
Fisheries and Oceans Canada(2007). "DFO WebTide Tidal Prediction Model." [On-line] February 26, 2007. http://www.mar.dfo-mpo.gc.ca/science/ocean/coastal_ hydrodynamics/WebTide/webtide.html .
Lemoine, F. G., S. C., Kenyon, J. K., Factor, R. G., Trimmer, N. K., Pavlis, D. S., Chinn, S. M., Cox, S. M., Klosko, S. B., Luthcke, M. H., Torrence, Y. M., Wang, R. G., Williamson, E. C., Pavlis, R. H., Rapp, and T. R., Olson (1998). "The development of the joint NASA GSFC and the National Imagery and Mapping Agency (NIMA) geopotential model EGM96." Rep. No. NASA/TP-1998-206861, United States (USA).
Ott, L. E. (1996). "OMNISTAR virtual base station system." Proceedings of the 1996 IEEE Position Location and Navigation Symposium, PLANS, Apr 22-26 1996. IEEE, Piscataway, NJ, USA, Atlanta, GA, USA, pp. 590-595.
Pollett,M.(2004). "CCGS Matthew." Bedford Institute of Oceanography. Dartmouth, Nova Scotia, Canada. [On-line] 02/28, 2008. http://www.bio.gc.ca/SHIPS/matthew-e.html .
Roscoe Hudson, J., and T. Sharp (2001). "Globally Corrected GPS (GcGPS): C-Nav GPS System." Proceedings of the Dynamic Positioning Conference, Houston, Texas, U.S.A., 2001.
Santos, M. C., F. Nievinski, K. Cove, R. Kingdon, and D. Wells (2005). "Range-Extended Post-Processing Kinematic (PPK) in a marine environment." Proceedings of the Institute of Navigation GNSS-2005, Long Beach, CA, USA., 2005.
Santos, M. C., D. Wells, K. Cove, and S. Bisnath (2004). "The Princess of Acadia GPS Project: Description and scientific challenges." Proceedings of the Canadian Hydrographic Conference CHC2004, Ottawa, ON, 2004.

Proceedings of the Canadian Hydrographic Conference and National Surveyors Conference 2008
Paper 4-2 Page 23 Ian Church
Wert, T., P. Dare, and J. E. Hughes Clarke (2004). "Toward Real-Time Tides from C-Nav GPS in the Canadian Arctic." Proceedings of ION GNSS, Long Beach, California, U.S.A., 2004.
Biography
Ian Church is from Fredericton, New Brunswick, Canada. He graduated from the University of New Brunswick with a Bachelors degree in Geodesy and Geomatics Engineering in 2006 and is currently pursuing his Master of Science in Engineering with the Ocean Mapping Group under the supervision of Dr. John Hughes Clarke.
John E. Hughes Clarke is the Chair in Ocean Mapping at the University of New Brunswick. With a background in marine geology and oceanography, his prime interest is in taking advantage of the limits of resolution and accuracy achievable with both the bathymetry and backscatter from swath sonar systems to examine marine sediment transport.
Sue Haigh is an Honorary Research Associate within the Ocean Mapping Group. She holds a PhD in Applied Math from UBC. She has worked with hydrodynamic models at UNB and IOS in Sydney, BC.
Marcelo Santos is an Associate Professor in the Department of Geodesy and Geomatics Engineering at UNB. He holds a M.Sc. in Geophysics from the National Observatory, in Rio de Janeiro, and a Ph.D. in Geodesy from UNB. He has been involved in research in the fields of space and physical geodesy, GNSS and navigation.
Michael Lamplugh has been a field hydrographer in CHS-Atlantic since 1977. He was H-I-C aboard the F G Creed until he moved (2002) to the CCGS Matthew. Starting in 2003 he worked hard to upgrade the sounding capability of the Matthew from an EM100 to the high-resolution EM710, this was achieved in 2006 (& both launches have EM3002 systems).
Jon Griffin is a hydrographer with the CHS-Atlantic, and is currently a Chief Hydrographer aboard the CCGS Matthew for the 2008 survey season. Jon joined the CHS in 1991, and has been primarily involved with field programs in support of science and hydrography since then. He has a Masters of Engineering from UNB.
Russell Parrott is a marine geophysicist specializing in high resolution survey techniques at the Geological Survey of Canada, Atlantic. He is the project leader for the Bay of Fundy project. He holds an M.Eng degree in Applied Geophysics from McGill University, Montreal.