t cell receptor signaling controls foxp3 expression via pi3k, akt, … · allosteric akt inhibitor...
TRANSCRIPT
T cell receptor signaling controls Foxp3 expressionvia PI3K, Akt, and mTORStephan Sauer*, Ludovica Bruno*, Arnulf Hertweck*, David Finlay†, Marion Leleu*, Mikhail Spivakov*,Zachary A. Knight‡, Bradley S. Cobb*, Doreen Cantrell†, Eric O’Connor§, Kevan M. Shokat‡, Amanda G. Fisher*,and Matthias Merkenschlager*¶
*Lymphocyte Development Group and §Flow Cytometry Facility, Medical Research Council Clinical Sciences Centre, Imperial College London, Du Cane Road,London W12 0NN, United Kingdom; †Division of Cell Biology and Immunology, College of Life Sciences, University of Dundee, Dundee DD1 5EH, UnitedKingdom; and ‡Department of Cellular and Molecular Pharmacology, Howard Hughes Medical Institute, University of California, San Francisco, CA 94143
Edited by Christophe Benoist, Joslin Diabetes Center, Boston, MA, and approved April 7, 2008 (received for review January 29, 2008)
Regulatory T (Treg) cells safeguard against autoimmunity andimmune pathology. Because determinants of the Treg cell fate arenot completely understood, we have delineated signaling eventsthat control the de novo expression of Foxp3 in naive peripheralCD4 T cells and in thymocytes. We report that premature termi-nation of TCR signaling and inibition of phosphatidyl inositol3-kinase (PI3K) p110�, p110�, protein kinase B (Akt), or mammaliantarget of rapamycin (mTOR) conferred Foxp3 expression and Treg-like gene expression profiles. Conversely, continued TCR signalingand constitutive PI3K/Akt/mTOR activity antagonised Foxp3 induc-tion. At the chromatin level, di- and trimethylation of lysine 4 ofhistone H3 (H3K4me2 and -3) near the Foxp3 transcription start site(TSS) and within the 5� untranslated region (UTR) preceded activeFoxp3 expression and, like Foxp3 inducibility, was lost uponcontinued TCR stimulation. These data demonstrate that the PI3K/Akt/mTOR signaling network regulates Foxp3 expression.
Specialized cell types in multicellular organisms are defined bydistinct patterns of gene expression (1). During their differ-
entiation from hematopoietic stem cells, developing T cellsundergo progressive restriction of their lineage potential. Afterthe CD4/CD8 lineage choice in the thymus, CD4 lineage cellsremain able to adopt a naive or regulatory cell fate, and naiveCD4 T cells can opt for a range of Th lineages or, alternatively,become regulatory T (Treg) cells after activation (2, 3). Thechoice of Th lineage is important for effective immune responsesto specific pathogens, and the balance between effector andregulatory cells is critical to ensure immune competence whileavoiding immune pathology and autoimmunity. Thymus-derivedTreg cells are generated via a TGF� independent pathway thatrequires costimulatory signals (2–4) and typically express thesignature transcription factor Foxp3, which confers regulatory Tcell function (7–10). Differences between the TCR repertoires ofconventional and regulatory CD4 T cells attest to the importanceof MHC/peptide recognition and TCR signaling in conventionalversus regulatory T cell differentiation (11, 12). Adaptive Tregcells can arise from naive peripheral CD4 T cells, for example byimmunisation with low dose antigen and limited costimulation(13). TGF� is a potent inducer of Foxp3 expression in vitro (14)and in vivo (15–17) and immunosuppressive drugs, such asrapamycin (18–20), act by as yet undefined mechanisms toinduce Foxp3 expression (18) or to expand preexisting Treg cells(19, 20). To clarify the determinants of the Treg cell fate choice,we set out to identify signaling events that control Foxp3expression. We show that activation of CD4 lineage thymocytesand peripheral T cells confers competence for the de novoexpression of Foxp3 in a pathway that is independent of TGF�and is instead controlled by phosphatidyl inositol 3 kinase(PI3K), protein kinase B (Akt), and mammalian target ofrapamycin (mTOR). The competence for Foxp3 induction islimited by TCR stimulation itself, and continued stimulationresults in the loss of permissive chromatin modifications fromthe Foxp3 TSS and 5� UTR.
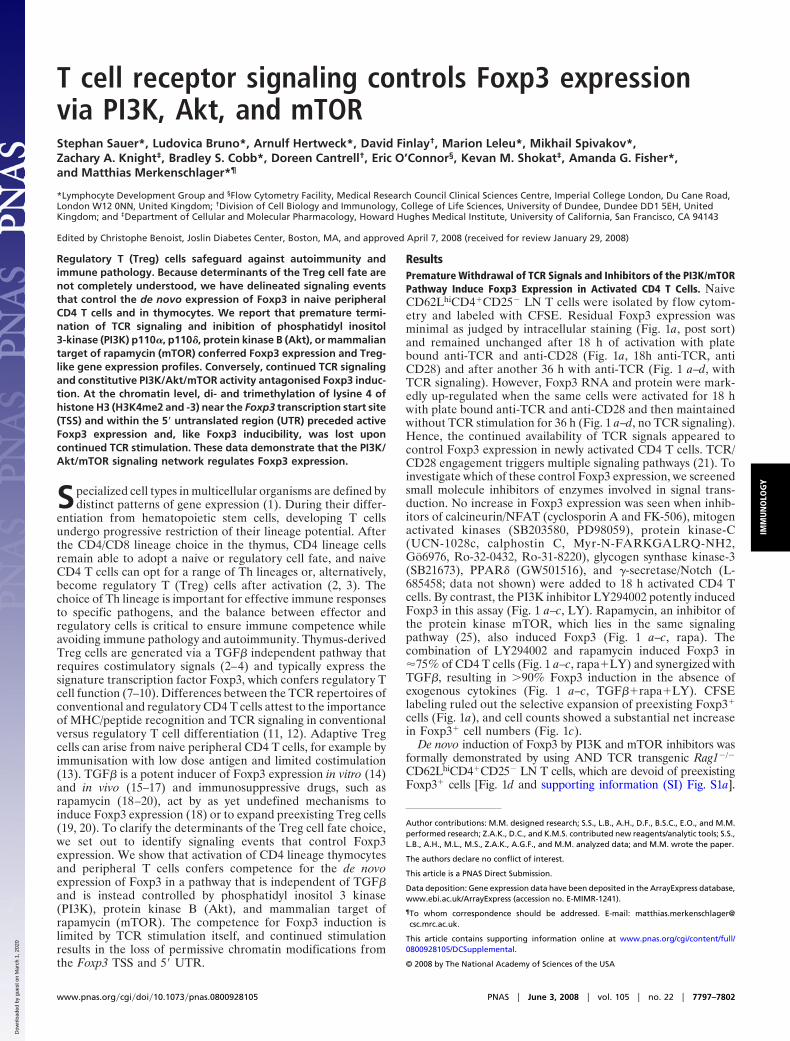
ResultsPremature Withdrawal of TCR Signals and Inhibitors of the PI3K/mTORPathway Induce Foxp3 Expression in Activated CD4 T Cells. NaiveCD62LhiCD4�CD25� LN T cells were isolated by flow cytom-etry and labeled with CFSE. Residual Foxp3 expression wasminimal as judged by intracellular staining (Fig. 1a, post sort)and remained unchanged after 18 h of activation with platebound anti-TCR and anti-CD28 (Fig. 1a, 18h anti-TCR, antiCD28) and after another 36 h with anti-TCR (Fig. 1 a–d, withTCR signaling). However, Foxp3 RNA and protein were mark-edly up-regulated when the same cells were activated for 18 hwith plate bound anti-TCR and anti-CD28 and then maintainedwithout TCR stimulation for 36 h (Fig. 1 a–d, no TCR signaling).Hence, the continued availability of TCR signals appeared tocontrol Foxp3 expression in newly activated CD4 T cells. TCR/CD28 engagement triggers multiple signaling pathways (21). Toinvestigate which of these control Foxp3 expression, we screenedsmall molecule inhibitors of enzymes involved in signal trans-duction. No increase in Foxp3 expression was seen when inhib-itors of calcineurin/NFAT (cyclosporin A and FK-506), mitogenactivated kinases (SB203580, PD98059), protein kinase-C(UCN-1028c, calphostin C, Myr-N-FARKGALRQ-NH2,Go6976, Ro-32-0432, Ro-31-8220), glycogen synthase kinase-3(SB21673), PPAR� (GW501516), and �-secretase/Notch (L-685458; data not shown) were added to 18 h activated CD4 Tcells. By contrast, the PI3K inhibitor LY294002 potently inducedFoxp3 in this assay (Fig. 1 a–c, LY). Rapamycin, an inhibitor ofthe protein kinase mTOR, which lies in the same signalingpathway (25), also induced Foxp3 (Fig. 1 a–c, rapa). Thecombination of LY294002 and rapamycin induced Foxp3 in�75% of CD4 T cells (Fig. 1 a–c, rapa�LY) and synergized withTGF�, resulting in �90% Foxp3 induction in the absence ofexogenous cytokines (Fig. 1 a–c, TGF��rapa�LY). CFSElabeling ruled out the selective expansion of preexisting Foxp3�
cells (Fig. 1a), and cell counts showed a substantial net increasein Foxp3� cell numbers (Fig. 1c).
De novo induction of Foxp3 by PI3K and mTOR inhibitors wasformally demonstrated by using AND TCR transgenic Rag1�/�
CD62LhiCD4�CD25� LN T cells, which are devoid of preexistingFoxp3� cells [Fig. 1d and supporting information (SI) Fig. S1a].
Author contributions: M.M. designed research; S.S., L.B., A.H., D.F., B.S.C., E.O., and M.M.performed research; Z.A.K., D.C., and K.M.S. contributed new reagents/analytic tools; S.S.,L.B., A.H., M.L., M.S., Z.A.K., A.G.F., and M.M. analyzed data; and M.M. wrote the paper.
The authors declare no conflict of interest.
This article is a PNAS Direct Submission.
Data deposition: Gene expression data have been deposited in the ArrayExpress database,www.ebi.ac.uk/ArrayExpress (accession no. E-MIMR-1241).
¶To whom correspondence should be addressed. E-mail: [email protected].
This article contains supporting information online at www.pnas.org/cgi/content/full/0800928105/DCSupplemental.
© 2008 by The National Academy of Sciences of the USA
www.pnas.org�cgi�doi�10.1073�pnas.0800928105 PNAS � June 3, 2008 � vol. 105 � no. 22 � 7797–7802
IMM
UN
OLO
GY
Dow
nloa
ded
by g
uest
on
Mar
ch 1
, 202
0

Activation with peptide-pulsed antigen presenting cells also con-ferred competence for Foxp3 induction by PI3K inhibitors (Fig.S1b).
TCR/CD28 activation followed by PI3K/mTOR inhibitioninduced Foxp3 not only in peripheral CD4 T cells, but also inCD4�CD8�CD25� thymocytes (Fig. 1e).
Differential Role of p110 Isoenzymes in Foxp3 Regulation. SelectivePI3K isoenzyme inhibitors have recently been characterized atthe biochemical, structural, and biological level (22–25) (TableS1). We utilized such compounds to define the role of specificPI3K catalytic subunits in Foxp3 regulation. TGX115 did notaffect Foxp3 expression at concentrations that selectively inhibitp110� (0.1 �M; 23), indicating that p110� does not controlFoxp3 in this setting. Similarly, the p110� inhibitor AS-605240induced Foxp3 expression only at concentrations far in excess ofthose required to inhibit p110� (0.008 �M; ref. 22 and Fig. 1f ).
IC-87114 is highly selective for p110� (23) and induced Foxp3 in10–15% more cells than TCR deprivation alone, demonstratinga contribution of p110� to the regulation of Foxp3. PI-103strongly induced Foxp3 at concentrations below its in vitro IC50
for mTOR (0.02 �M) and around the in vitro IC50 for p110�(0.008 �M) (23). PIK90 strongly induced Foxp3 at 0.1 �M (Fig.3a), where it inhibits p110� (and p110�, which did not induceFoxp3; see above). Higher concentrations of PI-103 and PIK90affect p110� (23), but Foxp3 induction by PI-103 and PIK90exceeded that of full p110� inhibition by IC-87114 (Fig. 1f ).These data identify p110� as a dominant isoenzyme and thehierarchy of p110� � � �/� may set Foxp3 regulation apartfrom lymphocyte activation, where p110� appears dominant(25, 26).
TCR Signaling and the PI3K/Akt/mTOR Network. Protein kinases ofthe Akt/PKB family are components of the PI3K/Akt/mTOR
Fig. 1. TCR signal deprivation and inhibitors of the PI3K/mTOR pathway induce Foxp3 expression in newly activated CD4 T cells. (a) Naive CD62LhiCD4�CD25�
LN T cells were isolated by flow cytometry, labeled with CFSE, and activated for 18 h with anti-TCR and anti-CD28. After this, the cells were cultured for 36 h undervarious conditions: with plate-bound anti-TCR (with TCR signaling); without anti-TCR (no TCR signaling); and with the PI3K inhibitor LY294002 (LY, 10 �M), themTOR inhibitor rapamycin (rapa, 25 nM), and/or TGF� (1 ng/ml). Foxp3 expression was assessed by intracellular staining. (b) Naive CD4 T cells were activated for18 h as in a and then cultured for 36 h with anti-TCR (with TCR signaling) or without anti-TCR (no TCR signaling). The expression of Foxp3 RNA was assessed byreal time RT-PCR (mean � SD, n � 3). (c) Naive CD4 T cells were activated for 18 h and aliquots of 105 cells (input) were transferred to the conditions describedin a. After 36 h, cells were counted, and Foxp3 expression assessed by intracellular staining. Bars show the percentage (red) and the number (black) of Foxp3�
cells. (d) AND TCR transgenic Rag1�/� CD62LhiCD4�CD25� LN T cells were activated for 18 h as in a and then cultured for 36 h with anti-TCR (with TCR signaling);without anti-TCR (no TCR signaling); and with LY294002 (LY, 10 �M), rapamycin (rapa, 25 nM), or TGF� (1 ng/ml). See Fig. S1 for percentages and numbers ofFoxp3� cells. (e) CD4�CD8�CD25� thymocytes were activated for 18h as in a and then cultured for 36 h with anti-TCR (control) or with LY294002 and rapamycinwithout anti-TCR (LY�rapa). ( f) Naive CD4 T cells were activated for 18 h as in a and cultured for 36 h with the indicated PI3K inhibitors without anti-TCR. Thepercentage of Foxp3� cells is shown after subtracting Foxp3� cells generated in cultures without anti-TCR (mean � SD, n � 4–12). The p110 isoform specificityof each inhibitor is summarized in Table S1. (g) Naive CD4 T cells were activated for 18 h and cultured for 36 h with plate-bound anti-TCR (control) or with theallosteric Akt inhibitor Akti1/2 (0.3 �M) without anti-TCR.
7798 � www.pnas.org�cgi�doi�10.1073�pnas.0800928105 Sauer et al.
Dow
nloa
ded
by g
uest
on
Mar
ch 1
, 202
0
network, and their activity is regulated by PI3K via PDK1 andby one of the two known mTOR-containing complexes,mTORC2 (27). We treated activated CD4 T cells with theallosteric Akt inhibitor Akti-1/2 (28) and found Foxp3 inductionat concentrations around its IC50 for Akt1 and Akt2 (58 nM and210 nM, respectively). This shows that inhibition of Akt and PI3Kand mTOR can drive Foxp3 induction (Fig. 1g).
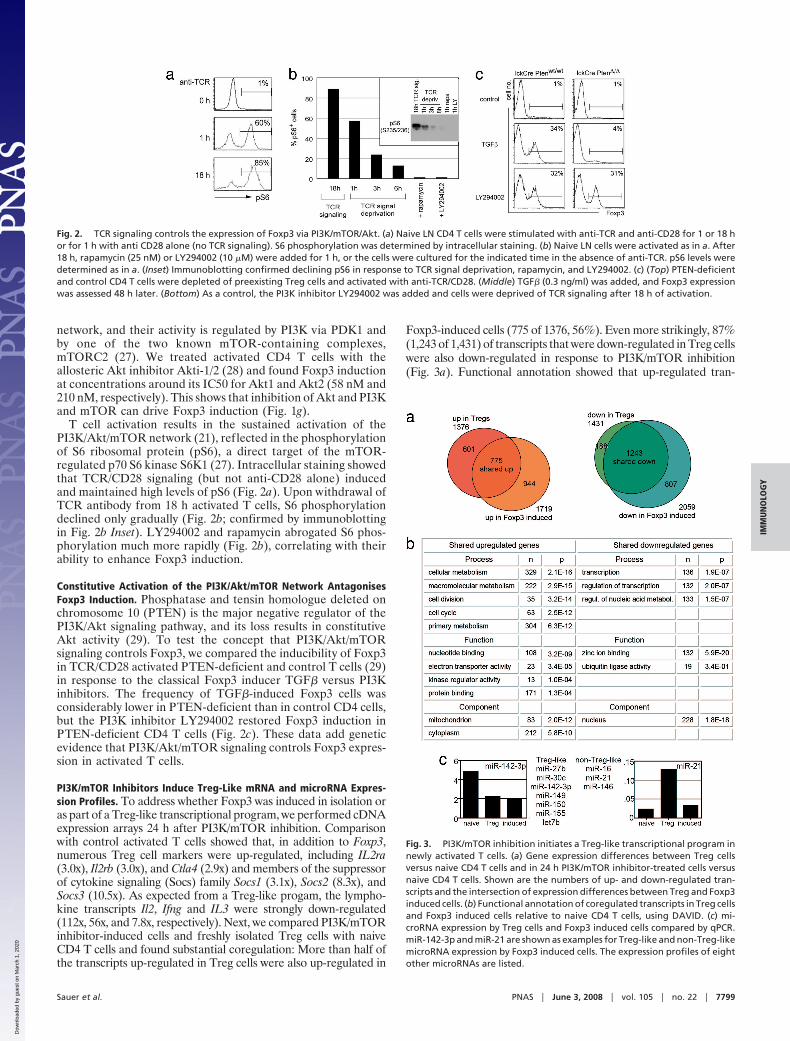
T cell activation results in the sustained activation of thePI3K/Akt/mTOR network (21), reflected in the phosphorylationof S6 ribosomal protein (pS6), a direct target of the mTOR-regulated p70 S6 kinase S6K1 (27). Intracellular staining showedthat TCR/CD28 signaling (but not anti-CD28 alone) inducedand maintained high levels of pS6 (Fig. 2a). Upon withdrawal ofTCR antibody from 18 h activated T cells, S6 phosphorylationdeclined only gradually (Fig. 2b; confirmed by immunoblottingin Fig. 2b Inset). LY294002 and rapamycin abrogated S6 phos-phorylation much more rapidly (Fig. 2b), correlating with theirability to enhance Foxp3 induction.
Constitutive Activation of the PI3K/Akt/mTOR Network AntagonisesFoxp3 Induction. Phosphatase and tensin homologue deleted onchromosome 10 (PTEN) is the major negative regulator of thePI3K/Akt signaling pathway, and its loss results in constitutiveAkt activity (29). To test the concept that PI3K/Akt/mTORsignaling controls Foxp3, we compared the inducibility of Foxp3in TCR/CD28 activated PTEN-deficient and control T cells (29)in response to the classical Foxp3 inducer TGF� versus PI3Kinhibitors. The frequency of TGF�-induced Foxp3 cells wasconsiderably lower in PTEN-deficient than in control CD4 cells,but the PI3K inhibitor LY294002 restored Foxp3 induction inPTEN-deficient CD4 T cells (Fig. 2c). These data add geneticevidence that PI3K/Akt/mTOR signaling controls Foxp3 expres-sion in activated T cells.
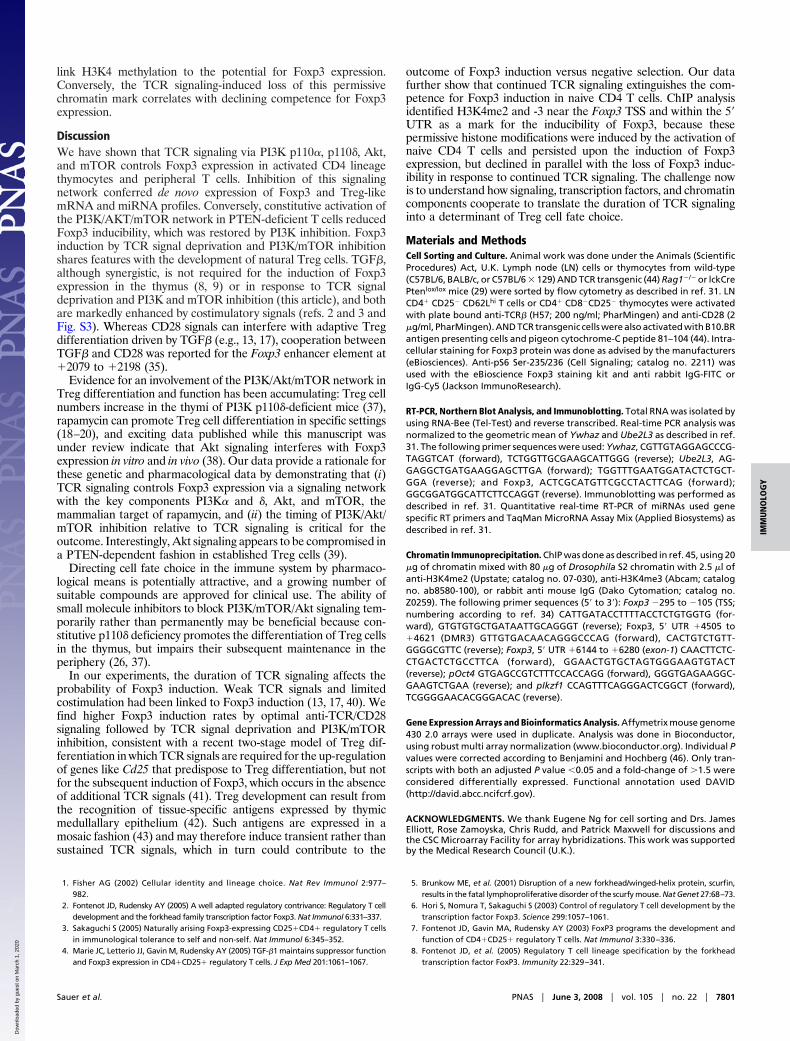
PI3K/mTOR Inhibitors Induce Treg-Like mRNA and microRNA Expres-sion Profiles. To address whether Foxp3 was induced in isolation oras part of a Treg-like transcriptional program, we performed cDNAexpression arrays 24 h after PI3K/mTOR inhibition. Comparisonwith control activated T cells showed that, in addition to Foxp3,numerous Treg cell markers were up-regulated, including IL2ra(3.0x), Il2rb (3.0x), and Ctla4 (2.9x) and members of the suppressorof cytokine signaling (Socs) family Socs1 (3.1x), Socs2 (8.3x), andSocs3 (10.5x). As expected from a Treg-like progam, the lympho-kine transcripts Il2, Ifng and IL3 were strongly down-regulated(112x, 56x, and 7.8x, respectively). Next, we compared PI3K/mTORinhibitor-induced cells and freshly isolated Treg cells with naiveCD4 T cells and found substantial coregulation: More than half ofthe transcripts up-regulated in Treg cells were also up-regulated in
Foxp3-induced cells (775 of 1376, 56%). Even more strikingly, 87%(1,243 of 1,431) of transcripts that were down-regulated in Treg cellswere also down-regulated in response to PI3K/mTOR inhibition(Fig. 3a). Functional annotation showed that up-regulated tran-
Fig. 2. TCR signaling controls the expression of Foxp3 via PI3K/mTOR/Akt. (a) Naive LN CD4 T cells were stimulated with anti-TCR and anti-CD28 for 1 or 18 hor for 1 h with anti CD28 alone (no TCR signaling). S6 phosphorylation was determined by intracellular staining. (b) Naive LN cells were activated as in a. After18 h, rapamycin (25 nM) or LY294002 (10 �M) were added for 1 h, or the cells were cultured for the indicated time in the absence of anti-TCR. pS6 levels weredetermined as in a. (Inset) Immunoblotting confirmed declining pS6 in response to TCR signal deprivation, rapamycin, and LY294002. (c) (Top) PTEN-deficientand control CD4 T cells were depleted of preexisting Treg cells and activated with anti-TCR/CD28. (Middle) TGF� (0.3 ng/ml) was added, and Foxp3 expressionwas assessed 48 h later. (Bottom) As a control, the PI3K inhibitor LY294002 was added and cells were deprived of TCR signaling after 18 h of activation.
Fig. 3. PI3K/mTOR inhibition initiates a Treg-like transcriptional program innewly activated T cells. (a) Gene expression differences between Treg cellsversus naive CD4 T cells and in 24 h PI3K/mTOR inhibitor-treated cells versusnaive CD4 T cells. Shown are the numbers of up- and down-regulated tran-scripts and the intersection of expression differences between Treg and Foxp3induced cells. (b) Functional annotation of coregulated transcripts in Treg cellsand Foxp3 induced cells relative to naive CD4 T cells, using DAVID. (c) mi-croRNA expression by Treg cells and Foxp3 induced cells compared by qPCR.miR-142-3p and miR-21 are shown as examples for Treg-like and non-Treg-likemicroRNA expression by Foxp3 induced cells. The expression profiles of eightother microRNAs are listed.
Sauer et al. PNAS � June 3, 2008 � vol. 105 � no. 22 � 7799
IMM
UN
OLO
GY
Dow
nloa
ded
by g
uest
on
Mar
ch 1
, 202
0

scripts were enriched for processes of cellular, macromolecular andprimary metabolism, cell division, and cell cycle and for thefunctional terms nucleotide binding, electron transporter, andkinase regulatory activity. Down-regulated transcripts representeddistinct processes, in particular transcriptional regulation. Only aminority of genes that were coregulated in ex vivo Treg cells andFoxp3 induced cells were known genomic targets of Foxp3 (Fig.S2). MicroRNAs are important mediators of posttranscriptionalgene regulation and naive CD4 T cells and Treg cells expressdistinct microRNAs (31). Of the 10 microRNAs we profiled, 7showed Treg-like expression in Foxp3-induced cells (Fig. 3c).Taken together, our analysis suggests that PI3K/mTOR signalingcontrols not only Foxp3 and its direct targets, but a wider Treg-liketranscriptional progam (30).
No Detectable Involvement of TGF� in Foxp3 Induction by PI3K andmTOR Inhibitors. Because TGF� is a powerful inducer of Foxp3expression (14–17) and synergizes with PI3K/mTOR inhibitors(Fig. 1), we addressed its requirement in this system. TGF� bindinginduces phosphorylation of receptor-associated Smad2 and Smad3,providing a sensitive indicator of TGF� signaling. pSmad2 (S465/467) was readily detectable in cells exposed to TGF� (Fig. 4a lane1) but not in cells subjected to TCR signal deprivation (Fig. 4a, lane2) or PI3K and mTOR inhibition (Fig. 4a, lanes 3 and 4). Neutral-izing TGF� antibodies and the Smad kinase inhibitor SB 431542(32) blocked Foxp3 induction by TGF�, but did not affect Foxp3induction by PI3K/mTOR inhibitors (Fig. 4b). Hence, TGF� ap-pears dispensable for Foxp3 induction by TCR signal deprivationand PI3K/mTOR inhibition.
Histone Modifications Mark a Window of Opportunity for Foxp3Induction by PI3K and mTOR Inhibition. T cell activation was re-quired for Foxp3 induction, and Foxp3 inducibility was maximalin T cells activated for 18 h before PI3K/mTor inhibition. Earlieraddition of inhibitors blocked activation (ref. 19 and data notshown), and Foxp3 induction was inefficient at later time points(Fig. 5 Top Left). Hence, the competence for Foxp3 expressioninduced by activation of CD4 T cells is transient and continuedTCR signaling antagonises Foxp3 inducibility.
The expression of the Foxp3 locus is intimately linked to itschromatin structure (33, 34). Permissive posttranslational histonemodifications are found in Treg cells at the Foxp3 promoter, theintronic differentially metylated region 3 (DMR3), and the recentlydescribed �2079 to �2198 enhancer (33–35). To explore howcontinued TCR signaling reduces the competence of CD4 T cellsto express Foxp3, we considered that chromatin marks can provideimportant information not only about the actual expression, butalso the potential for the expression of developmentally regulatedloci (36). We used ChIP (chromatin immunoprecipitation) toanalyze histone modifications at the Foxp3 locus in male (XY) cells
(Foxp3 is X-linked). We compared CD4 cells activated for 18 h(high potential for Foxp3 induction, no Foxp3 expression) to thesame cells after 72 h of TCR stimulation (reduced potential forFoxp3 induction, no Foxp3 expression) and CD4 cells activated for18 h and then exposed to PI3K/mTOR inhibitors (high Foxp3expression). Oct4, which is silent in T cells, and the activelytranscribed Ikzf1 (Ikaros) locus served as controls (Fig. 5). Inter-estingly, H3K4 di- and trimethylation was found near the Foxp3 TSS(34) and the 5� UTR not only in Foxp3� cells but also in 18-hactivated CD4 T cells, which had the potential for Foxp3 inductionbut did not actually express Foxp3. In contrast, H3K4me2 and -3were lost after 72 h of continuous TCR signaling (Fig. 5). These data
Fig. 4. No apparent TGF� involvement in Foxp3 induction by PI3K and mTOR inhibitors. (a) Naive LN CD4 T cells were activated for 18 h in serum-free AIM-Vmedium and then exposed to TGF� (1 ng/ml, 90 min, lane 1); TCR signal deprivation (90 min, lane 2); or TCR signal deprivation, rapamycin, and LY294002 (90min for lane 3, 8 h for lane 4). Blots were sequentially probed with anti-pSmad2 (S465/467) and anti-Smad2/3. (b) Naive LN CD4 T cells activated as in a weredeprived of TCR signals and TGF�, and PI3K/mTOR inhibitors were added as indicated. Cultures were supplemented with neutralizing anti TGF� (3 �g/ml) or theSmad kinase inhibitor SB431542. Foxp3 expression in the presence of anti TGF� (dark gray bars) or SB431542 (light gray bars) was determined 2 days later andnormalized to control cultures (black).
Fig. 5. Inducibility of Foxp3 by PI3K and mTOR inhibition is transient, and H3K4methylation at the Foxp3 TSS and 5� UTR marks the inducible state. Naive CD4 Tcells were activated for the indicated time with anti-TCR and anti-CD28 and thencultured for 36 h with LY294002 and rapamycin (Upper Left). Naive CD4 T cells(black), Treg cells (white), naive CD4 T cells activated for 18 h (orange) or 72 h(green)or inducedtoexpressFoxp3byPI3K/mTORinhibitors (red)wereexaminedfor H3K4me2 and H3K4me3 by ChIP and qPCR near the Foxp3 TSS (�295 to �105)and within the 5� UTR (�4505 to �4621 and �6144 to �6280). Primer positionsare indicated (34). pOct4 and pIkzf1 are shown as controls.
7800 � www.pnas.org�cgi�doi�10.1073�pnas.0800928105 Sauer et al.
Dow
nloa
ded
by g
uest
on
Mar
ch 1
, 202
0
link H3K4 methylation to the potential for Foxp3 expression.Conversely, the TCR signaling-induced loss of this permissivechromatin mark correlates with declining competence for Foxp3expression.
DiscussionWe have shown that TCR signaling via PI3K p110�, p110�, Akt,and mTOR controls Foxp3 expression in activated CD4 lineagethymocytes and peripheral T cells. Inhibition of this signalingnetwork conferred de novo expression of Foxp3 and Treg-likemRNA and miRNA profiles. Conversely, constitutive activation ofthe PI3K/AKT/mTOR network in PTEN-deficient T cells reducedFoxp3 inducibility, which was restored by PI3K inhibition. Foxp3induction by TCR signal deprivation and PI3K/mTOR inhibitionshares features with the development of natural Treg cells. TGF�,although synergistic, is not required for the induction of Foxp3expression in the thymus (8, 9) or in response to TCR signaldeprivation and PI3K and mTOR inhibition (this article), and bothare markedly enhanced by costimulatory signals (refs. 2 and 3 andFig. S3). Whereas CD28 signals can interfere with adaptive Tregdifferentiation driven by TGF� (e.g., 13, 17), cooperation betweenTGF� and CD28 was reported for the Foxp3 enhancer element at�2079 to �2198 (35).
Evidence for an involvement of the PI3K/Akt/mTOR network inTreg differentiation and function has been accumulating: Treg cellnumbers increase in the thymi of PI3K p110�-deficient mice (37),rapamycin can promote Treg cell differentiation in specific settings(18–20), and exciting data published while this manuscript wasunder review indicate that Akt signaling interferes with Foxp3expression in vitro and in vivo (38). Our data provide a rationale forthese genetic and pharmacological data by demonstrating that (i)TCR signaling controls Foxp3 expression via a signaling networkwith the key components PI3K� and �, Akt, and mTOR, themammalian target of rapamycin, and (ii) the timing of PI3K/Akt/mTOR inhibition relative to TCR signaling is critical for theoutcome. Interestingly, Akt signaling appears to be compromised ina PTEN-dependent fashion in established Treg cells (39).
Directing cell fate choice in the immune system by pharmaco-logical means is potentially attractive, and a growing number ofsuitable compounds are approved for clinical use. The ability ofsmall molecule inhibitors to block PI3K/mTOR/Akt signaling tem-porarily rather than permanently may be beneficial because con-stitutive p110� deficiency promotes the differentiation of Treg cellsin the thymus, but impairs their subsequent maintenance in theperiphery (26, 37).
In our experiments, the duration of TCR signaling affects theprobability of Foxp3 induction. Weak TCR signals and limitedcostimulation had been linked to Foxp3 induction (13, 17, 40). Wefind higher Foxp3 induction rates by optimal anti-TCR/CD28signaling followed by TCR signal deprivation and PI3K/mTORinhibition, consistent with a recent two-stage model of Treg dif-ferentiation in which TCR signals are required for the up-regulationof genes like Cd25 that predispose to Treg differentiation, but notfor the subsequent induction of Foxp3, which occurs in the absenceof additional TCR signals (41). Treg development can result fromthe recognition of tissue-specific antigens expressed by thymicmedullallary epithelium (42). Such antigens are expressed in amosaic fashion (43) and may therefore induce transient rather thansustained TCR signals, which in turn could contribute to the
outcome of Foxp3 induction versus negative selection. Our datafurther show that continued TCR signaling extinguishes the com-petence for Foxp3 induction in naive CD4 T cells. ChIP analysisidentified H3K4me2 and -3 near the Foxp3 TSS and within the 5�UTR as a mark for the inducibility of Foxp3, because thesepermissive histone modifications were induced by the activation ofnaive CD4 T cells and persisted upon the induction of Foxp3expression, but declined in parallel with the loss of Foxp3 induc-ibility in response to continued TCR signaling. The challenge nowis to understand how signaling, transcription factors, and chromatincomponents cooperate to translate the duration of TCR signalinginto a determinant of Treg cell fate choice.
Materials and MethodsCell Sorting and Culture. Animal work was done under the Animals (ScientificProcedures) Act, U.K. Lymph node (LN) cells or thymocytes from wild-type(C57BL/6, BALB/c, or C57BL/6 � 129) AND TCR transgenic (44) Rag1�/� or lckCrePtenlox/lox mice (29) were sorted by flow cytometry as described in ref. 31. LNCD4� CD25� CD62Lhi T cells or CD4� CD8�CD25� thymocytes were activatedwith plate bound anti-TCR� (H57; 200 ng/ml; PharMingen) and anti-CD28 (2�g/ml, PharMingen). AND TCR transgenic cells were also activated with B10.BRantigen presenting cells and pigeon cytochrome-C peptide 81–104 (44). Intra-cellular staining for Foxp3 protein was done as advised by the manufacturers(eBiosciences). Anti-pS6 Ser-235/236 (Cell Signaling; catalog no. 2211) wasused with the eBioscience Foxp3 staining kit and anti rabbit IgG-FITC orIgG-Cy5 (Jackson ImmunoResearch).
RT-PCR, Northern Blot Analysis, and Immunoblotting. Total RNA was isolated byusing RNA-Bee (Tel-Test) and reverse transcribed. Real-time PCR analysis wasnormalized to the geometric mean of Ywhaz and Ube2L3 as described in ref.31. The following primer sequences were used: Ywhaz, CGTTGTAGGAGCCCG-TAGGTCAT (forward), TCTGGTTGCGAAGCATTGGG (reverse); Ube2L3, AG-GAGGCTGATGAAGGAGCTTGA (forward); TGGTTTGAATGGATACTCTGCT-GGA (reverse); and Foxp3, ACTCGCATGTTCGCCTACTTCAG (forward);GGCGGATGGCATTCTTCCAGGT (reverse). Immunoblotting was performed asdescribed in ref. 31. Quantitative real-time RT-PCR of miRNAs used genespecific RT primers and TaqMan MicroRNA Assay Mix (Applied Biosystems) asdescribed in ref. 31.
Chromatin Immunoprecipitation. ChIP was done as described in ref. 45, using 20�g of chromatin mixed with 80 �g of Drosophila S2 chromatin with 2.5 �l ofanti-H3K4me2 (Upstate; catalog no. 07-030), anti-H3K4me3 (Abcam; catalogno. ab8580-100), or rabbit anti mouse IgG (Dako Cytomation; catalog no.Z0259). The following primer sequences (5� to 3�): Foxp3 �295 to �105 (TSS;numbering according to ref. 34) CATTGATACCTTTTACCTCTGTGGTG (for-ward), GTGTGTGCTGATAATTGCAGGGT (reverse); Foxp3, 5� UTR �4505 to�4621 (DMR3) GTTGTGACAACAGGGCCCAG (forward), CACTGTCTGTT-GGGGCGTTC (reverse); Foxp3, 5� UTR �6144 to �6280 (exon-1) CAACTTCTC-CTGACTCTGCCTTCA (forward), GGAACTGTGCTAGTGGGAAGTGTACT(reverse); pOct4 GTGAGCCGTCTTTCCACCAGG (forward), GGGTGAGAAGGC-GAAGTCTGAA (reverse); and pIkzf1 CCAGTTTCAGGGACTCGGCT (forward),TCGGGGAACACGGGACAC (reverse).
Gene Expression Arrays and Bioinformatics Analysis. Affymetrix mouse genome430 2.0 arrays were used in duplicate. Analysis was done in Bioconductor,using robust multi array normalization (www.bioconductor.org). Individual Pvalues were corrected according to Benjamini and Hochberg (46). Only tran-scripts with both an adjusted P value 0.05 and a fold-change of �1.5 wereconsidered differentially expressed. Functional annotation used DAVID(http://david.abcc.ncifcrf.gov).
ACKNOWLEDGMENTS. We thank Eugene Ng for cell sorting and Drs. JamesElliott, Rose Zamoyska, Chris Rudd, and Patrick Maxwell for discussions andthe CSC Microarray Facility for array hybridizations. This work was supportedby the Medical Research Council (U.K.).
1. Fisher AG (2002) Cellular identity and lineage choice. Nat Rev Immunol 2:977–982.
2. Fontenot JD, Rudensky AY (2005) A well adapted regulatory contrivance: Regulatory T celldevelopment and the forkhead family transcription factor Foxp3. Nat Immunol 6:331–337.
3. Sakaguchi S (2005) Naturally arising Foxp3-expressing CD25�CD4� regulatory T cellsin immunological tolerance to self and non-self. Nat Immunol 6:345–352.
4. Marie JC, Letterio JJ, Gavin M, Rudensky AY (2005) TGF-�1 maintains suppressor functionand Foxp3 expression in CD4�CD25� regulatory T cells. J Exp Med 201:1061–1067.
5. Brunkow ME, et al. (2001) Disruption of a new forkhead/winged-helix protein, scurfin,results in the fatal lymphoproliferative disorder of the scurfy mouse. Nat Genet 27:68–73.
6. Hori S, Nomura T, Sakaguchi S (2003) Control of regulatory T cell development by thetranscription factor Foxp3. Science 299:1057–1061.
7. Fontenot JD, Gavin MA, Rudensky AY (2003) FoxP3 programs the development andfunction of CD4�CD25� regulatory T cells. Nat Immunol 3:330–336.
8. Fontenot JD, et al. (2005) Regulatory T cell lineage specification by the forkheadtranscription factor FoxP3. Immunity 22:329–341.
Sauer et al. PNAS � June 3, 2008 � vol. 105 � no. 22 � 7801
IMM
UN
OLO
GY
Dow
nloa
ded
by g
uest
on
Mar
ch 1
, 202
0

9. Khattri R, Cox T, Yasayko SA, Ramsdell F (2003) An essential role for scurfin inCD4�CD25� T regulatory cells. Nat Immunol 3:337–342.
10. Tran DQ, Ramsey H, Shevach EM (2007) Induction of FOXP3 expression in naive humanCD4�FOXP3 T cells by T-cell receptor stimulation is TGF� dependent but does notconfer a regulatory phenotype. Blood 110:2983–2990.
11. Hsieh CS, Zheng Y, Liang Y, Fontenot JD, Rudensky AY (2006) An intersection betweenthe self-reactive regulatory and nonregulatory T cell receptor repertoires. Nat Immu-nol 7:401–410.
12. Pacholczyk R, et al. (2007) Nonself-antigens are the cognate specificities of Foxp3�
regulatory T cells. Immunity 27:493–504.13. Kretschmer K, et al. (2005) Inducing and expanding regulatory T cell populations by
foreign antigen. Nat Immunol 6:1219–1227.14. Chen W, et al. (2003) Conversion of peripheral CD4�CD25- naive T cells to CD4�CD25�
regulatory T cells by TGF-� induction of transcription factor Foxp3. J Exp Med198:1875–1886.
15. Coombes JL, et al. (2007) A functionally specialized population of mucosal CD103� DCsinduces Foxp3� regulatory T cells via a TGF� and retinoic acid dependent mechanism.J Exp Med 204:1757–1764.
16. Sun CM, et al. (2007) Small intestine lamina propria dendritic cells promote de novogeneration of Foxp3 T reg cells via retinoic acid. J Exp Med 204:1775–1785.
17. Benson MJ, Pino-Lagos K, Rosemblatt M, Noelle RJ (2007) All-trans retinoic acidmediates enhanced T reg cell growth, differentiation, and gut homing in the face ofhigh levels of co-stimulation. J Exp Med 204:1765–1774.
18. Gao W, et al. (2007) Contrasting effects of cyclosporine and rapamycin in de novogeneration of alloantigen-specific regulatory T cells. Am J Transplant 7:1722–1732.
19. Battaglia M, Stabilini A, Roncarolo MG (2005) Rapamycin selectively expandsCD4�CD25�FoxP3� regulatory T cells. Blood 105:4743–4748.
20. Mantel PY, et al. (2006) Molecular mechanisms underlying FOXP3 induction in humanT cells. J Immunol 176:3593–3602.
21. Kane LP, Weiss A (2003) The PI-3 kinase/Akt pathway and T cell activation: Pleiotropicpathways downstream of PIP3. Immunol Rev 192:7–20.
22. Camps M, et al. (2005) Blockade of PI3Kgamma suppresses joint inflammation anddamage in mouse models of rheumatoid arthritis. Nat Med 11:936–943.
23. Knight ZA, et al. (2006) A pharmacological map of the PI3K family defines a role forp110alpha in insulin signaling. Cell 125:733–747.
24. Foukas LC, et al. (2006) Critical role for the p110alpha phosphoinositide-3-OH kinasein growth and metabolic regulation. Nature 441:366–370.
25. Bilancio A, et al. (2006) Key role of the p110delta isoform of PI3K in B-cell antigen andIL-4 receptor signaling: Comparative analysis of genetic and pharmacologic interfer-ence with p110delta function in B cells. Blood 107:642–650.
26. Okkenhaug K, et al. (2002) Impaired B and T cell antigen receptor signaling inp110delta PI 3-kinase mutant mice. Science 297:1031–1034.
27. Sabatini DM (2006) mTOR and cancer: Insights into a complex relationship. Nat RevCancer 6:729–734.
28. Barnett SF, et al. (2005) Identification and characterization of pleckstrin-homology-domain-dependent and isoenzyme-specific Akt inhibitors. Biochem J 385:399–408.
29. Hagenbeek TJ, et al. (2004) The loss of PTEN allows TCR alphabeta lineage thymocytesto bypass IL-7 and Pre-TCR-mediated signaling. J Exp Med 200:883–894.
30. Hill JA, et al. (2007) Foxp3 transcription-factor-dependent and -independent regula-tion of the regulatory T cell transcriptional signature. Immunity 27:786–800.
31. Cobb BS, et al. (2006) A role for Dicer in immune regulation. J Exp Med 203:2519–2527.32. Inman GJ, et al. (2002) SB-431542 is a potent and specific inhibitor of TGF-� superfamily
type I activin receptor-like kinase (ALK) receptors ALK4, ALK5, and ALK7. Mol Phar-macol 62:65–74.
33. Floess S, et al. (2007). Epigenetic control of the Foxp3 locus in regulatory T cells. PLoSBiol. e38.
34. Kim HP, Leonard WJ (2007) CREB/ATF-dependent T cell receptor-induced FoxP3 geneexpression: A role for DNA methylation. J Exp Med 204:1543–1551.
35. Tone Y, et al. (2008) Smad3 and NFAT cooperate to induce Foxp3 expression throughits enhancer. Nat Immunol 9:194–202.
36. Spivakov M, Fisher AG (2007) Epigenetic signatures of stem-cell identity. Nat Rev Genet8:263–271.
37. Patton DT, et al. (2006) The phosphoinositide 3-kinase p110delta is critical for thefunction of CD4�CD25�Foxp3� regulatory T cells. J Immunol 177:6598–6602.
38. Haxhinasto S, Mathis D, Benoist C (2008). The AKT-mTOR axis regulates de novodifferentiation of CD4�Foxp3� cells. J Exp Med 205:565–574.
39. Walsh PT, et al. (2006) PTEN inhibits IL-2 receptor-mediated expansion of CD4� CD25�
Tregs. J Clin Invest 116:2521–2531.40. So T, Croft M (2007) Cutting edge: OX40 inhibits TGF-�- and antigen-driven conversion
of naive CD4 T cells into CD25�Foxp3� T cells. J Immunol 179:1427–1430.41. Lio CW, Hsieh CS (2008) A two-step process for thymic regulatory T cell development.
Immunity 28:100–111.42. Aschenbrenner K, et al. (2007). Selection of Foxp3� regulatory T cells specific for self
antigen expressed and presented by Aire� medullary thymic epithelial cells. NatImmunol 8:351 358.
43. Anderson MS, et al. (2005) The cellular mechanism of Aire control of T cell tolerance.Immunity 23:227–239.
44. Kaye J, et al. (1989) Selective development of CD4� T cells in transgenic mice expressinga class II MHC-restricted antigen receptor. Nature 341:746–749.
45. Baxter J, et al. (2004) Histone hypomethylation is an indicator of epigenetic plasticityin quiescent lymphocytes. EMBO J 23:4462–4472.
46. Benjamini Y, Hochberg Y (1995) Controlling the false discovery rate: A practical andpowerful approach to multiple testing. J Roy Stat Soc B 57:289–300.
7802 � www.pnas.org�cgi�doi�10.1073�pnas.0800928105 Sauer et al.
Dow
nloa
ded
by g
uest
on
Mar
ch 1
, 202
0