table of contentsas per the requirement of the ghana electricity grid code, we submit the...
TRANSCRIPT

1.1
2018 Electricity Supply Plan for the Ghana Power System
A 2018 Power Supply Outlook with Medium Term projections
REPUBLIC OF GHANA

i 2018 Electricity Supply Plan
2018 ELECTRICITY SUPPLY PLAN FOR
GHANA
An Outlook of the Power Supply Situation for 2018 and Highlights of Medium Term Power Requirements

ii 2018 Electricity Supply Plan
ACKNOWLEDGEMENT
We hereby wish to express our deepest appreciation to the Supply Plan Committee which is
made up of experts from Energy Commission, GRIDCo, VRA, BPA, ECG and NEDCo as
follows:
Benjamin Ntsin – Ghana Grid Company Limited (Chairman)
Frank Otchere – Ghana Grid Company Limited
Kassim Abubakar – Ghana Grid Company Limited
Monica Debrah (Mrs.) – Ghana Grid Company Limited
Abdul N. Wahab – Volta River Authority
Afua A. Thompson (Mrs.) –Volta River Authority
Dr. Joseph Essandoh-Yeddu – Energy Commission
Godfred Mensah – Electricity Company of Ghana
Ebenezer Baiden – Electricity Company of Ghana
Mohammed Aminu - Electricity Company of Ghana
Eugene Addo – Northern Electricity Company Limited
Mohammed T. Tampuri – Northern Electricity Company Limited
Anthony Osafo - Kissi – Bui Power Authority
Justice Okyere - Bui Power Authority
Acknowledgements also go to all Wholesale Suppliers, Power Distribution Companies, Bulk
Customers and other Key Stakeholders who provided relevant information to firm up
maintenance programmes, potential new projects and other information required for developing
the Supply Plan.

iii 2018 Electricity Supply Plan
EXECUTIVE SUMMARY
As per the requirement of the Ghana Electricity Grid Code, we submit the Electricity Supply
Plan (ESP) for the year 2018 as prepared by the Supply Plan Committee.
The ESP presents an outlook of power demand and supply for 2018 taking into consideration
all the committed projects and existing generation sources. It assesses the available hydro
generation taking into consideration low reservoir elevations at Akosombo and Bui. The Report
thus, presents the possible power supply situation in 2018. Additionally, it presents fuel
requirements and associated cost to meet electricity demand in 2018 and evaluates the
associated power evacuation requirements to ensure reliable power supply. The Report further
highlights the anticipated challenges in meeting the 2018 demand and makes
recommendations on the best course of action to be taken to ensure reliable power supply in
2018. Finally, the report provides an outlook of electricity demand and supply for the next five
years.
Review of 2017 Performance
Peak Demand
In 2017, the power system recorded a coincident system peak demand of 2,192.15 MW on
November 13, 2017. This figure represents an increase of 105.15 MW (5%) over the 2016
coincident system peak demand of 2,087 MW.
Energy Consumption
The total energy consumed (including losses) for the period was 14,177.33 GWh. Compared to
the 2016 figure of 13,699.89 GWh, this represents an annual growth in energy consumption of
3.48%.
Energy Supply
The total energy supplied (including imports from Cote d’Ivoire) over the period was 14,178.53
GWh. This comprises 5,615.51 GWh from hydro, 8,242.21 GWh from thermal and 320.81 GWh
from Imports. The 1.2 GWh difference between the supply and the consumption was
consumed at the various generating plants.
Transmission Losses
In 2017, the transmission network recorded total losses of 587.11 GWh which represents 4.1%
of total energy consumed. Compared to the 2016 figure of 607.38 GWh, there was a reduction
of 20.27 GWh or 0.33%.

iv 2018 Electricity Supply Plan
Transmission Lines and Feeder Availability
The Average Feeder Availability (AFA) in 2017 was 99.84 % and the System Average
Availability (SAA) for the transmission grid was 99.58%.
2018 Demand Outlook
The projected system peak demand for 2018 is 2,523.49 MW and this represents a 15.11 %
(or in absolute terms, an increase of 331.34 MW) growth over the 2017 system peak of
2,192.15 MW. The annual consumption for 2018 is projected at 16,304.79 GWh and this
represents a 15.01% (or in absolute terms, an increase of 2,127.46 GWh) growth over the
2017 actual annual consumption of 14,177.33 GWh.
2018 Supply Outlook
Hydro Power Generation for 2018
The total hydro generation for 2018 projected is 4,956.32 GWh. This is made up of 3,599.99
GWh, 600.12 GWh and 756.21 GWh from Akosombo, Kpong and Bui Generating Stations
respectively.
Akosombo Hydro Elevation
The Akosombo Lake Elevation on January 1, 2018 was 251.31 feet and this is projected to
bottom up at 243.60 feet at the end of the dry season in 2018.
Bui Hydro Elevation
The Bui Lake Elevation at the beginning of 2018 was 175.01 m and this is projected to bottom
up at 170.52 m at the end of the dry season in 2018.
Thermal Power Generation for 2018
The projected total thermal generation for 2018 is 11,301.65 GWh. This is made up of
generation from VRA and the IPPs as shown in the Table below.
Renewable Energy (RE) Generation for 2018
The total RE (currently only Solar PV) generation for 2018 is projected at 42.64GWh. This is
made up of VRA (Navrongo), BXC (Winneba) and Meinergy (Saltpond) as shown in the Table
below.
All of these utility-scale Solar PV Plants are connected on the Medium Voltage Distribution
System.

v 2018 Electricity Supply Plan
Imports
In 2018, no programmed import is expected apart from the usual inadvertent exchanges
between the two utilities, CIE and GRIDCo.
Projected Thermal Supply Energy (GWh)
VRA Existing Thermal & Solar Generation
T1 1,457.06
T2 2,155.05
TT1PP 352.98
TT2PP + TT2PP-X 0
KTPP 369.24
RE Generation (Solar PV) 4.20
Total VRA Thermal Generation 4,338.53
Existing IPP Thermal Generation
SAPP (Phase I and II) 1,466.11
CENIT 380.93
AMERI 796.53
Karpower Barge 2,708.25
AKSA 558.49
CENPOWER 1,061.21
BXC Solar PV 25.54
MEINERGY Solar PV 12.90
Total IPP Thermal Generation 7,009.96
Total VRA Supply 8,538.64
Total Non-VRA Supply 7,766.17
Import 0
Total Supply 16,304.79

vi 2018 Electricity Supply Plan
Fuel Cost
Based on the projected thermal generation of 11,301.65 GWh, an estimated US$1.0 Billion will
be required to purchase the various fuel types, namely; LCO, Natural Gas, HFO and diesel to
run the thermal plants. Of this amount, about US$ 336 million representing 33.57% will be
required by VRA and the remaining US$ 665 million or 66.43% will be required by the IPPs.
Type of Fuel Cost (Million USD)
VRA - LCO 42
VRA - GAS 263
VRA - DFO 32
TOTAL VRA FUEL COST 336
IPP - LCO 168
IPP - GAS 260
IPP - HFO 184
IPP - DFO 52
TOTAL IPP FUEL COST 665
TOTAL VRA & IPP COST 1,001
Distribution Outlook in 2018
ECG Network
In the ECG network, a key project expected to come on line is the Accra Central BSP. The
completion and commissioning of this Project will significantly improve system reliability,
resolve loading constraints on the interconnected 33 kV feeders and reduce overall technical
losses within the Accra metropolis. The Project is expected to be completed by the second
quarter of 2018. Other similar projects, are currently ongoing within the ECG network and are
expected to be completed by the end of the year. The completion of these additional Projects is
expected to improve supply reliability to the various ECG customers.
NEDCo Network
NEDCo is faced with capacity and voltage constraints within some sections of its distribution
network, thereby limiting its ability to deliver quality of supply to its customers during peak
hours.

vii 2018 Electricity Supply Plan
The Company has therefore outlined a number of interventions to mitigate the effect of these
network constraints in 2018.
Medium-Term (2019 – 2023) Demand and Supply Outlook
The Medium-Term (2019-2023) Demand and Supply Outlook as shown in the Table below
suggests that there will be adequate generation for the medium term.
Year 2019 2020 2021 2022 2023
Projected System Demand (MW) 2,980 3,245 3,576 3,745 3,919
Total Supply Required (Demand +Reserve (25%))
3,725 4,056 4,470 4,681 4,899
Total Existing Hydro Capacity (MW) 935 935 1,120 1,270 1,270
Total Existing Thermal Capacity (MW) 2,853 2,993 2,823 2,823 2,993
Total Existing Renewables (MW) 42.5 42.5 42.5 42.5 42.5
Committed Generation Projects
AKSA (PHASE II) 120 120 120 120 120
Early Power 142 300 400 400 400
Amandi 190 190 190 190 190
Jecobson Jelco 360 360 360
VRA T3 120 120 120 120 120
Rotan 300
Marinus Energy 26.5 26.5 26.5 26.5 26.5
VRA Solar 12 12 12 12 12
Total Committed Generation (MW) 610.5 768.5 1228.5 1228.5 1528.5
Expected Total Generation (MW) 4,398.50 4,696.50 5,171.50 5,321.50 5,791.50
Surplus (MW) 673.50 640.50 701.50 640.50 892.50
Strategic Medium Term Transmission Infrastructure Requirements
System network analyses carried out on the medium-term system conditions indicated that
there could be congestion, especially in the southern parts of the NITS. The analyses further
identified that in the medium-term, the addition of the following transmission infrastructure
would improve overall reliability of the transmission network:
Construction of a double circuit 330 kV transmission line from A4BSP to Kumasi.
Eastern Transmission Corridor Projects:
Construction of a 161kV Line between Kadjebi and Juale
Construction of a 161kV Line between Juale and Yendi
Construction of a 330 kV Substation at Dunkwa with a link to the existing 161 kV
Dunkwa Substation;

viii 2018 Electricity Supply Plan
Construction of a Third Bulk Supply Point in Kumasi at 330kV level.
Impact of Siting Generation in Kumasi
The medium-term network analyses also revealed that siting up to 200 MW generation
capacity in Kumasi addresses the general low voltage conditions in Kumasi and its environs
and improves overall network stability and reliability. It also results in marked reduction in
overall transmission losses.
This result confirms the recommendation in the 2011 Generation and Transmission Master
Plan to site at least 300 MW Combined-Cycle Thermal Power Plant in the central part of the
Transmission Network (around Kumasi or Dunkwa) to improve the overall network
performance.
Conclusion
The general conclusions of the 2018 Demand and Supply plan are as follows;
1. The system peak demand for 2018 is projected at 2,523.49 MW, representing a 15.1 %
growth over the 2017 peak demand of 2,192.15 MW.
2. In terms of energy, the projected consumption for 2018 is 16,304.79 GWh representing
a 15.01% growth over the 2017 actual annual consumption of 14,177.33 GWh.
3. The total energy exports for 2018 are projected at 671.97GWh.
4. In 2018, there will be adequate generation capacity to meet projected demand with as
high reserve margin as 47% during the period (the required reserve margin is 25%).
5. VALCO is expected to operate two Potlines with projected total energy consumption of
1,154.19 GWh.
6. Akosombo and Bui Reservoirs performed poorly in terms of inflows into the two Lakes,
during the last inflow season.
7. In terms of supply, the following generation mix is expected:
Hydro - 4,956.32 GWh representing 30.4% of total energy supply;
Thermal - 11,305.85 GWh representing 69.34% of total energy supply;
Renewables - 42.64 GWh representing 0.26% of total energy supply.
8. In terms of fuel, the following quantities of the various fuel types are required:
LCO - 3,000,000 barrels
Natural Gas - 67,000,000 MMBtu.
HFO - 455,000 MT

ix 2018 Electricity Supply Plan
Diesel - 100,000 barrels
9. In terms of fuel cost, an annual total of approximately 1.0 billion USD is required,
averaging a monthly total of some US$ 83.40 Million.
10. To ensure the stability of the grid in normal operating conditions, the following minimum
generating limits are required to be kept particularly at Peak:
300 MW generation at Aboadze and
Three (3) Units at Akosombo.
11. The transmission system has inadequate available transfer capacity to meet the
requirements of the major load centres (of Accra, Kumasi, Tarkwa, etc.) particularly at
peak. This situation results in low voltages, overloading of lines and increased overall
transmission system losses. The low voltages at Kumasi, Accra and surrounding areas
are due to poor customer end power factors.
12. For radial lines and single transformer stations, significant percentage of network loads
could be islanded in the event of outage of such lines and transformers.
13. The analysis shows that in normal operation, there is congestion on the Volta –Accra
East – Achimota - Mallam transmission corridor especially when there is high generation
in the East.
14. Analysis shows that a fair East - West balance in generation is required for system
stability and minimal overall transmission system losses.
15. A number of substations and interconnected circuits currently under construction are
expected to be completed within the first quarter of 2018. These include the Ogbojo 33
kV / 11 kV substation and associated 33 kV lines from GIMPA to Kwabenya 33 kV / 11
kV substations and from Dodowa switching station to Mobole 33 kV substation.
16. The following operational challenges would be experienced in the NEDCo operational
areas due to inadequate network capacities and long radial distribution lines;
a. Capacity constraints on the Shield-Wire transformer at Techiman which serves
Abofour and Nkenkansu in the Ashanti Region.
b. Transformer overloads at Wa Township and its environs.
c. Possible switchgear failures at Bawku and Navrongo Distribution Stations due to
Obsolescence.
d. Low voltages at Ejura, Atebubu, Dalung, Bimbilla, Kete-Krachi.
x 2018 Electricity Supply Plan
17. In the medium-term, constructing up to 200 MW in Kumasi improves overall system
performance.
Recommendation
The report makes the following recommendations;
1. The Akosombo and Bui Reservoirs should be prudently managed in 2018 by:
a. Operating three Units at Akosombo during off-peak and four units at Peak
b. Operating on the average, two units at Bui
This would ensure the recovery of the two lakes over the medium-term to ensure their
operational sustainability.
2. In view of the low overall hydro generation, measures should be put in place to ensure
security of fuel for the thermal plants to forestall possible supply disruptions to
consumers.
3. The players in the gas supply chain, namely; Ghana Gas Company Limited, Tullow, ENI
and GNPC should strongly collaborate with the power utilities to ensure effective
planning and coordination to avert any possible gas supply curtailments which could
have dire consequences for power supply.
4. In view of the huge investments in fuel supply, the Government of Ghana (GoG) should
assist the Utilities to raise the necessary financing to procure the required quantities of
fuel and on time to avert any possible power supply crisis.
5. The following on-going grid expansion programmes especially those connected with
transmission upgrades should be expedited and completed on schedule:
Prestea-Kumasi 330 kV line,
Aboadze – Prestea double circuit 330kV line,
Volta - A3BSP – Achimota - Mallam line upgrade,
The construction of A4BSP,
Construction of 3x125 MVA GIS station at Accra Central.
Construction of 2x66 MVA Bulk Supply Point at Afienya.
6. All load entities should invest in reactive power compensation facilities to ensure that
their customer-end power factors comply with the Grid Code (Article 9.33) requirement
of 0.9 pu lagging.

xi 2018 Electricity Supply Plan
7. A well-coordinated maintenance programme should be pursued by both GRIDCo and
the Generating Companies (GENCOs) to assure higher operational reliability of both the
generating plants and the transmission grid.
8. Initiate steps to install non-intermittent generation facilities (such as waste-to-energy,
etc.) totalling up to 200 MW in Kumasi in the medium term. This would help to improve
voltages in Kumasi and its surroundings. This is in accordance with the Transmission
Master Plan proposal to site a 300 MW combine cycle plant either in Kumasi or Dunkwa
to address the reactive power challenges.
9. The interventions detailed above to address constraints on the ECG network in Accra,
Kumasi, Tema and Takoradi should be expeditiously implemented to improve the
reliability and the overall performance of the ECG distribution network.
10. NEDCo should be assisted with the necessary financing to enable the Company
undertake all the identified critical projects to improve its overall operational
performance.

1 2018 Electricity Supply Plan
TABLE OF CONTENTS
1.1 ............................................................................................................................ I
1 INTRODUCTION ................................................................................... 7
1.1 ORGANISATION OF THE REPORT ................................................................. 7
2 SYSTEM PERFORMANCE REVIEW FOR 2017............................................... 9
2.1 PEAK DEMAND AND ENERGY CONSUMPTION............................................ 9
2.2 ENERGY GENERATION ................................................................................. 11
2.3 ENERGY CONSUMPTION .............................................................................. 12
2.4 ENERGY EXCHANGES (EXPORT AND IMPORT) ........................................ 12
2.5 HYDRO RESERVOIR OPERATION................................................................ 13
2.5.1 Akosombo Reservoir ....................................................................................................... 13
2.5.2 Bui Reservoir ................................................................................................................... 13
2.6 GENERATING PLANT AVAILABILITIES FOR 2017 ...................................... 15
2.7 FUEL SUPPLY ISSUES .................................................................................. 16
2.8 GENERATION DEFICIENCY AND LOAD SHEDDING ................................... 16
2.8.1 Load management program ............................................................................................ 16
2.8.2 Automatic Frequency Load shedding (AFLS) .................................................................. 16
2.9 QUALITY OF SUPPLY .................................................................................... 17
2.9.1 System Frequency .......................................................................................................... 17
2.9.2 System Voltages ............................................................................................................. 18
2.10 TRANSMISSION NETWORK PERFORMANCE ............................................. 18
2.10.1 Feeder Availability ........................................................................................................... 18
2.10.2 Transmission Lines ......................................................................................................... 18
2.11 TRANSFORMER CAPACITY .......................................................................... 18
2.12 NEW INSTALLATIONS IN 2017 ..................................................................... 20
3 DEMAND OUTLOOK FOR 2018 ..................................................................... 21
2 2018 Electricity Supply Plan
3.1 PEAK DEMAND .............................................................................................. 21
3.2 ECG ENERGY AND DEMAND FORECAST METHODOLOGY AND ASSUMPTIONS
21
3.3 NORTHERN ELECTRICITY COMPANY OF GHANA (NEDCO) FORECAST
METHODOLOGY AND ASSUMPTIONS...................................................................... 23
3.3.1 GDP Per Capita ............................................................................................................... 24
3.3.2 Tariff ................................................................................................................................ 24
3.3.3 Customer Population ....................................................................................................... 24
3.3.4 System Losses ................................................................................................................ 24
3.4 SUMMARY OF 2018 PEAK AND ENERGY DEMAND FORECAST .............. 24
3.5 OUTLOOK OF ENERGY CONSUMPTION ..................................................... 26
3.6 PROJECTED MONTHLY PEAK AND ENERGY DEMAND ............................ 28
4 SUPPLY OUTLOOK ........................................................................................ 29
4.1 SOURCES OF GENERATION ........................................................................ 29
4.2 EXISTING GENERATION SOURCES ............................................................. 29
4.2.1 Akosombo & Kpong Hydro .............................................................................................. 29
4.2.2 Bui Hydro ........................................................................................................................ 30
4.3 THERMAL GENERATION .............................................................................. 31
4.4 NEW GENERATION SOURCES ..................................................................... 32
4.5 KEY ASSUMPTIONS UNDERPINNING THE SUPPLY PLAN ....................... 32
4.5.1 Planned Maintenance ...................................................................................................... 32
4.5.2 Natural Gas Quantities and Availabilities ......................................................................... 33
4.5.3 Gas Supply Disruptions ................................................................................................... 33
4.5.4 West to East Reverse Flow ............................................................................................. 34
4.5.5 Fuel Allocation ................................................................................................................. 34
4.5.6 Fuel Price ........................................................................................................................ 34
4.6 DEMAND - SUPPLY ANALYSIS .................................................................... 34
4.7 PROJECTED CAPACITY SITUATION ........................................................... 38

3 2018 Electricity Supply Plan
4.8 FUEL REQUIREMENT .................................................................................... 40
4.9 ESTIMATES OF FUEL COST ......................................................................... 42
5 TRANSMISSION SYSTEM PERFORMANCE ................................................. 43
5.1 STATUS OF GHANA TRANSMISSION GRID ................................................ 43
5.2 TRANSMISSION LINE, FEEDER AND SUBSTATION AVAILABILITY ......... 43
5.3 STEADY STATE NETWORK ANALYSIS ....................................................... 44
5.3.1 Technical Adequacy Criteria ............................................................................................ 44
5.3.2 Summary of Results for the Steady State Network Analysis ............................................ 45
5.4 IMPACT OF TRANSMISSION NETWORK EXPANSION PROJECTS – SECOND
HALF OF 2018 ............................................................................................................. 47
5.5 LOAD FLOW ANALYSES FOR SECOND HALF 2018 .................................. 48
5.6 DYNAMIC SIMULATIONS .............................................................................. 50
6 POTENTIAL SUPPLY CHALLENGES IN 2017 .............................................. 59
6.1 MANAGING THE HYDRO RISK ..................................................................... 59
6.2 THERMAL FUEL SUPPLY RISK .................................................................... 59
6.3 SUPPLY RELIABILITY ................................................................................... 60
6.3.1 Radial lines ...................................................................................................................... 60
6.3.2 Single Transformer Stations ............................................................................................ 60
6.4 POWER EVACUATION ................................................................................... 61
7 DISTRIBUTION OUTLOOK ............................................................................ 62
7.1 ECG NETWORK RELIABILITY ASSESSMENT ............................................. 62
7.1.1 Constraints Identified in the 2018 ECG Reliability Study for Selected Areas .................... 62
7.1.2 Sub-Transmission and Distribution Constraints ............................................................... 63
7.2 NEDCO DISTRIBUTION NETWORK .............................................................. 63
7.2.1 NEDCo Distribution Constraints ...................................................................................... 64
7.2.2 Sub-Transmission and Distribution Lines: ........................................................................ 64

4 2018 Electricity Supply Plan
7.2.3 Primary Substations Constraints ..................................................................................... 65
8 OVERVIEW OF MEDIUM-TERM SUPPLY: 2018 - 2022 ................................ 66
8.1 DEMAND OUTLOOK ...................................................................................... 66
8.2 PROJECTED SUPPLY OUTLOOK ................................................................. 67
8.3 EXISTING GENERATION ............................................................................... 67
8.4 COMMITTED GENERATION PROJECTS ...................................................... 69
8.5 OTHER POTENTIAL GENERATION PROJECTS .......................................... 70
8.5.1 Additional Generation Requirement ................................................................................. 72
8.6 MEDIUM TERM TRANSMISSION NETWORK EXPANSION/UPGRADE
REQUIREMENTS ......................................................................................................... 72
8.6.1 Impact of Siting Generation at Western Part of Accra. ..................................................... 73
9 CONCLUSIONS .............................................................................................. 74
9.1 DEMAND AND SUPPLY OUTLOOK .............................................................. 74
9.2 REQUIREMENTS FOR GRID REINFORCEMENT ......................................... 75
9.3 DISTRIBUTION SYSTEMS ............................................................................. 75
9.4 MEDIUM TERM SUPPLY ................................................................................ 76
10 RECOMMENDATIONS ................................................................................... 77
11 APPENDICES ................................................................................................. 79

5 2018 Electricity Supply Plan
TABLE OF FIGURES
Figure 1: Projected versus Actual Energy Generation in 2017 ................................................................................................... 11
Figure 2: 2017 Akosombo Reservoir Trajectory ......................................................................................................................... 13
Figure 3: Bui Reservoir Trajectory (Actual) ................................................................................................................................. 14
Figure 4: Generating Plant projected & actual energy production for the year 2017 ................................................................................................................................................................................... 16
Figure 5: System Frequency for year 2017 ................................................................................................................................ 17
Figure 6: 2018 projected peak demand ...................................................................................................................................... 26
Figure 7: 2018 projected Energy consumption by customer....................................................................................................... 27
Figure 8: 2018 Projected Akosombo Trajectory ......................................................................................................................... 30
Figure 9: 2018 Projected Bui Reservoir Trajectory ..................................................................................................................... 31
Figure 10: Contribution of Supply by Generation Types ............................................................................................................. 37
Figure 11: Monthly fuel requirements and associated costs ....................................................................................................... 41
Figure 12: Case 1 – Frequency plot for loss of an Akosombo unit ............................................................................................. 51
Figure 13: Case 1 – Speed deviation of machines on the grid for 161kV three phase fault ......................................................................................................................................................................... 52
Figure 14: Case 1 – Relative rotor angles of machines on the grid for 161kV three phase fault.............................................................................................................................................................. 52
Figure 15: Case 1 – Relative rotor angles of machines on the grid for 330kV three phase fault.............................................................................................................................................................. 53
Figure 16: Case 1 – Speed of machines on the grid for 330kV three phase fault .................................................................................................................................................................................. 53
Figure 17: Case 2 – Frequency plot for loss of an Akosombo unit ............................................................................................. 54
Figure 18: Case 2 – Relative rotor angle plots for loss of an Akosombo unit ............................................................................................................................................................................................. 55
Figure 19: Case 2 – Speed deviation of machines on the grid for 161kV three phase fault ......................................................................................................................................................................... 55
Figure 20: Case 2 – Relative rotor angles of machines on the grid for 161kV three phase fault.............................................................................................................................................................. 56
Figure 21: Case 2 – Relative rotor angles of machines on the grid for 330kV three phase fault.............................................................................................................................................................. 56
Figure 22: Case 2 – Speed deviation of machines for a 330kV three phase fault .................................................................................................................................................................................. 57
Figure 23: Case 2 – Relative rotor angles for a 330kV three phase fault in the north ................................................................................................................................................................................. 57
Figure 24: Case 2 – Speed deviation of machines for a 330kV three phase fault in the north ............................................................................................................................................................... 58
Figure 25: Aspects of Sub-Transmission System Reliability Analysis ........................................................................................ 62
Figure 26: Projected Demand Versus Supply balance (2018 - 2023) ......................................................................................... 72

6 2018 Electricity Supply Plan
LIST OF TABLES
Table 1: System Projected and Actual Peak Demand for 2017 .................................................................................................... 9
Table 2: Projected versus Actual Energy Generation in 2017 .................................................................................................... 11
Table 3: Summary of Energy Consumption for 2017, actual vs. projected ................................................................................. 12
Table 4: Generating Plants’ actual and estimated availability for the year 2017 ........................................................................................................................................................................................... 15
Table 5: System Voltages........................................................................................................................................................... 18
Table 6: The percentage transmission line availability for the year 2017 ................................................................................... 18
Table 7: Transformer additions for year 2017 ............................................................................................................................. 19
Table 8: Transformer peak loadings for year 2017 ..................................................................................................................... 19
Table 9: Commissioned Projects in 2017 ................................................................................................................................... 20
Table 10: Coefficients for Natural Log of Non SLT model .......................................................................................................... 22
Table 11: Coefficients for SLT model ......................................................................................................................................... 22
Table 12: Coefficients determined from the analysis .................................................................................................................. 24
Table 13: Summary of 2018 Peak Demand forecast .................................................................................................................. 24
Table 14: Summary of 2018 Energy Consumption by Customer Class ...................................................................................... 26
Table 15: Summary of 2018 Monthly peak (MW) and Energy (GWh) demand forecast ......................................................................................................................................................................... 28
Table 16: Existing Generation Sources ...................................................................................................................................... 31
Table 17: 2018 Planned Maintenance ........................................................................................................................................ 32
Table 18: Projected Monthly Generation in GWh ....................................................................................................................... 35
Table 19: 2018 Projected energy and Supply Balance in GWh .................................................................................................. 36
Table 20: Projected Monthly Capacity Situation for 2018 ........................................................................................................... 38
Table 21: Summary of Annual Fuel Requirements ..................................................................................................................... 40
Table 22: Breakdown of Estimated Fuel Cost for 2018 .............................................................................................................. 42
Table 23: Criteria, normal condition ............................................................................................................................................ 44
Table 24: Criteria, contingency condition.................................................................................................................................... 44
Table 25: Bus Voltage showing voltages for first and second half of 2018 ................................................................................. 48
Table 26: Bus Voltage showing voltages for first and second half of 2018 ................................................................................. 60
Table 27: Projected Energy Demand (GWh) (2019- 2023)......................................................................................................... 67
Table 28: Projected Peak Demand (MW) (2019- 2023) ............................................................................................................. 67
Table 29: Projected Demand Versus Supply (existing) balance (2019- 2023) .......................................................................................................................................................................................... 69
Table 30: Projected Demand Versus Supply (+committed generation) Balance (2019- 2023) ................................................................................................................................................................. 71
Table 31: Comparison of system losses- Generation at Winneba and No Generation .................................................................................................................................................................................. 73
Table 32: Comparison of Line Loadings- Generation at Winneba and No Generation .................................................................................................................................................................................. 73
Table 33: Comparison of bus Voltages- Generation at Winneba and No Generation .................................................................................................................................................................................. 73

7 2018 Electricity Supply Plan
1 INTRODUCTION
This Electricity Supply Plan (ESP) details out projections for electricity demand and supply in
2018, based on available information and assumptions for load forecasting as well as the
expected generation for the year. It presents the strategy for delivering electricity generation,
transmission and distribution services on the Ghana power system in 2018 for the information
of stakeholders and the general public.
The Plan assesses the capacity of the National Interconnected Power System (NIPS) for
power generation and consumption as well as exports. The Plan also evaluates the
performance of the Akosombo and Bui Reservoirs over the last in-flow cycle and projects their
total contribution to total generation in the next planning period.
The Plan further estimates the amount of thermal generation required, together with the
corresponding fuel requirements and associated costs. It further evaluates the grid
requirements for meeting the demand for the year, highlighting the anticipated challenges and
consequently making recommendations on interventions necessary to ensure reliable and
sustainable power supply for Ghana in 2018.
The report was prepared by a team of experts from the Energy Commission (EC), Ghana Grid
Company Limited (GRIDCo), Electricity Company of Ghana Limited (ECG), Northern Electricity
Distribution Company (NEDCo), Bui Power Authority (BPA) and Volta River Authority (VRA).
The Team consulted with all the Power Producers in the Sector and other Key Stakeholders to
firm up maintenance programmes, potential new projects and other vital information required to
develop the Supply Plan.
The report further makes projections for the Medium-Term (2019-2023) Electricity Demand and
Supply outlook.
The Team first conducted a comprehensive review of the power system performance in 2017
based on which demand and supply projections were made for 2018.
1.1 Organisation of the Report
Chapter 1 is the captures the Introduction, whiles Chapter 2 presents a review of the power
system performance in 2017. Chapter 3 presents the electricity demand outlook for 2018,
whilst Chapter 4 focuses on the 2018 Generation Outlook together with the associated fuel
requirements and costs. Chapter 5 takes a look at evacuation issues on the Transmission
System whiles Chapter 6 highlights the anticipated challenges of the entire power system.
Chapter 7 presents an outlook of the ECG, NEDCo and Enclave Power Distribution Systems.
Chapter 8 provides a Medium-Term outlook for 2019 - 2023. The conclusion of the report is

8 2018 Electricity Supply Plan
presented in Chapter 9 ending with the recommendations of the analysis which are presented
in Chapter 10.

9 2018 Electricity Supply Plan
2 SYSTEM PERFORMANCE REVIEW FOR 2017
The review of the 2017 Ghana Power System performance includes among others
comparisons of the actual peak demand, energy generation and consumption against the
projections for the period. It also assesses the performance of the power system with respect
to voltages, system frequency and transmission system losses.
2.1 Peak Demand and Energy Consumption
The power system recorded a coincident peak demand of 2,192.15 MW on November 13,
2017. This figure represents an increase of 105.15 MW (5.0%) over the 2016 coincident peak
demand of 2,087 MW. The 2017 peak demand was however, 193.85 MW or 8.1 % lower than
the projected peak demand of 2,386 MW for 2017.
A summary of the actual monthly peak demands against the projected over the period is shown
in Table 1 below:
Table 1: System Projected and Actual Peak Demand for 2017
Month Projected Demand (MW)
Actual Demand (MW)
Deviation: Projected – Actual
(MW)
January 2106 2100.00 6
February 2134 2084.00 50
March 2151 2153.00 -2
April 2235 2161.00 88
May 2238 2158.00 80
June 2183 2077.00 106
July 2200 2042.00 158
August 2195 1930.00 265
September 2271 2021.00 250
October 2250 2131.00 119
November 2313 2192.15 120.85
December 2386 2135.00 251
Table 1 shows that actual monthly system peak demand was lower than the projected
throughout the year except for March. Some of the factors that could have contributed to the
low demand realised are as follows:

10 2018 Electricity Supply Plan
o Export: Export to CEB during the period reduced from a maximum of 120 MW to an
average of 20 MW. CEB imported much of its generation needs from Nigeria due to their
relatively lower tariffs.
o Tariff: The high electricity tariffs across all customer classes after the last increment in
December 2015.
o Discontinued/Suspended Customer Operations – Some Bulk Customers
discontinued or suspended all or part of their operations within the year 2017 due to a
number of challenges, which led to a reduction in their average demand. For example;
Owere and Sankofa Mines disconnected their operations from July and August
2017 respectively due to their inability to pay their electricity bills.
o Embedded/Distributed Generation – The high rate of embedded and distributed
generation following the past energy crisis. The following are some of the embedded
generation currently installed:
Renewable Energy Installations by licensed installers monitored by the Energy
Commission has seen an increase in installed units in grid connected areas by
about 4,266 KWp bringing the total to about 37,130 KWp in 2017. In addition to
this, there could be other individual installations that are not captured by the
Commission. This however does not include those installed in off-grid areas
where renewable energy installed capacity is estimated at 8 MWp.
Private generating sets - Some residential, commercial and industrial consumers
continue to strategically run their generating sets as substitute for grid supply in
order to minimize the cost of electricity for their operations.

11 2018 Electricity Supply Plan
2.2 Energy Generation
Summary of actual monthly energy generation against the projected is shown in Table 2 below.
Table 2: Projected versus Actual Energy Generation in 2017
Month
Hydro (GWh) Thermal (GWh) Import (GWh) System Total
(GWh)
Actual Projected Actual Projected Actual Projected Actual Projected
Jan 593 532 577 605 81 147 1250 1284
Feb 684 505 373 511 66 133 1123 1149
Mar 668 489 595 710 26 95 1290 1294
Apr 568 427 622 820 32 91 1222 1338
May 504 413 689 888 32 45 1226 1346
Jun 370 403 765 838 18 20 1153 1261
Jul 376 416 735 813 20 33 1130 1262
Aug 337 416 770 830 10 10 1116 1256
Sep 365 403 743 842 8 10 1116 1255
Oct 390 416 821 937 11 10 1222 1363
Nov 379 403 829 931 8 10 1216 1344
Dec 381 416 854 981 8 10 1244 1407
Total 5616 5239 8373 9706 320 614 14309 15559
Table 2 is presented graphically in figure 1 below.
Figure 1: Projected versus Actual Energy Generation in 2017
The total energy generated including imports from Cote d’Ivoire over the period was 14,178.53
GWh. This comprises 5,615.51 GWh hydro generation, 8,242.21 GWh thermal generation and
320.81 GWh Imports. The generation mix at the end of the period was therefore 39.60% hydro,
58.14% thermal and 2.26% import.

12 2018 Electricity Supply Plan
2.3 Energy Consumption
The total energy consumption (including losses) for 2017 was 14, 308.08 GWh in comparison
to the projected value of 15,615 GWh. This figure represents an increase of 608.08 GWh
(4.43%) over the 2016 value of 13,700 GWh. A summary of actual and projected energy
consumption for 2017 is as presented in Table 3 below.
Table 3: Summary of Energy Consumption for 2017, actual vs. projected
Customer Projection (GWh)
2017 Actual
(GWh) 2017 Actual (GWh)
2016 % Growth
ECG 10,326 9,923 9,267 7.07%
NED 1,213 1,236 1,139 8.51%
Mines 1,498 1,151 1,250 -7.97%
VALCO 620 631 617 2.34%
Export 940 377 466 -19.10%
Direct Customers
425 395 345 14.38%
Losses and Network Usage
593 595 615 -3.31%
Total Energy 15,615 14,308 13,700 4.44%
The details of the peak demand and energy consumption per Bulk Supply Points are included
in Appendix A.
2.4 Energy Exchanges (Export and Import)
A total energy of 354.94 GWh was transmitted to CEB, comprising 284.23 GWh from VRA and
70.71 GWh wheeled from CIE.
The total interchange flows between Ghana and Cote d’Ivoire on the tie line was 355.41 GWh.
This was made up of 320.43 GWh of import and 34.98 GWh of exports to CIE.

13 2018 Electricity Supply Plan
2.5 Hydro Reservoir Operation
2.5.1 Akosombo Reservoir
The year start elevation for the Volta Lake for 2017 was 76.34 m (250.47 feet). Based on this
unimpressive reservoir elevation, it was recommended to operate three (3) and five (5) units at
off-peak and peak respectively. It is to be noted however that, due to anticipated gas supply
challenges and a longer duration units’ maintenance at Aboadze in the first quarter of 2017, the
above recommendation included a specific requirement to run six (6) units at peak in
Akosombo in the first quarter.
Following the implementation of the above recommendation in 2017, the reservoir elevation
dropped to a minimum of 73.18 m (240.09 feet) during the dry season in 2017. This actual
lowest elevation in 2017 of 73.18 m (240.09 feet) was 0.03 m (0.09 feet) higher than the
projected.
Inflows in 2017
The recorded Lake elevation at the end of the inflow season was 77.24 m (253.40 feet), a rise
of 4.06 m (13.31 feet) above the recorded minimum. This rise in 2017 was lower than the 2016
rise of 5.50 m (18.04 feet). The corresponding total net inflow in 2017 was 25.14 MAF which
was 0.14 MAF higher than the long-term average of 25 MAF. Figure 2 shows the Akosombo
reservoir trajectory for 2017.
Figure 2: 2017 Akosombo Reservoir Trajectory
2.5.2 Bui Reservoir
The Bui Reservoir level at the beginning of 2017 was 175.87 masl, dropping to a minimum
level of 169.61 masl at the end of the dry season. The minimum level attained was 0.99 masl

14 2018 Electricity Supply Plan
lower than the projected minimum of 170.60 masl for the year. This drop in elevation below the
projected was due to over-drafting of the Lake to make up for the power deficit arising from the
shortfall in gas supply from Ghana Gas in the first quarter of 2017.
The total energy generated in 2017 was 581.79 GWh compared to the projected of 841 GWh.
The lower than projected generation was due to over-drafting of the reservoir in the first quarter
of 2017 as alluded to above, forcing a revised strategy to control the drafting of the dam
leading to a lower than anticipated generation.
At the end of the inflow season the reservoir level rose to a maximum level of 176.71 masl on
October 22, 2017. The year-end elevation on December 31, 2017 was 175.92 masl.
The reservoir trajectory in 2017 is as shown in Figure 3.
Figure 3: Bui Reservoir Trajectory (Actual)
15 2018 Electricity Supply Plan
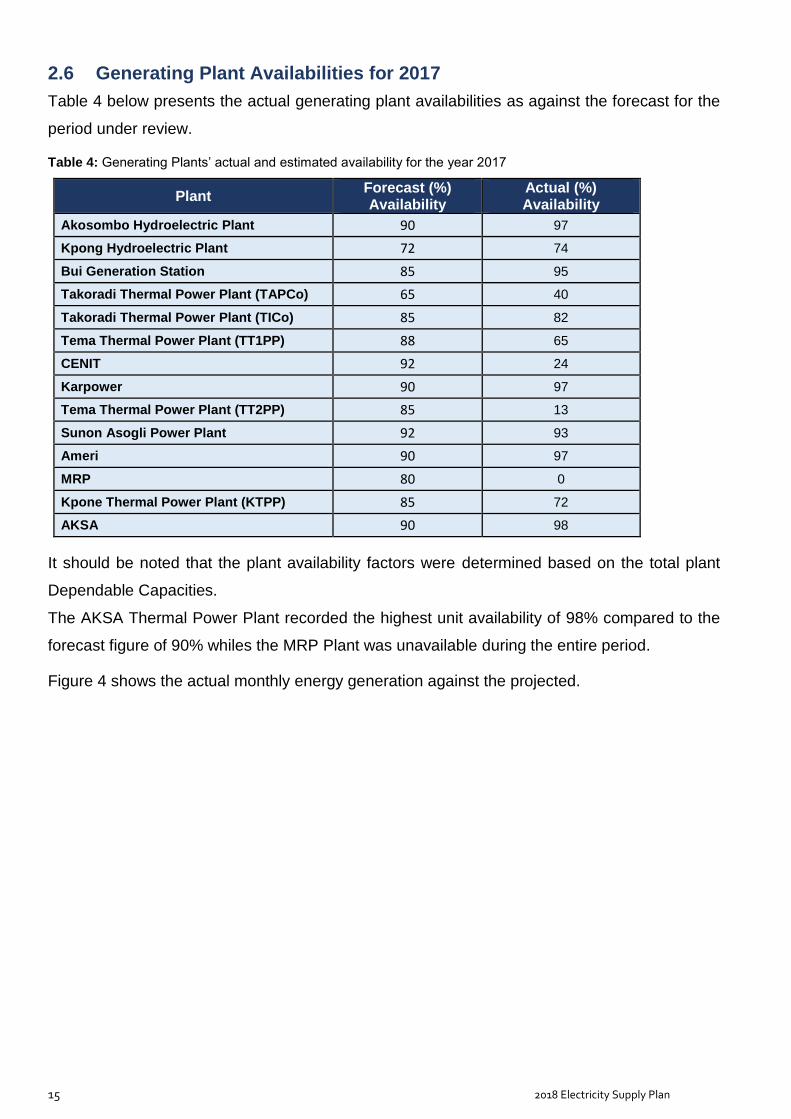
2.6 Generating Plant Availabilities for 2017
Table 4 below presents the actual generating plant availabilities as against the forecast for the
period under review.
Table 4: Generating Plants’ actual and estimated availability for the year 2017
Plant Forecast (%) Availability
Actual (%) Availability
Akosombo Hydroelectric Plant 90 97
Kpong Hydroelectric Plant 72 74
Bui Generation Station 85 95
Takoradi Thermal Power Plant (TAPCo) 65 40
Takoradi Thermal Power Plant (TICo) 85 82
Tema Thermal Power Plant (TT1PP) 88 65
CENIT 92 24
Karpower 90 97
Tema Thermal Power Plant (TT2PP) 85 13
Sunon Asogli Power Plant 92 93
Ameri 90 97
MRP 80 0
Kpone Thermal Power Plant (KTPP) 85 72
AKSA 90 98
It should be noted that the plant availability factors were determined based on the total plant
Dependable Capacities.
The AKSA Thermal Power Plant recorded the highest unit availability of 98% compared to the
forecast figure of 90% whiles the MRP Plant was unavailable during the entire period.
Figure 4 shows the actual monthly energy generation against the projected.

16 2018 Electricity Supply Plan
Figure 4: Generating Plant projected & actual energy production for the year 2017
2.7 Fuel Supply Issues
There was generally low availability of LCO in the Tema Thermal Complex in 2017.
Consequently, the CENIT Plant suspended operations in March 2017.
2.8 Generation Deficiency and Load Shedding
2.8.1 Load management program
In line with the planned maintenance of the gas infrastructure in the 2017 Supply Plan, Tullow
Ghana Limited and Ghana National Gas Company carried out planned maintenance works
between January and March 2017 that led to the curtailment of gas supply to the Aboadze
Enclave. This resulted in some brief incidences of load shedding between 20th February and
3rd March 2017.
2.8.2 Automatic Frequency Load shedding (AFLS)
The period under review registered 42 (no.) automatic frequency load shedding relay (AFLS)
operations which cumulatively lasted 41 hours and 7 minutes. The AFLS operations in 2016
were 24 (no.) and lasted 320 hours and 27 minutes. It is therefore observed that, though the
number of operations in 2017 was higher, the cumulative duration was much lower.
17 2018 Electricity Supply Plan
2.9 Quality of Supply
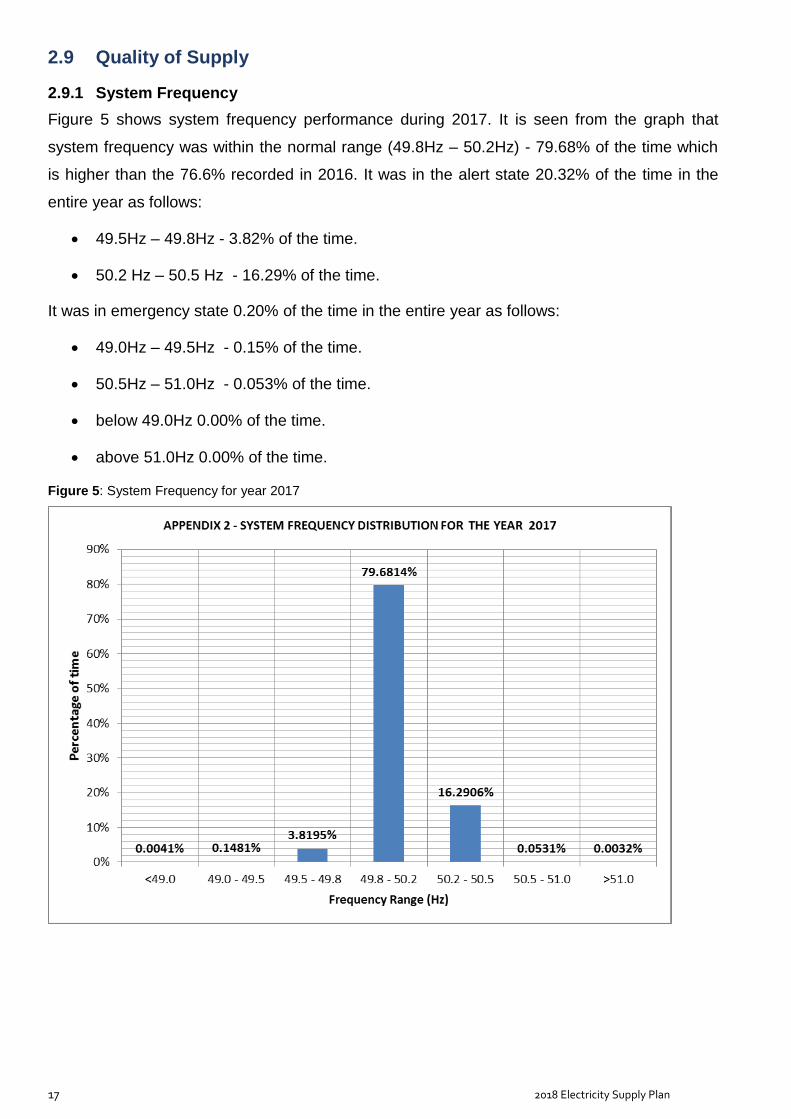
2.9.1 System Frequency
Figure 5 shows system frequency performance during 2017. It is seen from the graph that
system frequency was within the normal range (49.8Hz – 50.2Hz) - 79.68% of the time which
is higher than the 76.6% recorded in 2016. It was in the alert state 20.32% of the time in the
entire year as follows:
49.5Hz – 49.8Hz - 3.82% of the time.
50.2 Hz – 50.5 Hz - 16.29% of the time.
It was in emergency state 0.20% of the time in the entire year as follows:
49.0Hz – 49.5Hz - 0.15% of the time.
50.5Hz – 51.0Hz - 0.053% of the time.
below 49.0Hz 0.00% of the time.
above 51.0Hz 0.00% of the time.
Figure 5: System Frequency for year 2017

18 2018 Electricity Supply Plan
2.9.2 System Voltages
An analysis of voltages at selected Bulk Supply Points (BSP) at peak time indicates that
voltages across the NITS have largely been within normal limits, except Kumasi as shown in
the Table below.
Table 5: System Voltages
Station
Number Of Days of the Year Percentage for the Year
Normal Below Normal
Above Normal Normal Below Normal
Above Normal
Achimota 358 7 0 98.08% 1.92% 0 %
Mallam 332 33 0 90.96% 9.04% 0%
New Tema 365 0 0 100.00% 0.00% 0%
Kumasi 207 158 0 56.71% 43.29% 0%
Takoradi 363 2 0 99.45% 0.55% 0%
Tamale 363 0 2 99.45% 0.00% 0.55 %
Kumasi voltages were below limits 158 days in 2017. The low voltages are largely due to poor
customer (ECG) load power factors and the relatively long circuit distance from generating
plants.
2.10 Transmission Network Performance
2.10.1 Feeder Availability
The average feeder availability on the NITS in 2017 was 99.84 % as compared to 97.07% in
2016.
2.10.2 Transmission Lines
The System Average Availability (SAA) for the transmission grid was 99.58 % in 2017
Table 6: The percentage transmission line availability for the year 2017
Voltage Class Availability (%)
69kV 99.76%
161kV 99.74%
225kV 98.77%
330kV 99.01%
System Average Availability (%) 99.58%
2.11 Transformer Capacity
Over the period under review, transformer capacity on the NITS increased from 4,722.2 MVA
to 4,998.2 MVA, an increase of 236.0 MVA.

19 2018 Electricity Supply Plan
Table 7 shows the breakdown of transformer additions.
Table 7: Transformer additions for year 2017
Substation Transformer Code Voltage level Rating (MVA)
Juabeso 64T1 161/34 33
Kadjebi 70T1 161/34 13
Kpando 25T2 69/34 25
Takoradi 8T1 161/34 33
Old Kpong 17T1 161/34 33
17T2 161/34 33
Collector 75T1 161/34 33
Table 8 below shows typical transformer peak loadings in some major substations in 2017.
Table 8: Transformer peak loadings for year 2017
Substation Transformer
Code Rating (MVA)
Peak Loading (MVA)
% of Rating
Achimota
5T1 66 54.5 111.0
5T2 66 57.4 92.5
5T3 66 57.5 0.1
5T4 66 51.1 97.6
5T5 66 50.2 106.6
5T6 66 51.1 84.0
Mallam
37T1 66 71.6 68.5
37T2 66 57.5 73.3
37T3 66 54.3 82.2
37T4 66 55.2 83.6
New Tema
4T1 66 54 81.8
4T2 33 30.42 92.2
4T3 66 59.9 90.8
4T4 20 0.08 0.4
4T5 66 63.7 96.5
4T6 20 0.02 0.1
Kumasi
13T1 66 69 104.5
13T2 66 61.3 92.9
13T3 66 53.8 81.5
13T4 66 62.4 94.5
Takoradi
8T1 33 32.3 97.9
8T2 33 15.89 48.2
8T3 33 17.92 54.3

20 2018 Electricity Supply Plan
2.12 New installations in 2017
Table 9 below shows the projects that were commissioned during the year under review.
Table 9: Commissioned Projects in 2017
Equipment Projects
Generating Plants
1. 450 MW Karpower plant
2. 250 MW AKSA Plant
3. 180 MW Asogli Phase II
Transmission Lines
1. 161 kV AKSA – Enclave
2. 161kV Asawinso - Juabeso
3. 161kV Cenpower – Kpone Collector
Substation/ Transformers 1. Juabeso substation was commissioned.
2. Kadjebi Substation was commissioned

21 2018 Electricity Supply Plan
3 DEMAND OUTLOOK FOR 2018Peak Demand
The projected coincident peak demand (base case) for 2018 is 2,523.49 MW. This represents
an increase of 331.34 MW, translating into a growth of 15.11 % over 2017 recorded peak of
2,192.15 which occurred on November 13, 2017.
The following spots loads are expected to contribute to peak demand growth in 2018:
a. Second Cell – line operation of VALCO (from 75 MW to 150 MW)
b. Increase in export to SONABEL (Burkina Faso)- from 9.2 MW in 2017 to:
50 MW in the First half of 2018 and
100 MW in the second half of 2018.
c. On‐going distribution network expansion works intended to extend coverage and
improve service quality to ECG and NEDCo customers.
d. Also, various rural electrification projects within the ECG and NEDCo distribution zones
earmarked for commissioning in 2018.
3.2 ECG Energy and Demand Forecast Methodology and Assumptions
The external factors affecting the demand for energy consumption in ECG are following;
GDP growth projection for Ghana
Customer Population
Tariff
ECG customers are categorised into Special Load Tariff (SLT) customers and Non – Special
Load Tariff (NSLT) customers. The SLT customers are industrial customers whose demand is
100 kVA and above, whilst the Non SLT customers include both residential and commercial
customers whose demand less than 100 kVA.
Two (2) energy sales forecast models were developed for each category (SLT and Non – SLT)
to forecast the Energy Sales (MWh) from 2017 to 2026. Non-SLT model utilized the Ordinary
Least Squares (OLS) – Multiple Linear Regression Model (Log – Log) which examines the
historical behaviour of various key variables to build a model for predicting future demand. SLT
model utilized the Auto - Regressive Model which includes the lagged values of the dependent
variable as independent variables. The EVIEWs software was used to estimate the
coefficients.

22 2018 Electricity Supply Plan
The forecast values were projected based on assumptions for Low, Base and High case
scenarios. Exponential Smoothening forecast methodology was employed to carry out the
short term monthly forecast for the year 2018 only.
Tables 10 and 11 show the elasticity’s of price, GDP and Customer Population for both the
SLT and NSLT energy models.
Table 10: Coefficients for Natural Log of Non SLT model
LN_NSLT
Coefficient of Natural Log of Population LNPOP_NSLT 0.227022
Coefficient of Natural Log of GDP LNGDP 0.752405
Coefficient of Natural Log of Price LNP_NSLT -0.109534
Dummy Variables 1 DMN -0.041879
Dummy Variables 2 DMN-2 -0.154824
Constant C -5.692035
Table 11: Coefficients for SLT model
SLT
Coefficient of Non-Agriculture GDP GDP 1.06E-05
Dummy Variables 1 DMS -137621.5
Constant C 98779.93
Coefficient of lag of SLT sales S_SLT (-1) 0.888794
23 2018 Electricity Supply Plan
ECG Energy purchases (MWh) are also projected for the ten-year period 2017 – 2026 using
the relation below;
Where Energy sales (S) is the forecast energy sales from the sum of the SLT and NSLT
energy forecast results.
% System Losses is the projected system loss in line with ECG Management loss reduction
program.
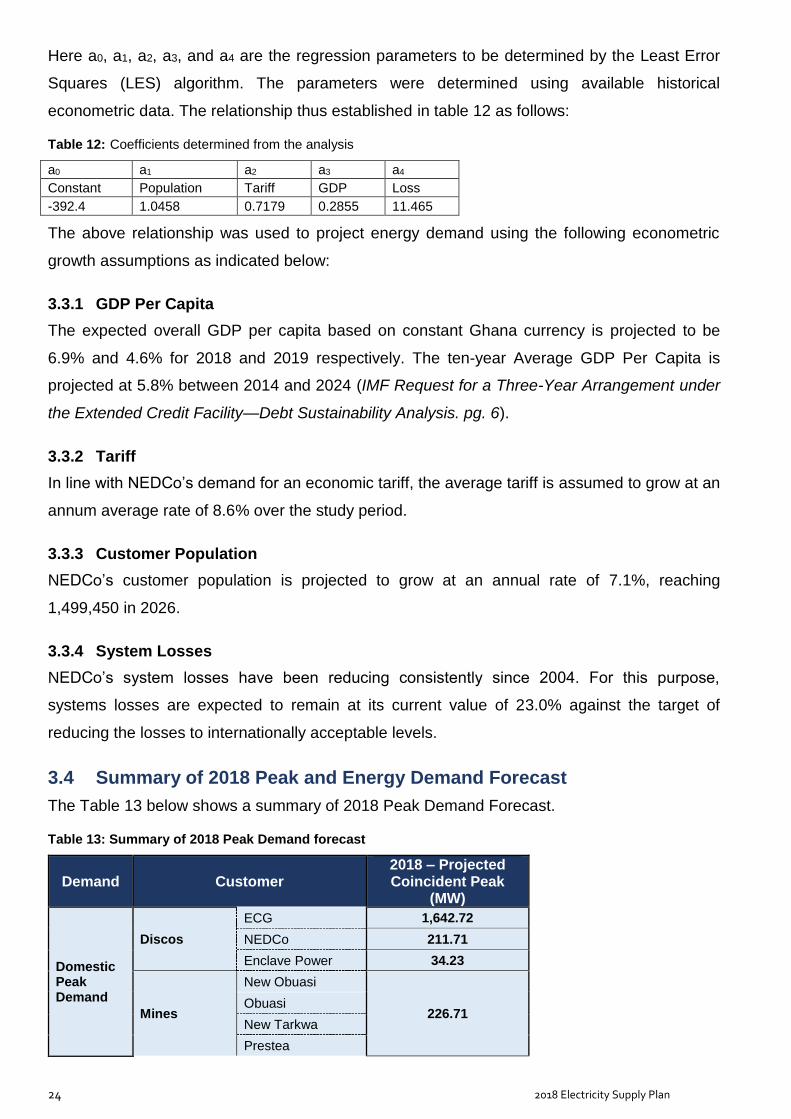
The Annual Total Non – Coincident Peak Demand (MW) are projected for the ten year period
2017 – 2026 using the relation below;
Based on the relation above, the Maximum Demand is forecasted for the period 2017 to 2026.
The Annual Load Factor for the forecast period is projected based on historical load factors
and expected changes in consumption patterns.
The full details of the report can be obtained directly from the Engineering Directorate of the
Electricity Company of Ghana.
3.3 Northern Electricity Company of Ghana (NEDCo) Forecast Methodology and Assumptions
It has been established through correlation studies that residential population and economic
growth has direct relationship with energy growth in NEDCo, hence, the model for the energy
demand took into account the following factors:
Population (POP),
GDP per Capita based on Purchasing Power Parity (GDPC) ,
Tariff (TAR),
System loss (LOSS)
For purposes of simplicity we assume that these factors have linear relationship with the load
demand. The demand equation can therefore be stated as follows:
PL= a0 + a1POP + a2TAR + a3GDPC + a4 LOSS
24 2018 Electricity Supply Plan
Here a0, a1, a2, a3, and a4 are the regression parameters to be determined by the Least Error
Squares (LES) algorithm. The parameters were determined using available historical
econometric data. The relationship thus established in table 12 as follows:
Table 12: Coefficients determined from the analysis
a0 a1 a2 a3 a4
Constant Population Tariff GDP Loss
-392.4 1.0458 0.7179 0.2855 11.465
The above relationship was used to project energy demand using the following econometric
growth assumptions as indicated below:
3.3.1 GDP Per Capita
The expected overall GDP per capita based on constant Ghana currency is projected to be
6.9% and 4.6% for 2018 and 2019 respectively. The ten-year Average GDP Per Capita is
projected at 5.8% between 2014 and 2024 (IMF Request for a Three-Year Arrangement under
the Extended Credit Facility—Debt Sustainability Analysis. pg. 6).
3.3.2 Tariff
In line with NEDCo’s demand for an economic tariff, the average tariff is assumed to grow at an
annum average rate of 8.6% over the study period.
3.3.3 Customer Population
NEDCo’s customer population is projected to grow at an annual rate of 7.1%, reaching
1,499,450 in 2026.
3.3.4 System Losses
NEDCo’s system losses have been reducing consistently since 2004. For this purpose,
systems losses are expected to remain at its current value of 23.0% against the target of
reducing the losses to internationally acceptable levels.
3.4 Summary of 2018 Peak and Energy Demand Forecast
The Table 13 below shows a summary of 2018 Peak Demand Forecast.
Table 13: Summary of 2018 Peak Demand forecast
Demand Customer 2018 – Projected Coincident Peak
(MW)
Domestic Peak Demand
Discos
ECG 1,642.72
NEDCo 211.71
Enclave Power 34.23
Mines
New Obuasi
226.71 Obuasi
New Tarkwa
Prestea

25 2018 Electricity Supply Plan
Demand Customer 2018 – Projected Coincident Peak
(MW) Ahafo/Kenyase (Newmont)
New Abirim (Newmont)
Akyempem (Wexford)
Perseus (Ayanfuri)
Bogosu
Akwatia
Konongo
Adamus Gold Resources
Asanko Gold
Drill Works
Other Bulk Customers
Akosombo Textiles
40.74
Aluworks
Ghana Water Company Ltd
Diamond Cement
Generation Plants Station Service
Volta Hotel
Savana Cement (Buipe)
VRA Townships
Losses + Network Usage 84.37
Total Domestic Peak Demand 2,240.49
Exports
CEB 30
CIE 3
SONABEL 100
Total Exports 133.00
VALCO 150.00
Coincident Peak Demand MW 2,523.49
The Pie-Chart below is used to describe the Peak Demand, showing the percentage share of
each customer class as shown in the Figure 6. From the Chart, ECG’s demand constitutes
65% of the total system peak followed by NEDCo and the Mines at 9%. VALCO at two Cell-
lines constitutes 6%. Other Bulk Consumers constitute 2 % whilst Exports to CEB and
SONABEL together account for 5%.

26 2018 Electricity Supply Plan
Figure 6: 2018 projected peak demand
ECG65%
NEDCo9%
Enclave1%
MINES9%
Other Bulk Customers2%
VALCO6%
EXPORTS5%
LOSSES3%
2018 Projected Peak Demand (MW)
3.5 Outlook of Energy Consumption
Total energy consumption including transmission network losses is projected at 16,304.79
GWh in 2018. This includes estimated transmission losses and network usage of 594.30 GWh,
representing 3.6 % of total energy consumption. The projected 2018 energy consumption
represents a growth of approximately 15.11 %, over the 2017 actual consumption of 14,177.33
GWh, an increase of 2,127.46 GWh
The summary of 2018 energy consumption by customer class is presented in Table 14 below.
Table 14: Summary of 2018 Energy Consumption by Customer Class
. Customer 2018 – Projected Consumption
(GWh)
Domestic Consumption
ECG 10,588.86
NEDCo 1,373.10
Enclave Power Company 167.74
Mines 1,495.41
Other Bulk Customers 259.22
Losses + Network Usage 594.30
Total Domestic 14,478.63
Exports
CEB 230.00
CIE 13.21
SONABEL 428.76
VALCO 1,154.19
Total Energy (GWh) 16,304.79
27 2018 Electricity Supply Plan
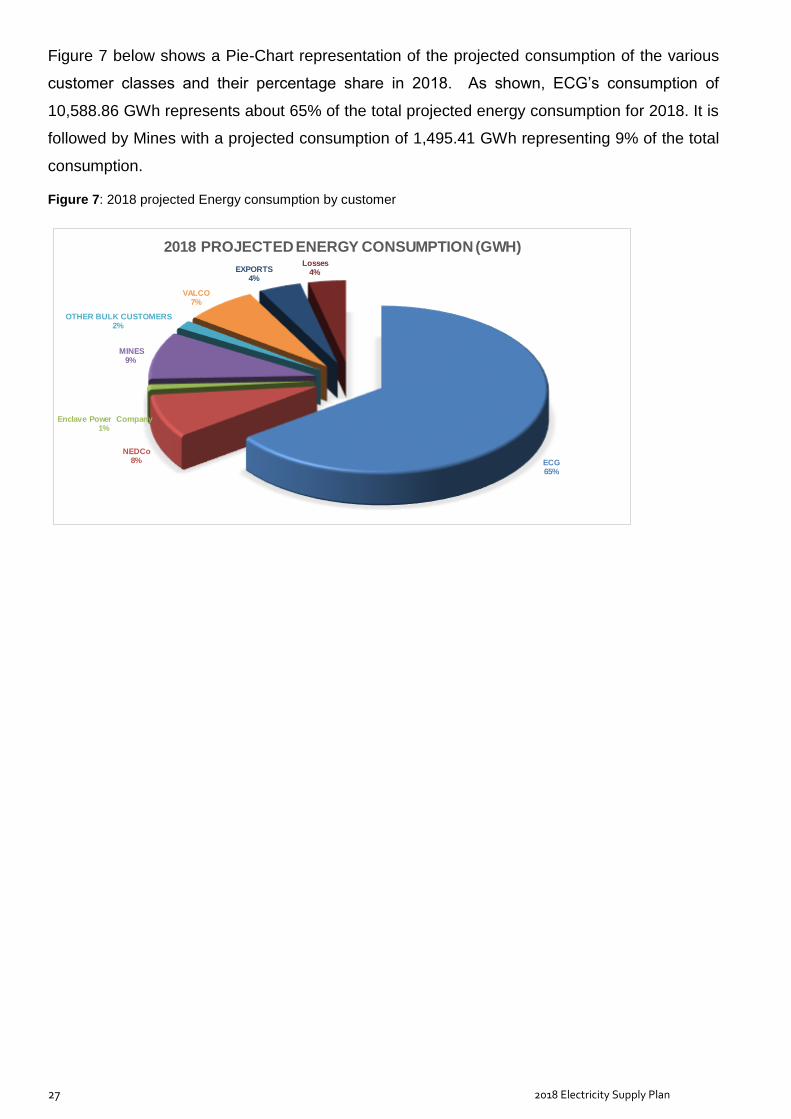
Figure 7 below shows a Pie-Chart representation of the projected consumption of the various
customer classes and their percentage share in 2018. As shown, ECG’s consumption of
10,588.86 GWh represents about 65% of the total projected energy consumption for 2018. It is
followed by Mines with a projected consumption of 1,495.41 GWh representing 9% of the total
consumption.
Figure 7: 2018 projected Energy consumption by customer
ECG65%
NEDCo8%
Enclave Power Company1%
MINES9%
OTHER BULK CUSTOMERS2%
VALCO7%
EXPORTS4%
Losses 4%
2018 PROJECTED ENERGY CONSUMPTION (GWH)

28 2018 Electricity Supply Plan
3.6 Projected Monthly Peak and Energy Demand
A detailed summary of the monthly peak demand and the corresponding energy consumption for the various customer classes is shown in Table 15
below.
Table 15: Summary of 2018 Monthly peak (MW) and Energy (GWh) demand forecast
Base Case- Energy and Peak Demand Projection- 2018
Energy (GWh) Jan Feb Mar Apr May Jun Jul Aug Sep Oct Nov Dec
Total Energy (GWh
ECG 930.12 822.34 900.28 912.40 916.02 845.16 838.49 850.29 840.25 894.54 896.51 942.46 10,588.86
NEDCo 112.28 110.31 117.36 111.92 113.55 111.75 114.15 113.38 112.60 121.00 117.26 117.52 1,373.10
Enclave Power Company 8.91 10.16 13.16 13.57 14.40 15.08 15.52 14.46 15.72 15.66 15.59 15.52 167.74
MINES 124.73 121.75 123.29 120.19 124.32 120.11 122.00 130.03 126.38 128.15 125.60 128.87 1,495.41
Other Bulk Customers 20.14 18.29 20.54 20.13 20.37 20.70 22.03 24.18 21.89 22.39 23.43 25.12 259.22
VALCO 53.57 64.51 85.71 103.68 107.14 103.68 107.14 107.14 103.68 107.14 103.68 107.14 1,154.19
CEB(Togo/Benin) 19.53 17.64 19.53 18.90 19.53 18.90 19.53 19.53 18.90 19.53 18.90 19.53 230.00
SONABEL(Burkina) 5.58 5.04 5.04 27.00 27.90 27.00 55.80 55.80 54.00 55.80 54.00 55.80 428.76
CIE(Ivory Coast) 0.89 0.81 0.89 0.86 0.89 0.86 0.89 0.89 0.86 0.89 0.86 0.89 13.21
Network Usage 0.73 0.67 0.74 0.76 0.77 0.72 0.74 0.75 0.74 0.78 0.78 0.81 8.99
LOSSES 50.02 45.91 50.41 66.72 67.50 63.44 38.89 39.49 38.85 40.98 40.70 42.41 585.31
Total 1326.50 1217.43 1336.95 1396.13 1412.40 1327.41 1335.18 1355.95 1333.88 1406.85 1397.32 1456.08 16,304.79
Peak demand (MW)-Coincident Jan Feb Mar Apr May Jun Jul Aug Sep Oct Nov Dec
Max. Demand (MW)
ECG 1604.05 1610.86 1652.07 1656.95 1640.61 1563.99 1485.64 1484.46 1552.04 1613.63 1637.79 1642.72 1656.95
NEDCo 200.95 203.23 201.84 201.45 204.89 205.34 205.08 207.89 209.67 214.34 212.14 211.71 214.34
Enclave Power Company 29.44 29.44 29.44 29.44 29.44 29.44 32.00 32.00 32.00 32.00 32.00 34.23 34.23
MINES 210.90 208.41 207.90 208.63 208.11 209.48 213.98 214.11 216.03 219.27 222.61 226.71 226.71
Other Bulk Customers 39.36 38.19 40.32 40.68 42.63 40.93 40.88 42.21 41.28 41.82 41.27 40.74 42.63
VALCO 75.00 100.00 120.00 150.00 150.00 150.00 150.00 150.00 150.00 150.00 150.00 150.00 150
CEB(Togo/Benin) 30.00 30.00 30.00 30.00 30.00 30.00 30.00 30.00 30.00 30.00 30.00 30.00 30
SONABEL(Burkina) 10.00 10.00 10.00 50.00 50.00 50.00 100.00 100.00 100.00 100.00 100.00 100.00 100
CIE(Ivory Coast) 3.00 3.00 3.00 3.00 3.00 3.00 3.00 3.00 3.00 3.00 3.00 3.00 3
Network Usage 1.30 1.32 1.36 1.40 1.39 1.35 1.34 1.34 1.38 1.42 1.44 1.44 1.44
LOSSES 101.76 103.17 106.01 137.47 136.80 132.37 76.86 76.96 79.36 81.74 82.58 82.93 137.47
System Peak (MW) - Coincident 2,305.77 2,337.62 2,401.94 2,509.01 2,496.88 2,415.89 2,338.78 2,341.97 2,414.76 2,487.23 2,512.83 2,523.49 2523.49

29 2018 Electricity Supply Plan
4 SUPPLY OUTLOOK
4.1 Sources of Generation
The sources of generation considered are mainly the existing generation and the committed
projects expected to come on line in 2018.
4.2 Existing Generation SourcesAkosombo & Kpong Hydro
The year start elevation for the Akosombo reservoir is 76.60 m (251.31 ft) which is lower than
the Lower Operating Rule Curve of 76.87 m (252.20ft.) for the Reservoir.
In the light of this low elevation for the Akosombo Reservoir, it is planned to operate three (3)
Units during Off-peak and up to four (4) Units during Peak periods in 2018. This mode of
operation will result in average Plant Output of 600 MW at Akosombo and this will ensure that
the Reservoir level is kept above the Minimum Operating Level of 73.15 m (240 ft.) by the end
of the dry season.
Kpong GS, which is currently undergoing retrofit, is projected to run 3 out of the 4 total installed
Units. Consequently, the total average Plant Output at Kpong GS is projected at 105 MW.
As a result of the above Plants operation, the projected total annual hydro energy generation
from Kpong and Akosombo Generating Stations is 4,200 GWh.
The projected monthly elevations for the Akosombo Reservoir in 2018 based on the above-
recommended hydro generation are shown in Figure 8 below. The expected minimum
elevation of 73.73 m (241.89 ft.) at the end of the dry season is some 0.58m or 1.89ft above
the minimum operating level of 73.15, or. 240 ft. The projected Akosombo Reservoir Monthly
Elevations is based on an assumed net inflow of 20 MAF (based on a 55% probability of
obtaining this level of inflow).

30 2018 Electricity Supply Plan
Figure 8: 2018 Projected Akosombo Trajectory
4.2.2 Bui Hydro
In 2018, Bui Hydro Plant is projected to operate an average of two (2) units throughout the
year. This mode of operation will lead to a projected annual production of 756 GWh. The plant
is assumed to provide an average generation capacity of 220 MW to support demand.
It is estimated that, for continuous and sustainable operation of the Bui GS for 2018 and for the
subsequent years (in the likely event of low inflows), the reservoir level at the end of the dry
season of 2018 should not drop below elevation 170 MASL.
With a projected year-start elevation of 175 MASL in 2018, and the total estimated total energy
production of 756.21 GWh for year 2018, the year-end elevation is projected at 174.9 MASL.
Assumptions for projected 2018 generation from the Bui Hydro Plant:
o 64% Long Term Average Inflow of 6,167 Mm3.
o 2018 Year start elevation of Bui Reservoir – 175 MASL
o Operation of two units in normal mode at 110 MW in 2018.
o Operation of third unit in Synchronous Condenser Mode (SCM) when required by NTIS
from January 1 to December 31, 2018.
o Operate Turbinette at 3.75 MW from January 1 to December 31, 2018.

31 2018 Electricity Supply Plan
Figure 9: 2018 Projected Bui Reservoir Trajectory
4.3 Thermal Generation
The details of installed and dependable generation sources assumed for the 2018 energy
supply plan are shown in Table 16. The total installed capacity of the existing generation
sources is 4,313 MW of which 3,868 MW is dependable capacity.
Table 16: Existing Generation Sources
Plants
Installed Capacity
Dependable Capacity Fuel Type
(MW) (MW)
Akosombo GS 1020 900 Hydro
Kpong GS 160 140 Hydro
TAPCO (T1) 330 300 LCO/Gas
TICO (T2) 340 320 LCO/Gas
TT1PP 110 100 LCO/Gas
TT2PP 80 70 Gas
KTPP 220 200 Gas/ Diesel
VRA Solar Plant 2.5 0 Solar
TOTAL VRA 2,263 2,030
Bui GS 404 360 Hydro
CENIT 110 100 LCO/Gas
AMERI 250 230 Gas
SAPP 200 180 Gas
SAPP 2 360 340 Gas
KAR Power 470 450 HFO

32 2018 Electricity Supply Plan
AKSA 260 220 HFO
BXC Solar 20 0 Solar
Meinergy Solar 20 0 Solar
Trojan 44 39.6 Diesel/Gas
Genser 22 18 Coal
TOTAL IPP 1,646 1,478
TOTAL (VRA, Bui & IPPs) 4,313 3,868
4.4 New Generation Sources
In 2018, a number of new generating plants are expected to be commissioned as follows:
o 340 MW Cenpower Thermal Power Plant. The Plant started commissioning in
November 2017 and expected to reach full COD by the second quarter of 2018.
o 20 MWp Meinergy Solar PV Plant. The Plant which will feed directly into the Medium
Voltage (MV) Network is located in the Central Region and expected to be
commissioned in the second half of 2018.
4.5 Key Assumptions Underpinning the Supply Plan
In developing the 2018 Supply Outlook, the following key assumptions were made;
4.5.1 Planned Maintenance
The schedule of key maintenance activities expected to be undertaken in 2018 on generating
units at the various power plants is shown in Table 17.
Table 17: 2018 Planned Maintenance
Plants Planned Maintenance
Akosombo GS Each of the six (6) units is scheduled to undergo annual maintenance, one at a time
for a duration 18 days
Maintenance at Akosombo GS will be scheduled in a manner that it will not affect
overall power supply
Kpong GS Unit 1: Post retrofit inspection for 30 days from July 1 – 30, 2018
Unit 2: Quarterly maintenance for a period of 1 week in April, August and
December, 2018
Unit 3: Major Retrofit from January 1 to October 31, 2018
Unit 4: Quarterly maintenance for a period of 1 week in February, June and October
Bui GS Unit 1 is scheduled for March 7 to April 18, 2018.
Unit 2 is scheduled for July 3 to 31, 2018.
Unit 3 is scheduled for October 1 to 29, 2018.
TAPCO (T1) Unit 1: Fuel Nozzle Inspection and Compressor Water Wash from September 16-23,
2018.
Unit 2: Major Inspection and compressor wash from Jan 1 – April 30, 2018
Unit 3: Minor Inspection from March 30 – April 21.
TICO (T2) Unit 1: Major Inspection from October 1 to November 29, 2018.
Unit 3: Warranty Clearance Outage from January 13 to 27, 2018
TT1PP Unit scheduled for 12 days’ maintenance from February 19 to March 2, 2018.

33 2018 Electricity Supply Plan
Plants Planned Maintenance
TT2PP Unit 1: Core Engine Swap and main gearbox overhaul from July 17 – August 10,
2018.
Unit 2: Core Engine Swap and main gearbox overhaul from June 1 – June 25, 2018.
Unit 3: Core Engine Swap and main gearbox overhaul from July 24 – July 18.
Unit 4: Undergo Maintenance for 12 days from October 1 to 12, 2018
Unit 5: Undergo Maintenance for 12 days from September 14 to 25, 2018
Unit 6: Undergo Maintenance for 12 days from September 22 to October 3
Unit 7: Undergo Maintenance for 12 days from October 9 to 20, 2018
Unit 8: Undergo Maintenance for 12 days from October 17 to 28, 2018
KTPP Unit 2 will undergo maintenance for 10 days from April 16 – 25, 2018.
ASOGLI I Unit 4 & 6: Will undergo Class A maintenance from July 1 to 31, 2018
Unit 5 : Class C maintenance1 from August 5 to 18, 2018
Unit 2, 3: Class C maintenance from August 18 to 31, 2018
Unit 1 : Class C maintenance from September 8 to 18, 2018
ASOGLI II Unit 7 & Unit 8: Class C Maintenance from March 15 to April 1, 2018
Unit 7: Class C maintenance from September 1 to 21, 2018
Unit 9 & 10 : Class C maintenance from November 10 to 27, 2018
CENIT Plant to undergo Hot Gas Path Inspection from April 21 to May 12, 2018
AKSA One unit will undergo maintenance in January, September, October and November
for 12 days.
KarPower Barge
Units 1 to 24 will undergo maintenance for a total of 336 hrs in February, April and
November 2018 and then for 384 hrs in September 2018.
Units 1 to 26 will undergo maintenance for a total of 672 hrs in June 2018.
Units 25 and 26 will undergo maintenance for 48 hrs in March, August and December
2018 and then for 96 hrs in October 2018.
4.5.2 Natural Gas Quantities and Availabilities
Two main supplies of natural gas were considered as follows:
Nigeria Gas – Average supply of 60 mmscf/day is assumed from January to December
2018
Ghana Gas
o Jubilee Fields- Average of 100 mmscf/day from January to December 2018.
o TEN Fields – Average of 50 mmscf/day from January to December 2018.
o Sankofa Fields – Average of 120 mmscf/day from July 2018 (to be used by 450
MW Karpower Barge).
4.5.3 Gas Supply Disruptions
There is a planned three (3) week disruption in gas supply from Ghana Gas in February 2018.
A second disruption in gas supply for 19 days is planned for March 2018 during which only 30
mmscf is expected to flow from Ghana Gas.
34 2018 Electricity Supply Plan
4.5.4 West to East Reverse Flow
On-going works to facilitate West to East Reverse Flow of gas using the WAPCo Gas Pipeline
is expected to be completed by April 2018. This will pave the way for Ghana Gas to supply
natural gas to power plants in the Tema Generation Enclave.
4.5.5 Fuel Allocation
Due to the limited quantities of natural gas supply in 2018 as projected above, fuel usage at
the Tema and Takoradi Power Enclaves shall be strategically managed as follows:
Tema
30 mmscf/day allocated to Sunon-Asogli power plants.
30 mmscf/day for VRA plants (TT1PP & KTPP) at Tema
TT2PP/TT2PP-X operate on natural gas (on standby).
CENIT and Cenpower to operate on LCO
Karpower to operate on HFO for the first half of the year and then be relocated to Takoradi to be run on natural gas from Sankofa Fields in the second half of the year .
AKSA to operate on HFO
Takoradi
T1 to operate mainly of Gas
T2 to operate mainly on Gas
Excess gas to be used by AMERI
Karpower to operate on Gas from Sakofa fields from July to December 2018.
4.5.6 Fuel Price
The following assumptions on price of fuel delivered made:
Nigeria Gas – US$ 8.45/mmbtu
Ghana Gas – US$ 7.6/mmbtu
Delivered LCO – US$ 70/barrel
Delivered Diesel – US$ 84/barrel
Delivered HFO – US$ 405/MT
4.6 Demand - Supply Analysis
This sub-section tries to analyze the demand – supply balance for 2018. The assumptions
underpinning the demand - supply projections for 2018 are as described above. The analysis
begins with the projected from all the generating plants and is presented in Table 18 below.
The analysis of the monthly energy balance shows capacity surplus in 2018.
In view of the supply surplus, some Plants will not be dispatched under normal operating
conditions.

35 2018 Electricity Supply Plan
Therefore, the following criteria are used to determine which Plants are dispatched on a
monthly basis:
a. Merit order dispatch including lower overall system losses.
b. Availability of fuel per Plant
c. Must-run Plants (e.g. Solar)
d. System stability Requirements
Table 18: Projected Monthly Generation in GWh
2018
Projected
Consumption
(GWh)
Jan Feb Mar Apr May Jun Jul Aug Sep Oct Nov Dec
Domestic 14,478.63 1,246.93 1,129 1,226 1,246 1,257 1,177 1,152 1,173 1,156 1,223 1,220 1,273
VALCO 1,154.19 54 65 86 104 107 104 107 107 104 107 104 107
Export (CEB+SONABEL) 671.97 26 24 26 47 49 47 76 76 74 76 74 76
Projected System Demand 16,304.79 1,327 1,218 1,337 1,396 1,413 1,328 1,335 1,356 1,334 1,407 1,398 1,456
Generation Sources
Projected
Supply (GWh)
Akosombo 3,599.99 326 293 312 302 312 305 269 261 285 315 305 314
Kpong GS 600.12 51 45 51 49 51 49 51 51 49 51 49 51
TAPCO 1,457.06 89 20 55 58 89 86 179 179 173 179 173 179
TICO 2,155.05 174 183 202 196 202 196 202 202 196 101 98 202
TT1PP 352.98 60 - 60 - 60 - 60 - 57 - 58 -
KTPP 369.24 - 57 - 61 - 61 - 63 - 63 - 63
MRPP - - - - - - - - - - - - -
TT2PP/TT2PPx - - - - - - - - - - - - -
VRA Solar 4.20 0.4 0.3 0.4 0.3 0.4 0.3 0.4 0.4 0.3 0.4 0.3 0.4
Imports From Cote d'Ivoire - - - - - - - - - - - - -
Total VRA Available Generation 8,538.63 700 599 680 667 714 698 761 757 761 709 683 809
AMERI Power Plant 796.53 92 - 56 49 76 73 76 76 73 76 73 76
Karpower Barge 2,708.25 287 262 229 268 271 218 138 163 147 261 254 210
SAPP 51.93 - 52 - - - - - - - - - -
SAPP (Phase 2) 1,414.18 118 118 118 118 118 118 118 118 118 118 118 118
CENIT 380.93 - - - 32 31 45 46 46 45 46 45 46
AKSA 558.49 71 133 88 101 35 14 14 14 14 14 48 14
CENPOWER 1,061.21 - - 108 104 108 104 108 108 104 108 104 108
Bui GS 756.21 57 52 57 56 57 56 71 71 69 71 69 71
BXC Solar 25.54 2.2 1.9 2.2 2.1 2.2 2.1 2.2 2.2 2.1 2.2 2.1 2.2
MEINERGY Solar 12.90 2.2 2.2 2.1 2.2 2.1 2.2
Total Available Generation (GWh) 16,304.79 1,327 1,218 1,337 1,396 1,412 1,328 1,336 1,356 1,334 1,407 1,397 1,456
The Table 19 below on the other hand shows the annual energy and supply balance for 2018.
It is seen from the Table that the total generation from the VRA Plants is 8,538.63 GWh,
representing 52.36% of the projected total electricity generation in 2018. Total generation from
Bui Hydro and other Independent Power Producers (IPPs) total 7,766.17 GWh, accounting for
47.34% of the projected total generation in 2018, out of which total IPP generation is 7,009.96
GWh, representing 42.99% of projected total generation in 2018

36 2018 Electricity Supply Plan
Table 19: 2018 Projected energy and Supply Balance in GWh
Projected Demand/Supply Demand/Supply (GWh)
Total Domestic 14,478.63
VALCO 1,154.19
Exports (CEB+SONABEL+CIE) 671.97
Total Projected Demand 16,304.79
Projected Supply
Total VRA Hydro (Akosombo & Kpong GS) 4,200.11
Bui GS 756.21
VRA Existing Thermal & Solar Generation
T1 1,457.06
T2 2,155.05
TT1PP 352.98
KTPP 369.24
MRPP 0
TT2PP/TT2PP-X 0
Solar 4.20
Total VRA Thermal & Solar Generation 4,338.53
Existing IPP Thermal & Solar Generation
AMERI Power Plant 796.53
Karpower Barge 2,708.25
SAPP+SAPP Phase 2 1,466.11
CENIT 380.93
AKSA 558.49
CENPOWER 1,061.21
BXC Solar 25.54
MEINERGY Solar 12.90
Total IPP Thermal & Solar Generation 7,009.96
Total VRA Supply 8,538.64
Total Non-VRA Supply 7,766.15
Total Supply 16,304.79
A graphical representation of the above energy supply giving the percentage share of each
generation type is shown in Figure 10 below. The chart indicates that in 2018 thermal
generation will constitute 69.3% of projected total generation whilst hydro generation and
generation from Solar PV would constitute 30.4% and 0.3% respectively.
This means that in 2018, generation from thermal sources would be more than twice that from
hydro sources.
This high percentage of thermal generation could have serious implications for the sector for
the following reasons;
i. It will adversely impact the finances the local power utilities, since their tariffs are cedi
denominated, but may require much more forex to purchase fuel and other
consumables for their operations, considering the volatility of the cedi.

37 2018 Electricity Supply Plan
ii. Since the thermal plants are predominantly gas-based, any disruptions in gas supply
would have dire consequences on the power supply situation in the country.
Figure 10: Contribution of Supply by Generation Types

38 2018 Electricity Supply Plan
4.7 Projected Capacity Situation
The projected monthly capacity levels, taking planned units’ and fuel supply systems’ maintenance into consideration is shown in Table 20
below.
Table 20: Projected Monthly Capacity Situation for 2018
Customer Category2018 Proj.
System Peak
(MW)
Jan Feb Mar Apr May Jun Jul Aug Sep Oct Nov Dec
Domestic 2,276 2,188 2,195 2,239 2,276 2,264 2,183 2,056 2,059 2,132 2,204 2,230 2,240
VALCO 150 75 100 120 150 150 150 150 150 150 150 150 150
Export (CEB+SONABEL) 133 43 43 43 83 83 83 133 133 133 133 133 133
Projected System Demand 2,523 2,306 2,338 2,402 2,509 2,497 2,416 2,339 2,342 2,415 2,487 2,513 2,523
Generation Sources Dependable
Capacity (MW)
Akosombo 900 600 600 600 600 600 600 600 600 600 600 600 600
Kpong GS 105 105 105 105 105 105 105 105 105 105 105 105 105
TAPCO 300 150 - 150 100 150 150 300 300 300 300 300 300
TICO 320 200 320 320 320 320 320 320 320 320 160 160 320
TT1PP 100 100 100 100 100 100 100 100 100 100 100 100 100
KTPP 200 100 100 100 100 100 100 100 100 100 100 100 100
TT2PP 60
VRA Solar 2.5
Imports From Cote d'Ivoire - - - - - - - - - - - - -
Total VRA Available Generation 1,988 1,255 1,225 1,375 1,325 1,375 1,375 1,525 1,525 1,525 1,365 1,365 1,525
Bui GS 345 230 230 230 230 230 230 230 230 230 230 230 230
Bui Min Unit 4 4 4 4 4 4 4 4 4 4 4 4 4
SAPP 180 180 180 180 180 180 180 180 180 180 180 180 180
SAPP (Phase 2) 360 180 180 180 180 180 180 360 360 360 360 360 360
CENIT 100 - - - 100 - 100 100 100 100 100 100 100
AMERI Power Plant 230 230 - 230 230 230 230 230 230 230 230 230 230
Karpower Barge 450 450 450 450 450 450 450 450 450 450 450 450 450
AKSA 220 220 220 220 220 220 220 220 220 220 220 220 220
CEN Power 340 - - 340 340 340 340 340 340 340 340 340 340
BXC Solar 20
Meinergy 20.0
Total Available Generation (MW) 4,257 2,749 2,489 3,209 3,259 3,209 3,309 3,639 3,639 3,639 3,479 3,479 3,639
Surplus/deficit (MW) 1,733 443 151 807 750 712 893 1300 1297 1224 991 966 1115
Reserve Margin 19% 6% 34% 30% 29% 37% 56% 55% 51% 40% 38% 44%
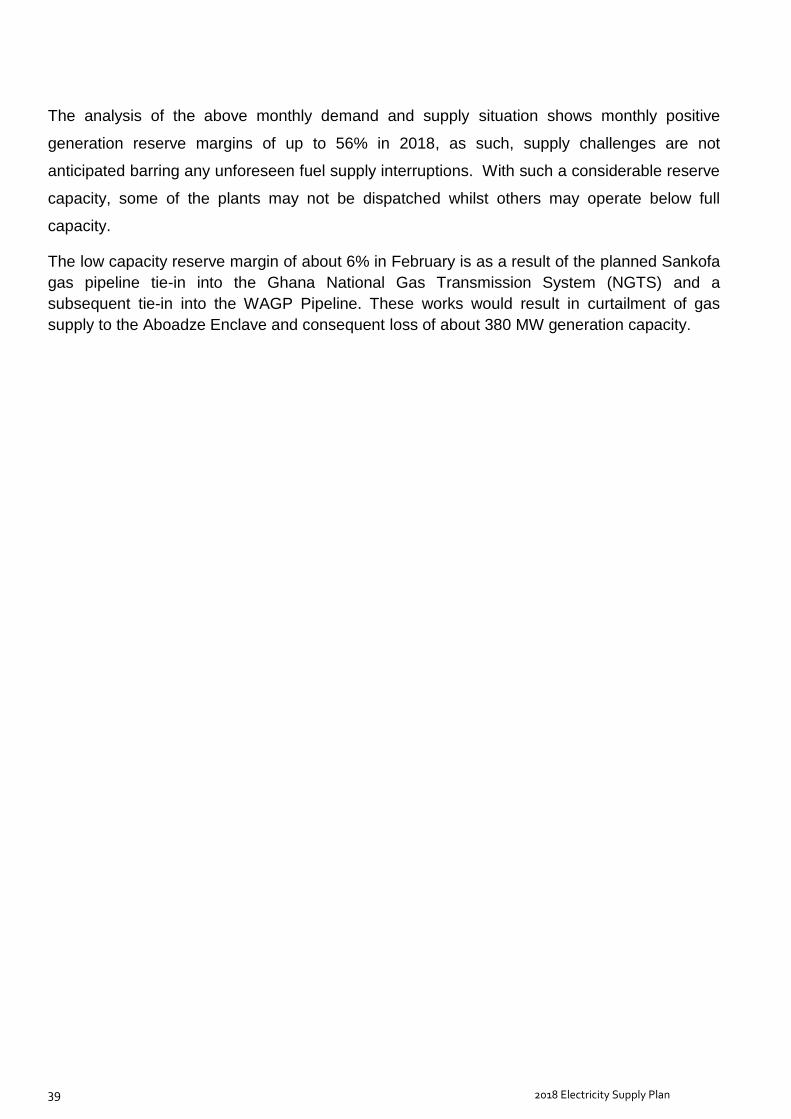
39 2018 Electricity Supply Plan
The analysis of the above monthly demand and supply situation shows monthly positive
generation reserve margins of up to 56% in 2018, as such, supply challenges are not
anticipated barring any unforeseen fuel supply interruptions. With such a considerable reserve
capacity, some of the plants may not be dispatched whilst others may operate below full
capacity.
The low capacity reserve margin of about 6% in February is as a result of the planned Sankofa
gas pipeline tie-in into the Ghana National Gas Transmission System (NGTS) and a
subsequent tie-in into the WAGP Pipeline. These works would result in curtailment of gas
supply to the Aboadze Enclave and consequent loss of about 380 MW generation capacity.

40 2018 Electricity Supply Plan
4.8 Fuel Requirement
Currently, the main fuels for power generation include Light Crude Oil (LCO), Natural Gas and
Heavy Fuel Oil (HFO). The estimates of quantity and cost of fuel require in 2018 is indicated in
the Table 21 below:
Table 21: Summary of Annual Fuel Requirements
PLANT LCO Natural Gas HFO
(Barrels) (MMbtu) (MT)
T1 11,996,329
T2 596,986 13,987,551
TT1PP 4,204,032
TT2PP
MRPP
KTPP 4,393,956
TOTAL VRA 596,986 34,581,868
CENIT 885,658
AMERI 8,094,557
Cenpower 1,512,221
SAPP+ SAPP Phase 2 13,194,441
Karpower 10,945,185 282,435
AKSA 171,904
TOTAL IPP 2,397,879 32,234,183 454,339
TOTAL (VRA&IPP) 2,994,865 66,816,052 454,339
The summary of fuel requirements for 2018 is as presented below:
LCO. The total LCO requirement for 2018 is about 3 million barrels out of which 597,000
barrels would be required for the VRA and about 2.4 million barrels for non-VRA plants.
Based on a cargo size of 405,000 barrels, the annual LCO requirements are about two (2)
cargoes and about six (6) cargoes for VRA and non-VRA Plants respectively. Thus, a total
of about eight (8) cargoes of LCO would be required.
Natural Gas. Based on the assumed gas supply from Nigeria and Ghana, the total natural
gas consumption is projected to be about 67 million mmbtu. VRA plants will use about 35
million mmbtu and IPPs some 32 million mmbtu.
HFO. For the first half of the year, Karpower is expected to operate on HFO. The AKSA
Plant is also scheduled to operate on HFO. Therefore, an estimated 455,000 Metric Tonnes
would be required by AKSA and Karpower.

41 2018 Electricity Supply Plan
Diesel. Diesel would be used mainly for start-ups and stops of all thermal plants. An
estimated 100,000 barrels would be required in total for starting and stopping all thermal
power plants.
Monthly Fuel Requirement.
The breakdown of Monthly fuel requirements and their associated costs are as shown in Figure 11
below.
Figure 11: Monthly fuel requirements and associated costs
Estimated Fuel Requirement & Cost
Units Jan Feb Mar Apr May Jun Jul Aug Sep Oct Nov Dec Total
Estimated Thermal Fuel Requirement Units
TAPCO - LCO barrels - - - - - - - - - - - - -
TAPCO - GAS mmbtu 734,953 165,957 450,455 474,163 734,953 711,245 1,469,906 1,469,906 1,422,490 1,469,906 1,422,490 1,469,906 11,996,329
TICO - LCO barrels - 283,315 313,670 - - - - - - - - - 596,986
TICO - GAS mmbtu 1,373,605 - - 1,547,724 1,599,314 1,547,724 1,599,314 1,599,314 1,547,724 799,657 773,862 1,599,314 13,987,551
TT1PP - GAS barrels 708,288 - 708,288 - 708,288 - 708,288 - 685,440 - 685,440 - 4,204,032
MRP - GAS mmbtu - - - - - - - - - - - - -
KTPP - GAS mmbtu - 679,728 - 728,280 - 728,280 - 752,556 - 752,556 - 752,556 4,393,956
TT2PP - GAS mmbtu - - - - - - - - - - - - -
IPP Plants -
AMERI Power Plant - GAS mmbtu 929,997 - 572,267 497,532 771,174 746,297 771,174 771,174 746,297 771,174 746,297 771,174 8,094,557
Karpower Barge - HFO MT 52,756 48,284 42,063 49,266 49,918 40,148 - - - - - - 282,435
Karpower Barge - GAS mmbtu - - - - - - 1,285,678 1,518,010 1,368,952 2,438,143 2,371,795 1,962,607 10,945,185
SAPP - GAS mmbtu - 484,650 - - - - - - - - - - 484,650
SAPP (Phase 2) - GAS mmbtu 1,099,537 1,099,537 1,099,537 1,099,537 1,099,537 1,099,537 1,099,537 1,099,537 1,099,537 1,099,537 1,099,537 1,099,537 13,194,441
SAPP (Phase 2) - LCO barrels - - - - - - - - - - - - -
CENIT - LCO barrels - - - 74,995 71,424 103,565 107,136 107,136 103,565 107,136 103,565 107,136 885,658
AKSA - HFO MT 21,814 40,955 26,966 31,169 10,885 4,157 4,295 4,295 4,157 4,295 14,622 4,295 171,904
CENPOWER - LCO barrels - - 153,199 148,257 153,199 148,257 153,199 153,199 148,257 153,199 148,257 153,199 1,512,221
ESTIMATED FUEL COST
Total VRA LCO - Cost @ US$ 70/bbl MMUS$ - 19.83 21.96 - - - - - - - - - 42
Total VRA WAGP Gas - Cost @ US$ 8.45/mmbtu MMUS$ 5.38 5.17 5.38 5.53 5.38 5.53 5.38 5.72 5.21 5.72 5.21 5.72 65
Total VRA GHANA Gas - Cost @ US$ 7.6/mmbtu MMUS$ 16.03 1.26 3.42 15.37 17.74 17.17 23.33 23.33 22.57 17.25 16.69 23.33 197
Total VRA Fuel Cost MMUS$ 21.41 26.26 30.76 20.90 23.12 22.70 28.71 29.05 27.78 22.97 21.90 29.05 305
IPP Fuel Cost
Total IPP LCO - Cost @ US$ 70/bbl MMUS$ - - 10.72 15.63 15.72 17.63 18.22 18.22 17.63 18.22 17.63 18.22 168
Total IPP WAGP Gas - Cost @ US$ 8.45/mmbtu MMUS$ 9.29 13.39 9.29 9.29 9.29 9.29 9.29 9.29 9.29 9.29 9.29 9.29 116
Total IPP GHANA Gas - Cost @ US$ 7.6/mmbtu MMUS$ 7.07 - 4.35 3.78 5.86 5.67 15.63 17.40 16.08 24.39 23.70 20.78 145
Total IPP HFO - Cost @ US$ 405/MT MMUS$ 30.20 36.14 27.96 32.58 24.63 17.94 1.74 1.74 1.68 1.74 5.92 1.74 184
Total IPP Fuel Cost MMUS$ 46.56 49.53 52.32 61.28 55.50 50.53 44.89 46.65 44.68 53.64 56.54 50.03 612
Total Cost MMUS$ 67.97 75.79 83.08 82.18 78.62 73.24 73.60 75.70 72.46 76.61 78.44 79.08 917

42 2018 Electricity Supply Plan
4.9 Estimates of Fuel Cost
The breakdown of the estimated cost of fuel for running all the Thermal Plants in 2018 is
presented in the Table 22 below. Based on the assumed unit prices, the total estimated fuel
cost for the Thermal Plants is US$ 1 Billion. This translates into an approximate monthly
average of US$ 83.40 Million.
This total cost comprises US$ 336 Million or approximately US$ 28.02 Million per month for the
VRA Plants and US$ 665 Million or monthly average of US$ 55.38 Million for the Non-VRA
Plants.
Table 22: Breakdown of Estimated Fuel Cost for 2018
Type of Fuel Cost (Million USD)
VRA - LCO 42
VRA - GAS 263
VRA - DFO 32
TOTAL VRA FUEL COST 336
IPP - LCO 168
IPP - GAS 260
IPP - HFO 184
IPP - DFO 52
TOTAL IPP FUEL COST 665
TOTAL VRA & IPP COST 1,001

43 2018 Electricity Supply Plan
5 TRANSMISSION SYSTEM PERFORMANCE
5.1 Status of Ghana Transmission Grid
In Ghana, the transmission of electricity is done at three main voltage levels, namely; 161 kV,
69 kV network and 330 kV. There is also a 225 kV voltage level transmission but this is only
through an interconnection with Ghana’s western neighbour Cote d’Ivoire. A similar
interconnection with Togo is through two 161 kV lines.
The Ghana transmission network consists approximately of 5,283.8 circuit kilometres of high
voltage transmission lines which connect generating plants at Akosombo, Kpong, Tema, Bui
and Aboadze to sixty (60) Bulk Supply Points across the nation.
The network has 127 transformers installed at various load centres across the country with a
Total Transformation Capacity of 5,609.9 MVA.
The NITS has 600 MVArs of fixed shunts installed at various Substations including Achimota,
Mallam, Smelter, Winneba, Takoradi, Kumasi etc. and a 40 MVAr Static Synchronous
Compensator (STATCOM) installed at the Tamale substation. The fixed shunts and the
STATCOM complement the generating units in providing the reactive power requirements of
the NITS, in order to maintain good voltages and minimize overall transmission losses.
The System Control Centre (SCC) in Tema is responsible for the real time dispatch (monitoring,
coordination and control) of the Ghana Power System as well as cross-border power
exchanges with neighboring countries. SCC is equipped with a Network Manager System
(NMS), which is the main tool used to monitor and control dispatch operations on the Ghana
Power System.
5.2 Transmission Line, Feeder and Substation Availability
The criteria for transmission Line, Feeder and Substation availability are as presented below;
All existing transmission lines are expected to be in service to ensure transmission of
electricity from the generation stations to the Bulk Supply Points across the nation and
to enable the execution of power exchanges with neighboring countries.
Maintenance work on transmission lines and substations is not to significantly affect
power supply to customers except for single transformer substations and consumers
served on radial lines.

44 2018 Electricity Supply Plan
5.3 Steady State Network Analysis
Steady state network analyses are carried out to determine transmission line loadings,
substation bus voltages and network loss levels across the transmission network. In particular,
the analyses seek to determine:
Transmission line constraints to the evacuation of power from the generating stations to
the Bulk Supply Points;
The ability of the entire power system to withstand an N-1 contingency (i.e. forced
outage of a single network element) e.g. transmission line, generator, transformer, etc;
Reactive power demand on the NITS and the level of VAr generation from the
generating units;
Adequacy of reactive power compensation in the transmission network in achieving
acceptable system voltages;
Network voltage stability;
Overall transmission system losses during peak and off-peak periods;
The impact of locational imbalance in generation resources.
5.3.1 Technical Adequacy Criteria
The following criteria were used to assess the performance of the system under both normal
and contingency conditions.
a. Normal Condition
Table 23: Criteria, normal condition
Parameter Range
Bus Voltages 0.95 pu to 1.05 pu
Transmission Line Power flows not exceeding 0.85 pu
Transformers Not exceeding 1.00 pu (nameplate rating)
Generators Not exceeding their Capability Curve
b. Contingency Conditions
Table 24: Criteria, contingency condition
Parameter Range
Bus Voltages 0.90 pu to 1.10 pu
Transmission Line Power flows not exceeding 1.00 pu
Transformers Not exceeding 1.20 pu
Generators Not exceeding their Capability Curve

45 2018 Electricity Supply Plan
c. Technical Analysis
Load Flow analyses were carried out to determine the transfer capability and assess the level
of reliability of the transmission network to evacuate power from the generation centres to the
various Bulk Supply Points across the network. Loadings on transmission lines and other
power equipment were monitored to determine whether there any limit violations. Also overall
transmission system losses were also recorded.
d. Assumptions and Development of a Base Case
The study was carried out on the 2018 network model as highlighted in Section 3 of this report.
e. Generation Additions
The 350 MW Cenpower power plant is expected to come on line during the end of second
quarter 2018.
f. Transmission Additions
The following transmission system reinforcements are expected to be commissioned into
service in 2018 and thus modeled in the load flow case:
Transmission Lines
New 330 kV, Kumasi – Kintampo –Tamale – Bolga II.
225 kV Bolga II-Ouagadougou (Paga) transmission line.
Asawinso – Juabeso - Mim 161 kV transmission line Project.
330 kV, Double Circuit Aboadze - Dunkwa Transmission line Project.
330 kV, Prestea –Kumasi ( K2BSP) transmission line Project.
Upgrade of 161 kV, Volta –A3BSP – Mallam –Achmota Lines.
161kV, AKSA – Smelter transmission line Project.
Substations
A4BSP 330kV (Pokuase).
Accra Central GIS Station.
5.3.2 Summary of Results for the Steady State Network Analysis
a. Transmission Losses: The results of the analysis consider the following scenarios:
Base Case without exports
50MW exports to SONABEL, Burkina Faso in the first half of 2018
100MW exports to SONABEL, Burkina Faso from the second half of 2018
when the 330 kV line from Kumasi through Kintampo and Tamale to
Bolgatanga is commissioned.

46 2018 Electricity Supply Plan
The results of the load flow simulations indicate average transmission losses of 4.7% of
system generation for the Base Case when there is no exports. The losses increase to
5.8% when there is an export of 50 MW to SONABEL. The increase in losses can be
attributed to the relatively low 161 kV transmission network capacity in the north and the
lack of adequate reactive power support.
When the 330 kV line is commissioned and there is an export of 100 MW to Burkina
Faso, the transmission losses reduce significantly to 2.9%. This clearly indicates the
positive impact of the 330 kV line on system losses.
b. Voltage Violations: For the first half of 2018 when 50 MW is being exported to Burkina
Faso, the results of the load flow analysis show voltage violations in Kumasi (148 kV)
and its surroundings. This could be attributed to the exports, poor customer-end power
factors and inadequate reactive power compensation. It has been identified that poor
voltages in Kumasi and its environs due to inadequate dynamic voltage support
capabilities contribute significantly to higher system losses.
The analyses indicated a significant improvement in system voltages in Kumasi (i.e.
from 148 kV to 163 kV) with the commissioning of the 330 kV transmission expansion
projects.
c. High Generation in the Eastern: With 1,944 MW of generation connected on the
eastern part of the NITS (i.e. Tema, Akosombo and Akuse generation enclaves), the
load flow analyses show overloads of 103% on the Volta–Achimota transmission
corridor. This results in significant increases in transmission system losses.
Furthermore, a contingency on any of the lines in the corridor results in overloads of up
to 133% on adjacent circuits and could lead to the cascaded tripping of lines in the
corridor. This situation is expected to worsen with the coming into operation of the 350
MW Cenpower Plant in the second quarter of 2018.
d. High Western Generation and overload on Takoradi-Tarkwa-Prestea Corridor: The
maximum western generation currently is 860 MW made up of TAPCo, TICo and Ameri
Power Plants all located in the Aboadze Generation Enclave.
The power flow simulation shows that the existing transmission infrastructure in the
corridor is capable of evacuating the projected generation under normal system
conditions. However, a contingency on any of the outgoing lines (i.e. the Takoradi-
Tarkwa and Tarkwa–Prestea lines) results in overloads on adjacent lines. It also results
in low voltages in the Western corridor. However, with the 330 kV Aboadze – Kumasi

47 2018 Electricity Supply Plan
circuit and the A4BSP Substation in service (second half of 2018), evacuation capacity
and overall system reliability increases. In this case, a single contingency does not lead
to overloads on adjacent circuits.
e. Evacuation of Asogli Phase II: The coming into service of the 330 kV Aboadze –
Kumasi lines reduces the loadings on the 330 /161 kV auto transformers at Volta. This is
expected to allow for the full evacuation of the 360 MW Asogli Phase II.
f. System Stability Requirements: To ensure stability of the NITS in normal operating
conditions, the following minimum locational generation requirements are to be met at
all times:
300 MW power generation from Aboadze, and
Three (3) units at Akosombo GS
Two (2) Bui (at peak when there are exports to Sonabel)
5.4 Impact of Transmission Network Expansion Projects – Second half of 2018
There are a number of transmission expansion projects currently ongoing which are expected
to be commissioned into service during the second half of 2018. The projects are listed below:
Volta – Achimota – Mallam Transmission Line Upgrade Project: Upgrading of
transmission lines in the Volta – Achimota corridor from 213 MVA to a 488 MVA, twin
Tern ACSR 2x430 mm2 line. This would increase the evacuation capacity from Tema
generation hub to the load centre of Accra. This is necessary to ensure the evacuation
of generation from the new thermal power plants in Tema, namely Karpower (225 MW),
Sunon-Asogli Phase II (360 MW) and the Kpone Thermal Power Plant (KTPP - 200
MW). The Project would increase transfer capacity to Accra Central GIS station to
enable the injection of high voltage power close to the central business district of Accra.
This would also significantly reduce system losses.
Aboadze – Prestea - Kumasi 330 kV Transmission Line Project: This would improve
upon bus voltages in Kumasi and adjacent substations and consequently reduce overall
system losses. The project would allow for increase in power export capacity to
Northern region as well as Burkina Faso.
Kumasi – Bolgatanga 330 kV transmission line Project: The project would primarily
allow for the export of up to 150 MW of power to Burkina Faso. It would also improve
upon the supply capacity and reliability to the northern region of Ghana.

48 2018 Electricity Supply Plan
Construction of A4BSP 330 kV substation at Pokuase This would increase the
reliability of supply to Accra and increase transfer capacity between the generation hub
of Aboadze and Tema to the load Centre at Accra. It would also allow for the reliable
evacuation of the 360 MW Sunon Asogli Phase II Plant.
Construction of 3x125 MVA GIS station at Accra Central: The station would supply
Power to the Central Business District of Accra to meet its growing demand and also
clear the overload on the Achimota and Mallam stations which supply power above the
station’s firm capacity.
Construction of 2x66 MVA Bulk Supply Point at Afienya: The project is expected to
improve upon supply reliability to Ghana Water Company’s pumping station at Dodowa.
It would also reduce the loading on the New Tema substation and increase supply
reliability to Afienya and its environs.
5.5 Load Flow Analyses for Second Half 2018
The load flow analyses seek to analyze the impact the commissioning of the above ongoing
project would have on the NITS.
a. Transmission Losses.
The results show significant reduction in transmission system losses from an average of
143.6 MW representing 5.8% of generation to 73.1 MW or 2.9% of scheduled generation.
b. Bus Voltages
Bus voltage across the network improved significantly, no violation is recorded even with
increase 100 MW export to Burkina Faso. Table 25 compares critical bus voltages before and
after the commissioning of the network expansion projects.
Table 25: Bus Voltage showing voltages for first and second half of 2018
Bus No. Base kV Simulated kV
Q1-Q2 2018 Q3-Q4 2018
ACHIMOTA 161 155.54 161.95
DUNKWA 161 149.98 162.3
OBUASI 161 150.36 162.99
KUMASI 161 148.09 163.24
ASAWINSO 161 147.29 160.97
NEW OBUASI 161 149.98 162.92
MALLAM 161 152.98 159.61
ANWOMASO 161 147.30 164.59
KADJEBI 69 66.61 69.00

49 2018 Electricity Supply Plan
c. Transmission line loadings
The overload situation on the Volta – Achimota transmission lines corridor is eliminated. The
loading on the 330/161 kV auto transformers at Volta is significantly reduced due to the
consumption of power directly on the 330 kV system at Pokuase (A4BSP). The relief on the
auto transformers makes it possible to evacuate the entire 360 MW SAPP Phase II Plant.
d. Contingency Analyses
Loss of 330 kV Volta –Aboadze Line
An outage on the 330 kV Volta –Aboadze line results in overloads on the 330/161 kV auto
transformers at Volta, however with the Pokuase (A4BSP) station in service the overload
situation clears.
Loss of 330 kV Tamale – Bolgatanga transmission line
The loss of 330 kV Tamale – Bolgatanga II transmission line with an export of 100MW to
Burkina Faso results in the non-convergence of the load flow case due to voltage collapse.
Export has to be reduced to 60 MW to stabilize the grid.
Loss of 161kV Aboadze –Tarkwa transmission line
Under a high generation from the west, the loss of the Aboadze –Tarkwa line results in an
overload on the Takoradi – Tarkwa line (102%) and a high loading on the 330/161 kV Auto
transformers (92%).
e. Radial Lines and Single Transformer Stations
The following lines in the NITS are presently radial and therefore the customers served by
these lines suffer complete blackout anytime the lines are out-of-service. For the single
transformer stations, customers served by these transformers also suffer complete blackout
anytime they go out-of-service. The single transformer stations are as indicated in the Table
below.
Radial Lines
161 kV Takoradi – Esiama Line
161 kV Bogoso – Akyempim Line
161 kV Bolgatanga – Zebilla – Bawku Line
161 kV Tamale –Yendi Line
69 kV Asiekpe – Sogakope Line

50 2018 Electricity Supply Plan
69 kV Asiekpe – Ho – Kpeve – Kpandu Kadjebi Line
Single Transformer Stations
Sogakope
Yendi
Esiama
Dunkwa
Konongo
Ayanfuri
Obotan
Mim
Buipe
5.6 Dynamic Simulations
To determine the stability of the grid under various contingency conditions, dynamic
simulations are performed on the contingencies. To assess the impact of the 330 kV Kumasi –
Kintampo – Tamale – Bolgatanga line on system stability, the simulations were first performed
without and with the 330 kV backbone.
The stability simulations are performed for various likely network contingencies on the grid to
observe the impact on the grid and to give an indication of the robustness and stability of the
grid. The contingencies considered include;
i. Loss of an Akosombo unit for the first and second halves of the year
ii. A three phase fault on one of the Achimota-Accra East lines cleared after 6 cycles by
tripping of the same line in both study scenarios.
iii. A three phase fault on the coastal 330kV line which is cleared by tripping of the line after
six cycles in both cases.

51 2018 Electricity Supply Plan
Loss of an Akosombo unit
Frequency Plots
The loss of one Akosombo unit results in a reduction in system frequency which decays and
settles at 49.65 Hz. This does not result in any underfrequency relay trippings. The Plot is as
shown in the figure below. The rotor angle plots also show that the resulting oscillations are
well-damped.
Figure 12: Case 1 – Frequency plot for loss of an Akosombo unit
Three phase fault on one of the Achimota - Accra East lines
A three phase fault on one of the 161kV Achimota-Accra East lines was simulated and the
impact monitored on the machine relative rotor angles and the machine speeds. This fault was
cleared after 6 cycles (120ms). The fault caused an instant increase in the speeds of all
connected machines with the Akosombo and Bui hydro units registering the greatest speed
deviation due to their sizes. The Akosombo machines registered higher speed deviations than
Bui due to their proximity to the fault. The deviation in speed continued for more than 15s after
fault clearing before settling at speeds lower than the initial speed.
The relative rotor angles plots showed poorly damped oscillations with wider amplitudes. It is
noted that the fault occurred in an area of the grid with a lot of generators, heavily loaded lines
and higher power demands.

52 2018 Electricity Supply Plan
Figure 13: Case 1 – Speed deviation of machines on the grid for 161kV three phase fault
Figure 14: Case 1 – Relative rotor angles of machines on the grid for 161kV three phase fault

53 2018 Electricity Supply Plan
Three phase fault on the 330kV coastal line from Aboadze to Volta
Simulation of a three phase fault on the 330kV Aboadze-Volta line cleared after 6 cycles
showed a variation in the rotor angles of the machines with adequate damping and a stable
operating power system. The impact of the loss of this lightly loaded line does not result in any
instability as seen in the relative angle and speed plots below.
Figure 15: Case 1 – Relative rotor angles of machines on the grid for 330kV three phase fault
Figure 16: Case 1 – Speed of machines on the grid for 330kV three phase fault

54 2018 Electricity Supply Plan
CASE 2: SIMULATIONS FOR SECOND HALF OF THE YEAR
The above simulations were repeated with the 330kV lines in service and an export of 100 MW
to SONABEL, in Burkina Faso.
Loss of an Akosombo unit
Just as simulated in case 1, the Akosombo unit is switched out of service and the impact on
the grid frequency and machine rotor angles is monitored.
Frequency Plots
The plot below shows an improvement in frequency performnce from 49.65 Hz to 49.68 Hz
(higher than in case 1).
Figure 17: Case 2 – Frequency plot for loss of an Akosombo unit
The plot for the rotor angle also shows well-damped oscillations.

55 2018 Electricity Supply Plan
Figure 18: Case 2 – Relative rotor angle plots for loss of an Akosombo unit
Three phase fault on one of the Achimota-Accra East lines
Compared to the previous Case, this case shows a significant reduction in the oscillations.
The amplitudes of the oscillations are also smaller as compared to the case 1 attributable to
the strengthening of the grid by the 330kV backbone.
Figure 19: Case 2 – Speed deviation of machines on the grid for 161kV three phase fault
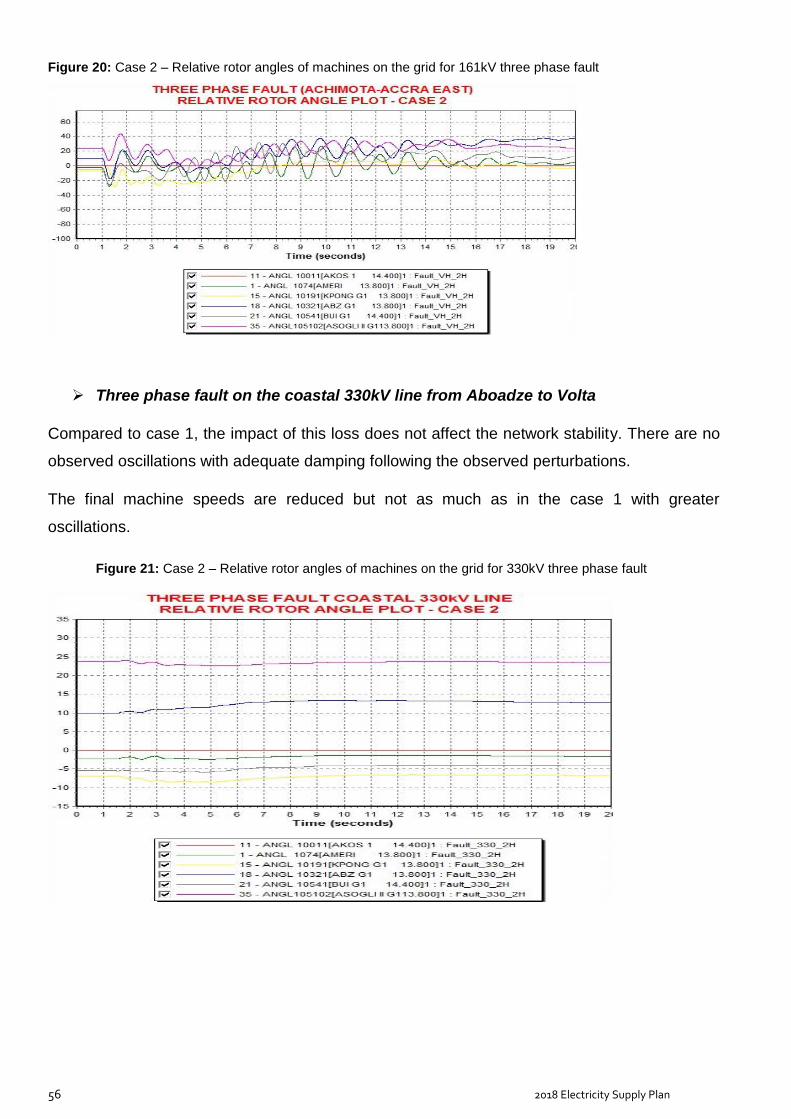
56 2018 Electricity Supply Plan
Figure 20: Case 2 – Relative rotor angles of machines on the grid for 161kV three phase fault
Three phase fault on the coastal 330kV line from Aboadze to Volta
Compared to case 1, the impact of this loss does not affect the network stability. There are no
observed oscillations with adequate damping following the observed perturbations.
The final machine speeds are reduced but not as much as in the case 1 with greater
oscillations.
Figure 21: Case 2 – Relative rotor angles of machines on the grid for 330kV three phase fault

57 2018 Electricity Supply Plan
Figure 22: Case 2 – Speed deviation of machines for a 330kV three phase fault
Three phase fault on the coastal 330kV line from Kintampo to Tamale
With an export of 100 MW of power to SONABEL, a contigency on the 330kV line from
Kintampo to Tamale was performed. A three phase fault was simulated on this line and cleared
after 6 cycles. The impact of the loss was greatly seen in the wider amplitude of oscillation
observed on the Bui hydro machine. There is however adequate damping which brings the
network conditions to normalcy.
Figure 23: Case 2 – Relative rotor angles for a 330kV three phase fault in the north
The machine speed deviation plots below show the fluctuations which settle after a few
seconds but at a reduced speed. There are no observed oscillations and the network
conditions appear stable.

58 2018 Electricity Supply Plan
Figure 24: Case 2 – Speed deviation of machines for a 330kV three phase fault in the north

59 2018 Electricity Supply Plan
6 POTENTIAL SUPPLY CHALLENGES IN 2017
Due to the low inflow into the Akosombo and Bui hydro dams in 2017 and the consequent low
reservoir elevations, some supply challenges could be experienced in 2018 if adequate fuel
supply arrangements are not made in February and March when major works are planned on
the domestic gas delivery systems.
6.1 Managing the Hydro Risk
With the current low head water levels in Akosombo and Bui dams, it will be prudent to
continue the conservative dispatch of the hydro plants to ensure that the reservoirs are not
drawn down below their minimum operating levels to guarantee sustainable operations in the
coming years.
6.2 Thermal Fuel Supply Risk
Gas supply inadequacy remains one of the major risks to reliable electricity supply in Ghana.
Although, installed generating capacity is high, inadequacy and/or unavailability of fuel to run
the thermal units has rendered some thermal plants inoperable.
The Ghana National Gas Company Ltd. and the Tullow Ghana Ltd. have scheduled to carryout
planned works between February and July, 2018 as follows:
February 1 – 21, 2018
Ghana National Gas Company and ENI Ghana
Tie-in of OCTP Sankofa Gas Pipeline to Ghana’s National Gas Transmission System (NGTS) at Sanzule;
Tie-in of NGTS with the West African Gas Pipeline system at Aboadze;
Tullow Ghana Ltd.
Preparation for turret remediation works on Jubilee FPSO.
A 19-day outage in March 2018
Tullow Ghana Ltd.
Turret remediation works
To forestall fuel supply deficits and possible electricity supply disruptions to consumers during
these maintenance periods, there is the need to make advanced arrangements for adequate
LCO storage at both Tema and Takoradi
For the two major maintenance periods in February and March, the estimated fuel quantity and
cost are as presented below:

60 2018 Electricity Supply Plan
Table 26: Bus Voltage showing voltages for first and second half of 2018
Month Qty of LCO (bbl) Total LCO - Cost @ US$ 70/bbl (MUSD)
February 849,945.00 59.5
March 941,011.20 65.9
It is also noted from the 2018 supply scenario and probably for subsequent years that the
share of hydro supply has been dwindling with much of the supply coming from thermal plants
which are predominantly gas-based. The danger this portends is that, any major disruptions in
gas supply, could throw the country into major power crisis. It is therefore imperative that the
Companies in the Gas Supply Chain, Tullow, ENI, GNPC, Ghana Gas, BOST and others
collaborate strongly with the power supply companies to ensure effective planning and
coordination.
6.3 Supply Reliability
6.3.1 Radial lines
Currently, supply reliability to customers served via single circuit radial lines is quite low. This is
because an outage on such single circuit radial lines interrupts supply to such customers. The
following are some of the single circuit radial lines on the NITS:
Tamale – Yendi line;
Takoradi – Esiama line;
Dunkwa – Asawinso;
Bogoso – Akyempim line;
Bolga - Zebilla line;
Zebila – Bawku line, etc.
Supply reliability to customers served on these lines would improve in future when such lines
are upgraded through construction of additional line(s) or by looping them into other adjoining
substations.
6.3.2 Single Transformer Stations
Similar to single circuit radial lines, consumers supplied by single transformer substations also
suffer low level of supply reliability. Consumers facing such challenges are those in Akosombo
Township, VRA Township at Akuse, Yendi, Sogakope, Esiama etc. since these townships are
supplied via single transformer stations.

61 2018 Electricity Supply Plan
Maintenance and/or upgrade works at these stations are often a challenge due to difficulties in
securing outages to carry out planned maintenance works.
6.4 Power Evacuation
There are also transmission capacity constraints in some portions of the network which could
lead to transmission line overloads;
Insufficient reactive power compensation could lead to poor customer supply voltage
in areas such as Kumasi, Accra and some parts of the Western region;
Some sections of the NITS do not satisfy the ‘N-1 criteria’ and will be unable to
withstand some single line/transformer contingencies;

62 2018 Electricity Supply Plan
7 DISTRIBUTION OUTLOOK
7.1 ECG Network Reliability Assessment
Reliability of supply within the sub – transmission and distribution network has been a major
concern recently. Accordingly, reliability studies were carried out within the ECG network,
focusing on the following operational areas: Accra, Tema, Kumasi and Takoradi. These ECG
operational regions accounted for 79.56 % of ECG’s total demand recorded in 2017.
7.1.1 Constraints Identified in the 2018 ECG Reliability Study for Selected Areas
ECG, performs three separate analyses to assess the reliability of the sub-transmission
system. (See Figure 2.5). First, a Total Transfer Capability (TTC) analysis is carried out to
determine the adequacy of uninterruptible sub-transmission capacity to deliver power to the
primary substations. The TTC analysis is also used to assess if interruptible sub-transmission
capacity will be required to meet any portion of the demand and/or if any demand will be unmet
due to inadequate sub-transmission transfer capability.
Figure 25: Aspects of Sub-Transmission System Reliability Analysis
A power flow analysis is then performed to determine voltages at all substations and identify if
ECG’s reliability criteria are met at each primary substation. As a general rule, if substation
voltages deviate significantly from their nominal levels, they can cause instability, and
eventually lead to a blackout. Voltage deviations can also damage or destroy customer
equipment, and low voltages significantly reduce the ability to transfer power within the sub-
transmission network. ECG’s reliability criteria require substation voltages at 33 kV to be
regulated within a ± 9.10 % tolerance band of their nominal ratings. Therefore, the power flow
analysis determines if any substation voltages are outside the tolerance band.
Finally, the adequacy of transformer capacity is assessed at each of the primary substations to
support connected peak load. At each primary substation, one or more transformers step down
voltage from the 33 kV sub-transmission level to 11 kV for the distribution network. Adequate

63 2018 Electricity Supply Plan
transformer capacity is important for the reliable operation of the distribution system. ECG
reliability criteria specify the loading of transformers under normal operating conditions to 70%
of their name plate capacity, therefore under normal operating conditions a transformer loaded
at 70% of its rating is considered fully loaded. Under contingency or emergency conditions,
transformer loading up to 120% of the nameplate capacity is permissible, but for short
duration only until operators can restore the system to normal conditions. These reliability
criteria are then used to assess transformer loading at the primary substations.
The sub – transmission reliability analysis have been performed for the four (4no.) major load
centers – Accra, Kumasi, Tema and Takoradi to identify constraints of low voltages, overloads
on transformers and sub-transmission lines during firm and non – firm assessment for which
projects are currently underway to mitigate them.
7.1.2 Sub-Transmission and Distribution Constraints
Although there have been some investments in the Sub-transmission network, the reliability
assessment of the network according to ECG shows that these investments are either delayed
or will not be enough to ensure uninterruptible sub-transmission service to all and to assure
reliable supply at areas identified in this study as not meeting the ECG’s Service Standard
under N-1 contingency.
To improve upon the existing reliability performance of these areas, a number of interventions
and ongoing projects that have either been just completed or expected to be completed within
the shortest possible time to meet the ECG 2018 projected demand. The details of these
Projects are outlined in Appendix C.
7.2 NEDCo Distribution Network
The Northern Electricity Distribution Company (NEDCo) operates a distribution network that
covers Brong-Ahafo, Northern, Upper East and Upper West Regions. It also extends to
portions of the Ashanti, Volta and Western Regions of Ghana. Some border communities in
Burkina Faso, Togo and Cote d’Ivoire are also supplied by NEDCo. In terms of geographical
Area, NEDCo covers about 64% of the landmass of Ghana.
The energy demand for NEDCo, excluding Cross border energy supply was 1,234.05 GWh in
2017 and this has been projected to reach a value of 1,328.97 GWh by the end of 2018, an
increase of about 7.7 % over the period.
There are however some pertinent constraints in the NEDCo distribution network which require
to be addressed to guarantee reliability and quality of supply to consumers.
64 2018 Electricity Supply Plan
7.2.1 NEDCo Distribution Constraints
NEDCo is faced with capacity and voltage constraints within some sections of its distribution
infrastructure. These constrains constitute the main bottlenecks to electric power delivery in the
NEDCo territory. The main constraints can be classified as below:
Voltage Constraints: Severe voltage drops on heavily loaded and long distribution networks is
a limiting factor to electricity supply within NEDCo as customers are unable to use the national
grid especially during peak hours. Customers result to alternative sources of supply such as
generators during peak periods.
Capacity Constrains: During the extension of electricity to the NEDCo Operational area, the
customer density at the time was very low. This influenced the infrastructure capacity design
decisions for electricity extension. Currently, significant kilometers of underground cables and
conductors are loaded to critical limits thereby impeding the addition of loads to the network.
Reliability constraints: Another limiting factor to electricity supply is reliability constraints as a
result of operating long radial lines and frequent breakdown of obsolete distribution
infrastructure.
Details of the main constraints at bulk supply points, primary substations, sub-transmission as
well as distribution networks are discussed below.
7.2.2 Sub-Transmission and Distribution Lines:
Current status
NEDCo serves a large geographical area mainly by long radial sub-transmission lines and
distribution feeders. Due to the ongoing Self-Help Electrification Project (SHEP), these sub
transmission and distribution lines have been extended beyond their technically acceptable
limits. Feeders from Techiman currently serve Ejura, Atebubu and beyond. Also feeders from
Tamale serve Dalun and beyond as well as Yendi feeders serving Bimbilla, Kete-Krachie and
beyond are some of the examples of such long radial lines.
Actions
The Ghana GRID Company is currently constructing a new 161/35.4kV BSP at Berekum to
improve quality of supply to Berekum and its environs. This project is expected to be
completed in 2018. Also, NEDCo has initiated actions to construct a 20MVA, booster station at
Bimbilla to improve the supply quality to customers along the Bimbilla- Kete-Krachie line. This
project is anticipated to be completed in 2019.
NEDCo is also in dialogue with GRIDCo for the construction of a new BSP at Atebubu in the
Techiman operational area to improve the supply quality to the Yaji-Kwame Danso area which
is about 200km from the current supply source (Techiman BSP).
65 2018 Electricity Supply Plan
NEDCo has over 5,800 distribution transformers in service, some of which are overloaded. In
2018, three hundred and seventy-three (373) distribution transformers are expected to be
upgraded or have additional transformers installed to provide relief to existing customers and to
enable the connection of additional customers. In the same period, about 150km of low voltage
lines are expected to be upgraded.
7.2.3 Primary Substations Constraints
Current status
NEDCo currently has fifteen (15) primary substations including a booster station. All the
primary Substations in NEDCo operational area are single transformer substations which
poses reliability constraints. The 11kV distribution networks within major cities in NEDCo
operational areas like Tamale, Techiman, Sunyani, Bolga and Wa are critically loaded and
have been extended beyond their technically acceptable limits. Also, the Bawku and Navrongo
primary substations have a number of obsolete switchgear.
Actions
NEDCo is embarking on a project which is aimed at replacing these pieces of obsolete
infrastructure. The Contract has already been awarded but this project has delayed due to
funding challenges. The new completion date for his project is December 1, 2018.
Also, NEDCo is in the process of securing funding to Construct 6 no. Primary substations as
follows:
1. 1X10MVA 34.5/11kV substation at Banvim in Tamale
2. 1X10MVA 34.5/11kV substation at Islamic in Tamale
3. 1X10MVA 34.5/11kV substation at Fuo in Tamale
4. 1X10MVA 34.5/11kV substation at Fiapre in Sunyani
5. 1X10MVA 34.5/11kV substation at Abesim in Sunyani
1X10MVA 34.5/11kV substation at Amangoase in Berekum (Sunyani)
66 2018 Electricity Supply Plan
8 OVERVIEW OF MEDIUM-TERM SUPPLY: 2018 - 2022
In this chapter, we present medium-term (2019 - 2023) peak demand and energy consumption
forecast to serve as a guide for power system investment planning. Typically, it takes an
average of four years for power plant projects to transition from conception through funding
arrangements, detail design, construction to commissioning and commencement of
commercial operation. This section therefore provides an outlook for generation and
transmission system requirements for the next five years (2019 – 2023) to enable adequate
and timely measures to be put in place to ensure security of supply in the Ghana Power
System over the medium term.
In the past, lack or delays in the implementation of Energy Supply Plan recommendations for
generation expansion projects to match forecast growth in demand have culminated in energy
crises in the country, which have had adverse impact on economic growth of the country.
8.1 Demand Outlook
Projected demand for electricity over the period is based on GRIDCo’s 2018 - 2027 load
forecast study. It covers natural growth in domestic demand over the period and some Spot
Loads. The expected spot loads for the period are as follows:
VALCO demand is expected to increase from 2 pot-lines in 2018 and 2019 to 3 pot-lines
in 2020 and the entire 5 pot-line operation is assumed from 2021 onwards;
Mines:
o Newmont Mines, Ahafo - demand is expected to increase by 10 MW in 2019 and
an additional 12.5 MW in 2020.
o Azuma Mines - 23 MW by 2020 at Yagha (50km North West of Wa);
Potential Exports:
o Burkina Faso is expected to be at 150 MW by 2019;
o Mali is expected to be at 50 MW by 2021, increasing to 100 MW by 2024
Total electricity consumption of the Ghana power system including power exports to Togo,
Benin, Burkina Faso and Mali (from 2019) is projected to increase from 19,486 GWh in 2019 to
25,680 GWh in 2023 at a Compound Annual Growth Rate (CAGR) of approximately 7.1 %.
The system peak demand is projected to increase from 2,980 MW in 2019 to 3,919 MW in
2023.
The details of the projected demand for 2019 to 2023 are illustrated in Tables 26 and 27.

67 2018 Electricity Supply Plan
Table 27: Projected Energy Demand (GWh) (2019- 2023)
2019 2020 2021 2022 2023
Domestic 14,623 15,531 16,396 17,396 18,425
VALCO 2,909 3,881 4,845 4,845 4,845
Exports 1,235 1,235 1,580 1,580 1,580
Transmission Losses +Network Usage 719 773 727 777 831
TOTAL 19,486 21,420 23,548 24,598 25,680
Table 28: Projected Peak Demand (MW) (2019- 2023)
2019 2020 2021 2022 2023
Domestic 2,366 2,511 2,674 2,837 3,005
VALCO 332 443 553 553 553
Exports 183 183 233 233 233
Transmission Losses +Network Usage 100 108 116 122 127
TOTAL 2,980 3,245 3,576 3,745 3,919
8.2 Projected Supply Outlook
The power supply outlook was prepared considering the existing and committed generation
capacity additions. The assessment of generation adequacy is based on ensuring that
sufficient generation resources are available to meet the forecast demand plus a 25% required
capacity reserve margin.
8.3 Existing Generation
The existing power supply facilities are made up of hydro, thermal and renewable energy
sources as shown in Chapter 4. A detailed breakdown of projected demand versus expected
supply from the existing generation resources is as shown in table 35.
The following assumptions were made for Hydro Power Generation:
Akosombo & Kpong GS. Provision was made for the recovery of the Akosombo
reservoir. A maximum of four (4) units were assumed over the period 2018 - 2020, five (5)
units in 2021. From 2022 onwards, all the six (6) units are expected to be available to
support peak demand. Akosombo & Kpong are assumed to generate a total of 4,200 GWh
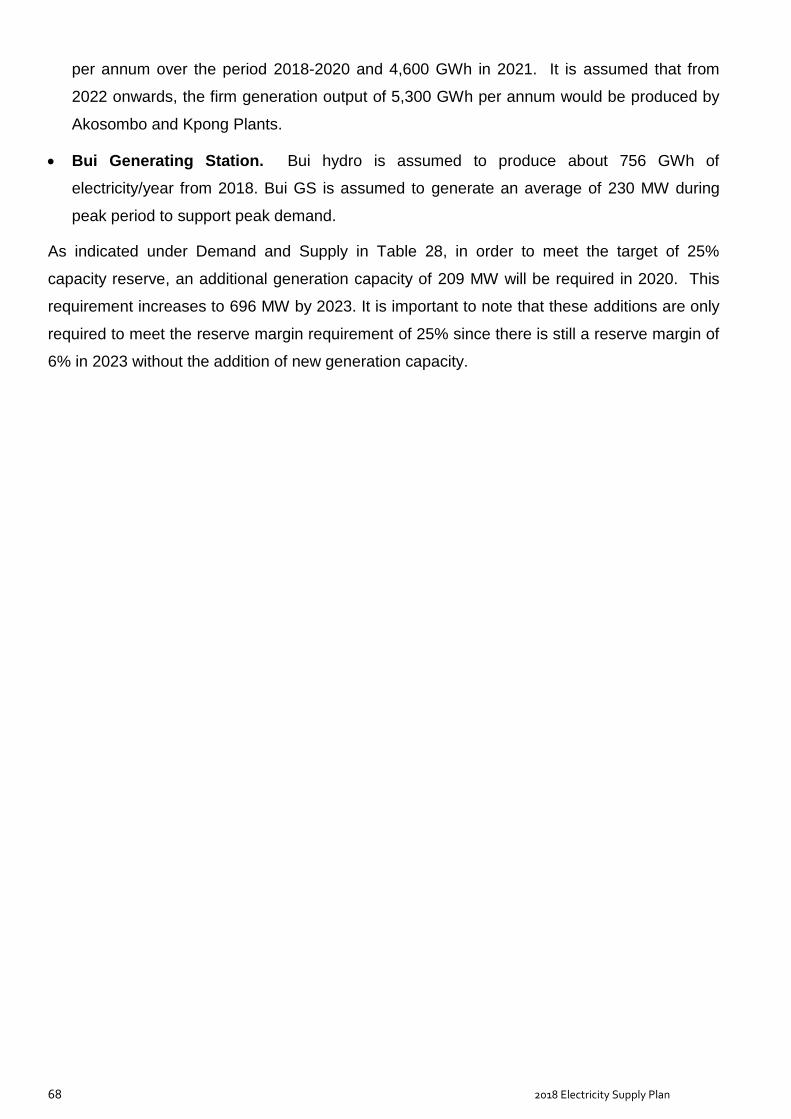
68 2018 Electricity Supply Plan
per annum over the period 2018-2020 and 4,600 GWh in 2021. It is assumed that from
2022 onwards, the firm generation output of 5,300 GWh per annum would be produced by
Akosombo and Kpong Plants.
Bui Generating Station. Bui hydro is assumed to produce about 756 GWh of
electricity/year from 2018. Bui GS is assumed to generate an average of 230 MW during
peak period to support peak demand.
As indicated under Demand and Supply in Table 28, in order to meet the target of 25%
capacity reserve, an additional generation capacity of 209 MW will be required in 2020. This
requirement increases to 696 MW by 2023. It is important to note that these additions are only
required to meet the reserve margin requirement of 25% since there is still a reserve margin of
6% in 2023 without the addition of new generation capacity.

69 2018 Electricity Supply Plan
Table 29: Projected Demand Versus Supply (existing) balance (2019- 2023)
2019 2020 2021 2022 2023CAPACITY DEMAND(MW)
Domestic 2,366 2,511 2,674 2,837 3,005
VALCO 332 443 553 553 553
Export 183 183 233 233 233
Transmission Losses +Network Usage 100 108 116 122 127
TOTAL PROJECTED DEMAND 2,980 3,245 3,576 3,745 3,919
TOTAL PROJECTED DEMAND+25% Reserve 3,725 4,056 4,470 4,681 4,898
CAPACITY SUPPLY (MW)
Hydro
Akosombo 600 600 750 900 900
Kpong 105 105 140 140 140
Bui Hydro Plant 230 230 230 230 230
Total Existing Hydro 935 935 1,120 1,270 1,270
Thermal
Existing Generation
T1 300 300 150 150 320
T2 320 320 320 320 320
Takoradi 3 (T3) - - - - -
TT1PP 100 100 100 100 100
CENIT 100 100 100 100 100
200 MW Sunon-Asogli (Phase 1) 180 180 180 180 180
TT2PP 70 70 70 70 70
KTPP 200 200 200 200 200
VRA Solar Power Plant Project-Phase 1 2.5 2.5 2.5 2.5 2.5
AMERI 230 230 230 230 230
Karpower 450 450 450 450 450
AKSA 220 220 220 220 220
Sunon-Asogli (Phase 2) 360 360 360 360 360
Cenpower 340 340 340 340 340
BXC Solar 20 20 20 20 20
Meinergy 20 20 20 20 20
Total Existing Non Hydro Generation 2,913 2,913 2,763 2,763 2,933
TOTAL AVAILABLE GENERATION 3,848 3,848 3,883 4,033 4,203
Surplus/Deficit 122 (209) (587) (648) (696)
Reserve Margin Less Solar Plants (%) 28% 17% 7% 7% 6%
Pro
jecte
d D
em
an
d (
MW
)
Projected
Exis
tin
g G
en
era
tio
n
8.4 Committed Generation Projects
The following are the committed generation addition projects expected to come on line in the
medium-term:
AKSA. AKSA is currently operating at 220 MW and will increase to 340 MW
VRA Solar Power Plant. The VRA has secured funding to construct a 12 MWp Solar
power plant in the Upper West Region of Ghana. The plant is expected to be on line by
2019.

70 2018 Electricity Supply Plan
Marinus Energy. This is a 26.5 MW thermal plant to be located at Atuabo in the Western
Region. The plant is expected to come on line by 2019.
Amandi Energy Limited. This is a 192 MW combined-cycle power plant expected to be
commissioned by 2019. The plant will be located in Aboadze.
Early Power. This is a 400 MW power plant to be located at Tema expected to be
commissioned in 2019.
Jacobson Jelco. This is a 360 MW combined-cycle power plant to be located at Aboadze
and expected to be commissioned in 2021.
Rotan Power Limited. This is a 634 MW combined-cycle power plant. 300 MW is expected
to be commissioned in 2023 and the rest of the 334 MW is expected to be commissioned in
2025.
T3. This is a 132 MW combine cycle plant which is currently out of service due to damage
to the gas turbine engines. It is expected that the engines will be refurbished/replaced by
2020.
8.5 Other Potential Generation Projects
A number of other generation projects which are also likely to come on line within the planning
period are presented below. These projects are however not considered in the medium-term
supply scenario because of some uncertainties about the projects.
Bui Solar Power Enclave. Bui Power Authority is collaborating with a number of investors
to develop up to 250 MWp Solar PV. Currently, Feasibility Studies have been completed for
100 MWp of the generation capacity. Further, grid impact study is ongoing to confirm the
capability of the grid to evacuate all the 250 MWp. The first 100 MWp is planned for 2019.
The remaining 150 MW is expected to come on line by 2020.
Upwind Ayitepa Limited. This is a 225 MW wind power project expected to come on line
in 2020. Grid impact study has been completed.
APSD Biomas Project. This is a project that seeks to add 65 MW biomas capacity to the
grid and is located in the Brong Ahafo Region. The project is expected to come on line in
2019.
Eleqtra. This is a 50 MW wind power project expected to come on line in 2020.
The demand and supply balance for the existing and committed generation capacity is shown
in Table 29.
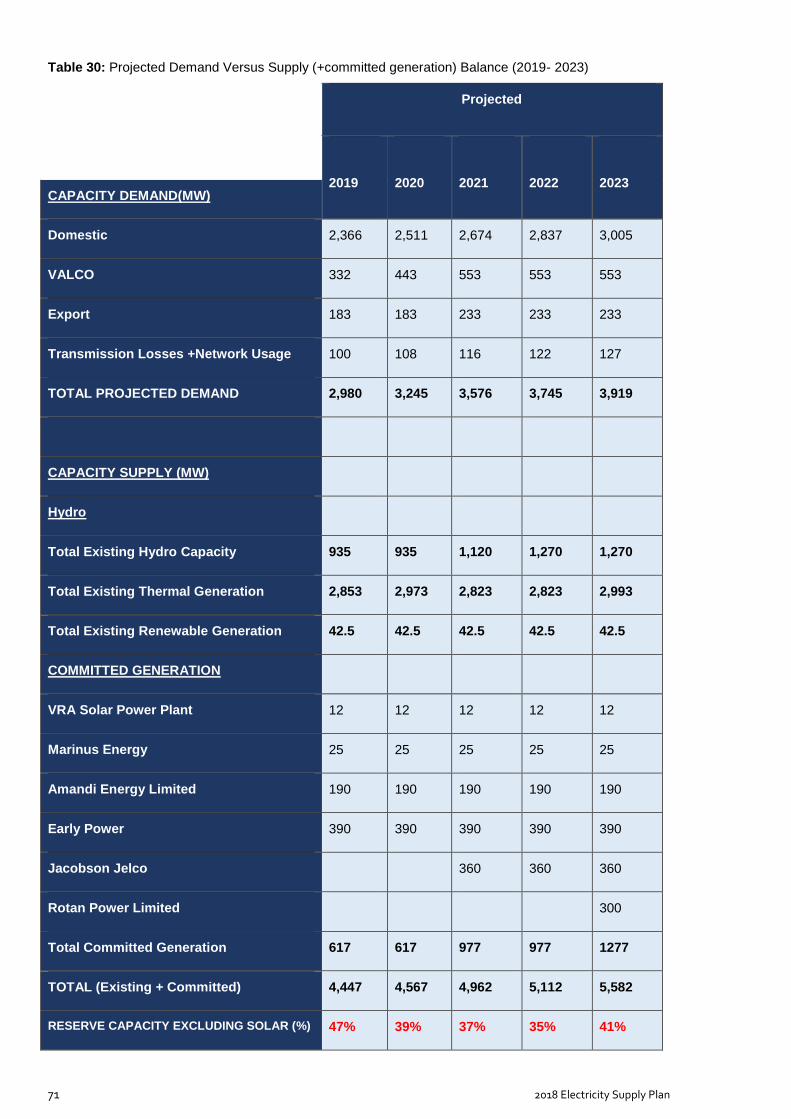
71 2018 Electricity Supply Plan
Table 30: Projected Demand Versus Supply (+committed generation) Balance (2019- 2023)
Projected
2019
2020
2021
2022
2023 CAPACITY DEMAND(MW)
Domestic 2,366 2,511 2,674 2,837 3,005
VALCO 332 443 553 553 553
Export 183 183 233 233 233
Transmission Losses +Network Usage 100 108 116 122 127
TOTAL PROJECTED DEMAND 2,980 3,245 3,576 3,745 3,919
CAPACITY SUPPLY (MW)
Hydro
Total Existing Hydro Capacity 935 935 1,120 1,270 1,270
Total Existing Thermal Generation 2,853 2,973 2,823 2,823 2,993
Total Existing Renewable Generation 42.5 42.5 42.5 42.5 42.5
COMMITTED GENERATION
VRA Solar Power Plant 12 12 12 12 12
Marinus Energy 25 25 25 25 25
Amandi Energy Limited 190 190 190 190 190
Early Power 390 390 390 390 390
Jacobson Jelco 360 360 360
Rotan Power Limited 300
Total Committed Generation 617 617 977 977 1277
TOTAL (Existing + Committed) 4,447 4,567 4,962 5,112 5,582
RESERVE CAPACITY EXCLUDING SOLAR (%) 47% 39% 37% 35% 41%

72 2018 Electricity Supply Plan
8.5.1 Additional Generation Requirement
As seen in Table 35 and Figure 46, with the deployment of the committed generation capacity,
there is adequate generation capacity to meet projected demand. The highest capacity reserve
margin recorded over the period is 47% and the lowest generation capacity reserve margin
expected over the period is 35% (the required reserve margin is 25%). Hence barring any
delays in the realization of these anticipated generation projects, there should be adequate
generation capacity to meet medium-term projected power demand.
Most of the additional thermal generation capacity expected over the period will operate on
natural gas. It is therefore important to ensure that efforts are made to achieve adequacy in
natural gas supply.
Figure 26: Projected Demand Versus Supply balance (2018 - 2023)
8.6 Medium Term Transmission Network Expansion/Upgrade Requirements
The results of the extensive system network analyses carried out using the projected demand
and supply scenario in the Tables above, indicate that there would be the need for the
following transmission equipment additions in the medium term to meet the required supply
reliability indices, and this is in addition to the investment identified under section 5. The
following are the critical transmissions additions required:
Construction of a second 330 kV Prestea - Dunkwa – Kumasi line
Construction of a second 330 kV Aboadze – A4 BSP circuit
Construction of a double circuit 330 kV A4BSP to Kumasi line

73 2018 Electricity Supply Plan
Eastern Transmission Corridor Projects:
161kV Kpando – Juale Line
161kV Juale – Yendi Line
Construction of 330 kV substation at Dunkwa with a link to the existing 161 kV
substation
Construction of a third Bulk Supply Point in Kumasi at 330kV level
8.6.1 Impact of Siting Generation at Western Part of Accra.
Power flow analyses indicate that siting a 200 MW generation in the western part of Accra
(around Winneba) results in a significant improvement in transmission network voltage
reliability. It also reduces congestion on the Volta – Achimota transmission corridor.
Furthermore, total transmission system losses reduce to 95.1 MW (3.96%) of generation from
106 MW (4.4 %).
Tables 30 to 33 show the load flow results.
Table 31: Comparison of system losses- Generation at Winneba and No Generation
No Generation With Generation at Winneba
Losses 106 MW 95.1 MW
Table 32: Comparison of Line Loadings- Generation at Winneba and No Generation
No Generation Generation at Winneba
Volta - Achimota 105 77
Volta - A3BSP 105 80
A3BSP - Achimota 88 62
Mallam -Achimota 93 45
Table 33: Comparison of bus Voltages- Generation at Winneba and No Generation
No Generation Generation at Winneba
Mallam 147.7 153.8
Achimota 151.7 155.7
Winneba 152.2 163.9

74 2018 Electricity Supply Plan
9 CONCLUSIONS
.The following conclusions are drawn in respect of the electricity supply and demand plan for
2018:
9.1 Demand and Supply Outlook
a. 2018 total system demand is projected to be 2,523.49 MW, representing a 15.1 %
growth over the 2017 peak demand of 2,192.15 MW.
b. The projected energy consumption for 2018 is 16,304.79 GWh of which:
Hydro supply will be - 4,956.32 GWh representing 30.4% of the total energy
supply;
Thermal supply will be - 11,305.85 GWh representing 69.34% of total energy
supply; and
Renewables supply will be - 42.64 GWh representing 0.23% of total energy
supply.
c. Total projected energy exports are 671.97GWh for 2018.
d. VALCO is expected to operate on two potlines with projected total consumption of
1,154.19 GWh.
e. There is the need to dispatch Akosombo and Bui Hydro Plants conservatively
throughout 2018 to ensure that the two reservoirs are not drawn down below their
minimum operating levels to guarantee sustainable operations in the coming years
f. In terms of fuel, the following quantities of the various fuel types are required;
LCO - 3,000,000 barrels
Natural Gas - 67,000,000 MMbtu.
HFO - 455,000 MT
Diesel - 100,000 barrels
g. In terms of fuel cost, an annual total of approximately 1.0 billion USD is required,
averaging a monthly total of some US$ 83.40 Million.
h. To ensure stability of the grid in normal operating conditions, the following minimum
generating limits should be observed at all times:
300 MW generation at Aboadze and
Three (3) Units at Akosombo.

75 2018 Electricity Supply Plan
9.2 Requirements for Grid Reinforcement
i. The transmission system has inadequate available transfer capacity to meet the
demand requirements of the major load centres (of Accra, Kumasi, Tarkwa, etc.)
particularly at peak. This situation would result in low voltages, overloading of lines and
increased overall transmission system losses.
j. For radial lines and single transformer stations, significant percentage of network loads
could be islanded in the event of outage of such lines and transformers.
k. In normal operation, there would be congestion on the Volta –Accra East – Achimota -
Mallam transmission corridor especially when there is high generation in the east.
l. Low voltages would be experienced at Kumasi, Accra and surrounding areas due to
poor customer-end power factors.
m. A fair East-West balance in generation provide better system stability and minimal
overall transmission system losses.
9.3 Distribution Systems
n. The Accra Central BSP is expected to be completed within the second quarter of 2018
to increase the level of reliability and meet the growing demand within the ECG network
in Accra. This project will resolve loading constraints currently being realized on
selected 33 kV feeders and reduce technical losses within the ECG Accra network.
o. A number of substations and interconnected circuits currently under construction are
expected to be completed within the first quarter of 2018. These include the Ogbojo 33
kV / 11 kV substation and associated 33 kV lines from GIMPA to Kwabenya 33 kV / 11
kV substations and from Dodowa switching station to Mobole 33 kV bus.
p. NEDCo will continue to experience some challenges in its operational areas. These
include the following overload and low voltage conditions;
Overload on the Shield-Wire transformer at Techiman which serves Abofour and
Nkenkansu in the Ashanti Region has capacity constraints.
Overload on the transformer serving Wa Township and its environs.
Obsolete switchgear at Bawku and Navrongo Distribution Stations.
Low voltages at Ejura, Atebubu, Dalung, Bimbilla, Kete-Krachi due to long radial
distribution lines.

76 2018 Electricity Supply Plan
9.4 Medium Term Supply
With the deployment of the committed generation capacity, there is adequate generation
capacity to meet projected demand. Up to about 47% capacity reserve margin is recorded over
the period (the required reserve margin is 25%). Barring any delays in the realization of these
anticipated generation projects, there should be adequate generation capacity to meet medium-
term projected power demand.
q. Over the medium term (2019 – 2023) system demand is expected to grow to 3,191 MW.
Hence to meet the reliability requirement of the Ghana power system an additional
reserve margin of 25% representing 798 MW is required. This adds up to a total
required supply capacity of 4,898 MW.
r. Low voltage challenges could be experienced in Kumasi. The construction of generation
resources of up to 200 MW in Kumasi in the medium term addresses this challenge.
77 2018 Electricity Supply Plan
10 RECOMMENDATIONS
Based on the above conclusions, the following recommendations are made:
1. The Akosombo and Bui Reservoirs should be prudently managed in 2018 by.
a. Operating three Units at Akosombo during off-peak and four units at Peak
b. Operating on the average, two units at Bui
2. In view of the low hydro generation, measures should be put in place to ensure security
of fuel for the thermal plants to forestall possible supply disruptions to consumers.
3. The players in gas supply chain, namely; Ghana Gas Company Limited, Tullow, ENI,
GNPC should strongly collaborate with the power utilities to ensure effective planning
and coordination to avert any possible gas supply curtailments which could have dire
consequences for power supply.
4. In view of the huge investments in fuel supply, the Government of Ghana (GoG) should
assist the Utilities to raise the necessary financing to procure the required quantities of
fuel and on time to avert any possible power supply crisis.
5. The ongoing transmission expansion projects should be expedited and completed on
schedule.
a. Volta – Achimota – Mallam Transmission Line Upgrade Project
b. Aboadze – Prestea - Kumasi 330 kV Transmission Line Project
c. Kumasi – Bolgatanga 330 kV transmission line Project
6. All load entities should invest in reactive power compensation facilities to ensure that
their customer-end power factors comply with the Grid Code (Article 9.33) requirement
of 0.9 pu lagging.
7. A well-coordinated maintenance programme should be pursued by both GRIDCo and
the Generating Companies (GENCOs).
8. Initiate steps to install non-intermittent generation facilities (such as waste-to-energy,
etc.) totalling up to 200 MW in Kumasi in the medium term. This would help to improve
voltages in Kumasi and its surroundings. This is in accordance with the Transmission
Master Plan proposal to site a 300 MW combine cycle plant either in Kumasi or Dunkwa
to address the reactive power challenges.
78 2018 Electricity Supply Plan
9. The following substation projects should be expedited;
a. The completion of the Afienya BSP.
b. Construction of 3x125 MVA GIS station at Accra Central.
c. Construction of A4BSP 330 kV substation at Pokuase.
10. The interventions detailed in Appendix C1 to address constraints on the ECG network in
the operational areas should be expeditiously implemented to ensure that they are
completed on schedule.

79 2018 Electricity Supply Plan
11 APPENDICES
Appendix A –Forecast Peak Demand and Energy Consumption
A1: Medium Term Peak Demand Forecast (MW): 2019 - 2024
A2: Projected Energy Consumption (GWh) -2019 - 2031
Appendix B –Actual Peak Demand and Energy Consumption
B1: 2017 Actual Energy Consumption
B2: 2017 Actual Peak Demand per BSP
Appendix C – Distribution Network Interventions
C1: Short term interventions being carried out by ECG to resolve network constraints
C2: Northern Electricity Distribution Company –Actual Energy Consumption (GWh) -2016
Appendix D – 2017 Planned Generating Units Maintenance
Appendix E – Estimated Fuel Requirement and Cost
Appendix F – Glossary
Appendix G – Grid Map

80 2018 Electricity Supply Plan
APPENDIX A - FORECAST PEAK DEMAND AND ENERGY CONSUMPTION
A1: Medium Term Peak Demand Forecast (MW): 2018 - 2027
Load forecast: Peak demand (MW)-Coincident
2018 2019 2020 2021 2022 2023 2024 2025 2026 2027
ECG 1642.72 1809.59 1876.84 2024.77 2166.12 2312.61 2467.81 2634.51 2815.35 2818.93
NEDCo 211.71 222.48 249.92 257.83 274.07 288.75 305.78 323.55 340.23 357.25
MINES 226.71 241.88 265.04 271.12 272.87 274.92 281.11 281.59 283.58 286.43
Other Bulk Customers 74.97 70.00 97.09 98.27 102.27 107.27 112.27 117.27 122.27 127.27
VALCO 150.00 332.00 443.00 553.00 553.00 553.00 553.00 553.00 553.00 553.00
CEB(Togo/Benin) 30.00 10.00 10.00 10.00 10.00 10.00 10.00 10.00 10.00 10.00
SONABEL(Burkina) 100.00 150.00 150.00 150.00 150.00 150.00 150.00 150.00 150.00 150.00
CIE(Ivory Coast) 3.00 3.00 3.00 3.00 3.00 3.00 3.00 3.00 3.00 3.00
EDM(Mali) 0.00 0.00 0.00 50.00 50.00 50.00 100.00 100.00 100.00 100.00
Transmission Losses +Network Usage 84.37 98.20 107.06 114.81 120.30 125.95 145.74 152.69 160.17 161.21
System Peak MW-Coincident 2523.48 2937.16 3201.95 3532.81 3701.64 3875.51 4128.71 4325.62 4537.61 4567.09
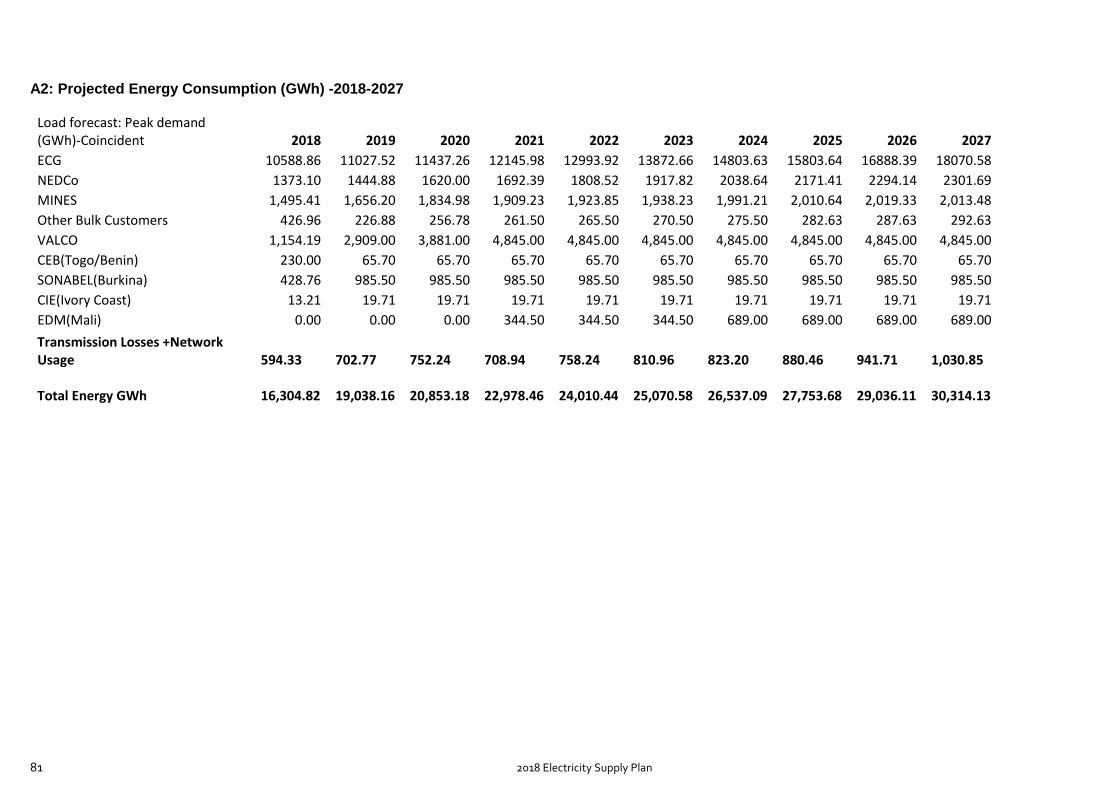
81 2018 Electricity Supply Plan
A2: Projected Energy Consumption (GWh) -2018-2027
Load forecast: Peak demand (GWh)-Coincident 2018 2019 2020 2021 2022 2023 2024 2025 2026 2027
ECG 10588.86 11027.52 11437.26 12145.98 12993.92 13872.66 14803.63 15803.64 16888.39 18070.58
NEDCo 1373.10 1444.88 1620.00 1692.39 1808.52 1917.82 2038.64 2171.41 2294.14 2301.69
MINES 1,495.41 1,656.20 1,834.98 1,909.23 1,923.85 1,938.23 1,991.21 2,010.64 2,019.33 2,013.48
Other Bulk Customers 426.96 226.88 256.78 261.50 265.50 270.50 275.50 282.63 287.63 292.63
VALCO 1,154.19 2,909.00 3,881.00 4,845.00 4,845.00 4,845.00 4,845.00 4,845.00 4,845.00 4,845.00
CEB(Togo/Benin) 230.00 65.70 65.70 65.70 65.70 65.70 65.70 65.70 65.70 65.70
SONABEL(Burkina) 428.76 985.50 985.50 985.50 985.50 985.50 985.50 985.50 985.50 985.50
CIE(Ivory Coast) 13.21 19.71 19.71 19.71 19.71 19.71 19.71 19.71 19.71 19.71
EDM(Mali) 0.00 0.00 0.00 344.50 344.50 344.50 689.00 689.00 689.00 689.00
Transmission Losses +Network Usage
594.33
702.77
752.24
708.94
758.24
810.96
823.20
880.46
941.71
1,030.85
Total Energy GWh 16,304.82
19,038.16
20,853.18
22,978.46
24,010.44
25,070.58
26,537.09
27,753.68
29,036.11
30,314.13

82 2018 Electricity Supply Plan
APPENDIX B - ACTUAL PEAK DEMAND AND ENERGY CONSUMPTION
B1: Electricity Company of Ghana-Monthly Actual Energy Consumption (GWh) by BSP’s in 2017
STATIONS JANUARY FEBRUARY MARCH APRIL MAY JUNE JULY AUGUST SEPTEMBER OCTOBER NOVEMBER DECEMBER TOTAL
KPONG 17,013.2 13,478.3 13,930.6 14,285.4 15,060.0 14,725.3 15,696.1 15,461.8 15,105.4 16,857.6 15,881.0 18,202.6 185,697.3
AKUSE 221.1 198.6 228.0 195.2 189.8 167.4 162.7 167.4 189.9 195.5 189.2 217.8 2,322.6
NEW TEMA 89,822.6 80,468.4 92,887.6 83,240.7 90,358.6 85,226.1 88,143.9 86,848.9 84,612.7 92,719.9 81,130.4 75,668.3 1,031,128.0
ACHIMOTA 192,897.0 146,534.0 165,348.3 155,983.7 165,782.0 141,775.3 164,068.9 156,830.1 164,901.7 179,799.3 188,241.4 195,887.2 2,018,048.9
MALLAM 83,283.7 101,945.6 118,175.0 116,702.0 110,090.5 109,004.1 75,784.7 81,837.0 77,746.5 95,455.2 85,461.5 89,005.2 1,144,491.0
WINNEBA 29,977.7 26,241.0 29,240.0 28,286.0 29,689.0 27,658.1 28,451.3 28,747.6 28,420.0 31,701.5 32,167.2 34,326.3 354,905.7
ACCRA EAST 95,803.0 75,723.0 88,792.0 94,215.0 101,718.0 81,323.3 76,636.7 72,687.9 69,743.8 87,664.9 95,814.2 87,431.6 1,027,553.4
SMELTER II 11,877.0 18,300.0 20,612.0 20,009.0 18,847.4 20,140.4 18,296.5 18,677.5 18,248.9 20,690.9 33,287.8 36,232.4 255,219.8
CAPE COAST 23,323.0 20,669.0 24,071.0 22,662.0 22,543.0 20,684.1 20,759.7 20,046.7 21,143.0 23,759.4 23,277.8 24,084.2 267,022.9
TAKORADI 34,222.4 29,368.7 35,820.1 34,426.3 35,089.4 32,650.3 32,001.2 32,261.5 31,149.5 33,943.2 34,877.9 35,502.8 401,313.2
ESSIAMA 6,285.0 5,355.7 6,191.0 5,509.9 5,596.0 5,041.9 4,940.2 5,296.7 5,003.0 5,357.7 5,359.1 6,127.7 66,063.7
BOGOSO 6,558.7 6,103.5 6,505.4 6,158.0 6,542.3 6,387.6 6,363.1 5,893.0 5,779.7 6,558.0 6,354.0 6,950.5 76,153.6
PRESTEA 2,030.5 1,900.8 2,048.9 1,970.1 1,894.8 1,773.9 1,783.3 1,692.2 1,619.1 1,809.8 1,787.9 1,991.7 22,303.0
TARKWA 22,018.7 17,316.2 21,127.9 20,594.0 20,311.4 20,081.4 20,229.2 19,401.3 19,452.1 20,285.6 20,539.8 20,592.6 241,950.1
AKYEMPIM 318.7 270.6 274.7 252.6 268.0 263.7 259.5 188.9 193.2 201.2 214.3 252.2 2,957.6 DUNKWA 3,140.4 2,942.4 3,227.9 3,126.8 3,128.4 2,728.6 2,757.9 2,764.5 2,668.8 2,873.3 2,860.3 3,046.5 35,265.8
ASAWINSO 26,373.3 25,198.7 25,953.1 23,980.7 25,285.3 26,684.4 27,047.4 25,912.2 24,873.8 25,968.6 26,758.0 27,991.9 312,027.2
OBUASI 11,423.2 10,375.3 10,946.5 10,702.4 10,646.9 9,905.3 9,970.9 9,788.8 9,523.1 10,183.7 10,434.6 10,965.8 124,866.4
KUMASI 99,746.0 82,471.0 101,014.0 98,988.0 99,937.0 91,779.0 94,076.6 95,202.5 90,548.1 91,383.8 86,903.3 103,956.7 1,136,006.0
ANWOMASO 30,542.0 35,870.0 33,524.0 33,042.0 30,817.0 30,142.0 30,758.1 28,045.5 30,358.0 38,462.3 38,261.6 29,292.4 389,114.9
KONONGO 5,669.5 5,192.1 5,490.4 5,454.9 5,677.0 5,102.0 5,355.2 4,933.5 4,913.5 5,824.6 5,603.5 6,118.0 65,334.1
NKAWKAW 6,869.6 6,149.0 6,981.5 6,957.8 7,048.1 6,300.4 6,409.3 6,101.8 6,002.3 6,692.3 6,612.2 7,011.9 79,136.2
AKWATIA 12,415.4 12,014.9 12,887.0 12,342.4 12,603.8 12,081.1 11,635.7 11,667.8 10,843.1 11,133.3 11,813.6 12,280.3 143,718.4
TAFO 18,365.0 17,187.8 18,950.8 18,105.4 18,348.3 17,316.1 16,945.9 16,495.5 16,175.5 17,757.7 17,829.7 18,665.0 212,142.5
HO 5,385.5 5,481.2 5,914.3 5,855.0 5,697.0 5,184.9 5,317.6 5,283.2 5,267.8 5,970.3 5,743.3 6,077.7 67,177.7
KPEVE 3,043.9 2,328.4 2,735.2 2,488.6 2,425.0 2,307.4 2,538.2 2,535.4 2,567.8 2,533.5 2,516.6 2,653.7 30,673.8
KPANDU 7,167.8 6,631.0 7,680.5 6,990.1 7,100.5 6,799.3 7,352.4 7,216.7 7,066.9 7,691.5 7,545.6 7,959.2 87,201.4
ASIEKPE 511.6 471.7 493.7 463.8 464.1 402.1 361.5 381.3 364.6 385.9 455.5 442.4 5,198.0
SOGAKOPE 6,748.6 6,137.9 5,817.0 5,955.2 6,632.4 6,036.2 6,107.8 6,043.8 5,627.0 6,270.3 6,730.4 7,137.7 75,244.3
AFLAO 5,280.0 4,515.0 5,390.0 5,868.0 4,932.7 4,599.7 4,840.6 4,801.6 5,236.2 5,900.7 5,297.0 5,708.4 62,369.9
TOTAL 858,334.1 766,839.6 872,258.4 844,810.9 864,723.7 794,271.1 785,052.0 773,212.3 765,344.9 856,031.2 859,948.5 881,780.5 9,922,607.3

83 2018 Electricity Supply Plan
B2: Electricity Company of Ghana-Actual Peak Demand – 2017
STATIONS January February March April May June July August September October November December HIGHEST
AKUSE 0.3 0.3 0.3 0.3 0.3 0.2 0.2 0.2 0.3 0.3 0.3 0.31 NEW TEMA 205.34 200.13 236.55 187.34 195.7 193.65 193.52 168.79 194.43 201.25 185.79 236.55
ACHIMOTA 299 304.8 283.8 380.1 257.8 308.6 268.5 267.6 252.8 297.3 300.3 300.7 380.10
MALLAM 198.9 230.5 228.5 258.7 215.8 215.7 207.6 226.5 163 198.3 210.8 161.4 258.70
ACCRA EAST 160.7 214.3 218.2 176.9 195.2 178.2 159.1 159.3 152.5 187.3 194.3 176.3 218.20
WINNEBA 62.5 78.2 59.3 65 71.5 65.5 59.2 62 61.7 72.5 68 68.3 78.20
SMELTER II 35.2 36.3 35.6 39 41.6 36.3 59 33.5 17.1 36.8 71.3 71.30
CAPE COAST 46.6 46.5 49 48.3 46.2 47.6 41 42.8 45.6 47.6 48.7 48.3 49.00
TAKORADI 99.13 121.79 69.99 122.99 82.9 85.24 75.63 61.37 63.48 71.53 69.76 68.8 122.99
ESSIAMA 15.95 13.03 13.23 12.57 13.39 11.88 10.62 10.76 11.2 12.15 12.06 12.77 15.95
BOGOSO 13.97 14.78 14.52 14.11 14.2 13.66 12.7 12.03 12.53 13.98 14.09 14.81 14.81
TARKWA 45.05 49.26 57.95 50.43 49.37 48.15 47.55 49.26 35.03 44.86 44.72 51.51 57.95
AKYEMPIM 0.71 0.73 0.71 0.71 0.74 0.69 0.63 0.47 0.63 0.62 0.62 0.65 0.74
DUNKWA 6.08 6.14 6.07 5.98 5.93 5.66 5.25 5.34 5.43 5.67 5.57 5.81 6.14
PRESTEA 3.56 3.53 3.63 3.56 3.37 3.29 19.63 2.99 2.99 3.3 3.32 3.49 19.63
ASAWINSO 49.3 49.49 54.31 51.96 55.56 47.13 46.98 45.14 46.36 48.7 48.29 49.19 55.56
OBUASI 25.65 27.15 23.11 27.79 21.31 20.35 19.63 18.76 19.53 22.63 24.09 20.79 27.79
ANWOMASO 88.5 99.2 104.2 49.7 94.8 94 91.5 71.3 96.3 102.7 107 73.2 107.00
KUMASI 239.4 219.6 221.6 206.5 232.4 199.7 193 190.3 223.3 228.3 229.5 232.4 239.40
KONONGO 10.52 10.82 10.7 10.67 10.52 10.23 10.36 9.65 10.16 10.44 10.81 10.54 10.82
NKAWKAW 15 20.45 25.83 18.83 30.54 13.69 13.64 12.82 17.79 16.35 14.15 15.23 30.54
AKWATIA 27.66 29.21 28.1 25.444 29.55 26.98 25.87 27.51 25.66 30.73 26.38 25.68 30.73
TAFO 35.08 30.473 36.02 35.85 38.06 34.95 32.92 33.56 33.3 35.57 35.36 35.83 38.06
HO 9.75 12.01 15.79 10.53 10.11 10.32 9.97 10.07 10.06 10.59 10.4 15.93 15.93
KPONG 26.05 28.56 27.92 45.86 42.2 27.45 39.6 26.2 34 89.1 28.94 32.1 89.10 KPEVE 5.14 5.39 5.3 4.58 4.63 4.58 4.03 5.37 5.29 4.87 4.61 4.67 5.39
KPANDU 14.77 15.12 14.64 22.68 17.8 14.52 14.3 14.26 14.48 14.68 14.59 14.53 22.68
ASIEKPE 1.24 1.24 1.17 1.18 11.9 1.09 0.85 0.8 0.85 0.85 1.11 0.98 11.90
SOGAKOPE 13.26 13.69 13.28 13.77 13.5 13.7 12.71 11.93 12.5 13.37 13.68 13.63 13.77
AFLAO 11.3 9.7 12.5 10.8 10.5 9.7 9.5 14.4 13.6 10.7 10.7 14.40
TOTAL 1,765.607 1,892.389 1,859.326 1,903.805 1,817.635 1,743.542 1,685.209 1,590.105 1,582.664 1,835.903 1,552.113 1,725.330 1,903.805

84 2018 Electricity Supply Plan
APPENDIX C – DISTRIBUTION NETWORK INTERVENTIONS
C1: Selected Interventions being carried out by ECG to resolve network constraints in 2018
No. Project Reason Benefits
Consequences for
not implementing the
Project
Load
Center Timeline
1
Construction of the
Accra Central BSP
on the Graphic
Road
High demand
growth in Accra.
Distribution
reliability threat of
lines supplying
Accra central
load.
1. Increased level of
reliability especially during
contingent conditions.
2. Improved voltages within
Accra central load.
3. Reduction in loading of
existing feeders supplying
Accra Central Demand
1. Severe loading
constraints on feeders
supplying Accra
central load.
2. Improved level of
reliability of supply
during contingent
situations
3. Technical Loss
Reduction
Accra Second Quarter
of 2018
2
Construction of
BSP Mobole and
creation of 33 kV
offloading circuits
for the newly
constructed
Mobole Bulk
1. The Dodowa
switching station
and Mampong
substation are
currently supplied
through a single
circuit 26 MVA
1. Increase flexibility of
supply within the Tema
network
2. Improve voltages at load
centers within Mobole
catchment area
3. Support and provide
1. Severe low voltages
at Dodowa
2. Potential power
outages to customers
supplied from the
Dodowa switching
Tema Complete

85 2018 Electricity Supply Plan
No. Project Reason Benefits
Consequences for
not implementing the
Project
Load
Center Timeline
Supply Point distribution line
about 27 km from
Adenta.
2. This results in
severe voltage
levels at Dodowa
and beyond.
Afienya BSP will
serve as a
alternative supply
to Dodowa,
Mampong and
possibly Aburi
alternative supply to
neighbouring sub-
transmission Accra networks
4. Improve power supply
reliability to Dodowa,
Mampong and possibly
Aburi
5. Reduce technical losses
station
3. High suppressed
demand
3
Upgrade of
existing Sogakope
substation from
10/13 MVA 69/11
kV to 25/33 MVA
69/11 kV
Potential
overloading of the
substation based
on projected
demand for 2018
in Sogakope
1. Reduction in technical
losses.
2. Increased capacity to
meet projected demand for
2018
1. Likely outages
resulting from
overloads
2. High level of
Technical losses
Volta Planned
4 Construction of a New load centers 1. Reduction in Technical 1. Low voltages Accra First Quarter of

86 2018 Electricity Supply Plan
No. Project Reason Benefits
Consequences for
not implementing the
Project
Load
Center Timeline
2x20/26 MVA
33/11 kV Primary
Substation at
Ogbojo complete
with associated
33kV circuits and
11 kV offloading
circuits for the
Ogbojo substation
developing within
the Ogbojo
catchment area
Losses
2. Increased reliability and
flexibility of supply to loads
within the Ogbojo catchment
area
3. Improved economic
loading of neighbouring
substations as the Ogbojo
substation will off - load a
percentage of existing
loading on the neighbouring
substations
2. Poor level of
reliability of supply
2018
5
Construction of a
33kV double circuit
tower lines from
Gimpa to
Kwabenya and
Dodowa to Mobole
substations
Currently the
Kwabenya
substation is a
terminal
substation either
when it is
supplied from the
Achimota BSP
1. Improved reliable power
supply to Kwabenya with
alternatives
2. Improved voltage levels at
Kwabenya
1. Low voltages at
Kwabenya
2. High level of
reliability of supply to
the Kwabenya
substation
Accra First Quarter of
2018

87 2018 Electricity Supply Plan
No. Project Reason Benefits
Consequences for
not implementing the
Project
Load
Center Timeline
through Adenta
or A3BSP
through Adenta.
Severe voltages
are anticipated
when supplied
from A3BSP and
loading constraint
on the H - Adenta
when supplied
from Achimota
BSP
6
Construction of
Primary S/S. at
Meridian Tema.
Construction of the
Tema “A” to
Meridian portion of
the looping of the
2x60 MVA 33 kV
To off - load
projected
overloading on
the Tema A and
Tema D
substations
1. Improved economic
loading of Tema A and
Tema D substations.
2. Reduce technical losses
3. Improved reliability of
supply to load centers within
the Meridian catchment area
1. High level of
Technical losses
2. Low level of
reliability
Tema Complete
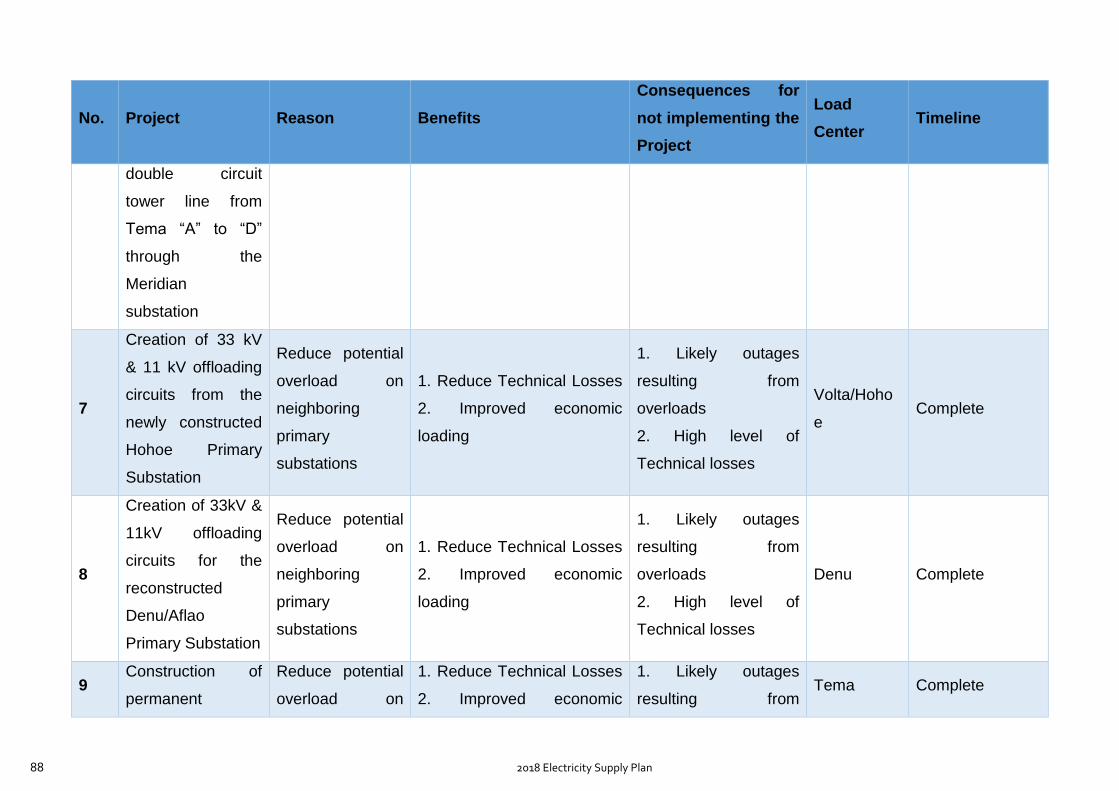
88 2018 Electricity Supply Plan
No. Project Reason Benefits
Consequences for
not implementing the
Project
Load
Center Timeline
double circuit
tower line from
Tema “A” to “D”
through the
Meridian
substation
7
Creation of 33 kV
& 11 kV offloading
circuits from the
newly constructed
Hohoe Primary
Substation
Reduce potential
overload on
neighboring
primary
substations
1. Reduce Technical Losses
2. Improved economic
loading
1. Likely outages
resulting from
overloads
2. High level of
Technical losses
Volta/Hoho
e Complete
8
Creation of 33kV &
11kV offloading
circuits for the
reconstructed
Denu/Aflao
Primary Substation
Reduce potential
overload on
neighboring
primary
substations
1. Reduce Technical Losses
2. Improved economic
loading
1. Likely outages
resulting from
overloads
2. High level of
Technical losses
Denu Complete
9 Construction of
permanent
Reduce potential
overload on
1. Reduce Technical Losses
2. Improved economic
1. Likely outages
resulting from Tema Complete

89 2018 Electricity Supply Plan
No. Project Reason Benefits
Consequences for
not implementing the
Project
Load
Center Timeline
substation at the
existing Kpone
industrial area
(OLAM) in Tema
neighboring
primary
substations
loading overloads
2. High level of
Technical losses
10
Construction of a
9.9km line from
Otokrom to James
Adomkrom to link
the Juabeso &
Asankragwa/Enchi
33kV lines
No alternative
line to supply
load centers
during outages
1. Improved level of
reliability
Longer duration of
outages resulting in
high levels of SAIDI
Western Complete

90 2018 Electricity Supply Plan
C2 a: Northern Electricity Distribution Company –Actual Energy Consumption (GWh) -2017
STATIONS JANUARY FEBRUARY MARCH APRIL MAY JUNE JULY AUGUST SEPT. OCTOBER NOVEMBER DECEMBER TOTAL
SUNYANI 19.6 19.9 22.0 20.9 21.2 18.2 18.5 19.1 18.3 20.1 21.0 21.8 240.8
TECHIMAN 15.1 15.3 17.4 16.3 16.8 15.1 15.2 15.4 14.5 15.7 16.5 17.1 190.4
TAMALE 20.1 20.9 24.3 23.9 24.4 23.4 22.1 22.4 21.5 25.1 25.5 24.6 278.2
BUIPE (PBC) 0.4 0.4 0.5 0.5 0.4 0.4 0.4 0.4 0.4 0.4 0.4 0.5 5.0
BOL'TANGA 4.6 6.9 8.5 8.6 8.3 7.2 6.7 6.8 6.9 8.0 7.8 7.7 88.0
YENDI 7.8 7.6 8.6 8.6 8.5 8.5 8.4 8.4 8.1 9.3 9.9 9.8 103.5
SAWLA 2.4 2.6 3.0 2.9 2.9 2.9 2.8 2.9 2.8 3.2 3.3 3.1 34.8
ZEBILLA 0.6 0.6 0.7 0.7 0.7 0.7 0.7 0.6 0.6 0.7 0.7 0.7 7.9
MIM 5.1 5.2 5.4 5.0 5.4 5.0 4.9 5.0 5.0 5.3 5.7 5.9 62.9
KINTAMPO 1.1 1.2 1.4 1.3 1.2 1.1 1.2 1.1 1.1 1.2 1.3 1.5 14.8
WA 5.4 5.7 6.8 6.6 5.9 5.6 5.4 5.2 5.3 6.4 6.3 6.0 70.5
TUMU 2.6 0.8 1.1 0.9 0.8 0.7 0.7 0.7 0.7 0.8 0.9 0.8 11.7
BAWKU 2.2 2.4 2.7 2.6 2.7 2.6 2.4 2.5 2.5 2.8 2.7 2.7 30.8
TOTAL 87.1 89.5 102.5 98.9 99.2 91.4 89.3 90.6 87.7 98.9 102.2 102.1 1139.5
C2 b: Northern Electricity Distribution Company –Actual Peak Demand (MW) -2017
STATIONS January February March April May June July August September October November December Maximum
SUNYANI 43.1 43.6 43.4 41.8 41.9 41.8 39.6 38.4 40.9 41.3 40.7 41.4 43.62
TECHIMAN 39.7 43.9 39.6 37.4 34.1 35.9 46.1 31.8 37.3 34.8 35.2 29.9 46.1
TAMALE 49.6 51.5 52.5 53.5 53.0 52.6 49.7 49.2 51.8 63.5 57.6 50.2 63.5
BOL'TANGA 15.9 17.1 19.1 19.0 18.3 18.0 17.1 17.3 15.3 21.0 10.6 18.8 21.0
YENDI 18.9 18.9 19.4 20.2 19.8 19.7 19.3 19.2 19.8 20.6 19.8 19.4 20.6
SAWLA 6.3 6.7 7.0 7.0 7.0 6.8 6.2 6.4 6.9 7.5 7.0 7.1 7.5
BUIPE (PBC) 1.2 1.3 1.3 1.3 1.4 1.2 1.2 1.4 1.4 1.5 1.6 1.6 1.6
ZEBILLA 1.3 1.3 1.4 1.4 1.5 1.4 1.4 1.4 1.4 1.5 1.4 1.6 1.6
MIM 11.1 12.4 12.7 12.9 12.9 12.7 11.1 11.0 11.5 12.1 12.5 12.6 12.9
KINTAMPO 2.9 3.6 3.2 3.1 3.3 3.1 3.0 3.7 3.1 6.9 6.8 7.9 7.9
TUMU 3.4 3.6 3.7 3.7 2.9 2.9 2.7 2.6 2.7 2.9 3.6 8.6 8.6
WA 12.4 13.4 13.8 14.5 13.5 13.8 12.1 12.2 13.6 14.9 13.4 12.8 14.9
BAWKU 10.1 10.7 11.2 11.1 12.0 10.9 10.0 10.8 10.4 12.8 12.0 11.9 12.8
TOTAL 215.9 228.0 228.2 227.0 221.5 220.8 219.4 205.3 216.1 241.4 222.2 223.7 241.4

91 2018 Electricity Supply Plan
C2 c: Mines-Energy Consumption (GWh)-2017
CUSTOMERS JANUARY FEBRUARY MARCH APRIL MAY JUNE JULY AUGUST SEPTEMBER OCTOBER NOVEMBER DECEMBER TOTAL
G.F.G. NEW TARKWA 13.4 12.9 15.3 16.3 14.2 15.1 11.5 8.2 9.4 9.7 8.8 10.6 145.5
NCM PRESTEA 1.2 1.2 1.2 1.4 1.6 1.8 1.9 1.6 1.6 1.8 1.9 17.1
SANKOFA PRESTEA 0.2 0.1 0.0 0.0 0.0 0.0 0.0 0.0 0.4
OWERE KONONGO 0.1 0.1 0.1 0.1 0.1 0.0 0.3
ANGLOGOLD OBUASI 1.3 1.4 1.5 1.4 1.5 1.6 1.8 2.0 1.9 1.7 2.0 1.7 19.9
ANGLOGOLD NEW OBUASI 5.1 4.1 4.8 4.7 4.7 4.8 5.2 5.1 4.3 4.4 4.4 4.5 56.1
G.C.D. AKWATIA 0.1 0.1 0.1 0.1 0.1 0.1 0.1 0.1 0.1 0.1 0.1 0.0 1.1
GOLDEN STAR BOGOSO 4.4 4.0 4.5 4.1 4.3 4.2 4.3 4.3 4.2 4.2 4.3 4.5 51.2
GOLDEN STAR WASSA 7.3 7.0 7.7 6.6 6.9 5.7 5.4 7.6 7.6 7.3 7.9 7.9 85.0
ADAMUS GOLD ESSIAMA 3.7 3.1 3.4 3.4 3.6 3.5 3.8 3.7 3.4 3.7 3.4 3.7 42.4
PERSEUS GOLD AYANFURI 10.8 9.8 11.2 9.3 11.3 12.5 11.3 10.1 10.9 12.1 12.7 10.6 132.5
NEWMONT NEW ABERIM 19.9 18.8 15.7 18.2 18.5 17.8 17.8 18.6 18.7 19.1 18.8 19.1 220.9
NEWMONT KENYASE 22.3 19.3 22.6 20.6 22.6 21.6 23.4 22.4 23.3 22.9 24.0 22.2 267.2
ADANSI GOLD OBOTAN 8.9 8.8 9.4 8.9 9.4 9.0 8.0 8.6 9.2 9.4 9.6 10.0 109.3
DRILLWORX KONONGO 0.0 0.1 0.1 0.1 0.1 0.1 0.6
TOTAL 98.56 90.46 96.23 94.93 98.60 97.52 94.44 92.64 94.67 96.37 97.95 97.02 1,149.39
C2 d: - Consumption (GWh)-2017
CUSTOMERS
January February March April May June July August September
October
November
December
Maximum
G.F.G. NEW TARKWA 35.4 28.4 39.3 39.2 39.0 39.4 38.9 37.8 39.3 37.3 38.3 38.2 39.4
NCM PRESTEA 2.9 2.9 2.9 2.9 2.9 3.4 8.4 3.6 3.7 3.5 3.7 3.7 8.4
SANKOFA PRESTEA 0.8 0.3 0.1 0.4 0.1 0.3 0.1 0.3 0.8
OWERE KONONGO 0.1 0.1 0.1 0.1 0.1 0.1 0.1
ANGLOGOLD. OBUASI 3.7 4.1 3.2 3.6 3.6 3.9 4.2 4.3 4.1 3.7 4.2 4.0 4.3
ANGLOGOLD NEW OBUASI 9.1 9.1 17.1 17.9 8.7 15.7 9.9 9.2 7.2 14.3 7.3 7.8 17.9
G.C.D. AKWATIA 0.2 0.2 0.2 0.2 0.2 0.2 0.2 0.2 0.2 0.2 0.2
GOLDEN STAR BOGOSO 6.9 7.0 7.0 6.9 7.3 7.1 7.0 6.5 6.9 6.9 7.2 7.3 7.3
GOLDEN STAR WASSA 11.7 11.8 11.9 11.7 11.7 11.7 11.8 12.2 12.2 12.4 12.5 12.2 12.5
ADAMUS GOLD ESSIAMA 5.6 5.4 5.6 5.5 5.5 5.6 5.6 5.4 5.4 5.4 5.5 5.6
PERCEUS GOLD AYANFURI 18.2 17.9 18.3 17.8 18.6 19.4 19.1 18.9 18.2 19.5 19.3 18.8 19.5
NEWMONT NEW ABERIM 30.7 15.6 30.0 29.3 29.3 23.7 29.8 37.6 57.3 56.3 29.0 42.6 57.3
NEWMONT KENYASI 36.5 32.6 33.0 69.8 66.0 65.8 35.8 67.3 69.7 36.2 71.9 45.1 71.9
ADANSI GOLD LTD OBOTAN 14.3 14.4 14.7 14.6 14.6 14.4 14.1 14.5 15.8 15.7 15.1 15.3 15.8
DRILLWORX KONONGO
240.00
250.00
320.00
330.00
330.00
320.00 330.0
TOTAL 176.0
149.8
183.4
219.9
207.6
210.6
385.9
212.2
240.0
211.3
214.1
200.5
386

92 2018 Electricity Supply Plan
Appendix D – 2017 PLANNED GENERATING UNITS MAINTENANCE
1G1 AAR(5 -13 MAR) AM(3 - 21SEP)
1G2 AAR(14-21 MAR) AM(24SEP - 12OCT)
1G3 AAR(22-29 MAR) AM(1-18 MAY)
1G4 AAR(30 MAR - 6 APR) AM(21MAY - 7JUN)
1G5 AAR(7 - 14APR) AM(2-19JUL)
1G6 AAR(15-23APR) AM(23JUL - 9AUG)
19G1
19G2 QM(2-9APR) QM(6-13AUG) QM(3-10 DEC)
19G3
19G4 QM(5-12 FEB) QM(4-11 JUN) QM(1-8 OCT)
54G1 AM(MAR 7-APR 7) QM (11-15 JUN) QM(17-21 SEP) QM(10-14 DEC)
54G2 QM(22-26 JAN) QM(23 -27 APR) AM(3-31 JUL) QM(19-23 NOV)
54G3 QM(12-16 FEB) QM(28 MAY-1 JUN) QM(13 - 17AUG) AM(1 - 29 OCT)
54G4 QM(8-12 JAN) QM(3 - 7 SEPT)
32G1 CWW(20-22 MAR) CWW(18-20 JUN) FI&CWW(16-23 SEP) CWW(19-21 DEC)
32G2 CWW(27-29 OCT)
32G3 mI(30MAR - 21APR)
35G4 OWW(1-2 FEB) OWW(1-2 MAY) OWW(1-2 AUG)
35G5 OWW(1-2 FEB) OWW(1-2 MAY) OWW(1-2 AUG) OWW(1-2 NOV)
35G6 WI(JAN 22-29)
67G1
67G2 TB M(16-25 APR)
47G1 FN/RC (19FEB-2MAR)
46G1a
46G1b
46G2
46G3
50G1 CES(17 JUL - 10 AUG)
50G2 CES(1 JUN - 25 JUN)
50G3 CES(24 JUN - 18 JUL)
50G4 TYPE A(1-12 OCT)
50G5 TYPE A(14-25 SEP)
50G6 TYPE A(22 SEP - 3OCT)
50G7 TYPE A(9-20 OCT)
50G8 TYPE A(17-28 OCT)
CENIT 47G2 OWW(12 JAN) OWW(23 FEB) OWW(22 MAR) HGPI (21 APR - MAY 12) OWW(11 JUN) OWW(12 JUL) OWW(12 AUG) OWW(12 SEP ) OWW(11 OCT) OWW(12 NOV) OWW(11 DEC)
51G1 CCM(8 - 21 SEP)
51G2 CCM(18-31 AUG)
51G3 CCM(18-31 AUG)
51G4 ACM (1 JUL - 4 AUG)
51G5 CCM(5-18 AUG)
51G6 ACM (1 JUL - 4 AUG)
51G7 CCM(15 MAR - 1 APR) CCM(1-18 SEP)
51G8 CCM(15 MAR - 1 APR)
51G9 CCM(10 - 27 NOV)
51G10 CCM(10 - 27 NOV)
79G3
79G4
79G5
79G6
79G7 PM(8-17 JAN)
79G8 PM(19-28 NOV)
79G9
79G10
79G11
79G12
79G13 PM(15-24 OCT)
79G14
79G15
79G16 PM(17-26 SEP)
79G17
79G18
79G19
74G1
74G2
74G3
74G4
74G5
74G6
74G7
74G8
74G9
74G10
77G1
77G2
77G3
77G4
77G5
77G6
77G7
77G8
77G9
77G10
77G11
77G12
77G13
BUI
SUNON ASOGLI
KARPOWER
AMERI
AKSA
MAJOR INSPECTION & COMPRESSOR WATER WASH (1 JAN - 30 APR)
MAJOR INSPECTION (1 OCT - 30 NOV)
KTPP
TTPC
TAPCO
TICO
SEP OCT NOV DECJAN JUL
KPONG
POST RETROFIT
AKOSOMBO
MAJOR RETROFIT (JAN-OCT)
AUGFEB MAR APR MAY JUN

93 2018 Electricity Supply Plan
APPENDIX F: GLOSSARY OF ELECTRICAL UTILITY TERMS
1000 Watt-hours = 1 Kilo Watt-hour (kWh)
1000 Kilo Watt-hour = 1 Mega Watt-hour (MWh)
1000 Mega Watt-hour = 1 Giga Watt-hour (GWh)
1000 Giga Watt-hour = 1 Tera Watt-hour (TWh)
Average Day Load
The average system demand is indicative of the system’s load during most part of the day that
is from 7: am – 5: pm apart from the peak load.
Capability
The maximum load a generator, piece of equipment, substation, or system can carry under
specified (standardized) conditions for a given time interval without exceeding approved limits.
Capacitor
1) In a power system, installed to supply reactive power.
2) A device to store an electrical charge (usually made of two or more conductors separated by
a non-conductor such as glass, paper, air, oil, or mica) that will not pass direct current and
whose impedance for alternating current frequencies is inversely proportional to frequency. 3)
In a power system, capacitors consist of metal-foil plates separated by paper or plastic
insulation in oil or other suitable insulating fluid and sealed in metal tanks.
Capacitor bank
A grouping of capacitors used to maintain or increase voltages in power lines and to improve
system efficiency by reducing inductive losses.
Capacity
The rated continuous load-carrying ability, expressed in megawatts (MW) or megavolt-amperes
(MVA) of generation, transmission, or other electrical equipment.
Installed Capacity
The total of the capacities shown by the name plate ratings of similar kinds of apparatus, such
as generators, transformers, or other equipment in a station or system.

94 2018 Electricity Supply Plan
Combined Cycle
An electric generating technology in which electricity is produced from otherwise lost waste
heat exiting from one or more gas (combustion) turbines. The exiting heat is routed to a
conventional boiler or to a heat recovery steam generator for utilization by a steam turbine in
the production of electricity. Such designs increase the efficiency of the electric generating unit.
Conductor
A substance or body that allows an electric current to pas continuously along it.
Contingency
In a power system, the possibility of a fault or equipment failure. First contingency disturbances
(outages) involve only one system element, such as a transmission line fault or a transformer
failure. A second contingency disturbance would have one system element out of service and
subject the system to a fault and loss of a second element.
Demand
The rate at which electric energy is delivered to or by the System or part of the System and is
the sum of both Active and Reactive Power, unless otherwise stated.
Demand, Peak:
The highest electric requirement occurring in a given period (e.g., an hour, a day, month,
season, or year). For an electric system, it is equal to the sum of the metered net outputs of all
generators within a system and the metered line flows into the system, less the metered line
flows out of the system.
Dispatch
The operating control of an integrated electric system to: (1) assign specific generating units
and other sources of supply to meet the relevant area Demand taken as load rises or falls; (2)
control operations and maintenance of high voltage lines, substations and equipment, including
administration of safety procedures; (3) operate interconnections; (4) manage energy
transactions with other interconnected Control Areas; and (5) curtail Demand.
Disturbance
An unplanned event that produces an abnormal system condition. Any occurrence that
adversely affects normal power flow in a system

95 2018 Electricity Supply Plan
Fault
An event occurring on an electric system such as a short circuit, a broken wire, or an
intermittent connection.
Generation (Electricity)
The process of producing electric energy from other forms of energy; also, the amount of
electric energy produced, expressed in watthours (Wh).
Giga (G)
A prefix indicating a billion (1,000,000,000); 109 in scientific notation. Hence Gigawatt (GW)
and Gigawatt-hour (GWh).
Grid
The transmission network (or “highway”) over which electricity moves from suppliers to
customers.
Grid Operator
An entity that oversees the delivery of electricity over the grid to the customer, ensuring
reliability and safety.
High voltage:
Descriptive of transmission lines and electrical equipment with voltage levels from 100 kV
through 287 kV.
Independent Power Producer (IPP):
A private entity that operates a generation facility and sells power to electric utilities for resale
to retail customers.
Insulator:
The porcelain support used to insulate electric service wires from the pole. All electric lines
require an insulator to attach the wires to the pole or to a residence.
Interconnected System
A system consisting of two or more individual electric systems that normally operate in
synchronism (matching frequency, voltage, phase angles, etc) and have connecting tie lines.
Kilowatt (kW)
One thousand watts of electricity (See Watt).
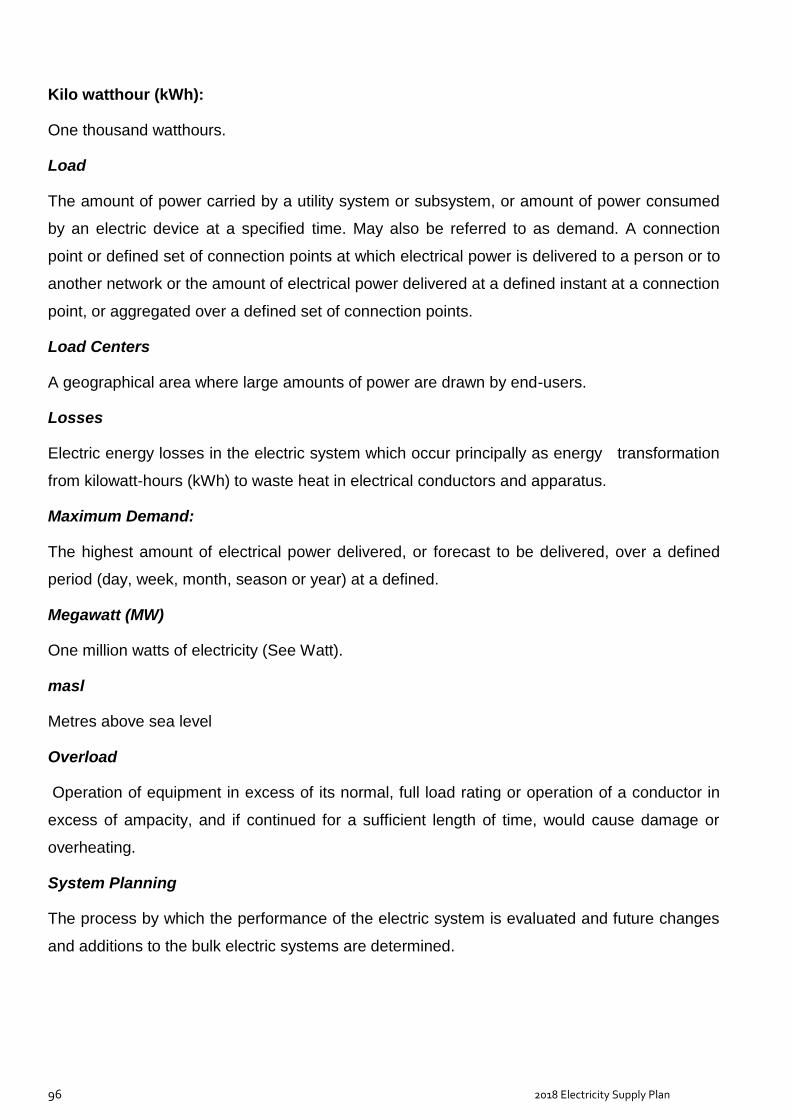
96 2018 Electricity Supply Plan
Kilo watthour (kWh):
One thousand watthours.
Load
The amount of power carried by a utility system or subsystem, or amount of power consumed
by an electric device at a specified time. May also be referred to as demand. A connection
point or defined set of connection points at which electrical power is delivered to a person or to
another network or the amount of electrical power delivered at a defined instant at a connection
point, or aggregated over a defined set of connection points.
Load Centers
A geographical area where large amounts of power are drawn by end-users.
Losses
Electric energy losses in the electric system which occur principally as energy transformation
from kilowatt-hours (kWh) to waste heat in electrical conductors and apparatus.
Maximum Demand:
The highest amount of electrical power delivered, or forecast to be delivered, over a defined
period (day, week, month, season or year) at a defined.
Megawatt (MW)
One million watts of electricity (See Watt).
masl
Metres above sea level
Overload
Operation of equipment in excess of its normal, full load rating or operation of a conductor in
excess of ampacity, and if continued for a sufficient length of time, would cause damage or
overheating.
System Planning
The process by which the performance of the electric system is evaluated and future changes
and additions to the bulk electric systems are determined.

97 2018 Electricity Supply Plan
Power System
The electricity power system of the national grid including associated generation and
transmission and distribution networks for the supply of electricity, operated as an integrated
arrangement.
Reactive Power
Means the product of voltage and current and the sine of the phase angle between them
measured in units of volt-amperes reactive and standard multiples thereof. Reactive power is a
necessary component of alternating current electricity which is separate from active power and
is predominantly consumed in the creation of magnetic fields in motors and transformers and
produced by plant such as: (a) alternating current generators (b) capacitors, including the
capacitive effect of parallel transmission wires;(c) synchronous condensers.
Reliability
The degree of performance of the elements of the bulk electric system that results in electricity
being delivered to customers within accepted standards and in the amount desired. It is a
measure of the ability of a power system to provide uninterrupted service, even while that
system is under stress. Reliability may be measured by the frequency, duration, and magnitude
of adverse effects on the electric supply. Electric system reliability has two components --
adequacy and security.
Adequacy is the ability of the electric system to supply the aggregate electrical demand and
energy requirements of the customers at all times, taking into account scheduled and
reasonably expected unscheduled outages of system elements.
Security is the ability of the electric system to withstand sudden disturbances such as electric
short circuits or unanticipated loss of system facilities.
Single Contingency
The sudden, unexpected failure or outage of a system facility(s) or element(s) (generating unit,
transmission line, transformer, etc.). Elements removed from service as part of the operation of
a remedial action scheme are considered part of a single contingency.
Stability
The ability of an electric system to maintain a state of equilibrium during normal and abnormal
system conditions or disturbances.

98 2018 Electricity Supply Plan
Supervisory Control and Data Acquisition (SCADA)
A computer system that allows an electric system operator to remotely monitor and control
elements of an electric system.
Switching Station
An installation of equipment where several transmission lines are interconnected. Does not
include equipment for transforming voltage levels.
Power System
An interconnected combination of generation, transmission, and distribution components
comprising an electric utility, an electric utility and independent power producer(s) (IPP), or
group of utilities and IPP(s).
Right of Way (ROW)
A corridor of land on which electric lines may be located. The Transmission Owner may own
the land in fee, own an easement, or have certain franchise, prescription, or license rights to
construct and maintain lines.
Thermal Limit
The maximum amount of electrical current that a transmission line or electrical facility can
conduct over a specified time period before it sustains permanent damage by overheating or
before it violates public safety requirements.
Transfer Capability
The amount of power, usually the maximum amount, that can be transmitted between one
system and another; power flow and stability studies determine transfer capability under
various outage, system loading, and system operating conditions.
Transformer
A device for transferring electrical energy from one circuit to another by magnetic induction,
usually between circuits of different voltages. Consists of a magnetic core on which there are
two or more windings. In power systems, most frequently used for changing voltage levels.
Transmission System (Electric)
An interconnected group of electric transmission lines and associated equipment for moving or
transferring electric energy in bulk between points of supply and points at which it is
transformed for delivery over the distribution system lines to consumers, or is delivered to other
electric systems.

99 2018 Electricity Supply Plan
Utility
A public or private organization created for the purpose of selling or supplying for general
public use water, electric energy, telephone service, or other items or services.
Voltage
The electronic force or electric potential between two points that gives rise to the flow of
electricity.
Voltage Stability
The condition of an electric system in which the sustained voltage level is controllable and
within predetermined limits.
Wheeling
The use of the facilities of one transmission system to transmit power and energy from one
power system to another.

100 2018 Electricity Supply Plan
APPENDIX G – GRID MAP