table of contents - bart.gov fy15 srtp_cip... · governance and organizational structure ... (amp)...
TRANSCRIPT

BART FY15-FY24Short Range Transit Plan and Capital Improvement Program
October 2014

BART FY15-FY24 SHORT RANGE TRANSIT PLAN AND CAPITAL IMPROVEMENT PROGRAM Federal transportation statutes require that the Metropolitan Transportation Commission (MTC), in partnership with state and local agencies, develop and periodically update a long-range Regional Transportation Plan (RTP) and a Transportation Improvement Program (TIP) that implements the RTP by programming federal funds to transportation projects contained in the RTP. To effectively execute these planning and programming responsibilities, MTC requires that each transit operator in its region that receives federal funding through the TIP prepare, adopt, and submit to MTC a Short Range Transit Plan (SRTP) that includes a Capital Improvement Program (CIP).
The preparation of this report has been funded in part by a grant from the U.S. Department of Transportation (DOT) through section 5303 of the Federal Transit Act. The contents of this SRTP reflect the views of San Francisco Bay Area Rapid Transit District and not necessarily those of the Federal Transit Administration (FTA) or MTC. The San Francisco Bay Area Rapid Transit District is solely responsible for the accuracy of the information presented in this SRTP.
i

Table of Contents Page
1 Introduction ............................................................................................................................. 1-1 2 Overview of the BART System ........................................................................................ 2-1
Milestones in BART’s History ............................................................................................ 2-1 Governance and Organizational Structure ................................................................. 2-2 Services Provided and Areas Served ........................................................................... 2-5 Fares ....................................................................................................................................... 2-8 Customer Information ....................................................................................................... 2-9 Physical Infrastructure and Capital Assets ...............................................................2-13
3 BART Goal Areas, Objectives, and Performance Evaluation ................................. 3-1 Development of Goal Areas .............................................................................................. 3-1 Objectives and Performance Indicators ....................................................................... 3-1 Historical BART System Performance ......................................................................... 3-4 Compliance ......................................................................................................................... 3-28
4 Operating Service Plan and Financial Plan .................................................................. 4-1 Long-Term Operating Financial Outlook ...................................................................... 4-1 Operating Service Plan ..................................................................................................... 4-4 Operating Financial Plan ................................................................................................... 4-9
5 Capital Improvement Program ........................................................................................ 5-1 Long-Term Capital Financial Outlook ............................................................................ 5-1 Capital Needs ....................................................................................................................... 5-5 Capital Funding ................................................................................................................. 5-28
Appendix A: Adopted BART Policies
Table of Figures Page
Figure 2-1 Milestones in BART History ................................................................................ 2-1 Figure 2-2 BART Board of Directors ................................................................................... 2-2 Figure 2-3 BART Staff Statistics .......................................................................................... 2-3 Figure 2-4 Union Membership .............................................................................................. 2-3 Figure 2-5 BART Organizational Chart (FY15 Budget) .................................................. 2-4 Figure 2-6 BART Routes and Hours of Service ................................................................ 2-5 Figure 2-7 BART Headways .................................................................................................. 2-5 Figure 2-8 BART System Map............................................................................................... 2-6 Figure 2-9 BART Fare Components and Ticket Prices (as of January 1, 2014) ... 2-10 Figure 2-10 BART Station-to-Station Fare Table (effective January 1, 2014) ......2-12 Figure 2-11 BART’s Access Hierarchy ................................................................................. 2-15 Figure 2-12 BART Bike Parking Supply .............................................................................. 2-18 Figure 2-13 Automobile Parking at BART Stations ........................................................ 2-19 Figure 2-14 BART Rail Vehicle Inventory .......................................................................... 2-20
ii

Figure 3-1 BART SRTP/CIP Goal Areas, Objectives, and Performance Indicators ............................................................................ 3-3
Figure 3-2 BART Weekday Ridership FY04-FY13 ......................................................... 3-6 Figure 3-3 BART Annual Ridership FY04-FY13 .............................................................. 3-6 Figure 3-4 BART Revenue Service Hours FY04-FY13 .................................................. 3-7 Figure 3-5 BART Revenue Service Miles FY04-FY13 .................................................... 3-8 Figure 3-6 BART Operating Financial History .................................................................. 3-9 Figure 3-7 Customer On-time Performance ...................................................................3-12 Figure 3-8 Train On-time Performance ............................................................................3-12 Figure 3-9 Peak Car Availability..........................................................................................3-13 Figure 3-10 Mean Time between Service Delays ........................................................... 3-14 Figure 3-11 Incidents ................................................................................................................. 3-15 Figure 3-12 OSHA Recordable Injuries per OSHA ...........................................................3-16 Figure 3-13 Cost per Revenue Vehicle Hour (in FY08$) .............................................. 3-19 Figure 3-14 Cost per Passenger (in FY08$) ..................................................................... 3-19 Figure 3-15 Cost per Passenger Mile (in FY08$) ........................................................... 3-20 Figure 3-16 Farebox Ratios for U.S. Heavy Rail Operators (2012) ............................3-21 Figure 3-17 Average Weekday Ridership ........................................................................ 3-22 Figure 3-18 Elevators and Escalators Availability ......................................................... 3-23 Figure 3-19 Customer Complaints per 100,000 Passengers ..................................... 3-25 Figure 3-20 Police Response Time per Emergency Incident ....................................... 3-26 Figure 3-21 Crimes per Million Riders ................................................................................. 3-27 Figure 3-22 FTA Triennial Review Findings ..................................................................... 3-30 Figure 4-1 BART Extensions under Construction ........................................................... 4-4 Figure 4-2 BART Ridership Forecast .................................................................................. 4-5 Figure 4-3 BART Rail Service Forecast .............................................................................. 4-8 Figure 4-4 ADA Paratransit Projected Passengers and
Productivity FY15-FY24 .................................................................................... 4-9 Figure 4-5 BART Operating Financial Forecast ............................................................. 4-10 Figure 5-1 BART’s Capital Financial Outlook, FY15-24 ................................................. 5-3 Figure 5-2 Overview of CIP Categories and Subcategories .........................................5-7 Figure 5-3 CIP Funding Needs ($ thousands) .................................................................. 5-8 Figure 5-4 Major BART Investments’ Schedule and Total Cost ................................. 5-12 Figure 5-5 Capital Funding Sources: Previously Identified and
Committed Funding ......................................................................................... 5-30 Figure 5-6 Capital Funding Sources: Potential Discretionary Funding ................... 5-31
iii

BART FY15-FY24 SRTP/CIP ACRONYM LIST Acronym Description
(AB) Assembly Bill
(ADA) Americans with Disabilities Act
(AMP) Asset Management Program
(APTA) American Public Transportation Association
(BATA) Bay Area Toll Authority
(BFS) BART Facilities Standards
(BPA) Bonneville Power Administration
(BPD) BART Police Department
(BPGG) Budget Project Governance Group
(CalPERS) California Public Employee Retirement System
(CARP) Capital Asset Replacement Program
(CBTC) Communication-Based Train Control
(CCA) California Carbon Allowances
(CCTV) Closed-Circuit Television
(CIO) Office Of The Chief Information Officer
(CIP) Capital Improvement Program
(CMA) Congestion Management Agencies
(CMAQ) Congestion Mitigation And Air Quality
(COPPS) Community Oriented Policing and Problem Solving
(CPI) Consumer Price Index
(CPTED) Crime Prevention Through Environmental Design
(CPUC) California Public Utilities Commission
(CTA) Chicago Transit Authority
(DBE) Disadvantaged Business Enterprise
(DCC) Doppelmayr Cable Car
(DMU) Diesel Multiple Unit
(DOL) Department Of Labor
(eBART) East Contra Costa Bart Extension
(EBPC) East Bay Paratransit Consortium
(ETR) Employee Trip Reduction
(FHWA) Federal Highway Administration
(FTA) Federal Transit Administration
(FY) Fiscal Year
(GO 175) General Order 175
(GO) General Obligation
(HMC) Hayward Maintenance Complex
(HOV) High Occupancy Vehicle
iv

Acronym Description
(HVAC) Heating, Ventilation, And Air Conditioning
(ICS) Integrated Computer Systems
(JARC) Job Access And Reverse Commute
(LA Metro) LA County Metropolitan Transportation Authority
(LEP) Limited-English-Proficiency
(LRT) Light Rail Train
(MARTA) Metropolitan Atlanta Rapid Transit Authority
(MBTA) Massachusetts Bay Transportation Authority
(MOU) Memorandum Of Understanding
(MPO) Metropolitan Planning Organization
(MTBSD) Mean Time Between Service Delays
(MTC) Metropolitan Transportation Commission
(NCPA) Northern California Power Agency
(NYCT) New York City Transit
(O&M) Operations and Maintenance
(OAK) BART to Oakland International Airport
(OCC) Operations Control Center
(OPEB) Other Post Employment Benefit
(OSHA) Occupational Safety and Health Administration
(PATCO) Port Authority Transit Corporation
(PCG) Budget Project Control Group
(PDA) Priority Development Area
(PEPRA) California Public Employees’ Pension Reform Act
(PG&E) Pacific Gas and Electric Company
(PPC) Passengers Per Car
(RM1) Regional Measure 1
(RM2) Regional Measure 2
(RTP) Regional Transportation Plan
(SCIP) Safety Culture Improvement Program
(SFIA) San Francisco International Airport
(SFMTA) San Francisco Municipal Transportation Agency
(SFO) San Francisco International Airport
(SMP) Strategic Maintenance Program
(SMSP) Safety Management Software program
(SRTP) Short Range Transit Plan
(STA) State Transit Assistance
(STP) Surface Transportation Program
(SVBX) Silicon Valley Extension
v

Acronym Description
(SVRT) Silicon Valley Rapid Transit
(TCMP) Train Control Modernization Project
(TDA) Transportation Development Act
(TIP) Transportation Improvement Program
(TOD) Transit-Oriented Development
(TPI) Transit Performance Initiative
(TPS) Traction Power System
(TSP) Transit Sustainability Project
(VRF) Vehicle Registration Fee
(VTA) Santa Clara Valley Transportation Authority
(WMATA) Washington Metropolitan Area Transit Authority
(WSX) BART to Warm Springs
vi

Introduction
1 INTRODUCTION This FY15-FY24 Short Range Transit Plan/Capital Improvement Program (SRTP/CIP) projects BART’s capital and operating needs for the coming decade, including reinvestment to upgrade its aging system and new investments to modernize and expand the system in compliance with the Metropolitan Transportation Commission’s (MTC) requirement. It has the following purposes:
To serve as a management and policy document for BART To provide the Federal Transit Administration (FTA) and MTC with required
information to meet regional fund programming and planning criteria To describe and validate BART’s capital and operating budgets To inform requests for federal, state, and regional funds To assess BART’s financial capacity to carry out proposed levels of service and
associated CIP To provide MTC with regular information on projects and programs of
regional significance To articulate goals, objectives, and standards by which BART assesses the
system’s performance (also part of the MTC Triennial Performance Audit of the operator)
The final FY15 SRTP/CIP is anticipated to be adopted by the BART Board of Directors in September 2014.
BART’s financial capacity to carry out proposed levels of service and associated CIP is an important component of the SRTP/CIP. The financial forecast shows BART facing major challenges in its operating program over the 10 years: BART must fund critical capital renovations and infrastructure upgrades while maintaining high service levels to meet ridership demands and operating new system extensions when they come on line. This SRTP reflects the fact that BART is projecting annual operating deficits ranging from $6 million to $80 million over the next 10 years.
BART is committing a significant amount of operating funds to critically important capital programs over the next 10 years in addition to baseline capital allocations. The need for these allocations will put a great deal of pressure on future operating budgets. The timing associated with these allocations is reflected in the projected annual operating shortfalls.
As with the operating outlook, the capital forecast illustrates serious funding challenges for BART in the coming years. Currently identified funding falls far short of the system’s capital needs, especially in the short term. This shortfall poses major challenges for ensuring that BART can adequately reinvest to maintain the system’s reliability and safety, while also making enhancements and adding
1-1
Introduction
capacity to serve new ridership demands and serve extensions that are under construction.
Similar to the timing issue with operating allocations, there is a misalignment between timing of need and availability of capital funding. Particularly important for BART’s capital program, funding is expected to become available at a far slower rate than is required to meet the schedule for BART’s capital needs, creating a more dramatic shortfall in the near term than the longer term.
The combination of the operating allocations and capital funding timing issues amplify the significant financial challenges BART is facing over the next 10 years. BART is working to develop strategies to address the operating allocation timing issue in order to reduce pressure on future operating budgets, and will work with MTC to finance the capital funding misalignment to the extent possible.
1-2

Overview of BART System
2 OVERVIEW OF THE BART SYSTEM For over 40 years, BART has provided reliable rapid transit service in the Bay Area. Over that time, the system has grown to accommodate the needs of a denser and expanding region. This chapter discusses the key milestones in BART’s history and provides an introduction to BART’s governance and organizational structures. It also describes the service BART provides, the areas it serves, its fare structure, and the extensive physical infrastructure that is required to ensure that BART runs smoothly and safely.
MILESTONES IN BART’S HISTORY Figure 2-1 below sets out key milestones in BART’s history.
Figure 2-1 Milestones in BART History
1957 California State Legislature creates BART in response to Bay Area growth and transportation needs
1962 Voters approve $792 million general obligation bond issue in San Francisco, Alameda, and Contra Costa counties that provides funding to construct original 71-mile system (bond fully paid off in 2000)
1972 BART begins service
12 stations open from MacArthur to Fremont
1973
20 stations open
Richmond to Ashby: 6 stations
Concord to Rockridge: 6 stations
Montgomery Street to Daly City: 8 stations
1974 Transbay service begins
1976 Embarcadero station opens
1995 North Concord/Martinez station opens
1996 Colma and Pittsburg/Bay Point stations open
1997 Castro Valley and Dublin/Pleasanton stations open
2003 Four San Francisco International Airport (SFO) extension stations begin service:
South San Francisco, San Bruno, San Francisco International Airport (SFIA), and Millbrae
2007 BART and SamTrans, with the aid of MTC, agree to turn SFO extension operations over to BART
2010 West Dublin/Pleasanton station opens
2012 BART celebrates 40 years of service and, on the day of the Giants’ World Series victory parade, carries the most riders ever, nearly 570,000
2014 BART-to-Oakland International Airport Project to open in fall 2014
2-1

Overview of BART System
GOVERNANCE AND ORGANIZATIONAL STRUCTURE Nine publicly elected directors form BART’s governing board. BART is one of three transit systems in the country with an elected board. The members of other transit agency’s boards are appointed. A member of the BART Board:
Serves a four-year term Represents approximately 374,000 residents in one of nine election districts
that comprise the three-county District Provides strategic and policy guidance to achieve BART’s mission to provide
"safe, reliable, customer-friendly and clean regional public transit" to Bay Area residents and visitors
Represents diverse constituencies, taking a leadership role by working with a broad range of stakeholders in the region, state, and nation to promote effective transit policies and political support for regional transit initiatives
Figure 2-2 BART Board of Directors
BART Board of Directors Counties Represented Term Ends in
December
Joel Keller, President Contra Costa 2014
Thomas M. Blalock, P.E., Vice President Alameda 2014
James Fang San Francisco 2014
Zakhary Mallet, AICP Alameda/Contra Costa/San Francisco 2016
John McPartland Alameda 2016
Gail Murray Contra Costa 2016
Robert Raburn, Ph.D Alameda 2014
Tom Radulovich San Francisco 2016
Rebecca Saltzman Alameda/Contra Costa 2016
2-2

Overview of BART System
Organizational Structure BART’s staff is one of the organization’s greatest resources in providing safe and reliable daily service to the Bay Area. Figure 2-3 below provides an overview of BART’s staff.
Figure 2-3 BART Staff Statistics
Operating and capital employees, per FY14 Budget* 3,420 total positions *Some positions are vacant. The following is a profile of BART employees as of February 2014: Gender 2,436 Male
849 Female Age (average) 49.5 years (age range 19.5 to 81.9 years) Ethnicity** American Indian/Alaska Native 22
Asian 810
Black/African American 828
Hispanic/Latino 446
Native Hawaiian/Other Pacific Islander 12
White 1,167
Average length of employment 12.8 years Average salary (without benefits) $77,641 annually Number of retirees 2,115 **The Federal Transit Administration uses these racial categories and category names
BART budgets and reports financial and operating statistical data on a fiscal year (FY) basis, July to June.
Union Representation
BART has five employee and collective bargaining agreements, covering 85.8% of BART’s workforce, which expire in FY17. Union membership, based upon positions budgeted for FY14, is shown in Figure 2-4. The remainder of BART staff is non-represented.
Figure 2-4 Union Membership
Union Membership
Service Employees International Union 1021 1,529
Amalgamated Transit Union Local 1555 902
American Federation of State, County and Municipal Employees Local 3993
249
BART Police Officers Association 240
BART Police Managers Association 46
Figure 2-5 shows BART’s organizational structure for the FY15 Budget. BART has five Board-appointed positions: General Manager, General Counsel, Controller-Treasurer, District Secretary, and Independent Police Auditor. BART is the only transit district in California with a dedicated police department. BART Police provide a full range of law enforcement services within its jurisdiction.
2-3

Overview of BART System
Figure 2-5 BART Organizational Chart (FY15 Budget)
BOARD OF DIRECTORS
POLICE CHIEFKenton Rainey
SAN FRANCISCO BAY AREA RAPID TRANSITFY15 Adopted Budget
ORGANIZATION CHART
Transportation
Engineering
Security Programs &Emergency Management
Professional Standards/Training
Program Management
Operations
BART Extensions
CONTROLLER-TREASURERScott L. Schroeder
GENERAL MANAGER
Grace Crunican
AGM, PLANNING & DEVELOPMENT
Robert Powers
Planning
District Architect
INDEPENDENT POLICE AUDITORMark Smith
GENERAL COUNSELMatthew Burrows
PROGRAM MANAGERLuna Salaver
MANAGING DIRECTOR, CAPITOL CORRIDORDavid Kutrosky
Marketing & Communications
AGM, ADMINISTRATION &BUDGETCarter Mau
Earthquake Safety Program
Stations
DISTRICT SECRETARYKenneth A. Duron
Support Services
System Safety
DEPUTY GENERAL MANAGERMarcia deVaughn
AGM, OPERATIONSPaul Oversier
Transportation & System Service
Rolling Stock & Shops
Maintenance & Engineering
Operations Planning
Mechanical
Systems
Property Development & Real Estate
AGM,EXTERNAL AFFAIRS
Kerry Hamill
Communications
Marketing & Research
Customer Services
Govt & Community RelationsGrant Advocacy/Development
Human ResourcesProcurement
Internal Audit Labor Relations
Operating & Capital Budgets
Planning & Programming
Customer Access
Office of Civil RightsChief Information Officer
AGM, EMPLOYEE RELATIONSAllison Picard
Ethics Officer
2-4

Overview of BART System
SERVICES PROVIDED AND AREAS SERVED
Fixed-Route Rail Service BART operates five lines in Alameda, Contra Costa, San Francisco, and San Mateo counties, as shown in Figure 2-8 on the next page. The current lines and hours of service are given in Figure 2-6 below.
Figure 2-6 BART Routes and Hours of Service
Hours of Service
Route Weekday Saturday Sunday
Pittsburg/Bay Point—SFO1 4 a.m.–12 a.m. 6 a.m. –12 a.m. 8 a.m. –12 a.m.
Dublin/Pleasanton—Daly City 4 a.m. –12 a.m. 6 a.m. –12 a.m. 8 a.m. –12 a.m.
Richmond—Fremont 4 a.m. –12 a.m. 6 a.m. –12 a.m. 8 a.m. –12 a.m.
Richmond—Millbrae2 5 a.m. –8 p.m. 9 a.m. –6 p.m. Not in service
Fremont—Daly City 5 a.m. –7 p.m. 9 a.m. –6 p.m. Not in service
1 Service extended to Millbrae during evenings and weekends
2 Terminates at Daly City during Saturday service
The system’s headways (minutes between trains) are shown in Figure 2-7.
Figure 2-7 BART Headways
Headway (minutes)
Monday through Friday1 Day: 15
Night: 20
Saturday, Sunday and major holidays 20
1 For the Pittsburg/Bay Point—Daly City line, peak period (6 a.m. to 9 a.m. and 4 p.m. to 7 p.m.) headways are 5 or 10 minutes
BART periodically reviews and adjusts service levels, if necessary, to meet varying levels of ridership demand. Changes include lengthening or shortening trains, adding or removing trains scheduled on a route, or even changing a route’s service hours or terminal stations. To provide BART’s current peak period revenue service, 573 cars are required of a total fleet of 669 cars.
Depending on demand, holiday rail service is operated on a full or modified weekday schedule, or a Saturday or Sunday schedule. BART service is also coordinated with major Bay Area events. Additional rail service for special events is provided by either adding cars to regularly scheduled trains, placing additional trains in service, or providing revenue operations at times when the system is normally closed (e.g., early Sunday morning opening for the annual Bay-to-Breakers footrace in San Francisco).
2-5

Overview of BART System
Figure 2-8 BART System Map
Demand Responsive Service BART complies with the Americans with Disabilities Act (ADA) requirement to provide paratransit service comparable and complementary to the BART system. Federal regulations define the ADA paratransit service area as a 0.75-mile radius around each BART station.
Paratransit service is available to persons who are prevented from using the accessible fixed-route services BART offers due to a disabling health condition. BART participates in a regional ADA eligibility process followed by the principal transit operators in the San Francisco Bay Area. BART, together with other Bay Area transit agencies, works to coordinate regional paratransit travel through the Bay Area Partnership Accessibility Committee.
2-6

Overview of BART System
Paratransit Partnerships with Other Operators
To provide effective paratransit service in its service area, BART partners with the following transit operators:
AC Transit: In their areas of joint service, BART and AC Transit fund and administer the East Bay Paratransit Consortium (EBPC). Service is provided through contractors. BART assumes 31% and AC Transit 69% of the broker and service provider costs based on their proportionate areas of responsibility. They have split the cost of the Program Coordinator’s Office 50/50 since FY11. This office provides a neutral central point of contact and fulfills administrative and contract monitoring activities for the two agencies.
SFMTA: BART has a Memorandum of Understanding (MOU) with the San Francisco Municipal Transportation Agency (SFMTA) whereby SFMTA provides service to meet BART's obligation within the City and County of San Francisco. BART reimburses SFMTA for 7.9% of the net cost of ADA paratransit service for all San Francisco riders. BART also pays SFMTA an administrative fee for these services, which is calculated at 4.7% of BART’s annual payment.
Other Agencies: BART has financial agreements with the Contra Costa County Transit Authority (County Connection), Eastern Contra Costa Transit Authority (Tri Delta Transit), and Livermore Amador Valley Transit Authority (LAVTA Wheels). These agencies provide paratransit service on BART’s behalf during the same hours they operate their own ADA paratransit service. BART’s share of the service provided by these operators is small compared to that provided by EBPC and SFMTA.
The efforts of BART and partner operators focus on providing all ride requests to eligible recipients while at the same time controlling costs.
Connecting Services Provided by Other Operators Several Bay Area bus operators provide connecting (or “feeder”) service to BART. These operators are AC Transit, County Connection, Dumbarton Express (operated by AC Transit), Muni (SFMTA), SamTrans (including Caltrain), Santa Clara Valley Transportation Authority (VTA), Tri Delta Transit, Union City Transit, WestCAT, Wheels, and City of Rio Vista.
In the FY15 Budget, BART contributes about $12 million for feeder services provided by AC Transit, Muni, County Connection, Tri Delta Transit, WestCAT, and Wheels. Most of the funding is paid with BART’s share of State Transit Assistance (STA) funds allocated by MTC, and the rest comes from BART’s operating budget.
2-7

Overview of BART System
FARES
Fixed-route Rail Fares BART fares are computed using a distance-based formula with surcharges applied. Fare structure components and fare media, including discounted tickets and transfers, are shown in Figure 2-9. Figure 2-10 details station-to-station fares for BART’s 44 stations.
On January 1, 2014, the following fare change was implemented:
Fares increased by 5.2% on average in accordance with the Board-approved, productivity-adjusted, Consumer Price Index (CPI)-based fare increase program.
The necessary federal Title VI equity analysis and public outreach were performed on this increase, and the Board approved the finding that the increase did not result in a disproportionate impact on protected groups.
Demand Responsive Fares The ADA limits the fare that can be charged for ADA paratransit service to twice the full adult fare for a comparable fixed-route trip. Fares for paratransit services in which BART participates vary widely due to the range of fare structures of BART and local bus agencies.
BART/AC Transit EBPC fares are distance-based and range from $4.00 to $6.00 for trips in the East Bay and from $6.00 to $10.00 for trips into and out of San Francisco.
San Francisco trips that go beyond the BART service territory carried by EBPC also pay an additional Muni paratransit fare of $2.00.
SFMTA paratransit provides travel within San Francisco.
− SF Access ADA service is $2.00 per ride.
− SFMTA also provides non-ADA taxi service for eligible riders at the rate of $5 for $30 worth of service.
Fares for BART's other paratransit partners currently range from $2.50 to $4.00 per trip.
Inter-operator Transfer Arrangements and Fare Coordination BART riders can receive discounted transfer fares for trips on the following operators: AC Transit, County Connection, Muni, Tri-Delta Transit, Union City Transit, VTA, WestCAT, and WHEELS. Discounted transfers are automatically given when the rider uses a Clipper card on AC Transit, Muni, and VTA (Clipper is the Bay Area’s universal fare card that works on many Bay Area transit systems). The rest of the operators accept a paper transfer dispensed in the paid area of the BART station. In addition, Muni and BART have an agreement whereby BART accepts Muni’s “A” Fast Pass, available only on Clipper, for unlimited rides on BART within San Francisco.
2-8

Overview of BART System
BART Plus is an inter-operator agreement between BART and six East Bay bus operators. A BART Plus magnetic stripe ticket functions as a flash pass on the six bus operators and has loaded value available in eight denominations for use on BART. The BART Plus ticket offers BART’s 6.25% high-value discount and a last ride bonus so that, with as little as a nickel left on the ticket, the rider can take a last ride anywhere in the system. The current values of the transfers, Fast Pass, and BART Plus are shown in Figure 2-9.
CUSTOMER INFORMATION BART provides information about its services in stations through advertisements and other publicity, online, and by telephone including:
Website (bart.gov) Mobile web app (m.bart.gov) Email and text subscriptions (bart.gov/alerts) Text on-demand (bart.gov/sms) Third-party applications (bart.gov/apps) Twitter (@sfbart and @sfbartalert) Facebook (facebook.com/bartsf) Youtube (youtube.com/BARTable) Pinterest (pinterest.com/sfbart) Telephone (phone numbers vary depending on location)
2-9

Overview of BART System
Figure 2-9 BART Fare Components and Ticket Prices (as of January 1, 2014)
TRIP LENGTH Minimum Fare: Up to 6 miles $1.85 Between 6 and 14 miles1 $1.93 + 14.1¢/mile Over 14 miles $3.04 + 8.5¢/mile
SURCHARGES
Transbay $0.94 Daly City2 $1.08 San Mateo County3 $1.37 Capital4 $0.13 Premium fare applied to trips to/from SFO $4.27
SPEED DIFFERENTIAL Charge differential for faster or slower than average trips, based on scheduled travel time ±5.4¢/minute
RESULTING FARES
Range 5 $1.85 to $11.65 Average fare (before discounts) 6 $3.68
Average fare paid (after discounts) 6 $3.52
RAIL FARE DISCOUNTS and SPECIAL FARES7
Children under 5 Free
62.5% Discount: $0.65-$4.35 when using Clipper card; $9 mag stripe ticket with $24 ticket value
Children 5 through 12 Persons 65 and over Persons with a qualifying disability Students 13 through 18: 50% discount 8 $16 ($32 ticket value)
Regular adult: 6.25% discount $45 and $60 ($48 and $64 ticket value)
Excursion (entry/exit, same station) 9 $5.55 SEMI-MONTHLY
RAIL/BUS PASS BART Plus (w/$15 to $50 BART value) 10 (6.25% discount, last ride bonus)
$43 to $76 (8 denominations)
MONTHLY RAIL/ Muni PASS 11
“A” Fast Pass (Unlimited monthly use of BART within San Francisco and SF Muni)
$76
ONE-WAY TRANSFERS:
FROM BART TO 12 (issued at rail stations)
County Connection Muni, within San Francisco13 Tri Delta Transit
Union City Transit
VTA (Express buses only at Fremont station) WestCAT
Wheels
Pay $1 of $2 fare (50% disc) Pay $1.50 of $2 fare (25% disc) Pay $1.25 of $2 fare (37.5% disc) Pay $0.50 of $2 fare (75% disc) Pay $2 of $4 fare (50% disc) Pay $1 of $1.75 fare (43% disc) Pay $1 of $2 fare (50% disc)
TWO-WAY TRANSFERS: FROM BART/
TO BART12
AC Transit Pay $1.85 of $2.10 one-way fare (12% disc)
Muni, within San Francisco Pay $1.75 of $2.00 one-way fare (12.5% disc)
Muni, Daly City station Free ($2.00 one-way fare)
ADA SERVICE East Bay Paratransit Consortium14 $4.00-$10.00
All other areas See ADA Paratransit Section
2-10
Overview of BART System
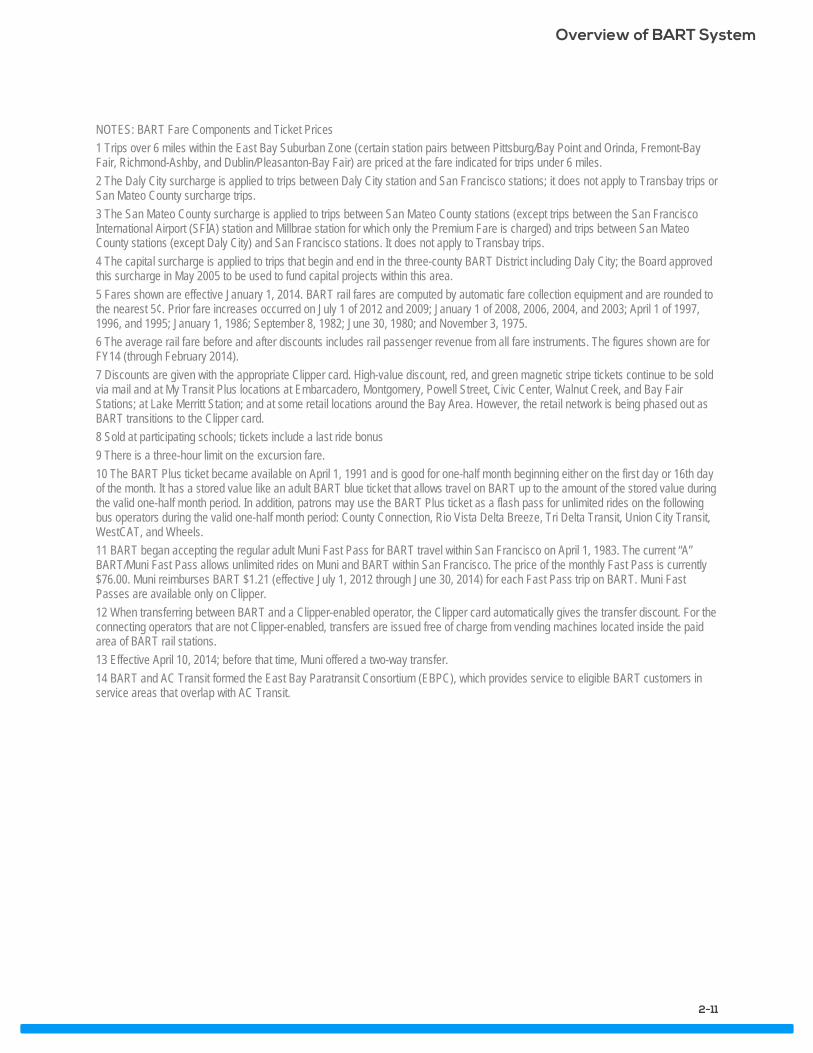
NOTES: BART Fare Components and Ticket Prices 1 Trips over 6 miles within the East Bay Suburban Zone (certain station pairs between Pittsburg/Bay Point and Orinda, Fremont-Bay Fair, Richmond-Ashby, and Dublin/Pleasanton-Bay Fair) are priced at the fare indicated for trips under 6 miles. 2 The Daly City surcharge is applied to trips between Daly City station and San Francisco stations; it does not apply to Transbay trips or San Mateo County surcharge trips. 3 The San Mateo County surcharge is applied to trips between San Mateo County stations (except trips between the San Francisco International Airport (SFIA) station and Millbrae station for which only the Premium Fare is charged) and trips between San Mateo County stations (except Daly City) and San Francisco stations. It does not apply to Transbay trips. 4 The capital surcharge is applied to trips that begin and end in the three-county BART District including Daly City; the Board approved this surcharge in May 2005 to be used to fund capital projects within this area. 5 Fares shown are effective January 1, 2014. BART rail fares are computed by automatic fare collection equipment and are rounded to the nearest 5¢. Prior fare increases occurred on July 1 of 2012 and 2009; January 1 of 2008, 2006, 2004, and 2003; April 1 of 1997, 1996, and 1995; January 1, 1986; September 8, 1982; June 30, 1980; and November 3, 1975. 6 The average rail fare before and after discounts includes rail passenger revenue from all fare instruments. The figures shown are for FY14 (through February 2014). 7 Discounts are given with the appropriate Clipper card. High-value discount, red, and green magnetic stripe tickets continue to be sold via mail and at My Transit Plus locations at Embarcadero, Montgomery, Powell Street, Civic Center, Walnut Creek, and Bay Fair Stations; at Lake Merritt Station; and at some retail locations around the Bay Area. However, the retail network is being phased out as BART transitions to the Clipper card. 8 Sold at participating schools; tickets include a last ride bonus 9 There is a three-hour limit on the excursion fare. 10 The BART Plus ticket became available on April 1, 1991 and is good for one-half month beginning either on the first day or 16th day of the month. It has a stored value like an adult BART blue ticket that allows travel on BART up to the amount of the stored value during the valid one-half month period. In addition, patrons may use the BART Plus ticket as a flash pass for unlimited rides on the following bus operators during the valid one-half month period: County Connection, Rio Vista Delta Breeze, Tri Delta Transit, Union City Transit, WestCAT, and Wheels. 11 BART began accepting the regular adult Muni Fast Pass for BART travel within San Francisco on April 1, 1983. The current “A” BART/Muni Fast Pass allows unlimited rides on Muni and BART within San Francisco. The price of the monthly Fast Pass is currently $76.00. Muni reimburses BART $1.21 (effective July 1, 2012 through June 30, 2014) for each Fast Pass trip on BART. Muni Fast Passes are available only on Clipper. 12 When transferring between BART and a Clipper-enabled operator, the Clipper card automatically gives the transfer discount. For the connecting operators that are not Clipper-enabled, transfers are issued free of charge from vending machines located inside the paid area of BART rail stations. 13 Effective April 10, 2014; before that time, Muni offered a two-way transfer. 14 BART and AC Transit formed the East Bay Paratransit Consortium (EBPC), which provides service to eligible BART customers in service areas that overlap with AC Transit.
2-11

Overview of BART System
Figure 2-10 BART Station-to-Station Fare Table (effective January 1, 2014)
2-12

Overview of BART System
PHYSICAL INFRASTRUCTURE AND CAPITAL ASSETS As a fixed rail system that carries riders across four counties, BART is a capital-intensive system. BART operates and maintains a wide variety of capital assets and manages a great deal of physical infrastructure throughout the Bay Area such as railcars, tracks, stations, and maintenance facilities. BART’s infrastructure is valued at $21 billion.
Most of this infrastructure is over 40 years old and at, or close to, the end of its useful life, placing increasing strain on the system to maintain its high performance and meet growing demand. BART staff estimates that $6.5 billion of BART’s infrastructure is now in poor or very poor condition. BART has recently developed an Asset Management Strategy which is designed to efficiently and effectively rebuild this high performing but quite old transit system into a new world class system over the next 10 years. The strategy is specifically designed to show maximal value for money and to manage safety, operational, and financial risk.
BART’s Comprehensive Asset Management Program: Allocating Limited Resources to High Value Investments Over the last two years, BART staff has been developing a comprehensive Asset Management Program (AMP) and a Budget Project Governance Group to guide BART’s long-term financial plan and ensure it adequately addresses system reinvestment, minimizes risk, and maintains financial stability. The Asset Management Strategy is a product of the AMP.
The comprehensive AMP allows BART to take a more systematic, risk-focused approach to prioritizing investment of scarce resources for both operating and capital needs. BART’s 40,000+ assets are generally divided into six broad categories: Guideways, Facilities, Non-Revenue Vehicles, Systems, Revenue Vehicles, and Support. BART has developed six asset management plans based on these categories that serve as a roadmap for implementing the Asset Management Strategy.
Each asset management plan includes a risk management plan. The comprehensive risk framework assesses the likelihood of near-term failure for each asset and the consequent impact on the BART system, rather than merely considering age or condition, as has been done in the past.
The six plans are combined into the comprehensive Asset Management Strategy for BART to guide the effective allocation of resources. The Asset Management Strategy is used to screen capital projects and inform funding allocations for BART’s annual capital budgets going forward.
The Budget Project Governance Group
To manage and implement the AMP, BART has established a Budget Project Governance Group (BPGG). The BPGG will be responsible for linking the asset management plans with the annual budget process and ensuring that funding decisions minimize BART’s safety, operational, and financial risks.
2-13

Overview of BART System
The BPGG includes staff from a broad range of BART departments to ensure the full range of system functions is considered, which includes:
Planning and Development Office of the Chief Information Officer Transportation Rolling Stock and Shops Maintenance and Engineering (including Asset Management) Administration and Budget External Affairs System Safety Operations Planning BART Police Department
The role of the BPGG is evolving, but its overall mission is to:
Guide where BART spends its money to get the best long-term value for its investment
Identify initiatives and innovations that can reduce net long-term operating and maintenance costs for the set target service levels and risks
Provide guidance on communicating with the community and customers on how to address our asset needs
Over the course of the next year, BART will further define how the AMP and BPGG will be linked to the annual budget and long-term financial plan.
BART Stations Stations are the point of entry for passengers accessing the BART system. BART has 44 stations: 16 subway, 12 elevated, and 16 at grade (ground level).
Platform length is typically about 700 feet to fit the maximum train length of 10 cars
Stations are spaced on average between 1/2 to 1 mile apart within and near San Francisco, Oakland, and Berkeley downtown areas, and 2 to 10 miles apart in suburban areas
Automated fare collection equipment accepts cash, credit cards, and debit cards to vend and process magnetic stripe tickets and to load Clipper cards
Rider information is provided through the following means:
− Platform-level automated train destination signs that show an arriving train's destination and other information
− Platform and concourse-level special displays provide train schedules, local area destinations, connecting transit, and other information
− A public address system linked to BART's Operations Control Center (OCC) gives additional passenger information; station agents also use it to make in-station announcements
2-14

Overview of BART System
− Station agent booths provide electronic message boards displaying elevator status
Riders enter and exit the stations from the street-level and traverse from mezzanine to platform levels by stairways, elevators and escalators
− BART works hard to ensure that its stations are clean and bright, as well as functional and accessible to all riders. In FY14, BART added more station cleaning crews to improve station and elevator cleanliness, which includes station cleaning, painting, and making upgrades and repairs. In FY15, BART is adding two staff crews that will be responsible for deep-cleaning stations.
Station Access BART’s Access Guidelines (2004) are meant to guide policy and investment decisions about access to BART stations. The guidelines include an Access Hierarchy, shown in Figure 2-11.
Figure 2-11 BART’s Access Hierarchy
According to BART’s latest Station Profile Survey (2008), the overall access mode share to the stations was as follows:
Car: 49% Walking: 31% Transit: 15% Bicycle: 4%
2-15

Overview of BART System
The most notable changes since the previous Station Profile Survey (1998) were the increase in the walking mode share (5 percentage points) and the decrease in the transit mode share (8 percentage points). The next Station Profile Survey is scheduled to be conducted in Fall 2014.
BART has intermodal areas at most of its stations, dedicated to providing convenient access for many forms of connecting transportation: buses, shuttles, taxis, passenger dropoffs and pickups, paratransit service, and ADA accessible loading areas. Bus bays for public transit partners are designed with shelters, some of which provide real-time departure information. Possible initiatives include creating a dedicated area for shuttle stops, which may include adding signage and, in some cases, reconfiguring or reassigning the limited space for buses in the intermodal area; adding more secure bicycle parking (i.e. bike stations); and removing barriers to pedestrian access within station areas.
Pedestrian Infrastructure
At BART’s urban stations, which do not have BART maintained parking, sidewalks, or associated pedestrian infrastructure (crosswalks, pedestrian countdown signals, etc.), pedestrian facilities are provided as part of the street networks under control of local jurisdictions. All other BART stations, which are surrounded by station areas under BART jurisdiction, have sidewalks along driveways and bus zones that connect the surrounding street networks to the station entrances. Elevated stations within freeway medians (such as the Dublin/Pleasanton and West Dublin/Pleasanton stations) have pedestrian bridges.
Access within BART stations is provided by stairways, elevators, and escalators that connect the street level to concourse and platform levels. BART also works closely with partner jurisdictions to ensure good pedestrian accessibility to stations around the perimeters of the station areas. In FY15, BART is funding extra pedestrian improvements at Daly City, Orinda, and Coliseum stations.
All BART stations also have facilities to accommodate people with disabilities. For example, all stations have at least one ADA accessible path. Stations also provide curb cuts with yellow tactile detectable warning strips which assist the visually impaired to safely transit between the street and the sidewalk.
Transit and Shuttle Infrastructure
The number of bus lines serving BART stations ranges from a single route (e.g. Orinda) to 15 or more (e.g. Downtown Berkeley). Fifteen percent of patrons traveling on weekdays from home to BART use public transit to access BART stations. BART makes payments to the local transit operators via feeder service agreements in return for this service.
BART coordinates with local transit providers and shuttle operators to provide access to its stations. Of BART’s 44 stations, 26 have dedicated bus stops and layover space within the station area. At the remaining 18 stations, most of which are in urban environments, there are bus stops within the public right-of-way, often immediately adjacent to the station entrances. At San Francisco’s downtown stations (Embarcadero, Montgomery Street, Powell Street, and Civic Center), BART
2-16

Overview of BART System
shares the concourse level with Muni light rail train (LRT) lines, providing convenient integration between systems. At Millbrae station, BART shares the station area with Caltrain.
There are at least 100 privately- and publicly-operated shuttles that make stops at BART stations, At least three-quarters of all BART stations are served by shuttle service(s). These services consist mostly of community shuttles open to the public (e.g. Emery Go-Round, Broadway Shuttle, Daly City Bayshore Circulator), hospital and university shuttles (e.g. Kaiser, Alta Bates, UC Berkeley, UC San Francisco, Cal State University East Bay), single-employer, last-mile shuttles (e.g. Tesla, Clorox, Men’s Wearhouse) multiple-employer, last-mile shuttles (e.g. Sierra Point shuttles, South San Francisco – Oyster Point Shuttle), and single-employer, commuter shuttles (e.g. Genentech, Google, Facebook, Cisco, etc.).
The AirBART shuttle serves Oakland International Airport and is operated by BART in partnership with the Port of Oakland, the owner and operator of the airport. It currently carries an average of 60,000 riders a month. In fall 2014, AirBART will be replaced by the BART-to-Oakland International Airport automated guideway transit system spanning the 3.2 mile distance between the Coliseum BART station and the Oakland International Airport. The service is scheduled to have 4-minute frequencies and under 15-minute total travel times, of which 8.5 minutes will be on the tram.
Bicycle Infrastructure
After several “Bikes on Board” pilot programs, BART implemented a permanent program, effective December 1, 2013, that allows bikes on all trains at all times—with the exception of the peak commute hours (7 a.m. to 9 a.m. and 4:30 p.m. to 6:30 p.m.), during which riders are not allowed to bring their bikes on the first three cars of any train. The first three car rule provides an option for those riders who want to avoid bikes altogether.
Other safety rules relating to bikes still apply:
No bikes are allowed in the first train car at any time Bikes are never allowed on crowded trains Bicyclists must yield priority seating to seniors, people with disabilities and
pregnant women Bikes are not to block doorways or aisles and are not allowed on escalators
Staff will give a status report on the modified bike rules when BART has three consecutive months of an average of 450,000 weekday riders. The report will evaluate customer acceptance, safety and practicality of the modified rules.
For riders who wish to leave their bikes at the station, almost all BART stations have bike racks, over half of BART stations have bike lockers, and four stations now have bike stations, which are secure, protected bike parking areas, often located inside the station. A new bike station near the 19th Street station in Oakland is scheduled to open in the fall of 2014. The figure below shows BART’s bike parking supply.
2-17

Overview of BART System
Figure 2-12 BART Bike Parking Supply
Bike rack spaces 3,424
Bike station spaces 744
Bike locker spaces 1,324
TOTAL BIKE PARKING SPACES 5,492
Car Sharing Infrastructure
Two companies, City Carshare and Zipcar, provide car sharing services at 19 BART stations in eight jurisdictions (El Cerrito, Berkeley, Oakland, Pleasant Hill, Walnut Creek, Concord, San Francisco, and Daly City). Car sharing vehicle pods are usually located in BART parking lots and garages. Patrons arriving at a BART station can pick-up their rented car share vehicle to travel from the station to their final destination and back.
Park-and-Ride Infrastructure
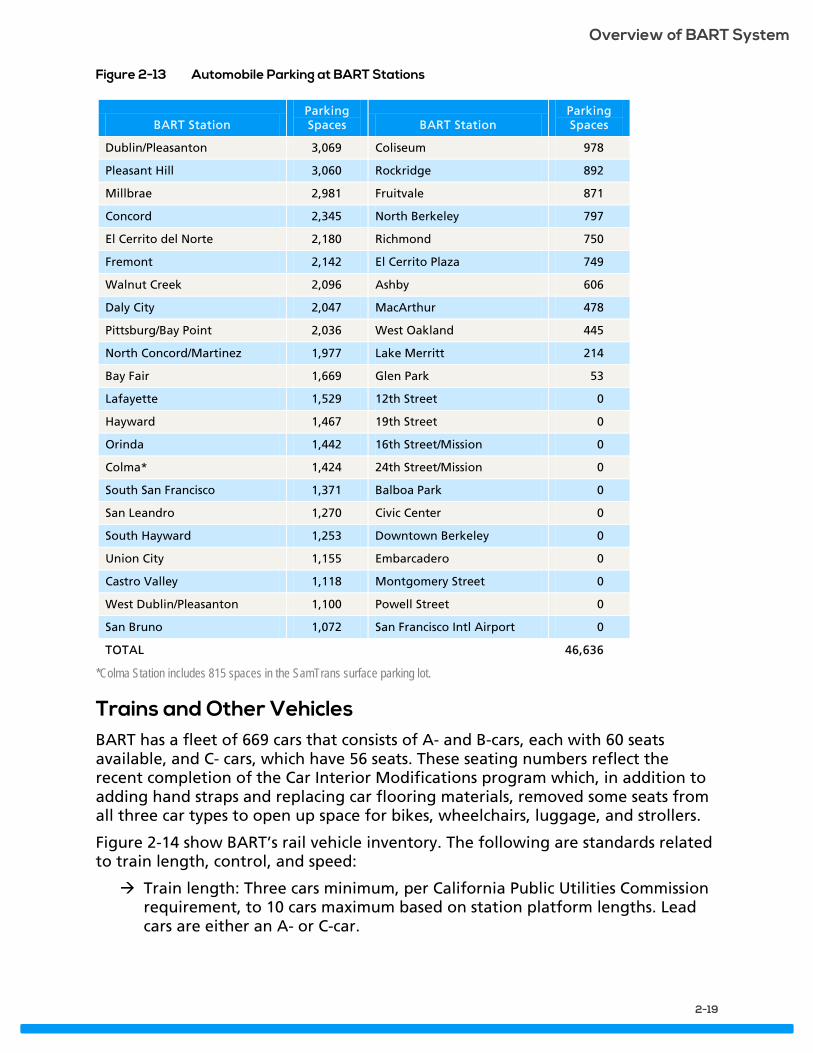
BART has almost 47,000 parking spaces at 33 of its 44 stations, as shown in Figure 2-13. Most of these parking spaces are in surface lots; all other spaces are in BART’s 16 parking structures. Paid parking is one of BART’s larger non-fare revenue sources. BART offers the following paid parking programs: monthly and single-day reserved parking, daily fee parking, and airport/long-term permit parking.
2-18
Overview of BART System
Figure 2-13 Automobile Parking at BART Stations
BART Station Parking Spaces BART Station
Parking Spaces
Dublin/Pleasanton 3,069 Coliseum 978
Pleasant Hill 3,060 Rockridge 892
Millbrae 2,981 Fruitvale 871
Concord 2,345 North Berkeley 797
El Cerrito del Norte 2,180 Richmond 750
Fremont 2,142 El Cerrito Plaza 749
Walnut Creek 2,096 Ashby 606
Daly City 2,047 MacArthur 478
Pittsburg/Bay Point 2,036 West Oakland 445
North Concord/Martinez 1,977 Lake Merritt 214
Bay Fair 1,669 Glen Park 53
Lafayette 1,529 12th Street 0
Hayward 1,467 19th Street 0
Orinda 1,442 16th Street/Mission 0
Colma* 1,424 24th Street/Mission 0
South San Francisco 1,371 Balboa Park 0
San Leandro 1,270 Civic Center 0
South Hayward 1,253 Downtown Berkeley 0
Union City 1,155 Embarcadero 0
Castro Valley 1,118 Montgomery Street 0
West Dublin/Pleasanton 1,100 Powell Street 0
San Bruno 1,072 San Francisco Intl Airport 0
TOTAL 46,636
*Colma Station includes 815 spaces in the SamTrans surface parking lot.
Trains and Other Vehicles BART has a fleet of 669 cars that consists of A- and B-cars, each with 60 seats available, and C- cars, which have 56 seats. These seating numbers reflect the recent completion of the Car Interior Modifications program which, in addition to adding hand straps and replacing car flooring materials, removed some seats from all three car types to open up space for bikes, wheelchairs, luggage, and strollers.
Figure 2-14 show BART’s rail vehicle inventory. The following are standards related to train length, control, and speed:
Train length: Three cars minimum, per California Public Utilities Commission requirement, to 10 cars maximum based on station platform lengths. Lead cars are either an A- or C-car.
2-19

Overview of BART System
Train control: Computers along the right-of-way automatically control train movements, as supervised by the train control computer at the Operations Control Center. Train operators can override the automatic system if needed.
Train speed: Revenue service is based on a maximum speed of 70 miles per hour and an average speed of 34 miles per hour, including station stops.
BART staff also use over 30 other types of vehicles to maintain and service the BART system.
Figure 2-14 BART Rail Vehicle Inventory
Car Type Number in
Fleet Function Date
Manufactured Date
Renovated Size
A2 59 Lead or trail car
1971 to 1975 1995 to 2002 75 feet long by
10.5 feet wide
B2 380 Mid-train car only 70 feet long by
10.5 feet wide
C1 150 Lead, mid-train, or trail
car
1987 to 1990 N/A
C2 80 1995 to 1996
Tracks and Related Infrastructure
BART operates on over 104 route miles of track: 37 miles in subways and tunnels; 23 miles on aerial structures; and 44 miles at ground level. In total, BART uses and maintains approximately 500 miles of linear track counting all tracks running in two (or more) directions, train storage, track sidings, and rail access routes from yards. BART’s grounds and right-of-way include the areas adjacent to ground level trackways and other access points to system facilities. BART also invests in fences around its grounds and other track intrusion prevention, which contributes to maintaining system safety and security.
Maintenance Shops and Yards Planned preventive and unscheduled maintenance for rail cars are performed at four facilities located at or near these stations:
Concord Hayward Richmond Daly City
Accident damage, component, and heavy repairs are performed at the Hayward facility. In addition, BART has a facility in Oakland to perform maintenance on support vehicles and equipment.
In 2006, the Strategic Maintenance Program (SMP) was introduced in the Rolling Stock and Shops department. Essentially, SMP is a proactive maintenance operation aimed at continuous improvement through strategically engineered, planned, and scheduled maintenance and overhaul activities. The SMP’s objective was for BART
2-20

Overview of BART System
to evolve from a reactive run-to-failure car maintenance model to a proactive, planned maintenance model. This strategy succeeded in increasing service reliability for the fleet to a record of 3,757 hours mean time between service delays (MTBSD), an outstanding accomplishment for the oldest rail transit fleet in North America.
Themes for the coming years for BART’s Rolling Stock and Shops focus on supporting increased service levels, commissioning new cars, and expanding the size of the fleet. BART has the oldest fleet in North America and is in the process of procuring new railcars. Until the new cars are online, BART must invest carefully in its existing aging fleet to sustain hard-fought gains in reliability without over-investing in a retiring fleet.
In 2007 BART initiated the procurement of the new railcars and, in 2012, Bombardier was awarded the contract to design and construct the next generation of BART railcar. The current contract is for 775 cars, with BART seeking to expand this quantity to 1,000 cars or more. The first 10 cars are due to BART in 2015 for testing and evaluation, with cars expected to enter service at the end of FY17.
To prepare for the incoming new fleet and for upcoming extensions, BART must expand its maintenance shop capacity. The Hayward Maintenance Complex (HMC) project will provide needed maintenance and storage capacity for car repair shops, component repair shops, and infrastructure shops to support the southern expansion to Warm Springs and Berryessa. This project will reconfigure the existing Hayward revenue vehicle shop for increased primary repair shop capacity and procure a 26-acre parcel for new shops. The new shops introduce a new component repair shop, a vehicle-level overhaul shop, a new central parts warehouse, and a new maintenance and engineering repair shop. This integrated solution meets the requirements for the new revenue car fleet, including expansion of the fleet, while also helping move needed maintenance capacity southward to support maintenance of BART’s 16 miles of extensions.
These projects are further described in Chapter 5.
Vehicle Storage and Staging
BART's current system is configured for five lines of service. These service patterns are supported by four major yards, three of which are primary 24-hour servicing locations.
The four major yards are Concord Yard with 283 revenue vehicles currently assigned, Richmond Yard with 285 vehicles assigned, Daly City Yard with 101 vehicles assigned, and Hayward Yard, which is currently used for program works and specialized repairs. Incidental overnight vehicle storage takes place at the terminal end points of Millbrae, Pittsburg/Bay Point, and Dublin/Pleasanton.
2-21

Overview of BART System
Train Control, Power Systems, Communications, and Administration Most of BART’s administrative staff is located in downtown Oakland at 300 Lakeside Drive near the 19th Street station. The Operations Control Center (OCC) houses BART's central train control computer system that supervises train movements 24 hours a day. OCC train controllers and other BART certified personnel monitor train movements and can override the automatic system if needed. A telephone system connects the OCC to station agents and each station has radios for direct contact to the OCC in the event of emergencies, delays, problems, or other events. In addition, OCC personnel can monitor train movements and activities in and around stations via remote cameras located at key points.
BART systems that control ventilation, coordinate emergency response, and monitor electricity to the system are also located in the OCC facility. BART’s “third rail” provides 1,000 volt DC electricity to propel trains at up to 80 miles per hour.
Security
The safety and security of passengers, employees and the general public is BART’s highest priority. Security measures are implemented at all levels of the BART organization through both operational activities and capital projects. The BART Police Department (BPD) has the lead role for operational security activities and works with other departments to coordinate security programs that are risk based and intelligence driven. BPD uses the principles of Community Oriented Policing and Problem Solving (COPPS) to partner with stakeholders and identify security solutions that address root causes of crime and disorder.
BART identifies security gaps through threat and vulnerability assessments and data analysis. Security committees and change control boards use this information to provide direction and focus for projects that address identified security gaps. BART Facilities Standards (BFS) incorporate Crime Prevention Through Environmental Design (CPTED) concepts to ensure that capital improvement projects provide security by design. BART System Safety and Police Departments both provide input and oversight to ensure that capital projects meet the BFS requirements for safety and security.
2-22

BART Goal Areas, Objectives and Performance Evaluation
3 BART GOAL AREAS, OBJECTIVES, AND PERFORMANCE EVALUATION
This chapter describes the goals and objectives that BART works to achieve, and to what extent the system is meeting these goals. It includes a description of the process used to establish goals and objectives for this SRTP/CIP, the specific indicators that are used to measure performance, and BART’s actual performance over the past 10 years as compared to these indicators. The chapter concludes with an additional section that describes BART’s compliance with Title VI and FTA Triennial Review, as required by MTC’s SRTP guidelines.
DEVELOPMENT OF GOAL AREAS BART’s mission to deliver safe, reliable, customer-oriented transportation service has remained the same throughout its history. Over the years, BART has developed and updated a Strategic Plan to link this mission to more concrete goals and performance indicators. A future update to BART's Strategic Plan will likely include a comprehensive reconsideration of the agency’s goals, which will help guide how BART invests in its future.
In the meantime, to ensure that this document considers BART’s current priorities related to safety, reliability, capacity, and sustainability, this SRTP/CIP has identified five key goal areas to guide the next 10 years of BART’s investments:
Safety Service reliability System effectiveness Customer experience Sustainability
OBJECTIVES AND PERFORMANCE INDICATORS To gauge BART’s progress in each of these goal areas, specific objectives have been identified, each of which has a measureable indicator(s)
3-1

BART Goal Areas, Objectives and Performance Evaluation
associated with it. The FY15 SRTP/CIP goal areas, objectives, and performance indicators are shown in Figure 3-1.
To calculate BART’s current performance, data was drawn from BART’s Quarterly Performance Reports, the biennial Customer Satisfaction Survey, and mandatory metrics reported to MTC as part of the Transit Sustainability Project (TSP). MTC’s TSP recommendations establish performance measures, performance standards, and a monitoring process for BART and the other large transit operators in the Bay Area. Per MTC Resolution 4060, SRTP/CIPs are required to be consistent with the TSP process and demonstrate progress toward achievement of one of the TSP performance measures.
The TSP performance standard is a 5% real reduction by FY17 in at least one of three performance measures and no growth above the Consumer Price Index (CPI) thereafter. The TSP Performance Measures as defined by the Transportation Development Act are:
Cost per service hour Cost per passenger Cost per passenger mile
To account for the results of recent cost control strategies by transit agencies, the baseline year to measure against is set as the highest cost year between FY08 and FY11.
BART’s performance versus the standard for each of these three measures is described in this document. BART has met the cost per passenger and cost per passenger mile standards for the first five year period (FY08-FY13). However, BART’s planned expansion projects may impact BART’s ability to meet these standards in the future. BART will work with MTC to determine how to comply with Resolution 4060 moving forward, given that the costs associated with expansion projects and near-term operations and maintenance needs for an aging system are not specifically addressed in the TSP.
3-2

BART Goal Areas, Objectives and Performance Evaluation
Figure 3-1 BART SRTP/CIP Goal Areas, Objectives, and Performance Indicators
Goal Area Objective Performance Indicator FY13 Performance Standard
FY13 Performance
Service reliability
Improved service reliability
On-time performance1
Customers6: 96% (peak) 96% (daily)
Trains6: 94% (peak) 94% (daily)
Customers: 94.6% (peak) 94.94% (daily)
Trains: 91.7% (peak) 93.1% (daily)
Peak car availability1 573 cars at commencement of morning service
587 cars at commencement of morning service
Mean time between service delays1
3,500 hours between service delays (on average)
3,758 hours between service delays (on average)
Safety
Continued passenger safety incidents1
5.5 station incidents per million passengers 1.3 vehicle incidents per million passengers
5.2 station incidents per million passengers 0.9 vehicle incidents per million passengers
Continued employee safety Injuries to BART workers1
13.3 recordable injuries per OSHA
15.8 recordable injuries per OSHA
System effectiveness
Enhanced efficiency
Cost per revenue vehicle hour2
$240.10 per hour $259.21 per hour
Cost per passenger2 $3.95 per passenger $3.73 per passenger
Cost per passenger mile2 $0.31 per passenger mile $0.29 per passenger mile
Rail farebox ratio3 73.4% 73.7%
Accommodating more passengers Weekday ridership3 376,475 passengers 392,293 passengers
Customer experience
Accessibility and access
Elevator/escalator availability1
Station elevators: 98% Garage elevators: 98% Street escalators: 95% Platform escalators: 96%
Station elevators: 98.6% Garage elevators: 96.9% Street escalators: 89.6% Platform escalators: 94.8%
Customer experience
Overall satisfaction4 N/A 84% Satisfied
BART as "good value"4 N/A 70% Agree
Cleanliness of trains4 N/A
Train interiors: 4.49 Train floors: 4.28 Train seats: 4.18 (1=Poor, 7= Excellent)
Cleanliness of stations4 N/A 4.6 (1=Poor, 7= Excellent)
Customer complaints1 5.07 complaints per 100,000 riders
4.2 complaints per 100,000 riders
Enhanced security Police response time1
5 minute police response time
4.6 minute police response time
Crimes against person/million riders1
2 crimes per million riders 2.2 crimes per million riders
Financial Sustainability
Financial health Prudent reserve5 Maintain an operating reserve equal to 5% of operating costs
$33.1 million
NOTE: BART Performance Standards and FY13 Performance taken from the following sources. 1 BART Quarterly Performance Report 2 Transit Sustainability Project BART Performance Indicators Report 3 BART FY 13 Budget and Quarterly Performance Report 4 2012 Customer Satisfaction Survey 5 BART Financial Stability Policy 6 BART Performance Standard changed in FY15 to Customers: 95% and Trains: 92%.
3-3

BART Goal Areas, Objectives and Performance Evaluation
HISTORICAL BART SYSTEM PERFORMANCE BART reports its performance as compared to established performance standards, a comparison that highlights where the system is succeeding and which areas require more attention. Every three months, the Quarterly Performance Report allows the Board and staff to evaluate the status of a comprehensive set of performance measures; this is the source of much of the data that is provided in this section. BART also relies on data reported to MTC as part of the TSP and the biennial Customer Satisfaction Survey.
Provided below is a 10-year retrospective of three major operating statistics: ridership, annual revenue miles, and annual revenue hours as well as BART’s 10-year financial history. Next, a detailed description of BART’s performance as compared to each of the nine performance standards for the past 10 years (FY04-FY13) is provided.
Ridership Retrospective Ridership is one of the key measures of BART’s success. Between FY04 and FY13, BART’s ridership grew by almost 28%, from 306,600 to 392,300 on an average weekday. Within that timeframe, ridership increased steadily, with one exception in FY10 when ridership gains were interrupted by the effects of the most recent recession. The system also recorded an all-time daily ridership high of almost 570,000 passengers on October 31, 2012 and an all-time high of 117.8 million annual trips for FY13.
Figure 3-2 shows average weekday, Saturday, Sunday, and total annual linked trips for the past 10 fiscal years. Figure 3-3 graphically illustrates the trend in total annual trips over this time period.
Ridership trends largely reflect the health of the economy overall; travel increases when the economy is healthy and declines during times of recession. Described below are key economic milestones and a description of their effects on ridership over the past 10 years:
Starting in the summer of 2003, when the region began pulling out of the 2001 dot-com recession, BART ridership began to increase.
Ridership declined in early 2009 in response to the next recession, with ridership reaching its lowest point in the summer and fall of 2009 (FY10). A year-to-year ridership decline of 10% was observed for the summer of 2009.
Monthly ridership loss persisted until July 2010, when trips started to grow again very slightly.
Although moving in a positive direction, ridership growth was inconsistent until early 2011, when growth of around 4% to 6%
3-4

BART Goal Areas, Objectives and Performance Evaluation
indicated that the region’s recovery from the recession was actually taking hold.
Bay Bridge toll increases and increases in gas prices were also factors that likely contributed to making BART a more attractive option compared to the automobile.
Other factors that impacted ridership fluctuations during the 10-year period are:
Since January 2010, BART ridership in San Francisco has been impacted by Muni’s implementation of a two-tier Fast Pass pricing structure. The “A” Fast Pass, currently $76, is accepted both on Muni and BART within San Francisco, while the “M” Fast Pass, currently $66, is accepted on Muni only. Since the introduction of the more expensive “A” Fast Pass, Fast Pass trips on BART have declined by 41%, from 12.1 million trips in calendar year 2009 to 7.1 million trips in calendar year 2013. This decline has been only partially offset by riders taking intra-San Francisco trips using BART’s fare media.
The West Dublin/Pleasanton Station opened in February 2011. Currently, ridership at this station averages about 6,800 weekday entries and exits combined. About two-thirds of these trips are estimated to be new riders and the rest of trips are assumed to be existing riders who have shifted away from using the existing Dublin/Pleasanton Station.
In general, over the 10-year period, ridership growth on the SFO Extension in San Mateo County outpaced growth in the rest of the system. Ridership grew from approximately 25,000 weekday trips in FY04 (the first year of SFO Extension service) to nearly 46,000 weekday trips in FY13. About 12% of all air travelers at the San Francisco International Airport use BART to access or depart the airport.
BART’s all-time ridership record was set on October 31, 2012, when nearly 570,000 riders took BART on a single day as the region celebrated the Giants’ 2012 World Series victory. The Giants’ World Series victory parade on November 3, 2010 resulted in the second highest number of trips in a day, when over 522,000 people rode BART.
With continued growth in the local economy, FY13 saw strong ridership increases, averaging about 392,300 trips on an average weekday (a 7% increase over FY12). Growing ridership shows the important role BART plays in connecting the Bay Area and in facilitating economic recovery locally.
3-5

BART Goal Areas, Objectives and Performance Evaluation
Figure 3-2 BART Weekday Ridership FY04-FY13 (rounded to nearest 100)
Average Weekday
Trips
Ch
ang
e
Average Saturday
Trips
Ch
ang
e
Average Sunday Trips
Ch
ang
e Total Passenger
Trips (Linked) 1
Ch
ang
e
FY04 306,600 -- 145,400 -- 104,300 – 91,042,200 –
FY05 310,700 1% 150,000 3% 108,700 5% 92,756,100 2%
FY06 323,000 4% 161,900 8% 116,500 6% 96,852,200 4%
FY07 339,400 5% 172,000 6% 124,900 8% 101,704,400 5%
FY08 357,800 5% 181,200 5% 132,500 6% 107,487,600 6%
FY09 356,700 0% 182,800 1% 130,200 -2% 106,874,400 -1%
FY10 335,000 -6% 175,200 -4% 125,300 -4% 101,003,800 -5%
FY11 345,300 3% 173,400 -1% 126,400 1% 103,713,500 3%
FY12 366,600 6% 190,000 10% 138,800 10% 110,777,000 7%
FY13 392,300 7% 202,900 7% 148,200 6% 117,815,100 6%
NOTE: 1 A linked trip is a trip from origin to destination. Even if a passenger must make a transfer, the trip is counted as one linked trip.
Figure 3-3 BART Annual Ridership FY04-FY13
Revenue Service Hours and Miles Retrospective While ridership increased over the past 10 years, BART’s revenue service hours and miles remained steady overall. The following events explain the few fluctuations that did occur over this time period:
Between FY04 and FY07, the variation in service hours and service miles was related to the changing operating plans for serving the SFO extension.
80
90
100
110
120
FY04 FY05 FY06 FY07 FY08 FY09 FY10 FY11 FY12 FY13
Mill
ions
3-6

BART Goal Areas, Objectives and Performance Evaluation
FY08 and FY09 saw an increase in service hours and/or service miles related to the January 2008 increase in off-peak service frequency (off-peak headways were reduced from 20 to 15 minutes).
Service hours and service miles decreased in FY10, following the September 2009 return to 20 minute off-peak headways. The return to prior service levels was mainly due to budget considerations, but declining fleet reliability, due in part to increased off-peak service frequency between January 2008 and September 2009, also had an effect.
Figures 3-4 and Figure 3-5 show a 10-year retrospective summary of BART’s revenue service hours and revenue service miles.
Figure 3-4 BART Revenue Service Hours FY04-FY13 (rounded to nearest 1,000)
Revenue Service Hours
Change from Prior Year
FY04 1,842,000 –
FY05 1,774,000 -4%
FY06 1,820,000 3%
FY07 1,844,000 1%
FY08 1,940,000 5%
FY09 1,941,000 0%
FY10 1,780,000 -8%
FY11 1,774,000 0%
FY12 1,800,000 1%
FY13 1,821,000 1%
1,500 1,550 1,600 1,650 1,700 1,750 1,800 1,850 1,900 1,950 2,000
Thou
sand
s
3-7

BART Goal Areas, Objectives and Performance Evaluation
Figure 3-5 BART Revenue Service Miles FY04-FY13 (rounded to nearest 1,000)
Revenue
Service Miles
Change from Prior Year
FY04 62,373,000 –
FY05 60,004,000 -4%
FY06 62,089,000 3%
FY07 64,330,000 4%
FY08 66,988,000 4%
FY09 67,843,000 1%
FY10 63,237,000 -7%
FY11 63,347,000 0%
FY12 64,266,000 1%
FY13 65,652,000 2%
55
57
59
61
63
65
67
69
Mill
ions
3-8

BART Goal Areas, Objectives and Performance Evaluation
BART Financial Retrospective Figure 3-6 illustrates BART’s actual financial outcomes for the previous 10 fiscal years (FY04 through FY13).
Figure 3-6 BART Operating Financial History ($ millions)
FY04 FY05 FY06 FY07 FY08 FY09 FY10 FY11 FY12 FY13
Operating Revenue
Net rail revenue $219.9 $233.1 $255.6 $281.5 $308.9 $317.5 $331.4 $342.7 $366.5 $406.1
ADA 0.5 0.5 0.6 0.6 0.6 0.6 0.7 0.8 0.9 0.8
Subtotal net passenger revenue 220.4 233.7 256.2 282.1 309.5 318.1 332.0 343.5 367.3 406.9
Parking revenue 4.3 3.8 5.0 8.7 10.2 11.2 11.8 14.0 14.8 15.7
Other operating revenue 11.1 13.3 18.5 22.0 22.1 20.0 24.9 19.5 19.8 20.7
Subtotal non-fare revenue 15.5 17.1 23.4 30.7 32.3 31.2 36.7 33.5 34.6 36.4
Total Operating Revenue 235.9 250.8 279.7 312.8 341.8 349.3 368.7 377.0 402.0 443.3
Tax and Financial Assistance
Sales tax 170.6 178.4 191.7 198.8 202.6 184.3 166.5 180.8 195.2 208.6
Property tax 21.4 22.4 24.3 27.4 29.0 30.4 30.1 29.5 29.7 31.7
State Transit Assistance (STA) 0.0 0.0 3.5 21.2 21.7 0.0 0.0 19.7 18.3 17.3
ARRA grants/feeder swap 0.0 0.0 0.0 0.0 0.0 0.0 25.4 0.0 0.0 0.0
SamTrans - SFO operations 17.9 14.7 10.2 4.7 6.0 2.8 2.9 1.5 0.0 0.0
Allocations from reserves 0.0 12.0 0.0 0.0 5.6 26.5 0.0 0.0 0.0 0.0
Other 2.0 1.9 2.1 7.0 7.2 7.0 9.2 6.7 4.9 6.5
Rail car fund swap 0.0 0.0 0.0 22.7 22.7 22.7 22.7 0.0 26.7 24.0
Total Financial Assistance 211.8 229.5 231.8 281.8 294.8 273.7 256.8 238.2 274.8 288.0
TOTAL SOURCES 447.7 480.2 511.4 594.6 636.6 623.0 625.5 615.1 676.8 731.3
(Continued on following page)
3-9

BART Goal Areas, Objectives and Performance Evaluation
FY04 FY05 FY06 FY07 FY08 FY09 FY10 FY11 FY12 FY13
Expenses
Net labor 275.1 313.1 315.0 326.7 360.6 381.7 352.3 352.9 375.6 401.2
OPEB unfunded liability1 0.0 0.0 0.0 0.0 21.3 5.2 14.4 5.4 5.1 5.8
Traction/station power 24.1 18.1 20.9 34.8 34.6 36.8 35.3 35.3 35.1 37.3
Other non labor 68.4 74.4 80.3 92.8 89.6 91.2 87.4 83.2 99.0 106.7
Subtotal Rail Operating Expenses 367.6 405.6 416.2 454.3 506.1 514.9 489.4 476.8 514.8 551.1
Feeder bus/purchased transportation 4.9 4.8 2.4 2.7 2.8 3.7 11.0 2.6 2.7 3.5
ADA paratransit service 9.4 9.1 9.3 10.0 10.3 11.0 11.9 12.1 12.2 12.4
Rail car fund swap 0.0 0.0 0.0 22.7 22.7 22.7 22.7 0.0 25.9 24.0
Subtotal Non-Rail Expenses 14.4 13.9 11.7 35.4 35.9 37.4 45.6 14.6 40.8 39.9
Total operating expense 381.9 419.5 427.9 489.8 542.0 552.3 534.9 491.4 555.6 591.0
Debt Service and Allocations
Debt service 59.4 59.5 62.7 70.3 65.9 67.7 68.5 59.2 62.3 62.5
Capital and other allocations 8.0 5.5 15.4 25.4 17.2 8.2 33.4 68.4 52.2 31.1
Allocations to/from SFO reserve 0.0 0.0 0.0 1.0 17.5 0.0 0.7 0.0 8.6 7.0
Allocation - rail cars 0.0 0.0 0.0 0.0 0.0 0.0 0.0 0.0 0.0 45.6
Operating reserve allocations 0.0 0.0 8.1 7.6 15.3 0.0 0.0 0.0 3.3 0.0
Total Debt Service and Allocations 67.4 65.0 86.3 104.4 115.9 75.9 102.5 127.6 126.4 146.2
OPEB unfunded liability1 0.0 0.0 0.0 0.0 (21.3) (5.2) (14.4) (5.4) (5.1) (5.8)
TOTAL USES 449.3 484.5 514.2 594.1 636.6 623.0 623.1 613.6 676.8 731.3
ANNUAL FINANCIAL RESULTS ($M) ($1.7) ($4.3) ($2.7) $0.4 $0.0 $0.0 $2.4 $1.5 $0.0 $0.0
Rail farebox ratio 59.8% 57.5% 61.4% 62.0% 61.0% 61.7% 67.7% 71.9% 71.2% 73.7%
Operating ratio 61.8% 59.8% 65.4% 67.0% 65.8% 66.0% 72.0% 76.7% 75.9% 78.2%
Rail cost per passenger mile 29.9¢ 32.3¢ 31.8¢ 33.2¢ 33.5¢ 35.7¢ 35.6¢ 33.0¢ 33.3¢ 33.4¢
NOTES: 1 OPEB: Other Post Employment Benefits.
3-10

BART Goal Areas, Objectives and Performance Evaluation
Service Reliability Evaluation
Service Reliability – On-Time Performance (Customer and Train)
The ability of BART to maintain its published schedules and train frequencies is the single most important factor that impacts customer perception of BART’s reliability. BART measures its on-time performance with regard to its customers and trains during peak hours and on the average weekday. To be “on-time,” a train/customer must arrive at the destination station less than five minutes late compared to published schedules. Train on time represents the percentage of trains that dispatch from their scheduled start point, provide service to all stations without run through, offload or cancellation, and arrive at the end point less than five minutes late compared to schedule arrival. In FY15 BART revised its performance standard to be 95% of its customers on-time and 92% of its trains arrive on-time.
As shown in Figure 3-7, BART has met its customer daily on-time performance benchmarks every year for the last 10 years, and has met the peak period customer on-time performance for the past seven years. However, BART has largely fallen short of delivering 94% of its trains on time over the last 10 years with between 89% and 93% of peak period trains on time and 91% to 94% of daily trains on time (Figure 3-8). While the on-time performance during peak hours is worse than the overall daily on-time performance, it has experienced greater improvement between FY04 and FY13.
3-11
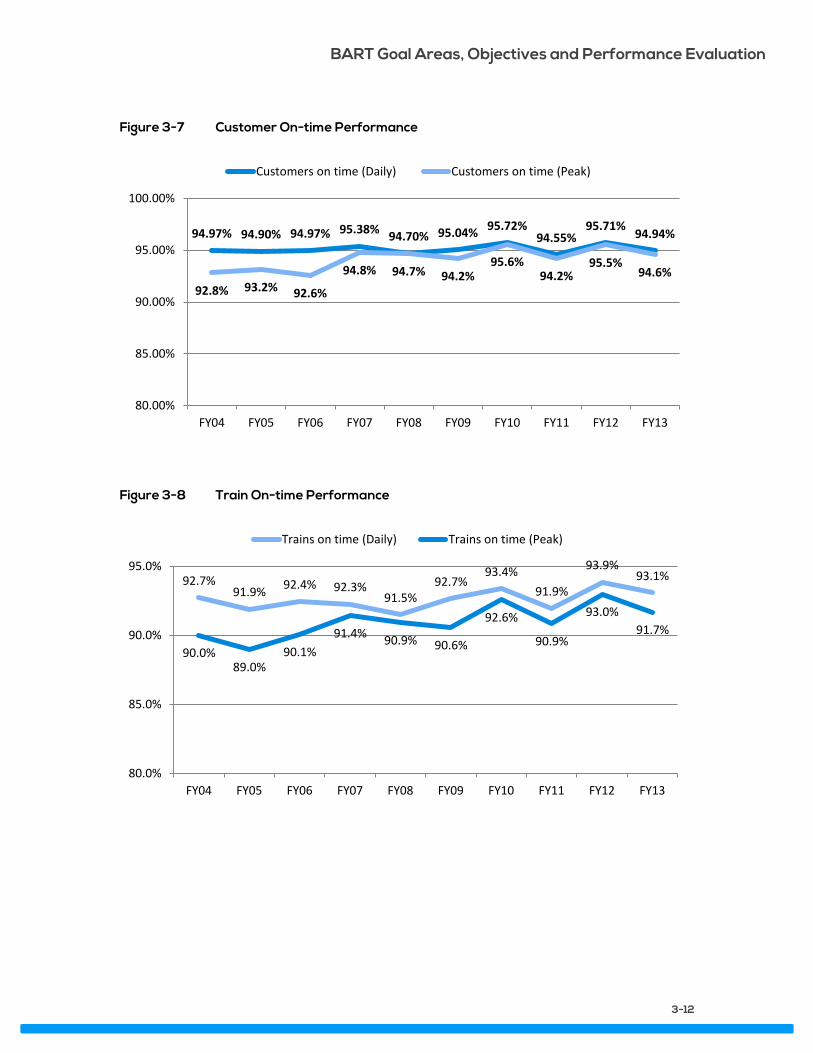
BART Goal Areas, Objectives and Performance Evaluation
Figure 3-7 Customer On-time Performance
Figure 3-8 Train On-time Performance
94.97% 94.90% 94.97% 95.38% 94.70% 95.04% 95.72% 94.55%
95.71% 94.94%
92.8% 93.2% 92.6%
94.8% 94.7% 94.2% 95.6%
94.2% 95.5%
94.6%
80.00%
85.00%
90.00%
95.00%
100.00%
FY04 FY05 FY06 FY07 FY08 FY09 FY10 FY11 FY12 FY13
Customers on time (Daily) Customers on time (Peak)
92.7% 91.9% 92.4% 92.3%
91.5% 92.7%
93.4% 91.9%
93.9% 93.1%
90.0% 89.0%
90.1% 91.4% 90.9% 90.6%
92.6%
90.9%
93.0% 91.7%
80.0%
85.0%
90.0%
95.0%
FY04 FY05 FY06 FY07 FY08 FY09 FY10 FY11 FY12 FY13
Trains on time (Daily) Trains on time (Peak)
3-12
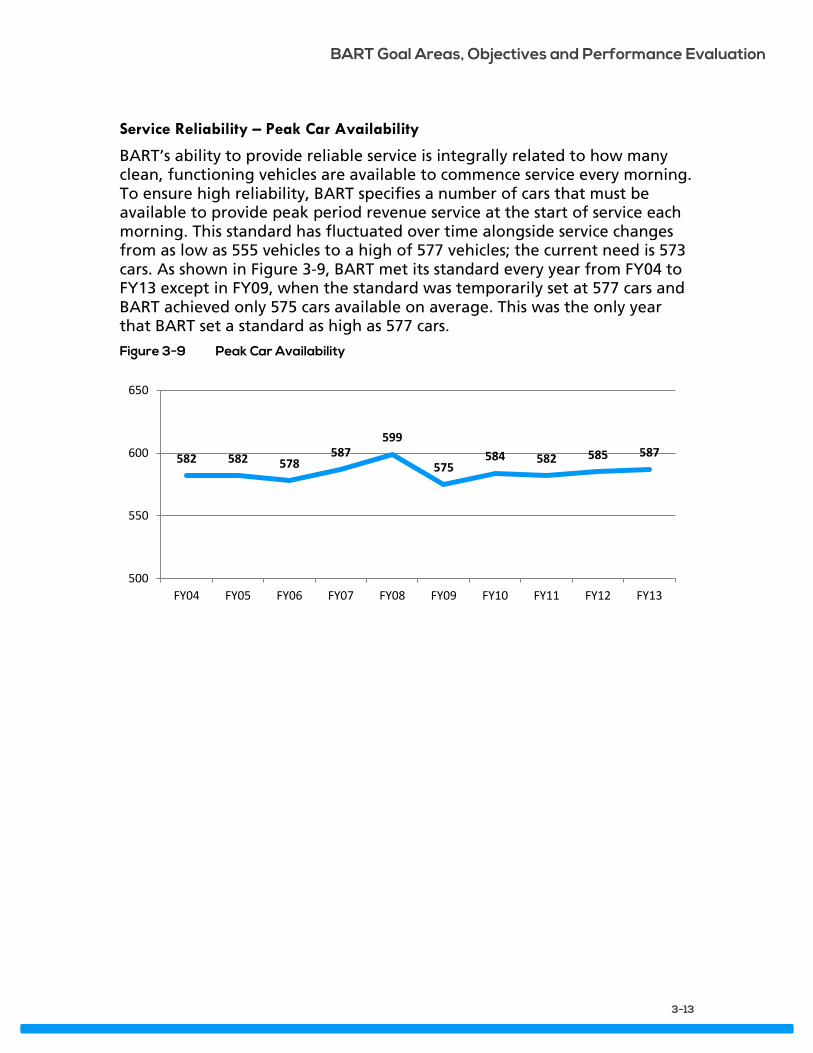
BART Goal Areas, Objectives and Performance Evaluation
Service Reliability – Peak Car Availability
BART’s ability to provide reliable service is integrally related to how many clean, functioning vehicles are available to commence service every morning. To ensure high reliability, BART specifies a number of cars that must be available to provide peak period revenue service at the start of service each morning. This standard has fluctuated over time alongside service changes from as low as 555 vehicles to a high of 577 vehicles; the current need is 573 cars. As shown in Figure 3-9, BART met its standard every year from FY04 to FY13 except in FY09, when the standard was temporarily set at 577 cars and BART achieved only 575 cars available on average. This was the only year that BART set a standard as high as 577 cars.
Figure 3-9 Peak Car Availability
582 582 578 587
599
575 584 582 585 587
500
550
600
650
FY04 FY05 FY06 FY07 FY08 FY09 FY10 FY11 FY12 FY13
3-13

BART Goal Areas, Objectives and Performance Evaluation
Service Reliability – Mean Time Between Service Delays
Another standard indicator used by transit agencies to track the reliability of their infrastructure is the amount of time that passes, on average, between service failures. BART aims for a minimum of 3,500 hours as the mean time between service failures. From FY04 to FY13, BART has steadily improved its performance with regard to this indicator, almost doubling the average time that elapses between failures from 1,901 hours in FY04 to 3,758 hours in FY13 (Figure 3-10). This steady improvement is a result of refinements in BART’s asset maintenance and management strategy under the SMP.
Figure 3-10 Mean Time Between Service Delays (hours)
1,901 2,016 2,435
3,004 3,007 2,683 2,796
2,995 3,216
3,758
-
500
1,000
1,500
2,000
2,500
3,000
3,500
4,000
FY04 FY05 FY06 FY07 FY08 FY09 FY10 FY11 FY12 FY13
3-14

BART Goal Areas, Objectives and Performance Evaluation
Safety Evaluation
Continued Passenger Safety – Incidents
BART has consistently met its standards for passenger safety for the past 10 years as measured by station and vehicle incidents per million passengers. BART sets a goal of no more than 5.5 station incidents per million passengers and 1.3 vehicle incidents per million passengers. Station incidents and vehicle incidents are all incidents that meet the FTA criteria as “reportable” (mostly injuries and illnesses) and occur either in BART station areas or on BART train cars.
Between FY04 and FY13, station incidents have consistently met this standard. The average number of vehicle incidents also has been consistently less than 1.3 incidents per million passengers for the 10 year period; every year except FY04 had less than one incident per million passengers, as shown in Figure 3-11.
Figure 3-11 Incidents
Continued Employee Safety – Injuries in BART Workers
BART takes the safety of its employees very seriously. As such, reducing workplace incidents is a high priority. One metric BART uses to monitor its performance in keeping its employees safe is the number of worker injuries. The actual safety standard is calculated according to national standards provided by the Occupational Safety and Health Administration (OSHA) of the U.S. Department of Labor. OSHA provides “incidence rates,” which show the relative level of injuries and illnesses among different industries, organizations, or operations within a single organization. These rates are
5.5 5.1 4.9
4.2 4.1 4.3 4.3 4.2
3.9
5.2
1.4 0.9 0.9 0.6 0.8 0.9 0.9 0.8 0.9 0.9
0.0
1.0
2.0
3.0
4.0
5.0
6.0
FY04 FY05 FY06 FY07 FY08 FY09 FY10 FY11 FY12 FY13
Station Incidents Per Million Patrons Vehicle Incidents Per Million Patrons
3-15
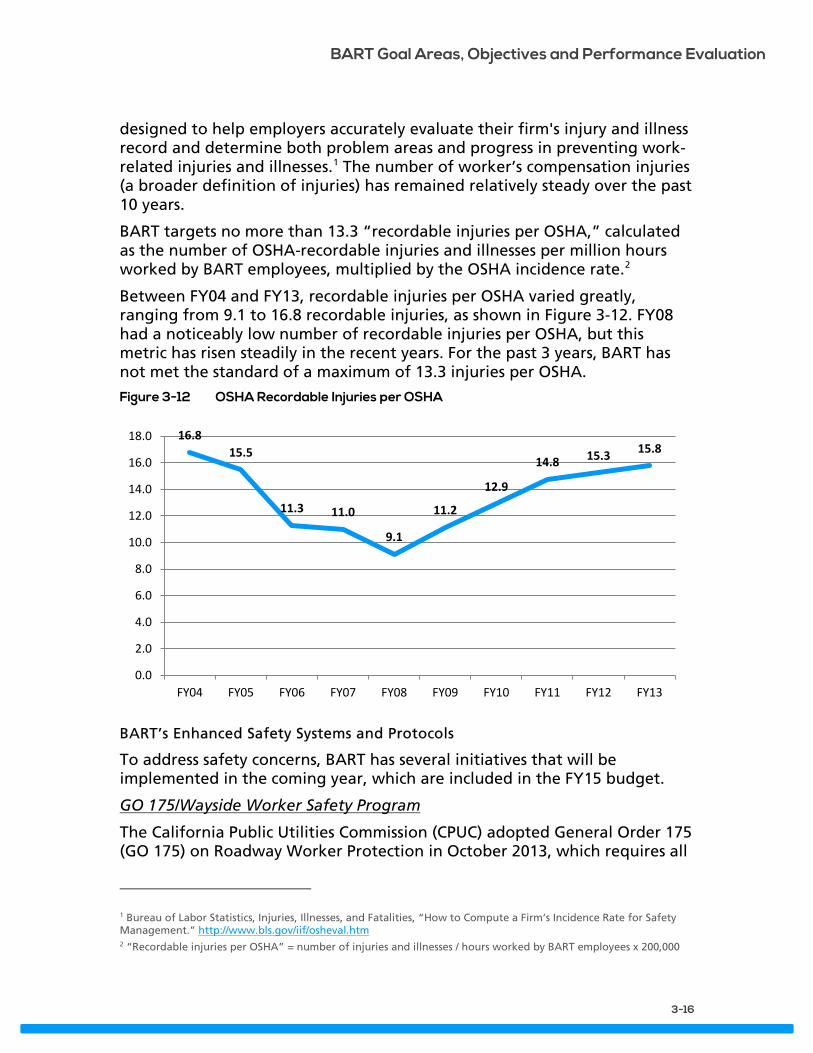
BART Goal Areas, Objectives and Performance Evaluation
designed to help employers accurately evaluate their firm's injury and illness record and determine both problem areas and progress in preventing work-related injuries and illnesses.1 The number of worker’s compensation injuries (a broader definition of injuries) has remained relatively steady over the past 10 years.
BART targets no more than 13.3 “recordable injuries per OSHA,” calculated as the number of OSHA-recordable injuries and illnesses per million hours worked by BART employees, multiplied by the OSHA incidence rate.2
Between FY04 and FY13, recordable injuries per OSHA varied greatly, ranging from 9.1 to 16.8 recordable injuries, as shown in Figure 3-12. FY08 had a noticeably low number of recordable injuries per OSHA, but this metric has risen steadily in the recent years. For the past 3 years, BART has not met the standard of a maximum of 13.3 injuries per OSHA.
Figure 3-12 OSHA Recordable Injuries per OSHA
BART’s Enhanced Safety Systems and Protocols
To address safety concerns, BART has several initiatives that will be implemented in the coming year, which are included in the FY15 budget.
GO 175/Wayside Worker Safety Program
The California Public Utilities Commission (CPUC) adopted General Order 175 (GO 175) on Roadway Worker Protection in October 2013, which requires all
1 Bureau of Labor Statistics, Injuries, Illnesses, and Fatalities, “How to Compute a Firm’s Incidence Rate for Safety Management.” http://www.bls.gov/iif/osheval.htm 2 “Recordable injuries per OSHA” = number of injuries and illnesses / hours worked by BART employees x 200,000
16.8 15.5
11.3 11.0
9.1
11.2
12.9
14.8 15.3 15.8
0.0
2.0
4.0
6.0
8.0
10.0
12.0
14.0
16.0
18.0
FY04 FY05 FY06 FY07 FY08 FY09 FY10 FY11 FY12 FY13
3-16

BART Goal Areas, Objectives and Performance Evaluation
California rail transit agencies to comply with a comprehensive set of safety requirements for wayside workers. In response, BART has developed and is in the process of implementing a new and enhanced wayside program. It includes more restrictive operating rules on wayside activities and procedures for how these activities should be performed by BART wayside workers and contractors. The program’s goal is to provide improved protection for employees in the BART right-of-way. To that end, BART has to acquire additional resources to fully implement the new roadway worker protection program and comply with GO 175.
Under the new program, work orders from the Operations Control Center (OCC) are required for all work performed in the trackway during revenue hours. Work orders result in reduced train speeds and, therefore, negatively impact service. BART plans to reduce the negative impact by moving most of the scheduled maintenance work from daytime hours to overnight hours. However, this will require a significant increase in the number of maintenance personnel to schedule, prioritize, plan, and perform this new work load during non-revenue hours. This displaced work load is in addition to the nightly maintenance work, CPUC-mandated inspections, and capital project support that already must be performed during the non-revenue service hours. As roadway worker activities increase during the non-revenue service hours, BART will also need new resources to focus on wayside safety implementation and to provide safety support during this critical organizational change. These resources will also assist in administering the new near-miss reporting program, another requirement of GO 175.
Starting in FY15, BART will be investing $5.3 million in operating funds to address these new safety rules, including 40 additional positions with ongoing annual operating costs. This investment includes the establishment of a Maintenance Operations Center (MOC) to coordinate maintenance activities during non-revenue hours. The FY15 capital budget includes $1.7 million of a $4.0 million project to construct right-of-way fencing at strategic locations that will provide additional worker safety and allow for staging of maintenance work during revenue hours. These additional investments are necessary to ensure that BART complies with GO 175 and that BART staff has the time and equipment necessary to maintain the track, traction power, and train control systems in proper working condition.
Safety Culture Improvement Program
In addition to GO 175-required investments, BART’s Safety Department will implement a Safety Culture Improvement Program (SCIP) in FY15, with a goal to reduce injury rates. This interdisciplinary program will include enhanced tracking of safety metrics and inspections, enhanced employee safety training, and an incentive program to reward employees who are working safely. In the first year, select BART departments will participate in a
3-17

BART Goal Areas, Objectives and Performance Evaluation
pilot program. The program will then be evaluated and pending results and necessary adjustments, it will expand to additional departments in the District. The goal of the program is to reduce injury rates and associated costs to a point where the program can pay for itself. The program is currently under development and projected to be rolled out during the last quarter of FY15.
Safety Management Software Program
BART is also undertaking an initiative to implement a new Safety Management Software Program (SMSP) in FY15. System Safety staff needs to replace several antiquated databases that are used to store, process, and manage safety data. Currently, information from hundreds of handwritten injuries reports and Unusual Occurrence Reports must be manually entered—a labor-intensive process. Further, these safety data, information, and trends are not available to System Safety staff and managers in a timely fashion.
SMSP can drastically reduce paper-based reports, increase productivity at various departments, and improve the efficiency of safety data reporting. The SMSP contains a "safety dashboard" that provides the status of real-time system safety health and enhances the accountability of all departments for their safety performance. Overall, SMSP significantly improves how safety issues are tracked, managed, and closed and gives all personnel access to that real-time information simultaneously.
System Effectiveness Evaluation Three of the most common metrics used by transit agencies to measure system efficiency and cost effectiveness are the three reported here: cost per vehicle hour, per passenger, and per passenger mile. These are also the three metrics established by the TSP recommendations (MTC Resolution 4060) that all large Bay Area transit operators must meet. The TSP standard is set as the highest cost year between FY08 and FY11 and the performance standard is a 5% real reduction in at least one of three performance measures by FY17. For BART, this means that the system must achieve one of the following three performance standards by FY17 (all are denominated in FY08 constant dollars which is the baseline year for the TSP):
Cost per revenue vehicle hour = $240.10 Cost per passenger (unlinked) = $3.95 Cost per passenger mile = $0.31
Another indicator commonly used by BART to measure efficiency, effectiveness, and productivity is the rail farebox ratio, reported in Figure 3-16.
3-18

BART Goal Areas, Objectives and Performance Evaluation
Enhanced Efficiency – Cost per Revenue Vehicle Hour
Between FY04 and FY13, cost per revenue vehicle hour has fluctuated from $227 per hour up to $261 per hour in the most recent year for which there is data (Figure 3-13). As of FY13, BART is not meeting the TSP standard of $240 per revenue vehicle hour, maximum.
Figure 3-13 Cost per Revenue Vehicle Hour (in FY08$)
Enhanced Efficiency – Cost per Passenger
Due to increasing ridership between FY04 and FY13, BART’s cost per passenger steadily decreased from $4.29 to $3.76 per passenger (Figure 3-14). Therefore, BART is already meeting its TSP standard of $3.95 per passenger and has been for the past 3 years.
Figure 3-14 Cost per Passenger (in FY08$)
$227 $254 $246 $257 $247 $245 $253 $242 $251 $261
$0
$50
$100
$150
$200
$250
$300
FY04 FY05 FY06 FY07 FY08 FY09 FY10 FY11 FY12 FY13
$4.29 $4.55
$4.32 $4.35 $4.16 $4.15 $4.16 $3.87 $3.83 $3.76
$0.00 $0.50 $1.00 $1.50 $2.00 $2.50 $3.00 $3.50 $4.00 $4.50 $5.00
FY04 FY05 FY06 FY07 FY08 FY09 FY10 FY11 FY12 FY13
3-19

BART Goal Areas, Objectives and Performance Evaluation
Enhanced Efficiency – Cost per Passenger Mile
Like the prior metric, between FY04 and FY13, BART’s cost per passenger mile exhibited a decreasing trend, declining from $0.34 in FY04 to $0.29 in FY13 (Figure 3-15). Also like the prior metric, for the past 3 years, BART has been meeting the TSP standard of $0.31 per passenger mile.
Figure 3-15 Cost per Passenger Mile (in FY08$)
$0.34 $0.36
$0.34 $0.35 $0.33 $0.33 $0.32
$0.30 $0.29 $0.29
$0.00
$0.05
$0.10
$0.15
$0.20
$0.25
$0.30
$0.35
$0.40
FY04 FY05 FY06 FY07 FY08 FY09 FY10 FY11 FY12 FY13
3-20

BART Goal Areas, Objectives and Performance Evaluation
Enhanced Efficiency – Rail Farebox Ratio
The rail farebox ratio is the portion of rail operating cost that is funded through passenger fares. BART recovered approximately 73.7% of operating expenses from fares in FY13, exceeding the FY13 performance standard of 73.4%. In fact, BART has historically had one of the highest farebox ratios among all operators of heavy rail in the U.S., as shown in the Figure 3-16. The last 10 years of BART’s farebox ratio is shown in Figure 3-6 above.
Figure 3-16 Farebox Ratios for U.S. Heavy Rail Operators (2012)3
Agency Farebox Ratio
BART 75.0%
New York City Transit (NYCT) 73.2%
Washington Metropolitan Area Transit Authority (WMATA) 67.5%
Port Authority Transit Corporation (PATCO) 57.1%
Southeastern Pennsylvania Transportation Authority (SEPTA) 52.8%
Massachusetts Bay Transportation Authority (MBTA) 52.4%
Chicago Transit Authority (CTA) 51.0%
Metropolitan Atlanta Rapid Transit Authority (MARTA) 39.6%
LA County Metropolitan Transportation Authority (LA Metro) 31.9%
Source: National Transit Database (NTD) 2012 data
3 National Transit Database (NTD) data, the source of these figures, excludes certain operating expenses, such as building leases, legal settlements, and Other Post Employment Benefits (OPEB). As a result, BART’s NTD farebox ratio is slightly higher than the numbers reported in the Financial History in Figure 3-6.
3-21
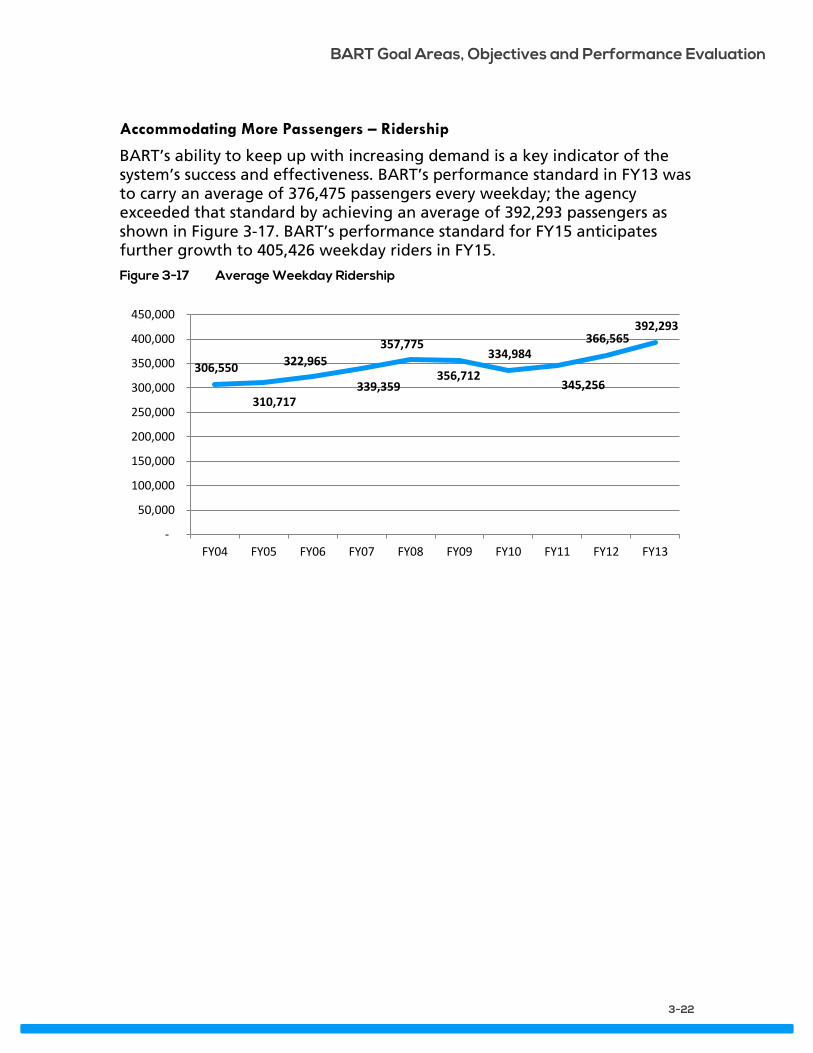
BART Goal Areas, Objectives and Performance Evaluation
Accommodating More Passengers – Ridership
BART’s ability to keep up with increasing demand is a key indicator of the system’s success and effectiveness. BART’s performance standard in FY13 was to carry an average of 376,475 passengers every weekday; the agency exceeded that standard by achieving an average of 392,293 passengers as shown in Figure 3-17. BART’s performance standard for FY15 anticipates further growth to 405,426 weekday riders in FY15.
Figure 3-17 Average Weekday Ridership
306,550
310,717
322,965
339,359
357,775
356,712
334,984
345,256
366,565 392,293
-
50,000
100,000
150,000
200,000
250,000
300,000
350,000
400,000
450,000
FY04 FY05 FY06 FY07 FY08 FY09 FY10 FY11 FY12 FY13
3-22

BART Goal Areas, Objectives and Performance Evaluation
Customer Experience Evaluation
Accessibility and Access – Elevator/Escalator Availability
To ensure all passengers are readily able to access stations, BART aims to keep at least 98% of its station and garage elevators in service at all times and 95% and 96% of its street and platform escalators in service, respectively. BART was successful in meeting each of these performance standards through FY10. However, between FY10 and FY13, the availability of BART’s garage elevators and platform escalators has each dipped a few percentage points below the standard, and street escalator availability has dipped significantly (Figure 3-18). To address problems with elevators, BART station agents have been assigned to inspect elevators every two hours and to keep track of the results.
Figure 3-18 Elevators and Escalators Availability
75%
80%
85%
90%
95%
100%
FY04 FY05 FY06 FY07 FY08 FY09 FY10 FY11 FY12 FY13
Station elevators in service Garage elevators in service
Street Escalators in service Platform Escalators in service
3-23

BART Goal Areas, Objectives and Performance Evaluation
Customer Experience – Customer Satisfaction
BART’s 2012 Customer Satisfaction Survey showed that 84% of riders were “very satisfied” or “somewhat satisfied” with the services provided by BART; only 5% said they were “dissatisfied." Satisfaction was up two percentage points vs. 2010, driven by an increase in those who were “very satisfied.”
Note that there was variation in satisfaction among passengers depending on the time period in which they rode BART. Off-peak and weekend riders were more likely to say they were “very satisfied” with BART service, whereas peak period riders were more likely to be only “somewhat satisfied.”
Overall levels of satisfaction tend to increase or decrease over time depending on customers’ perceptions of BART on important factors such as on-time performance, cleanliness, and train frequency. Ratings have ranged from a low of 74% in 1998 to a high of 86% in 2004. The increase in ratings between 1998 and 2004 coincided with BART’s billion dollar reinvestment program to repair aging facilities and equipment. Over the past three surveys, ratings have been fairly consistent (in the 82% - 84% range).
Customer Experience – BART as "Good Value"
The perception of BART as a good value showed a positive trend. In 2012, 70% of survey respondents agreed that BART was a good value as compared to 64% in the 2010 customer survey. Of the 70% positive rating, 30% strongly agreed and 40% somewhat agreed that BART was a good value for the money. Off-peak riders were more likely to strongly agree that BART was a good value (32%) than peak period riders (27%).
Customer Experience – Cleanliness of Trains
The 2012 BART Customer Satisfaction survey resulted in a score of 4.49 for cleanliness of train interiors, a score of 4.28 for condition/cleanliness of train floors, and a score of 4.18 for condition/cleanliness of train seats (on a scale of 1 to 7, where ‘‘1’’ is ‘‘poor’’ and ‘‘7’’ is ‘‘excellent’’). These scores represent a slight improvement from the 2010 survey. The increase in seat cleanliness ratings was attributed to BART’s investment in new vinyl seat covers; the survey revealed that passengers who were surveyed on trains with vinyl seat covers gave significantly higher ratings to seat cleanliness than passengers on trains with upholstered seats. As BART continues to replace seats, it is expected that the cleanliness ratings will improve.
Customer Experience – Cleanliness of Stations
Cleanliness of stations was one of the attributes that showed a significant decline in customer ratings between 2010 and 2012 (The other attributes with large declines were escalator availability and reliability, and elevator
3-24

BART Goal Areas, Objectives and Performance Evaluation
cleanliness). BART acknowledges the issues related to station cleanliness and attributes the decline to having fewer workers to clean the stations than it did 10 years ago (due to budget cuts).
In the coming year, BART will be dedicating more resources to cleaning the stations and hiring additional station cleaners. At key stations in San Francisco (the Civic Center and Mission District stations), BART is working with community groups to improve the area immediately surrounding the stations and increase attention to loitering.
Customer Experience – Customer Complaints
As part of measuring its customer experience performance, BART aims to have a maximum of 5.07 complaints per 100,000 passengers. Between FY04 to FY13, BART was largely successful in meeting this goal, with a decreasing number of complaints over these years, as shown in Figure 3-19.
Figure 3-19 Customer Complaints per 100,000 Passengers
5.2
4.2
5.1
4.0
5.0 4.1
4.1
4.0
3.7
4.2
0.0
1.0
2.0
3.0
4.0
5.0
6.0
FY04 FY05 FY06 FY07 FY08 FY09 FY10 FY11 FY12 FY13
Involvement in MTC’s Community-Based Transportation Planning Program BART is committed to serving disadvantaged populations. To that end, BART has participated in many Community-Based Transportation Planning efforts that have generally been led by Congestion Management Agencies (CMAs) or cities. Additionally, BART has performed environmental justice studies to ensure equitable access to all BART stations. This is a key aspect of BART’s efforts to ensure it is meeting the needs of all of its passengers.
3-25
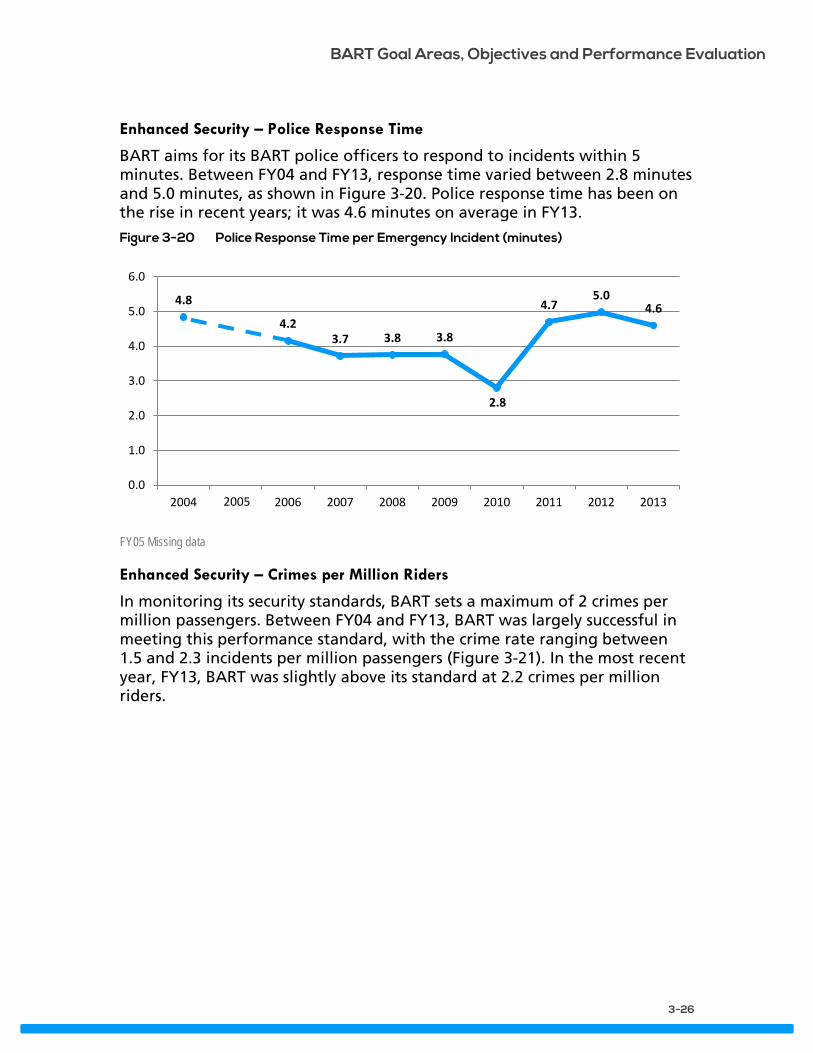
BART Goal Areas, Objectives and Performance Evaluation
Enhanced Security – Police Response Time
BART aims for its BART police officers to respond to incidents within 5 minutes. Between FY04 and FY13, response time varied between 2.8 minutes and 5.0 minutes, as shown in Figure 3-20. Police response time has been on the rise in recent years; it was 4.6 minutes on average in FY13.
Figure 3-20 Police Response Time per Emergency Incident (minutes)
FY05 Missing data
Enhanced Security – Crimes per Million Riders
In monitoring its security standards, BART sets a maximum of 2 crimes per million passengers. Between FY04 and FY13, BART was largely successful in meeting this performance standard, with the crime rate ranging between 1.5 and 2.3 incidents per million passengers (Figure 3-21). In the most recent year, FY13, BART was slightly above its standard at 2.2 crimes per million riders.
4.8
4.2 3.7 3.8 3.8
2.8
4.7 5.0
4.6
0.0
1.0
2.0
3.0
4.0
5.0
6.0
2004 2006 2007 2008 2009 2010 2011 2012 2013 2005
3-26

BART Goal Areas, Objectives and Performance Evaluation
Figure 3-21 Crimes per Million Riders
FY05 Missing data
Sustainability Evaluation
Financial Health – Prudent Reserve
BART's Financial Stability Policy, adopted on March 27, 2003, establishes a goal to set aside operating reserves at 5% of operating costs. The full policy can be found in Appendix A. The current balance of $33.1 million represents 5% of current operating costs. In this financial forecast, as operating expenses increase in future years, small annual allocations are planned to keep the reserve balance at a minimum of 5%. It should be noted that 5% may not be sufficient to cover a severe loss or economic downtown. Given the significant demands on limited BART funds, increasing the size of its operating reserve may not be an option in the near future. BART’s Board of Directors recently established a Reserve Fund/Risk Management Ad Hoc Committee to review proposed policies for consideration at a future date.
2.0
1.9
2.0
1.5
2.3
1.5
1.7
2.0 2.2
0.0
0.5
1.0
1.5
2.0
2.5
FY04 FY05 FY06 FY07 FY08 FY09 FY10 FY11 FY12 FY13
3-27

BART Goal Areas, Objectives and Performance Evaluation
COMPLIANCE This section describes the agency’s most recent Title VI analysis and report, provides information on the agency’s most recent FTA Triennial Review, and provides an update on Community-based Transportation Planning, as required by the MTC SRTP guidelines.
Title VI BART is required to submit a report to the Federal Transit Administration (FTA) every three years detailing its efforts to comply with Title VI of the Civil Rights Act of 1964. BART submitted its 2013 Title VI Triennial Program Update report for the period January 1, 2012 to December 31, 2013 to the FTA in January 2014 in accordance with FTA Circular 4702.1B (effective 2012).4
The 2013 Title VI report outlines BART’s service and fare equity analysis process, which includes Title VI data collection, data analysis, and results and findings of the analysis. The report also includes BART’s Disparate Impact and Disproportionate Burden Policy that has thresholds to determine when a proposed fare change or major service change would result in a disparate impact on or a disproportionate burden on people with limited incomes.
If the assessment finds that minority riders (as defined by Title VI) experience disparate impacts from the proposed new fares, BART will take steps to avoid, minimize, or mitigate these disparate impacts. If the additional steps do not mitigate the potential disparate impacts on minority riders, pursuant to FTA Circular 4702.1B, BART may proceed with the proposed new fares only if BART can show:
A substantial legitimate justification for the proposed new fare; and There are no alternatives serving the same legitimate objectives that
would have a less disparate impact on minority riders. If the assessment finds that low-income riders experience a disproportionate burden from the proposed new fare, pursuant to FTA Circular 4702.1B, BART should take steps to avoid, minimize, or mitigate these impacts where practicable. BART shall also describe alternatives available to low-income riders affected by the proposed new fare.
The complete process for conducting the analysis is documented in BART’s 2013 Triennial Title VI report, which can be found at http://www.bart.gov/guide/titlevi.
4 BART’s previous Title VI Program, dated 2011, covered four years due to the FTA Corrective Action Plan. The FTA approved submittal of a two-year report to remain up to date on the reporting schedule. BART's next triennial review will cover a three-year reporting period.
3-28

BART Goal Areas, Objectives and Performance Evaluation
In addition to the program-specific data collection and analysis requirements stated above, the Title VI Circular also includes a number of general reporting requirements that are completed by departments within BART. These include, for example, public notification of protection under Title VI; Title VI complaint procedures and forms; a policy for providing access for limited-English-speaking populations (based on the U.S. Department of Transportation’s limited-English-Proficiency [LEP] guidance); inclusive public-participation processes; a breakdown of minority representation on planning and advisory bodies; and, equity analyses of the locations of any proposed transit facilities. All of the documentation related to these general reporting requirements can be found in BART’s 2013 Title VI Triennial Program update report at http://www.bart.gov/guide/titlevi.
Community-based Transportation Planning BART participates in MTC’s Community-based Transportation Planning Program. Plans developed under this program identify and recommend transit improvements specific to low-income communities. Recommendations for BART have included improved pedestrian and bicycle infrastructure, bicycle parking, improved wayfinding, additional/upgraded bus shelters, increased lighting, and other safety improvements.
Recent improvements for BART include elevator installation at the Ashby station, in conjunction with the Ed Roberts campus, and the Westside Entrance and Walkway Project at the Balboa Park station, where an accessible path now connects the west side of the station to Ocean Avenue. Bike lockers and bike stations have been installed or increased at a number of stations, with additional stations scheduled for future years. Wayfinding and bus shelter improvements have also been implemented. Lifeline funds also are being used for improvements to the intermodal zones at the following stations: Concord (design underway), Richmond (project out to bid), and Pittsburg/Bay Point (project completed).
In addition, a one-year pilot project of enhanced late night “Owl” bus service funded by BART and Lifeline STA funds is currently anticipated to begin in late 2014. This pilot will augment the frequency of existing late night AC Transit route 800 and 801 service between San Francisco and Alameda County. New express service will connect San Francisco to Rockridge, Pittsburg/Bay Point, and several BART stations in between.
3-29

BART Goal Areas, Objectives and Performance Evaluation
FTA Triennial Review BART completed its most recent FTA Triennial Review in September 2012. BART was found to be compliant in all but one area where deficiencies were identified: Disadvantaged Business Enterprise (DBE).
The findings of the FTA Triennial Review are shown in Figure 3-22. The FTA reviewed BART’s response to the above deficiencies, dated January 31, 2013, and found that corrective actions to these deficiencies had been achieved and no further action was required. The FTA closed the review as of February 28, 2013.
Figure 3-22 FTA Triennial Review Findings
Review Area Finding Deficiency Corrective Action Response
Date
Disadvantaged Business Enterprise
D-17 Grantee not ensuring prompt payment
Submit report to Region IX Civil Rights Officer on progress in implementing short term initiatives identified in the Small Business Opportunity Plan and provide an update on the Vendor Payment Tracking System. The Standard Operating Procedures must address compliance with DBE program requirements for public participation, prompt payment and return of retainage, and accurate completion of the Uniform Reports. The Uniform Report due 12/1/12 must include all required information.
January 31, 2013
D-18 Public participation process deficiencies
D-20 Uniform reports do not include required information
3-30

Operating Service Plan and Financial Plan
4 OPERATING SERVICE PLAN AND FINANCIAL PLAN
This chapter details BART’s long-term operating outlook, rail service plan, and operating financial forecast for FY15 through FY24. These 10-year ridership, operating service, and financial forecasts help guide BART’s annual budget decision-making process and identify potential challenges or opportunities that may arise over the next 10 years.
The financial forecast for the SRTP was based upon the FY15 budget, which the BART Board adopted on June 12, 2014.
LONG-TERM OPERATING FINANCIAL OUTLOOK This financial forecast shows BART facing major challenges in its operating program over the 10 years of this plan: BART must fund critical capital renovations and infrastructure upgrades while maintaining high service levels to meet ridership demands and operating new system extensions when they come on line.
A particular challenge will be to provide reliable rail service prior to the receipt of new rails cars starting in 2017. If ridership grows more than forecast, BART will not be able to add additional service during the peak periods until new cars are available. In addition, attempting to run the current fleet of older cars with more passengers and more crowding and not maintaining car service standards could increase delays and make service less reliable. In the past, BART has successfully reinvested in programs like the Strategic Maintenance Program (SMP), which improves car maintenance procedures and processes in order to increase car reliability and move cars more quickly from maintenance into revenue service. In the future, BART will need to continue to implement innovative programs like the SMP.
In addition, BART is continuing to implement its Asset Management Program (AMP) to ensure that it is prioritizing investments that provide the best value and address the biggest safety, operational, and financial risks. The BART system is well over 40 years old and infrastructure throughout the system requires renovation and replacement. The AMP is beginning to identify and prioritize infrastructure needs in a manner that allows BART to make its operating and capital investment choices based on risk and criticality to safety and system operations, which will benefit the financial sustainability of both the operating and capital programs.
4-1

Operating Service Plan and Financial Plan
With regard to the projected annual shortfalls for the operating program, which range from $6 million to $80 million in future years, it is important to remember that the SRTP forecasts are based on several assumptions. The operating projections reflect historical, long-term assumptions regarding ridership growth and revenue sources. The forecast also reflects realistic, updated projections of labor expenses, including increases in the cost of benefits such as medical coverage and pensions. However, actual results can be quite different. Past experience suggests that over the next 10 years, the Bay Area is likely to experience both periods of higher-than-normal growth and a recession or economic downturn. The SRTP/CIP does not attempt to predict economic cycles and thus projects conservative yet steady growth. If revenues increase more than projected, or if expenses grow less than projected, the deficit could be reduced. Conversely, lower revenues or higher expenses than projected could produce a larger shortfall.
BART is committing a significant amount of operating funds to capital programs over the next 10 years, particularly to fund the “Big 3” capital programs (Fleet of the Future rail cars, Hayward Maintenance Complex, and Train Control Modernization Project), in addition to baseline capital allocations. Much of these operating funds will come from the four inflation-based fare increases implemented between FY14 and FY20. The need for these allocations, based on project schedules, will put a great deal of pressure on future operating budgets. The timing associated with these allocations is reflected in the projected annual operating shortfalls. BART is working to develop strategies to address the timing issue in order to reduce pressure on future operating budgets. If the impact of these timing issues cannot be fully mitigated then BART staff will need to consider other financial strategies, which may include short-term financing or borrowing from operating reserves.
BART has a specific program to direct all incremental revenue from the four inflation-based fare increases implemented between FY14 and FY20 to high-priority capital programs. The SRTP financial forecast continues this assumption through the end of the 10-year forecast in FY24. One option to reduce projected deficits in the later years is to redirect the incremental fare increase revenue back to the operating program after the end of the eight-year program. This would reduce the operating shortfall by approximately $250 million under current projections, but would adversely impact the timing and ability to fund critical high-priority capital projects. In addition, delaying capital reinvestment could increase future operating costs required to maintain existing, aging assets.
Other ways of addressing projected deficits could include cutting costs, reducing future expense increases, or finding additional revenue sources for the capital needs to lessen the demand on operating revenues. Cutting additional expenses would need to be a very strategic undertaking given BART operations are already quite lean. To address the impacts of the two recessions between 2000 and 2010, BART reduced a considerable amount of expense, as exemplified in the number of positions for BART’s operating budget. BART operates with fewer staff today than 14 years ago -- 3,044 in FY15, including nearly 300 positions added in FY04 for the
4-2

Operating Service Plan and Financial Plan
SFO Extension, compared to 3,169 in FY01. Further expense reductions, particularly in the area of staffing, would likely negatively influence service and system performance. Regarding the other options–identifying additional revenue sources and limiting expense increases–BART staff are always striving to do both; however, exogenous factors sometime undermine their ability to accomplish this.
BART’s Financial Stability Policy, adopted by the Board in 2003, outlines specific goals and strategies to ensure BART’s ability to deliver service rests on a strong and stable financial foundation (see Appendix A for full policy). The goals include:
Maintain an operating and capital financial base that is sufficient to deliver safe, quality service efficiently and cost-effectively to meet the level of demand.
Continuously improve productivity. Preserve and maximize BART's fare revenue base, through a predictable
pattern of adjustments, while retaining ridership. Provide a fare and fee structure that is tied to the cost of providing service,
optimizes use of the BART system, and provides BART customers with convenience, ease of use, and a good value for the money.
Establish and maintain prudent reserves sufficient to ensure that BART can adjust to economic downturns.
Maintain the highest possible credit rating and reputation for prudent financial management.
To date, BART has implemented a number of strategies to meet the Financial Stability Policy, including: Implementing small regular fare increases tied to Consumer Price Index (CPI)-
based cost increases and surcharges tied to capital needs. Increasing revenue from other sources such as parking and advertising. Maintaining a reserve of at least 5% of total annual operating expenses to
preserve BART’s ability to deliver safe and reliable service and to reinvest in capital.
For the financial outlook, the Financial Stability Policy will continue to provide guidance and strategies to address potential deficits. As part of future annual budget processes, staff will develop and adjust strategies to fit actual circumstances, particularly those that provide long-term solutions.
The financial forecast shows a Revenue Enhancement/Cost Containment line that reflects BART’s commitment to produce a balance budget for the Board’s consideration prior to the start of each future fiscal year. Measures, such as those discussed in this section, will be utilized to solve deficits. Over the next year, staff will develop and evaluate the feasibility of a number of strategies to secure funding for capital reinvestment. Additional funding for the capital program could in turn allow for reductions in operating to capital allocations.
4-3

Operating Service Plan and Financial Plan
In addition, to put the current projected deficits in perspective with regards to overall planned operating expenditures, the cumulative operating shortfall of approximately $500 million represents 5% of the total projected operating uses forecast over the 10-year time frame.
OPERATING SERVICE PLAN One of the first steps in planning for BART’s future is forecasting how many riders the system will serve and how to configure service to accommodate them. BART balances available cars across all routes to match projected ridership so it can efficiently provide the right level of service to meet actual rider demand. It is important to note that the ridership forecast assumes that BART is able to maintain current service levels and on-time train performance. Should ridership grow substantially more than forecast before the arrival of new train cars in 2017, it may be difficult to maintain the current high level of customer and train on-time performance while running the older cars. Generally, more passengers and more crowding can increase delays and make service less reliable.
Over the 10-year SRTP timeframe, four new extension projects are planned to open shown in the figure below.
Figure 4-1 BART Extensions under Construction
Extension Opening Date
BART-to-Oakland International Airport (OAK) FY15 (fall 2014)
BART to Warm Springs (WSX) FY16
East Contra Costa BART Extension (eBART) FY18
Silicon Valley Berryessa Extension (SVBX) FY18
The first three projects are included in the SRTP forecasts. At this time, projections of ridership, fare and other revenues, and agreement expenses for the SVBX project are not factored into the SRTP. Per the terms of BART’s 2001 Comprehensive Agreement with the Santa Clara Valley Transportation Authority (VTA), the financial responsibility for the extension rests with VTA, and operations of the BART extension into Santa Clara County will not financially impact BART. The additional service for this extension, however, is shown in the BART Rail Service Forecast, Figure 4-3.
Ridership Forecasts As part of its service and financial planning process, BART projects weekday ridership for future years. The first step is to establish a recent actual station-to-station trip table. This table is then adjusted to account for the following areas:
4-4

Operating Service Plan and Financial Plan
Projected changes in regional population and employment Scheduled openings of new extensions and stations Scheduled BART fare and service changes Projected changes in competing travel markets (e.g., auto travel times and
fuel costs)
The base for BART’s current set of ridership forecasts is actual origin-destination data from all weekdays in FY13, averaged and projected forward to FY15. Figure 4-2 shows the resulting ridership forecast through FY24, including the BART-to-OAK project, WSX, and eBART.
Figure 4-2 BART Ridership Forecast
FY15 FY16 FY17 FY18 FY19 FY20 FY21 FY22 FY23 FY24
Average Weekday 405,426 413,536 422,294 429,658 440,563 449,760 456,915 463,896 468,949 474,110
Total Annual (M) 122.1 124.6 127.2 129.4 132.7 135.5 137.6 139.7 141.2 142.8
Annual Increase
2.0% 2.1% 1.7% 2.5% 2.1% 1.6% 1.5% 1.1% 1.1%
Key findings from the ridership forecast are as follows:
After two years of much higher than normal growth (6% in FY12 and 7% in FY13), growth in FY14 was inconsistent and much slower than past years.
Based on current trends, and taking into account the estimated impact of the two labor strikes in 2013, weekday ridership in FY14 averaged 399,100, 2% above FY13.
Ridership is budgeted to grow only slightly in FY15, by approximately 1.5% based upon growth trends during the latter half of FY14.
Approximately 2,800 daily riders are expected to use the new BART-to-Oakland International Airport service during the first year of operations.
Each of the three extension projects included in the forecast is expected to grow at a faster rate than the current core system for approximately the first three years after opening, based on BART’s actual experience with previously opened extensions and infill stations.
Total annual trips are projected to grow at approximately the same rate as weekday trips. Passenger miles are expected to increase at a slightly higher rate due to expected longer average trip lengths for some extensions.
4-5
Operating Service Plan and Financial Plan
Service Planning BART’s service plan is based on the ridership forecast described above and operational constraints, for example, car loading standards and peak Transbay Tube throughput. The service plan produces a fleet demand for an entire weekday based on:
Average passenger loading on cars: 107 passengers per car (PPC) traveling transbay in the peak one-hour period, 100 PPC in the peak three-hour period.
Headways: Service is scheduled at 15 minute frequencies on each line during the peak periods, with additional “rush train” service on the Pittsburg-Baypoint line. Rush trains will be added to the Warm Springs line upon service commencement.
Transbay Tube throughput: Twenty-three trains pass through the Transbay Tube during the peak hour and in the peak direction, increasing to 24 trains with Warm Springs service.
Number of trains on each route: Four trains per hour in each direction, except for evenings and weekends, when there are three trains per hour in each direction.
Total cars and control cars required: To optimize train sizing, generally three out of eight cars are planned to be control cars, which have operator cabs.
Number of cars in maintenance: To meet peak demand, 85% of the total fleet is required to be in service; the remaining 15% is undergoing maintenance. Between FY18 and FY23, while BART is operating a mixed fleet of old and new cars, the percentage of the total fleet in service will decline temporarily to 80%.
Figure 4-3 shows the BART Rail Service Forecast, a preliminary overview of how BART might operate service to accommodate the projected increase in ridership and service through FY24.
Key findings from the service forecast are as follows:
The period of FY16 through FY18 will be a challenging time for BART service provision. A total of 850 new cars are assumed to be delivered gradually and accepted into BART’s revenue fleet, with the first new cars available for service at the end of FY17. Until then, only the current, aging, fleet will be available to address growing ridership and the increased car requirements associated with the extension of rail service to WSX.
As new cars are accepted into the revenue fleet, BART plans to retain some of the current fleet to help provide and expand service. The current fleet is assumed to be completely retired by FY24. With an entirely new fleet of cars, fleet availability is anticipated to return to 85% level.
4-6

Operating Service Plan and Financial Plan
In FY18, SVBX is expected to open with 60 new cars operating two-line (Green and Orange) service. Additional vehicles could be added later to address ridership growth on this line.
By the end of FY19, BART anticipates receipt of over 300 new cars enabling service to catch up on prior demands.
Also in FY19, BART will be able to increase train lengths to 10 cars on all peak Transbay runs and to as many as 8 cars on East Bay (Orange Line) runs. BART’s original cars will be retained to allow this near-term expansion in train lengths.
The BART-to-OAK and eBART are not anticipated to require increases to heavy rail service beyond the planned increases in peak train lengths.
Additional expansion to service, such as an increase in off-peak service on selected lines or the increase in peak Transbay service to up to 28 or 30 trains per hour would require additional operating funds beyond those included in the Operating Financial Plan which is described in the next section of this document.
4-7
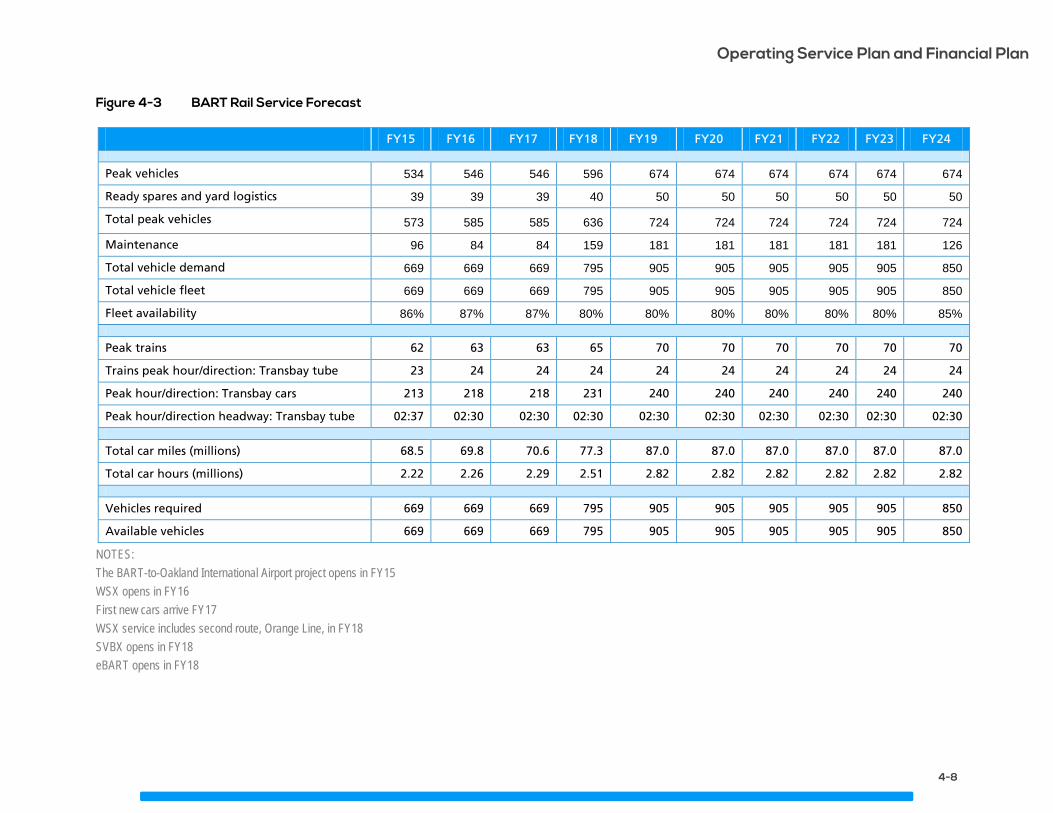
Operating Service Plan and Financial Plan
Figure 4-3 BART Rail Service Forecast
FY15 FY16 FY17 FY18 FY19 FY20 FY21 FY22 FY23 FY24
Peak vehicles 534 546 546 596 674 674 674 674 674 674
Ready spares and yard logistics 39 39 39 40 50 50 50 50 50 50
Total peak vehicles 573 585 585 636 724 724 724 724 724 724
Maintenance 96 84 84 159 181 181 181 181 181 126
Total vehicle demand 669 669 669 795 905 905 905 905 905 850
Total vehicle fleet 669 669 669 795 905 905 905 905 905 850
Fleet availability 86% 87% 87% 80% 80% 80% 80% 80% 80% 85%
Peak trains 62 63 63 65 70 70 70 70 70 70
Trains peak hour/direction: Transbay tube 23 24 24 24 24 24 24 24 24 24
Peak hour/direction: Transbay cars 213 218 218 231 240 240 240 240 240 240
Peak hour/direction headway: Transbay tube 02:37 02:30 02:30 02:30 02:30 02:30 02:30 02:30 02:30 02:30
Total car miles (millions) 68.5 69.8 70.6 77.3 87.0 87.0 87.0 87.0 87.0 87.0
Total car hours (millions) 2.22 2.26 2.29 2.51 2.82 2.82 2.82 2.82 2.82 2.82
Vehicles required 669 669 669 795 905 905 905 905 905 850
Available vehicles 669 669 669 795 905 905 905 905 905 850
NOTES: The BART-to-Oakland International Airport project opens in FY15 WSX opens in FY16 First new cars arrive FY17 WSX service includes second route, Orange Line, in FY18 SVBX opens in FY18 eBART opens in FY18
4-8

Operating Service Plan and Financial Plan
ADA Paratransit Service As described in Chapter 2, BART partners with local operators to provide paratransit service in BART’s service area, generally by providing a payment directly to the transit operator to cover a share of the service. In the case of the East Bay Paratransit Consortium (EBPC), BART jointly manages the operator contract with AC Transit.
The EBPC fleet consists of approximately 210 lift-vans providing demand responsive service during all BART and AC Transit service hours.
Figure 4-4 below shows current projections for the EBPC. The projections are based recent ridership trends which, after many years of steady growth, have leveled off in the past couple years. The row entitled “Total Passengers” includes ADA riders and attendants and companions. The subsequent row, “ADA Passengers” excludes attendants and companions. Productivity is defined as passengers per revenue vehicle hour and is calculated for both categories of ridership.
Figure 4-4 ADA Paratransit Projected Passengers and Productivity FY15-FY24
Projections FY15 FY16 FY17 FY18 FY19 FY20 FY21 FY22 FY23 FY24
Total Passengers 710,000 713,550 717,118 721,420 726,470 732,282 738,873 745,523 752,978 760,508
Total ADA Passengers 617,700 620,789 623,892 627,636 632,029 637,085 642,819 644,877 651,326 657,839
Productivity (Total Passengers)
1.75 1.76 1.77 1.77 1.78 1.78 1.79 1.79 1.79 1.80
Productivity (ADA passengers)
1.52 1.53 1.54 1.54 1.55 1.55 1.56 1.55 1.55 1.56
OPERATING FINANCIAL PLAN The Operating Financial Plan includes projected revenues, financial assistance, expenses, and allocations out of operating funds to other BART programs. Projections of passenger revenue are calculated using ridership forecasts described in the prior section. Expense forecasts are developed through a multi-step process that utilizes ridership forecasts, projections of future service requirements, known impacts of labor contracts, and changes to benefit costs. It is important to note that BART’s capital needs have a meaningful impact on its operating financial plan and are a significant driver of projected deficits.
These forecasts are, as much as possible, consistent with or based upon regional forecasts and historical trends. For example, the Metropolitan Transportation Commission (MTC) provides guidance on projections for inflation and State Transit Assistance (STA) funds. Figure 4-5 details the current 10-year operating financial outlook through FY24, building upon the FY15 budget. Major categories of revenues and expenses are described in subsequent sections.
4-9
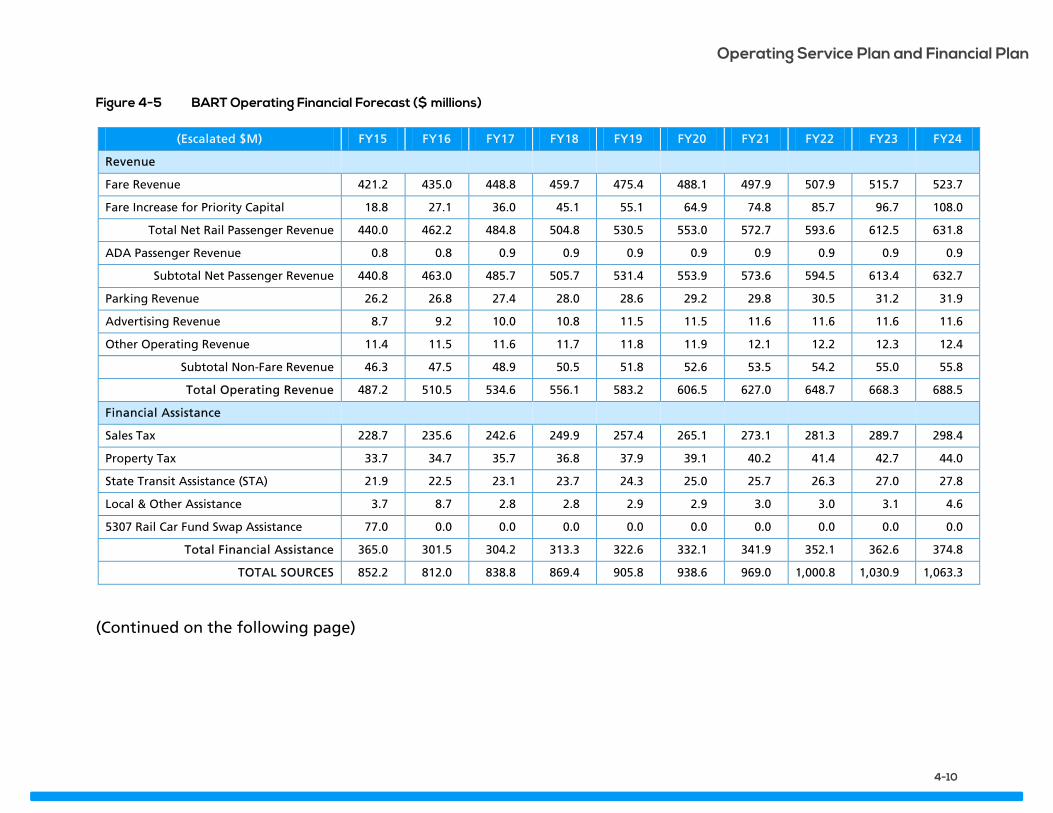
Operating Service Plan and Financial Plan
Figure 4-5 BART Operating Financial Forecast ($ millions)
(Escalated $M) FY15 FY16 FY17 FY18 FY19 FY20 FY21 FY22 FY23 FY24
Revenue
Fare Revenue 421.2 435.0 448.8 459.7 475.4 488.1 497.9 507.9 515.7 523.7
Fare Increase for Priority Capital 18.8 27.1 36.0 45.1 55.1 64.9 74.8 85.7 96.7 108.0
Total Net Rail Passenger Revenue 440.0 462.2 484.8 504.8 530.5 553.0 572.7 593.6 612.5 631.8
ADA Passenger Revenue 0.8 0.8 0.9 0.9 0.9 0.9 0.9 0.9 0.9 0.9
Subtotal Net Passenger Revenue 440.8 463.0 485.7 505.7 531.4 553.9 573.6 594.5 613.4 632.7
Parking Revenue 26.2 26.8 27.4 28.0 28.6 29.2 29.8 30.5 31.2 31.9
Advertising Revenue 8.7 9.2 10.0 10.8 11.5 11.5 11.6 11.6 11.6 11.6
Other Operating Revenue 11.4 11.5 11.6 11.7 11.8 11.9 12.1 12.2 12.3 12.4
Subtotal Non-Fare Revenue 46.3 47.5 48.9 50.5 51.8 52.6 53.5 54.2 55.0 55.8
Total Operating Revenue 487.2 510.5 534.6 556.1 583.2 606.5 627.0 648.7 668.3 688.5
Financial Assistance
Sales Tax 228.7 235.6 242.6 249.9 257.4 265.1 273.1 281.3 289.7 298.4
Property Tax 33.7 34.7 35.7 36.8 37.9 39.1 40.2 41.4 42.7 44.0
State Transit Assistance (STA) 21.9 22.5 23.1 23.7 24.3 25.0 25.7 26.3 27.0 27.8
Local & Other Assistance 3.7 8.7 2.8 2.8 2.9 2.9 3.0 3.0 3.1 4.6
5307 Rail Car Fund Swap Assistance 77.0 0.0 0.0 0.0 0.0 0.0 0.0 0.0 0.0 0.0
Total Financial Assistance 365.0 301.5 304.2 313.3 322.6 332.1 341.9 352.1 362.6 374.8
TOTAL SOURCES 852.2 812.0 838.8 869.4 905.8 938.6 969.0 1,000.8 1,030.9 1,063.3
(Continued on the following page)
4-10

Operating Service Plan and Financial Plan
(Escalated $M) FY15 FY16 FY17 FY18 FY19 FY20 FY21 FY22 FY23 FY24 Expense Net Labor and Benefits 420.5 446.1 478.9 523.4 552.5 575.5 590.9 608.7 625.7 645.3 OPEB Unfunded Liability 2.4 2.5 2.6 2.6 2.7 2.8 2.9 3.0 3.1 3.2
Subtotal Labor 422.9 448.6 481.5 526.0 555.2 578.3 593.8 611.7 628.8 648.4 Traction/Station Power 38.1 40.4 41.7 43.4 45.2 47.1 49.0 50.8 52.9 55.1 Other Non-Labor 114.6 116.4 122.8 133.3 140.1 142.3 146.9 149.9 154.3 157.1
Subtotal Non-Labor 152.7 156.7 164.6 176.7 185.3 189.3 195.9 200.7 207.3 212.2 BART-to-OAK and eBART 3.7 5.6 5.7 11.9 18.5 19.0 19.5 20.1 20.6 21.2 Subtotal Rail/Guideway Operating Expense 579.2 611.0 651.8 714.6 758.9 786.6 809.2 832.5 856.6 881.9 ADA Paratransit Service 6.3 6.6 7.0 7.3 7.7 8.1 8.5 8.9 9.3 9.8 Other Purchased Transportation 13.5 13.7 14.0 14.3 14.6 14.9 15.2 15.6 15.9 16.3 5307 Rail Car Fund Swap Expense 77.0 0.0 0.0 0.0 0.0 0.0 0.0 0.0 0.0 0.0
Subtotal Non-Rail Expense 96.8 20.3 20.9 21.6 22.3 23.0 23.7 24.5 25.3 26.1 Total Operating Expense 676.1 631.3 672.7 736.2 781.2 809.5 832.9 856.9 881.9 908.0
Debt Service & Allocations Bond Debt Service 56.0 56.3 56.5 56.8 56.9 57.1 57.2 57.4 57.6 57.7 Allocations: Priority Capital Projects/Programs 63.8 72.1 81.0 90.1 55.1 64.9 74.8 85.7 96.7 108.0 Capital Renovation 37.0 33.8 26.6 25.2 25.7 24.7 25.3 25.8 26.4 27.0 Additional Capital Renovation 6.0 11.0 6.0 1.0 26.0 25.0 25.0 25.0 25.0 25.0 Operating Reserve 0.0 0.3 2.1 3.2 2.2 1.4 1.2 1.2 1.2 1.3 From SFO Operations 8.7 10.0 11.1 11.2 12.7 14.2 15.1 16.0 16.8 9.5 Access Program from Parking Fees 4.3 4.0 4.0 4.2 4.4 4.6 4.9 5.1 5.4 5.7 Other (Leases, BART-to-OAK Capital Reserve)
2.7 1.5 1.5 1.5 1.5 1.6 1.6 1.6 1.6 3.1
Total Debt Service & Allocations 178.4 189.1 188.7 193.2 184.6 193.5 204.9 217.8 230.8 237.4 TOTAL USES 854.5 820.3 861.4 929.4 965.8 1,003.0 1,037.9 1,074.7 1,112.7 1,145.4
OPEB Unfunded Liability 2.4 2.5 2.6 2.6 2.7 2.8 2.9 3.0 3.1 3.2 Net Result 0.1 (5.9) (20.1) (57.3) (57.3) (61.6) (66.0) (70.9) (78.8) (79.0)
Revenue Enhancement/Cost Containment 0.0 5.9 20.1 57.3 57.3 61.6 66.0 70.9 78.8 79.0 Revised Net Result 0.1 0.0 0.0 0.0 0.0 0.0 0.0 0.0 0.0 0.0 Rail Farebox Reovery Ratio 76% 76% 74% 71% 70% 70% 71% 71% 72% 72%
4-11

Operating Service Plan and Financial Plan
Operating Sources: Revenue
Rail Passenger Revenue
Rail passenger revenue is projected based on the rail ridership forecast described previously and is net of the various fare discounts offered by BART.
Fare increases are estimated using the Board-approved renewal of the CPI-based fare formula that accounts for changes in inflation over the preceding two-year period, both nationally and locally, and is reduced by a productivity factor of 0.5% to account for increases in labor and operating efficiencies. Estimates for the fare increases are based on 2.2% CPI annually, resulting in 3.9% increases every other year.
Fare Increase Revenue for Priority Capital Programs
In 2013, the Board took action to dedicate incremental fare revenue generated from the CPI-based increases in 2014, 2016, 2018, and 2020 to fund high-priority capital projects, including the “Big 3” projects of Rail Car Fleet of the Future Program, Hayward Maintenance Complex (HMC), and Train Control Modernization Project (TCMP). The incremental revenue is separated in the financial forecast.
Using current assumptions of ridership and inflation, the financial forecast estimates $600 million of incremental fare increase revenue over the 10 years. For planning purposes, the SRTP assumes continuation of the CPI-based formula and continued dedication of the incremental fare revenue to high-priority capital programs through the end of the 10-year forecast, with fare increases assumed for 2022 and 2024. Continuation of the inflation-based fare increase program beyond 2020 and continued direction of incremental fare revenue to high-priority capital projects are subject to Board approval.
ADA Passenger Revenue
BART complies with the Americans with Disabilities Act (ADA) requirement to provide paratransit service comparable and complementary to the BART system. In their areas of joint service, BART and AC Transit fund and administer the East Bay Paratransit Consortium (EBPC), which provides service through contractors. BART directly collects fare revenue from EBPC trips. Fare revenue projections are a function of ridership. Recent paratransit ridership has been relatively flat and is expected to remain flat during the time covered by this SRTP, with a projected growth in revenues of 0.7% per year.
4-12

Operating Service Plan and Financial Plan
Parking Revenue
Paid parking is the largest source of non-passenger revenue. BART charges daily and permit parking fees at its current 33 stations with parking facilities. In February 2013, the Board approved modifications to its paid parking programs by implementing a demand-based approach to parking fees. Daily parking fees are now re-evaluated every six months, based on the occupancy of the parking facility. Costs for permits and fees may either increase or decrease by 50¢ per day, depending upon whether the facility's utilization is above or below 95% capacity. There is a daily fee maximum of $3 at all stations, with the exception of West Oakland, which does not have a cap.
Additional revenue raised from the demand-based initiative is dedicated for investments in station access and improvements, including renovation, heavy cleaning, and addressing quality of life issues. In addition, the funds are used to enhance the customer experience, including signage and communication. Programs and projects funded by the increased parking revenue consist of both operating and capital efforts, some of which are one-time in nature and others ongoing.
The FY15 parking revenue budget is $26.2 million, which includes an estimated $10.1 million from the parking fee modification program, funding $4.1 million of ongoing programs such as Station Brightening (through deep cleaning) and $6 million in new projects and programs such as retrofitting station lighting and pedestrian improvements. FY15 will also see daily fee parking charges implemented at the last four stations that did not have fees: North Concord, Concord, Hayward, and Coliseum.
Aside from the changes noted above, parking revenue is projected to increase annually by inflation, or 2.2% each year through FY24. In addition, once open, the Warm Springs Station and the eBART extension are projected to generate small amounts of parking revenue.
Advertising Revenue and Other Revenue
Other sources of operating revenue include, in order of the amount of revenue generated, advertising contracts; fiber optics and telecommunication programs; station concessions; and parking fines and forfeitures. Categories not tied to contracts are forecast to keep pace with inflation.
4-13

Operating Service Plan and Financial Plan
Operating Sources: Financial Assistance Sales Tax
BART’s largest source of financial assistance is a dedicated 75% share of a one-half cent sales tax levied in the three BART counties. For FY15, sales tax revenue is estimated to grow by 4% compared to annual growth rates between 6% and 9% over the prior four years. Most regional economic forecasts anticipate Bay Area sales tax growth to return to more sustainable long-term rates. BART’s annual average sales tax growth rate for the past 10 to 15 years ranges from 2.2% to 2.6%, which reflects the substantial negative impacts of two recessions. A growth rate of 3% is estimated for FY16 through FY24.
Property Tax
BART receives a dedicated property tax assessment in the three BART counties to fund operations. After growing at an average rate of 5% over the past 10 to 15 years, property tax revenue growth is estimated to slow to 4% in FY15 and 3% growth over the long term, which is slightly less than BART’s historical average. The more conservative long-term growth rate assumes that the real estate and housing value market, which was generally robust in the Bay Area over the past 15 years, moderates slightly.
State Transit Assistance
BART receives funding assistance through appropriations of State Transit Assistance (STA), which is derived from actual receipts of the sales tax on diesel fuel. Statewide collections can fluctuate based on diesel prices and consumption; appropriations to transit operators will vary based on calculations of qualifying revenues for the local operator and the region. These funding sources have not been consistent throughout the years and can be subject to actions in the governor’s state budget. In some years, BART received no STA funds.
In FY15, BART’s share of STA is estimated at $27.9 million. $5.6 million of that amount will be directed by the MTC to feeder bus operators providing service to BART stations and $0.4 million will be held by MTC to fund fare coordination efforts with AC Transit. In addition, $3.2 million is committed as a pass-through to AC Transit to fund BART feeder service payments (also described in the Purchased Transportation section later in this document). This leaves a net of $18.7 million for BART operations. STA is projected to grow to $27.8 million by FY24.
4-14

Operating Service Plan and Financial Plan
Local and Other Assistance
BART also receives smaller amounts of annual funding from several local sources. Alameda County’s Measure B one-half cent sales tax and Contra Costa County’s Measure J one-half cent sales tax currently provide almost $1.8 million for BART’s paratransit service operations. These voter-approved fund sources are assumed to be renewed at this same level when the current programs expire.
As part of operating service to the joint BART/Caltrain station at Millbrae, Caltrain is required to pay for the use, operations, and maintenance costs at the station applicable to Caltrain service and passengers. For FY15, the payment is about $0.8 million; future payments are based on actual inflation and thus are estimated to increase by 2.2% annually through FY24.
Also included in “local and other assistance” is a one-time allocation of $6.0 million of capitalized interest from prior debt issuance from the BART-to-Oakland International Airport project expected in FY16.
Rail Car Fund Swap (Federal 5307 Reimbursement)
In FY15, federal preventive maintenance grant funds of $77.0 million are available through MTC to fund BART’s rail car purchase. This is the final year of the grant, which is recorded by BART in the Financial Assistance category, and then transferred to MTC as an expense to be placed in a sinking fund for future rail car replacement. The net result of the assistance and expense to the budget’s bottom line is zero. Including the FY15 funds, a total of $290 million has been directed to the MTC reserve account to fund BART rail cars.
Operating Uses: Expenses Operating expense projections use the FY15 budget as the base and are estimated for future years based on labor contracts, anticipated changes to benefit costs, inflation growth, and agreements with other agencies and service providers. Expenses include the anticipated cost of operating BART-to-Oakland International Airport, the Warm Springs extension, eBART, and the expanded Hayward Maintenance Complex. In addition, the forecast reflects the operating expense of lengthening and adding trains to revenue service with the arrival of new cars, starting in FY17.
The FY15 Budget proposed funding a number of new ongoing operating initiatives, totaling $6.3 million and including 45 positions, the majority of which are to enhance wayside worker safety. The SRTP assumes that these initiatives are approved in the final budget and the expenses continue for future years.
4-15
Operating Service Plan and Financial Plan
Net Labor and Benefits
Labor cost, which includes both wages and benefits, is the primary driver for BART’s operating uses, comprising about 70% of BART’s operating expense. Labor cost reflects the wage and benefit increases included in the FY14 through FY17 labor agreements.5 For represented employees, annual wage increases of 3.72% are scheduled for FY14 through FY16, with a 4.22% wage increase scheduled for FY17. For non-represented employees, wage increases are scheduled to be the same, but delayed six months. An annual wage increase of 2.0% was assumed for the years not covered by the labor contracts.
Under the current contracts, all BART employees (represented and non-represented) will contribute $37 more per month to their medical plans, in addition to the amount they agreed to contribute in previous labor agreements. This provision is expected to generate $6.9 million to help pay for medical costs over the contract period. Beyond FY17, no assumption was made for increases to medical plan contributions from employees.
Despite FY10’s district-wide cap on individual-level HMO premium contributions and the $37 per month increased contribution, cumulative health premium costs are projected to escalate by 7% in FY15. The average rate of change for active employee medical insurance plans over the past five years was approximately 8%. The actuarial projection of rate changes for the next five years ranges between 4.5% and 6.75%. These actuarial projections are reflected in the SRTP/CIP.
Under the current contracts, all BART employees will make contributions to their pensions, starting at 1% of pay and increasing by 1% for each year of the contract, up to a 4% maximum. This provision is expected to save BART $20.3 million over the contract period. Prior to this contract provision, BART paid 100% of the both the employer and employee share of pension costs. No assumption was made for additional pension contributions beyond FY17, but it is assumed that the 4% employee contribution continues.
BART’s pension plan is administered by the California Public Employee Retirement System (CalPERS) and includes two plans: Safety (sworn police officers) and Miscellaneous (all other employees). In 2012, the State Legislature passed Assembly Bill (AB) 340, the California Public Employees’ Pension Reform Act (PEPRA). PEPRA affects employees hired on or after January 1, 2013 and contains several provisions that are intended to lower future pension costs for public agencies, including changes to the retirement
5 At the time of publication, BART’s two police unions were still negotiating their contracts. For the SRTP, it has been assumed that the police unions would receive the same basic wage and benefit package as other BART labor unions.
4-16

Operating Service Plan and Financial Plan
plans and how pensions are calculated, and places a cap on the amount used to determine an employee’s pension.
The U.S. Department of Labor (DOL) determined that PEPRA interfered with collective bargaining, so the law was suspended for transit unions, including BART’s, until related litigation is concluded. The SRTP/CIP assumes that the exemption of represented employees from PEPRA continues into the future. Non-represented employees hired on or after January 1, 2013 are subject to PEPRA.
CalPERS determines all employer and employee pension contribution rates. To ensure the long-term health of the pension fund, and decrease fund volatility, the CalPERS Board has been considering and implementing a number of key actuarial assumptions that have significant impacts on employer rates:
Beginning in FY14, CalPERS decreased its projected investment return assumption from 7.75% to 7.50%. Increased contributions by employers, including BART, make up the difference. For FY15, the CalPERS pension employer rate will increase by 11% of payroll for Safety employees and by 8% for Miscellaneous employees.
In April 2013, the CalPERS Board approved new amortization and smoothing policies that will be phased in over five years from FY16 through FY20. As a result of this policy, CalPERS projects BART’s employer rates to increase by 54%6 for Miscellaneous plans and by 19%7 for Safety plans over the five-year period.
In February 2014, the CalPERS Board approved a number of changes to actuarial assumptions. One of the most significant changes is the increased life expectancy of active and retired employees, which will increase costs to plan members beginning FY17.
The SRTP/CIP assumes the first two changes to CalPERS policy. The impact of assuming longer life expectancy is currently unknown and will be included in subsequent updates of the SRTP/CIP.
The other post employment benefit (OPEB) unfunded liability is an accounting transaction, specifically for life insurance, with an equal offsetting budget adjustment. There is no net impact to BART’s bottom line.
6 Miscellaneous Plan of the San Francisco Bay Area Rapid Transit District, Annual Valuation Report as of June 30, 2012, October 2013, p. 26. 7 Safety Plan of the San Francisco Bay Area Rapid Transit District, Annual Valuation Report as of June 30, 2012, October 2013, p.26.
4-17

Operating Service Plan and Financial Plan
Traction and Station Power Expense
Electrical power costs are a sizable component of BART’s operating budget. Annually, BART uses about 370,000 megawatt hours of electrical power, making BART one of Northern California’s 10 largest users.
Recognizing the large impact that power supply has on BART’s operating expenses, BART obtained authority from the California legislature to purchase electrical power from sources other than the Pacific Gas and Electric Company (PG&E). Under legislation enacted in 1995, BART procured low cost-based power from the federal Bonneville Power Administration (BPA) through FY06. In 2004, BART obtained expanded statutory authority from the California legislature that permits BART to purchase power from municipal utilities as well as federal power marketing agencies. Under these expanded provisions, the Northern California Power Agency (NCPA) has replaced the expiring BPA supply by procuring market-priced power on behalf of BART. BART is also a participant in the Lodi Energy Center, a highly efficient natural gas project located in the city of Lodi, and is the sole participant in a 2.5 megawatt solar photovoltaic project located in the city of Gridley. In 2014, BART entered into a 20 year agreement for the output of the 4.3 megawatt Lake Nacimiento Hydroelectric project. There are also two pending projects to develop solar shade structures in two BART parking lots. The federal Western Area Power Administration will continue to supply a small amount of power under an existing contract through FY24. BART will continue to seek to reduce its exposure to power market cost fluctuations through joint ownership with municipal utilities of power generation facilities and to increase BART’s use of renewable energy resources. Another goal is to reduce power usage through conservation efforts.
The estimate for the cost of power through FY17 is based primarily on contract prices. The estimates beyond FY17 assume 3% annual increases. BART must purchase transmission and distribution services from PG&E to deliver its power supplies and these delivery costs are also forecast to increase at 3% annually.
State law requires investor-owned utilities, such as PG&E, to have renewable energy sources provide 33% of their electricity supply by 2020. Although this law does not apply to BART, it has decided to meet or exceed this same environmental goal for its electrical power supply. In FY14, BART's power resources were 53% renewable or carbon-free.
Other Non-Labor Expenses
Non-labor expenses include materials usage; rental and maintenance contracts; insurance; utilities other than traction and station power; professional and technical services, and; other miscellaneous expenses, including fees paid to MTC and financial institutions to administer the
4-18

Operating Service Plan and Financial Plan
Clipper regional transit smart card program. Most other non-labor categories are assumed to increase at the rate of inflation.
Purchased Transportation
BART’s ADA paratransit program has been operating under full federal compliance since 1997. Expenses, which rapidly escalated during the program’s early days, have started to stabilize. National experience suggests that annual expense growth rates are highly variable and can range as high as 10% to 15%. Staff will continue to look for ways to control BART’s paratransit program costs while providing compliant service. The Operating Financial Plan forecasts ADA paratransit service expenses of $13.4 million for FY15 and a subsequent annual expense growth at the rate of inflation.
BART has an agreement with the San Francisco Municipal Transportation Agency (SFMTA) that links the annual purchased transportation (feeder) payment to changes in the Bay Area CPI and changes in the number of riders transferring between BART and Muni, and has an annual cap of 5% for increases or decreases. A similar agreement will be implemented with AC Transit, effective FY15. The AC Transit agreement will be funded by BART’s share of STA and also includes a provision whereby 10% of the overall payment will be retained by MTC and used towards fare coordination efforts between the two agencies. New BART service to the Oakland International Airport is scheduled to open in fall 2014 and will be operated and maintained for twenty years by a private contractor, Doppelmayr Cable Car (DCC). Certain contractor performance measures and inflation factors apply to the calculation of annual operations and maintenance (O&M) costs. The FY15 estimated O&M cost is $3.7 million for eight months of operation in FY15, growing to $6.8 million per year by FY24.
Rail Car Fund Swap Expense
As noted in the Financial Assistance section, Federal Section 5307 Urbanized Area Formula Grant funds are allocated to BART by the MTC for preventive maintenance work and then swapped with other funds to pay for new rail cars. There is no net impact to BART’s operating budget bottom line as the Section 5307 funds are merely swapped for other funds. Including funds budgeted for FY15, a total of $290 million has been directed to the MTC reserve account.
Operating Uses: Debt Service and Allocations As BART begins to take an even larger role in self-funding critical capital needs, the level of detail needed to describe the resultant accounting has increased. The section below describes the line items in the financial forecast, which include debt service, allocations to support the capital
4-19

Operating Service Plan and Financial Plan
program, and other allocations as required by agreements with other agencies or accounting rules.
Bond Debt Service
BART first issued bonds backed by sales tax revenues in 1970 and has periodically sold additional bonds to finance or refinance the capital costs of constructing, improving, renovating, and equipping the system. As of March 2014, the outstanding principal for all outstanding sales tax revenue bonds is about $718.9 million. BART’s last bond sale was in 2012, with the issuance and refunding of bonds totaling $241.6 million, including $111.1 million for the BART-to-Oakland International Airport project. Annual debt service for all current bonds will remain nearly constant at $56.0 million in FY15, increasing to $57.7 million in FY24.
Allocations – Priority Capital Projects/Programs
BART has made a commitment to fund three high-priority programs (the “Big 3”) that are needed for system reliability and for system capacity to meet future ridership demand: the Rail Car Fleet of the Future, TCMP, and the HMC. Incremental fare revenue from the January 1, 2014 fare increase and subsequent fare increases scheduled for 2016, 2018, and 2020 will be directly allocated to a fund for these programs. For planning purposes, the SRTP assumes continuation of the fare increase program and allocations through FY24.
Rail Car Fleet of the Future. BART has an initial order for 410 new rail cars and has exercised options to purchase a total of 775 new cars, with a goal of securing a fleet of 1,000 new cars. In May 2012, BART committed $298 million from BART operating funds to the first 410 cars, with $118 million of operating funds allocated to rail car replacement to-date. The SRTP/CIP reflects BART’s annual operating allocations of $45 million in FY15 through FY18, totaling $180 million, to fulfill BART’s remaining obligation. BART will continue the $45 million annual allocations in FY19 and beyond, for a total of $270 million, to fund rail cars beyond the initial 410 cars.
Train Control Modernization Project and Hayward Maintenance Complex. Through FY24, the SRTP/CIP reflects commitments of operating allocations totaling $196 million for the TCMP and $149 million for the HMC.
Allocations – To Baseline Capital Renovations
Throughout its history, BART has reinvested annual operating revenues into the capital program. These annual allocations are used for many critical capital projects that do not qualify for grant funding or for which other
4-20

Operating Service Plan and Financial Plan
funding sources may not be available. Representative uses of allocations include station renovation, the purchase of capitalized tools, parts inventory and non-revenue vehicles, and as a local match for grant funds.
Capital renovation allocations include the following:
An annual baseline allocation, which starts at approximately $22 million in FY15 and grows by 3%, to serve as the local match for federal grants or to fund ongoing capital projects for which grants are not typically available (such as stations and facilities renovation, inventory buildup, non-revenue vehicle replacement, tools, and other capitalized maintenance).
Additional capital renovation allocations when funding allows for critical projects of a short-term nature. Examples of projects for FY15 through FY19 include replacement programs for rail car floors, right-of-way fencing, train control room batteries, and obsolete and inefficient T12 fluorescent lighting in BART tunnels and facilities, including the Transbay Tube.
Additional Capital Allocations
In May 2014, at BART’s request, the California Transportation Commission acted to shift Proposition 1A High-Speed Rail bond funds from other BART projects to the HMC project. The agreement is to shift $5 million ($1 million each year for FY15 through FY19) from the Millbrae Tail Track project; $20 million ($5 million in FY15 and FY17; $10 million in FY16) from the planned new Operations Control Center (OCC); and $13.6 million from un-programmed Proposition 1A funds to HMC. BART made this request because the HMC project is on an earlier timeline than the other projects and the funding is currently available. In addition, the FY15 SRTP/CIP assumes that beginning in FY19, BART plans to allocate $25 million annually to fund critical asset replacement.
Allocations – To Operating Reserve
BART’s Financial Stability Policy sets a goal to set aside operating reserves at 5% of operating costs. The current balance of $30.3 million represents 5% of current operating costs. In this financial forecast, as operating expenses increase in future years, small annual allocations are planned to keep the reserve balance at a minimum of 5%.
Allocations – To Rail Cars from SFO Extension Results
Operations of the five-station SFO extension into San Mateo County (outside of the three-county BART District) are projected to generate net positive results through FY24. Per the terms of the 2007 agreements relieving SamTrans of financial responsibility for the extension into San Mateo
4-21

Operating Service Plan and Financial Plan
County, fare revenue in excess of operating expenses is to be allocated to a special reserve account. The first $145 million deposited into the reserve account is to fund commitments to BART’s rail car replacement project. Current financial estimates project completion of that obligation in FY24.
Allocations – To Stations and Access Programs from Parking Fees
These programs are funded by the incremental parking fee revenue generated by the demand-based parking program first implemented in May 2013. This incremental revenue, above the baseline revenue generated by BART’s prior parking program will be directed to new station improvement and station access programs. In FY15, these programs include station brightening (by deep cleaning), pedestrian improvements, increased parking enforcement, bike program expansion, and a staffing the Pleasant Hill bike station. Future year projects will be determined in each fiscal year’s budget process. The allocation is the capital portion of the programs; the balance is included in the operating budget.
Safety BART is also making concerted operating investments in safety in coming years to update systems and procedures as well as hire additional staff positions dedicated to safety. In FY15, BART is undertaking several major safety initiatives which will invest on an ongoing basis millions of dollars into enhancing system safety. These additional investments will ensure that the necessary processes, incentives and equipment are in place to protect the safety of BART employees who are responsible for maintaining the track, traction power, and train control systems in proper working condition. They will also ensure that BART is fully compliant with a new set of California Public Utilities Commission (CPUC) safety requirements for wayside (track) workers (General Order 175, or GO 175).
In response to GO 175, BART has developed and is in the process of implementing a new and enhanced wayside safety program that includes more restrictive operating rules for wayside activities and procedures for how these activities should be performed by BART wayside workers and contractors. The program’s goal is to provide improved protection for employees in the BART right-of-way. To that end, the District has dedicated and needs to acquire additional resources to fully implement the new roadway worker protection program and comply with GO 175.
The Safety Department will also have additional staffing resources to manage two additional new safety programs: The Safety Culture Improvement Program to reduce injury rates through creation of a safety incentive program for front line workers, and the Safety Management Software Program to enhance monitoring.
Finally, the Maintenance and Engineering and Transportation Departments are adding 40 new positions to provide increased safety oversight. These efforts are further described in Chapter 3.
4-22
Operating Service Plan and Financial Plan
Allocations – Other
Other allocations include annual accounting entries of $0.5 million to offset an equal amount booked as other revenue or financial assistance for the Pleasant Hill/Contra Costa Centre and West Dublin/Pleasanton stations. FY15 also includes a $1.5 million accounting cash flow adjustment for BART’s lease on the 300 Lakeside Building in Oakland.
In addition, an annual allocation will be directed to funding the Capital Asset Replacement Program (CARP) for BART-to-Oakland International Airport. The CARP allocation starts at $0.6 million in FY15 and grows to $1.1 million by FY24. BART will contribute to this escrow fund each year, which will pay for the refurbishment and replacement costs for the system for the 20-year term of the operating contract. Expenditure of these funds is controlled jointly by BART and Doppelmayr Cable Car (DCC) based upon actual needs for refurbishment and replacement over the 20 years. DCC is required to fund costs in excess of the CARP and any funds remaining at the end of the term belong to DCC.
Revenue Enhancement/Cost Containment
As discussed in the beginning of Chapter 4, this line represents the District’s commitment to address future year deficits, either on an annual basis or as part of an overall financial strategy.
4-23

Capital Improvement Program
5 CAPITAL IMPROVEMENT PROGRAM
This chapter presents BART's Capital Improvement Program (CIP), a comprehensive inventory of the capital needs that BART faces, and the capital funding sources that have been identified for the 10 years of this plan (FY15-FY24). The primary purpose of this CIP is to provide a realistic picture of the funding outlook and the challenges BART faces in securing adequate funding to pay for needed capital improvements. While BART has some funding that is already programmed, allocated, or identified, the CIP shows that there is a significant shortfall between projected need and available funds. Additional funding at the federal, state, and local level will be needed to fully fund BART’s long term capital program.
The CIP’s secondary goal is to ensure that it is as consistent as possible with BART’s needs described in the Metropolitan Transportation Commission’s (MTC’s) Plan Bay Area (2040) Regional Transportation Plan (RTP).
The capital improvement projects described below are designed to maintain and enhance BART’s service by renovating and strengthening the core system; improving the system’s safety, security, and reliability; and modernizing and expanding the system to accommodate increasing ridership demand. This CIP is a snapshot of the current outlook, and is updated periodically as projects are further developed and the funding picture evolves.
LONG-TERM CAPITAL FINANCIAL OUTLOOK As with the operating outlook, the capital forecast illustrates serious funding challenges for BART in the coming years. Currently identified funding falls far short of the system’s capital needs, especially in the short term. This shortfall poses major challenges for ensuring that BART can adequately reinvest to maintain the system’s reliability and safety, while also making enhancements and adding capacity to serve new ridership demands and serve extensions that are under construction.
The CIP is not financially constrained and cannot be considered a capital budget as it shows a significant shortfall. To fully fund the CIP for FY15-FY24 would require approximately $9.6 billion. BART has already secured $323
5-1

Capital Improvement Program
million in “previously identified” capital funding. Staff has identified another $4.5 billion in future “committed” funding. Committed funding is defined as funding that is already secured or can reasonably be assumed to be received by BART. The remaining $4.8 billion shortfall represents 50% of BART’s projected capital needs. A snapshot of total CIP need as compared to previously identified and committed funding is shown in Figure 5-1.
BART has also identified several additional potential funding sources that may be received by BART. These are more uncertain and/or speculative, commonly referred to by MTC as "discretionary" funding. It is unlikely that all of these sources actually become a reality. Both committed and discretionary sources are further described later in this chapter.
BART is also working to identify capital need and funding sources beyond the 10-year horizon of this plan. However, it is challenging to fully anticipate capital improvements that will be needed that far in the future and any detailed cost estimates are likely to understate actual needs. Therefore, costs and funding sources beyond FY24 are not included in this CIP.
Key challenges related to the CIP financial outlook are:
Accommodating growth: BART’s ridership is expected to continue to grow. The region’s integrated transportation and land use plan, Plan Bay Area, relies on BART to continue to provide reliable, safe service for hundreds of thousands of additional riders over the next 25 years.
− By 2040, Plan Bay Area anticipates 2 million additional Bay Area residents and projects accommodating this growth in “Priority Development Areas” (PDAs) around transit hubs – many of which are centered on BART stations. Plan Bay Area also projects 250,000 new jobs (a 40% increase) located in areas adjacent to BART stations.
− BART’s daily ridership is expected to grow to nearly 500,000 by 2025 and to over 600,000 daily riders by 2040.
− These forecasts assume the BART system continues to operate reliably day-to-day and is able to expand its capacity to serve this increase in ridership. Sustaining the system’s current level of reliability will be a challenge if adequate funding for system reinvestment and capacity expansion is not available.
Misalignment between timing of need and availability of funding: Particularly important for BART’s capital program, funding is expected to become available at a far slower rate than is required to meet the schedule for BART’s capital needs, creating a more dramatic shortfall in the near term than the longer term. The shortfall is particularly acute in FY15 because it includes BART’s current backlog of unfunded maintenance as well as new investment needs that arise. BART is
5-2

Capital Improvement Program
actively working with MTC to finance this funding misalignment to the extent possible. Amplifying this issue, BART is allocating a significant amount of operating funds to the capital program. The need for these operating allocations, which is based on project schedules, will put a great deal of pressure on future operating budgets. These operating allocations to capital are one of the drivers of the projected annual operating shortfalls. BART is working to develop strategies to address the misalignment between capital funding and capital needs that could relieve the pressure on the operating budget.
Figure 5-1 BART’s Capital Financial Outlook, FY15-24
5-3

Capital Improvement Program
Decision-Making Factors BART considers number of factors when determining which capital projects are allocated the limited funding that is available. The Asset Management Program, described in Chapter 2, is refining and standardizing the manner in which BART decides to fund projects and related operating expenditures. In the past, BART has taken into consideration most of the factors listed below when considering which projects to fund, but the Asset Management Program, managed by the Budget Project Governance Group, will ensure that the process is transparent, accountable, and evidence-based. BART considers the following questions when deciding which projects to fund:
Does this expenditure provide the best value? Does this expenditure maximize value for money? Does this expenditure help BART manage risk? Does this expenditure address BART’s biggest identified sources of
risk? Does this expenditure close an identified need (i.e., a gap between
target and actual service levels)? Does this expenditure minimize life-cycle cost? Does this expenditure yield ongoing operational cost savings either
through efficiency or reduced risk? Does this expenditure align with BART’s six-point strategy for long-
term financial sustainability?
In addition, BART takes the following factors into consideration before finalizing its resource allocation strategy:
Equity: Does this project support BART’s mission to ensure equitable and just investments that support customers throughout its system?
Environmental Justice: Does this project comply with federal Title VI and BART’s environmental justice policies?
Project Continuity: Is this project already underway and does it need ongoing funding to continue implementation from a prior year?
Project Interdependence: Are other projects dependent on this project? Is this project dependent on others?
5-4
Capital Improvement Program
CAPITAL NEEDS The CIP includes hundreds of capital improvement projects. For ease of understanding, the CIP investments have been categorized on a broad level according to whether they support system reinvestment, service/capacity enhancement, system expansion, or earthquake safety, as shown in Figure 5-2. At a more fine-grained level, the individual projects have been grouped into nine major infrastructure categories and a series of subcategories. The list of categories and subcategories is shown in Figure 5-3. Each category and subcategory is subsequently briefly described.
Many of the projects described here are explicitly designed to mitigate system risks that have been identified through the Asset Management Program. BART’s six Asset Management Plans provide detailed descriptions of asset condition, performance, and the risk created by not adequately investing in each type of capital asset, as well as suggestions for mitigating these identified risks.
To fully fund the current CIP would require approximately $9.6 billion for the period FY15-FY24. The full CIP financial need projections for FY15 through FY24 are shown in Figure 5-4. Of these needs, 74.5% of the CIP is system reinvestment, another 17.5% is for service and capacity enhancement and the remainder is for system expansion, earthquake safety and other planning and Transit-Oriented Development (TOD) projects (Figure 5-2). Detail on total project costs and timelines for the “Big 3” and major BART system expansion projects is provided in Figure 5-5.
5-5

Capital Improvement Program
Figure 5-2 Overview of CIP Investments (Reinvestment, Capacity, Expansion, Earthquake Safety)
System Reinvestment
74.5%
Service and Capacity
Enhancement 17.5%
System Expansion
3.3%
Earthquake Safety 4.6%
Other 0.1%
5-6

Capital Improvement Program
Figure 5-3 Overview of CIP Categories and Subcategories
Categories Subcategories
BART Stations BART Metro Station Capacity Communication Systems Emergency Response Escalators/Elevators Facility Upgrades Fare Collection Landscaping Lighting
Planning Platforms Plazas & Concourses Signage Stairs Transit-Oriented Development Waste Management Water Infrastructure
Station Access Accessibility Bike Access
Intermodal Facilities Parking Facilities
Trains and Other Vehicles
Non-Revenue Vehicles Railcars
Train Equipment
Tracks & Related Infrastructure
Aerial Structures All Guideways At-Grade Guideways BART Metro Track Capacity Earthquake Safety Emergency Repair Emergency Response
Grounds Lighting Tracks Transbay Tube Tunnels Ventilation Systems Water Infrastructure
Maintenance Shops & Yards
Electrical Systems Emergency Response Lighting Maintenance Buildings & Facilities Mechanical Systems
Parking Facilities Security Systems Shop Equipment Tools & Equipment Water Infrastructure
Train Control, Power Systems, and Communications
Communication Systems Electrical Systems Facility Upgrades Integrated Computer Systems (ICS)
and Related Infrastructure
Traction Power Train Control Wireless
Security BART Police Building Security CCTV
Emergency Response Station Security
Administration Customer Service Information Technology
Office of External Affairs Studies
BART System Expansion
BART-to-Oakland Int’l Airport eBART Grounds Infill Stations
Livermore Planning Silicon Valley Berryessa Extension Warm Springs
5-7
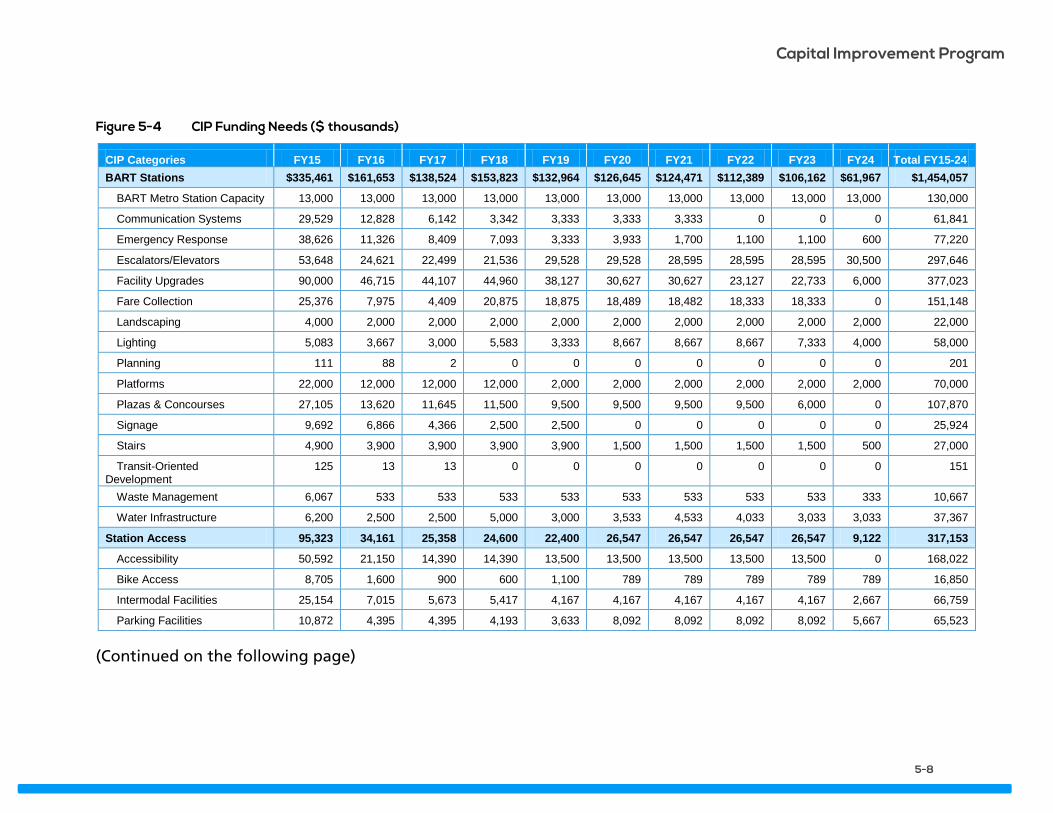
Capital Improvement Program
Figure 5-4 CIP Funding Needs ($ thousands)
CIP Categories FY15 FY16 FY17 FY18 FY19 FY20 FY21 FY22 FY23 FY24 Total FY15-24 BART Stations $335,461 $161,653 $138,524 $153,823 $132,964 $126,645 $124,471 $112,389 $106,162 $61,967 $1,454,057
BART Metro Station Capacity 13,000 13,000 13,000 13,000 13,000 13,000 13,000 13,000 13,000 13,000 130,000
Communication Systems 29,529 12,828 6,142 3,342 3,333 3,333 3,333 0 0 0 61,841
Emergency Response 38,626 11,326 8,409 7,093 3,333 3,933 1,700 1,100 1,100 600 77,220
Escalators/Elevators 53,648 24,621 22,499 21,536 29,528 29,528 28,595 28,595 28,595 30,500 297,646
Facility Upgrades 90,000 46,715 44,107 44,960 38,127 30,627 30,627 23,127 22,733 6,000 377,023
Fare Collection 25,376 7,975 4,409 20,875 18,875 18,489 18,482 18,333 18,333 0 151,148
Landscaping 4,000 2,000 2,000 2,000 2,000 2,000 2,000 2,000 2,000 2,000 22,000
Lighting 5,083 3,667 3,000 5,583 3,333 8,667 8,667 8,667 7,333 4,000 58,000
Planning 111 88 2 0 0 0 0 0 0 0 201
Platforms 22,000 12,000 12,000 12,000 2,000 2,000 2,000 2,000 2,000 2,000 70,000
Plazas & Concourses 27,105 13,620 11,645 11,500 9,500 9,500 9,500 9,500 6,000 0 107,870
Signage 9,692 6,866 4,366 2,500 2,500 0 0 0 0 0 25,924
Stairs 4,900 3,900 3,900 3,900 3,900 1,500 1,500 1,500 1,500 500 27,000
Transit-Oriented Development
125 13 13 0 0 0 0 0 0 0 151
Waste Management 6,067 533 533 533 533 533 533 533 533 333 10,667
Water Infrastructure 6,200 2,500 2,500 5,000 3,000 3,533 4,533 4,033 3,033 3,033 37,367
Station Access 95,323 34,161 25,358 24,600 22,400 26,547 26,547 26,547 26,547 9,122 317,153
Accessibility 50,592 21,150 14,390 14,390 13,500 13,500 13,500 13,500 13,500 0 168,022
Bike Access 8,705 1,600 900 600 1,100 789 789 789 789 789 16,850
Intermodal Facilities 25,154 7,015 5,673 5,417 4,167 4,167 4,167 4,167 4,167 2,667 66,759
Parking Facilities 10,872 4,395 4,395 4,193 3,633 8,092 8,092 8,092 8,092 5,667 65,523
(Continued on the following page)
5-8

Capital Improvement Program
CIP Categories FY15 FY16 FY17 FY18 FY19 FY20 FY21 FY22 FY23 FY24 Total FY15-24
Trains and Other Vehicles 80,011 57,359 190,710 546,025 597,565 499,937 467,808 473,916 27,214 64,630 3,005,175
Non-Revenue Vehicles 21,527 9,365 9,365 9,073 9,073 1,766 1,766 1,766 0 14,983 78,684
Railcars 49,949 47,587 180,938 536,952 588,492 498,171 466,042 472,150 27,214 49,647 2,917,142
Train Equipment 8,535 407 407 0 0 0 0 0 0 0 9,350
Tracks and Related Infrastructure 595,246 134,306 117,328 104,273 113,018 142,480 142,168 167,534 148,701 129,645 1,794,698
Aerial Structures 43,911 10,567 4,287 4,250 17,583 17,583 17,583 4,250 4,250 250 124,515
All Guideways 6,959 3,424 3,424 3,250 2,250 1,000 1,000 1,000 1,000 0 23,308
At-Grade Guideways 316,322 556 556 556 556 556 556 556 556 0 320,767
BART Metro Track Capacity 4,300 0 1,000 0 3,500 6,750 6,750 44,550 44,550 37,800 149,200
Earthquake Safety 70,238 48,077 40,226 40,212 40,212 40,212 40,212 40,212 40,212 40,212 440,024
Emergency Repair 2,000 1,000 1,000 1,000 1,000 1,000 1,000 1,000 1,000 0 10,000
Emergency Response 1,375 875 875 375 0 0 0 0 0 0 3,500
Grounds 16,142 7,286 5,940 2,413 2,413 32,413 32,100 32,100 32,100 31,350 194,255
Lighting 1,836 824 824 813 500 0 0 0 0 0 4,797
Tracks 70,340 26,920 26,920 21,500 21,000 21,000 21,000 21,000 6,500 3,000 239,180
Transbay Tube 11,450 4,044 1,544 772 772 500 500 333 333 20,249
Tunnels 40,757 25,228 22,728 21,633 21,633 20,800 20,800 22,200 18,200 16,700 230,680
Ventilation Systems 9,616 5,504 5,504 5,000 1,600 667 667 667 0 0 29,223
Water Infrastructure 0 0 2,500 2,500 0 0 0 0 0 0 5,000
(Continued on the following page)
5-9
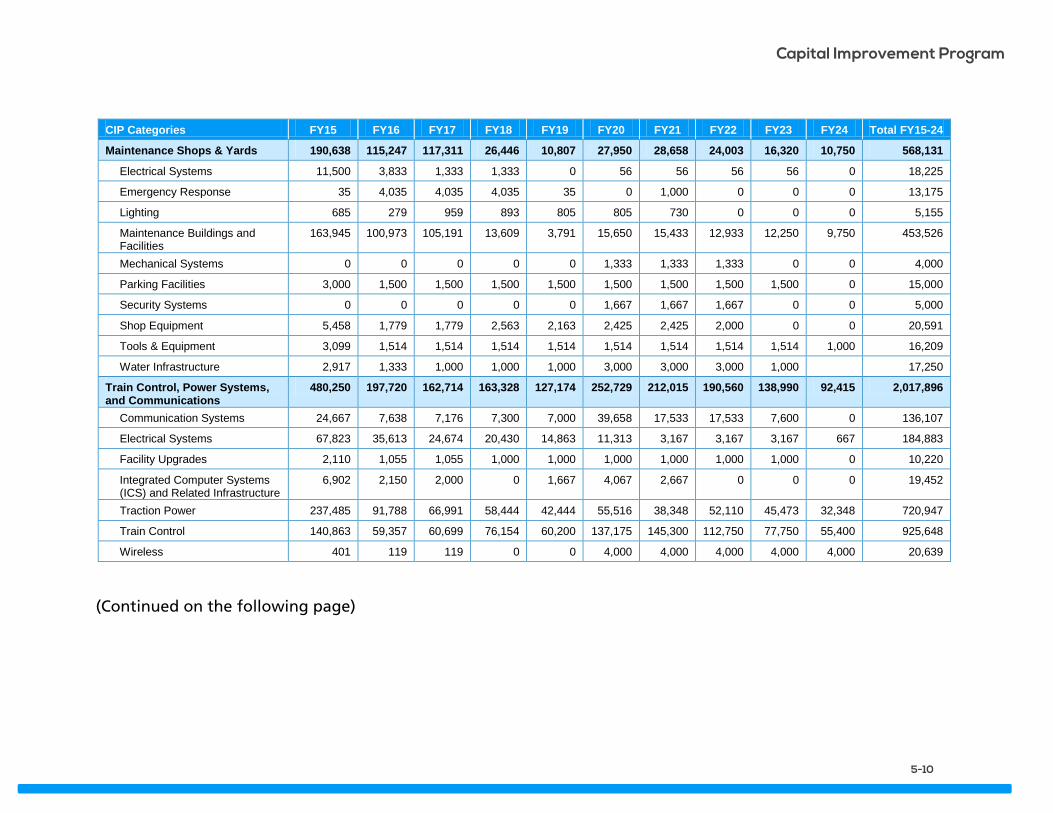
Capital Improvement Program
CIP Categories FY15 FY16 FY17 FY18 FY19 FY20 FY21 FY22 FY23 FY24 Total FY15-24
Maintenance Shops & Yards 190,638 115,247 117,311 26,446 10,807 27,950 28,658 24,003 16,320 10,750 568,131
Electrical Systems 11,500 3,833 1,333 1,333 0 56 56 56 56 0 18,225
Emergency Response 35 4,035 4,035 4,035 35 0 1,000 0 0 0 13,175
Lighting 685 279 959 893 805 805 730 0 0 0 5,155
Maintenance Buildings and Facilities
163,945 100,973 105,191 13,609 3,791 15,650 15,433 12,933 12,250 9,750 453,526
Mechanical Systems 0 0 0 0 0 1,333 1,333 1,333 0 0 4,000
Parking Facilities 3,000 1,500 1,500 1,500 1,500 1,500 1,500 1,500 1,500 0 15,000
Security Systems 0 0 0 0 0 1,667 1,667 1,667 0 0 5,000
Shop Equipment 5,458 1,779 1,779 2,563 2,163 2,425 2,425 2,000 0 0 20,591
Tools & Equipment 3,099 1,514 1,514 1,514 1,514 1,514 1,514 1,514 1,514 1,000 16,209
Water Infrastructure 2,917 1,333 1,000 1,000 1,000 3,000 3,000 3,000 1,000 17,250
Train Control, Power Systems, and Communications
480,250 197,720 162,714 163,328 127,174 252,729 212,015 190,560 138,990 92,415 2,017,896
Communication Systems 24,667 7,638 7,176 7,300 7,000 39,658 17,533 17,533 7,600 0 136,107
Electrical Systems 67,823 35,613 24,674 20,430 14,863 11,313 3,167 3,167 3,167 667 184,883
Facility Upgrades 2,110 1,055 1,055 1,000 1,000 1,000 1,000 1,000 1,000 0 10,220
Integrated Computer Systems (ICS) and Related Infrastructure
6,902 2,150 2,000 0 1,667 4,067 2,667 0 0 0 19,452
Traction Power 237,485 91,788 66,991 58,444 42,444 55,516 38,348 52,110 45,473 32,348 720,947
Train Control 140,863 59,357 60,699 76,154 60,200 137,175 145,300 112,750 77,750 55,400 925,648
Wireless 401 119 119 0 0 4,000 4,000 4,000 4,000 4,000 20,639
(Continued on the following page)
5-10

Capital Improvement Program
CIP Categories FY15 FY16 FY17 FY18 FY19 FY20 FY21 FY22 FY23 FY24 Total FY15-24
Security 35,787 14,951 11,270 5,533 5,176 13,976 14,484 7,737 7,835 7,533 124,282
BART Police 17,071 7,741 7,194 2,000 1,643 2,345 2,645 1,370 1,468 500 43,976
Building Security 0 0 0 0 0 800 0 0 0 0 800
CCTV 1,085 543 543 0 0 9,508 8,183 3,833 3,833 3,833 31,362
Emergency Response 0 0 0 0 0 498 498 0 0 0 995
Station Security 17,631 6,668 3,533 3,533 3,533 825 3,158 2,533 2,533 3,200 47,149
Administration 4,872 1,839 514 546 531 572 168 12 12 0 9,067
Customer Service 42 21 21 0 0 0 0 0 0 0 83
Information Technology 3,633 1,807 482 475 475 475 150 0 0 0 7,497
Office of External Affairs 577 12 11 71 56 97 18 12 12 0 866
Studies 621 0 0 0 0 0 0 0 0 0 621
BART System Expansion 193,423 75,487 31,134 14,266 1,776 1,776 0 0 0 0 317,863
BART-to-Oakland International Airport
22,108 21,618 7,486 0 0 0 0 0 0 0 51,212
eBART 19,920 14,039 12,584 12,489 0 0 0 0 0 0 59,033
Grounds 174 87 87 0 0 0 0 0 0 0 347
Infill Stations 654 0 0 0 0 0 0 0 0 0 654
Livermore 3,747 3,747 0 0 0 0 0 0 0 0 7,495
Planning 585 181 181 0 0 0 0 0 0 0 948
Silicon Valley Berryessa Extension
2,404 1,776 1,776 1,776 1,776 1,776 0 0 0 0 11,286
Warm Springs 143,831 34,038 9,020 0 0 0 0 0 0 0 186,889
Grand Total 2,011,011 792,722 794,864 1,038,839 1,011,412 1,092,613 1,016,320 1,002,698 471,780 376,063 9,608,321
5-11

Figure 5-5 Major BART Investments’ Schedule and Total Cost
Project Total
Cost (M$)
Schedule
Enter Revenue Service Project Funding
Rail Cars (1,000) $3,286.0 FY171 FY08 - FY27 FY10 - FY27
Hayward Maintenance Complex (HMC)
$432.9 FY172 FY10 - FY18 FY10 - FY19
Train Control Modernization Project (TCMP)
$700-$9004
FY203 FY12 - FY24 FY12 - FY30
BART-to-OAK $484.1 FY15 FY11 - FY15
Warm Springs Extension (WSX)
$767.0 FY16 FY10 - FY17 FY07 - FY28
eBART $506.0 FY18 FY10 - FY17 FY18
1. Multi-year project. First cars to be delivered in FY17. 2. Multi-year project. Must improvements functional by FY17. 3. Multi-year project. Transbay and Oakland Wye improvements estimated to begin in FY20. 4. Cost depends on technology selected.
BART Stations BART has 44 stations – 16 subway stations, 12 elevated and 16 at ground level. Every station has buildings, fare gates, fare collection equipment, elevators and escalators, plazas, waiting areas, and many other features that support passengers accessing, waiting for, and boarding BART trains every day. Some station plazas are used by the community as civic spaces. Other stations connect to transit-oriented development, which often combines housing with office space and shopping.
Stations also include a great deal of infrastructure that is not easily visible or noticed by everyday users. This type of infrastructure includes water and ventilation systems, lighting, emergency infrastructure, and waste management equipment. Asset Management Plans identify the risks associated with stations, some of which include: older station roofs that allow water intrusion into public and non-public spaces and leads to deterioration of infrastructure. Plumbing/sewer drains are also old, which can result in undetected leaks, flooding, electrolysis, or fire system failures.
Capital improvement projects for stations are grouped into several subcategories described below.
BART Metro Station Capacity
As noted in the Building a Better BART section of this report, the BART Metro Core Capacity Capital Improvement Program encompasses a package
5-12

Capital Improvement Program
of projects to enhance BART service and capacity. It includes two phases – Metro Commute, which focuses on service strategies and investments to support growing ridership within the existing core system, and Metro Vision, which provides a framework for long-term service enhancements and system expansion.
Capacity is simply a measure of the station’s ability to accommodate riders, whether in station plazas and concourses or on the station platform. Capacity is especially important during peak commuting hours. In part, the BART Metro planning initiative includes projects designed to increase station capacity at existing core stations to ensure that more passengers are able to get to and from the platforms and safely wait for the trains. BART Metro station capacity projects such as additional platforms and elevators will be particularly helpful in accommodating BART's growing ridership safely and efficiently.
Communication Systems
Communication systems at the station level include infrastructure and technology to convey information to passengers. Examples of projects included in the CIP are:
Replacement of the public address system BART uses to make announcements
Replacement of the destination signs on station platforms Installation of real-time train arrival displays
Emergency Response
These projects ensure that BART has adequate information and infrastructure in place to quickly and safely respond in the event of an emergency as well as ensure that station areas are safe and secure at all times. Examples of projects included in the CIP are:
Replacement of station fire alarms Replacement of sprinkler heads Rehabilitation/installation of emergency lighting
Escalators/Elevators
There are over 173 escalators and 130 elevators throughout the BART system. In operation continuously during service hours, they require a great deal of regular maintenance and upkeep. Most stations only have one elevator to get people on to a platform or into a station. As a result, if just one elevator is out of service, a customer who must use the elevator is unable to access that station. Keeping the elevators in service at the 90% level is managed by prioritizing escalator maintenance second. Escalators
5-13

Capital Improvement Program
are used by most patrons, so an out-of-service escalator results in several complaints from customers, but the station is still accessible by most patrons. Escalators that lead to streets are exposed to the outside elements, which contributes to increased maintenance issues.
Examples of short- and long-term capital improvements to escalators and elevators are:
Replacement and/or renovation of street level escalator canopies Basic elevator renovation Louder elevator chimes and brighter call buttons (which have been
faded by the sun) at Lake Merritt station
Facility Upgrades
As BART stations age and experience the wear and tear of daily use, the various components that make up station areas and buildings need to be replaced. BART is also planning to install infrastructure to help shield surrounding neighborhoods from the noise created by BART and other activities that occur at stations. Examples of capital improvements to station facilities are:
Replacements of station roofs Installment of noise abatement facilities Rehabilitation of employee facilities
Fare Collection
Station fare collection equipment includes fare gates, Clipper card technology, change machines, and other infrastructure that enables passengers to make, and BART to collect and process, fare payments. Examples of projects included in the CIP are:
Replacement of fare collection computer equipment Installation of bill-to-bill change machines Removal of bus transfer machines and subsequent site restoration
Landscaping
Landscaping projects include re-planting of outdoor areas and other improvements to the natural areas around station structures and plazas.
Lighting
BART station lighting includes lights that illuminate the platforms, station concourses, and station parking lots. Examples of projects included in the CIP are:
5-14

Capital Improvement Program
Retrofit of underground station lighting to LED for energy efficiency Installation of programmable lighting panels for all stations
Planning
Station planning projects largely include studies about expanding station capacity.
Platforms
Station platforms are where riders wait for, board, and get off trains. Platform projects include basic renovation of platform components, such as the systemwide replacement of the platform edge detectable warning system (i.e., the “yellow strip”).
Plazas and Concourses
Station plazas and concourses include both unpaid and paid areas within the station, as well as infrastructure immediately outside the station. Related infrastructure includes paths, patios, street furniture, and sidewalks. Projects in this subcategory typically include renovation and/or replacement of key plaza components, such as tiles and other hardscapes.
Signage
BART station signage includes station name signs and directional signage. Projects in this subcategory include installing new signage to help passengers better navigate within the stations and get oriented before they exit. Some stations are scheduled to receive a full upgrade of all the signage, echoing the complete signage renovation at the Ashby and downtown San Francisco stations.
Stairs
In addition to escalators and elevators, stairs are the primary forms of access between the street, concourse, and platform levels. Stairway projects include:
Replacement of handrails and guardrails Replacement of station stair tread to keep passengers from slipping
Transit-Oriented Development
BART’s station parking lots are prime locations for transit-oriented, mixed-use developments. Transit-oriented development (TOD) generally includes one or more of the following elements: a combination of office, retail, civic and/or residential uses; high density development; walkable, bikeable design; and easy transit access. TOD can significantly increase transit
5-15

Capital Improvement Program
ridership. Joint transit-oriented development projects are being planned or built at several stations, including Walnut Creek, MacArthur, Coliseum, San Leandro, South Hayward, and Millbrae.
Waste Management
With hundreds of thousands of riders passing through each day, significant quantities of waste are generated at stations every day. Examples of projects to ensure BART is able to adequately manage waste collection and disposal are:
Replacement of trash compactors Replacement of station trash cans
Water Infrastructure
Water infrastructure at BART stations includes pumps, storm water drainage systems, and irrigation for station area landscaping.
Examples of projects included in the CIP are:
Upgrades to storm water treatment systemwide Replacement of irrigation systems and maintenance of valves
Station Access There are a wide variety of facilities and improvements that give riders access to BART stations including bike facilities, bus and shuttle loading areas, and parking facilities. BART manages 47,000 parking spaces across 33 stations. Almost all BART stations have bike racks, over half of BART stations have bike lockers, and four stations now have bike stations. BART also has many features throughout the system to accommodate people with disabilities, such as tactile pathways, braille signage, and audible announcements.
Capital improvement projects for station access are grouped into subcategories described below.
Accessibility
Like all transit agencies across the United States, BART is required by the ADA to ensure that all patrons may safely access BART. Examples of ADA accessibility projects in the CIP include:
Installation of accessible fare gates Installation of braille signage at stations, including elevators Replacement/renovation of pavement and reduction of slopes at the
Castro Valley intermodal area
5-16

Capital Improvement Program
Bike Access
BART has increased bike accessibility over the past several years in a number of ways, including revising the agency’s bike policy to be more inclusive and installing bike lockers and other infrastructure to make it easier for bicyclists to access and ride BART. Future bike access needs include additional bike lockers, bike stations, and stair channels throughout the BART system.
Intermodal Facilities
Intermodal facilities are locations where BART riders can access connecting transit services such as AC Transit, Muni, and SamTrans buses. Examples of intermodal facility improvements in the CIP include repaving of station intermodal areas, which endure daily wear and tear from constant use.
Parking Facilities
Thirty-three of BART’s 44 stations have on-site parking facilities, such as multi-story parking garages and surface lots. Examples of projects here include:
Renovations of elevators in parking garages Improvements to lighting in and around parking areas Renewal of paint for striping and curbs in parking areas
Trains and Other Vehicles BART has a fleet of 669 rail cars, which are joined into 3- to 10-car trains to provide daily service. BART’s current fleet is the oldest in the United States and is in constant need of maintenance and repair. Rehabilitation and upgrade of BART’s railcars in the late 1990s helped prolong the life of these essential vehicles, but they are now in need of replacement. BART has embarked on a project to acquire new cars – its Fleet of the Future – described more fully below. BART staff also use a wide range of non-revenue vehicles to maintain and access the BART system.
The primary need of this category is investing in the Fleet of the Future, which are the railcars that will carry BART passengers for the next 40 years.
Non-Revenue Vehicles
Non-revenue vehicles are any vehicles that are not used for passenger service. BART staff use over 30 different types of service vehicles to support BART train service, including rail grinding vehicles, which are used to grind down rough patches of track, and maintenance trucks at yards. Asset Management Plans identify the risks associated with non-revenue vehicles, which include inadequate shop space to support fleet maintenance; an aging non-revenue fleet, which increases down-time of critical assets needed
5-17

Capital Improvement Program
for track maintenance; and, for track equipment, customized parts that are very expensive and have a long procurement lead time. In addition, although the size of the BART system has increased over the past 20 years, there has not been a commensurate increase in the fleet of maintenance equipment. Projects in the CIP include systematic replacement of non-revenue vehicles and related equipment due to age and wear and tear.
Railcars
BART’s railcars are among its most visible capital assets. With railcars that are over 40 years old, BART launched the process of acquiring its Fleet of the Future, a project to expand BART’s current fleet from 669 to as many as 1,000 railcars. This will improve the reliability of BART’s fleet, decrease maintenance costs, relieve crowding, and help meet growing demand associated with regional population growth and system expansions. In 2012, BART chose Bombardier Transportation to build BART's Fleet of the Future. The project is currently in the design and engineering phase. A complex supply chain and assembly process, followed by testing, will result in the first new train cars going into service in 2017. In 2015, Bombardier will deliver 10 fully functional pilot cars that will spend 18 months in the Bay Area running on BART test tracks and throughout the BART system outside of normal operating hours. During this qualification and testing phase, BART and Bombardier will verify and validate the train car performance prior to manufacturing the railcars for revenue service. The new rail cars will be designed to have a minimum service life of 40 years for the car body and truck frame and 30 years for most associated systems and subsystems.
Train Equipment
Train equipment includes components and parts of railcars that allow them to operate normally and provide passenger comfort. Projects of this nature in the CIP include continued replacement of the floors and heating and air conditioning units of existing railcars in the short-term, prior to the full deployment of the Fleet of the Future.
Tracks and Related Infrastructure BART operates 104 route miles of track: 37 miles in subways and tunnels; 23 miles on aerial structures; and 44 miles at ground level. In addition, BART maintains 500 linear miles of track throughout the entire system.
Aerial Structures
Aerial (or “elevated”) structures allow BART trains to travel at high speed above the ground, which frees up space for streets, trails, and other uses under the tracks. As aerial structures age, BART will need to reinvest in
5-18

Capital Improvement Program
infrastructure, such as sound walls, steel girder bridges, and catwalks—structures that allow staff access to equipment along aerial structures.
All Guideways
This subcategory simply refers to projects that apply to trackways throughout the system, whether aerial, at-grade, or underground. Examples of these types of projects include:
Restoration of handrails along emergency walkways Control and repair of steel corrosion
At-Grade Guideways
Another term for at-grade is “ground level.” This subcategory includes capital investment projects that renew BART trackways at the surface level or on embankments. At-grade projects in the CIP primarily include slope stabilization and the rehabilitation of embankments at key locations in the system.
BART Metro Track Capacity
BART Metro projects related to tracks and related infrastructure include a series of capital improvements that would allow BART to improve its service flexibility and reliability while also filling empty seats during the off-peak and creating a high frequency service in the region's core. These improvements specifically involve the installation of a limited number of tail tracks, pocket tracks, and track crossovers at locations such as Richmond, Lafayette, Dublin/Pleasanton, Bay Fair, Daly City, Millbrae, and Glen Park. This allows trains to switch directions without going all the way to the end of the line, allowing additional peak trains in core areas.
Earthquake Safety
From 2009 to the present, BART has been steadily investing in crucial seismic upgrades to its core infrastructure. In particular, the Earthquake Safety Program, which seeks to strengthen the BART system and its facilities as quickly as possible while maintaining normal BART service, will be complete in 2023.
Emergency Repair
Emergency repair projects are those that address the needs caused by emergencies, such as repairing substations after failures, fixing broken rails, or cleaning up storm damage. Projects such as these occur on an ad hoc basis as they are undertaken only in response to an unplanned event.
5-19

Capital Improvement Program
Emergency Response
In contrast, projects in the emergency response category address reinvestment needs for infrastructure that supports fire response and suppression along trackways.
Grounds
BART grounds include rights-of-way and other ground level areas around trackways and buildings. Asset Management Plans identify the risks associated with guideways and grounds, some of which include major deterioration of sound walls along several lines; broken irrigation systems at stations, resulting in dead vegetation that can become a fire hazard; and damaged right-of-way fencing that may not meet California Public Utilities Commission (CPUC) requirements in the next five years.
Grounds projects in the CIP include:
Management of vegetation on BART grounds Replacement and renewal of fencing
Lighting
Trackway lighting mainly includes emergency lighting and other lights in tunnels.
Tracks
BART’s tracks include the rails on which BART runs. Ensuring that the tracks are always in top shape requires a great deal of ongoing maintenance and reinvestment. Asset Management Plans identify the risks associated with track, some of which include old and unreliable track equipment and worn existing track in need of replacement.
Sample projects in the CIP include:
Replacement of ties at switches and regular track segments Renewal of rails along regular track segments
Transbay Tube
BART’s Transbay Tube links San Francisco and Oakland and runs along the bottom of the San Francisco Bay. As the most crucial link in the system, it requires constant maintenance and reinvestment to ensure that it remains safe and reliable. An investment project for the Transbay Tube includes the replacement of cross-passage doors and hardware to ensure emergency egress.
5-20

Capital Improvement Program
Tunnels
BART has several major tunnels in the system in addition to the Transbay Tube. These include the Berkeley Hills Tunnel and the subway sections in San Francisco, downtown Oakland, and downtown Berkeley. Asset Management Plans identify the risks associated with tunnels, such as deterioration of the Berkeley Hills tunnel liner in the area of the Hayward Fault and premature failure of tracks and train control equipment due to groundwater intrusion in some locations between San Francisco and Millbrae.
Tunnel capital projects in the CIP include:
Waterproofing of the tunnel and related facilities at Ashby and Berkeley stations on the Richmond line
Earthquake mitigation in the Berkeley Hills Tunnel
Ventilation Systems
Investments in ventilation systems help control the temperatures at BART stations and trackways through the use of fans and other equipment. A number of replacements and upgrades are needed to ensure that this equipment continues to operate efficiently.
Maintenance Shops and Yards BART has five maintenance facilities as well as tools and other equipment to support the upkeep and repair of the BART system. The four rail car facilities, located near the Hayward, Concord, Richmond, and Daly City stations, are used for preventive and unscheduled maintenance, with heavy maintenance performed at Hayward. The Oakland Shop is used to maintain BART’s fleet of non-revenue support vehicles.
Electrical Systems
This subcategory of projects includes key electrical system upgrades and replacements at maintenance facilities.
Emergency Response
Emergency response projects at maintenance shops and yards include reinvestments in fire hoses and piping at key locations.
Lighting
Projects to improve lighting at maintenance shops and yards include upgrades to fixtures in storage yard areas and in shop buildings.
5-21
Capital Improvement Program
Maintenance Buildings and Facilities
Maintenance facilities and yards include a number of components, paint shops, fueling stations, storage areas, and offices for staff. Projects in this subcategory generally include rehabilitations and/or expansions of existing facilities to ensure they continue to meet the needs of an expanding fleet.
A major investment in this category is the expansion of the Hayward Maintenance Complex (HMC). While BART already has a maintenance yard in Hayward, the agency plans to expand the HMC to accommodate the growing fleet and system expansion. The HMC project has two components:
Reconfiguration of the existing Hayward Yard Acquisition of three adjacent properties on the west side of the
existing Hayward Yard for a larger primary repair shop, a new component repair shop, a vehicle overhaul shop, a new central parts warehouse, and a new maintenance and engineering repair shop
Investment in the new HMC is essential to ensuring that BART’s maintenance and repair capacity is sufficient to support existing and new infrastructure, particularly as the Silicon Valley Berryessa Extension project and the Fleet of the Future are put into service in the second half of this decade.
Mechanical Systems
Mechanical systems at yards and shops include heating, ventilation, and air conditioning (HVAC) units and systems.
Parking Facilities
Employees access and/or park at maintenance shops and yard parking areas using access and service roads. A project in the CIP is the repaving of these areas to ensure that they remain viable in the long term.
Security Systems
Maintenance shops and yards must be properly secured to ensure that BART’s important assets remain intact. The CIP includes one major security systems project in this category: improving security at the Oakland Shops and Yards.
Shop Equipment
Shop equipment includes a variety of key machines and shop components that allow staff to adequately maintain BART railcars and other assets. Shop equipment include train washers, shop heaters, overhead cranes, and units for large-scale washing. Projects in this subcategory involve replacement of these types of equipment.
5-22

Capital Improvement Program
Tools and Equipment
This subcategory includes general tools and equipment used by BART maintenance staff to complete their duties in a variety of fields, including systems and power/mechanical maintenance.
Water Infrastructure
Water infrastructure at maintenance shops and yards generally includes standard water and sewage connections and pumps, as well as treatment plans for wastewater created at each of the four BART yards. Examples of projects in this subcategory are infrastructure replacement once existing units and systems have become obsolete.
Train Control, Power Systems, and Communications BART’s trains, stations, and other facilities operate continuously due to a number of key systems that provide a functional foundation for BART service. Three major types of systems are covered in this category: train control, power systems, and communications. This category also includes other types of systems that enable BART to function properly.
Two significant BART reinvestment projects are included in this category: Train Control Modernization, which is one of the Core Capacity “Big 3” projects, and the new Operations Control Center (OCC).
Communication Systems
BART’s communication systems form the backbone of its supervisory and control systems. They consist of fiber optic cable plant and computer systems that control and route all commands to the field from the OCC. The OCC functions as the nerve center of BART's 104-mile system, performing supervisory control of train operations and remote control of electrification, ventilation, and emergency response systems. The display boards use computer imaging and video projection to display the entire system, combining information into two modules: one for track and train positions and the other for maintenance information and electrification. In addition, OCC personnel can monitor train movements and activities in and around stations via remote cameras located at key points. The OCC was constructed in 1972 and will be replaced in FY18.
Communication systems are critical to ensuring that OCC staff can consistently monitor activity throughout the BART system at all times. Another primary communication network is the trunked radio system, which is used for a variety of daily functions. Also, throughout the BART system, closed-circuit television (CCTV) infrastructure functions dually as a key component of BART’s operational oversight and security functions. Asset
5-23
Capital Improvement Program
Management Plans identify the risks associated with communications, such as insufficient storage capacity of the VCR/DVR for CCTV and obsolescence of the majority of analog CCTV cameras and many of the aged communications systems.
Improvement projects for communication systems in the CIP include:
Upgrade of system CCTV’s Replacement of various telephone network components
Electrical Systems
This subcategory includes BART’s 1,000 volt DC electricity third rail which propels trains at up to 80 miles per hour and other electrical infrastructure for powering BART facilities. This electrical equipment supports BART’s traction power system, electrical generators, and related infrastructure. Examples of projects included in this subcategory are:
Replacement of power generators Replacement of breakers and wiring on fans systemwide Replacement of coverings for BART’s third rail power source
Facility Upgrades
Some electrical infrastructure is housed in substations at various locations around the BART system. An example of a facility upgrade project in the CIP is repainting substations.
Integrated Computer Systems (ICS) and Related Infrastructure
BART’s Integrated Computer System is a major component in BART’s train control and supervisory system, along with the OCC, the train control system, and on-board train operation computers. ICS, together with the communications network, essentially allows the OCC to control and monitor the systems and devices that run BART trains.
This subcategory also includes other computer systems that monitor BART facility performance and provide passenger information (like the Destination Sign System). Asset Management Plans identify the risks associated with the ICS and related infrastructure, including an ICS Central Computer that is nearing the end of its useful life. This system is critical to operations. BART has a limited number and, in some cases, no spare parts for the existing destination sign system. Any sudden failures that cannot be repaired because of insufficient spare parts could result in failure to meet ADA and other service requirements.
5-24

Capital Improvement Program
Sample projects in this subcategory include several upgrades and improvements to expand the ability of the ICS in smartly guiding train control operations.
Traction Power
The Traction Power System (TPS) is what propels BART trains by providing electricity to BART’s third rail. The TPS is supported through a set of 118 substations, over 700 high voltage circuit breakers and switchgear, over 1.5 million linear feet of cabling, and other electrical equipment. Projects in the CIP include routine replacement and rehabilitation of this equipment to ensure that BART is able to draw power for its daily operations.
Train Control
The train control system consists of both hardware and software that is used to ensure safe operation of the system. It monitors train location, ensures sufficient distance between trains, manages train movements, and helps staff to analyze and report on any issues.
The Train Control Modernization Project entails replacing aging train control equipment and upgrading it with a Communications-Based Train Control (CBTC) system that will improve the reliability of the system, decrease the run time of trains between stations, and enhance the efficiency of maintenance. Specifically, modernizing BART’s train control system will allow trains to operate on the tracks at more closely-spaced intervals and at faster speeds, thereby increasing the BART system’s capacity to carry passengers. A modernized train control system will enable BART to meet the projected demand of over 30,000 peak hour/peak direction passengers; compared to today’s approximately 21,000 riders.
Wireless
Projects to improve wireless connectivity on BART are also a component of BART’s communication networks. Future projects include improving Wi-Fi access aboard trains and at other locations throughout the system.
Security The security of the BART system is primarily provided by BART Police. In addition, BART has a robust emergency preparedness program, coordinated with adjacent jurisdictions, and a dedicated Safety Department. In addition to BART Police, security investments can be subcategorized, as described below.
5-25

Capital Improvement Program
BART Police
BART Police is BART’s own police department, which provides security at all of BART’s stations and facilities. Future investments in the department include:
Improvements to staff facilities (break/locker/other rooms) Improvements to other facilities (e.g., the evidence room) Rehabilitation projects at other BART Police locations
Building Security
BART’s facilities are kept secure using CCTV and other access control systems that limit access to BART staff. Projects in this subcategory primarily include upgrading BART’s Access Control System and related infrastructure.
CCTV
While BART uses CCTV technology as a means to conduct routine observation of daily operational activities, it is also a crucial tool in ensuring that BART stations and facilities are safe and secure at all times. Projects in the CIP include:
Reinvestment in the reliability and coverage of on-train CCTV units Installation of cameras in more elevators Implementation of analytic tools for CCTV and other security data
Emergency Response
A project in this subcategory is to reinvest in fire extinguishers at locations throughout the system (not solely at stations).
Station Security
Station security infrastructure includes a variety of components, such as grates covering station entrances when BART is not operating and fencing and gates designed to secure paid fare areas by discouraging fare evasion. Investment projects in this subcategory include:
Reinvestment in station entrance roll-up grilles Installation of additional station entrance protection Mitigation of fare evasion
Administration There are a variety of administrative activities and facilities behind the scenes that support BART, such as IT equipment, customer service, and planning studies.
5-26

Capital Improvement Program
Customer Service
BART’s customer service activities include providing customer information through paper brochures, signage at stations, and information on a variety of online platforms. A major capital investment for BART’s customer service is the remodeling of BART’s Transit Information Center near the Lake Merritt station.
Information Technology
BART’s Information Technology department oversees BART’s administrative computer networks. Projects for the IT department include investments in asset management and computer hardware and software upgrades.
Office of External Affairs
BART’s Office of External Affairs primarily oversees media relations and public information programs. Capital projects for the Office of External Affairs include a BART Museum and other outreach equipment, as well as funding for the maintenance of items used for communications activities.
Studies
Administrative study projects include a review of BART’s real estate procedures and a report on refining BART’s train operator training simulator.
BART System Expansion At the same time BART must reinvest in its core system infrastructure, it is also continuing to invest in system extensions, infill stations, and planning for future expansion. BART’s System Expansion Policy which sets forth the criteria for adding new BART service is included in Appendix A.
BART is currently working on several capital projects to expand the system, including:
The BART-to-Oakland International Airport Project will link the Coliseum station with the Oakland International Airport and is expected to open in fall 2014.
The Warm Springs extension (WSX) is a 5.4-mile extension from the existing Fremont station to a new station in the Warm Springs District of South Fremont. This project is underway and projected to open in December 2015.
eBART is a 10-mile, one station extension of BART that will create a link from Pittsburg/Bay Point to Antioch in eastern Contra Costa County. The project will use a cost-effective technology called diesel multiple unit (DMU) trains that are run with clean-diesel technology
5-27

Capital Improvement Program
and can carry 300 to 400 people in each two-vehicle train. eBART is expected to begin service in 2017.
Silicon Valley Berryessa Extension (SVBX) will link the Warm Springs/South Fremont station (currently under construction) to Milpitas and Berryessa near San Jose. The SVBX will be constructed through a partnership between BART and the Santa Clara Valley Transportation Authority (VTA). This project is expected to open in 2018.
Specific projects related to these extensions are included in the CIP since the four expansion projects are currently underway. Additionally, BART planning staff is busy preparing for the future. Projects of this nature included in the CIP involve environmental planning for a potential extension to Livermore.
CAPITAL FUNDING Securing capital funds in the Bay Area is challenging because of the number of transit operators within the region. Their collective need for replacement and expansion of capital assets and the consequent required funding creates a significant financial burden for the Bay Area. As identified in Plan Bay Area (the region’s federally mandated Regional Transportation Plan), over the next 28 years the Bay Area region is facing a $17 billion transit capital shortfall out of a $47 billion overall need. The resulting funding uncertainty means that projects included in BART’s CIP will not necessarily be funded. Given these circumstances and the magnitude of BART's capital needs over the next 10 years and beyond, a very aggressive approach to securing discretionary grants will be necessary. Advocacy for project grant funding must be continuous at the county, regional, state, and federal levels from the moment a project is approved to the year that the grant is won. This process is labor intensive and requires persistent effort on the part of BART staff, Board members, and elected officials.
Capital funds come from a wide variety of federal, state, regional, and local sources. With the exception of FTA Section 5307 and Transit Development Alternative funding formula allocations, other capital funding sources are one-time, competitive grants. With fierce competition for federal and state funding coupled with ongoing and recent tightening of regulations and restrictions on such funding, transit agencies increasingly need to rely on regional and local funding sources, including public/private partnerships. The fact that BART operates in four counties impedes local ownership of systemwide capital needs, which reduces BART's ability to secure local funding for these systemwide needs.
Consistent with the terminology used by MTC in its Regional Transportation Plan, BART has identified future funding sources either as “committed” or “discretionary.” Committed funds are those already allocated to BART,
5-28
Capital Improvement Program
programmed, identified in an agreement, or that can be reasonably assumed to be committed to BART in the future. Discretionary funds are more speculative funding sources; these funds may require a vote of the electorate or legislative action and there is far less certainty that they will become available within the plan horizon.
Also included in the funding projections is a modest amount of funds that have already been received by BART, but have not yet been expended; these sources are referred to as “previously identified” sources.
Previously identified funding sources and committed funding sources are shown in Figure 5-6. Potential discretionary sources are shown in Figure 5-7. Committed and discretionary sources are each described in more detail after the figures.
5-29

Capital Improvement Program
Figure 5-6 Capital Funding Sources: Previously Identified and Committed Funding ($thousands)
FY15 FY16 FY17 FY18 FY19 FY20 FY21 FY22 FY23 FY24 Total FY 15-24
Previously Identified Funding
Total Previously Identified Funds $32,321 $32,321 $32,321 $32,321 $32,321 $32,321 $32,321 $32,321 $32,321 $32,321 $323,213
Committed Funding
Federal
TCP - FTA Sections 5337 & 53071,19 $152,719 $154,480 $156,295 $158,163 $160,088 $162,071 $164,113 $166,216 $168,383 $170,614 $1,613,143
STP 2nd Cycle TCS2 1,438 2,000 2,000 2,000 62,019 62,067 62,117 62,169 62,222 62,277 380,309
TSP - Transit Performance Initiative3 3,713 3,825 3,939 4,057 4,179 4,305 4,434 4,567 4,704 4,845 42,567
STP & CMAQ4,15 4,671 0 3,726 30,000 30,000 30,000 30,000 30,000 13,000 0 171,397
State
Proposition 1 B Security7 5,400 5,400 5,400 5,400 5,400 5,400 5,400 5,400 5,400 0 48,600
Proposition 1A High Speed Rail Bonds8 148,600 0 0 0 0 0 0 0 0 0 148,600
Regional
AB 664 Bridge Tolls & BATA Project Savings5, 15 20,320 20,449 20,583 20,720 20,862 21,008 21,158 21,313 21,472 21,636 209,520
Local
County Sales Taxes10 2,910 2,910 2,910 2,910 2,910 2,910 2,910 2,910 0 0 23,280
VTA Contribution s17 76,833 6,304 24,584 67,783 57,788 13,028 1,757 912 6,742 3,454 259,185
Alameda County Vehicle Registration Fees4 3,718 0 0 0 0 0 0 0 0 0 3,718
BART
BART Seismic GO Bonds9 43,000 43,000 43,000 0 0 0 0 0 0 0 129,000
BART Op. Allocations to "Big 3" Core Capacity Projects & Capital4,11,12 82,178 79,033 79,387 72,305 161,288 242,534 111,938 78,140 80,750 87,317 1,074,869
BART Op. Allocations - Other SGR Assets11 6,000 11,000 6,000 1,000 26,000 25,000 25,000 25,000 25,000 25,000 175,000
BART Op. Allocations - Access11 4,344 4,033 3,959 4,194 4,436 4,604 4,858 5,119 5,388 5,663 46,599
SFO Net Operating Revenue18 8,679 9,974 11,145 11,158 12,719 14,211 15,055 15,964 16,839 9,541 125,285
Total Committed Funds 564,523 342,407 362,928 379,692 547,690 587,137 448,740 417,710 409,898 390,348 4,451,072
TOTAL FUNDING 596,844 374,729 395,249 412,013 580,011 619,458 481,061 450,031 442,220 422,669 4,774,286
5-30

Capital Improvement Program
Figure 5-7 Capital Funding Sources: Potential Discretionary Funding ($thousands)
FY15 FY16 FY17 FY18 FY19 FY20 FY21 FY22 FY23 FY24
Discretionary Funding
Federal
STP & CMAQ14 $0 $0 $0 $0 $0 $0 $0 $0 $22,000 $35,000
New Starts (including Core Capacity)/Small Starts15
0 0 0 0 0 0 14,400 14,400 14,400 14,400
State
New Bridge Tolls13 0 0 0 0 25,230 25,230 25,230 25,230 25,230 25,230
Cap & Trade Funds (SB375)15 0 0 0 0 0 0 22,600 22,600 22,600 22,600
Local
Sales Tax Reauthorizations16 0 28,400 28,400 28,400 28,400 28,400 28,400 28,400 28,400 28,400
Regional Gas Tax13 0 0 0 0 24,330 24,330 24,330 24,330 24,330 24,330
Other Anticipated but Undetermined Revenues13
0 0 0 0 89,443 89,443 89,443 89,443 89,443 89,443
5-31

Capital Improvement Program
NOTES for Figures 5-5 and 5-6: 1 FTA Section 5337 and Section 5307 amounts for FY 2012/2013 and FY 2013/2014 reflect BART submittal for TCP call for projects, October 2012. Total FTA Section 5337 and Section 5307 estimate for FY13 through FY40 is $3,365,400,000 per TFWG Memorandum, June 18, 2012. FTA revenues projected to increase 3% annually per TFWG Memorandum, January 4, 2012. Includes 10% ADA Operating and Flexible Set-asides. FTA Section 5309 Fixed Guideway has been replaced by Section 5337 State of Good Repair in the federal transportation authorization forFY13 and FY14, per MAP-21. Score 16 projects: Revenue vehicle rehab/repl, train control, traction power, fixed guideway repl/rehab. Other eligible projects: security, fare collection equipment, ADA, other SOGR. 2 Total STP 2nd Cycle TCS estimate for FY13 through FY40 $58,200,000 per TFWG Memorandum, June 18, 2012. FTA revenues projected to increase 3% annually per TFWG Memorandum, January 4, 2012. Also assumes funds will be programmed to TCP-eligible operators in proportion to projected Score 16 needs. Eligible projects: regional planning, regional operations, regional bicycle program, transportation for livable communities, transit capital rehabilitation. Assumes additional $906M spread equally over 15 years (2016-2030) for Core Capacity Challenge Grants - $743M for additional 365 rail cars and $163M for train control. 3 TSP - TPI FY 2012/2013 estimate per Programming and Allocations Committee Memorandum, October 10, 2012. FTA revenues projected to increase 3% annually per TFWG Memorandum, January 4, 2012. Eligible projects increase ridership or productivity. 4 OBAG grant for Berkeley BART Plaza & Transit Area Improvement project = $1,805,000 CMAQ (CA-95-X145 FY2014), Proposition 1B Lifeline $721,360 (FY14), Coordinated OBAG (STIP - Federalized = STP/CMAQ) $3,726,000 (FY17), Coordinated OBAG (CMAQ) $340,000 (FY15), Alameda County Vehicle Registration Fees $3,718,000 (FY15), City of Berkeley $557,000 (FY14) and BART $551,250 (FY14). OBAG grant for Richmond BART Station Intermodal = $4,331,000 CMAQ (FY15) and BART $561,127. 5 Total AB664 Bridge Tolls estimate for FY13 through FY40 $174,800,000 per TFWG Memorandum, June 18, 2012. FTA revenues projected to increase 3% annually per TFWG Memorandum, January 4, 2012. Also assumes funds will be programmed to eligible operators in proportion to FTA Section 5307/5309 FG programming for capital projects, consistent with current programming policy. Generally used as local match to TCP (i.e. SOGR/renovation projects). Assumes an additional $82M AB664 Bridge Tolls and $83M BATA Project Savings in 2014 for Core Capacity Challenge Grants for additional 470 rail cars spread over 10 years beginning in 2018. 6 Proposition 1B Revenue-Based amount for fiscal year 2012/2013 reflects actual programmed amount. The total estimate for FY13 through FY18 per TFWG Memorandum, October 3, 2012, and is spread roughly evenly over those years. Already programmed for a number of projects, including Station Mod, Warm Springs, eBART, BART-to-Oakland International Airport Project, and Earthquake Safety. 7 $5.4M annual Prop 1 B Security Grant for 10 years per Michael Tanner March 28, 2014. 8 Assumes $78.6M in FY 2015 per Todd Morgan (expected to request allocation from CTC June 2014). 9 Assumes remaining $215M of GO Bond funds spread equally over five years. 10 Assumes $29.1M remaining Contra Costa County Measure J allocation to BART spread over 10 years (2013-2022 per Michael Tanner). Source MTC TFWG Attachment A March 5, 2013. 11 Per BART Financial Planning. BART Operating Allocations to Capital. Other SGR includes Millbrae Tailtrack, OCC, Other SGR. For TCM, includes $50.85M of prior AATC funds in FY2012-2014. 12 On March 22, 2013, the BART Board of Directors affirmed its intention to dedicate all funds from the CPI based fare increase to three projects: new rail cars, train control and the Hayward Maintenance Complex 13 Plan Bay Area Investment Strategy (discretionary revenues) per TFWG Memorandum June 18, 2012. Assume revenues available starting after 2018 and straightlined for 22 years. Memorandum does not assign specific revenue types by operator, so amount by revenue type assumed in proportion to overall Plan Bay Area assumptions provided by Glen Tepke in an email dated November 14, 2012. 14 Assumes $35M/year starting in 2024 (after completion of train control modernization funding), with partial funding of $22M in 2023.
5-32

Capital Improvement Program
15 MTC Resolution No. 4123, dated December 18, 2013, outlines a Core Capacity Challenge Grants - Funding Plan which identifies grant funding for BART, as follows: BART Rail Cars (470 cars beyond current funding commitment) - FTA/STP $743M, AB664 Bridge Tolls $82M, BATA Project Savings $83M, SFO Net Op Revenue $145M, Cap & Trade $100M; BART Train Control - FTA/STP $163M, Cap & Trade $126, Core Capacity New Starts $144M. 16 Assumes expected $710M Alameda County Sales Tax Reauthorization planned for 2014, with revenues beginning in 2015 and spread over 25 years per Michael Tanner). Source 2014 Alameda County Transportation Expenditure Plan. 17 HMC: Per Hayward Maintenance Complex Cost Sharing Agreement executed September 9, 2013. Rail Cars: Contribution for 60 cars. 18 Assumes $145M spread over 13 years (FY12-FY24) for Core Capacity Challenge Grants for additional 365 rail cars. 19 Total equals Federal contribution for 410 cars per cashflow summary 2/21/13 ($347M + 524M) plus Federal contribution for additional 470 cars per MTC Resolution No. 4123 ($743M), spread out $94M/year through 2027 and the balance in 2028.
5-33

Capital Improvement Program
Committed Funds Under federal law, MTC, along with other Metropolitan Planning Organizations (MPOs), is required to submit to the FTA a Regional Transportation Plan (RTP) every four years. Projects must be included in an RTP in order to receive funding. MTC's current RTP, Plan Bay Area, was adopted in July 2013 for the 2040 planning horizon.
The RTP process provides policy direction to county-level funding agencies regarding many issues and projects of relevance to BART. For example, MTC sets policy for each of the counties to follow regarding the funding of reinvestment and rehabilitation of transit systems, a topic of particular concern to BART given its aging infrastructure. The process of updating county plans begins when the individual counties take the series of budget assumptions and policies provided by MTC and use them to develop their individual Countywide Transportation Plans. The resulting county transportation priorities feed into a region-wide planning process conducted by MTC, which culminates with the development and adoption of the RTP.
The RTP forecasts a 4% annual growth in federal formula funds for the next 25 years and predicts that roughly 75% of BART's 25-year system reinvestment needs will be funded, largely from federal formula funds. However, the actual determination and programming of projects with formula funds is done once every three years. This is due to the volatility of the annual appropriation and apportionment process at the national level and can result in projects that appear to be funded in the RTP not receiving actual programming when the time comes. The reality is that not all of BART's reinvestment needs are fully funded and that BART must continue to compete with other transit operators for limited funding.
Federal Funding
On July 6, 2012, President Obama signed into law new federal transportation legislation, Moving Ahead for Progress in the 21st Century (MAP-21). MAP-21 reauthorizes surface transportation funding in the United States. The legislation took effect on October 1, 2012 and will guide surface transportation funding for 27 months, until January 1, 2015.
MAP-21 includes several strategic changes as compared with the prior transportation legislation known as SAFETEA-LU. One of MAP-21’s central goals is to reverse the proliferation of smaller and more specialized programs and consolidate them into larger programs that give funders more flexibility.
5-34

Capital Improvement Program
FTA Sections 5307 and 5337 (Urbanized Area Formula Funds)
The main sources of funding for BART's capital needs are FTA Section 5307 and 5337 formula funds. BART is eligible to receive federal formula funds in three urbanized areas: San Francisco-Oakland, Concord, and Antioch. In total, BART forecasts the receipt of approximately $150 million per year from these federal funding sources, representing approximately half of BART's annual renovation funding. BART’s total estimated FTA Section 5337 and Section 5307 allocations for FY15 through FY40 is $3.365 billion.
FTA Section 5307
MTC, designated by FTA as the region's Metropolitan Planning Organization (MPO), distributes the Section 5307 funds to the five large and seven small urbanized areas in the Bay Area. In general, large urbanized area formula funds can be used for capital purposes only. The major changes under the FTA Section 5307 Formula Funds are:
Consolidation of Job Access and Reverse Commute (JARC) with 5307. Activities eligible under the former JARC program are now eligible under the Urbanized Area Formula program. This includes operating assistance for “job access and reverse commute” activities. In addition, the urbanized area formula for distributing funds now includes the number of low-income individuals as a factor. There is no floor or ceiling on the amount of funds that can be spent on job access and reverse commute activities.
New Operating Assistance Authority. Now MAP-21 expands eligibility for using Urbanized Area Formula funds for operating expenses. FTA Section 5307 provides funding for transit capital and transportation-related planning.
FTA Section 5337 (State of Good Repair)
Section 5337 is FTA’s first stand-alone initiative written into law that is dedicated to repairing and upgrading the nation’s rail transit systems to maintain a state of good repair. These funds reflect a commitment to ensuring that public transit operates safely, efficiently, and reliably. This program replaced the Fixed Guideway Rail Modernization Formula program. Eligible capital activities include projects on fixed guideway transit services (e.g. rail, ferry, BRT, and cable-car systems) to replace and rehabilitate rolling stock, track, line equipment and structures; signals and communications; power equipment and substations; passenger stations and terminals; security and other support equipment. Section 5337 funds are also distributed to MPOs on an urbanized area basis. Unlike Section 5307 funds, the 5337 funds are generated in large urbanized areas only.
5-35
Capital Improvement Program
In the Bay Area, federal Section 5307 and Section 5337 funds are consolidated and distributed to transit operators through MTC’s Transit Capital Priorities process, which assigns funding to highest needs based on scoring criteria. BART programs eligible for this funding include train control, traction power, general main line, fare collection and revenue vehicle replacement.
Surface Transportation Program (STP)
BART also receives federal funds from the Surface Transportation Program fund. STP funds are considered "flexible" meaning they can be spent on mass transit, roads, highways, pedestrian, bicycle, and intermodal facilities. They are programmed by MTC on a two or three year cycle, administered by the Federal Highway Administration (FHWA), and flow to BART through FTA formula grants. Eligible projects include regional planning, regional operations, the regional bicycle program, transportation for livable communities, and transit capital rehabilitation. BART has projected the amount it expects to receive by escalating the amount received in FY13, $1.35 million, at a 3% annual increase. In addition, beginning in FY19, BART is expected to receive a supplemental amount of $906 million spread equally over 15 years for new rail cars and train control upgrades.
Congestion Mitigation and Air Quality (CMAQ) Funds
BART is eligible to receive federal funds from Congestion Mitigation and Air Quality funds. The CMAQ program, which is jointly administered by FHWA and FTA, provides funding to state departments of transportation, MPOs, and transit agencies to invest in projects that reduce air pollution in areas that do not meet the National Ambient Air Quality Standards, which are referred to as “nonattainment areas.”
CMAQ funds can be used for a wide variety of transit uses, including programs to improve public transit, High Occupancy Vehicle (HOV) facilities, Employee Trip Reduction (ETR) programs, traffic flow improvements that reduce emissions, bicycle/pedestrian facilities, park-and-ride facilities, and programs to restrict vehicle use in areas of emission concentration. While these funds are largely used to fund clean air capital projects, a portion of funds can be used for operations to support a demonstration or pilot project for a period of three years. As of FY13, all CMAQ projects require a 20% local match with the exception of carpool and vanpool projects, which remain fully funded through federal monies. CMAQ funds are programmed by MTC and, like STP funds, flow to BART through FTA formula grants. Historically, these funds have been used to fund BART's car renovation projects.
5-36

Capital Improvement Program
Transit Sustainability Project (TSP) and Transit Performance Initiative (TPI)
A program established under the Transit Sustainability Project is the Transit Performance Initiative, which is a pilot program to fund low-cost capital investments that can be implemented quickly and efficiently and are designed to increase ridership and productivity. BART has a commitment from the MTC Transit Finance Working Group to receive $3.5 million per year with a 3% annual increase each year.
State Funding
Proposition 1B
The Highway Safety, Traffic Reduction, Air Quality, and Port Security Bond Act, approved by voters in 2006, allows the state to sell up to $1.475 billion in bonds for security and disaster preparedness projects throughout the state. Of the $3.6 billion allocated in Proposition 1B to transit statewide, half is to be allocated based on transit agency revenue from fares and taxes. In FY13 and FY14, $52.3 million in Proposition 1B revenue-based funds were committed to BART for a number projects, including Station Modernization, WSX, eBART, BART-to-Oakland International Airport Project, and Earthquake Safety.
In June 2007, MTC adopted Resolution No. 3814, which dedicated a portion of the bond proceeds to be used for lifeline projects to address the needs of low-income and minority communities. As part of a One Bay Area Grant for the Berkeley BART Plaza and Transit Area Improvement Project, BART was awarded $721,000 in Proposition 1B lifeline funds.
Proposition 1B includes $1 billion for capital projects that provide increased protection against security and safety threats. BART is expected to receive $5.4 million in Proposition 1B Security funds annually over 10 years.
Proposition 1A High Speed Rail Bonds
The Safe, Reliable High-Speed Passenger Train Bond Act for the 21st Century was approved by voters as Proposition 1A on November 4, 2008. It authorized the California Transportation Commission to allocate funds for capital improvements to intercity rail lines, commuter rail lines, and urban rail systems that provide direct connectivity to the high-speed train system and its facilities, or that are part of the construction of the high-speed train system. The Commission will allocate the net proceeds received from the sale of $950 million in bonds authorized under Proposition 1A for the intercity rail program and the commuter and urban rail program. BART anticipates an allocation of $45 million and $78.6 million in FY14 and FY15, respectively.
5-37

Capital Improvement Program
Regional Funding
AB664 Bridge Tolls
Assembly Bill 664 designated MTC to allocate certain bridge tolls for projects that relieve congestion on the southern bridges (Bay Bridge, San Mateo Bridge, and Dumbarton Bridge). These funds are split 70% for East Bay and 30% for West Bay. MTC Resolution No. 2004 gives first priority to match federal and state funds for transit capital projects in score order. AB664 bridge tolls are primarily used to match federal formula grants. BART expects to receive approximately $4 million annually with a 3% annual increase; BART typically uses these funds to match federal grants. In FY14, BART anticipates an additional $165 million from a combination of Bridge Tolls and Bay Area Toll Authority (BATA) project savings. These funds will be used to pay for 365 of the new rail cars.
Local Funding
Contra Costa Measure J Sales Tax Measure
In November 2004, Contra Costa County voters approved a new measure, Measure J, which took effect in 2009. This measure was projected to generate $1.6 billion over 25 years. BART received funding from Measure J for two capital projects: eBART, which received $150 million in 2004 dollars, and the BART Parking, Access, and Other Improvements project, which received $41 million. This CIP assumes that BART will receive the remaining Contra Costa County Measure J allocation of $29 million, which will be spread over 10 years.
VTA Contribution to Hayward Maintenance Complex and Rail Cars
Voters in Santa Clara County approved a sales tax measure in 2000 designed to fund transit service and the future extension of BART to Santa Clara, called Silicon Valley Rapid Transit (SVRT). VTA and BART reached agreement in November 2001 regarding the relationship between the two organizations for the duration of the planning, building, and operating of a future BART line to Santa Clara.
In 2013, an agreement between the two agencies was executed for the purchase of property and the design and construction work for the HMC project, which will support the maintenance of the 60 BART revenue vehicles being purchased for the SVBX project and other maintenance aspects of the full 16-mile SVRT program. The agreement addresses the purchase of property and the design and construction of improvements to BART's existing yard and shop facilities located in Hayward. In FY14 and FY15, $87.7 million is anticipated.
5-38

Capital Improvement Program
This agreement also commits VTA to partially fund the purchase of the new rail cars that are being acquired to serve the SVBX project. Annual funding, in varying amounts agreed to by the two agencies, is expected for FY15 through FY25.
Alameda County Vehicle Registration Fee (VRF)
The Alameda County Transportation Commission has committed $3.718 million from Alameda County Vehicle Registration Fees to BART for FY15.
BART Funding
BART Seismic General Obligation Bonds
General Obligation (GO) bonds are supported by a district-wide, voter-approved ad valorem property tax. Prior to the $980 million Earthquake Safety Program bond, GO bonds were used to finance the construction of the original BART system. Approval from at least two-thirds of the voters within the BART district is required to approve the sale and issuance of the GO bonds and assume the burden of the additional property tax necessary to pay off the bonds over several years. BART issued GO bonds in 2005 and 2006 for earthquake safety improvements and construction of the West Dublin/Pleasanton station and related improvements. This CIP assumes the remaining $215 million in GO bonds will be spread equally over the next five years.
BART Operating Allocations
Throughout its history, BART has reinvested annual operating revenues into the capital program. These annual allocations are used for many critical capital projects that do not qualify for grant funding or for which other funding sources may not be available. These are fully described in Chapter 4, but in general will fund the “Big 3” (Fleet of the Future, the Train Control Modernization Project, and the Hayward Maintenance Complex) as well as some other state-of-good-repair and access projects.
SFO Net Operating Revenue
This allocation is from the positive net operating result of the SFO Extension. Over the 10 years of the SRTP, $125 million is projected to be generated for Core Capacity Challenge Grants to acquire an additional 365 rail cars. Including prior year allocations, this source totals $145 million.
Discretionary Funds Discretionary revenues are not yet committed to BART and are more speculative funding sources. However, they may become available within the plan horizon. Although federal and state funding for transportation is
5-39
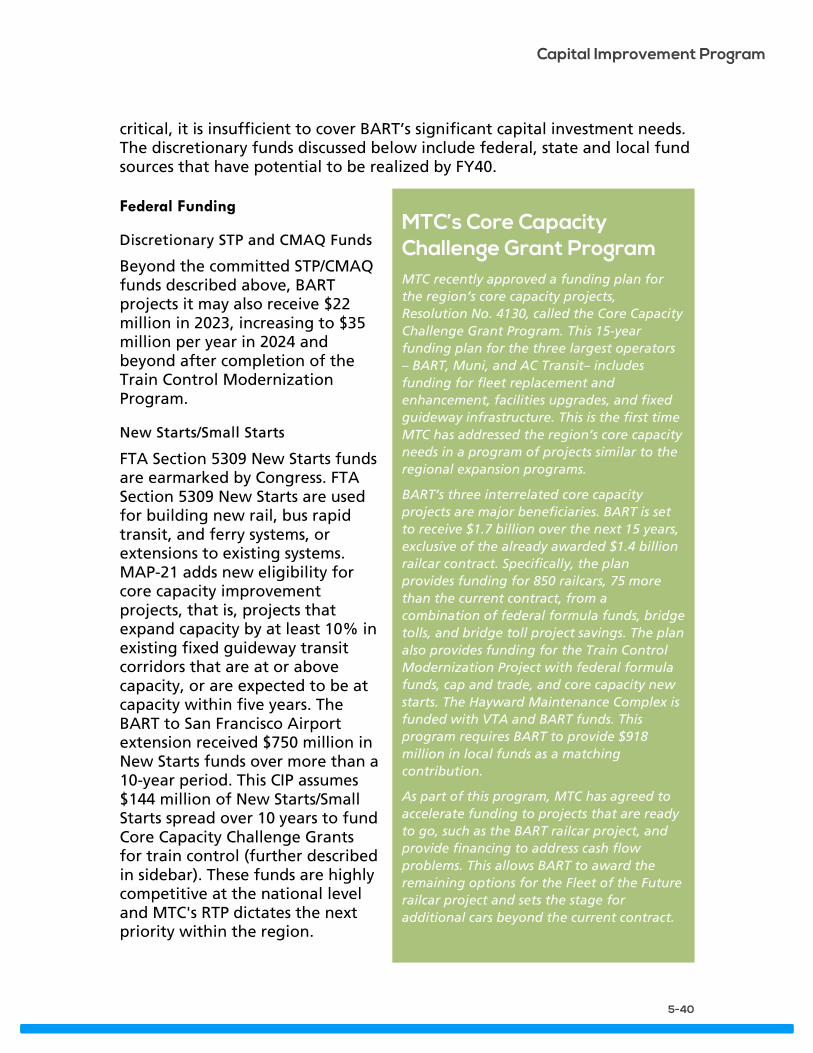
Capital Improvement Program
critical, it is insufficient to cover BART’s significant capital investment needs. The discretionary funds discussed below include federal, state and local fund sources that have potential to be realized by FY40.
Federal Funding
Discretionary STP and CMAQ Funds
Beyond the committed STP/CMAQ funds described above, BART projects it may also receive $22 million in 2023, increasing to $35 million per year in 2024 and beyond after completion of the Train Control Modernization Program.
New Starts/Small Starts
FTA Section 5309 New Starts funds are earmarked by Congress. FTA Section 5309 New Starts are used for building new rail, bus rapid transit, and ferry systems, or extensions to existing systems. MAP-21 adds new eligibility for core capacity improvement projects, that is, projects that expand capacity by at least 10% in existing fixed guideway transit corridors that are at or above capacity, or are expected to be at capacity within five years. The BART to San Francisco Airport extension received $750 million in New Starts funds over more than a 10-year period. This CIP assumes $144 million of New Starts/Small Starts spread over 10 years to fund Core Capacity Challenge Grants for train control (further described in sidebar). These funds are highly competitive at the national level and MTC's RTP dictates the next priority within the region.
MTC’s Core Capacity Challenge Grant Program MTC recently approved a funding plan for the region’s core capacity projects, Resolution No. 4130, called the Core Capacity Challenge Grant Program. This 15-year funding plan for the three largest operators – BART, Muni, and AC Transit– includes funding for fleet replacement and enhancement, facilities upgrades, and fixed guideway infrastructure. This is the first time MTC has addressed the region’s core capacity needs in a program of projects similar to the regional expansion programs.
BART’s three interrelated core capacity projects are major beneficiaries. BART is set to receive $1.7 billion over the next 15 years, exclusive of the already awarded $1.4 billion railcar contract. Specifically, the plan provides funding for 850 railcars, 75 more than the current contract, from a combination of federal formula funds, bridge tolls, and bridge toll project savings. The plan also provides funding for the Train Control Modernization Project with federal formula funds, cap and trade, and core capacity new starts. The Hayward Maintenance Complex is funded with VTA and BART funds. This program requires BART to provide $918 million in local funds as a matching contribution.
As part of this program, MTC has agreed to accelerate funding to projects that are ready to go, such as the BART railcar project, and provide financing to address cash flow problems. This allows BART to award the remaining options for the Fleet of the Future railcar project and sets the stage for additional cars beyond the current contract.
5-40

Capital Improvement Program
State Funding
New Bridge Tolls
Regional Measure 1 (RM1) and Regional Measure 2 (RM2) were approved by voters in 1988 and 2004, respectively. Consistent with the investment strategy in Plan Bay Area, this plan assumes that in FY19 there would be a $1 increase in the non-carpool vehicle toll on all state-owned bridges. Regional bridge toll revenues are based on projected travel demand on the region’s seven state-owned toll bridges. Beginning in FY19, $25.2 million per year is estimated as new revenue for BART to help fund its capital improvement projects.
Cap and Trade Funds (SB375)
In 2013, California officially launched its Cap and Trade program for greenhouse gas emissions. California Carbon Allowances (CCAs) are auctioned by the State’s Air Resources Board on a quarterly basis through 2020.
Plan Bay Area assumes Cap and Trade funding for a variety of transportation improvements, including transit operating and capital rehabilitation/ replacement which BART would be eligible for, local streets and roads rehabilitation, goods movement, and transit-oriented affordable housing. In December 2013, MTC adopted Resolution No. 4130, which establishes the cap and trade funding framework and process development. While the process is just getting underway, MTC’s Core Capacity Challenge Grants Funding Plan identifies $75 million for Rail Cars for Phase 2 of the Silicon Valley Extension and $126 million for Train Control Modernization over a 10 year period (further described in sidebar).
Local Funding
Alameda County Sales Tax Reauthorization
The Alameda County Transportation Commission has placed a measure on the ballot for fall 2014 to extend and augment the county’s half-cent sales tax. The measure includes $710 million for BART System Modernization and Expansion over the 30-year time horizon of the plan, including $400 million for BART to Livermore, $100 million for the Bay Fair Connector/BART Metro projects, $90 million for the BART Station Modernization and Capacity Program, and $120 million for a potential future infill station in the Irvington area of Fremont. Should the measure pass, revenues are assumed beginning in FY16 and spread over 25 years.
5-41
Capital Improvement Program
Regional Gas Tax
Plan Bay Area, adopted in July 2013, includes transportation policies and investments intended to maintain and enhance the region’s extensive transportation network. One of the recommended investment strategies is for a regional gas tax. Since there is no guarantee that such an increase would be approved by voters or how revenues would be allocated to Bay Area operators, this CIP makes several key assumptions for this potential revenue source. Consistent with the Transit Finance Working Group, it is assumed that $24.3 million in revenues would be available each year beginning in FY19 and extend for the duration of the plan.
Other Anticipated but Undetermined Revenues
Plan Bay Area required that every county congestion management agency create a “Priority Development Area (PDA) Investment and Growth Strategy” that describes how the county will support the development of its PDAs. As many BART station areas have been designated as PDAs, BART anticipates $8.4 million annually from a variety of funding sources that will be allocated through these plans, starting in 2018.
5-42

APPENDIX A: Adopted BART Policies
A-1
BART’s Policy for System Expansion
In 1999, the BART Board adopted a set of Project Advancement Criteria to evaluate all potential expansions to the BART system. BART’s System Expansion Policy aims to enhance regional mobility and generate new ridership cost-effectively and in partnership with the communities served. BART’s Project Advancement Criteria are:
Transit Supportive Land Use and Access
Existing Land Use: Residential and/or Employment
Existing Intermodal Connections
Land Use Plans and Policies Cost-Effectiveness
Ridership Threshold
Station Context Regional Network Connectivity
Cost per New Rider: Base Case
Cost per New Rider: with TOD
Cost per Transportation System User Benefit System and Financial Capacity
Regional Transportation Gap Closure Partnerships
Core System Improvements
Capital Finance Plan
Operating Finance Plan Ridership
Community and Stakeholder Support

March 13, 2014 Asset Management Policy The San Francisco Bay Area Rapid Transit District has an important responsibility to its riders and the citizens of the San Francisco Bay Area to maintain the District’s approximately $21 billion of assets in a State of Good Repair, as defined by the Federal Transit Administration (FTA) and as required by Federal legislation, Moving Ahead for Progress in the 21st Century Act (MAP-21), 49 USC, Section 5326. Continued system vitality requires careful financial stewardship and consistent reinvestment to responsibly replenish system assets. In addition, federal legislation mandates Asset Management as a means to reach a State of Good Repair and requires agencies to use this approach in order to be eligible for Federal funding. In order to ensure that BART is positioned to achieve and maintain a State of Good Repair necessary to provide the safe, reliable, on-time service our customers expect, the following policy goals and objectives are adopted:
Goals: A. Ensure that BART’s services are provided and infrastructure maintained in a sustainable manner.
Consider the risks and consequences of action, and inaction, when prioritizing asset replacement or repair, and when identifying and allocating funding sources.
Incorporate complete asset lifecycle costs into long-term financial planning to achieve cost-effective asset management planning.
Inform decision making by planning for, reporting, and considering future lifecycle costs of new services and assets (i.e., extensions, infill stations, garages) as well as when considering upgrades and expansion of the existing physical infrastructure.
B. Safeguard BART assets, including employees and physical assets, by implementing asset management strategies and directing appropriate resources to these strategies.
Develop employee capability, capacity and competency in asset management practices; and promote employee and Board member stewardship and governance of asset management strategies.
Collaboratively identify and consistently apply criteria to prioritize funding of asset management projects throughout BART.
Annually allocate appropriate financial and operational resources to implement asset management strategies and devote resources to prioritized projects.
C. Demonstrate transparent and responsible asset management processes that align with accepted best practices and federal standards.
Achieve and sustain a target level of asset management maturity across the BART organization.
Review and update all asset management plans on an annual basis to ensure assets are managed, valued and depreciated in accordance with Generally Accepted Accounting Principles (GAAP) and federal standards.
Ensure alignment and integration among BART’s Asset Management Strategy, annual operating and capital budgets, Strategic Plan, and Short Range Transit Plan/Capital

Improvement Program in order to accurately assess the District’s overall financial health and inform decision makers.
D. Meet federal legislative requirements for asset management.
Develop Asset Management Plans that include, at a minimum: o Capital asset inventories and condition assessments o Risk-based decision-making and a decision support tool o Investment prioritization consistent with the System Safety Program Plan
provisions. Establish performance targets in relation to State of Good Repair measures, as required
by the FTA. Legislation: 49 U.S.C. Section 5326 / MAP-21 Section 20019 Related Documents: Asset Management Strategy and associated Asset Management Plans. Responsibility: The BART Board is responsible for adopting the Asset Management Policy, allocating resources, and providing high level oversight of the delivery of BART’s asset management strategy to ensure that resources are appropriately used to address BART’s plans and priorities. BART’s General Manager has overall responsibility for developing an asset management strategy, plans and procedures, and reporting to the Board on the status and effectiveness of asset management within BART. Review Date: This policy shall be in effect for five years. It will be reviewed and re-approved by the BART Board before March 13, 2019.
SAN FRANCISCO BAY AREA RAPID TRANSIT DISTRICT FARE POLICY
Adopted by the BART Board of Directors November 17, 2005
The purpose of BART’s Fare Policy is to serve as a framework for decision-making that reflects the interconnected areas that fares can influence: customer satisfaction, ridership growth, financial health, seamless interagency travel, and optimal system usage. The Fare Policy is to be integrated with the District’s Strategic Plan and complement the District’s Financial Stability Policy. When making fare-related decisions, the Fare Policy goals should be considered as a whole, as they work together, with no one goal taking precedence to the exclusion of another. Goal A. Ensure and enhance customer satisfaction. Strategies: a. Provide BART customers with the safe, on-time, frequent, clean and reliable service
they value and that is supported by setting fares to reflect the cost of providing such service, including an allocation to capital programs.
b. Offer fare instrument options that are convenient and reward frequent usage. c. Provide a fare structure that customers find easy to understand so they can choose the
option that best meets their needs. d. Consider the value to the customer of preserving fare structure continuity so that fare
structure changes do not increase some customers’ fares while decreasing the fares of other customers, creating clear winners and losers.
Goal B. Increase ridership while meeting the goals of the District’s Financial Stability
Policy. Strategies: a. Attract new riders through innovative pilot programs. b. Encourage existing riders to take more trips by offering programs that reward
frequent usage.
Goal C. Maintain and improve the District’s financial health, in accordance with BART’s Strategic Plan and Financial Stability Policy.
Strategies: a. Achieve an operating ratio (total operating revenue/total operating expense) of at least
62%. b. Consider ways to increase contributions from the components of total operating
revenue in order to provide more options for fares while maintaining or increasing total operating revenue.
c. Test fare structure changes on a small scale where possible, measuring customer response and revenue impact, to minimize risk to the District’s financial health.
Goal D. Promote seamless interagency travel. Strategies: a. Work with other agencies to provide fare instruments and pricing that encourage
linked trips.
Goal E. Optimize system usage and asset management. Strategies: a. Consider limited-duration promotional discounts to encourage off-peak and reverse
commute ridership to fill excess capacity. b. Consider limited-duration promotional discounts to shift riders from a heavily used
station to a nearby station that has greater available capacity.

- 1 -
FINANCIAL STABILITY POLICY ADOPTED BY THE BOARD OF DIRECTORS MARCH 27, 2003
The San Francisco Bay Area Rapid Transit District has an important responsibility to its riders and the citizens of the Bay Area to wisely manage the District’s finances in both the short and long term. In times of economic change and uncertainty, it is especially important for the District to make sure its ability to deliver service rests on a strong and stable financial foundation. To this end, the following are the District’s financial stability goals and strategies for achieving those goals. GOALS A. Maintain an operating and capital financial base that is sufficient to deliver safe,
quality service efficiently and cost-effectively to meet the level of demand. B. Continuously improve productivity. C. Preserve and maximize BART's fare revenue base, through a predictable pattern of
adjustments, while retaining ridership. D. Provide a fare and fee structure that is tied to the cost of providing service, optimizes
use of the BART system, and provides BART customers with convenience, ease of use, and a good value for the money.
E. Establish and maintain prudent reserves sufficient to ensure that the District can
adjust to economic downturns. F. Maintain the highest possible credit rating and reputation for prudent financial
management. STRATEGIES Operating Expenses a) Adjust operating expenses as needed to reflect changes in service demand,
technology, and productivity. b) Endeavor to keep growth in rail operating expenses (as measured by a rolling average
of growth in rail operating cost per passenger mile) at or below the rate of inflation by: • Implementing technology and productivity advancements designed to reduce or
avoid increasing operational costs. • Exploring greater efficiency, effectiveness, and increased ridership. • Working to increase and optimize ridership on the BART system through
partnerships that foster transit oriented development and improve access to the BART system.
c) Regularly review productivity improvement programs and results as part of the
annual budget process.

- 2 -
Capital Investment a) Pursue grant funding for BART capital projects pursuant to priorities as addressed in
the Capital Improvement Program. b) Adopt an annual budget that includes an allocation to capital programs adequate to
meet annual baseline reinvestment needs for programs which are essential to ensure system performance but not likely to receive grant funds. Such funding should also be available for local match to grants and for unforeseen needs and emergencies.
c) Use debt financing prudently to leverage local, regional, state, and federal funding for
major cyclical capital investments such as transit vehicle, escalator and elevator, fare collection equipment, and train control renovation and replacement.
Fares and Other Revenues a) To the extent revenue increases are needed as one part of a program to preserve
BART’s revenue base and financial stability, tie passenger revenue increases to service costs and system needs with particular consideration to: • Aligning fares with CPI-based cost growth. • Small regular fare increases tied to CPI-based cost increases or other major cost
factors and to factors such as significant change in other revenues and productivity.
• Small surcharges tied to capital needs such as rehabilitation or seismic retrofit. • A peak premium, at some point in the future when ridership is growing, tied to the
need to optimize off-peak system use and to fund core system capacity improvements.
b) Increase customer satisfaction, when economically and technologically feasible, by
giving consideration to: • Increasing discounts for high-value tickets to mitigate the impact of fare
increases on regular BART riders. • Developing new interoperator and interagency partnerships to increase transit
access. • Developing innovative partnership programs with major employers, educational
institutions, and other rider generators. • Using time-limited passes to market BART for special events, weekends, and
families, evaluating the impact on ridership of each pass program. c) Increase revenue from other sources such as parking, advertising, concessions, and
joint development while meeting customer needs and providing safe, reliable service. Reserve for Economic Uncertainty a) Maintain a prudent reserve to be used in times of significant revenue decline to
preserve the District’s ongoing ability to deliver safe and reliable service to the customer and to reinvest in capital.
b) Adopt a Short Range Transit Plan that builds the reserve to at least 5% of total annual
operating expenses by funding regular contributions to the reserve.

Adopted by BART Board: July 14, 2005
Transit-Oriented Development Policy Vision The San Francisco Bay Area Rapid Transit District (BART) is the steward of a large-scale public investment, which includes important real property assets essential to BART’s operation. These assets also contribute to the ongoing financial viability of the transit system. Recent system extensions and federal, state and regional policy direction to concentrate growth around transit further enhances the value of these assets. By promoting high quality, more intensive development on and near BART-owned properties, the District can increase ridership, support long-term system capacity and generate new revenues for transit. Also, such development creates attractive investment opportunities for the private sector and facilitates local economic development goals. Goals
A. Increase transit ridership and enhance quality of life at and around BART stations by encouraging and supporting high quality transit-oriented development within walking distance of BART stations.
B. Increase transit-oriented development projects on and off BART property through creative
planning and development partnerships with local communities. C. Enhance the stability of BART’s financial base through the value capture strategies of transit-
oriented development. D. Reduce the access mode share of the automobile by enhancing multi-modal access to and
from BART stations in partnership with communities and access providers. Land Use Strategies
1. Proactively develop and promote station area plans and land use policies that: a) encourage intensive, high quality development oriented towards transit on and around station properties, b) enhance the value of BART land, and c) enhance the performance of the BART system as a whole.
2. Develop performance-based station access strategies on a corridor or line segment basis
rather than on a station basis. Adjust the 1:1 replacement parking objective in development projects by employing the refined access methodology that examines transit access within the context of both development around transit and access strategies on a corridor or line segment basis. Encourage direct connections to stations from surrounding development in order to promote pedestrian and non-motorized access.
3. Evaluate access facilities (including commuter and development parking) as a commodity
and locate them according to best planning, design and real estate practices. This may shift transit-related facilities off BART property.

Adopted by BART Board: July 14, 2005
4. Ensure that transit-oriented development opportunities are explicitly accounted for in acquisition of new properties, location of new station sites and design and construction of station facilities.
Process Strategies
1. Form sustainable partnerships with local jurisdictions, other transit and regional agencies,
and the private sector to implement development plans on and off District property.
2. As early in the development process as feasible, use a variety of mechanisms, including joint powers authorities, assessment districts, and improvement districts, to achieve coordinated development of station area properties.
3. In concert with local jurisdictions, employ community involvement techniques that reflect
where communities are in the planning and development continuum. 4. Solicit proposals for transit-oriented development of District-owned property through a
competitive selection process, except in cases where sole source negotiations would result in more favorable conditions for the District. Where appropriate, employ requests for qualifications rather than proposals.
Financial Strategies
1. Evaluate the financial performance of proposed projects based on sound financial parameters and the ability to generate transit ridership, fare revenue, lease payments, parking revenues, grant resources, other financial participation, and/or cost savings. Consider the opportunity cost to the District of delaying development opportunities.
2. When appropriate, use transit-oriented development revenues to foster additional transit-
oriented development projects on BART property in particular and to assist in financing TOD in general.
3 (a) Generally favor long-term ground leases, rather than the sale of property, as the standard
disposition strategy for joint development projects, except in cases where alternative approaches are required to achieve specific development objectives or where other strategies would generate greater financial returns to the District.
3 (b) Where land sales are pursued as part of a development project, ensure fulfillment of BART
development objectives from the project as a whole, including generating revenue over the long-term, continuing control of land for TOD purposes, leveraging BART’s land as an equity investment, and protecting the District’s long-term ridership goals.