tailwinds 2016 airline industry trends - pwc tailwinds: 2016 airline industry trends welcome to our...
TRANSCRIPT
Tailwinds 2016 airline industry trends
Spotlight: Surging airline profits:Now what?
www.pwc.com/us/airlines
B Tailwinds: 2016 airline industry trends
Welcome to our 2016 edition of Tailwinds
This publication provides an overview of the current state of the global airline industry and highlights emerging trends. Part one analyzes airline industry metrics such as revenue, pricing, and profitability and examines the effects of lower fuel costs on airline performance. This section concludes with a discussion of industry trends for the remainder of 2016. Part two delves deeper into current airline profitability. In addition to looking at how airlines are using profits to improve their business today, our research suggests other avenues of investment for building a sustainable future.
1 Tailwinds: 2016 airline industry trends
Part one: Current global industry trends 2
Part two: Surging airline profits: Now what? 8
Contacts 13
Table of contents
2 Tailwinds: 2016 airline industry trends
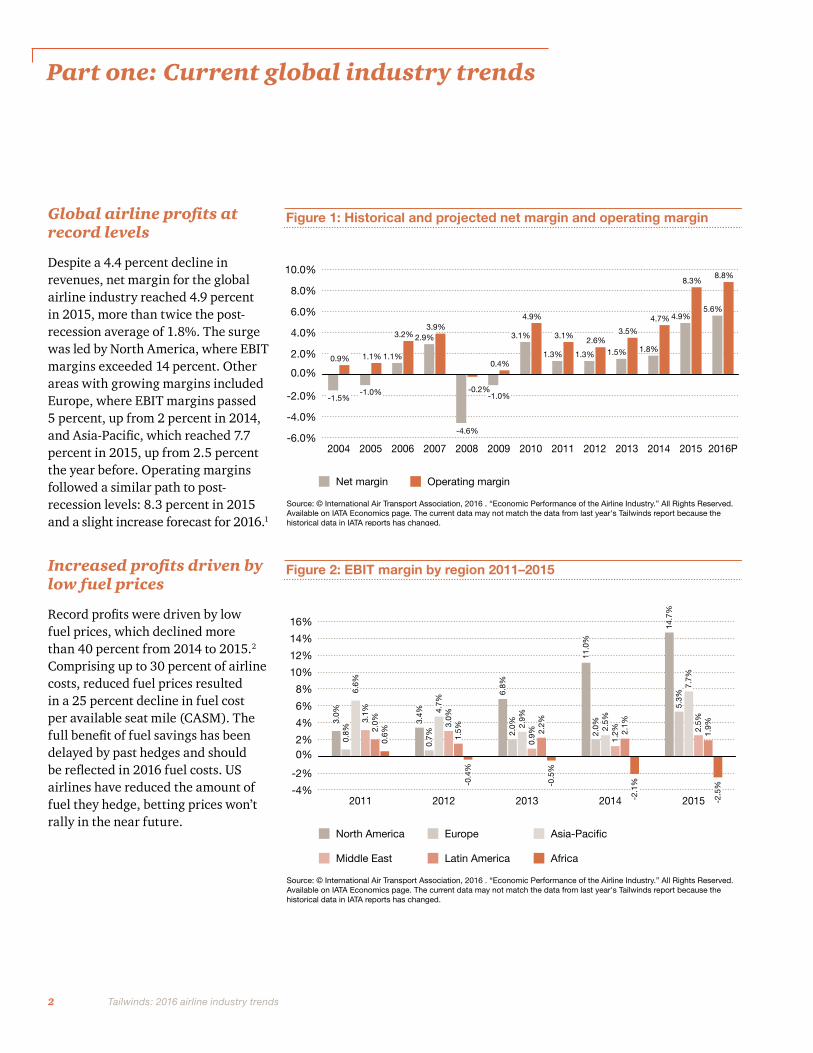
Global airline profits at record levels
Despite a 4.4 percent decline in revenues, net margin for the global airline industry reached 4.9 percent in 2015, more than twice the post-recession average of 1.8%. The surge was led by North America, where EBIT margins exceeded 14 percent. Other areas with growing margins included Europe, where EBIT margins passed 5 percent, up from 2 percent in 2014, and Asia-Pacific, which reached 7.7 percent in 2015, up from 2.5 percent the year before. Operating margins followed a similar path to post-recession levels: 8.3 percent in 2015 and a slight increase forecast for 2016.1
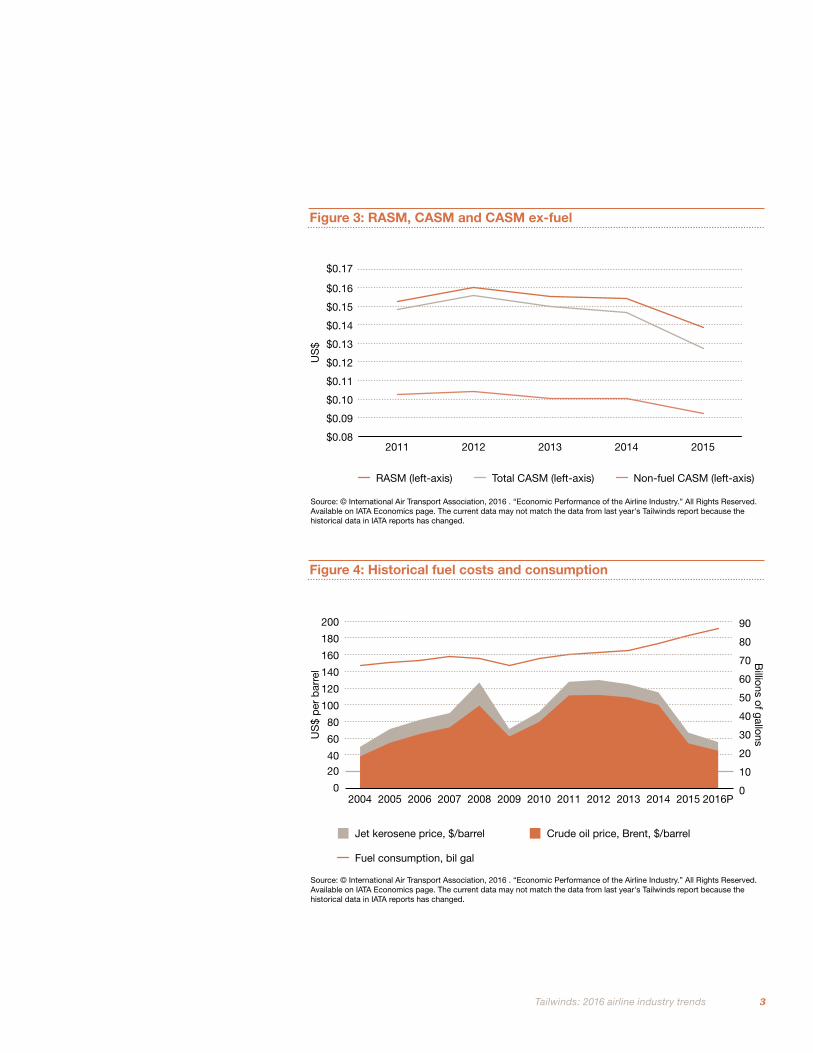
Increased profits driven by low fuel prices
Record profits were driven by low fuel prices, which declined more than 40 percent from 2014 to 2015.2 Comprising up to 30 percent of airline costs, reduced fuel prices resulted in a 25 percent decline in fuel cost per available seat mile (CASM). The full benefit of fuel savings has been delayed by past hedges and should be reflected in 2016 fuel costs. US airlines have reduced the amount of fuel they hedge, betting prices won’t rally in the near future.
Part one: Current global industry trends
-6.0%
-4.0%
-2.0%
0.0%
2.0%
4.0%
6.0%
8.0%
10.0%
2016P201520142013201220112010200920082007200620052004
Figure 1: Historical and projected net margin and operating margin
Net margin
Source: © International Air Transport Association, 2016 . “Economic Performance of the Airline Industry.” All Rights Reserved.Available on IATA Economics page. The current data may not match the data from last year's Tailwinds report because thehistorical data in IATA reports has changed.
Operating margin
0.9% 1.1% 1.1%
-1.0%
3.2% 2.9%3.9%
0.4%
3.1%
4.9%
1.3%
3.1%
1.3%
2.6%
1.5%
3.5%
1.8%
4.7% 4.9%
8.3%
5.6%
8.8%
-4.6%
-0.2%-1.0%-1.5%
-4%
-2%
0%2%
4%
6%
8%
10%
12%
14%
16%
20152014201320122011
Figure 2: EBIT margin by region 2011–2015
Source: © International Air Transport Association, 2016 . “Economic Performance of the Airline Industry.” All Rights Reserved.Available on IATA Economics page. The current data may not match the data from last year's Tailwinds report because thehistorical data in IATA reports has changed.
North America Europe
Latin America
Asia-Pacific
Middle East Africa
3.0%
0.8%
6.6%
3.1%
2.0%
0.6%
3.4%
0.7%
4.7%
3.0%
1.5%
-0.4
%
6.8%
2.0% 2.
9%0.
9% 2.2%
-0.5
%
11.0
%2.
0% 2.5%
1.2% 2.
1%-2
.1%
14.7
%5.
3%7.
7%2.
5%1.
9%-2
.5%
3 Tailwinds: 2016 airline industry trends
Figure 3: RASM, CASM and CASM ex-fuel
Source: © International Air Transport Association, 2016 . “Economic Performance of the Airline Industry.” All Rights Reserved.Available on IATA Economics page. The current data may not match the data from last year's Tailwinds report because thehistorical data in IATA reports has changed.
RASM (left-axis)
US
$
Total CASM (left-axis) Non-fuel CASM (left-axis)
$0.08
$0.09
$0.10
$0.11
$0.12
$0.13
$0.14
$0.15
$0.16
$0.17
20152014201320122011
Figure 4: Historical fuel costs and consumption
Source: © International Air Transport Association, 2016 . “Economic Performance of the Airline Industry.” All Rights Reserved.Available on IATA Economics page. The current data may not match the data from last year's Tailwinds report because thehistorical data in IATA reports has changed.
Jet kerosene price, $/barrel
US
$ p
er b
arre
l
Billions of gallons
Crude oil price, Brent, $/barrel
Fuel consumption, bil gal
0
10
20
30
40
50
60
70
80
90
2016P2015201420132012201120102009200820072006200520040
2040
60
80
100
120
140
160
180
200
4 Tailwinds: 2016 airline industry trends
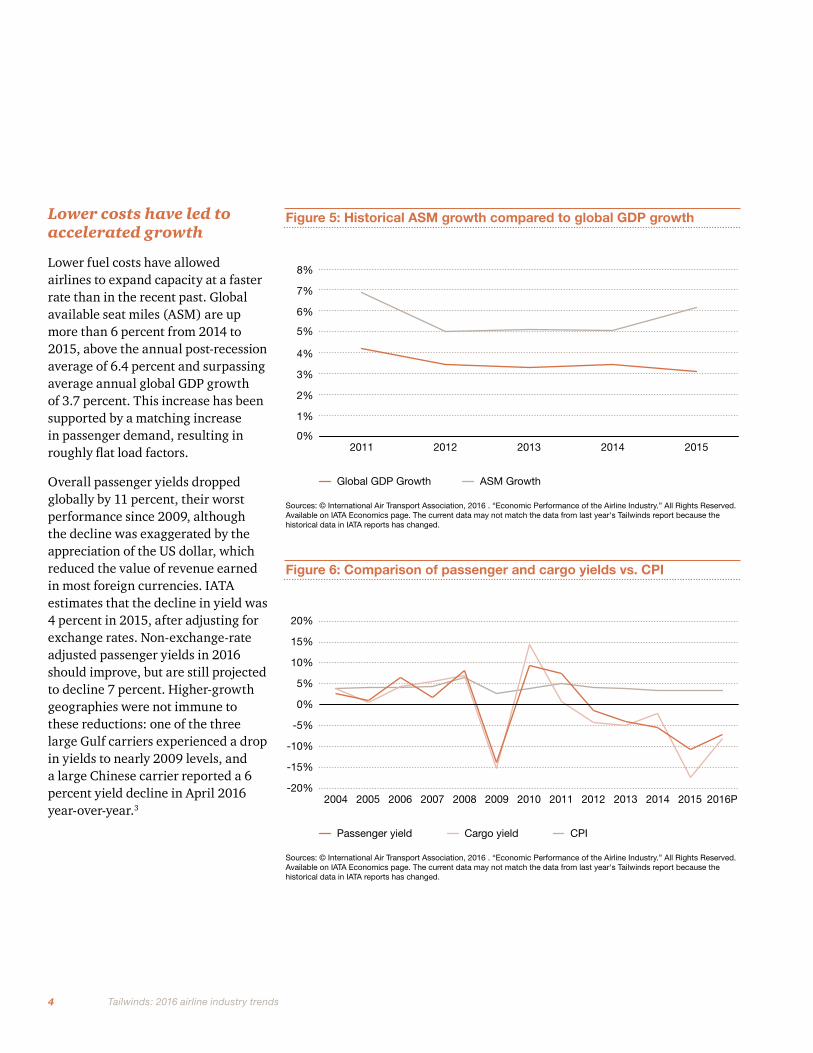
Lower costs have led to accelerated growth
Lower fuel costs have allowed airlines to expand capacity at a faster rate than in the recent past. Global available seat miles (ASM) are up more than 6 percent from 2014 to 2015, above the annual post-recession average of 6.4 percent and surpassing average annual global GDP growth of 3.7 percent. This increase has been supported by a matching increase in passenger demand, resulting in roughly flat load factors.
Overall passenger yields dropped globally by 11 percent, their worst performance since 2009, although the decline was exaggerated by the appreciation of the US dollar, which reduced the value of revenue earned in most foreign currencies. IATA estimates that the decline in yield was 4 percent in 2015, after adjusting for exchange rates. Non-exchange-rate adjusted passenger yields in 2016 should improve, but are still projected to decline 7 percent. Higher-growth geographies were not immune to these reductions: one of the three large Gulf carriers experienced a drop in yields to nearly 2009 levels, and a large Chinese carrier reported a 6 percent yield decline in April 2016 year-over-year.3
Figure 5: Historical ASM growth compared to global GDP growth
Sources: © International Air Transport Association, 2016 . “Economic Performance of the Airline Industry.” All Rights Reserved.Available on IATA Economics page. The current data may not match the data from last year's Tailwinds report because thehistorical data in IATA reports has changed.
Global GDP Growth ASM Growth
0%
1%
2%
3%
4%
5%
6%
7%
8%
20152014201320122011
Figure 6: Comparison of passenger and cargo yields vs. CPI
Sources: © International Air Transport Association, 2016 . “Economic Performance of the Airline Industry.” All Rights Reserved.Available on IATA Economics page. The current data may not match the data from last year's Tailwinds report because thehistorical data in IATA reports has changed.
Passenger yield Cargo yield CPI
-20%
-15%
-10%
-5%
0%
5%
10%
15%
20%
2016P201520142013201220112010200920082007200620052004

5 Tailwinds: 2016 airline industry trends
In the US, the yield decline was concentrated around ultra-low-cost carriers (ULCCs), which saw a drop of 17 percent from 2014 to 2015, offsetting most of their fuel-driven 20 percent decrease in CASM. The dramatic ULCC yield decline was partially driven by more aggressive competition from mainline carriers, whose yields declined 4 percent.
Another interesting metric is the drop in non-fuel costs. While IATA figures show a 2.4 percent decline, the majority of this improvement is driven by exchange rates. In the US, mainline carriers showed a 7 percent increase in non-fuel CASM, raising concerns about sustaining profitability when fuel prices increase. The yield declines and increased price competition spooked investors, with the top 10 US airlines’ stock prices dropping by an average of 11.7 percent during 2015.
At the same time, cargo revenue in 2015 showed a decline in both absolute terms ($10 million) and as a proportion of total airline revenue (figures show an 8 percent decline). Cargo yields declined as well, falling over 17 percent in 2015. IATA is forecasting a further decline of 5.5 percent in 2016. This is partially driven by the slowdown in global GDP and lower growth rates in Asia-Pacific, especially China, which has a large share of air freight volume.
0
100
200
300
400
500
600
700
800
2016P20152014201320122011200620052004
Figure 7: Global commercial airline revenue ($ billion)
Cargo Passenger
Source: © International Air Transport Association, 2016 . “Economic Performance of the Airline Industry.” All Rights Reserved.Available on IATA Economics page. The current data may not match the data from last year's Tailwinds report because thehistorical data in IATA reports has changed.
Other
294
38
47
379
323
42
48
413
365
47
53
465
512
63
67
642
531
112
64
707
539
120
61
720
539
150
63
752
518
147
53
718
511
148
50
709
$ b
illio
ns
6 Tailwinds: 2016 airline industry trends
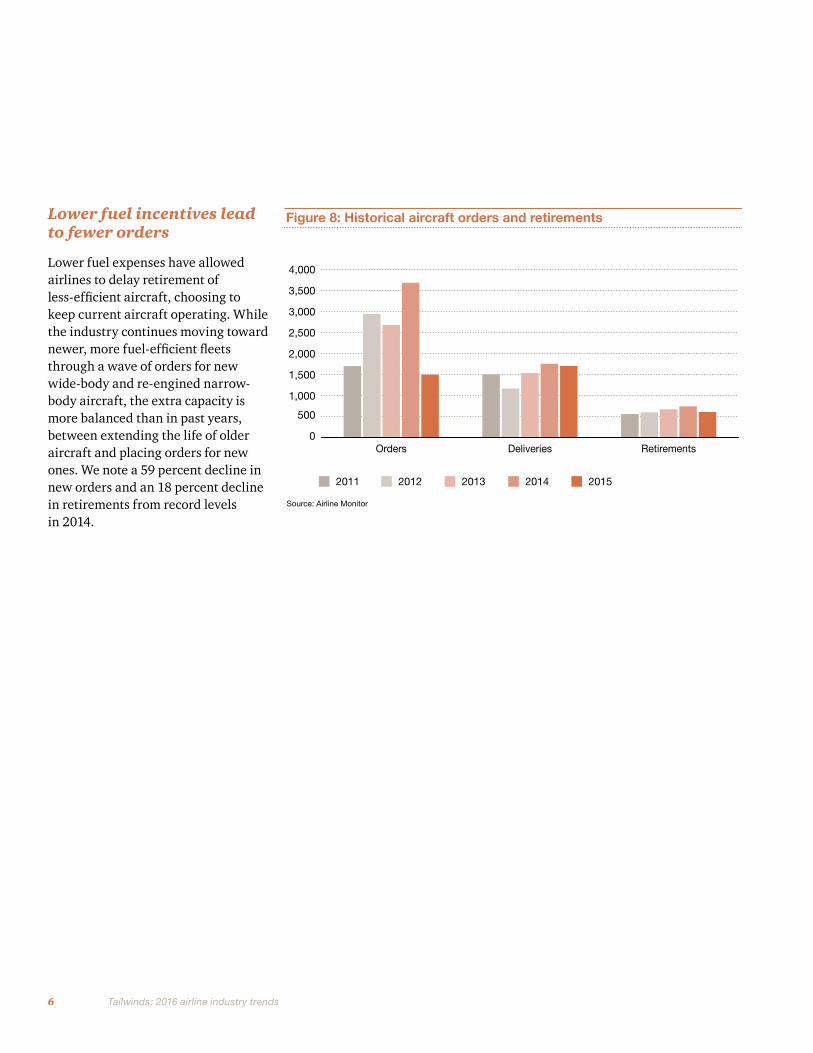
Lower fuel incentives lead to fewer orders
Lower fuel expenses have allowed airlines to delay retirement of less-efficient aircraft, choosing to keep current aircraft operating. While the industry continues moving toward newer, more fuel-efficient fleets through a wave of orders for new wide-body and re-engined narrow-body aircraft, the extra capacity is more balanced than in past years, between extending the life of older aircraft and placing orders for new ones. We note a 59 percent decline in new orders and an 18 percent decline in retirements from record levels in 2014.
Figure 8: Historical aircraft orders and retirements
2011
Source: Airline Monitor
2012 2013 2014 2015
0
500
1,000
1,500
2,000
2,500
3,000
3,500
4,000
RetirementsDeliveriesOrders
7 Tailwinds: 2016 airline industry trends
Outlook for 2016
Our outlook is promising for the remainder of the year, but we do see a few troubling trends. The domestic GDP appears to be growing more slowly and other parts of the world are continuing to struggle, such as China and the European Union (EU). If Britain decides to exit from the EU, it could further dampen Europe’s economy and hurt Britain’s economy as well. Also, oil prices appear to be rising because of lower global supply and could be further affected by an increase in terrorism and political instability. However, if current conditions largely continue, we expect to see the following trends evolve during 2016:
Continued moderation in aircraft orders
After years of record orders, the number of new orders has moderated significantly. In the US, the combination of large, existing replacement orders and lower fuel prices has resulted in less demand for new aircraft. Globally, the uncertain economic climate combined with large existing order books and lower fuel costs mean many buyers are not placing new orders and relying more on older aircraft and existing orders and deliveries. But we also don’t project airlines acting on widespread deferral of existing orders, since airlines expect newer aircraft to help retain and attract new customers.
Airlines are also taking advantage of a favorable financing climate to fund new aircraft needed to meet projected growth in traffic levels.
Fuel hedges
While many carriers are letting previous fuel hedges expire, a number of carriers are reported to be locking in a percentage (even if smaller than previous hedging levels) of their fuel at what they perceive to be a favorable price.4 Proactive carriers are re-examining hedging also because locking in some fuel demand at lower levels reduces their upside cost risk and provides security to better plan and execute important other investments and projects.
Equity partnerships
Equity partnerships between airlines are now quite common, but with carriers enjoying relatively high stock prices and high levels of profitability, we anticipate seeing increased investment levels in existing and new joint venture-type arrangements. While most carriers strike these arrangements to improve access to emerging and constrained markets and better optimize aircraft and assets, passengers also benefit from these arrangements. Closer linkages result in more flight options, a wider range of schedules, and the opportunity to combine fares from multiple carriers into a single itinerary. These arrangements tend to
“round up” the in-flight experience, with airline partners seeking to increase standardization of product by offering a similar minimum service level for the lower fare classes, and bringing the higher fare classes more in line to provide higher-value passengers a more consistent experience on both partners’ aircraft.
Product
Carriers will likely continue to look to improve in ways that are sustainable through the economic cycle. They are unlikely to abandon efforts to increase density in existing cabins since more seats increase revenue and lower costs, but will be more inclined to improve the passenger experience in other ways. More product differentiation with growth of highly profitable premium economy sections will likely be balanced by new low-fare, low-amenity products to aggressively compete with ULCCs. Also, there is a continued push to improve Wi-Fi connectivity as a key part of airlines’ IFEC (in-flight entertainment and communication) strategy that increasingly relies on customers’ own devices, increases bandwidth, and expands content choices. Also, airlines are working with original equipment manufacturers (OEMs) to improve the passenger experience “upstream.” A notable example is the addition of “space bins” on Boeing 737s, increasing overhead cabin storage and addressing a major, cross-carrier customer request.
8 Tailwinds: 2016 airline industry trends
With their current success, airline executives are faced with deciding how to allocate their airlines’ profits, balancing several alternatives: returning cash to shareholders, reinvesting in the airline, and deploying capital to better prepare for the next downturn.
Some US airlines have returned a portion of their profits to their shareholders. One of the largest US carriers returned $3.9 billion to shareholders last year in dividends and stock buybacks.9 After many unprofitable years, it’s understandable that airlines are trying to repay stockholders. But too much of a payout can backfire. If investors believe an airline is only using profits for short-term gains and ignoring investment in longer-term, growth-oriented strategies, they might shift their own investment capital to carriers that potentially offer larger payouts in the future.
Some airlines have shared profits with employees in the form of incentives or bonuses. Two of the three largest global carriers in the US participated in profit-sharing in 2015, and the third recently announced it would follow suit in early 2017.10 US low-cost and value carriers are also sharing the wealth with employees. One such carrier has done so for two years running, 2014 and 2015, and another last year awarded its highest level of incentive pay to date.11
In the years since the 2008–9 downturn, US airlines have gradually seen improving economic and market conditions, and they are now as financially strong as ever. The 10 largest US airlines had average operating margins of 17.4 percent in 2015, and four of these airlines delivered returns of 20 percent or more.5 Cash reserves are at an historic high, and the US industry’s on-time arrival performance metrics in the first four months of 2016 are the second best in the equivalent periods over the last 10 years.6
This turnaround has been led primarily by three main factors. First, the oil glut has depressed fuel prices 49 percent off their highs three years ago which, despite now underwater fuel hedges, saved the industry $47 billion in fuel costs.7 Second, growth in air travel has been steady and measurable, with 2015 seeing 6.2 percent capacity growth from the prior year and a 39 percent expansion in available seat miles (ASM) from the downturn (2009).8 This demand has given airlines the confidence to take a longer-term outlook on some investments and customer/operational improvement projects. Third, airlines have been strategic about capitalizing on passenger growth, practicing capacity discipline in expanding services throughout the network. This discipline has been partially enabled by the four mega-mergers in the industry since 2009.
Part two: Surging airline profits: Now what?
Airlines and their employees are also negotiating new labor contracts under very different conditions from the past decade. As a result, in January, one of the largest US-based global carriers approved a new pay package for pilots, locking in raises for the next three years. And the largest US-based low-cost carrier is likely to grant labor increases for flight attendants, mechanics, and pilots.12 To the extent possible, airlines must seek to maximize the alignment of airline performance with employee compensation by pushing compensation increases to variable bonus payments instead of locking in long-term base salary increases. Contractual adjustments to base salary are essentially locking in an increase in fixed costs, and airline employees and their unions must work together to maintain some level of profitability during any future economic downturn.
Airlines have also passed on a portion of lower fuel prices to travelers in the form of lower airline fares. From 2014 to 2015, the average US domestic airfare dropped 3.8 percent. This has partially been driven by the larger carriers benefiting from lower fuel costs, lowering fares to compete against discount airlines on certain routes.13 Also, flights have been added in markets and at times that were not profitable when fuel prices were higher. However, these price cuts
9 Tailwinds: 2016 airline industry trends 9
and capacity increases have been strategic rather than a reflection of input costs, as airlines remain focused on profitability rather than growing market share.
Many airlines are spending to upgrade or expand their fleets. While the impetus for buying new, fuel-efficient aircraft began during a high fuel cost environment, some airlines are moving ahead with purchase orders and even expanding them. As an example, last month, one major US airline announced it would buy 25 new Boeing 737-700s in addition to the previously announced order of 40 of the same aircraft.14 In general, investments in more efficient and larger aircraft like this one make sense, given the age of the legacy fleets they will replace. However, with many airlines committed to buying the same aircraft types, the acquisition of these aircraft is not
likely to provide differentiation on its own; airlines will likely still have to make customer-centric in-cabin and operational investments to differentiate themselves.
Airline executives may be tempted to continue turning over profits to their stakeholders. While satisfying their needs is important, and in some cases overdue, it’s critical that airlines prepare for profitable growth under changing economic conditions. So what can airlines do now to protect themselves and their stakeholders for the future? Below are several ideas that can help build sustainable and differentiating capabilities:
• Become known for reliability. Many fliers, especially those traveling on business, care greatly (and in some cases, primarily) about arriving at their destination on time. The same is true for travelers who have to meet connecting
flights. So, consistently delivering high reliability can pay off as a competitive advantage. In addition to being attractive for customers, airlines run much more smoothly and efficiently when they’re on time. Flights can connect without unscheduled down time, reduced passenger re-accommodation minimizes transactions at airports and call centers, and maintenance schedules become more predictable. To achieve excellence in reliability requires investment in logistics, data analytics, information systems, and processes. For example, it means giving employees the technology tools they need to do their jobs and reducing the number of exceptions they have to deal with (like lost baggage and missed connections).
10 Tailwinds: 2016 airline industry trends
• Achieve unit-cost efficiency. An airline can more easily afford to use price as a weapon when it has its unit costs under firm control. One way to do this is by developing a set of key capabilities such as the ability to achieve structurally faster aircraft turn times, yielding additional flights with the same aircraft. Carriers can also hone day-of-operation capabilities like rational fuel tankering practices, operations recovery decision support, the ability to adjust flight cost factors on the fly to recover schedule integrity, and real-time predictive maintenance analytics that reduce delays and cancellations.
• Develop a noteworthy customer experience. This capability is a moving target. Not only do customers need change, but it’s hard to keep ahead of the competition. For example, the boarding pass kiosk once was a differentiator; now it is commonplace. Airlines should channel innovation to create greater convenience for passengers and more distinctive services. Perhaps an airline’s mobile app alerts a passenger to traffic conditions and TSA wait times and then recommends what time to leave for the airport. Once at the airport, the passenger’s bags could be automatically checked in using a specialized tag in the passenger’s bag or through the app on the passenger’s smartphone. The passenger also could get a message
about available food options close to the departure gate, order from the menu, and pick up the prepaid and packaged order by the time he or she reaches the gate.
• Formulate a new tax plan. It’s been at least a decade since many US-based airlines have had to concern themselves with corporate income taxes. Instead, they have been more focused on indirect and aviation taxes. Now, we see that focus shifting. Due to their significant profits, many airlines are, or will soon be, paying cash federal and state income taxes (although actual cash outlays should remain lower for some airlines due to usage of carryover attributes). This means that US-based airlines will have an unfavorable effective tax rate in relation to airlines based abroad as well as US-based multinational companies, with an effective tax rate close to the federal and state statutory rate of nearly 40 percent. This is a good time for airlines to rethink key performance indicators related to tax. Profitability has allowed airlines to remove valuation allowances; inevitably, this will put more pressure on timely tax accounting calculations. External factors are creating new challenges across all tax functions including a growing problem of tax-related business identity theft, as well as an evolving set of compliance requirements required by changes in the regulatory
and legislative environment. Tax functions will need to work closely with the business to identify tax efficiencies across the organization by understanding the value chain. For instance, heavy technology investments can mean the applicability of favorable tax provisions such as research and development credits or Section 199 (domestic manufacturing deduction). What is certain is that airlines all over the world will likely have to deal with increased scrutiny from taxing authorities. To meet these new challenges, airlines should allow the tax function to take a more visible and proactive role within the C-suite and board.
• Invest in innovative technologies. Changing the dynamics of the airline industry going forward will depend on investment in innovations and evolving technologies. It’s only through technological advances that airlines can effect step-change efficiency and customer service improvements. As an example, one of the larger US-based value airlines announced early this year that it would create a venture capital arm based in Silicon Valley to invest in developing new technologies in the hospitality and travel industry.15 In March, that same airline announced it had invested in a Silicon Valley-based travel and data science company, based on the company’s work in predictive analytics.16
11 Tailwinds: 2016 airline industry trends
These ideas go beyond short-term uses of cash to help airlines build a sustainable future. A key component of sustainability is ensuring a more flexible cost structure that can prepare an airline to weather the inevitable downturns. Part of this flexibility is driven by a hedging strategy under various fuel price scenarios, labor contracts that increase alignment of incentives for airlines and their workers through the economic cycle, and rational fleet planning that considers fuel prices, capacity, and projected demand. If airlines want to be treated as high-quality industrials, allowing them greater access to capital, they have to adapt to adverse conditions and capitalize on economic and industry growth.
Today, it’s US-based airlines that are leading the industry in profitability, helped by overall growth in the US economy and a strong dollar. While net profits are expected to grow in 2016 in Europe and Asia-Pacific as
well, both areas are hampered by decelerating economic growth, which dampens their results. Latin American airlines (and non-LATAM carriers with significant exposure to the region) are being adversely affected by economic problems most acutely felt in Brazil and Venezuela. Despite this, net profits are expected to increase to $400 million in 2016 (compared with a loss in 2015) and account for approximately 1.1 percent of the global total.17 African airlines are experiencing challenges because of political instability that impacts tourism. They are expected to continue showing a loss in 2016, although a smaller one than in 2015. Middle East airlines are also seeing profitability improvements, but at a reduced rate due to a depressed oil and gas industry, political instability, and foreign exchange exposure. After an aggressive round of expansion, these airlines are also challenged to find new routes with the same incremental profitability of earlier, higher demand markets.18
Airlines in all areas are being helped by a low-cost fuel environment and a growing number of passengers globally. The US is leading the way with a strong economy and currency that are contributing to the success of its airlines. Now it’s up to the airlines to invest in ideas for sustained profitability. Achieving this will depend on capitalizing on the opportunities of today to cost-effectively develop a differentiated and compelling customer experience, increase operational reliability, and use the sharing of profits with all involved stakeholders to better align incentives among them.
These new industry realities require a different playbook than the one airline executives have followed in years past. They demand not only vision, but a laser-like focus on executing that vision. Airlines should reassess how they will compete, what strategic model they will pursue, and how to invest for the long term.
12
Endnotes
1, 2, 7, 17 IATA, © International Air Transport Association, 2015 . “Economic Performance of the Airline Industry,” December 2015. All Rights Reserved. Available at: http://www.iata.org/whatwedo/Documents/economics/Central-forecast-end-year-2015-tables.pdf.
3 CAPA Centre for Aviation, “China Airlines pax numbers down 2% in Apr-2016, pax yield down 6%,” May 2016; http://centreforaviation.com/news/china-airlines-reports-apr-2016-traffic-554615
4 CNBC.com, “Airline hedges fuel rally in later dated oil prices,” Apr. 2016; http://www.cnbc.com/2016/04/06/airline-hedges-fuel-rally-in-later-dated-oil-prices.html
5 10 largest publicly traded airlines based on revenue, source is annual reports and publicly available financial data.
6, 12 US Department of Transportation, Bureau of Transportation Statistics, accessed May 24, 2016; http://skift.com/2016/01/27/the-cost-of-airline-fuel-drops-while-airplane-ticket-prices-stay-steady/
8 Airline Monitor, “Update of Commercial Aircraft and Engine Market Forecast 2016–2040,” February 2016.
9, 11 Jansen, Bart; Bomey, Nathan. USA Today, “Airlines fly lower fuel costs to lofty profits,” Jan. 21, 2016; http://www.usatoday.com/story/money/2016/01/21/airlines-fly-lower-fuel-costs-lofty-profits/79119356/
10 The New York Times, “Joining Other Airlines, American Will Share Profits,” Mar. 23, 2015; http://www.nytimes.com/2016/03/24/business/joining-other-airlines-american-will-share-profits.html
13 Schlangenstein, Mary; Sasso, Michael. Bloomberg. “The Cost of Airline Fuel Drops While Airplane Ticket Prices Stay Steady,” Jan. 27, 2016; http://skift.com/2016/01/27/the-cost-of-airline-fuel-drops-while-airplane-ticket-prices-stay-steady/
14 United Press Release, “United Airlines Announces Fleet Update,” Mar. 8, 2016; http://newsroom.united.com/2016-03-08-United-Airlines-Announces-Fleet-Update
15, 16 Bidness ETC, “JetBlue Airways Corporation Launches Technology Venture,” Feb. 12, 2016; http://www.bidnessetc.com/63385-jetblue-airways-corporation-launches-technology-venture/
18 International Air Transport Association, “Industry Profitability Improves,” 2 June 2016; http://www.iata.org/pressroom/pr/Pages/2016-06-02-02.aspx
13
US contacts
Jonathan Kletzel US Transportation & Logistics Leader +1 (312) 298 6869 [email protected]
Richard Wysong US Transportation & Logistics Director, Advisory +1 (415) 498 5353 [email protected]
Alexander T. Stillman US Transportation & Logistics Director, Advisory +1 (202) 487 8086 [email protected]
Sean B. Johnson US Transportation & Logistics Partner, Tax +1 (214) 979 8027 [email protected]
Thomas D. Pellegrin Director, Aviation Center of Excellence +971 4 304 3645 [email protected]
Kristen D. Spott US Transportation & Logistics Director, Tax +1(214) 999 2588 [email protected]
Andrew Schmahl US Transportation & Logistics Principal, PwC Strategy& +1 (312) 578 4895 [email protected]
Jim Bohlman US Transportation & Logistics Managing Director, PwC Strategy& +1 (214) 675 5619 [email protected]
Bryan Terry US Transportation & Logistics Director, Advisory +1 (678) 419 1540 [email protected]
Research analyst
Sean Gaffney US Transportation & Logistics Manager, Research & Analytics +1 (412) 482 4571 [email protected]
General inquiries
Diana Garsia US Transportation & Logistics Marketing Senior Manager +1 (973) 236 7264 [email protected]
Global contacts
Julian Smith Global Transportation & Logistics Leader +6 22 1528 0966 [email protected]
Dr. Anil Khurana Airline Center of Excellence, Partner, Strategy & Operations; Middle East Consulting Leader +971508836369 (UAE) +1 978 943 2094 (US) [email protected]
Bernd Roese Global Airlines & Airports Leader +49 69 9585 1162 [email protected]
Contacts
To have a deeper conversation about the subjects discussed in this report, please contact the following PwC airline/transportation specialists:

www.pwc.com/us/airlines
© 2016 PricewaterhouseCoopers LLP, a Delaware limited liability partnership. All rights reserved. PwC refers to the US member firm, and may sometimes refer to the PwC network. Each member firm is a separate legal entity. Please see www.pwc.com/structure for further details. This content is for general information purposes only, and should not be used as a substitute for consultation with professional advisors. PwC US helps organizations and individuals create the value they’re looking for. We’re a member of the PwC network of firms with 169,000 people in more than 158 countries. We’re committed to delivering quality in assurance, tax and advisory services. Tell us what matters to you and find out more by visiting us at www.pwc.com/us. 182982–2016
This content is for general information purposes only, and should not be used as a substitute for consultation with professional advisors.