tanzania’s maize export ban and heterogeneous impacts on regional food prices
Upload: international-food-policy-research-institute-development-strategy-and-governance-division
Post on 16-Jul-2015
174 views
TRANSCRIPT

INTERNATIONAL FOOD POLICY RESEARCH INSTITUTE
Tanzania’s Maize Export Ban and Heterogeneous Impacts on Regional Food Prices
Athur Mabiso Postdoctoral Fellow, IFPRI August 6, 2013

Background & Motivation
In recent years, periodic export restrictions, incl. export bans (Martin and Anderson, 2012; Bouët and Laborde Debucquet, 2012)
High food prices and domestic shortfalls in production believed to engender the export restrictions (Hernandez, Robles and Torero, 2010)
Often modeled at global levels with the exception of a few studies (World Bank, 2009; Jayne, Zulu and Nijhoff, 2006; Chapoto and Jayne, 2009; Porteous, 2012)
Export restrictions rarely modeled as endogenous (Headey, 2011; Porteous, 2012)
Research Objective
Test effect of export ban on regional price levels
Test for endogeneity of export ban • If endogenous, model accordingly as an
endogenous variable using treatment effects vector autoregression models

Empirical Model
1. 𝑝𝑖,𝑡 = 𝛼0,𝑗 + ∑ 𝛼𝑘,𝑗𝑝𝑗,𝑡−𝑘𝑚1𝑘=0 + ∑ 𝛼𝑘,𝑤𝑝𝑤,𝑡−𝑘
𝑚2𝑘=0 +
𝜇𝐶(𝐵𝑗,𝑡)𝑖𝑗 + 𝜀𝑡 , 𝑖 ≠ 𝑗, 𝜀𝑡~𝑁(0, 𝜀2)
2. Pr(𝐵𝑗,𝑡 𝑝𝑗,𝑡−𝑘 ,𝑝𝑤,𝑡−𝑘 , 𝑧𝑡 =
Ф 𝛽0,𝑗 + ∑ 𝛽1,𝑘𝑝𝑖,𝑡−𝑘𝑚3𝑘=1 + ∑ 𝛽2,𝑘𝑝𝑤,𝑡−𝑘 + ∑ 𝜏𝑧𝑡
𝑚5𝑡=1
𝑚4𝑘=0 + 𝑒𝑡
zt = instruments (futures prices; temperature levels in surplus producing regions)

Empirical Model
3. 𝐶𝑖𝑗,𝑡 = (1 + 𝜃𝐵𝑖,𝑡)𝑑𝑖𝑗,𝑡
𝑑𝑖𝑗,𝑡 = 𝑑𝑖𝑑𝑑𝑑𝑑𝑑𝑒 × 𝑝𝑝𝑖𝑑𝑒 𝑜𝑜 𝑜𝑓𝑒𝑓𝑡 × 𝑑𝑝𝑑𝑡𝑒𝑓 𝑑𝑖𝑡𝑒𝑡
Travel time helps capture differences in transaction costs due to road infrastructure quality differences and customs/border delays Also accounts for potential asymmetric travel
cost structure e.g. due to altitude – driving uphill may be more expensive

Data
Tanzanian export ban data and monthly prices of maize and rice (2004-2011) from Min. of Industry and Trade.
Regional prices from FEWS NET (Kenya, Uganda, Malawi, Tanzania, DRC)
Distance and travel time (Local traders; transport companies)
Exchange rates from Min. of Finance World Prices from World Bank Pink Sheets Futures prices from CME Group

Estimation
Treatment-effects Vector Error Correction Model
First estimate equation 2, followed by equation 1
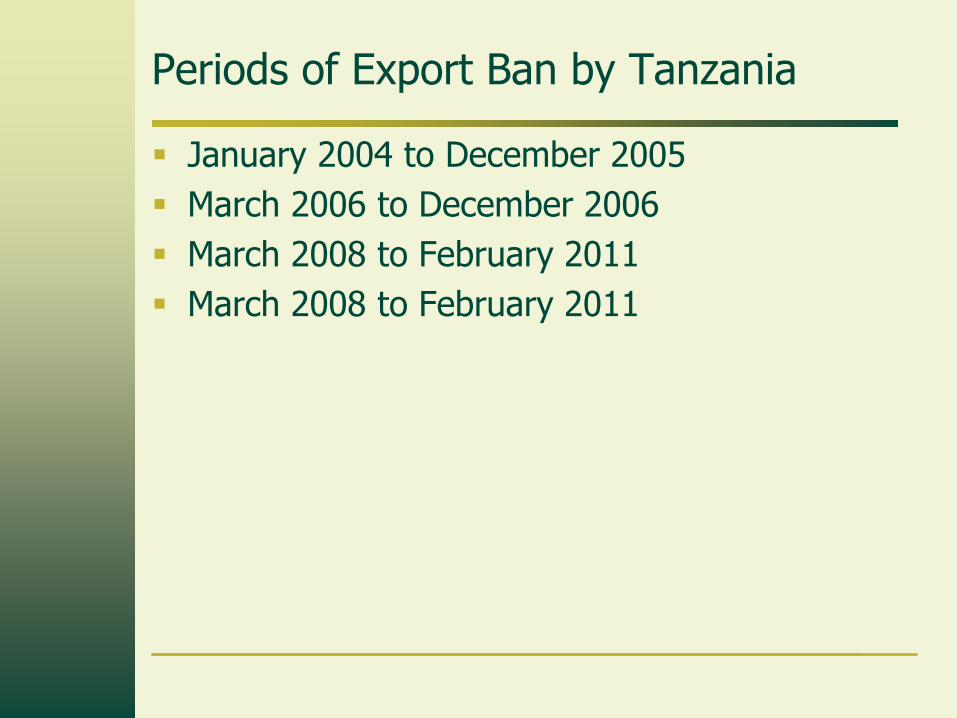
Periods of Export Ban by Tanzania
January 2004 to December 2005 March 2006 to December 2006 March 2008 to February 2011 March 2008 to February 2011

Results
99.
510
10.5
log
price
of m
aize
ln(T
sh/1
00kg
)
Jan 2004 Jan 2006 Jan 2008 Jan 2010 Jan 2012Jan 2005 Jan 2007 Jan 2009 Jan 2011Month and year
Arusha Dar es SalaamIringa Mbeya

Differences in mean prices (Dar es Salaam)
Export ban regime Free trade (no export ban) regime
Maize price (Tsh/100kg)
Rice price (Tsh/100kg)
Beans price (Tsh/100kg)
Maize price (Tsh/100kg)
Rice price (Tsh/100kg)
Beans price (Tsh/100kg)
Mean
29,550
89,042
79,761
24,781
78,790
75,149
Standard deviation
9,756
28,151
26,140
9,573
17,459
19,045
F-test of differences in mean
Maize Rice Beans 0.0585 0.1335 0.4721 Prob>F
0.9200 0.021 0.114 Bartlett's Chi2 test for equal variances

Endogeneity Test from Treatment Effects Model)
Sample: 2004m5 - 2011m12 No. of obs = 92 Log likelihood = 1090.951 AIC = -17.62937 FPE = 4.21e-18 HQIC = -14.53167 Det(Sigma_ml) = 6.92e-21 SBIC = -9.954358 rho 0.264 sigma 3.061 lambda 0.808
Sample: 2004m5 - 2011m12 No. of obs = 92 Log likelihood = 1351.761 AIC = -19.2441 rho 0.422 HQIC = -15.93117 sigma 2.723 SBIC = -10.024817 lambda 1.149
Sample: 2004m5 - 2011m12
No. of obs = 92
Log likelihood = 2811.339 AIC = -29.49722 rho 0.504 HQIC = -23.64201 sigma 5.687 SBIC = -18.33785 lambda 2.866

Results: Unit Root tests Market Location Unit roots test:
Maize price lags(ᵨ) Rice price lags(ᵨ)
Beans price lags(ᵨ)
Arusha DF-GLS tau statistic -2.999 3 -3.267* 7 -3.151* 1 KPSS 0.156* 3 0.0691 7 0.585** 1 Phillips-Perron (Rho statistic) -16.132 4 -16.655 7 -17.385 1
Dar es Salaam DF-GLS tau statistic -2.870 2 -3.109* 2 -1.925 7 KPSS 0.11 0.215* 0.178 Phillips-Perron (Rho statistic) -17.716 3 -20.416 2 -18.335 1
Dodoma DF-GLS tau statistic -2.757 9 -2.835 0 -3.420* 11 KPSS 0.0566 0.330 0.0699 Phillips-Perron (Rho statistic) -16.131 4 -18.793 1 -17.726 14
Iringa DF-GLS tau statistic -2.819 1 -2.956 1 -1.988 9 KPSS 0.256 0.682 0.0979 Phillips-Perron (Rho statistic) -16.668 2 -16.967 2 -32.411** 3
Mbeya DF-GLS tau statistic -3.002* 11 -2.812 1 -2.985 1 KPSS 0.0496 0.284 0.550 Phillips-Perron (Rho statistic) -17.716 2
Morogoro DF-GLS tau statistic -3.097* 3 -2.055 11 -4.122** 1 KPSS 0.103 0.114 0.479** Phillips-Perron (Rho statistic) -16.702 2 -20.151 2
Moshi DF-GLS tau statistic -2.643 1 -2.980 4 -2.807 8 KPSS 0.316 0.0977 0.0665 Phillips-Perron (Rho statistic)
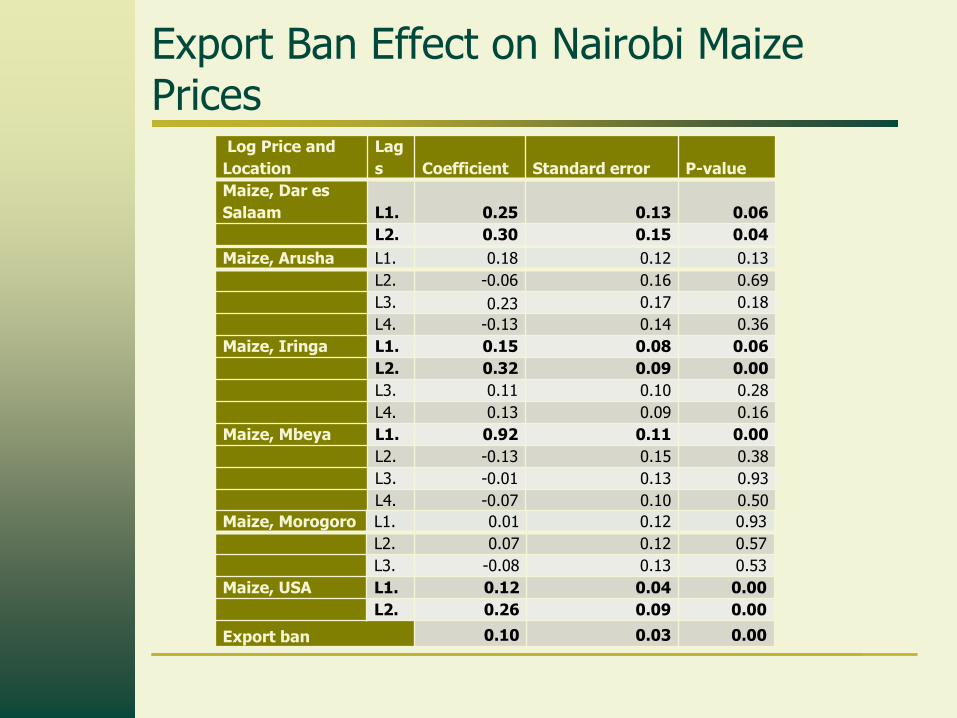
Export Ban Effect on Nairobi Maize Prices
Log Price and Location
Lags Coefficient Standard error P-value
Maize, Dar es Salaam L1. 0.25 0.13 0.06
L2. 0.30 0.15 0.04 Maize, Arusha L1. 0.18 0.12 0.13
L2. -0.06 0.16 0.69 L3. 0.23 0.17 0.18 L4. -0.13 0.14 0.36
Maize, Iringa L1. 0.15 0.08 0.06 L2. 0.32 0.09 0.00 L3. 0.11 0.10 0.28 L4. 0.13 0.09 0.16
Maize, Mbeya L1. 0.92 0.11 0.00 L2. -0.13 0.15 0.38 L3. -0.01 0.13 0.93 L4. -0.07 0.10 0.50
Maize, Morogoro L1. 0.01 0.12 0.93 L2. 0.07 0.12 0.57 L3. -0.08 0.13 0.53
Maize, USA L1. 0.12 0.04 0.00 L2. 0.26 0.09 0.00
Export ban 0.10 0.03 0.00

Export Ban Effect on Dar es Salaam Maize Prices
Log Price and Location Lags Coefficient
Standard error
P-value
Maize, Dar es Salaam L0. 0.27656 0.12551 0.028
L1. 0.17204 0.74583 0.024
L2. -0.07212 0.14028 0.607
L3. -0.05478 0.13312 0.681 Maize, Arusha L0. 0.07006 0.01892 0.071
L1. -0.50342 0.20227 0.013
L2. 0.79244 0.20933 0.000
Maize, Iringa L0. 0.76921 0.01297 0.000
L1. 0.06511 0.01523 0.067
L2. -0.11050 0.14981 0.461
L3. -0.04944 0.12663 0.696 Maize, Mbeya L0. 0.899271 0.11939 0.000
L1. -0.464881 0.16004 0.004
Maize, USA L0. 0.425578 0.16607 0.006
L1. 0.023667 0.10325 0.001
L2. 0.127660 0.49870 0.000
Export ban -0.06215 0.02763 0.000

Export Ban Effect on Mbeya Prices Log Price
and Location Lags Coefficient Standard
error P-value
Maize, Dar es Salaam L0. 0.011 0.004 0.028
L1. 0.064 0.028 0.024
L2. -0.012 0.140 0.607 Maize, Arusha L0. 0.082 0.017 0.000
L1. -0.307 0.200 0.013
L2. 0.791 0.213 0.000 Maize, Mbeya L0. 0.021 0.013 0.000
L1. -0.370 0.11 0.000
Maize, USA L0. -0.168 0.061 0.306
L1. -0.231 0.103 0.001
L2. 0.125 0.009 0.000
Export ban -0.147 0.036 0.000
Conclusion
Export bans appear endogenous Export bans have some effect in reducing
domestic maize prices in Dar es Salaam and in surplus producing areas like Mbeya
Does not seem to have an impact on other commodities like rice and beans
But Tanzania’s maize export ban likely comes at a cost of increasing transaction costs of trade (bribes, etc.)
This may further increase prices in neighboring country markets that rely on imports from Tanzania such as Nairobi

Thank you!