tata consultancy services - extract from ......tata consultancy services limited and its...
TRANSCRIPT
EXTRACT FROM CONSOLIDATED AUDITED ACCOUNTS OF
TATA CONSULTANCY SERVICES LIMITED
AS AT MARCH 31, 2012

TATA CONSULTANCY SERVICES LIMITED CONSOLIDATED BALANCE SHEET AS AT MARCH 31, 2012
1
(` crores)As at As at
Note March 31, 2012 March 31, 2011
I. EQUITY AND LIABILITIES
(1) Shareholders’ funds
(a) Share Capita l 3 295.72 295.72
(b) Reserves and Surplus 4 29283.51 24209.09
29579.23 24504.81
(2) Minority interest 558.77 458.17
(3) Non-current liabilities
(a) Long-term borrowings 5 115.37 37.70
(b) Deferred tax l iabi l i ties (net) 6 173.45 109.49
(c) Other long term l iabi l i ties 7 285.01 185.61
(d) Long-term provis ions 8 217.65 139.23
791.48 472.03
(4) Current liabilities
(a) Short-term borrowings 9 0.89 31.57
(b) Trade payables 3247.87 2572.33
(c) Other current l iabi l i ties 10 2422.20 1923.20
(d) Short-term provis ions 11 4794.05 2718.93
10465.01 7246.03
TOTAL 41394.49 32681.04
II. ASSETS
(1) Non-current assets
(a) Fixed assets 12
(i ) Tangible assets 4820.73 3935.33
(i i ) Intangible assets 297.87 311.76
(i i i ) Capita l work-in progress 1446.37 1193.89
6564.97 5440.98
(b) Non-current investments 13 577.65 1078.68
(c) Deferred tax assets (net) 6 256.04 160.18
(d) Long-term loans and advances 14 4517.63 2953.44
(e) Other non-current assets 15 2659.65 2779.35
(f) Goodwi l l (on Consol idation) 3543.46 3232.00
18119.40 15644.63
(2) Current Assets
(a) Current investments 16 772.68 683.99
(b) Inventories 17 17.77 22.82
(c) Unbi l led revenue 18 2247.76 1348.85
(d) Trade receivables 19 11520.35 8194.97
(e) Cash and bank balances 20 6003.47 4700.85
(f) Short-term loans and advances 21 2255.19 1966.64
(g) Other current assets 22 457.87 118.29
23275.09 17036.41
TOTAL 41394.49 32681.04
III. NOTES FORMING PART OF THE CONSOLIDATED FINANCIAL STATEMENTS 1-46
As per our report attached For and on behal f of the Board
For Deloitte Haskins & Sells
Chartered Accountants Ratan N. Tata S. Ramadorai N. ChandrasekaranChairman Vice Chairman CEO and Managing Director
P. R. RameshPartner S. Mahalingam Phiroz Vandrevala Laura M. Cha
Chief Financial Officer and Director DirectorExecutive Director
Aman Mehta V. Thyagarajan Ishaat HussainDirector Director Director
Cyrus Mistry Dr. Ron Sommer Dr. Vijay KelkarDirector Director Director
O.P. Bhatt Suprakash MukhopadhyayMumbai , Apri l 23, 2012 Director Company Secretary
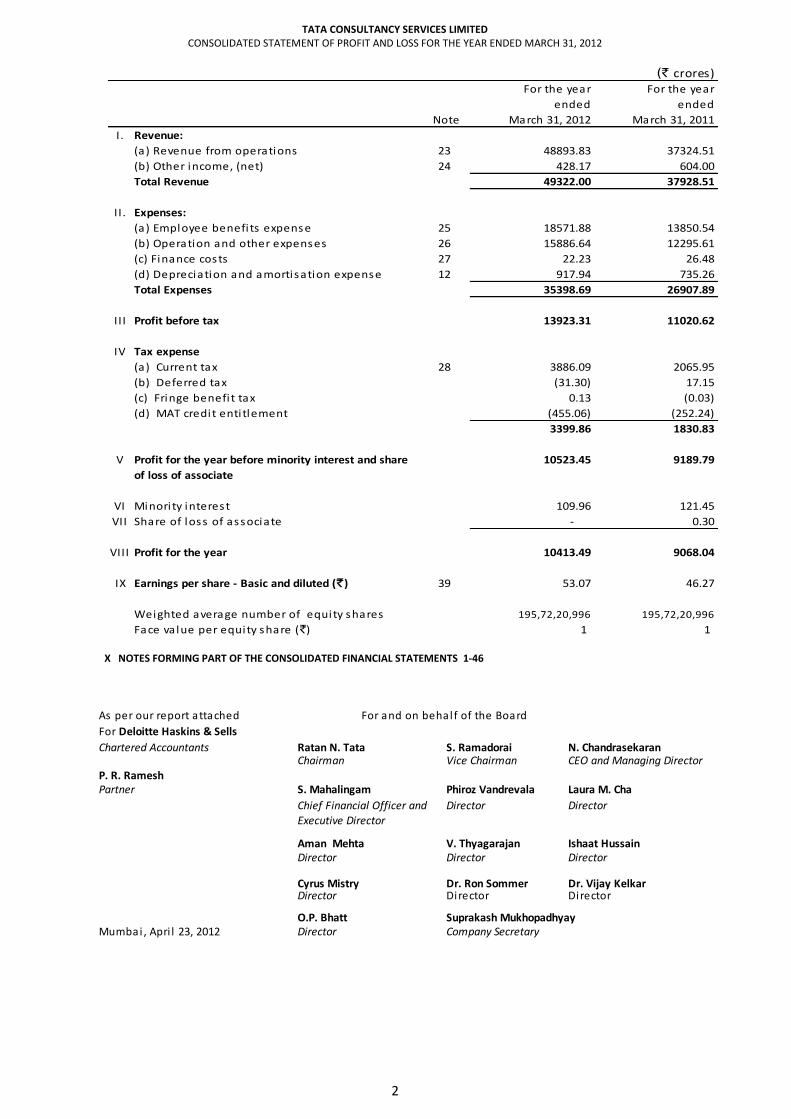
TATA CONSULTANCY SERVICES LIMITED CONSOLIDATED STATEMENT OF PROFIT AND LOSS FOR THE YEAR ENDED MARCH 31, 2012
2
(` crores)For the year For the year
ended ended
Note March 31, 2012 March 31, 2011
I. Revenue:
(a) Revenue from operations 23 48893.83 37324.51
(b) Other income, (net) 24 428.17 604.00
Total Revenue 49322.00 37928.51
I I . Expenses:
(a) Employee benefi ts expense 25 18571.88 13850.54
(b) Operation and other expenses 26 15886.64 12295.61
(c) Finance costs 27 22.23 26.48
(d) Depreciation and amortisation expense 12 917.94 735.26
Total Expenses 35398.69 26907.89
I I I Profit before tax 13923.31 11020.62
IV Tax expense
(a) Current tax 28 3886.09 2065.95
(b) Deferred tax (31.30) 17.15
(c) Fringe benefi t tax 0.13 (0.03)
(d) MAT credit enti tlement (455.06) (252.24)
3399.86 1830.83
V Profit for the year before minority interest and share
of loss of associate
10523.45 9189.79
VI Minori ty interest 109.96 121.45
VII Share of loss of associate - 0.30
VIII Profit for the year 10413.49 9068.04
IX Earnings per share - Basic and diluted (`) 39 53.07 46.27
Weighted average number of equity shares 195,72,20,996 195,72,20,996
Face va lue per equity share (`) 1 1
X NOTES FORMING PART OF THE CONSOLIDATED FINANCIAL STATEMENTS 1-46
As per our report attached For and on behalf of the Board
For Deloitte Haskins & Sells
Chartered Accountants Ratan N. Tata S. Ramadorai N. ChandrasekaranChairman Vice Chairman CEO and Managing Director
P. R. RameshPartner S. Mahalingam Phiroz Vandrevala Laura M. Cha
Chief Financial Officer and Director DirectorExecutive Director
Aman Mehta V. Thyagarajan Ishaat HussainDirector Director Director
Cyrus Mistry Dr. Ron Sommer Dr. Vijay KelkarDirector Director Director
O.P. Bhatt Suprakash MukhopadhyayMumbai , Apri l 23, 2012 Director Company Secretary

TATA CONSULTANCY SERVICES LIMITED CONSOLIDATED CASH FLOW STATEMENT FOR THE YEAR ENDED MARCH 31, 2012
3
(` crores)For the year For the year
ended ended
March 31, 2012 March 31, 2011
I CASH FLOWS FROM OPERATING ACTIVITIES
Profit before taxes 13923.31 11020.62
Adjustments for:
Depreciation and amortisation 917.94 735.26
Provis ion for doubtful debts and advances (18.27) (98.25)
Provis ion for diminution in va lue of investment - 0.58
Impairment of goodwi l l 21.18 0.71
Finance costs 22.23 26.48
Loss on sa le of fixed assets (net) 0.35 1.82
Dividend income (6.41) (16.04)
Profi t on sa le of mutual fund and other current investments (net) (31.76) (81.85)
Interest income (765.22) (497.23)
Exchange di fference on trans lation of foreign currency
cash and cash equiva lents
(119.09) (30.28)
Unreal ised exchange loss/(ga in) 152.30 (19.07)
Operating profit before working capital changes 14096.56 11042.75
Inventories 5.05 (5.03)
Unbi l led revenues (898.91) (144.36)
Trade receivables (3299.69) (2203.86)
Loans and advances and Other assets (561.66) (380.12)
Trade payables , Other l iabi l i ties and Provis ions 1339.79 556.94
Adjustment of trans lation di fferences on working capita l 395.41 11.58
Cash generated from operations 11076.55 8877.90
Taxes pa id (4068.40) (2263.52)
Net cash flows provided by operating activities 7008.15 6614.38
I I CASH FLOWS FROM INVESTING ACTIVITIES
Purchase of fixed assets (2007.07) (1826.61)
Commeria l papers matured - 150.00
Proceeds from sa le of fixed assets 19.71 18.11
Purchase of mutual fund and other investments (16937.99) (49686.01)
Sa le of mutual funds and other investments 17385.23 51687.68
Inter-corporate depos i ts placed (1676.21) (286.00)
Inter-corporate depos i ts refunded 992.80 326.00
Commercia l papers purchased - (146.02)
Adjustment of purchase cons ideration - 27.33
Acquis i tion of subs idiaries net of cash (including
additional cons ideration)
- 7.16
Purchase of shares from minori ty shareholders (229.16) (6.59)
Dividends received 6.41 16.04
Interest received 419.31 398.75
Fixed depos i t placed with banks having origina l maturi ty
over three months
(4261.63) (6109.59)
Fixed depos i t with banks matured having origina l
maturi ty over three months
3551.35 3968.21
Net cash used in investing activities (2737.25) (1461.54)
Note

TATA CONSULTANCY SERVICES LIMITED CONSOLIDATED CASH FLOW STATEMENT FOR THE YEAR ENDED MARCH 31, 2012
4
(` crores)
For the year For the year
ended ended
March 31, 2012 March 31, 2011
III CASH FLOWS FROM FINANCING ACTIVITIES
Short term borrowings (net) (32.90) (294.11)
Proceeds from issue of Long term borrowings - 273.26
Repayment of Long term borrowings (1.25) (3.54)
Dividend paid, including dividend tax (3879.81) (4584.38)
Dividend tax on dividend paid by subs idiaries (11.35) (8.31)
Dividend paid to minori ty shareholders of subs idiaries (17.12) (15.98)
Proceeds from issue of shares to minori ty shareholders 9.71 0.66
Interest pa id (22.37) (26.50)
Net cash used in financing activities (3955.09) (4658.90)
Net increase in cash and cash equivalents 315.81 493.94
Cash and cash equiva lents at beginning of the year 1548.59 1024.37
Exchange di fference on trans lation of foreign currency
Cash and cash equiva lents
119.09 30.28
Cash and cash equivalents at end of the year 20 1983.49 1548.59
Short term bank depos its 4004.21 3126.14
Earmarked balances with banks 15.77 26.12
Cash and bank balances at the end of the year 20 6003.47 4700.85
Note
IV NOTES FORMING PART OF THE CONSOLIDATED FINANCIAL STATEMENTS 1-46
As per our report attached For and on behal f of the Board
For Deloitte Haskins & Sells
Chartered Accountants Ratan N. Tata S. Ramadorai N. ChandrasekaranChairman Vice Chairman CEO and Managing Director
P. R. RameshPartner S. Mahalingam Phiroz Vandrevala Laura M. Cha
Chief Financial Officer and Director DirectorExecutive Director
Aman Mehta V. Thyagarajan Ishaat HussainDirector Director Director
Cyrus Mistry Dr. Ron Sommer Dr. Vijay KelkarDirector Director Director
O.P. Bhatt Suprakash MukhopadhyayMumbai , Apri l 23, 2012 Director Company Secretary

TATA CONSULTANCY SERVICES LIMITED Notes forming part of the Consolidated Financial Statements
5
1) Corporate Information Tata Consultancy Services Limited and its subsidiaries (collectively referred to as the “Group”) provide a wide range of information technology and consultancy services including systems, hardware and software, communications and networking, hardware sizing and capacity planning, software management solutions, technology education services and business process outsourcing. The Company’s full services portfolio consists of Application Development and Maintenance, Business Intelligence, Enterprise Solutions, Assurance, Engineering and Industrial Services, IT Infrastructure services, Business Process Outsourcing, Consulting and Asset Leveraged solutions. As of March 2012, Tata Sons owned 73.75 percent of the Company’s equity share capital and has the ability to control its operating and financial policies. The Company’s registered office is in Mumbai and it has 58 subsidiaries in 20 countries.
2) Significant accounting policies
a) Basis of Preparation
These financial statements have been prepared in accordance with the generally accepted accounting principles in India under the historical cost convention on accrual basis, except for certain financial instruments which are measured at fair value. These financial statements have been prepared to comply in all material aspects with the accounting standards notified under Section 211(3C) [Companies (Accounting Standards) Rules, 2006, as amended], the other relevant provisions of the Companies Act, 1956 and the Guidelines issued by the Securities and Exchange Board of India(SEBI).
b) Principles of consolidation
The financial statements of the subsidiary companies used in the consolidation are drawn up to the same reporting date as of the Company. The consolidated financial statements have been prepared on the following basis: i) The financial statements of the Company and its subsidiary companies have been combined on a line- by-line
basis by adding together like items of assets, liabilities, income and expenses. Inter-company balances and transactions and unrealised profits or losses have been fully eliminated.
ii) The consolidated financial statements include the share of profit/loss of associate companies, which are
accounted under the ‘Equity method’ as per which the share of profit/loss of the associate company has been adjusted to the cost of investment. An associate is an enterprise in which the investor has significant influence and which is neither a subsidiary nor a joint venture.
iii) The excess of cost to the Group of its investments in subsidiary companies over its share of the equity of the
subsidiary companies at the dates on which the investments in the subsidiary companies are made, is recognised as ‘Goodwill’ being an asset in the consolidated financial statements. Alternatively, where the share of equity in the subsidiary companies as on the date of investment is in excess of cost of investment of the Group, it is recognised as ‘Capital Reserve’ and shown under the head ‘Reserves and Surplus’, in the consolidated financial statements.
iv) Minority interest in the net assets of consolidated subsidiaries consists of the amount of equity attributable to
the minority shareholders at the dates on which investments are made by the Group in the subsidiary companies and further movements in their share in the equity, subsequent to the dates of investments.
v) On disposal of a subsidiary, the attributable amount of goodwill is included in the determination of the profit or
loss on disposal.
c) Use of estimates
The preparation of financial statements requires the management of the Group to make estimates and assumptions that affect the reported balances of assets and liabilities and disclosures relating to the contingent liabilities as at the date of the financial statements and reported amounts of income and expenses during the period. Example of such estimates include provision for doubtful debts, employee benefits, provision for income taxes, accounting for contract costs expected to be incurred to complete software development, the useful lives of depreciable fixed assets and provisions for impairment.

TATA CONSULTANCY SERVICES LIMITED Notes forming part of the Consolidated Financial Statements
6
d) Fixed Assets
Fixed assets are stated at cost, less accumulated depreciation / amortisation. Costs include all expenses incurred to bring the assets to its present location and condition. Fixed assets exclude computers and other assets individually costing ` 50,000 or less which are not capitalised except when they are part of a larger capital investment programme.
e) Depreciation / Amortisation
Depreciation / amortisation other than on freehold land and capital work-in-progress is charged so as to write-off the cost of the assets, on the following basis:
Type of asset Method Period/Rate
Leasehold Land and Buildings Straight-Line Lease period
Freehold Buildings Written down value 5%
Straight-Line 1.63% - 2.50%
Factory Buildings Straight-Line 10%
Leasehold Improvements Straight-Line Lease period
Plant and Machinery Straight-Line 16.67-33.33%
Computer Equipment Straight-Line 16% - 50%
Vehicles Written down value 25.89% - 29.89%
Straight-Line 19.80% - 33.33%
Office Equipment Written down value 13.91%
Straight-Line 10% - 20%
Electrical Installations Written down value 13.91%
Straight-Line 18% - 20%
Furniture and Fixtures Straight-Line 10% - 100%
Goodwill Straight-Line 5 - 12 years
Acquired Contract Rights Straight-Line 12 years
Intellectual Property / Distribution Rights Straight-Line 24 - 60 months
Software Licenses Straight-Line License Period
Straight-Line 20% - 50%
Rights under Licensing Agreement Straight-Line License Period
Fixed assets purchased for specific projects are depreciated over the period of the project.
f) Leases
Where the Group, as a lessor, leases assets under finance leases such amounts are recognised as receivables at an amount equal to the net investment in the lease and the finance income is based on a constant rate of return on the outstanding net investment. Assets leased by the Group in its capacity as lessee, where the Group has substantially all the risks and rewards of ownership are classified as finance lease. Such leases are capitalised at the inception of the lease at lower of the fair value or the present value of the minimum lease payments and a liability is created for an equivalent amount. Each lease rental paid is allocated between the liability and the interest cost so as to obtain a constant periodic rate of interest on the outstanding liability for each year. Lease arrangements where, the risks and rewards incidental to ownership of an asset substantially vests with the lessor, are recognised as operating lease. Lease rentals under operating lease are recognised in the statement of profit and loss on a straight-line basis.

TATA CONSULTANCY SERVICES LIMITED Notes forming part of the Consolidated Financial Statements
7
g) Impairment
At each balance sheet date, the management reviews the carrying amounts of its assets included in each cash generating unit to determine whether there is any indication that those assets were impaired. If any such indication exists, the recoverable amount of the assets is estimated in order to determine the extent of impairment loss. Recoverable amount is the higher of an asset’s net selling price and value in use. In assessing value in use, the estimated future cash flows expected from the continuing use of the asset and from its disposal are discounted to their present value using a pre-tax discount rate that reflects the current market assessments of time value of money and risks specific to the asset. Reversal of impairment loss is recognised immediately as income in the statement of profit and loss. For the purpose of impairment testing, goodwill is allocated to each of the Group’s cash-generating units expected to benefit from the synergies of the acquisition. Cash-generating units to which goodwill has been allocated are tested for impairment annually, or more frequently when there is an indication that the unit may be impaired. If the recoverable amount of the cash-generating unit is less than the carrying amount of the unit, the impairment loss is allocated first to reduce the carrying amount of any goodwill allocated to the unit and then to the other assets of the unit pro-rata on the basis of the carrying amount of each asset in the unit.
h) Investments
Long-term investments and current maturities of long-term investments are stated at cost, less provision for other than temporary diminution in value. Current investments, except for current maturities of long term investments, are stated at the lower of cost and fair value, determined on a portfolio basis.
i) Employee benefits
i) Post-employment benefit plans Contributions to defined contribution retirement benefit schemes are recognised as an expense when employees have rendered services entitling them to contributions. For defined benefit schemes, the cost of providing benefits is determined using the Projected Unit Credit Method, with actuarial valuations being carried out at each balance sheet date. Actuarial gains and losses are recognised in full in the statement of profit and loss for the period in which they occur. Past service cost is recognised immediately to the extent that the benefits are already vested, and otherwise is amortised on a straight-line basis over the average period until the benefits become vested. The retirement benefit obligation recognised in the balance sheet represents the present value of the defined benefit obligation as adjusted for unrecognised past service cost, and as reduced by the fair value of scheme assets. Any asset resulting from this calculation is limited to the present value of available refunds and reductions in future contributions to the scheme.
ii) Other employee benefits The undiscounted amount of short-term employee benefits expected to be paid in exchange for the services rendered by employees is recognised during the period when the employee renders the service. These benefits include compensated absences such as paid annual leave, overseas social security contributions and performance incentives. Compensated absences which are not expected to occur within twelve months after the end of the period in which the employee renders the related services are recognised as an actuarially determined liability at the present value of the defined benefit obligation at the balance sheet date.
j) Revenue recognition
Revenues from contracts priced on a time and material basis are recognised when services are rendered and related costs are incurred. Revenues from turnkey contracts, which are generally time bound fixed price contracts, are recognised over the life of the contract using the proportionate completion method, with contract costs determining the degree of completion. Foreseeable losses on such contracts are recognised when probable. Revenues from the sale of equipment are recognised upon delivery, which is when title passes to the customer.
TATA CONSULTANCY SERVICES LIMITED Notes forming part of the Consolidated Financial Statements
8
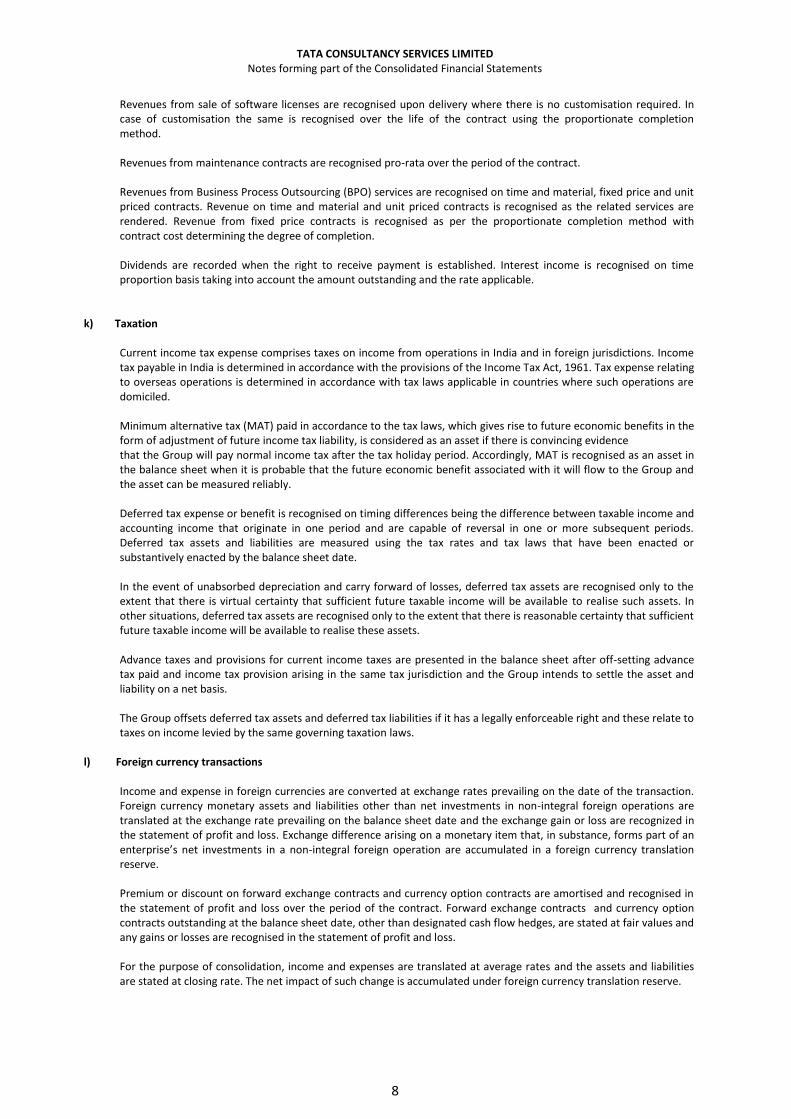
Revenues from sale of software licenses are recognised upon delivery where there is no customisation required. In case of customisation the same is recognised over the life of the contract using the proportionate completion method. Revenues from maintenance contracts are recognised pro-rata over the period of the contract. Revenues from Business Process Outsourcing (BPO) services are recognised on time and material, fixed price and unit priced contracts. Revenue on time and material and unit priced contracts is recognised as the related services are rendered. Revenue from fixed price contracts is recognised as per the proportionate completion method with contract cost determining the degree of completion. Dividends are recorded when the right to receive payment is established. Interest income is recognised on time proportion basis taking into account the amount outstanding and the rate applicable.
k) Taxation
Current income tax expense comprises taxes on income from operations in India and in foreign jurisdictions. Income tax payable in India is determined in accordance with the provisions of the Income Tax Act, 1961. Tax expense relating to overseas operations is determined in accordance with tax laws applicable in countries where such operations are domiciled. Minimum alternative tax (MAT) paid in accordance to the tax laws, which gives rise to future economic benefits in the form of adjustment of future income tax liability, is considered as an asset if there is convincing evidence that the Group will pay normal income tax after the tax holiday period. Accordingly, MAT is recognised as an asset in the balance sheet when it is probable that the future economic benefit associated with it will flow to the Group and the asset can be measured reliably. Deferred tax expense or benefit is recognised on timing differences being the difference between taxable income and accounting income that originate in one period and are capable of reversal in one or more subsequent periods. Deferred tax assets and liabilities are measured using the tax rates and tax laws that have been enacted or substantively enacted by the balance sheet date. In the event of unabsorbed depreciation and carry forward of losses, deferred tax assets are recognised only to the extent that there is virtual certainty that sufficient future taxable income will be available to realise such assets. In other situations, deferred tax assets are recognised only to the extent that there is reasonable certainty that sufficient future taxable income will be available to realise these assets. Advance taxes and provisions for current income taxes are presented in the balance sheet after off-setting advance tax paid and income tax provision arising in the same tax jurisdiction and the Group intends to settle the asset and liability on a net basis. The Group offsets deferred tax assets and deferred tax liabilities if it has a legally enforceable right and these relate to taxes on income levied by the same governing taxation laws.
l) Foreign currency transactions
Income and expense in foreign currencies are converted at exchange rates prevailing on the date of the transaction. Foreign currency monetary assets and liabilities other than net investments in non-integral foreign operations are translated at the exchange rate prevailing on the balance sheet date and the exchange gain or loss are recognized in the statement of profit and loss. Exchange difference arising on a monetary item that, in substance, forms part of an enterprise’s net investments in a non-integral foreign operation are accumulated in a foreign currency translation reserve. Premium or discount on forward exchange contracts and currency option contracts are amortised and recognised in the statement of profit and loss over the period of the contract. Forward exchange contracts and currency option contracts outstanding at the balance sheet date, other than designated cash flow hedges, are stated at fair values and any gains or losses are recognised in the statement of profit and loss.
For the purpose of consolidation, income and expenses are translated at average rates and the assets and liabilities are stated at closing rate. The net impact of such change is accumulated under foreign currency translation reserve.

TATA CONSULTANCY SERVICES LIMITED Notes forming part of the Consolidated Financial Statements
9
m) Derivative instruments and hedge accounting
The Group uses foreign currency forward contracts and currency options to hedge its risks associated with foreign currency fluctuations relating to certain firm commitments and forecasted transactions. The Company designates these hedging instruments as cash flow hedges. The use of hedging instruments is governed by the policies of the Company and its subsidiaries which are approved by its respective Board of Directors, which provide written principles on the use of such financial derivatives consistent with the risk management strategy of the Company and its subsidiaries. Hedging instruments are initially measured at fair value, and are remeasured at subsequent reporting dates. Changes in the fair value of these derivatives that are designated and effective as hedges of future cash flows are recognised directly in shareholders’ funds and the ineffective portion is recognised immediately in the statement of profit and loss.
Changes in the fair value of derivative financial instruments that do not qualify for hedge accounting are recognised in statement of profit and loss as they arise. Hedge accounting is discontinued when the hedging instrument expires or is sold, terminated, or exercised, or no longer qualifies for hedge accounting. At that time for forecasted transactions, any cumulative gain or loss on the hedging instrument recognised in shareholders’ funds is retained there until the forecasted transaction occurs. If a hedged transaction is no longer expected to occur, the net cumulative gain or loss recognised in shareholders’ funds is transferred to the statement of profit and loss for the period.
n) Inventories Raw materials, sub-assemblies and components are carried at the lower of cost and net realisable value. Cost is
determined on a weighted average basis. Purchased goods in transit are carried at cost. Work-in-progress is carried at the lower of cost and net realisable value. Stores and spare parts are carried at cost, less provision for obsolescence. Finished goods produced or purchased by the Group are carried at the lower of cost and net realisable value. Cost includes direct material and labour cost and a proportion of manufacturing overheads.
o) Government Grants
Government grants are recognised when there is reasonable assurance that the Group will comply with the conditions attached to them and the grants will be received. Government grants whose primary condition is that the Group should purchase, construct or otherwise acquire capital assets are presented by deducting them from the carrying value of the assets. The grant is recognised as income over the life of a depreciable asset by way of a reduced depreciation charge. Other government grants are recognised as income over the periods necessary to match them with the costs for which they are intended to compensate, on a systematic basis.
p) Provisions, Contingent Liabilities and Contingent Assets
A provision is recognised when the Group has a present obligation as a result of past event and it is probable that an outflow of resources will be required to settle the obligation, in respect of which reliable estimate can be made. Provisions (excluding retirement benefits) are not discounted to its present value and are determined based on best estimate required to settle the obligation at the balance sheet date. These are reviewed at each balance sheet date and adjusted to reflect the current best estimates. Contingent liabilities are not recognised in the financial statements. A contingent asset is neither recognised nor disclosed in the financial statements.
q) Cash and cash equivalents
The Group considers all highly liquid financial instruments, which are readily convertible into cash and have original maturities of three months or less from the date of purchase, to be cash equivalents.

TATA CONSULTANCY SERVICES LIMITED Notes forming part of the Consolidated Financial Statements
10
3) SHARE CAPITAL
The authorised, issued, subscribed and fully paid-up share capital comprises of equity shares and redeemable cumulative preference shares having a par value of ` 1/- each as follows:
(` crores)As at As at
March 31, 2012 March 31, 2011
(a) Authorised
(i ) 225,00,00,000 equity shares of ` 1 each 225.00 225.00
(March 31, 2011 : 225,00,00,000 equity shares of ` 1 each)
(i i ) 100,00,00,000 redeemable preference shares of ` 1 each 100.00 100.00(March 31, 2011 : 100,00,00,000 redeemable preference
shares of ` 1 each)
325.00 325.00
(b) Issued, Subscribed and Fully Paid up
(i ) 195,72,20,996 equity shares of ` 1 each 195.72 195.72
(March 31, 2011 : 195,72,20,996 equity shares of ` 1 each)
(i i ) 100,00,00,000 redeemable preference shares of ` 1 each 100.00 100.00
(March 31, 2011 : 100,00,00,000 redeemable preference
shares of ` 1 each)
295.72 295.72
a) Reconciliation of number of shares
As at March 31, 2012 As at March 31, 2011
Number of Amount Number of Amount
shares (` crores) shares (` crores)
Equity Shares
Opening Balance 195,72,20,996 195.72 195,72,20,996 195.72
Changes during the year - - - -
Closing Balance 195,72,20,996 195.72 195,72,20,996 195.72
Preference Shares
Opening Balance 100,00,00,000 100.00 100,00,00,000 100.00
Changes during the year - - - -
Closing Balance 100,00,00,000 100.00 100,00,00,000 100.00
b) Rights, preferences and restrictions attached to shares
Equity Shares
The Company has one class of equity shares having a par value of ` 1 each. Each shareholder is eligible for one vote per share held. The dividend proposed by the Board of Directors is subject to the approval of the shareholders in the ensuing Annual General Meeting, except in case of interim dividend. In the event of liquidation, the equity shareholders are eligible to receive the remaining assets of the company after distribution of all preferential amounts, in proportion to their shareholding. Preference Shares Preference shares would be redeemable at par at the end of six years from the date of allotment but may be redeemed at any time after 3 years from the date of allotment at the option of shareholder. These shares would carry a fixed cumulative dividend of 1% per annum and a variable non-cumulative dividend of 1% of the difference between the rate of dividend declared during the year on the equity shares of the Company and the average rate of dividend declared on the equity shares of the Company for three years preceding the year of issue of the redeemable preference shares.

TATA CONSULTANCY SERVICES LIMITED Notes forming part of the Consolidated Financial Statements
11
c) Details of shares held by shareholders holding more than 5% of the aggregate shares in the Company
As at
March 31, 2012
As at
March 31, 2011
Equity Shares
Tata Sons Limited, the Holding Company 144,34,51,698 144,34,04,398
(73.75%) (73.75%)
Preference shares
Tata Sons Limited, the Holding Company 100,00,00,000 100,00,00,000
(100.00%) (100.00%)
d) Shares allotted as fully paid up by way of bonus shares (during 5 years preceding March 31, 2012)
97,86,10,498 equity shares allotted as fully paid up bonus shares by utilization of Securities Premium Account on June 18, 2009.
TATA CONSULTANCY SERVICES LIMITED Notes forming part of the Consolidated Financial Statements
12
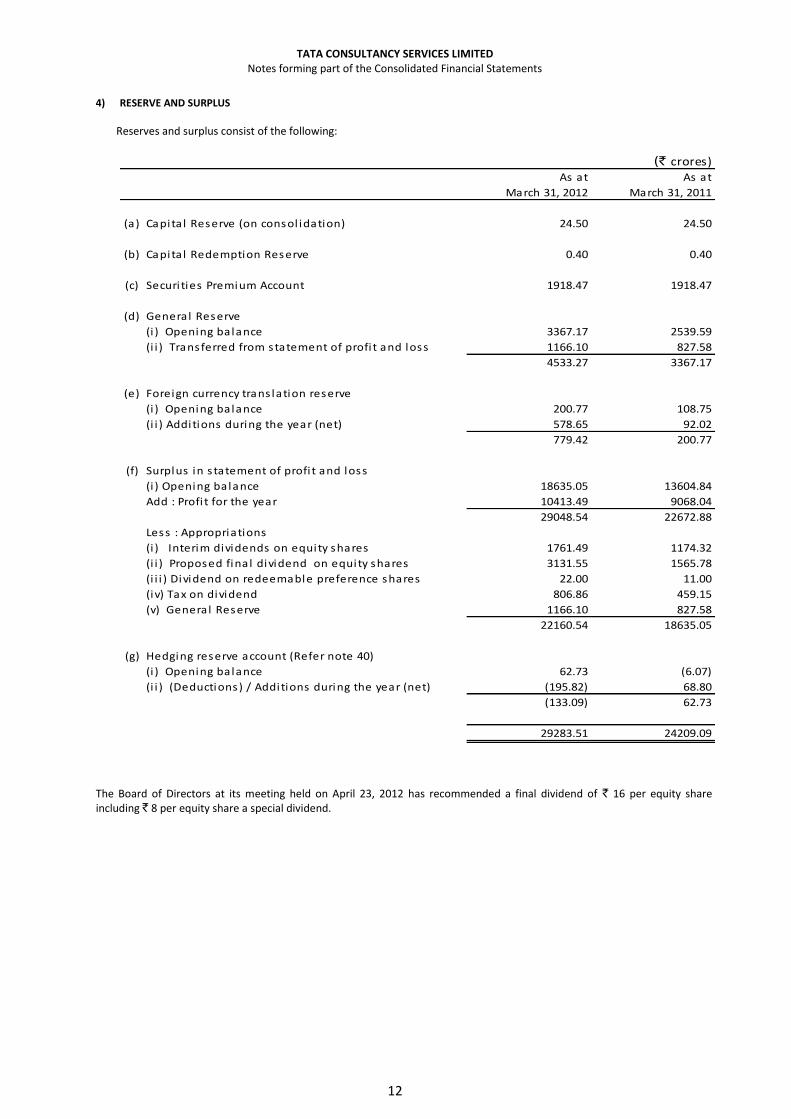
4) RESERVE AND SURPLUS
Reserves and surplus consist of the following:
(` crores) As at As at
March 31, 2012 March 31, 2011
(a) Capita l Reserve (on consol idation) 24.50 24.50
(b) Capita l Redemption Reserve 0.40 0.40
(c) Securi ties Premium Account 1918.47 1918.47
(d) General Reserve
(i ) Opening balance 3367.17 2539.59
(i i ) Transferred from statement of profi t and loss 1166.10 827.58
4533.27 3367.17
(e) Foreign currency trans lation reserve
(i ) Opening balance 200.77 108.75
(i i ) Additions during the year (net) 578.65 92.02
779.42 200.77
(f) Surplus in s tatement of profi t and loss
(i ) Opening balance 18635.05 13604.84
Add : Profi t for the year 10413.49 9068.04
29048.54 22672.88
Less : Appropriations
(i ) Interim dividends on equity shares 1761.49 1174.32
(i i ) Proposed fina l dividend on equity shares 3131.55 1565.78
(i i i ) Dividend on redeemable preference shares 22.00 11.00
(iv) Tax on dividend 806.86 459.15
(v) General Reserve 1166.10 827.58
22160.54 18635.05
(g) Hedging reserve account (Refer note 40)
(i ) Opening balance 62.73 (6.07)
(i i ) (Deductions) / Additions during the year (net) (195.82) 68.80
(133.09) 62.73
29283.51 24209.09
The Board of Directors at its meeting held on April 23, 2012 has recommended a final dividend of ` 16 per equity share including ` 8 per equity share a special dividend.
TATA CONSULTANCY SERVICES LIMITED Notes forming part of the Consolidated Financial Statements
13
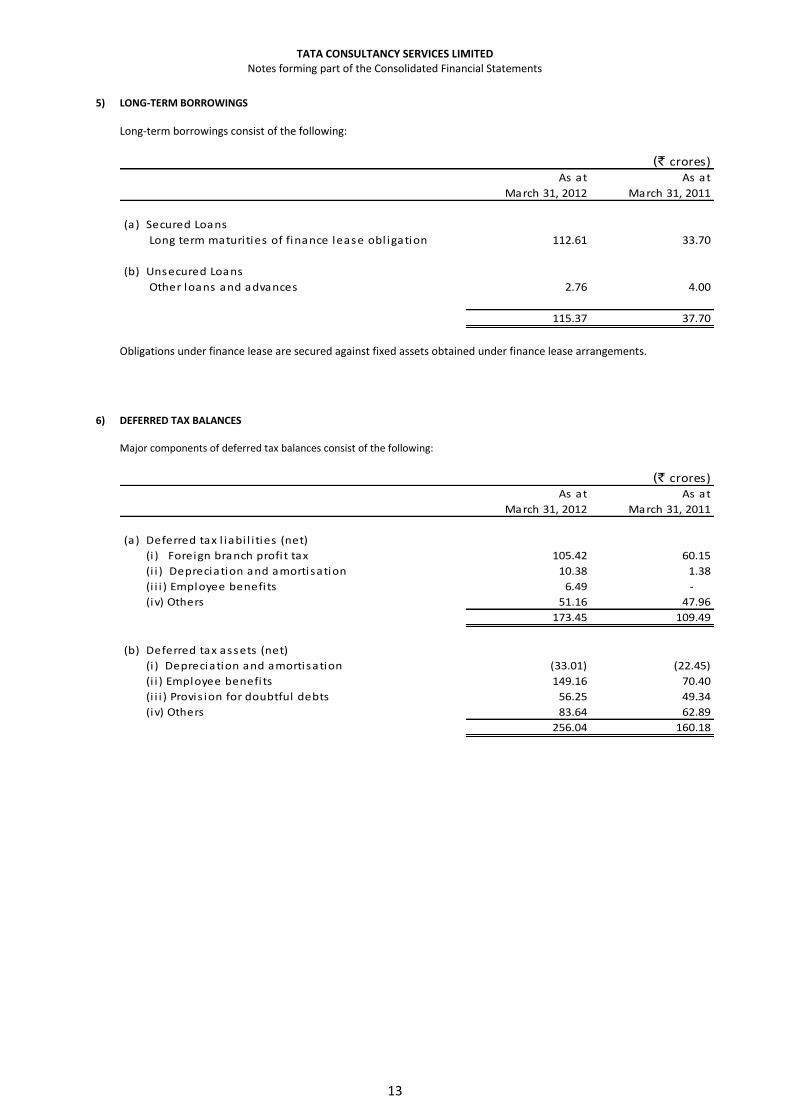
5) LONG-TERM BORROWINGS
Long-term borrowings consist of the following:
(` crores)As at As at
March 31, 2012 March 31, 2011
(a) Secured Loans
Long term maturi ties of finance lease obl igation 112.61 33.70
(b) Unsecured Loans
Other loans and advances 2.76 4.00
115.37 37.70
Obligations under finance lease are secured against fixed assets obtained under finance lease arrangements.
6) DEFERRED TAX BALANCES Major components of deferred tax balances consist of the following:
(` crores)As at As at
March 31, 2012 March 31, 2011
(a) Deferred tax l iabi l i ties (net)
(i ) Foreign branch profi t tax 105.42 60.15
(i i ) Depreciation and amortisation 10.38 1.38
(i i i ) Employee benefi ts 6.49 -
(iv) Others 51.16 47.96
173.45 109.49
(b) Deferred tax assets (net)
(i ) Depreciation and amortisation (33.01) (22.45)
(i i ) Employee benefi ts 149.16 70.40
(i i i ) Provis ion for doubtful debts 56.25 49.34
(iv) Others 83.64 62.89
256.04 160.18

TATA CONSULTANCY SERVICES LIMITED Notes forming part of the Consolidated Financial Statements
14
7) OTHER LONG TERM LIABILITIES
Other long term liabilities consist of the following:
(` crores) As at As at
March 31, 2012 March 31, 2011
(a) Trade payables 10.63 -
(b) Other I iabi l i ties 274.38 185.61
285.01 185.61
Other l iabi l i ties perta ins to :
(i ) Fa i r va lues of foreign exchange forward and currency
option contracts secured against trade receivables
52.51 42.94
(i i ) Capita l Creditors 31.63 24.87
(i i i ) Others 190.24 117.80
8) LONG-TERM PROVISIONS
Long-term provisions consist of the following:
(` crores) As at As at
March 31, 2012 March 31, 2011
Provis ion for employee benefi ts 217.65 139.23
217.65 139.23
Provision for employee benefits includes provision for gratuity and other retirement benefits.
9) SHORT-TERM BORROWINGS
Short-term borrowings consist of the following:
(` crores) As at As at
March 31, 2012 March 31, 2011
(a) Secured Loans
Loans repayable on demand
- From banks - 0.46
(b) Unsecured Loans
Loans repayable on demand
- From banks 0.89 31.11
0.89 31.57
Secured loans from banks are secured against trade receivables.

TATA CONSULTANCY SERVICES LIMITED Notes forming part of the Consolidated Financial Statements
15
10) OTHER CURRENT LIABILITIES
Other current liabilities consist of the following:
(` crores) As at As at
March 31, 2012 March 31, 2011
(a) Current maturi ties of long-term debt 1.25 1.25
(b) Current maturi ties of finance lease obl igations 9.05 4.28
(c) Interest accrued but not due on borrowings 0.05 0.19
(d) Income received in advance 823.01 771.94
(e) Unpaid dividends 9.40 8.41
(f) Equity share appl ication monies refundable - 0.03
(g) Advance received from customers 105.69 37.36
(h) Other payables 1473.75 1099.74
2422.20 1923.20
Other payables includes :
(i ) Fa ir va lues of foreign exchange forward and currency
option contracts secured against trade receivables
240.38 14.77
(i i ) Statutory Liabi l i ties 612.07 499.57
(i i i ) Capita l creditors 167.41 163.37
Obligations under finance lease are secured against fixed assets obtained under finance lease arrangements.
11) SHORT-TERM PROVISIONS
Short-term provisions consist of the following:
(` crores)
As at As at
March 31, 2012 March 31, 2011
(a) Provis ion for employee benefi ts 641.45 527.35
(b) Others
(i ) Proposed fina l dividend on equity shares 3131.55 1565.78
(i i ) Proposed dividend on redeemable preference shares 22.00 11.00
(i i i ) Interim Dividend - -
(iv) Tax on dividend 524.07 266.74
(v) Current income taxes (net) 472.07 339.53
(vi ) Other provis ions 2.91 8.53
4794.05 2718.93

TATA CONSULTANCY SERVICES LIMITED Notes forming part of the Consolidated Financial Statements
16
12) FIXED ASSETS
Fixed assets consist of the following: (` crores)Gross Block Accumulated Accumulated Net book Net book
Gross Block Translation as at Depreciation / Depreciation/ Translation Depreciation / value as at value as at
as at Deletions/ exchange March Amortisation Amortisation Deletions/ exchange Amortisation as at March March
Description April 1, 2011 Additions Adjustment
s
difference 31, 2012 as at April 1, 2011 for the year Adjustment
s
difference March 31, 2012 31, 2012 31, 2011
(a) TANGIBLE FIXED ASSETS
FREEHOLD LAND 329.55 - - 1.93 331.48 - - - - - 331.48 329.55
LEASEHOLD LAND 97.72 1.98 - - 99.70 (11.55) (1.74) - - (13.29) 86.41 86.17
FREEHOLD BUILDINGS 1721.38 438.40 - 6.26 2166.04 (290.79) (77.49) 0.01 (0.57) (368.84) 1797.20 1430.59
FACTORY BUILDINGS 1.51 1.26 - - 2.77 (0.83) (0.20) - - (1.03) 1.74 0.68
LEASEHOLD BUILDINGS 91.08 (0.10) (75.82) 0.94 16.10 (41.50) (2.23) 33.26 (0.43) (10.90) 5.20 49.58
LEASEHOLD IMPROVEMENTS 610.50 229.79 61.74 13.97 916.00 (304.02) (96.74) (19.28) (4.90) (424.94) 491.06 306.48
PLANT AND MACHINERY 32.24 0.12 (0.37) 2.88 34.87 (27.37) (0.05) 0.37 (2.22) (29.27) 5.60 4.87
COMPUTER EQUIPMENT 2440.95 543.30 (108.57) 27.82 2903.50 (1592.64) (422.50) 92.17 (14.66) (1937.63) 965.87 848.31
VEHICLES 28.06 1.80 (3.56) (0.11) 26.19 (15.64) (3.80) 2.71 0.12 (16.61) 9.58 12.42
OFFICE EQUIPMENT 777.19 248.56 16.38 7.11 1049.24 (337.51) (98.74) (0.83) (3.48) (440.56) 608.68 439.68
ELECTRICAL INSTALLATIONS 584.53 133.85 (2.42) 5.57 721.53 (263.82) (65.83) 2.02 (2.79) (330.42) 391.11 320.71
FURNITURE AND FIXTURES 484.04 124.93 (38.25) 5.81 576.53 (377.75) (91.57) 20.25 (0.66) (449.73) 126.80 106.29
TOTAL 7198.75 1723.89 (150.87) 72.18 8843.95 (3263.42) (860.89) 130.68 (29.59) (4023.22) 4820.73 3935.33
Previous year 5928.50 1418.78 (171.31) 22.78 7198.75 (2675.11) (686.21) 112.30 (14.40) (3263.42) 3935.33
(b) INTANGIBLE ASSETS
GOODWILL ON ACQUISITION 235.56 - - 31.71 267.27 (98.54) (20.99) - (14.55) (134.08) 133.19 137.02
ACQUIRED CONTRACT RIGHTS 181.51 - - 24.43 205.94 (75.96) (16.17) - (11.21) (103.34) 102.60 105.55
INTELLECTUAL PROPERTY /
DISTRIBUTION RIGHTS
12.92 - - 0.01 12.93 (11.06) (0.38) - - (11.44) 1.49 1.86
SOFTWARE LICENSES 104.50 11.97 (63.93) 6.20 58.74 (94.00) (12.95) 64.06 (5.53) (48.42) 10.32 10.50
RIGHTS UNDER LICENSING
AGREEMENT 59.00 - - - 59.00 (2.17) (6.56) - - (8.73) 50.27 56.83
TOTAL 593.49 11.97 (63.93) 62.35 603.88 (281.73) (57.05) 64.06 (31.29) (306.01) 297.87 311.76
Previous year 491.01 75.01 3.33 24.14 593.49 (222.36) (49.05) (1.35) (8.97) (281.73) 311.76
(c) CAPITAL WORK- IN-PROGRESS 1446.37 1193.89
7792.24 1735.86 (214.80) 134.53 9447.83 (3545.15) (917.94) 194.74 (60.88) (4329.23) 6564.97 5440.98Grand Total (i) Freehold buildings include ` 2.67 crores (March 31, 2011: ` 2.67 crores) being value of investment in shares of Co-operative Housing Societies and Limited Companies. (ii) Legal formalities relating to conveyance of freehold building having net book value ` 0.23 crore (March 31, 2011: ` 0.23 crore) are pending completion. (iii) Net book value of computer equipment of `20.89 crores (March 31, 2011 `1.82 crores), furniture and fixtures of ` Nil crores (March 31, 2011 `3.00 crores) and lease hold improvements of ` 92.57 crores
( March 31, 2011: ` 30.39 crores) is under finance lease.
TATA CONSULTANCY SERVICES LIMITED Notes forming part of the Consolidated Financial Statements
17
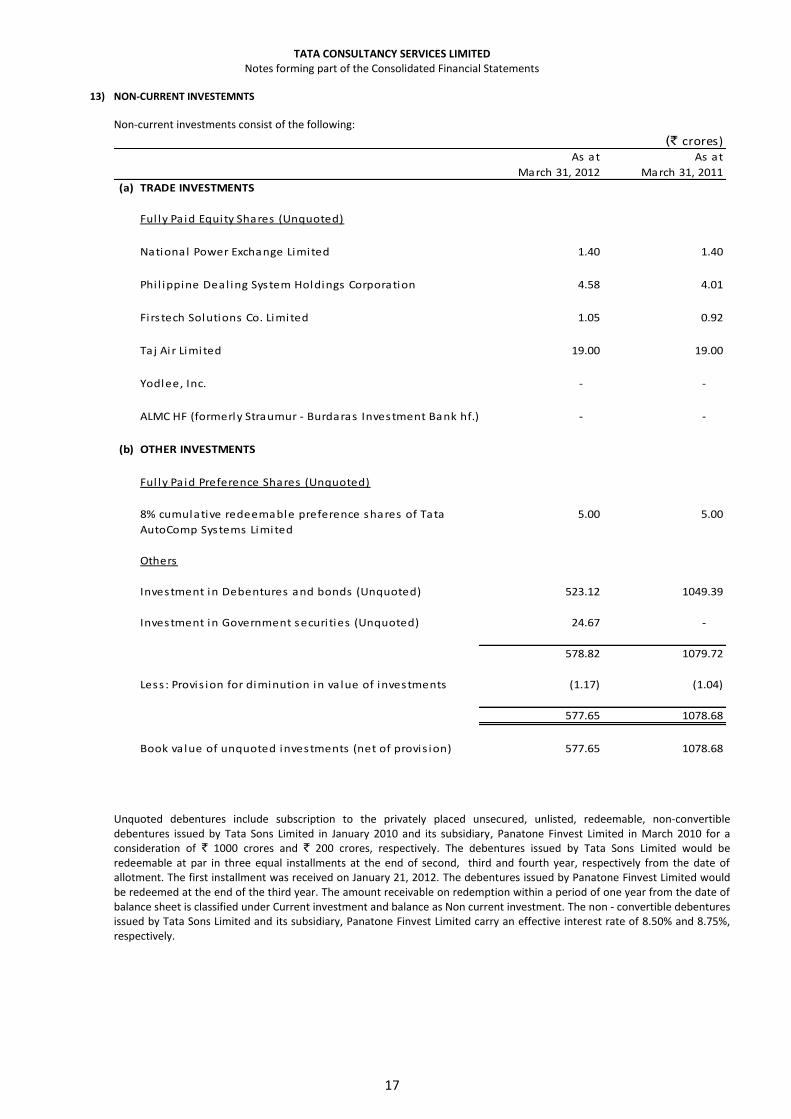
13) NON-CURRENT INVESTEMNTS
Non-current investments consist of the following:
(` crores)As at As at
March 31, 2012 March 31, 2011
(a) TRADE INVESTMENTS
Ful ly Pa id Equity Shares (Unquoted)
National Power Exchange Limited 1.40 1.40
Phi l ippine Deal ing System Holdings Corporation 4.58 4.01
Firs tech Solutions Co. Limited 1.05 0.92
Taj Ai r Limited 19.00 19.00
Yodlee, Inc. - -
ALMC HF (formerly Straumur - Burdaras Investment Bank hf.) - -
(b) OTHER INVESTMENTS
Ful ly Pa id Preference Shares (Unquoted)
8% cumulative redeemable preference shares of Tata
AutoComp Systems Limited
5.00 5.00
Others
Investment in Debentures and bonds (Unquoted) 523.12 1049.39
Investment in Government securi ties (Unquoted) 24.67 -
578.82 1079.72
Less : Provis ion for diminution in va lue of investments (1.17) (1.04)
577.65 1078.68
Book va lue of unquoted investments (net of provis ion) 577.65 1078.68
Unquoted debentures include subscription to the privately placed unsecured, unlisted, redeemable, non-convertible debentures issued by Tata Sons Limited in January 2010 and its subsidiary, Panatone Finvest Limited in March 2010 for a consideration of ` 1000 crores and ` 200 crores, respectively. The debentures issued by Tata Sons Limited would be redeemable at par in three equal installments at the end of second, third and fourth year, respectively from the date of allotment. The first installment was received on January 21, 2012. The debentures issued by Panatone Finvest Limited would be redeemed at the end of the third year. The amount receivable on redemption within a period of one year from the date of balance sheet is classified under Current investment and balance as Non current investment. The non - convertible debentures issued by Tata Sons Limited and its subsidiary, Panatone Finvest Limited carry an effective interest rate of 8.50% and 8.75%, respectively.

TATA CONSULTANCY SERVICES LIMITED Notes forming part of the Consolidated Financial Statements
18
14) LONG-TERM LOANS AND ADVANCES
Long-term loans and advances consist of the following:
(` crores) As at As at
March 31, 2012 March 31, 2011
(a) Secured, Cons idered good
Loans and advances to employees 0.27 0.37
(b) Unsecured, Cons idered good
(i ) Capita l advances 346.09 229.49
(i i ) Securi ty depos its 481.01 461.61
(i i i ) Loans and advances to employees 9.43 11.83
(iv) Loans and advances to related parties 48.36 47.97
(v) Advance tax (including refunds receivable) (net) 1470.06 918.77
(vi ) MAT Credit enti tlement 1465.83 1010.77
(vi i ) Other loans and advances 696.58 272.63
(c) Cons idered doubtful
Other loans and advances 0.45 0.02
Less : Provis ion for doubtful loans and advances (0.45) (0.02)
4517.63 2953.44
15) OTHER NON-CURRENT ASSETS
Other non-current assets consist of the following:
(` crores) As at As at
March 31, 2012 March 31, 2011
(a) Future finance lease receivables 0.96 2.34
Less : Unearned finance income (0.92) (0.17)
0.04 2.17
(b) Interest receivable 131.96 99.94
(c) Other non current assets 2527.65 2677.24
2659.65 2779.35
Other non current assets includes long term bank
depos its
2513.89 2677.24
TATA CONSULTANCY SERVICES LIMITED Notes forming part of the Consolidated Financial Statements
19
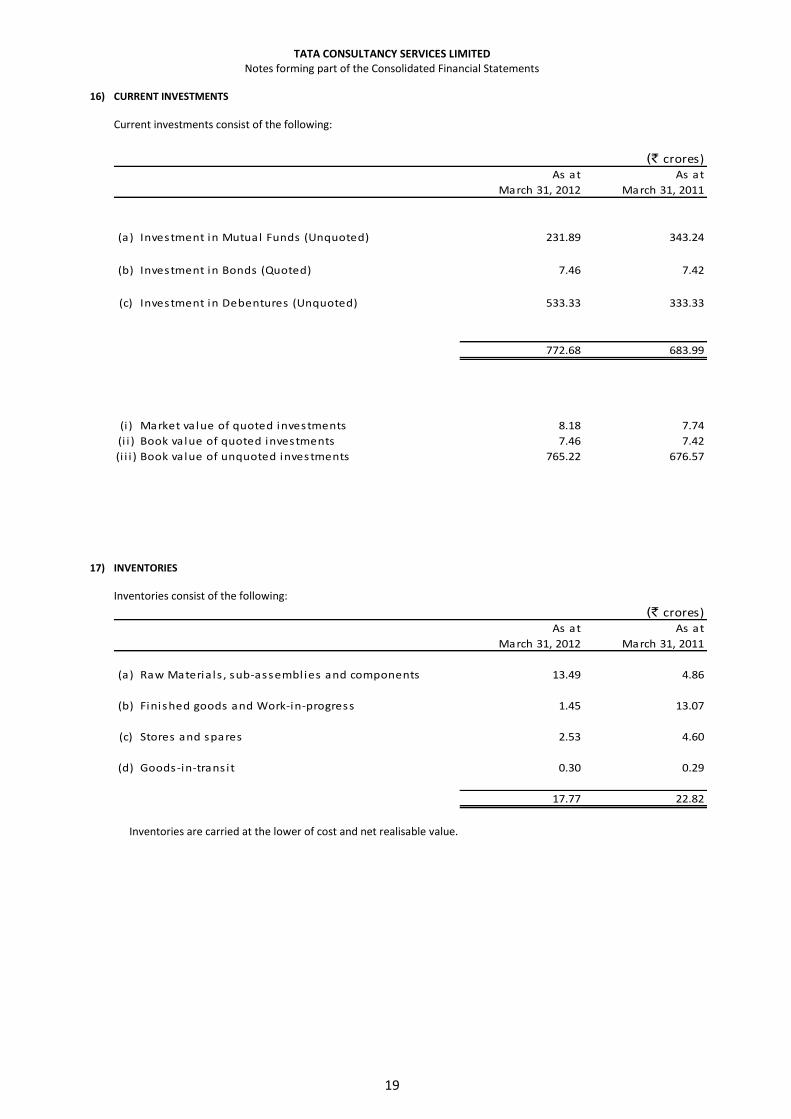
16) CURRENT INVESTMENTS
Current investments consist of the following:
(` crores)
As at As at
March 31, 2012 March 31, 2011
(a) Investment in Mutual Funds (Unquoted) 231.89 343.24
(b) Investment in Bonds (Quoted) 7.46 7.42
(c) Investment in Debentures (Unquoted) 533.33 333.33
772.68 683.99
(i ) Market va lue of quoted investments 8.18 7.74
(i i ) Book va lue of quoted investments 7.46 7.42
(i i i ) Book va lue of unquoted investments 765.22 676.57
17) INVENTORIES
Inventories consist of the following:
(` crores)As at As at
March 31, 2012 March 31, 2011
(a) Raw Materia ls , sub-assembl ies and components 13.49 4.86
(b) Finished goods and Work-in-progress 1.45 13.07
(c) Stores and spares 2.53 4.60
(d) Goods-in-trans i t 0.30 0.29
17.77 22.82
Inventories are carried at the lower of cost and net realisable value.

TATA CONSULTANCY SERVICES LIMITED Notes forming part of the Consolidated Financial Statements
20
18) UNBILLED REVENUE
Unbilled revenue as at March 31, 2012, amounting to ` 2247.76 crores (March 31, 2011 : ` 1348.85 crores) primarily comprises of the revenue recognised in relation to efforts incurred on turnkey contracts priced on a fixed time, fixed price basis.
19) TRADE RECEIVABLES (Unsecured)
Trade receivables consist of the following:
(` crores)As at As at
March 31, 2012 March 31, 2011
(a) Over s ix months from the date they were due for payment
(i ) Cons idered good 1058.64 432.18
(i i ) Cons idered doubtful 193.54 224.16
(b) Others
(i ) Cons idered good 10461.71 7762.79
(i i ) Cons idered doubtful - 9.53
11713.89 8428.66
Less : Provis ion for doubtful receivables (193.54) (233.69)
11520.35 8194.97
20) CASH AND BANK BALANCES
Cash and bank balances consist of the following:
(` crores)As at As at
March 31, 2012 March 31, 2011
(a) Cash and cash equiva lents
(i ) Ba lances with banks
In current accounts 1136.08 672.48
In cash credit accounts 14.27 26.32
In depos it accounts with origina l maturi ty less than 3
months
794.98 785.62
(i i ) Cheques on hand 17.14 54.33
(i i i ) Cash on hand 4.53 2.40
(iv) Remittances in trans i t 16.49 7.44
1983.49 1548.59
(b) Other Bank balances
(i ) Earmarked balances with banks 15.77 26.12
(i i ) Short term bank depos its 4004.21 3126.14
6003.47 4700.85
Balances with banks in current accounts do not include fourteen bank accounts having a balance of ` Nil (March 31, 2011: ` Nil) operated by the Company on behalf of a third party.

TATA CONSULTANCY SERVICES LIMITED Notes forming part of the Consolidated Financial Statements
21
21) SHORT-TERM LOANS AND ADVANCES
Short -term loans and advances consist of the following:
(` crores) As at As at
March 31, 2012 March 31, 2011
(a) Secured, cons idered good
Loans and advances to employees 0.36 0.39
(b) Unsecured, Cons idered good
(i ) Loans and advances to employees 170.89 187.10
(i i ) Loans and advances to related parties 152.43 154.40
(i i i ) Advance tax (including refunds receivable) (net) - 225.92
(iv) MAT Credit Enti tlement 10.29 20.94
(v) Other loans and advances 1921.22 1377.89
(c) Doubtful
(i ) Loans and advances to employees 33.81 27.54
(i i ) Other loans and advances 12.21 10.96
Less : Provis ion for doubtful loans and advances (46.02) (38.50)
2255.19 1966.64
22) OTHER CURRENT ASSETS
Other current assets consist of the following:
(` crores)As at As at
March 31, 2012 March 31, 2011
(a) Interest receivable 430.48 116.59
(b) Future finance lease receivables 1.38 2.09
Less : Unearned finance income (1.24) (0.39)
0.14 1.70
(c) Other Current Assets 27.25 -
457.87 118.29

TATA CONSULTANCY SERVICES LIMITED Notes forming part of the Consolidated Financial Statements
22
23) REVENUE FROM OPERATIONS
Revenue from operations consist of the following:
(` crores)For the year For the year
ended ended
March 31, 2012 March 31, 2011
(a) Information technology and consultancy services 47436.63 36046.13
(b) Sale of equipment and software l icences 1457.45 1278.65
Less : Excise Duty (0.25) (0.27)
48893.83 37324.51
24) OTHER INCOME (Net)
Other Income (net) consist of the following:
(` crores)For the year For the year
ended ended
March 31, 2012 March 31, 2011
(a) Interest income 765.22 497.23
(b) Dividend income 6.41 16.04
(c) Profi t on redemption / sa le of mutual funds and other
current investments (net)
31.76 81.85
(d) Rent 16.94 4.54
(e) Loss on sa le of of fixed assets (net) (0.35) (1.82)
(f) Exchange (loss ) (net) (426.02) (36.23)
(g) Miscel laneous income 34.21 42.39
428.17 604.00
(i ) Dividend income perta ins to:
Dividend from mutual funds / investments 6.01 15.27
Dividends from other long-term investments 0.40 0.77
(i i ) Exchange (loss ) (net) includes :
Loss on foreign exchange forward contracts and
currency option contracts which have been des ignated
as Cash Flow Hedges ( Refer note 40)
(788.95) (24.50)
TATA CONSULTANCY SERVICES LIMITED Notes forming part of the Consolidated Financial Statements
23
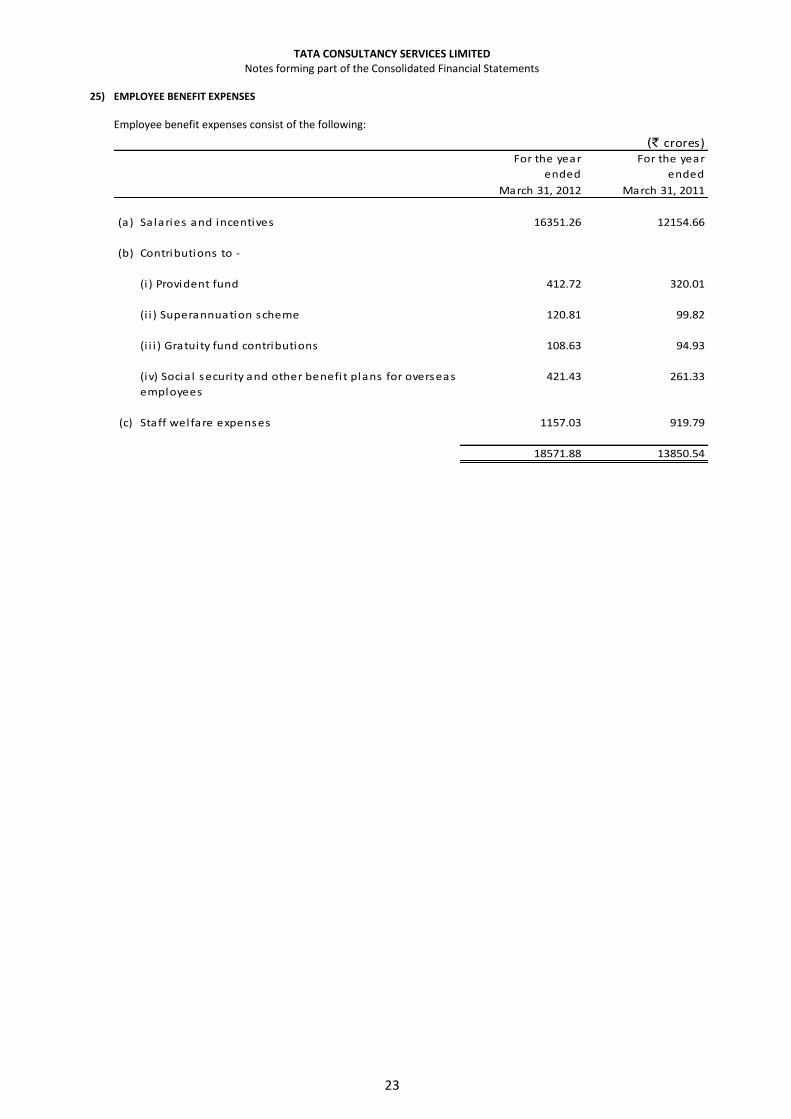
25) EMPLOYEE BENEFIT EXPENSES
Employee benefit expenses consist of the following:
(` crores)For the year For the year
ended ended
March 31, 2012 March 31, 2011
(a) Sa laries and incentives 16351.26 12154.66
(b) Contributions to -
(i ) Provident fund 412.72 320.01
(i i ) Superannuation scheme 120.81 99.82
(i i i ) Gratuity fund contributions 108.63 94.93
(iv) Socia l securi ty and other benefi t plans for overseas
employees
421.43 261.33
(c) Staff wel fare expenses 1157.03 919.79
18571.88 13850.54

TATA CONSULTANCY SERVICES LIMITED Notes forming part of the Consolidated Financial Statements
24
26) OPERATION AND OTHER EXPENSES
Operation and other expenses consist of the following:
(` crores)For the year For the year
ended ended
March 31, 2012 March 31, 2011
(a) Overseas bus iness expenses 6800.54 5497.67
(b) Services rendered by bus iness associates and others 2391.30 1743.65
(c) Software, hardware and materia l costs 1538.71 1100.99
(d) Cost of software l icenses 683.11 524.10
(e) Communication expenses 650.20 549.39
(f) Travel l ing and conveyance expenses 640.75 473.73
(g) Rent 968.22 734.77
(h) Legal and profess ional fees 346.61 222.43
(i ) Repairs and maintenance 325.66 256.69
(j) Electrici ty expenses 366.32 302.08
(k) Bad debts and advances wri tten off 43.14 25.35
(l ) Write back of provis ion for doubtful debts (net) (25.69) (102.30)
(m) Provis ion for doubtful advances 7.42 4.05
(n) Recruitment and tra ining expenses 223.18 210.68
(o) Diminution in va lue of long-term investments - 1.08
(p) Commiss ion and brokerage 40.33 20.37
(q) Printing and s tationery 50.59 45.87
(r) Insurance 32.76 30.98
(s ) Rates and taxes 108.24 79.98
(t) Enterta inment 34.11 25.14
(u) Impairment of goodwi l l (Refer note 43) 21.18 0.71
(v) Other expenses 639.96 548.20
15886.64 12295.61
(i ) Overseas bus iness expenses includes :
Travel expenses 571.29 450.52
Employee a l lowances 6132.11 4955.15
(i i ) Repairs and maintenance includes :
Bui ldings 161.57 126.12
Office and computer equipment 159.58 118.10
27) FINANCE COST
Finance costs consist of the following:
(` crores)
For the year For the year
ended ended
March 31, 2012 March 31, 2011
Interest expense 22.23 26.48
22.23 26.48
28) Current tax is net of the write back of provisions (net) and refunds of ` 6.70 crores for the year ended March 31, 2012
(March 31, 2011: Current tax is net of the effect of additional provision (net) of ` 132.76 crores) in domestic and certain overseas jurisdictions relating to earlier years.

TATA CONSULTANCY SERVICES LIMITED Notes forming part of the Consolidated Financial Statements
25
29) (a) Particulars of subsidiaries and associates:
Name of the Company Country of
Incorporation Percentage of
voting power as at March 31, 2012
Percentage of voting power as at
March 31, 2011
Subsidiaries (held directly) APOnline Limited India 89.00 89.00 C-Edge Technologies Limited India 51.00 51.00 CMC Limited India 51.12 51.12 Diligenta Limited UK 100.00 76.00 MP Online Limited India 89.00 89.00 Tata Consultancy Services Canada Inc. Canada 100.00 100.00 Tata America International Corporation USA 100.00 100.00 Tata Consultancy Services Asia Pacific Pte Ltd. Singapore 100.00 100.00 Tata Consultancy Services Belgium SA Belgium 100.00 100.00 Tata Consultancy Services Deutschland GmbH Germany 100.00 100.00 Tata Consultancy Services Netherlands BV Netherlands 100.00 100.00 Tata Consultancy Services Sverige AB Sweden 100.00 100.00 TCS FNS Pty Limited Australia 100.00 100.00 TCS Iberoamerica SA Uruguay 100.00 100.00 WTI Advanced Technology Limited India 100.00 100.00 Tata Consultancy Services Morocco SARL AU Morocco 100.00 100.00 Tata Consultancy Services (Africa) (PTY) Ltd. South Africa 60.00 60.00 TCS e-Serve Limited India 96.26 96.26 MahaOnline Limited (w.e.f. 28.07.2010) India 74.00 74.00 Retail FullServe Limited (w.e.f. 08.10.2010) (formerly SUPERVALU Services India Private Limited)
India 100.00 100.00
TCS Qatar SPC (w.e.f. 20.12.2011) Qatar 100.00 - Subsidiaries (held indirectly) CMC Americas Inc. USA 100.00 100.00 TCS Financial Solution Beijing Co. Limited (formerly Financial Network Services (Beijing) Co. Ltd.)
China 100.00 100.00
Tata Information Technology (Shanghai) Company Limited
China 100.00 100.00
Tata Consultancy Services (China) Co., Ltd. China 74.63 74.63 TCS Solution Center S.A. Uruguay 100.00 100.00 Tata Consultancy Services Argentina S.A. Argentina 99.00 99.00 Tata Consultancy Services Do Brasil Ltda Brazil 100.00 100.00 Tata Consultancy Services De Mexico S.A., De C.V. Mexico 100.00 100.00 Tata Consultancy Services De Espana S.A. Spain 100.00 100.00 TCS Italia SRL Italy 100.00 100.00 Tata Consultancy Services Japan Ltd. Japan 100.00 100.00 Tata Consultancy Services Malaysia Sdn Bhd Malaysia 100.00 100.00 Tata Consultancy Services Luxembourg S.A.
Capellen (G.D. de Luxembourg)
100.00 100.00
Tata Consultancy Services Portugal Unipessoal Limitada
Portugal 100.00 100.00
TCS Inversiones Chile Limitada Chile 99.99 99.99 Tata Consultancy Services Chile S.A. Chile 100.00 100.00 TATASOLUTION CENTER S.A Ecuador 100.00 100.00 TCS Financial Solutions Australia Holdings Pty Limited Australia 100.00 100.00 TCS Financial Solutions Australia Pty Limited Australia 100.00 100.00 TCS Management Pty Ltd. Australia 100.00 100.00 PT Financial Network Services Indonesia 100.00 100.00 PT Tata Consultancy Services Indonesia Indonesia 100.00 100.00 Tata Consultancy Services Switzerland Ltd. Switzerland 100.00 100.00 Tata Consultancy Services France SAS France 100.00 100.00 Tata Consultancy Services (South Africa) (PTY) Ltd. South Africa 75.00 75.00

TATA CONSULTANCY SERVICES LIMITED Notes forming part of the Consolidated Financial Statements
26
Name of the Company Country of Incorporation
Percentage of voting power as at
March 31, 2012
Percentage of voting power as at
March 31, 2011
Tata Consultancy Services (Thailand) Limited Thailand 100.00 100.00 Tata Consultancy Services (Philippines) Inc. Philippines 100.00 100.00 TCS e-Serve International Limited India 100.00 100.00 TCS e-Serve America, Inc. USA 100.00 100.00 TCS Uruguay S. A. Uruguay 100.00 100.00 MGDC S.C. Uruguay 100.00 100.00 Diligenta 2 Limited (w.e.f. 31.08.2010) (formerly Unisys Insurance Services Limited)
UK 100.00 100.00
MS CJV Investments Corporation (w.e.f. 04.10.2010)
USA 100.00 100.00
CMC eBiz Inc. (w.e.f. 27.01.2011) USA 100.00 100.00 Nippon TCS Solution Centre limited (w.e.f. 03.01.2012) Japan 60.00 - Tata Consultancy Services Osterreich GmbH (w.e.f. 09.03.2012)
Austria 100.00 -
Tata Consultancy Services Danmark ApS (w.e.f. 26.03.2012)
Denmark 100.00 -
Associate National Power Exchange Limited India 19.04 19.04 (Ceased to be an associate w.e.f. 04.09.2010)
(b) The contribution of the subsidiary formed during the year is as under: ` crores
Name of Subsidiary Revenue (post incorporation)
Net Profit/(Loss) (post incorporation)
Net Assets
TCS Qatar SPC 47.98 2.17 4.97 Nippon TCS Solution Centre limited - (0.59) 21.13 Tata Consultancy Services Osterreich GmbH - (0.05) 0.07 Tata Consultancy Services Danmark ApS - (0.08) 36.45
30) Acquisitions /Divestments
a) In terms of the shareholders agreement dated March 23, 2006, Phoenix Group Services Limited (formerly known as Pearl Group Services Limited), exercised their put option and sold equity holding of 24% in Diligenta Limited to the Company at a fixed price of ` 228.00 crores (GBP 30.24 million) in September 2011. Thereby Diligenta Limited became a wholly owned subsidiary of the Company.
b) Tata Consultancy Services Morocco SARL AU, a wholly owned subsidiary, is in the process of being voluntarily
liquidated.
c) On December 20, 2011, the Company has subscribed to 100% equity share capital of Tata Consultancy Services Qatar SPC.
d) On January 24, 2012, the Company through its wholly owned subsidiary, TCS Japan subscribed to 60 percent
share capital of Nippon TCS Solution Centre Limited.
e) On March 9, 2012, the Company through its wholly owned subsidiary, Tata Consultancy Services Netherlands BV subscribed to 100 percent share capital of Tata Consultancy Services Osterreich GmbH.
f) On March 26, 2012, the Company through its wholly owned subsidiary, Tata Consultancy Services Netherlands BV subscribed to 100 percent share capital of Tata Consultancy Services Danmark ApS.
31) The Company has given undertakings to the Government of Maharashtra not to divest its shareholding in MahaOnline Limited except to an affiliate.

TATA CONSULTANCY SERVICES LIMITED Notes forming part of the Consolidated Financial Statements
27
32) Employee retirement benefits
a) Defined contribution plans
The Company and its subsidiaries make Provident Fund and Superannuation Fund contributions to defined contribution retirement benefit plans for qualifying employees. Under the schemes, the Company and its subsidiaries are required to contribute a specified percentage of the payroll costs to fund the benefits. The contributions as specified under the law are paid to the provident fund set up as a trust by the company. The company is generally liable for annual contribution and any shortfall in the fund assets based on the government specified minimum rate of return and recognizes such contribution and shortfall if any as an expense in the year it is incurred. The Group recognised ` 412.72 crores (March 31, 2011: ` 320.01 crores) for provident fund contributions and ` 120.81 crores (March 31, 2011: ` 99.82 crores) for superannuation contributions in the statement of profit and loss. The contributions payable to these plans by the Group are at rates specified in the rules of the schemes.
The Group has contributed ` 120.69 crores (March 31, 2011: ` 69.09 crores) towards foreign defined contribution plans.
b) Defined benefit plans
In accordance with Indian law, the Company and its subsidiaries in India provide for gratuity, post retirement medical benefit and pension plan, a defined benefit retirement plan covering eligible employees in India. The plan provides for a lump sum payment to vested employees at retirement, death while in employment or on termination of employment in an amount equivalent to 15 to 30 days salary payable for each completed year of service. Vesting occurs upon completion of five years of service. The measurement date used for determining retirement benefits for gratuity is March 31. Certain overseas subsidiaries of the Company also provide for retirement benefit plans in accordance with the local laws.
The present value of the defined benefit obligation and the related current service cost were measured using the Projected Unit Credit Method, with actuarial valuation being carried out at each balance sheet date.
The following table set out the funded status of the retirement benefit plans and the amounts recognised in the financial statements:
(` Crores)
Funded reti rement benefi ts Indian as at Foreign as at Consol idated as at
March 31,2012 March 31,2012 March 31,2012
i) Change in benefit obligations:
Project benefi t obl igation, beginning of the year 602.65 222.22 824.87
497.21 184.10 681.31
Service cost 101.63 24.35 125.98
90.95 18.33 109.28
Interest cost 54.68 10.12 64.80
40.98 7.78 48.76
Acquis i tions - - -
0.72 - 0.72
Actuaria l (ga in)/loss 1.76 (2.35) (0.59)
5.56 (5.49) 0.07
Plan Participants ’ contributions - 6.74 6.74
- 6.00 6.00
Exchange loss/(ga in) - 32.51 32.51
- 19.86 19.86
Past service cost - - -
4.13 0.37 4.50
Benefi ts pa id (36.05) (19.92) (55.97)
(36.90) (8.72) (45.62)
Projected benefit obligation, end of the year 724.67 273.67 998.34
602.65 222.23 824.88
TATA CONSULTANCY SERVICES LIMITED Notes forming part of the Consolidated Financial Statements
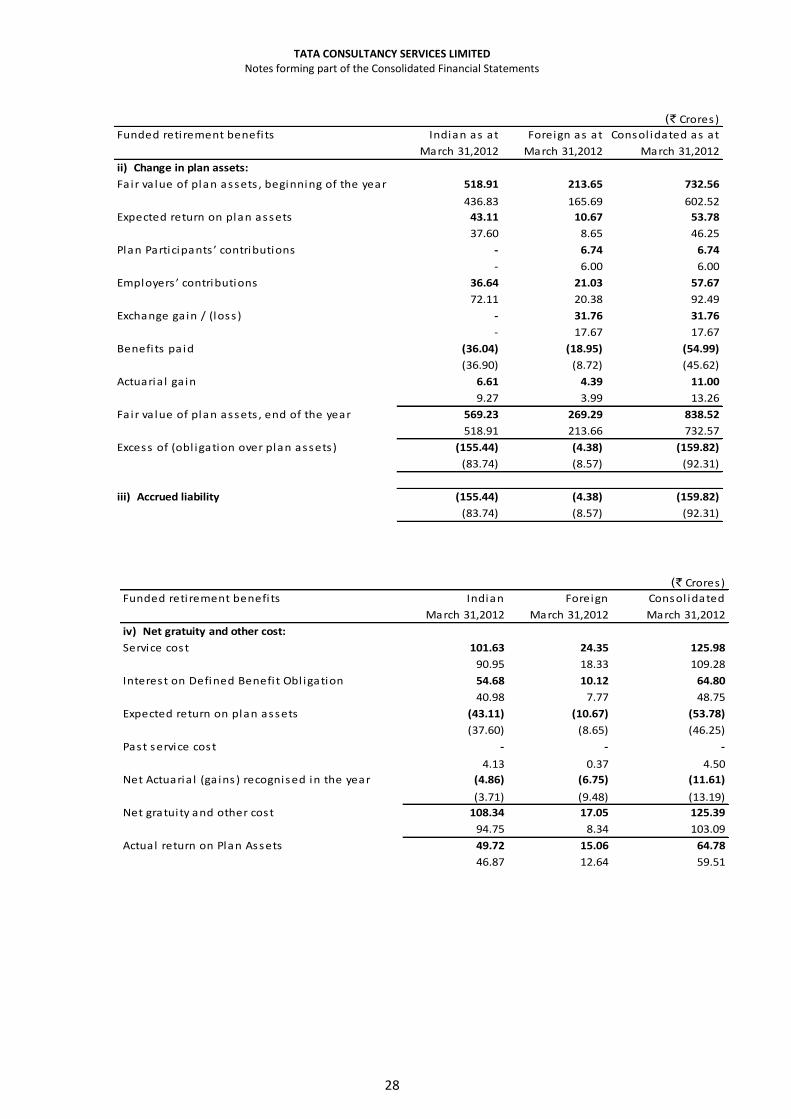
28
(` Crores)
Funded reti rement benefi ts Indian as at Foreign as at Consol idated as at
March 31,2012 March 31,2012 March 31,2012
ii) Change in plan assets:
Fair va lue of plan assets , beginning of the year 518.91 213.65 732.56
436.83 165.69 602.52
Expected return on plan assets 43.11 10.67 53.78
37.60 8.65 46.25
Plan Participants ’ contributions - 6.74 6.74
- 6.00 6.00
Employers ’ contributions 36.64 21.03 57.67
72.11 20.38 92.49
Exchange ga in / (loss ) - 31.76 31.76
- 17.67 17.67
Benefi ts pa id (36.04) (18.95) (54.99)
(36.90) (8.72) (45.62)
Actuaria l ga in 6.61 4.39 11.00
9.27 3.99 13.26
Fa ir va lue of plan assets , end of the year 569.23 269.29 838.52
518.91 213.66 732.57
Excess of (obl igation over plan assets) (155.44) (4.38) (159.82)
(83.74) (8.57) (92.31)
iii) Accrued liability (155.44) (4.38) (159.82)
(83.74) (8.57) (92.31)
(` Crores)
Funded reti rement benefi ts Indian Foreign Consol idated
March 31,2012 March 31,2012 March 31,2012
iv) Net gratuity and other cost:
Service cost 101.63 24.35 125.98
90.95 18.33 109.28
Interest on Defined Benefi t Obl igation 54.68 10.12 64.80
40.98 7.77 48.75
Expected return on plan assets (43.11) (10.67) (53.78)
(37.60) (8.65) (46.25)
Past service cost - - -
4.13 0.37 4.50
Net Actuaria l (ga ins ) recognised in the year (4.86) (6.75) (11.61)
(3.71) (9.48) (13.19)
Net gratuity and other cost 108.34 17.05 125.39
94.75 8.34 103.09
Actual return on Plan Assets 49.72 15.06 64.78
46.87 12.64 59.51
TATA CONSULTANCY SERVICES LIMITED Notes forming part of the Consolidated Financial Statements
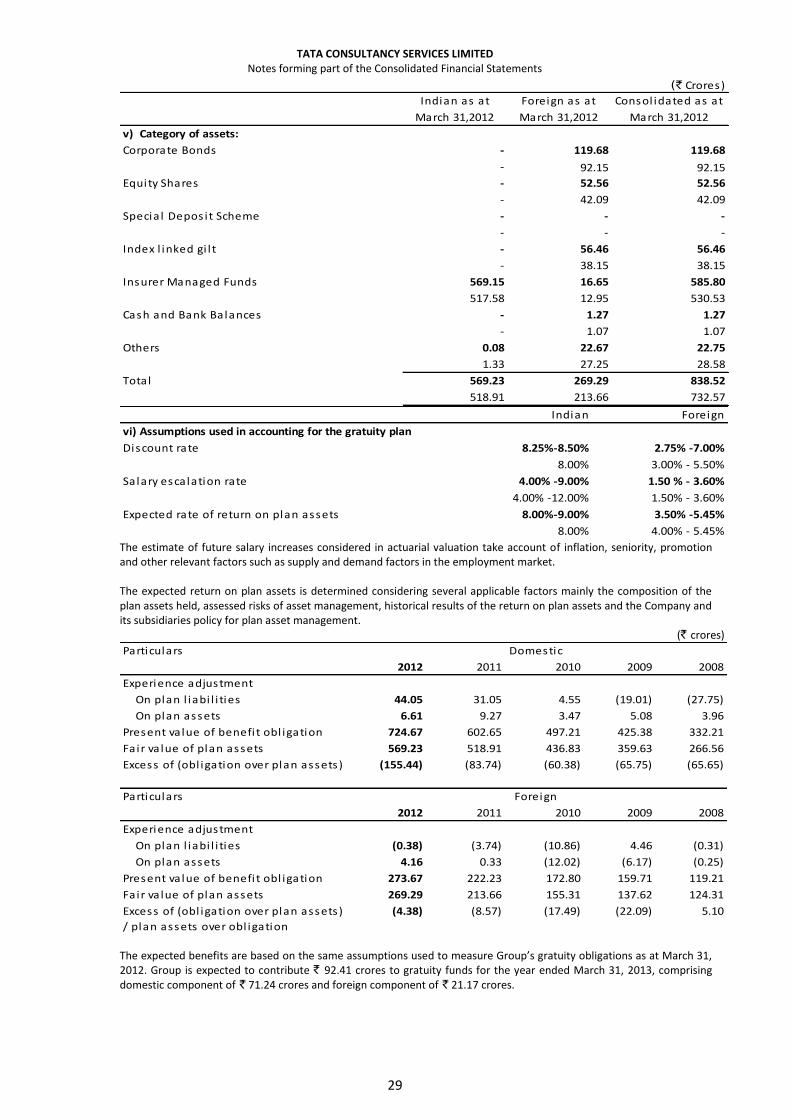
29
(` Crores)
Indian as at Foreign as at Consol idated as at
March 31,2012 March 31,2012 March 31,2012
v) Category of assets:
Corporate Bonds - 119.68 119.68
- 92.15 92.15
Equity Shares - 52.56 52.56
- 42.09 42.09
Specia l Depos it Scheme - - -
- - -
Index l inked gi l t - 56.46 56.46
- 38.15 38.15
Insurer Managed Funds 569.15 16.65 585.80
517.58 12.95 530.53
Cash and Bank Balances - 1.27 1.27
- 1.07 1.07
Others 0.08 22.67 22.75
1.33 27.25 28.58
Total 569.23 269.29 838.52
518.91 213.66 732.57 Indian Foreign
vi) Assumptions used in accounting for the gratuity plan
Discount rate 8.25%-8.50% 2.75% -7.00%
8.00% 3.00% - 5.50%
Salary escalation rate 4.00% -9.00% 1.50 % - 3.60%
4.00% -12.00% 1.50% - 3.60%
Expected rate of return on plan assets 8.00%-9.00% 3.50% -5.45%
8.00% 4.00% - 5.45% The estimate of future salary increases considered in actuarial valuation take account of inflation, seniority, promotion and other relevant factors such as supply and demand factors in the employment market. The expected return on plan assets is determined considering several applicable factors mainly the composition of the plan assets held, assessed risks of asset management, historical results of the return on plan assets and the Company and its subsidiaries policy for plan asset management.
(` crores)
Particulars
2012 2011 2010 2009 2008
Experience adjustment
On plan l iabi l i ties 44.05 31.05 4.55 (19.01) (27.75)
On plan assets 6.61 9.27 3.47 5.08 3.96
Present va lue of benefi t obl igation 724.67 602.65 497.21 425.38 332.21
Fair va lue of plan assets 569.23 518.91 436.83 359.63 266.56
Excess of (obl igation over plan assets ) (155.44) (83.74) (60.38) (65.75) (65.65)
Domestic
Particulars
2012 2011 2010 2009 2008
Experience adjustment
On plan l iabi l i ties (0.38) (3.74) (10.86) 4.46 (0.31)
On plan assets 4.16 0.33 (12.02) (6.17) (0.25)
Present va lue of benefi t obl igation 273.67 222.23 172.80 159.71 119.21
Fair va lue of plan assets 269.29 213.66 155.31 137.62 124.31
Excess of (obl igation over plan assets )
/ plan assets over obl igation
(4.38) (8.57) (17.49) (22.09) 5.10
Foreign
The expected benefits are based on the same assumptions used to measure Group’s gratuity obligations as at March 31, 2012. Group is expected to contribute ` 92.41 crores to gratuity funds for the year ended March 31, 2013, comprising domestic component of ` 71.24 crores and foreign component of ` 21.17 crores.

TATA CONSULTANCY SERVICES LIMITED Notes forming part of the Consolidated Financial Statements
30
33) Segment Reporting
The Group has identified business segments (industry practice) as its primary segment and geographic segments as its secondary segment. Business segments are primarily financial services comprising customers providing banking, finance and insurance services, manufacturing companies, companies in retail and consumer packaged goods industries, companies in telecommunication, media and entertainment and others such as energy, resources and utilities, Hi-Tech industry practice, life science and healthcare, s-Governance, travel, transportation and hospitality, products, etc. Revenues and expenses directly attributable to segments are reported under each reportable segment. Expenses which are not directly identifiable to each reporting segment have been allocated on the basis of associated revenues of the segment and manpower efforts. All other expenses which are not attributable or allocable to segments have been disclosed as unallocable expenses. Assets and liabilities that are directly attributable or allocable to segments are disclosed under each reportable segment. All other assets and liabilities are disclosed as unallocable. Fixed assets that are used interchangeably among segments are not allocated to primary and secondary segments. Geographical revenues are allocated based on the location of the customer. Geographic segments of the Group are Americas (including Canada and South American countries), Europe, India and Others.
Year ended March 31, 2012
Banking,
Financial
Services and
Insurance
Manufacturing
Retail and
Consumer
Packaged
Goods
Telecom,
Media and
Entertainment
Others Total
Revenue 21062.22 3800.54 5954.47 6204.69 11871.91 48893.83
16526.60 2751.76 4105.05 5292.45 8648.65 37324.51
Segment result 6493.07 985.89 1742.14 1889.57 3202.81 14313.48
5170.84 704.30 1071.68 1843.78 2273.49 11064.09
Unal locable expenses
(net) 818.34
647.47
Operating income 13495.14
10416.62
Other income (net) 428.17
604.00
Profi t before tax 13923.31
11020.62
Tax expense 3399.86
1830.83
Profi t before Minori ty
Interest and share of
loss of associate 10523.45
9189.79
Minori ty Interest 109.96
121.45
Share of loss of
associate -
0.30
Net profi t for the year 10413.49
9068.04
(` crores)
Particulars Business Segments
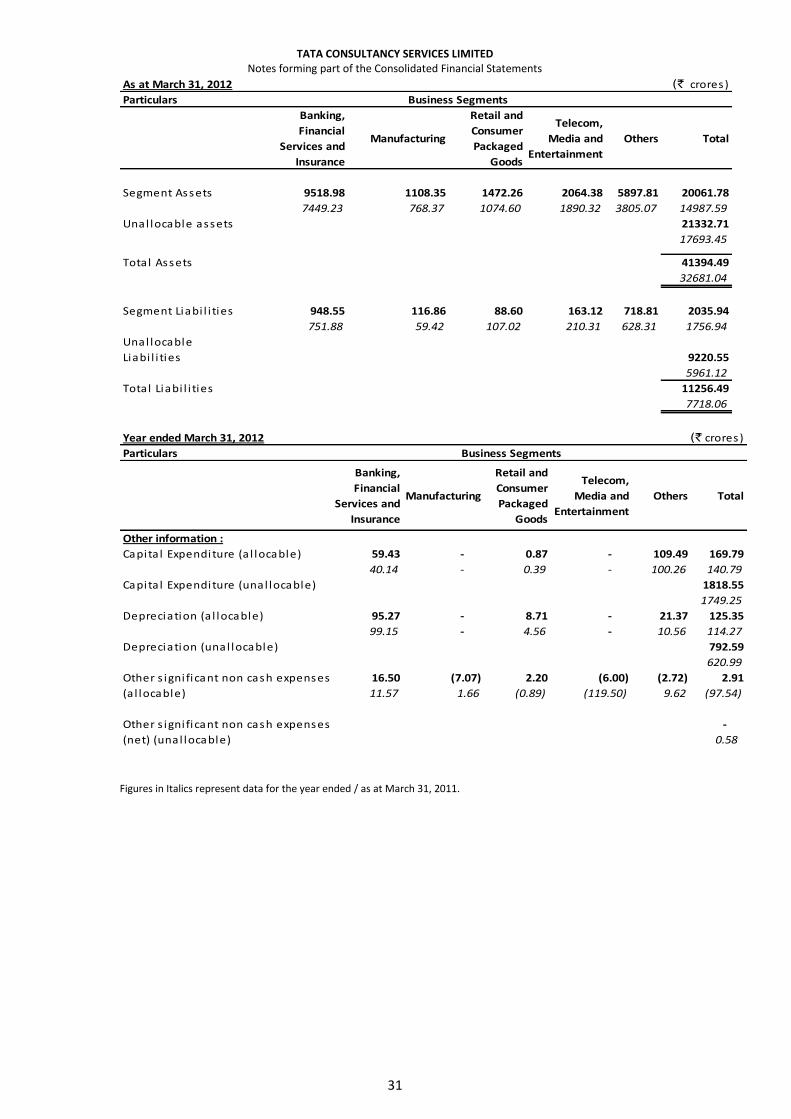
TATA CONSULTANCY SERVICES LIMITED Notes forming part of the Consolidated Financial Statements
31
As at March 31, 2012
Particulars
Banking,
Financial
Services and
Insurance
Manufacturing
Retail and
Consumer
Packaged
Goods
Telecom,
Media and
Entertainment
Others Total
Segment Assets 9518.98 1108.35 1472.26 2064.38 5897.81 20061.78
7449.23 768.37 1074.60 1890.32 3805.07 14987.59
Unal locable assets 21332.71
17693.45
Total Assets 41394.49
32681.04
Segment Liabi l i ties 948.55 116.86 88.60 163.12 718.81 2035.94
751.88 59.42 107.02 210.31 628.31 1756.94
Unal locable
Liabi l i ties 9220.55
5961.12
Total Liabi l i ties 11256.49
7718.06
Business Segments
(` crores)
Year ended March 31, 2012 (` crores)
Particulars
Banking,
Financial
Services and
Insurance
Manufacturing
Retail and
Consumer
Packaged
Goods
Telecom,
Media and
Entertainment
Others Total
Other information :
Capita l Expenditure (a l locable) 59.43 - 0.87 - 109.49 169.79
40.14 - 0.39 - 100.26 140.79
Capita l Expenditure (unal locable) 1818.55
1749.25
Depreciation (a l locable) 95.27 - 8.71 - 21.37 125.35
99.15 - 4.56 - 10.56 114.27
Depreciation (unal locable) 792.59
620.99
Other s igni ficant non cash expenses 16.50 (7.07) 2.20 (6.00) (2.72) 2.91
(a l locable) 11.57 1.66 (0.89) (119.50) 9.62 (97.54)
Other s igni ficant non cash expenses -
(net) (unal locable) 0.58
Business Segments
Figures in Italics represent data for the year ended / as at March 31, 2011.

TATA CONSULTANCY SERVICES LIMITED Notes forming part of the Consolidated Financial Statements
32
34) Obligation towards operating lease
(` Crores)
Non-cancel lable operating lease obl igation As at As at
March 31, 2012 March 31, 2011
Not later than one year 547.08 488.46
Later than one year but not later than five years 1376.86 1395.99
Later than five years 898.92 1012.22
Total 2822.86 2896.67
Rental expenses of ` 475.70 crores (March 31, 2011: ` 432.04 crores) in respect of obligation under non-cancellable operating leases have been charged to the statement of profit and loss. Further, a sum of ` 492.52 crores (March 31, 2011: ` 302.73 crores) has been charged to the profit and loss account in respect of cancellable operating leases.
35) Finance Lease
a) Company as lessor
(` Crores)
Particulars As at As at
March 31, 2012 March 31, 2011
(i ) Tota l gross investment for the year 2.34 4.43
Not later than one year 1.38 2.09
Later than one year but not later than five years 0.96 2.34
Later than five years - -
(i i ) Present va lue of Minimum Lease Payments receivable 0.18 3.87
Not later than one year 0.14 1.70
Later than one year but not later than five years 0.04 2.17
Later than five years - -
(i i i ) Unearned Finance Income 2.16 0.56
b) Company as lessee
(` Crores)
Obl igations towards finance leases As at As at
March 31, 2012 March 31, 2011
Assets acquired under finance lease
i ) Minimum Lease Payments :
Not later than one year 23.66 10.13
Later than one year but not later than five years 106.27 38.90
Later than five years 80.40 10.92
Total 210.33 59.95
i i ) Present Value of Minimum Lease Payments :
Not later than one year 9.05 4.28
Later than one year but not later than five years 60.34 23.61
Later than five years 52.27 10.09
Total 121.66 37.98
i i i ) Finance charges 88.67 21.97 The finance lease arrangements are renewable at the option of the lessee.

TATA CONSULTANCY SERVICES LIMITED Notes forming part of the Consolidated Financial Statements
33
36) Receivables under sub leases
(` Crores)
Sub lease receivables As at As at
March 31, 2012 March 31, 2011
Not later than one year 12.39 1.30
Later than one year but not later than five years 45.83 0.90
Later than five years 8.56 -
Total 66.78 2.20
The total amount recognised in the statement of profit and loss for the year ended March 31, 2012 is ` 16.43 crores (March 31, 2011: ` 2.86 crores).
37) Contingent Liabilities (` crores)
Particulars As at As at March 31, 2012 March 31,2011
Claims against the Group not acknowledged as debt 113.16 82.83
Income Taxes (See note (a) below) 1714.41 842.04
Indirect Taxes 157.39 144.68
Guarantees given by the Group (See note (b) below) 681.02 873.42
Unexpired Letters of Credit 0.09 1.57
Other Contingencies 0.10 0.94
Notes: a) TCS e-Serve Limited has a contingent liability of ` 330.07 crores (March 31, 2011: ` 236.41 crores) in respect of Income Tax
matters in dispute. TCS e-Serve Limited has net advance taxes aggregating to ` 321.85 crores against disputed amounts for the various assessment years. The Company is entitled to an indemnification from the seller, of the above referred contingent claims on TCS e-Serve Limited, and would be required to refund to the seller, amounts equal to the monies received by TCS e-Serve Limited, on all such claims, as an adjustment to the purchase price consideration.
b) The Group has provided guarantees aggregating to ` 659.72 crores (GBP 81.00 million) (March 31, 2011: ` 814.69 crores)
(GBP 99.10 million) to third parties on behalf of its subsidiary Diligenta Limited. The Group does not expect any outflow of resources in respect of the above.
c) The Group has examined the social security and tax aspects of contracts with legal entities which provide services to an
overseas subsidiary and, based on legal opinion, concludes that the subsidiary is in compliance with the related statutory requirements.
38) Capital and other commitments
i) Estimated amount of contracts remaining to be executed on capital account and not provided for (net of advances) `
1792.68 crores (March 31, 2011: ` 1208.27 crores).
ii) The Company has a purchase commitment towards India Innovation Fund for the uncalled amount of balance ` 80,963.86 per unit of 1000 units aggregating to ` 8.10 crores (March 31, 2011: ` 9.00 crores).
iii) The Company has a purchase commitment towards KOOH Sports Private Ltd. for the balance amount of ` 2.80 crores against 20 lakh shares of ` 15 per share.

TATA CONSULTANCY SERVICES LIMITED Notes forming part of the Consolidated Financial Statements
34
39) Earnings per share
The following reflects the profit and share data used in the basic and diluted EPS computations:
For the year For the year
ended ended
March 31, 2012 March 31, 2011
Net profi t for the year 10413.49 9068.04
Less : Dividend on preference shares (including dividend tax) 25.57 12.78
Amount avai lable for Equity shareholders 10387.92 9055.26
Weighted average number of shares 195,72,20,996 195,72,20,996
Earning per share bas ic and di luted (`) 53.07 46.27
Face value per Equity share (`) 1 1
40) Derivative Financial Instruments
The Company and its subsidiaries, in accordance with its risk management policies and procedures, enter into foreign currency forward contracts and currency option contracts to manage its exposure in foreign exchange rates. The counter party is generally a bank. These contracts are for a period between one day and eight years.
The Group has following outstanding derivative instruments as at March 31, 2012: i) The following are outstanding foreign exchange forward contracts, which have been designated as Cash Flow Hedges as at:
March 31, 2012 March 31, 2011
Foreign Currency No. of
Contracts
Notional amount of
Forward contracts (million)
Fair Value (` crores)
No. of Contracts
Notional amount of
Forward contracts (million)
Fair Value (` crores)
U.S. Dollar 44 288.01 (98.19) 52 207.82 34.70
Sterling Pound 26 9.38 (5.70) 38 27.70 1.71
Australian Dollar 44 11.14 (7.40) 19 9.50 (2.27) ii) The following are outstanding Currency Option contracts, which have been designated as Cash Flow Hedges, as at:
March 31, 2012 March 31, 2011
Foreign Currency No. of
Contracts
Notional amount of
Currency Option
contracts (million)
Fair Value (` crores)
No. of Contracts
Notional amount of
Currency Option
contracts (million)
Fair Value (` crores)
U.S.Dollar 81 2185.00 29.56 58 349.38 (16.79)
Sterling Pound 33 217.50 14.66 9 54.00 8.63
Euro 21 210.00 18.64 21 149.00 1.06
Australian dollar 6 30.00 3.34 - - -
Net loss on derivative instruments of ` 117.02 crores recognised in Hedging Reserve as of March 31, 2012, is expected to be reclassified to the statement of profit and loss by March 31, 2013.

TATA CONSULTANCY SERVICES LIMITED Notes forming part of the Consolidated Financial Statements
35
The movement in Hedging Reserve during the year ended March 31, 2012, for derivatives designated as Cash Flow Hedges is as follows:
(` crores)
Year ended March 31, 2012
Year ended March 31, 2011
Balance at the beginning of the year 62.73 (6.07) Changes in the fair value of effective portion of discontinued/ matured (802.80) 0.12 cash flow hedges during the year Losses / (gains) transferred to statement of profit and loss on occurrence of forecasted hedge transaction
755.62 (57.38)
Change in the fair value of effective portion of outstanding cash flow hedges
(154.80) 125.61
Amount transferred to minority interest during the year 6.16 0.45
Balance at the end of the year (133.09) 62.73
In addition to the above Cash Flow Hedges, the Group has outstanding foreign exchange forward contracts and currency option contracts with notional amount aggregating ` 8506.37 crores (March 31, 2011: ` 4649.67 crores) whose fair value showed a loss of ` 95.43 crores as at March 31, 2012 (March 31, 2011 : gain of ` 29.44 crores).
Exchange loss of ` 213.44 crores (March 31, 2011 : exchange gain of ` 1.86. crores) on foreign exchange forward contracts and currency option contracts for the year ended March 31, 2012, have been recognised in the statement of profit and loss.
41) Increase in payables in respect of purchase of fixed assets amounting to ` 10.80 crores for the year ended March 31, 2012
(Increase in March 31, 2011: ` 52.83 crores) have been considered as non-cash transactions in the cash flow statement.
42) Research and development expenditure aggregating to ` 132.02 crores (March 31, 2011: ` 106.13 crores) was incurred during the year.
43) Operation and Other expenses include an impairment loss on goodwill on consolidation of ` 21.18 crores due to the deterioration of the financial position and financial performance of a subsidiary in the banking, financial services and insurance segment.
44) Trade payables include payable to Micro, medium and small enterprises ` 1.30 crores (March 31, 2011: ` 7.42 crores).
45) Figures pertaining to the subsidiary companies have been reclassified wherever necessary to bring them in line with the Group financial statements.
46) These financial statements have been prepared in the format prescribed by the Revised Schedule VI to the Companies Act 1956.
Previous period figures have been recast / restated to confirm to the classification of the current period.