td regional housing market report
DESCRIPTION
As the year draws to a close, we conclude that the Canadian housing market put forth a respectable showing. Annual price gains are estimated at 7.5% in 2011 and sales’ growth ought to come in positive as well, but at a much more modest pace of 2.2%.TRANSCRIPT

SPECIAL REPORTTD Economics
Homebuyers came out in the early part of 2011 to take advantage of record-low interest rates and to beat out changes to new insured mortgage financing rules. With Canadians bringing forward their purchases and national job gains tapering off since the autumn, the past few months have recorded more modest price and sales gains. In all, 2011 put forth a very respectable showing with price appreciation clocking in at an estimated 7.5% and sales growth also positive, but at a more modest 2.2%. At around 190,000 units, housing starts also continued to come in above long-run averages.
Looking ahead, we anticipate a tug-of-war action to take hold in the Canadian real estate market. At one of the rope is the magnetism of low interest rates; at the other end are subdued prospects for economic, income and employment growth. Ultimately, we expect the economic side of the equation to win out over the near-term. In particular, the first half of 2012 is likely to be characterized by ongoing confidence-sapping events in Europe, global financial turbulence and slowing world economic growth. While housing activity is expected to do somewhat better in the second half of the year, as external clouds start to dissipate, rising Canadian interest rates in 2013 should erect the next road block in the way of housing markets. Overall, we expect sales to record annual average declines of 2.4% and 3.5%
REGIONAL HOUSING MARKETS: A YEAR IN REVIEW AND A LOOK AHEADGradual unwinding of the over-valuation in house prices across the country
December 22, 2011
Sonya Gulati, Economist, 416-982-8063
Highlights
• Astheyeardrawstoaclose,weconcludethattheCanadianhousingmarketputfortharespect-ableshowing.Annualpricegainsareestimatedat7.5%in2011andsales’growthoughttocomeinpositiveaswell,butatamuchmoremodestpaceof2.2%.
• Behindtheheadlinefigure,wehaveseengains inpricesandsalesactivitydecelerate inrecentmonths.Someoftheunderlyingfactorsincludetighterinsuredmortgagefinancingrulesandweak-enedconfidencerelatedtothestabilityoftheeconomicrecovery.Helpingcushiontheimpactofthesenegativeforceshasbeenthepersistenceoflowmortgagerates.
• WebelievethattheaverageCanadianhomepriceisover-valuedbyroughly10%.Metricslikepricetoincome,pricetorent,andaffordabilityallsupportthisconclusion.Weexpectthatthepriceexcesswillgraduallyunwindoverthenexttwoyearsinlightofasofteninginemploymentconditionsin2012followedbyhigherinterestratesin2013.
• Incontrasttotheresalemarket,startscontinuetocomeinwellaboveexpectations.Thestrengthwitnessedover the last fewyearshasbeendrivenexclusivelyby themulti-residential category.Consistentwithweakerresalemarkets,weexpectnewstartstotrendtoward170,000-180,000unitsinthe2012-13period.
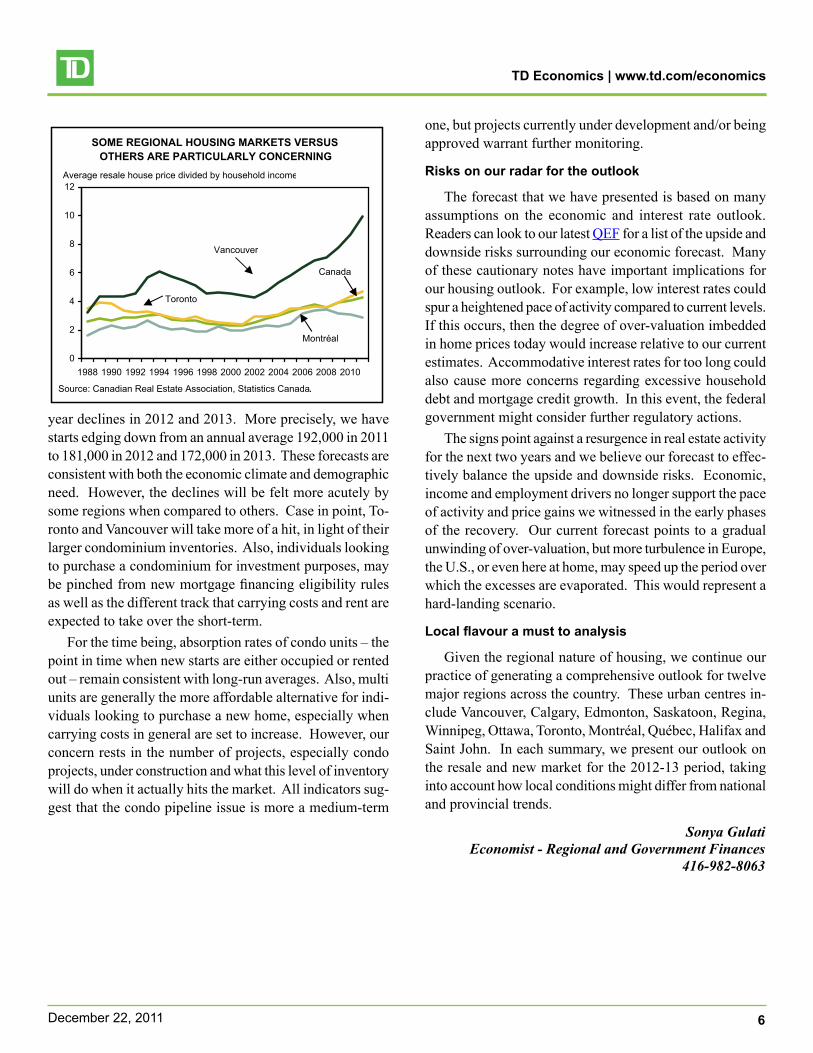
• Inadditiontoournationalperspective,weprovideanin-depthforecastoftwelvemajormarkets.Whilenourbancentrewillbeimmunetothemacroeconomicandinterestrateheadwinds,CalgaryandEdmontonarelikelytodobetterthantherest.Bycontrast,alarger-than-averagepriceandsalescorrectionlookstobeinstoreforbothTorontoandVancouver.
TD Economics | www.td.com/economics
2December22,2011
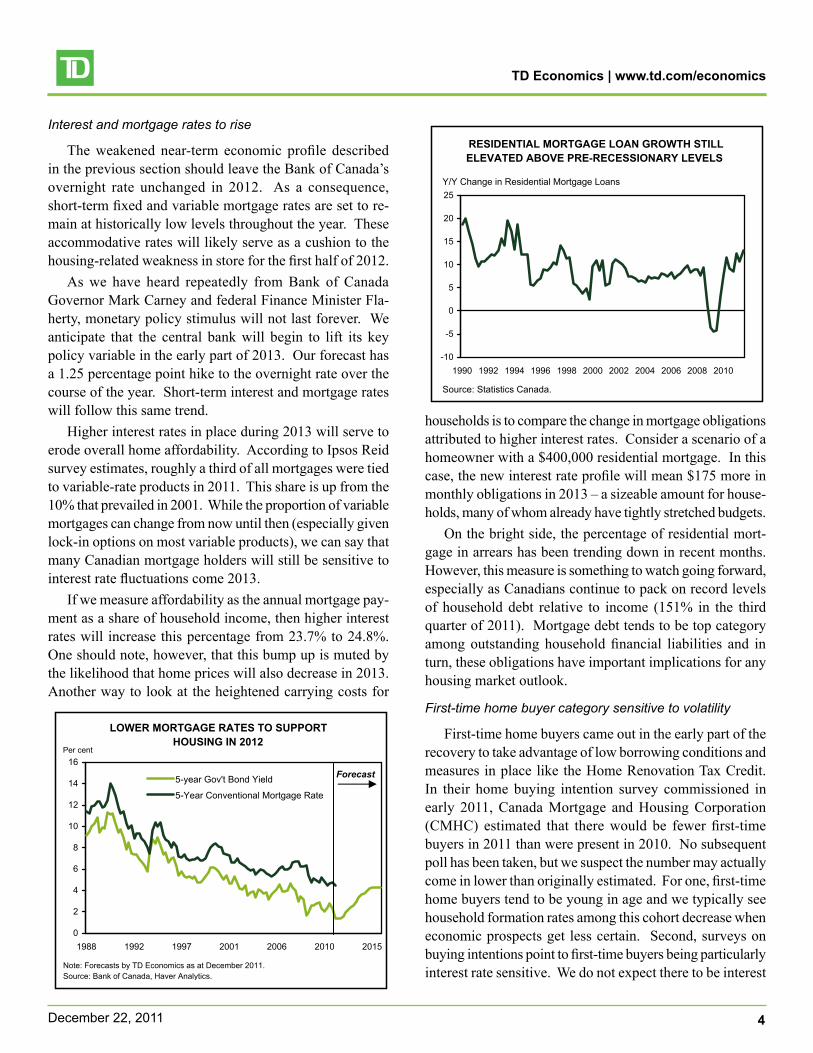
in 2012 and 2013, respectively. Prices are poised to suffer a similar fate – annual average declines of 1.9% in 2012 and 3.6% in 2013. Starts should dip to an average 170,000 to 180,000 units in 2012-13. Collectively, these adjustments will gradually erase the over-valuation in the marketplace.
While no urban centre will be immune from economic volatility and higher prevailing interest rates, some re-gions are expected to do better than others over the next two years. Among the twelve major markets profiled in this report, Calgary and Edmonton ought to lead the pack. Solid economic fundamentals and the absence of a recent run-up in prices support our call. Toronto and Vancouver do not appear to be as lucky – we have them experiencing a greater-than-average correction in both sales and prices over the next two years.
Canada’s housing market defies the odds in 2011
In 2011, the national housing market turned in a respect-able performance despite some notable hurdles. In the spring, the federal government responded to growing signs of excessive household indebtedness by announcing a fur-ther tightening in the rules surrounding insured mortgages. In order to beat this announced change, we suspect that many homebuyers brought forward their purchases earlier in the year. In the summer, a combination of concerns about European sovereign debt, a U.S. government credit rating downgrade and worries about the global recovery led to increased uncertainty. Businesses have responded by re-ducing hiring in Canada since the autumn. Yet, home sales are headed for their seventh gain in ten years; prices are on tap to see their ninth gain in ten years. Still, a closer look at the data shows that activity in most of Canada’s major
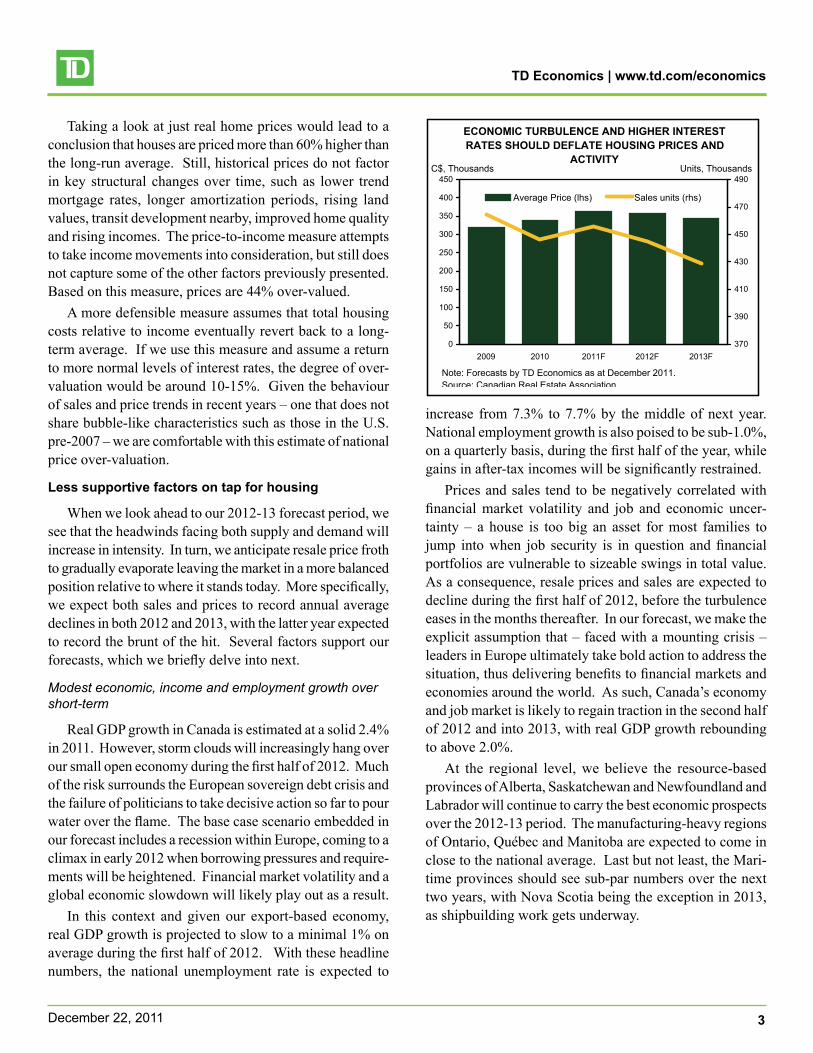
markets has moved past its peak and has since landed softly. Average residential prices have also been skewed by out-sized strength in Vancouver and to a lesser extent, Toronto. If we were to exclude these two major markets, the price and resale activity gains would be much more muted than the headline number would suggest.
In the new home market, starts have fallen from their peak levels of 229,000 recorded in 2007. But at an estimated 192,000 new starts in 2011, readings continue to remain well above demographic fundamentals, which we calculate to be 180,000 units. Similar to the resale side of the story, the national numbers have been skewed disproportionately by strong performances in large urban markets, notably Toronto. If we were to exclude Toronto from the national tally, total starts would have declined significantly in 2011.
Metrics point to over-valuation embedded in home prices today
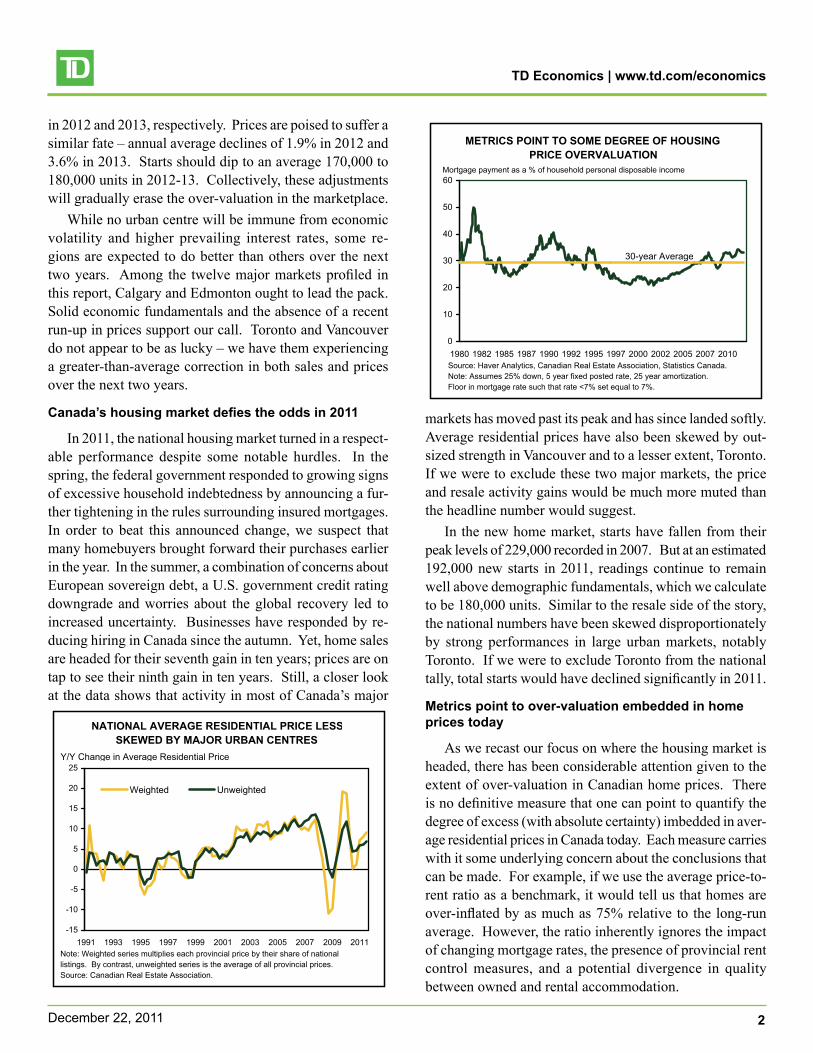
As we recast our focus on where the housing market is headed, there has been considerable attention given to the extent of over-valuation in Canadian home prices. There is no definitive measure that one can point to quantify the degree of excess (with absolute certainty) imbedded in aver-age residential prices in Canada today. Each measure carries with it some underlying concern about the conclusions that can be made. For example, if we use the average price-to-rent ratio as a benchmark, it would tell us that homes are over-inflated by as much as 75% relative to the long-run average. However, the ratio inherently ignores the impact of changing mortgage rates, the presence of provincial rent control measures, and a potential divergence in quality between owned and rental accommodation.
METRICS POINT TO SOME DEGREE OF HOUSING PRICE OVERVALUATION
0
10
20
30
40
50
60
1980 1982 1985 1987 1990 1992 1995 1997 2000 2002 2005 2007 2010
30-yearAverage
Source:HaverAnalytics,CanadianRealEstateAssociation,StatisticsCanada.Note:Assumes25%down,5yearfixedpostedrate,25yearamortization.Floorinmortgageratesuchthatrate<7%setequalto7%.
Mortgagepaymentasa%ofhouseholdpersonaldisposableincome
NATIONAL AVERAGE RESIDENTIAL PRICE LESSSKEWED BY MAJOR URBAN CENTRES
-15
-10
-5
0
5
10
15
20
25
1991 1993 1995 1997 1999 2001 2003 2005 2007 2009 2011
Weighted Unweighted
Y/YChangeinAverageResidentialPrice
Note:Weightedseriesmultiplieseachprovincialpricebytheirshareofnationallistings.Bycontrast,unweightedseriesistheaverageofallprovincialprices.Source:CanadianRealEstateAssociation.
TD Economics | www.td.com/economics
3December22,2011
Taking a look at just real home prices would lead to a conclusion that houses are priced more than 60% higher than the long-run average. Still, historical prices do not factor in key structural changes over time, such as lower trend mortgage rates, longer amortization periods, rising land values, transit development nearby, improved home quality and rising incomes. The price-to-income measure attempts to take income movements into consideration, but still does not capture some of the other factors previously presented. Based on this measure, prices are 44% over-valued.
A more defensible measure assumes that total housing costs relative to income eventually revert back to a long-term average. If we use this measure and assume a return to more normal levels of interest rates, the degree of over-valuation would be around 10-15%. Given the behaviour of sales and price trends in recent years – one that does not share bubble-like characteristics such as those in the U.S. pre-2007 – we are comfortable with this estimate of national price over-valuation.
Less supportive factors on tap for housing
When we look ahead to our 2012-13 forecast period, we see that the headwinds facing both supply and demand will increase in intensity. In turn, we anticipate resale price froth to gradually evaporate leaving the market in a more balanced position relative to where it stands today. More specifically, we expect both sales and prices to record annual average declines in both 2012 and 2013, with the latter year expected to record the brunt of the hit. Several factors support our forecasts, which we briefly delve into next.
Modest economic, income and employment growth over short-term
Real GDP growth in Canada is estimated at a solid 2.4% in 2011. However, storm clouds will increasingly hang over our small open economy during the first half of 2012. Much of the risk surrounds the European sovereign debt crisis and the failure of politicians to take decisive action so far to pour water over the flame. The base case scenario embedded in our forecast includes a recession within Europe, coming to a climax in early 2012 when borrowing pressures and require-ments will be heightened. Financial market volatility and a global economic slowdown will likely play out as a result.
In this context and given our export-based economy, real GDP growth is projected to slow to a minimal 1% on average during the first half of 2012. With these headline numbers, the national unemployment rate is expected to
increase from 7.3% to 7.7% by the middle of next year. National employment growth is also poised to be sub-1.0%, on a quarterly basis, during the first half of the year, while gains in after-tax incomes will be significantly restrained.
Prices and sales tend to be negatively correlated with financial market volatility and job and economic uncer-tainty – a house is too big an asset for most families to jump into when job security is in question and financial portfolios are vulnerable to sizeable swings in total value. As a consequence, resale prices and sales are expected to decline during the first half of 2012, before the turbulence eases in the months thereafter. In our forecast, we make the explicit assumption that – faced with a mounting crisis – leaders in Europe ultimately take bold action to address the situation, thus delivering benefits to financial markets and economies around the world. As such, Canada’s economy and job market is likely to regain traction in the second half of 2012 and into 2013, with real GDP growth rebounding to above 2.0%.
At the regional level, we believe the resource-based provinces of Alberta, Saskatchewan and Newfoundland and Labrador will continue to carry the best economic prospects over the 2012-13 period. The manufacturing-heavy regions of Ontario, Québec and Manitoba are expected to come in close to the national average. Last but not least, the Mari-time provinces should see sub-par numbers over the next two years, with Nova Scotia being the exception in 2013, as shipbuilding work gets underway.
ECONOMIC TURBULENCE AND HIGHER INTEREST RATES SHOULD DEFLATE HOUSING PRICES AND
ACTIVITY
0
50
100
150
200
250
300
350
400
450
2009 2010 2011F 2012F 2013F370
390
410
430
450
470
490
AveragePrice(lhs) Salesunits(rhs)
Units,ThousandsC$,Thousands
Note:ForecastsbyTDEconomicsasatDecember2011.Source: Canadian Real Estate Association
TD Economics | www.td.com/economics
4December22,2011
Interest and mortgage rates to rise
The weakened near-term economic profile described in the previous section should leave the Bank of Canada’s overnight rate unchanged in 2012. As a consequence, short-term fixed and variable mortgage rates are set to re-main at historically low levels throughout the year. These accommodative rates will likely serve as a cushion to the housing-related weakness in store for the first half of 2012.
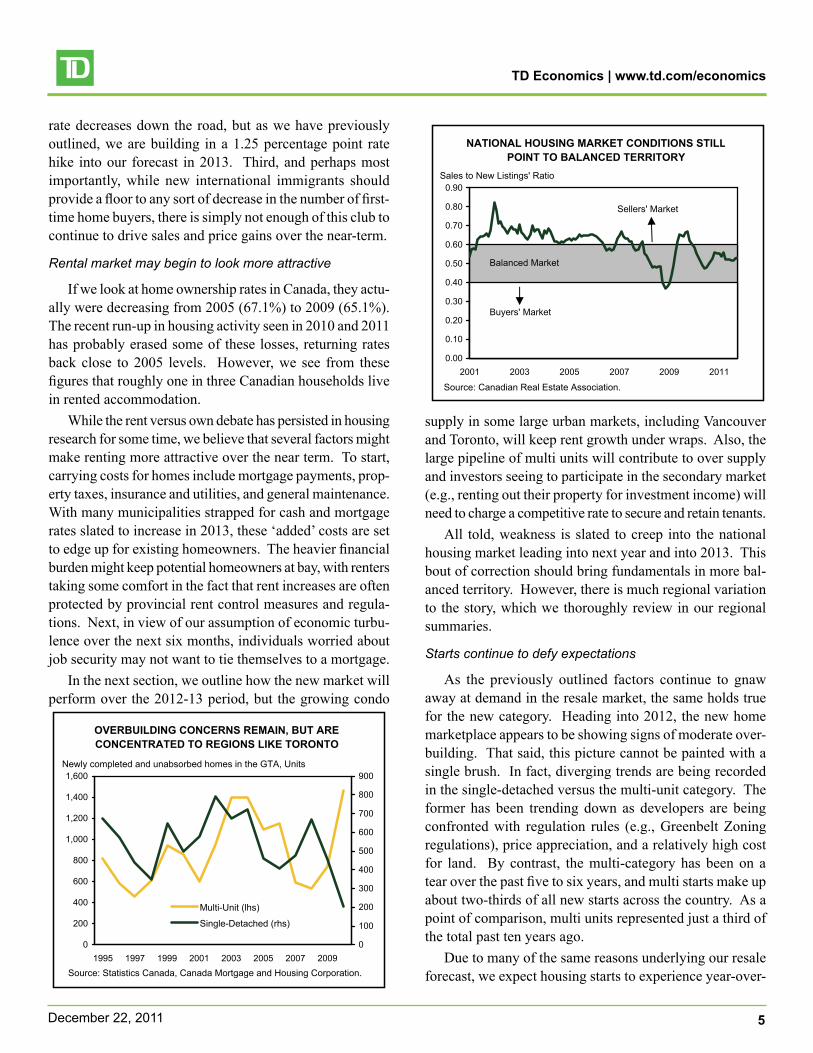
As we have heard repeatedly from Bank of Canada Governor Mark Carney and federal Finance Minister Fla-herty, monetary policy stimulus will not last forever. We anticipate that the central bank will begin to lift its key policy variable in the early part of 2013. Our forecast has a 1.25 percentage point hike to the overnight rate over the course of the year. Short-term interest and mortgage rates will follow this same trend.
Higher interest rates in place during 2013 will serve to erode overall home affordability. According to Ipsos Reid survey estimates, roughly a third of all mortgages were tied to variable-rate products in 2011. This share is up from the 10% that prevailed in 2001. While the proportion of variable mortgages can change from now until then (especially given lock-in options on most variable products), we can say that many Canadian mortgage holders will still be sensitive to interest rate fluctuations come 2013.
If we measure affordability as the annual mortgage pay-ment as a share of household income, then higher interest rates will increase this percentage from 23.7% to 24.8%. One should note, however, that this bump up is muted by the likelihood that home prices will also decrease in 2013. Another way to look at the heightened carrying costs for
households is to compare the change in mortgage obligations attributed to higher interest rates. Consider a scenario of a homeowner with a $400,000 residential mortgage. In this case, the new interest rate profile will mean $175 more in monthly obligations in 2013 – a sizeable amount for house-holds, many of whom already have tightly stretched budgets.
On the bright side, the percentage of residential mort-gage in arrears has been trending down in recent months. However, this measure is something to watch going forward, especially as Canadians continue to pack on record levels of household debt relative to income (151% in the third quarter of 2011). Mortgage debt tends to be top category among outstanding household financial liabilities and in turn, these obligations have important implications for any housing market outlook.
First-time home buyer category sensitive to volatility
First-time home buyers came out in the early part of the recovery to take advantage of low borrowing conditions and measures in place like the Home Renovation Tax Credit. In their home buying intention survey commissioned in early 2011, Canada Mortgage and Housing Corporation (CMHC) estimated that there would be fewer first-time buyers in 2011 than were present in 2010. No subsequent poll has been taken, but we suspect the number may actually come in lower than originally estimated. For one, first-time home buyers tend to be young in age and we typically see household formation rates among this cohort decrease when economic prospects get less certain. Second, surveys on buying intentions point to first-time buyers being particularly interest rate sensitive. We do not expect there to be interest
LOWER MORTGAGE RATES TO SUPPORT HOUSING IN 2012
0
2
4
6
8
10
12
14
16
1988 1992 1997 2001 2006 2010 2015
5-yearGov'tBondYield
5-YearConventionalMortgageRate
Note:ForecastsbyTDEconomicsasatDecember2011.Source:BankofCanada,HaverAnalytics.
Percent
Forecast
RESIDENTIAL MORTGAGE LOAN GROWTH STILL ELEVATED ABOVE PRE-RECESSIONARY LEVELS
-10
-5
0
5
10
15
20
25
1990 1992 1994 1996 1998 2000 2002 2004 2006 2008 2010
Y/YChangeinResidentialMortgageLoans
Source:StatisticsCanada.
TD Economics | www.td.com/economics
5December22,2011
rate decreases down the road, but as we have previously outlined, we are building in a 1.25 percentage point rate hike into our forecast in 2013. Third, and perhaps most importantly, while new international immigrants should provide a floor to any sort of decrease in the number of first-time home buyers, there is simply not enough of this club to continue to drive sales and price gains over the near-term.
Rental market may begin to look more attractive
If we look at home ownership rates in Canada, they actu-ally were decreasing from 2005 (67.1%) to 2009 (65.1%). The recent run-up in housing activity seen in 2010 and 2011 has probably erased some of these losses, returning rates back close to 2005 levels. However, we see from these figures that roughly one in three Canadian households live in rented accommodation.
While the rent versus own debate has persisted in housing research for some time, we believe that several factors might make renting more attractive over the near term. To start, carrying costs for homes include mortgage payments, prop-erty taxes, insurance and utilities, and general maintenance. With many municipalities strapped for cash and mortgage rates slated to increase in 2013, these ‘added’ costs are set to edge up for existing homeowners. The heavier financial burden might keep potential homeowners at bay, with renters taking some comfort in the fact that rent increases are often protected by provincial rent control measures and regula-tions. Next, in view of our assumption of economic turbu-lence over the next six months, individuals worried about job security may not want to tie themselves to a mortgage.
In the next section, we outline how the new market will perform over the 2012-13 period, but the growing condo
supply in some large urban markets, including Vancouver and Toronto, will keep rent growth under wraps. Also, the large pipeline of multi units will contribute to over supply and investors seeing to participate in the secondary market (e.g., renting out their property for investment income) will need to charge a competitive rate to secure and retain tenants.
All told, weakness is slated to creep into the national housing market leading into next year and into 2013. This bout of correction should bring fundamentals in more bal-anced territory. However, there is much regional variation to the story, which we thoroughly review in our regional summaries.
Starts continue to defy expectations
As the previously outlined factors continue to gnaw away at demand in the resale market, the same holds true for the new category. Heading into 2012, the new home marketplace appears to be showing signs of moderate over-building. That said, this picture cannot be painted with a single brush. In fact, diverging trends are being recorded in the single-detached versus the multi-unit category. The former has been trending down as developers are being confronted with regulation rules (e.g., Greenbelt Zoning regulations), price appreciation, and a relatively high cost for land. By contrast, the multi-category has been on a tear over the past five to six years, and multi starts make up about two-thirds of all new starts across the country. As a point of comparison, multi units represented just a third of the total past ten years ago.
Due to many of the same reasons underlying our resale forecast, we expect housing starts to experience year-over-
NATIONAL HOUSING MARKET CONDITIONS STILLPOINT TO BALANCED TERRITORY
0.00
0.10
0.20
0.30
0.40
0.50
0.60
0.70
0.80
0.90
2001 2003 2005 2007 2009 2011
Source:CanadianRealEstateAssociation.
SalestoNewListings'Ratio
BalancedMarket
Buyers'Market
Sellers'Market
OVERBUILDING CONCERNS REMAIN, BUT ARE CONCENTRATED TO REGIONS LIKE TORONTO
0
200
400
600
800
1,000
1,200
1,400
1,600
1995 1997 1999 2001 2003 2005 2007 20090
100
200
300
400
500
600
700
800
900
Multi-Unit(lhs)
Single-Detached(rhs)
Source:StatisticsCanada,CanadaMortgageandHousingCorporation.
NewlycompletedandunabsorbedhomesintheGTA,Units
TD Economics | www.td.com/economics
6December22,2011
year declines in 2012 and 2013. More precisely, we have starts edging down from an annual average 192,000 in 2011 to 181,000 in 2012 and 172,000 in 2013. These forecasts are consistent with both the economic climate and demographic need. However, the declines will be felt more acutely by some regions when compared to others. Case in point, To-ronto and Vancouver will take more of a hit, in light of their larger condominium inventories. Also, individuals looking to purchase a condominium for investment purposes, may be pinched from new mortgage financing eligibility rules as well as the different track that carrying costs and rent are expected to take over the short-term.
For the time being, absorption rates of condo units – the point in time when new starts are either occupied or rented out – remain consistent with long-run averages. Also, multi units are generally the more affordable alternative for indi-viduals looking to purchase a new home, especially when carrying costs in general are set to increase. However, our concern rests in the number of projects, especially condo projects, under construction and what this level of inventory will do when it actually hits the market. All indicators sug-gest that the condo pipeline issue is more a medium-term
one, but projects currently under development and/or being approved warrant further monitoring.
Risks on our radar for the outlook
The forecast that we have presented is based on many assumptions on the economic and interest rate outlook. Readers can look to our latest QEF for a list of the upside and downside risks surrounding our economic forecast. Many of these cautionary notes have important implications for our housing outlook. For example, low interest rates could spur a heightened pace of activity compared to current levels. If this occurs, then the degree of over-valuation imbedded in home prices today would increase relative to our current estimates. Accommodative interest rates for too long could also cause more concerns regarding excessive household debt and mortgage credit growth. In this event, the federal government might consider further regulatory actions.
The signs point against a resurgence in real estate activity for the next two years and we believe our forecast to effec-tively balance the upside and downside risks. Economic, income and employment drivers no longer support the pace of activity and price gains we witnessed in the early phases of the recovery. Our current forecast points to a gradual unwinding of over-valuation, but more turbulence in Europe, the U.S., or even here at home, may speed up the period over which the excesses are evaporated. This would represent a hard-landing scenario.
Local flavour a must to analysis
Given the regional nature of housing, we continue our practice of generating a comprehensive outlook for twelve major regions across the country. These urban centres in-clude Vancouver, Calgary, Edmonton, Saskatoon, Regina, Winnipeg, Ottawa, Toronto, Montréal, Québec, Halifax and Saint John. In each summary, we present our outlook on the resale and new market for the 2012-13 period, taking into account how local conditions might differ from national and provincial trends.
SOME REGIONAL HOUSING MARKETS VERSUS OTHERS ARE PARTICULARLY CONCERNING
0
2
4
6
8
10
12
1988 1990 1992 1994 1996 1998 2000 2002 2004 2006 2008 2010
Source:CanadianRealEstateAssociation,StatisticsCanada.
Vancouver
Toronto
Montréal
Canada
Averageresalehousepricedividedbyhouseholdincome
Sonya GulatiEconomist - Regional and Government Finances
416-982-8063
TD Economics | www.td.com/economics
7December22,2011
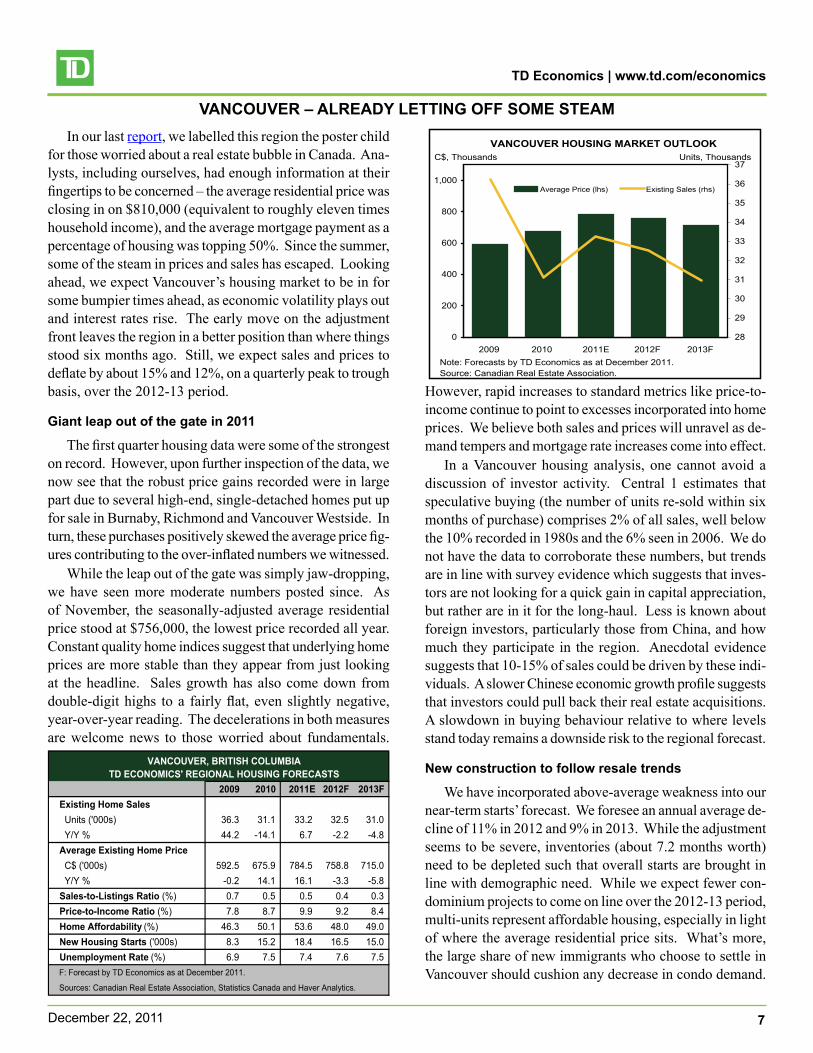
VANCOUVER – ALREADY LETTING OFF SOME STEAMIn our last report, we labelled this region the poster child
for those worried about a real estate bubble in Canada. Ana-lysts, including ourselves, had enough information at their fingertips to be concerned – the average residential price was closing in on $810,000 (equivalent to roughly eleven times household income), and the average mortgage payment as a percentage of housing was topping 50%. Since the summer, some of the steam in prices and sales has escaped. Looking ahead, we expect Vancouver’s housing market to be in for some bumpier times ahead, as economic volatility plays out and interest rates rise. The early move on the adjustment front leaves the region in a better position than where things stood six months ago. Still, we expect sales and prices to deflate by about 15% and 12%, on a quarterly peak to trough basis, over the 2012-13 period.
Giant leap out of the gate in 2011
The first quarter housing data were some of the strongest on record. However, upon further inspection of the data, we now see that the robust price gains recorded were in large part due to several high-end, single-detached homes put up for sale in Burnaby, Richmond and Vancouver Westside. In turn, these purchases positively skewed the average price fig-ures contributing to the over-inflated numbers we witnessed.
While the leap out of the gate was simply jaw-dropping, we have seen more moderate numbers posted since. As of November, the seasonally-adjusted average residential price stood at $756,000, the lowest price recorded all year. Constant quality home indices suggest that underlying home prices are more stable than they appear from just looking at the headline. Sales growth has also come down from double-digit highs to a fairly flat, even slightly negative, year-over-year reading. The decelerations in both measures are welcome news to those worried about fundamentals.
2009 2010 2011E 2012F 2013FExisting Home SalesUnits('000s) 36.3 31.1 33.2 32.5 31.0Y/Y% 44.2 -14.1 6.7 -2.2 -4.8Average Existing Home PriceC$('000s) 592.5 675.9 784.5 758.8 715.0Y/Y% -0.2 14.1 16.1 -3.3 -5.8Sales-to-Listings Ratio (%) 0.7 0.5 0.5 0.4 0.3Price-to-Income Ratio (%) 7.8 8.7 9.9 9.2 8.4Home Affordability (%) 46.3 50.1 53.6 48.0 49.0New Housing Starts ('000s) 8.3 15.2 18.4 16.5 15.0Unemployment Rate (%) 6.9 7.5 7.4 7.6 7.5F:ForecastbyTDEconomicsasatDecember2011.
Sources:CanadianRealEstateAssociation,StatisticsCanadaandHaverAnalytics.
VANCOUVER, BRITISH COLUMBIA TD ECONOMICS' REGIONAL HOUSING FORECASTS
VANCOUVER HOUSING MARKET OUTLOOK
0
200
400
600
800
1,000
2009 2010 2011E 2012F 2013F28
29
30
31
32
33
34
35
36
37
AveragePrice(lhs) ExistingSales(rhs)
Note:ForecastsbyTDEconomicsasatDecember2011.Source:CanadianRealEstateAssociation.
C$,Thousands Units,Thousands
However, rapid increases to standard metrics like price-to-income continue to point to excesses incorporated into home prices. We believe both sales and prices will unravel as de-mand tempers and mortgage rate increases come into effect.
In a Vancouver housing analysis, one cannot avoid a discussion of investor activity. Central 1 estimates that speculative buying (the number of units re-sold within six months of purchase) comprises 2% of all sales, well below the 10% recorded in 1980s and the 6% seen in 2006. We do not have the data to corroborate these numbers, but trends are in line with survey evidence which suggests that inves-tors are not looking for a quick gain in capital appreciation, but rather are in it for the long-haul. Less is known about foreign investors, particularly those from China, and how much they participate in the region. Anecdotal evidence suggests that 10-15% of sales could be driven by these indi-viduals. A slower Chinese economic growth profile suggests that investors could pull back their real estate acquisitions. A slowdown in buying behaviour relative to where levels stand today remains a downside risk to the regional forecast.
New construction to follow resale trends
We have incorporated above-average weakness into our near-term starts’ forecast. We foresee an annual average de-cline of 11% in 2012 and 9% in 2013. While the adjustment seems to be severe, inventories (about 7.2 months worth) need to be depleted such that overall starts are brought in line with demographic need. While we expect fewer con-dominium projects to come on line over the 2012-13 period, multi-units represent affordable housing, especially in light of where the average residential price sits. What’s more, the large share of new immigrants who choose to settle in Vancouver should cushion any decrease in condo demand.
TD Economics | www.td.com/economics
8December22,2011
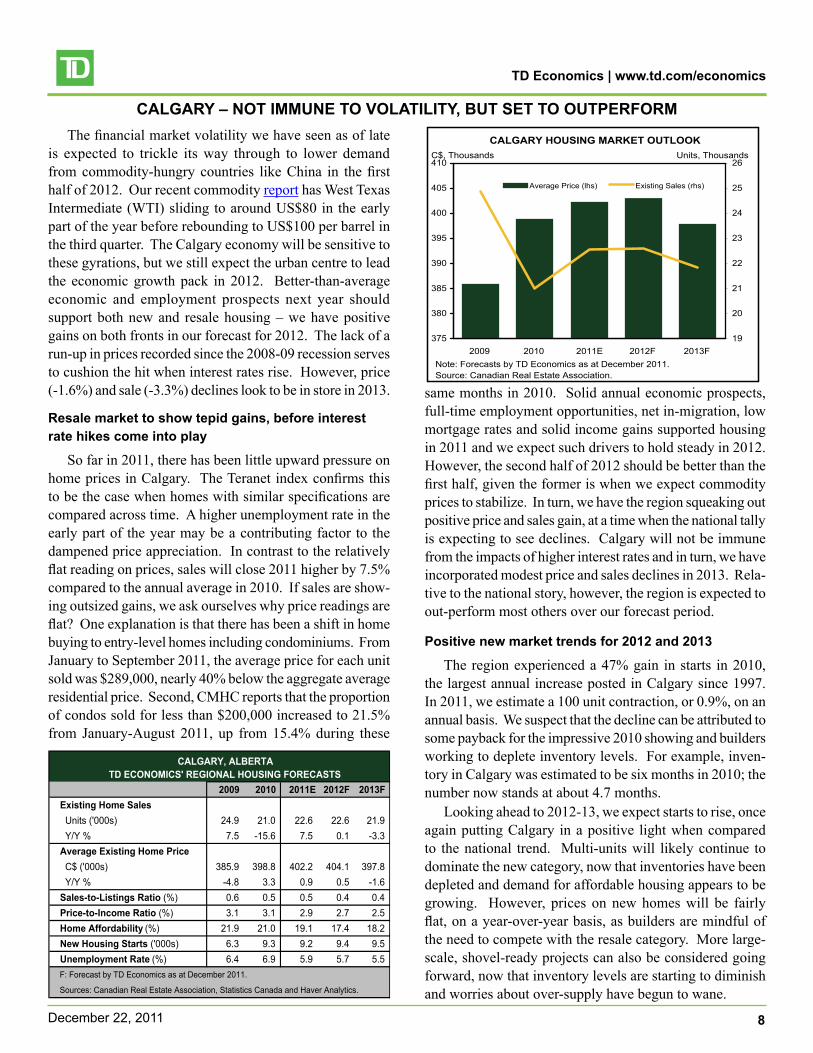
CALGARY – NOT IMMUNE TO VOLATILITY, BUT SET TO OUTPERFORMThe financial market volatility we have seen as of late
is expected to trickle its way through to lower demand from commodity-hungry countries like China in the first half of 2012. Our recent commodity report has West Texas Intermediate (WTI) sliding to around US$80 in the early part of the year before rebounding to US$100 per barrel in the third quarter. The Calgary economy will be sensitive to these gyrations, but we still expect the urban centre to lead the economic growth pack in 2012. Better-than-average economic and employment prospects next year should support both new and resale housing – we have positive gains on both fronts in our forecast for 2012. The lack of a run-up in prices recorded since the 2008-09 recession serves to cushion the hit when interest rates rise. However, price (-1.6%) and sale (-3.3%) declines look to be in store in 2013.
Resale market to show tepid gains, before interest rate hikes come into play
So far in 2011, there has been little upward pressure on home prices in Calgary. The Teranet index confirms this to be the case when homes with similar specifications are compared across time. A higher unemployment rate in the early part of the year may be a contributing factor to the dampened price appreciation. In contrast to the relatively flat reading on prices, sales will close 2011 higher by 7.5% compared to the annual average in 2010. If sales are show-ing outsized gains, we ask ourselves why price readings are flat? One explanation is that there has been a shift in home buying to entry-level homes including condominiums. From January to September 2011, the average price for each unit sold was $289,000, nearly 40% below the aggregate average residential price. Second, CMHC reports that the proportion of condos sold for less than $200,000 increased to 21.5% from January-August 2011, up from 15.4% during these
2009 2010 2011E 2012F 2013FExisting Home SalesUnits('000s) 24.9 21.0 22.6 22.6 21.9Y/Y% 7.5 -15.6 7.5 0.1 -3.3Average Existing Home PriceC$('000s) 385.9 398.8 402.2 404.1 397.8Y/Y% -4.8 3.3 0.9 0.5 -1.6Sales-to-Listings Ratio (%) 0.6 0.5 0.5 0.4 0.4Price-to-Income Ratio (%) 3.1 3.1 2.9 2.7 2.5Home Affordability (%) 21.9 21.0 19.1 17.4 18.2New Housing Starts ('000s) 6.3 9.3 9.2 9.4 9.5Unemployment Rate(%) 6.4 6.9 5.9 5.7 5.5F:ForecastbyTDEconomicsasatDecember2011.
Sources:CanadianRealEstateAssociation,StatisticsCanadaandHaverAnalytics.
CALGARY, ALBERTATD ECONOMICS' REGIONAL HOUSING FORECASTS
CALGARY HOUSING MARKET OUTLOOK
375
380
385
390
395
400
405
410
2009 2010 2011E 2012F 2013F19
20
21
22
23
24
25
26
AveragePrice(lhs) ExistingSales(rhs)
Note:ForecastsbyTDEconomicsasatDecember2011.Source:CanadianRealEstateAssociation.
C$,Thousands Units,Thousands
same months in 2010. Solid annual economic prospects, full-time employment opportunities, net in-migration, low mortgage rates and solid income gains supported housing in 2011 and we expect such drivers to hold steady in 2012. However, the second half of 2012 should be better than the first half, given the former is when we expect commodity prices to stabilize. In turn, we have the region squeaking out positive price and sales gain, at a time when the national tally is expecting to see declines. Calgary will not be immune from the impacts of higher interest rates and in turn, we have incorporated modest price and sales declines in 2013. Rela-tive to the national story, however, the region is expected to out-perform most others over our forecast period.
Positive new market trends for 2012 and 2013
The region experienced a 47% gain in starts in 2010, the largest annual increase posted in Calgary since 1997. In 2011, we estimate a 100 unit contraction, or 0.9%, on an annual basis. We suspect that the decline can be attributed to some payback for the impressive 2010 showing and builders working to deplete inventory levels. For example, inven-tory in Calgary was estimated to be six months in 2010; the number now stands at about 4.7 months.
Looking ahead to 2012-13, we expect starts to rise, once again putting Calgary in a positive light when compared to the national trend. Multi-units will likely continue to dominate the new category, now that inventories have been depleted and demand for affordable housing appears to be growing. However, prices on new homes will be fairly flat, on a year-over-year basis, as builders are mindful of the need to compete with the resale category. More large-scale, shovel-ready projects can also be considered going forward, now that inventory levels are starting to diminish and worries about over-supply have begun to wane.
TD Economics | www.td.com/economics
9December22,2011
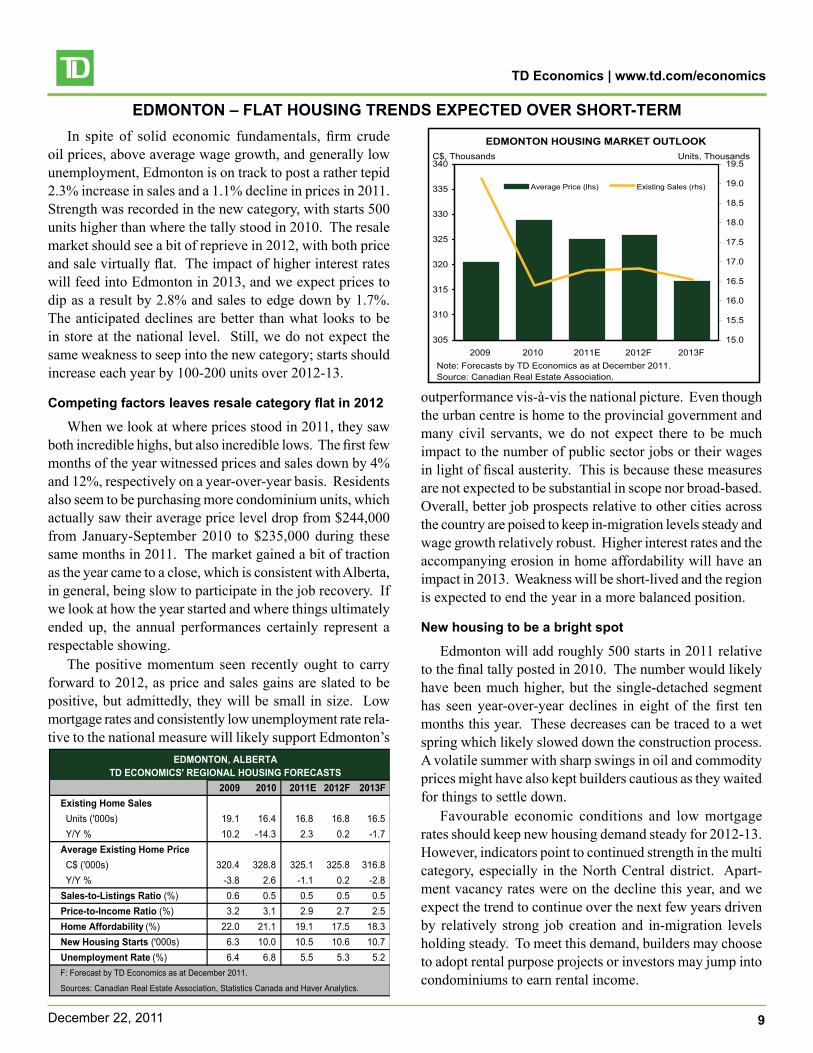
EDMONTON – FLAT HOUSING TRENDS EXPECTED OVER SHORT-TERMIn spite of solid economic fundamentals, firm crude
oil prices, above average wage growth, and generally low unemployment, Edmonton is on track to post a rather tepid 2.3% increase in sales and a 1.1% decline in prices in 2011. Strength was recorded in the new category, with starts 500 units higher than where the tally stood in 2010. The resale market should see a bit of reprieve in 2012, with both price and sale virtually flat. The impact of higher interest rates will feed into Edmonton in 2013, and we expect prices to dip as a result by 2.8% and sales to edge down by 1.7%. The anticipated declines are better than what looks to be in store at the national level. Still, we do not expect the same weakness to seep into the new category; starts should increase each year by 100-200 units over 2012-13.
Competing factors leaves resale category flat in 2012
When we look at where prices stood in 2011, they saw both incredible highs, but also incredible lows. The first few months of the year witnessed prices and sales down by 4% and 12%, respectively on a year-over-year basis. Residents also seem to be purchasing more condominium units, which actually saw their average price level drop from $244,000 from January-September 2010 to $235,000 during these same months in 2011. The market gained a bit of traction as the year came to a close, which is consistent with Alberta, in general, being slow to participate in the job recovery. If we look at how the year started and where things ultimately ended up, the annual performances certainly represent a respectable showing.
The positive momentum seen recently ought to carry forward to 2012, as price and sales gains are slated to be positive, but admittedly, they will be small in size. Low mortgage rates and consistently low unemployment rate rela-tive to the national measure will likely support Edmonton’s
2009 2010 2011E 2012F 2013FExisting Home SalesUnits('000s) 19.1 16.4 16.8 16.8 16.5Y/Y% 10.2 -14.3 2.3 0.2 -1.7Average Existing Home PriceC$('000s) 320.4 328.8 325.1 325.8 316.8Y/Y% -3.8 2.6 -1.1 0.2 -2.8Sales-to-Listings Ratio (%) 0.6 0.5 0.5 0.5 0.5Price-to-Income Ratio (%) 3.2 3.1 2.9 2.7 2.5Home Affordability (%) 22.0 21.1 19.1 17.5 18.3New Housing Starts ('000s) 6.3 10.0 10.5 10.6 10.7Unemployment Rate(%) 6.4 6.8 5.5 5.3 5.2F:ForecastbyTDEconomicsasatDecember2011.
Sources:CanadianRealEstateAssociation,StatisticsCanadaandHaverAnalytics.
EDMONTON, ALBERTA TD ECONOMICS' REGIONAL HOUSING FORECASTS
EDMONTON HOUSING MARKET OUTLOOK
305
310
315
320
325
330
335
340
2009 2010 2011E 2012F 2013F15.0
15.5
16.0
16.5
17.0
17.5
18.0
18.5
19.0
19.5
AveragePrice(lhs) ExistingSales(rhs)
Note:ForecastsbyTDEconomicsasatDecember2011.Source:CanadianRealEstateAssociation.
C$,Thousands Units,Thousands
outperformance vis-à-vis the national picture. Even though the urban centre is home to the provincial government and many civil servants, we do not expect there to be much impact to the number of public sector jobs or their wages in light of fiscal austerity. This is because these measures are not expected to be substantial in scope nor broad-based. Overall, better job prospects relative to other cities across the country are poised to keep in-migration levels steady and wage growth relatively robust. Higher interest rates and the accompanying erosion in home affordability will have an impact in 2013. Weakness will be short-lived and the region is expected to end the year in a more balanced position.
New housing to be a bright spot
Edmonton will add roughly 500 starts in 2011 relative to the final tally posted in 2010. The number would likely have been much higher, but the single-detached segment has seen year-over-year declines in eight of the first ten months this year. These decreases can be traced to a wet spring which likely slowed down the construction process. A volatile summer with sharp swings in oil and commodity prices might have also kept builders cautious as they waited for things to settle down.
Favourable economic conditions and low mortgage rates should keep new housing demand steady for 2012-13. However, indicators point to continued strength in the multi category, especially in the North Central district. Apart-ment vacancy rates were on the decline this year, and we expect the trend to continue over the next few years driven by relatively strong job creation and in-migration levels holding steady. To meet this demand, builders may choose to adopt rental purpose projects or investors may jump into condominiums to earn rental income.

TD Economics | www.td.com/economics
10December22,2011
SASKATOON – A NOTABLE YEAR FOR HOME-BUILDING ACTIVITY IN 2011As 2011 draws to a close, we conclude that it was an
impressive one for home building activity. Saskatoon is set to record 3,100 starts in 2011, or nearly 700 more units than was the case in 2010. Similar to the national picture, most of the strength seen over the past two years on the new side of the market has been in the multi unit category. In spite of solid underlying economic, income and employ-ment fundamentals, we anticipate that the number of total starts will decline in both 2012 and 2013, as builders work to complete projects and deplete excess inventory. Resale activity and prices are projected to be relatively flat in 2012 before downshifting moderately in 2013 as interest rate hikes come into effect. Still, the region is expected to perform better than the national average over our forecast horizon.
Home building a bright spot in 2011
In 2010, Saskatoon recorded its best year since the 1970s when it saw 2,400 new starts break ground. In 2011, the feat looks like it will be topped, as Saskatoon is on track to ink 3,100 starts. The strength in both years was driven by an increase in multi-residential units, which now make up about 60% of the total annual tally. The persistence of low mortgage rates and a desire to secure affordable housing are two of the factors making apartments and condominiums attractive options for homebuyers. Government initiatives, in combination with CMHC, such as the City of Saskatoon’s Mortgage Flexibilities Support Program, are striving to boost home ownership rates of low-to-middle-income households.
Looking ahead to 2012 and 2013, we anticipate that builders will ease off the accelerator pedal a touch, as they encounter rising inventories and lower levels of net migra-tion. We have starts falling to 2,900 units in 2012 and 2,600 units in 2013. While these forecasts are slated to come in lower than both the 2010 and 2011 totals, they still remain
2009 2010 2011E 2012F 2013FExisting Home SalesUnits('000s) 3.8 3.6 4.0 4.0 3.9Y/Y% 8.3 -6.8 10.8 0.4 -2.3Average Existing Home PriceC$('000s) 278.9 296.4 309.3 308.3 301.6Y/Y% -3.1 6.3 4.4 -0.3 -2.1Sales-to-Listings Ratio (%) 0.6 0.5 0.5 0.4 0.5Price-to-Income Ratio (%) 2.9 2.9 2.8 2.6 2.3Home Affordability (%) 20.5 20.0 18.7 16.8 17.3New Housing Starts ('000s) 1.4 2.4 3.1 2.9 2.6Unemployment Rate(%) 4.6 5.3 5.6 5.5 5.5F:ForecastbyTDEconomicsasatDecember2011.
Sources:CanadianRealEstateAssociation,StatisticsCanadaandHaverAnalytics.
SASKATOON, SASKATCHEWAN TD ECONOMICS' REGIONAL HOUSING FORECASTS
SASKATOON HOUSING MARKET OUTLOOK
0
50
100
150
200
250
300
350
400
2009 2010 2011E 2012F 2013F0.0
0.5
1.0
1.5
2.0
2.5
3.0
3.5
4.0
4.5
5.0
AveragePrice(lhs) ExistingSales(rhs)
Note:ForecastsbyTDEconomicsasatDecember2011.Source:CanadianRealEstateAssociation.
C$,Thousands Units,Thousands
well above long-run averages. The slowdown will be most felt among multis, as this is where concerns about overbuild-ing and too many projects currently in the works lie.
As completed units work their way into the system, the rental vacancy rate is slated to be above 3.0% over our forecast period. In addition to new projects coming on line, the vacancy rate will face upward pressure – and rents downward pressure – from more units entering the housing market via secondary channels (e.g., home owners renting out their property for investment).
Resale to see softness in 2012 and 2013
Saskatoon has seen just 500 net new jobs created if we compare January and November 2011 employment levels. This represents a disappointing performance as the region also saw an outright job contraction in 2010. With the job report card in the background, it is a surprise that Saskatoon managed to see a 10.8% year-over-year increase in sales (the best in the country) and a 4.4% increase in prices. The overall scorecard is that much more notable when we see that a third of all sales from January to August were priced at the lower end of the spectrum or around the $250,000 range.
With increased competition coming from the new market, we anticipate that softness on the resale side will take hold. Sales are expected to be positive, but small, in 2012 (0.4%), as homebuyers try to beat the interest rate hike set to come into effect in 2013. We have then built in a year-over-year contraction in sales in 2013 of 2.3%. In our estimation, prices need to adjust by about 8.3% to return to more bal-anced territory, on a quarterly peak-to-trough basis. On this front, weakness will be recorded in both 2012 (-0.3%) and 2013 (-2.1%), with the latter taking the brunt of the hit.
TD Economics | www.td.com/economics
11December22,2011
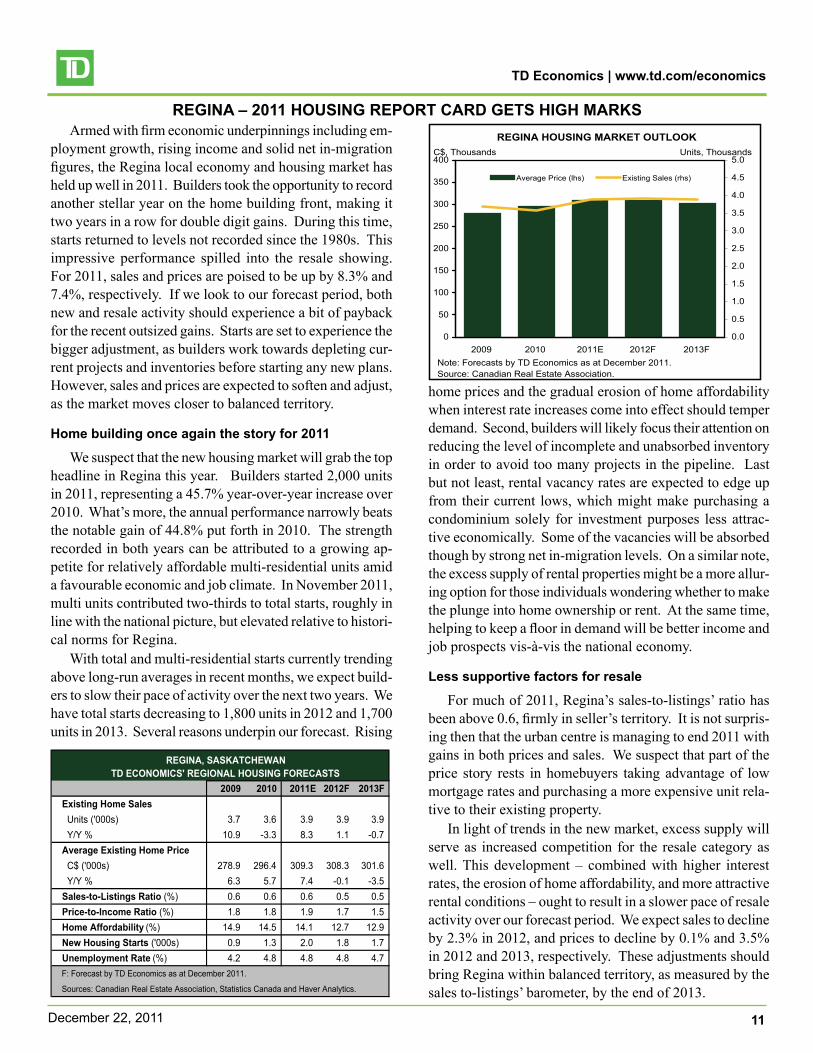
REGINA – 2011 HOUSING REPORT CARD GETS HIGH MARKSArmed with firm economic underpinnings including em-
ployment growth, rising income and solid net in-migration figures, the Regina local economy and housing market has held up well in 2011. Builders took the opportunity to record another stellar year on the home building front, making it two years in a row for double digit gains. During this time, starts returned to levels not recorded since the 1980s. This impressive performance spilled into the resale showing. For 2011, sales and prices are poised to be up by 8.3% and 7.4%, respectively. If we look to our forecast period, both new and resale activity should experience a bit of payback for the recent outsized gains. Starts are set to experience the bigger adjustment, as builders work towards depleting cur-rent projects and inventories before starting any new plans. However, sales and prices are expected to soften and adjust, as the market moves closer to balanced territory.
Home building once again the story for 2011
We suspect that the new housing market will grab the top headline in Regina this year. Builders started 2,000 units in 2011, representing a 45.7% year-over-year increase over 2010. What’s more, the annual performance narrowly beats the notable gain of 44.8% put forth in 2010. The strength recorded in both years can be attributed to a growing ap-petite for relatively affordable multi-residential units amid a favourable economic and job climate. In November 2011, multi units contributed two-thirds to total starts, roughly in line with the national picture, but elevated relative to histori-cal norms for Regina.
With total and multi-residential starts currently trending above long-run averages in recent months, we expect build-ers to slow their pace of activity over the next two years. We have total starts decreasing to 1,800 units in 2012 and 1,700 units in 2013. Several reasons underpin our forecast. Rising
2009 2010 2011E 2012F 2013FExisting Home SalesUnits('000s) 3.7 3.6 3.9 3.9 3.9Y/Y% 10.9 -3.3 8.3 1.1 -0.7Average Existing Home PriceC$('000s) 278.9 296.4 309.3 308.3 301.6Y/Y% 6.3 5.7 7.4 -0.1 -3.5Sales-to-Listings Ratio (%) 0.6 0.6 0.6 0.5 0.5Price-to-Income Ratio (%) 1.8 1.8 1.9 1.7 1.5Home Affordability (%) 14.9 14.5 14.1 12.7 12.9New Housing Starts ('000s) 0.9 1.3 2.0 1.8 1.7Unemployment Rate(%) 4.2 4.8 4.8 4.8 4.7F:ForecastbyTDEconomicsasatDecember2011.
Sources:CanadianRealEstateAssociation,StatisticsCanadaandHaverAnalytics.
REGINA, SASKATCHEWAN TD ECONOMICS' REGIONAL HOUSING FORECASTS
REGINA HOUSING MARKET OUTLOOK
0
50
100
150
200
250
300
350
400
2009 2010 2011E 2012F 2013F0.0
0.5
1.0
1.5
2.0
2.5
3.0
3.5
4.0
4.5
5.0
AveragePrice(lhs) ExistingSales(rhs)
Note:ForecastsbyTDEconomicsasatDecember2011.Source:CanadianRealEstateAssociation.
C$,Thousands Units,Thousands
home prices and the gradual erosion of home affordability when interest rate increases come into effect should temper demand. Second, builders will likely focus their attention on reducing the level of incomplete and unabsorbed inventory in order to avoid too many projects in the pipeline. Last but not least, rental vacancy rates are expected to edge up from their current lows, which might make purchasing a condominium solely for investment purposes less attrac-tive economically. Some of the vacancies will be absorbed though by strong net in-migration levels. On a similar note, the excess supply of rental properties might be a more allur-ing option for those individuals wondering whether to make the plunge into home ownership or rent. At the same time, helping to keep a floor in demand will be better income and job prospects vis-à-vis the national economy.
Less supportive factors for resale
For much of 2011, Regina’s sales-to-listings’ ratio has been above 0.6, firmly in seller’s territory. It is not surpris-ing then that the urban centre is managing to end 2011 with gains in both prices and sales. We suspect that part of the price story rests in homebuyers taking advantage of low mortgage rates and purchasing a more expensive unit rela-tive to their existing property.
In light of trends in the new market, excess supply will serve as increased competition for the resale category as well. This development – combined with higher interest rates, the erosion of home affordability, and more attractive rental conditions – ought to result in a slower pace of resale activity over our forecast period. We expect sales to decline by 2.3% in 2012, and prices to decline by 0.1% and 3.5% in 2012 and 2013, respectively. These adjustments should bring Regina within balanced territory, as measured by the sales to-listings’ barometer, by the end of 2013.
TD Economics | www.td.com/economics
12December22,2011
WINNIPEG – DEVELOPMENT IN THE DOWNTOWN CORE
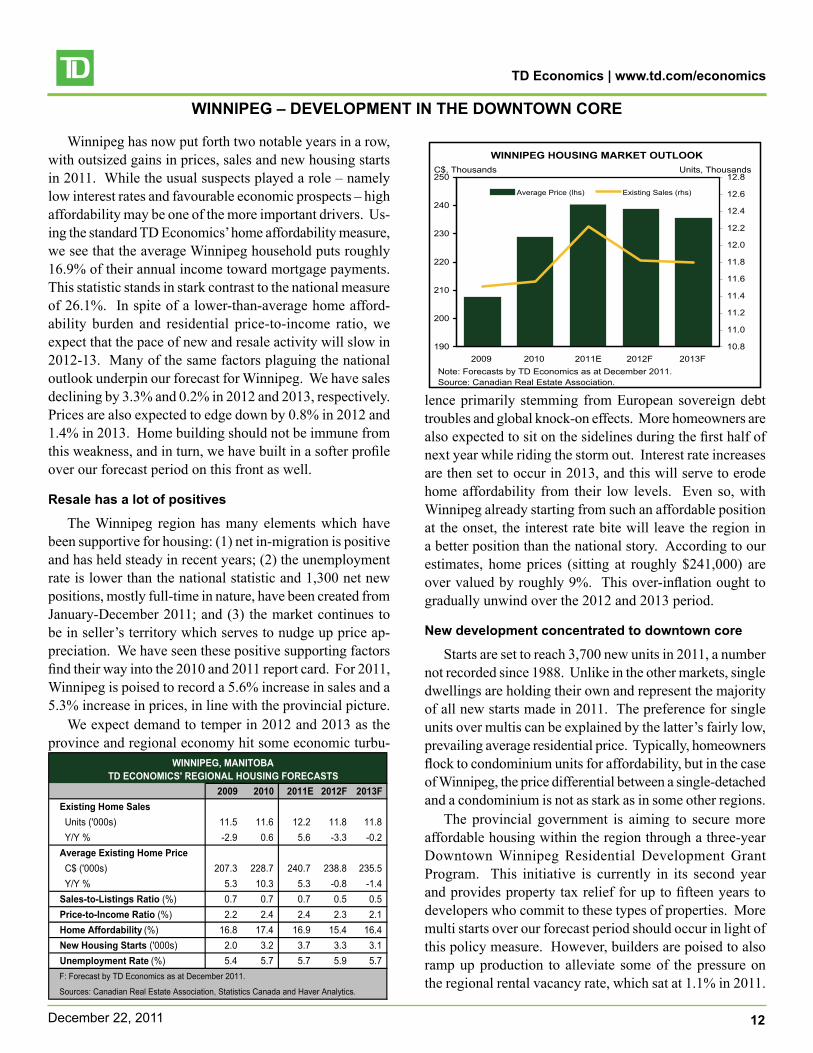
Winnipeg has now put forth two notable years in a row, with outsized gains in prices, sales and new housing starts in 2011. While the usual suspects played a role – namely low interest rates and favourable economic prospects – high affordability may be one of the more important drivers. Us-ing the standard TD Economics’ home affordability measure, we see that the average Winnipeg household puts roughly 16.9% of their annual income toward mortgage payments. This statistic stands in stark contrast to the national measure of 26.1%. In spite of a lower-than-average home afford-ability burden and residential price-to-income ratio, we expect that the pace of new and resale activity will slow in 2012-13. Many of the same factors plaguing the national outlook underpin our forecast for Winnipeg. We have sales declining by 3.3% and 0.2% in 2012 and 2013, respectively. Prices are also expected to edge down by 0.8% in 2012 and 1.4% in 2013. Home building should not be immune from this weakness, and in turn, we have built in a softer profile over our forecast period on this front as well.
Resale has a lot of positives
The Winnipeg region has many elements which have been supportive for housing: (1) net in-migration is positive and has held steady in recent years; (2) the unemployment rate is lower than the national statistic and 1,300 net new positions, mostly full-time in nature, have been created from January-December 2011; and (3) the market continues to be in seller’s territory which serves to nudge up price ap-preciation. We have seen these positive supporting factors find their way into the 2010 and 2011 report card. For 2011, Winnipeg is poised to record a 5.6% increase in sales and a 5.3% increase in prices, in line with the provincial picture.
We expect demand to temper in 2012 and 2013 as the province and regional economy hit some economic turbu-
2009 2010 2011E 2012F 2013FExisting Home SalesUnits('000s) 11.5 11.6 12.2 11.8 11.8Y/Y% -2.9 0.6 5.6 -3.3 -0.2Average Existing Home PriceC$('000s) 207.3 228.7 240.7 238.8 235.5Y/Y% 5.3 10.3 5.3 -0.8 -1.4Sales-to-Listings Ratio (%) 0.7 0.7 0.7 0.5 0.5Price-to-Income Ratio (%) 2.2 2.4 2.4 2.3 2.1Home Affordability (%) 16.8 17.4 16.9 15.4 16.4New Housing Starts ('000s) 2.0 3.2 3.7 3.3 3.1Unemployment Rate(%) 5.4 5.7 5.7 5.9 5.7F:ForecastbyTDEconomicsasatDecember2011.
Sources:CanadianRealEstateAssociation,StatisticsCanadaandHaverAnalytics.
WINNIPEG, MANITOBA TD ECONOMICS' REGIONAL HOUSING FORECASTS
WINNIPEG HOUSING MARKET OUTLOOK
190
200
210
220
230
240
250
2009 2010 2011E 2012F 2013F10.8
11.0
11.2
11.4
11.6
11.8
12.0
12.2
12.4
12.6
12.8
AveragePrice(lhs) ExistingSales(rhs)
Note:ForecastsbyTDEconomicsasatDecember2011.Source:CanadianRealEstateAssociation.
C$,Thousands Units,Thousands
lence primarily stemming from European sovereign debt troubles and global knock-on effects. More homeowners are also expected to sit on the sidelines during the first half of next year while riding the storm out. Interest rate increases are then set to occur in 2013, and this will serve to erode home affordability from their low levels. Even so, with Winnipeg already starting from such an affordable position at the onset, the interest rate bite will leave the region in a better position than the national story. According to our estimates, home prices (sitting at roughly $241,000) are over valued by roughly 9%. This over-inflation ought to gradually unwind over the 2012 and 2013 period.
New development concentrated to downtown core
Starts are set to reach 3,700 new units in 2011, a number not recorded since 1988. Unlike in the other markets, single dwellings are holding their own and represent the majority of all new starts made in 2011. The preference for single units over multis can be explained by the latter’s fairly low, prevailing average residential price. Typically, homeowners flock to condominium units for affordability, but in the case of Winnipeg, the price differential between a single-detached and a condominium is not as stark as in some other regions.
The provincial government is aiming to secure more affordable housing within the region through a three-year Downtown Winnipeg Residential Development Grant Program. This initiative is currently in its second year and provides property tax relief for up to fifteen years to developers who commit to these types of properties. More multi starts over our forecast period should occur in light of this policy measure. However, builders are poised to also ramp up production to alleviate some of the pressure on the regional rental vacancy rate, which sat at 1.1% in 2011.
TD Economics | www.td.com/economics
13December22,2011
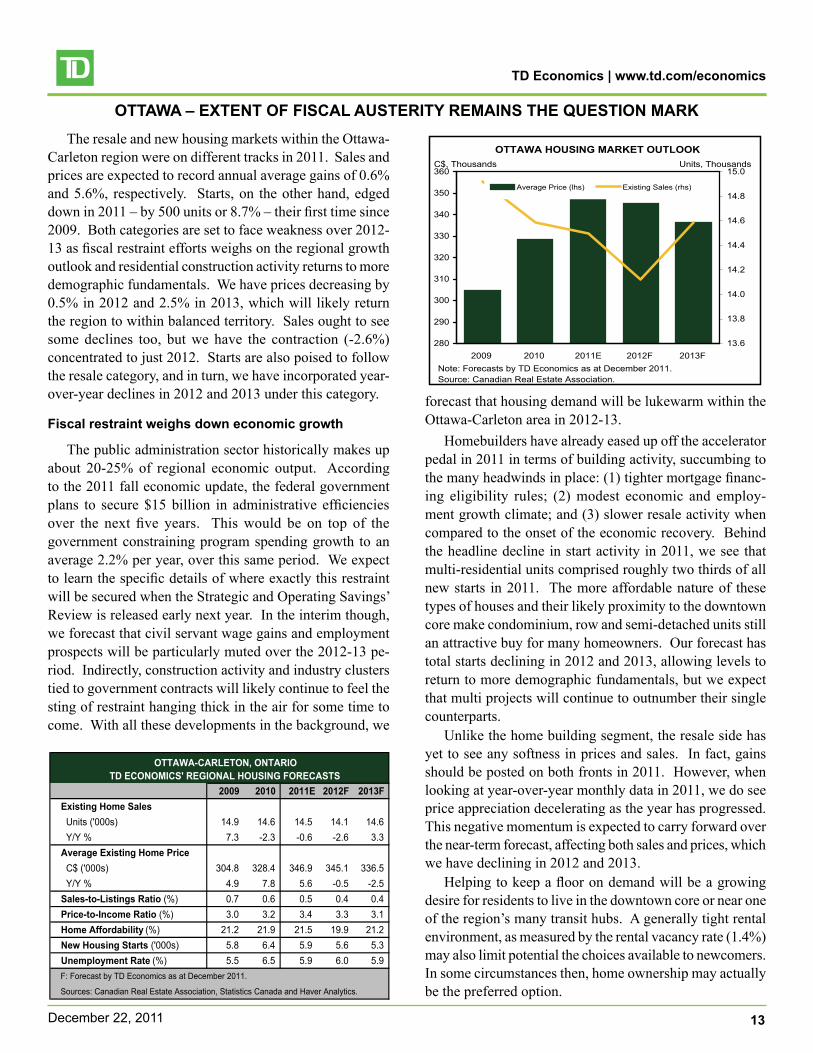
OTTAWA – EXTENT OF FISCAL AUSTERITY REMAINS THE QUESTION MARKThe resale and new housing markets within the Ottawa-
Carleton region were on different tracks in 2011. Sales and prices are expected to record annual average gains of 0.6% and 5.6%, respectively. Starts, on the other hand, edged down in 2011 – by 500 units or 8.7% – their first time since 2009. Both categories are set to face weakness over 2012-13 as fiscal restraint efforts weighs on the regional growth outlook and residential construction activity returns to more demographic fundamentals. We have prices decreasing by 0.5% in 2012 and 2.5% in 2013, which will likely return the region to within balanced territory. Sales ought to see some declines too, but we have the contraction (-2.6%) concentrated to just 2012. Starts are also poised to follow the resale category, and in turn, we have incorporated year-over-year declines in 2012 and 2013 under this category.
Fiscal restraint weighs down economic growth
The public administration sector historically makes up about 20-25% of regional economic output. According to the 2011 fall economic update, the federal government plans to secure $15 billion in administrative efficiencies over the next five years. This would be on top of the government constraining program spending growth to an average 2.2% per year, over this same period. We expect to learn the specific details of where exactly this restraint will be secured when the Strategic and Operating Savings’ Review is released early next year. In the interim though, we forecast that civil servant wage gains and employment prospects will be particularly muted over the 2012-13 pe-riod. Indirectly, construction activity and industry clusters tied to government contracts will likely continue to feel the sting of restraint hanging thick in the air for some time to come. With all these developments in the background, we
2009 2010 2011E 2012F 2013FExisting Home SalesUnits('000s) 14.9 14.6 14.5 14.1 14.6Y/Y% 7.3 -2.3 -0.6 -2.6 3.3Average Existing Home PriceC$('000s) 304.8 328.4 346.9 345.1 336.5Y/Y% 4.9 7.8 5.6 -0.5 -2.5Sales-to-Listings Ratio (%) 0.7 0.6 0.5 0.4 0.4Price-to-Income Ratio (%) 3.0 3.2 3.4 3.3 3.1Home Affordability (%) 21.2 21.9 21.5 19.9 21.2New Housing Starts ('000s) 5.8 6.4 5.9 5.6 5.3Unemployment Rate(%) 5.5 6.5 5.9 6.0 5.9F:ForecastbyTDEconomicsasatDecember2011.
Sources:CanadianRealEstateAssociation,StatisticsCanadaandHaverAnalytics.
OTTAWA-CARLETON, ONTARIO TD ECONOMICS' REGIONAL HOUSING FORECASTS
OTTAWA HOUSING MARKET OUTLOOK
280
290
300
310
320
330
340
350
360
2009 2010 2011E 2012F 2013F13.6
13.8
14.0
14.2
14.4
14.6
14.8
15.0
AveragePrice(lhs) ExistingSales(rhs)
Note:ForecastsbyTDEconomicsasatDecember2011.Source:CanadianRealEstateAssociation.
C$,Thousands Units,Thousands
forecast that housing demand will be lukewarm within the Ottawa-Carleton area in 2012-13.
Homebuilders have already eased up off the accelerator pedal in 2011 in terms of building activity, succumbing to the many headwinds in place: (1) tighter mortgage financ-ing eligibility rules; (2) modest economic and employ-ment growth climate; and (3) slower resale activity when compared to the onset of the economic recovery. Behind the headline decline in start activity in 2011, we see that multi-residential units comprised roughly two thirds of all new starts in 2011. The more affordable nature of these types of houses and their likely proximity to the downtown core make condominium, row and semi-detached units still an attractive buy for many homeowners. Our forecast has total starts declining in 2012 and 2013, allowing levels to return to more demographic fundamentals, but we expect that multi projects will continue to outnumber their single counterparts.
Unlike the home building segment, the resale side has yet to see any softness in prices and sales. In fact, gains should be posted on both fronts in 2011. However, when looking at year-over-year monthly data in 2011, we do see price appreciation decelerating as the year has progressed. This negative momentum is expected to carry forward over the near-term forecast, affecting both sales and prices, which we have declining in 2012 and 2013.
Helping to keep a floor on demand will be a growing desire for residents to live in the downtown core or near one of the region’s many transit hubs. A generally tight rental environment, as measured by the rental vacancy rate (1.4%) may also limit potential the choices available to newcomers. In some circumstances then, home ownership may actually be the preferred option.
TD Economics | www.td.com/economics
14December22,2011
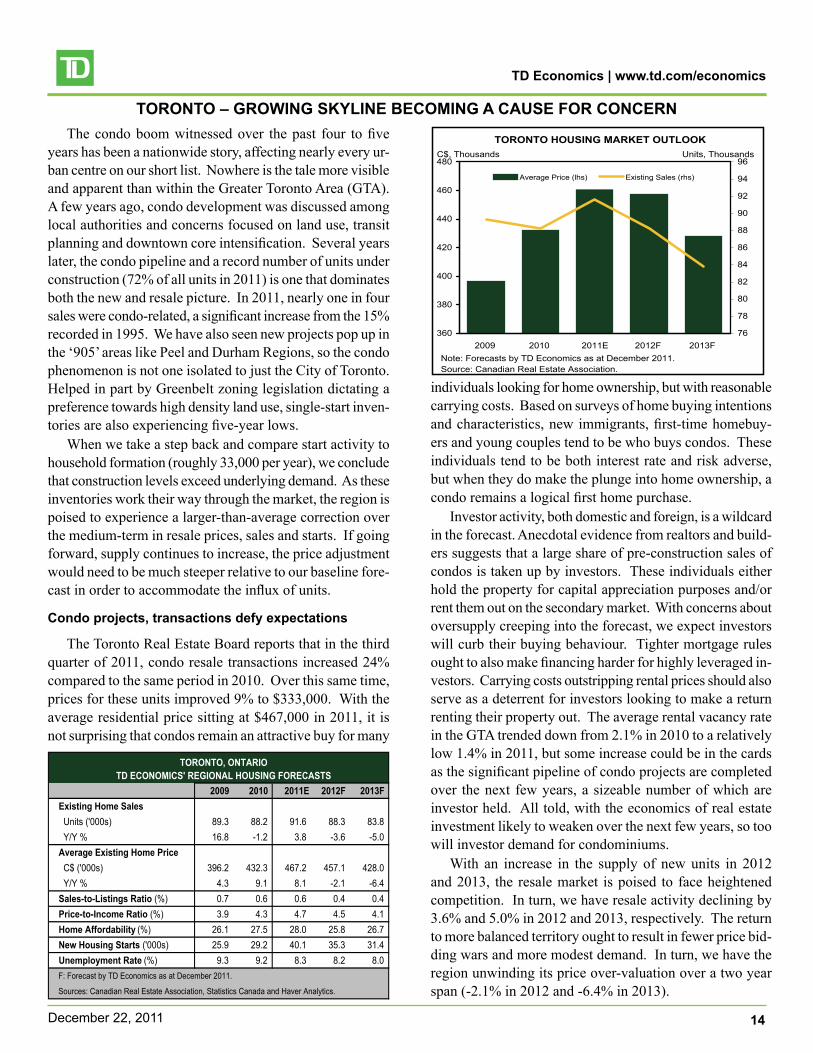
TORONTO – GROWING SKYLINE BECOMING A CAUSE FOR CONCERNThe condo boom witnessed over the past four to five
years has been a nationwide story, affecting nearly every ur-ban centre on our short list. Nowhere is the tale more visible and apparent than within the Greater Toronto Area (GTA). A few years ago, condo development was discussed among local authorities and concerns focused on land use, transit planning and downtown core intensification. Several years later, the condo pipeline and a record number of units under construction (72% of all units in 2011) is one that dominates both the new and resale picture. In 2011, nearly one in four sales were condo-related, a significant increase from the 15% recorded in 1995. We have also seen new projects pop up in the ‘905’ areas like Peel and Durham Regions, so the condo phenomenon is not one isolated to just the City of Toronto. Helped in part by Greenbelt zoning legislation dictating a preference towards high density land use, single-start inven-tories are also experiencing five-year lows.
When we take a step back and compare start activity to household formation (roughly 33,000 per year), we conclude that construction levels exceed underlying demand. As these inventories work their way through the market, the region is poised to experience a larger-than-average correction over the medium-term in resale prices, sales and starts. If going forward, supply continues to increase, the price adjustment would need to be much steeper relative to our baseline fore-cast in order to accommodate the influx of units.
Condo projects, transactions defy expectations
The Toronto Real Estate Board reports that in the third quarter of 2011, condo resale transactions increased 24% compared to the same period in 2010. Over this same time, prices for these units improved 9% to $333,000. With the average residential price sitting at $467,000 in 2011, it is not surprising that condos remain an attractive buy for many
2009 2010 2011E 2012F 2013FExisting Home SalesUnits('000s) 89.3 88.2 91.6 88.3 83.8Y/Y% 16.8 -1.2 3.8 -3.6 -5.0Average Existing Home PriceC$('000s) 396.2 432.3 467.2 457.1 428.0Y/Y% 4.3 9.1 8.1 -2.1 -6.4Sales-to-Listings Ratio (%) 0.7 0.6 0.6 0.4 0.4Price-to-Income Ratio (%) 3.9 4.3 4.7 4.5 4.1Home Affordability (%) 26.1 27.5 28.0 25.8 26.7New Housing Starts ('000s) 25.9 29.2 40.1 35.3 31.4Unemployment Rate(%) 9.3 9.2 8.3 8.2 8.0F:ForecastbyTDEconomicsasatDecember2011.
Sources:CanadianRealEstateAssociation,StatisticsCanadaandHaverAnalytics.
TORONTO, ONTARIO TD ECONOMICS' REGIONAL HOUSING FORECASTS
TORONTO HOUSING MARKET OUTLOOK
360
380
400
420
440
460
480
2009 2010 2011E 2012F 2013F76
78
80
82
84
86
88
90
92
94
96
AveragePrice(lhs) ExistingSales(rhs)
Note:ForecastsbyTDEconomicsasatDecember2011.Source:CanadianRealEstateAssociation.
C$,Thousands Units,Thousands
individuals looking for home ownership, but with reasonable carrying costs. Based on surveys of home buying intentions and characteristics, new immigrants, first-time homebuy-ers and young couples tend to be who buys condos. These individuals tend to be both interest rate and risk adverse, but when they do make the plunge into home ownership, a condo remains a logical first home purchase.
Investor activity, both domestic and foreign, is a wildcard in the forecast. Anecdotal evidence from realtors and build-ers suggests that a large share of pre-construction sales of condos is taken up by investors. These individuals either hold the property for capital appreciation purposes and/or rent them out on the secondary market. With concerns about oversupply creeping into the forecast, we expect investors will curb their buying behaviour. Tighter mortgage rules ought to also make financing harder for highly leveraged in-vestors. Carrying costs outstripping rental prices should also serve as a deterrent for investors looking to make a return renting their property out. The average rental vacancy rate in the GTA trended down from 2.1% in 2010 to a relatively low 1.4% in 2011, but some increase could be in the cards as the significant pipeline of condo projects are completed over the next few years, a sizeable number of which are investor held. All told, with the economics of real estate investment likely to weaken over the next few years, so too will investor demand for condominiums.
With an increase in the supply of new units in 2012 and 2013, the resale market is poised to face heightened competition. In turn, we have resale activity declining by 3.6% and 5.0% in 2012 and 2013, respectively. The return to more balanced territory ought to result in fewer price bid-ding wars and more modest demand. In turn, we have the region unwinding its price over-valuation over a two year span (-2.1% in 2012 and -6.4% in 2013).
TD Economics | www.td.com/economics
15December22,2011
MONTRÉAL – A HEAD START ON THE CORRECTION JOURNEY
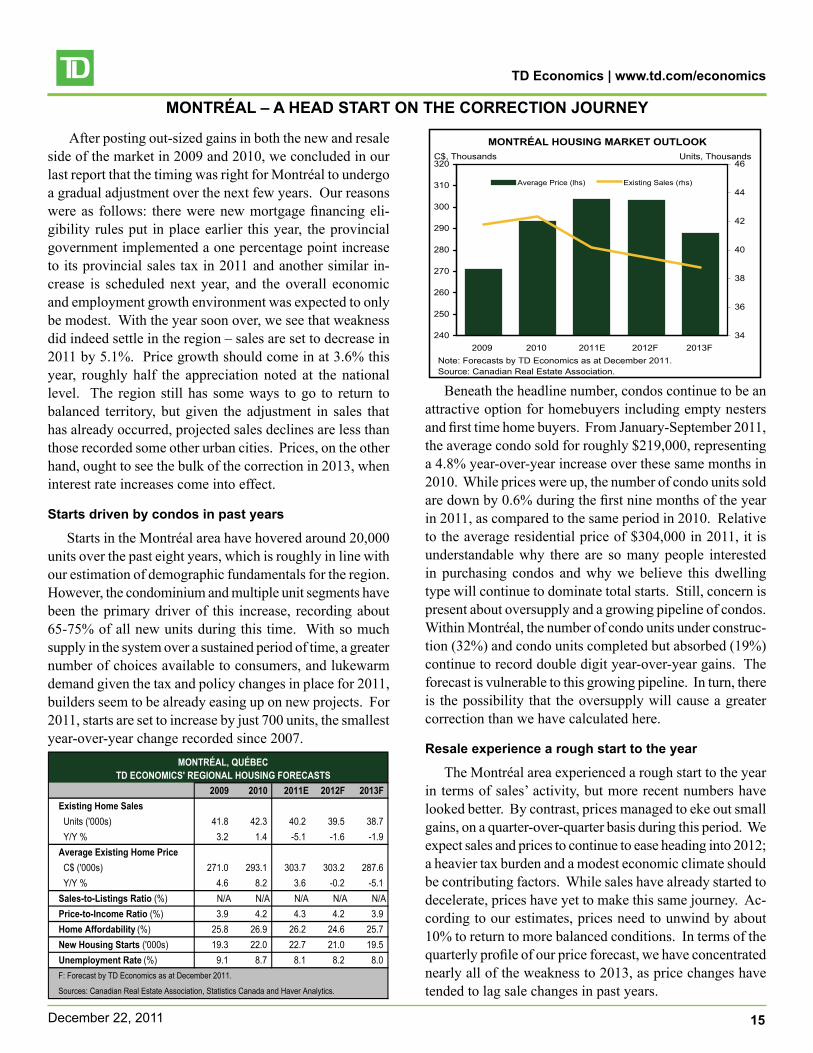
After posting out-sized gains in both the new and resale side of the market in 2009 and 2010, we concluded in our last report that the timing was right for Montréal to undergo a gradual adjustment over the next few years. Our reasons were as follows: there were new mortgage financing eli-gibility rules put in place earlier this year, the provincial government implemented a one percentage point increase to its provincial sales tax in 2011 and another similar in-crease is scheduled next year, and the overall economic and employment growth environment was expected to only be modest. With the year soon over, we see that weakness did indeed settle in the region – sales are set to decrease in 2011 by 5.1%. Price growth should come in at 3.6% this year, roughly half the appreciation noted at the national level. The region still has some ways to go to return to balanced territory, but given the adjustment in sales that has already occurred, projected sales declines are less than those recorded some other urban cities. Prices, on the other hand, ought to see the bulk of the correction in 2013, when interest rate increases come into effect.
Starts driven by condos in past years
Starts in the Montréal area have hovered around 20,000 units over the past eight years, which is roughly in line with our estimation of demographic fundamentals for the region. However, the condominium and multiple unit segments have been the primary driver of this increase, recording about 65-75% of all new units during this time. With so much supply in the system over a sustained period of time, a greater number of choices available to consumers, and lukewarm demand given the tax and policy changes in place for 2011, builders seem to be already easing up on new projects. For 2011, starts are set to increase by just 700 units, the smallest year-over-year change recorded since 2007.
2009 2010 2011E 2012F 2013FExisting Home SalesUnits('000s) 41.8 42.3 40.2 39.5 38.7Y/Y% 3.2 1.4 -5.1 -1.6 -1.9Average Existing Home PriceC$('000s) 271.0 293.1 303.7 303.2 287.6Y/Y% 4.6 8.2 3.6 -0.2 -5.1Sales-to-Listings Ratio (%) N/A N/A N/A N/A N/APrice-to-Income Ratio (%) 3.9 4.2 4.3 4.2 3.9Home Affordability (%) 25.8 26.9 26.2 24.6 25.7New Housing Starts ('000s) 19.3 22.0 22.7 21.0 19.5Unemployment Rate(%) 9.1 8.7 8.1 8.2 8.0F:ForecastbyTDEconomicsasatDecember2011.
Sources:CanadianRealEstateAssociation,StatisticsCanadaandHaverAnalytics.
MONTRÉAL, QUÉBEC TD ECONOMICS' REGIONAL HOUSING FORECASTS
MONTRÉAL HOUSING MARKET OUTLOOK
240
250
260
270
280
290
300
310
320
2009 2010 2011E 2012F 2013F34
36
38
40
42
44
46
AveragePrice(lhs) ExistingSales(rhs)
Note:ForecastsbyTDEconomicsasatDecember2011.Source:CanadianRealEstateAssociation.
C$,Thousands Units,Thousands
Beneath the headline number, condos continue to be an attractive option for homebuyers including empty nesters and first time home buyers. From January-September 2011, the average condo sold for roughly $219,000, representing a 4.8% year-over-year increase over these same months in 2010. While prices were up, the number of condo units sold are down by 0.6% during the first nine months of the year in 2011, as compared to the same period in 2010. Relative to the average residential price of $304,000 in 2011, it is understandable why there are so many people interested in purchasing condos and why we believe this dwelling type will continue to dominate total starts. Still, concern is present about oversupply and a growing pipeline of condos. Within Montréal, the number of condo units under construc-tion (32%) and condo units completed but absorbed (19%) continue to record double digit year-over-year gains. The forecast is vulnerable to this growing pipeline. In turn, there is the possibility that the oversupply will cause a greater correction than we have calculated here.
Resale experience a rough start to the year
The Montréal area experienced a rough start to the year in terms of sales’ activity, but more recent numbers have looked better. By contrast, prices managed to eke out small gains, on a quarter-over-quarter basis during this period. We expect sales and prices to continue to ease heading into 2012; a heavier tax burden and a modest economic climate should be contributing factors. While sales have already started to decelerate, prices have yet to make this same journey. Ac-cording to our estimates, prices need to unwind by about 10% to return to more balanced conditions. In terms of the quarterly profile of our price forecast, we have concentrated nearly all of the weakness to 2013, as price changes have tended to lag sale changes in past years.
TD Economics | www.td.com/economics
16December22,2011
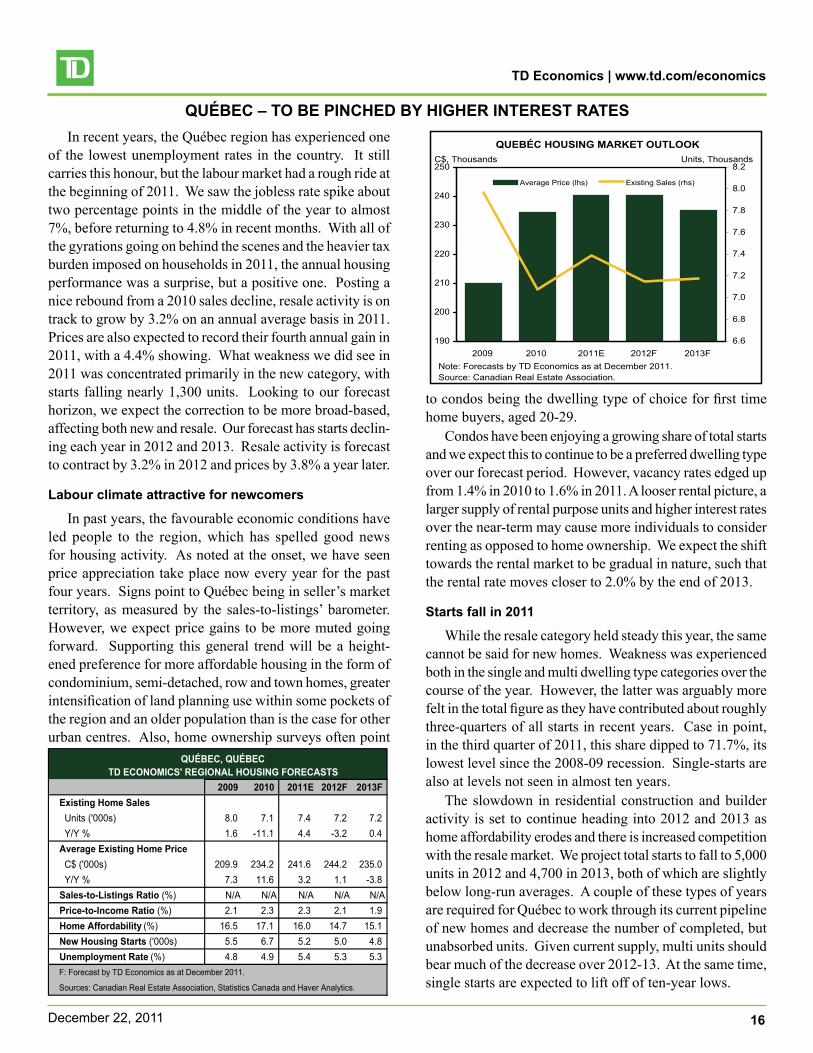
QUÉBEC – TO BE PINCHED BY HIGHER INTEREST RATESIn recent years, the Québec region has experienced one
of the lowest unemployment rates in the country. It still carries this honour, but the labour market had a rough ride at the beginning of 2011. We saw the jobless rate spike about two percentage points in the middle of the year to almost 7%, before returning to 4.8% in recent months. With all of the gyrations going on behind the scenes and the heavier tax burden imposed on households in 2011, the annual housing performance was a surprise, but a positive one. Posting a nice rebound from a 2010 sales decline, resale activity is on track to grow by 3.2% on an annual average basis in 2011. Prices are also expected to record their fourth annual gain in 2011, with a 4.4% showing. What weakness we did see in 2011 was concentrated primarily in the new category, with starts falling nearly 1,300 units. Looking to our forecast horizon, we expect the correction to be more broad-based, affecting both new and resale. Our forecast has starts declin-ing each year in 2012 and 2013. Resale activity is forecast to contract by 3.2% in 2012 and prices by 3.8% a year later.
Labour climate attractive for newcomers
In past years, the favourable economic conditions have led people to the region, which has spelled good news for housing activity. As noted at the onset, we have seen price appreciation take place now every year for the past four years. Signs point to Québec being in seller’s market territory, as measured by the sales-to-listings’ barometer. However, we expect price gains to be more muted going forward. Supporting this general trend will be a height-ened preference for more affordable housing in the form of condominium, semi-detached, row and town homes, greater intensification of land planning use within some pockets of the region and an older population than is the case for other urban centres. Also, home ownership surveys often point
2009 2010 2011E 2012F 2013FExisting Home SalesUnits('000s) 8.0 7.1 7.4 7.2 7.2Y/Y% 1.6 -11.1 4.4 -3.2 0.4Average Existing Home PriceC$('000s) 209.9 234.2 241.6 244.2 235.0Y/Y% 7.3 11.6 3.2 1.1 -3.8Sales-to-Listings Ratio (%) N/A N/A N/A N/A N/APrice-to-Income Ratio (%) 2.1 2.3 2.3 2.1 1.9Home Affordability (%) 16.5 17.1 16.0 14.7 15.1New Housing Starts ('000s) 5.5 6.7 5.2 5.0 4.8Unemployment Rate(%) 4.8 4.9 5.4 5.3 5.3F:ForecastbyTDEconomicsasatDecember2011.
Sources:CanadianRealEstateAssociation,StatisticsCanadaandHaverAnalytics.
QUÉBEC, QUÉBECTD ECONOMICS' REGIONAL HOUSING FORECASTS
QUEBÉC HOUSING MARKET OUTLOOK
190
200
210
220
230
240
250
2009 2010 2011E 2012F 2013F6.6
6.8
7.0
7.2
7.4
7.6
7.8
8.0
8.2
AveragePrice(lhs) ExistingSales(rhs)
Note:ForecastsbyTDEconomicsasatDecember2011.Source:CanadianRealEstateAssociation.
C$,Thousands Units,Thousands
to condos being the dwelling type of choice for first time home buyers, aged 20-29.
Condos have been enjoying a growing share of total starts and we expect this to continue to be a preferred dwelling type over our forecast period. However, vacancy rates edged up from 1.4% in 2010 to 1.6% in 2011. A looser rental picture, a larger supply of rental purpose units and higher interest rates over the near-term may cause more individuals to consider renting as opposed to home ownership. We expect the shift towards the rental market to be gradual in nature, such that the rental rate moves closer to 2.0% by the end of 2013.
Starts fall in 2011
While the resale category held steady this year, the same cannot be said for new homes. Weakness was experienced both in the single and multi dwelling type categories over the course of the year. However, the latter was arguably more felt in the total figure as they have contributed about roughly three-quarters of all starts in recent years. Case in point, in the third quarter of 2011, this share dipped to 71.7%, its lowest level since the 2008-09 recession. Single-starts are also at levels not seen in almost ten years.
The slowdown in residential construction and builder activity is set to continue heading into 2012 and 2013 as home affordability erodes and there is increased competition with the resale market. We project total starts to fall to 5,000 units in 2012 and 4,700 in 2013, both of which are slightly below long-run averages. A couple of these types of years are required for Québec to work through its current pipeline of new homes and decrease the number of completed, but unabsorbed units. Given current supply, multi units should bear much of the decrease over 2012-13. At the same time, single starts are expected to lift off of ten-year lows.
TD Economics | www.td.com/economics
17December22,2011
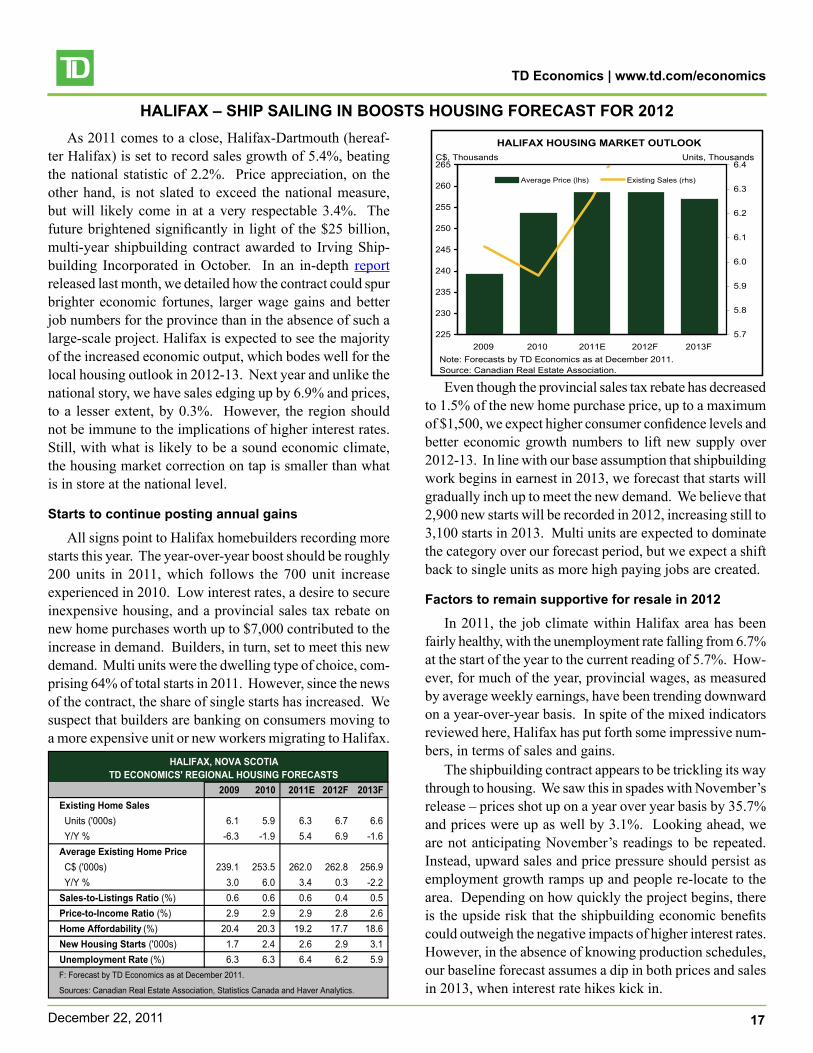
HALIFAX – SHIP SAILING IN BOOSTS HOUSING FORECAST FOR 2012As 2011 comes to a close, Halifax-Dartmouth (hereaf-
ter Halifax) is set to record sales growth of 5.4%, beating the national statistic of 2.2%. Price appreciation, on the other hand, is not slated to exceed the national measure, but will likely come in at a very respectable 3.4%. The future brightened significantly in light of the $25 billion, multi-year shipbuilding contract awarded to Irving Ship-building Incorporated in October. In an in-depth report released last month, we detailed how the contract could spur brighter economic fortunes, larger wage gains and better job numbers for the province than in the absence of such a large-scale project. Halifax is expected to see the majority of the increased economic output, which bodes well for the local housing outlook in 2012-13. Next year and unlike the national story, we have sales edging up by 6.9% and prices, to a lesser extent, by 0.3%. However, the region should not be immune to the implications of higher interest rates. Still, with what is likely to be a sound economic climate, the housing market correction on tap is smaller than what is in store at the national level.
Starts to continue posting annual gains
All signs point to Halifax homebuilders recording more starts this year. The year-over-year boost should be roughly 200 units in 2011, which follows the 700 unit increase experienced in 2010. Low interest rates, a desire to secure inexpensive housing, and a provincial sales tax rebate on new home purchases worth up to $7,000 contributed to the increase in demand. Builders, in turn, set to meet this new demand. Multi units were the dwelling type of choice, com-prising 64% of total starts in 2011. However, since the news of the contract, the share of single starts has increased. We suspect that builders are banking on consumers moving to a more expensive unit or new workers migrating to Halifax.
2009 2010 2011E 2012F 2013FExisting Home SalesUnits('000s) 6.1 5.9 6.3 6.7 6.6Y/Y% -6.3 -1.9 5.4 6.9 -1.6Average Existing Home PriceC$('000s) 239.1 253.5 262.0 262.8 256.9Y/Y% 3.0 6.0 3.4 0.3 -2.2Sales-to-Listings Ratio (%) 0.6 0.6 0.6 0.4 0.5Price-to-Income Ratio (%) 2.9 2.9 2.9 2.8 2.6Home Affordability (%) 20.4 20.3 19.2 17.7 18.6New Housing Starts ('000s) 1.7 2.4 2.6 2.9 3.1Unemployment Rate(%) 6.3 6.3 6.4 6.2 5.9F:ForecastbyTDEconomicsasatDecember2011.
Sources:CanadianRealEstateAssociation,StatisticsCanadaandHaverAnalytics.
HALIFAX, NOVA SCOTIA TD ECONOMICS' REGIONAL HOUSING FORECASTS
HALIFAX HOUSING MARKET OUTLOOK
225
230
235
240
245
250
255
260
265
2009 2010 2011E 2012F 2013F5.7
5.8
5.9
6.0
6.1
6.2
6.3
6.4
AveragePrice(lhs) ExistingSales(rhs)
Note:ForecastsbyTDEconomicsasatDecember2011.Source:CanadianRealEstateAssociation.
C$,Thousands Units,Thousands
Even though the provincial sales tax rebate has decreased to 1.5% of the new home purchase price, up to a maximum of $1,500, we expect higher consumer confidence levels and better economic growth numbers to lift new supply over 2012-13. In line with our base assumption that shipbuilding work begins in earnest in 2013, we forecast that starts will gradually inch up to meet the new demand. We believe that 2,900 new starts will be recorded in 2012, increasing still to 3,100 starts in 2013. Multi units are expected to dominate the category over our forecast period, but we expect a shift back to single units as more high paying jobs are created.
Factors to remain supportive for resale in 2012
In 2011, the job climate within Halifax area has been fairly healthy, with the unemployment rate falling from 6.7% at the start of the year to the current reading of 5.7%. How-ever, for much of the year, provincial wages, as measured by average weekly earnings, have been trending downward on a year-over-year basis. In spite of the mixed indicators reviewed here, Halifax has put forth some impressive num-bers, in terms of sales and gains.
The shipbuilding contract appears to be trickling its way through to housing. We saw this in spades with November’s release – prices shot up on a year over year basis by 35.7% and prices were up as well by 3.1%. Looking ahead, we are not anticipating November’s readings to be repeated. Instead, upward sales and price pressure should persist as employment growth ramps up and people re-locate to the area. Depending on how quickly the project begins, there is the upside risk that the shipbuilding economic benefits could outweigh the negative impacts of higher interest rates. However, in the absence of knowing production schedules, our baseline forecast assumes a dip in both prices and sales in 2013, when interest rate hikes kick in.
TD Economics | www.td.com/economics
18December22,2011
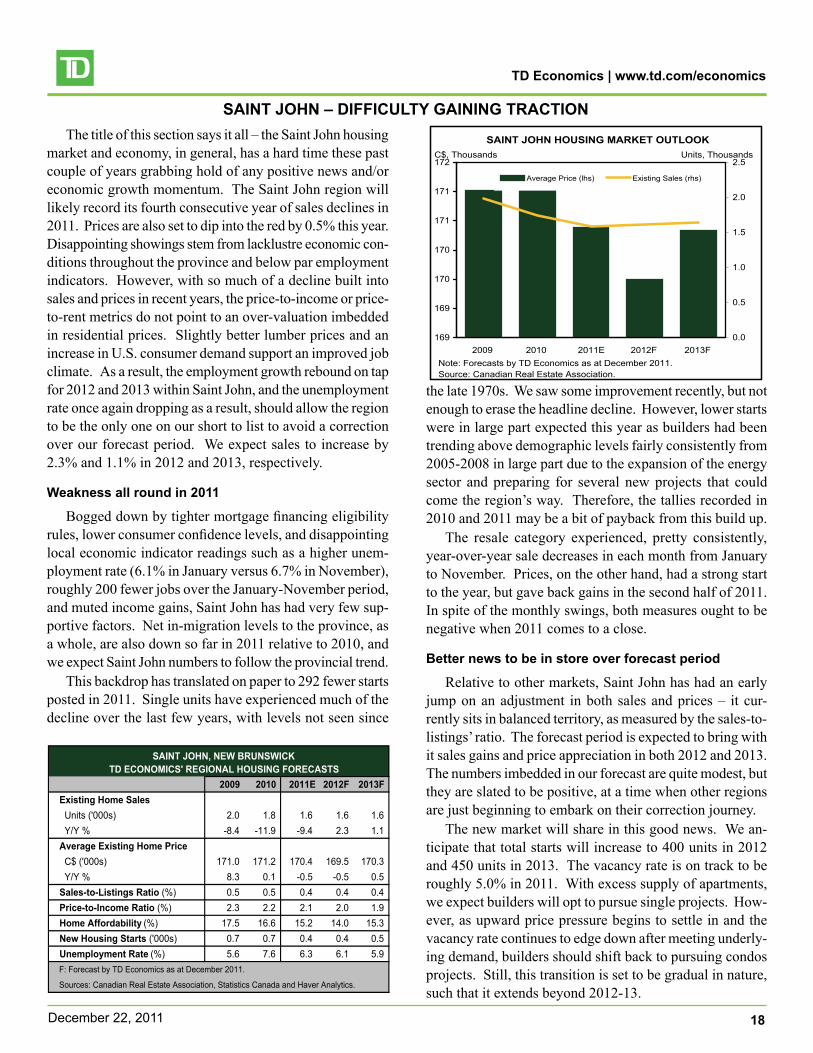
SAINT JOHN – DIFFICULTY GAINING TRACTIONThe title of this section says it all – the Saint John housing
market and economy, in general, has a hard time these past couple of years grabbing hold of any positive news and/or economic growth momentum. The Saint John region will likely record its fourth consecutive year of sales declines in 2011. Prices are also set to dip into the red by 0.5% this year. Disappointing showings stem from lacklustre economic con-ditions throughout the province and below par employment indicators. However, with so much of a decline built into sales and prices in recent years, the price-to-income or price-to-rent metrics do not point to an over-valuation imbedded in residential prices. Slightly better lumber prices and an increase in U.S. consumer demand support an improved job climate. As a result, the employment growth rebound on tap for 2012 and 2013 within Saint John, and the unemployment rate once again dropping as a result, should allow the region to be the only one on our short to list to avoid a correction over our forecast period. We expect sales to increase by 2.3% and 1.1% in 2012 and 2013, respectively.
Weakness all round in 2011
Bogged down by tighter mortgage financing eligibility rules, lower consumer confidence levels, and disappointing local economic indicator readings such as a higher unem-ployment rate (6.1% in January versus 6.7% in November), roughly 200 fewer jobs over the January-November period, and muted income gains, Saint John has had very few sup-portive factors. Net in-migration levels to the province, as a whole, are also down so far in 2011 relative to 2010, and we expect Saint John numbers to follow the provincial trend.
This backdrop has translated on paper to 292 fewer starts posted in 2011. Single units have experienced much of the decline over the last few years, with levels not seen since
2009 2010 2011E 2012F 2013FExisting Home SalesUnits('000s) 2.0 1.8 1.6 1.6 1.6Y/Y% -8.4 -11.9 -9.4 2.3 1.1Average Existing Home PriceC$('000s) 171.0 171.2 170.4 169.5 170.3Y/Y% 8.3 0.1 -0.5 -0.5 0.5Sales-to-Listings Ratio (%) 0.5 0.5 0.4 0.4 0.4Price-to-Income Ratio (%) 2.3 2.2 2.1 2.0 1.9Home Affordability (%) 17.5 16.6 15.2 14.0 15.3New Housing Starts ('000s) 0.7 0.7 0.4 0.4 0.5Unemployment Rate(%) 5.6 7.6 6.3 6.1 5.9F:ForecastbyTDEconomicsasatDecember2011.
Sources:CanadianRealEstateAssociation,StatisticsCanadaandHaverAnalytics.
SAINT JOHN, NEW BRUNSWICK TD ECONOMICS' REGIONAL HOUSING FORECASTS
SAINT JOHN HOUSING MARKET OUTLOOK
169
169
170
170
171
171
172
2009 2010 2011E 2012F 2013F0.0
0.5
1.0
1.5
2.0
2.5
AveragePrice(lhs) ExistingSales(rhs)
Note:ForecastsbyTDEconomicsasatDecember2011.Source:CanadianRealEstateAssociation.
C$,Thousands Units,Thousands
the late 1970s. We saw some improvement recently, but not enough to erase the headline decline. However, lower starts were in large part expected this year as builders had been trending above demographic levels fairly consistently from 2005-2008 in large part due to the expansion of the energy sector and preparing for several new projects that could come the region’s way. Therefore, the tallies recorded in 2010 and 2011 may be a bit of payback from this build up.
The resale category experienced, pretty consistently, year-over-year sale decreases in each month from January to November. Prices, on the other hand, had a strong start to the year, but gave back gains in the second half of 2011. In spite of the monthly swings, both measures ought to be negative when 2011 comes to a close.
Better news to be in store over forecast period
Relative to other markets, Saint John has had an early jump on an adjustment in both sales and prices – it cur-rently sits in balanced territory, as measured by the sales-to-listings’ ratio. The forecast period is expected to bring with it sales gains and price appreciation in both 2012 and 2013. The numbers imbedded in our forecast are quite modest, but they are slated to be positive, at a time when other regions are just beginning to embark on their correction journey.
The new market will share in this good news. We an-ticipate that total starts will increase to 400 units in 2012 and 450 units in 2013. The vacancy rate is on track to be roughly 5.0% in 2011. With excess supply of apartments, we expect builders will opt to pursue single projects. How-ever, as upward price pressure begins to settle in and the vacancy rate continues to edge down after meeting underly-ing demand, builders should shift back to pursuing condos projects. Still, this transition is set to be gradual in nature, such that it extends beyond 2012-13.
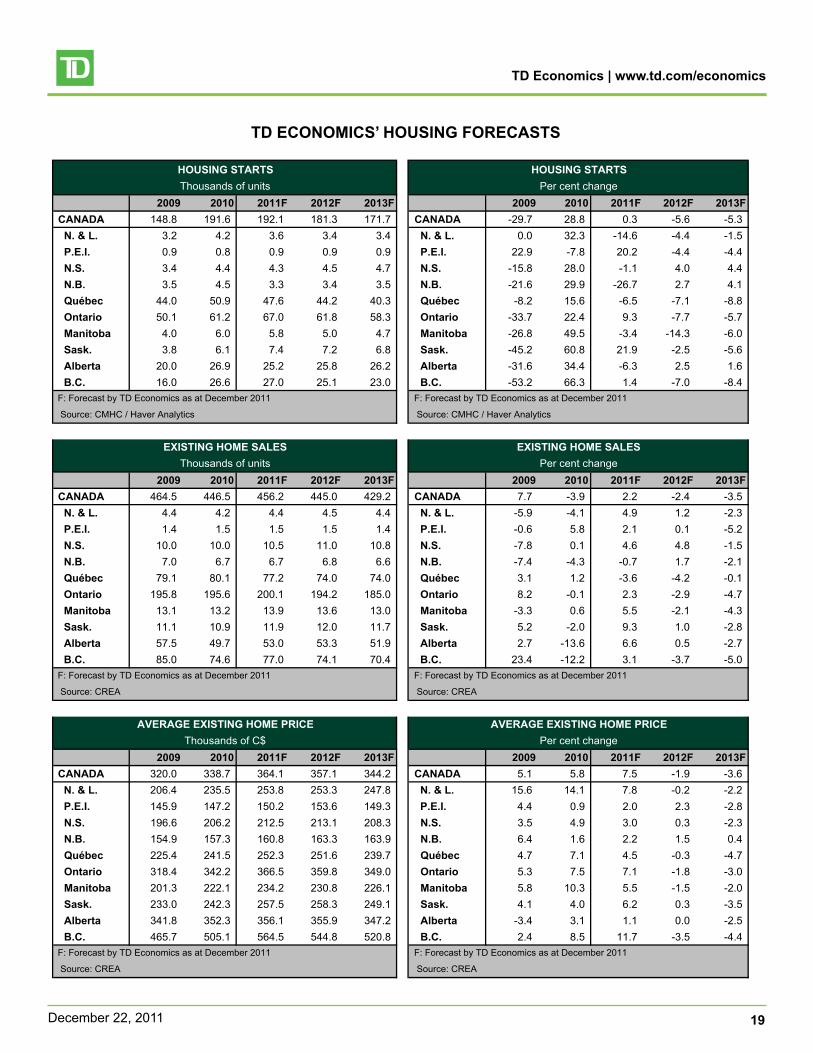
TD Economics | www.td.com/economics
19December22,2011
2009 2010 2011F 2012F 2013F 2009 2010 2011F 2012F 2013FCANADA 148.8 191.6 192.1 181.3 171.7 CANADA -29.7 28.8 0.3 -5.6 -5.3 N. & L. 3.2 4.2 3.6 3.4 3.4 N. & L. 0.0 32.3 -14.6 -4.4 -1.5 P.E.I. 0.9 0.8 0.9 0.9 0.9 P.E.I. 22.9 -7.8 20.2 -4.4 -4.4 N.S. 3.4 4.4 4.3 4.5 4.7 N.S. -15.8 28.0 -1.1 4.0 4.4 N.B. 3.5 4.5 3.3 3.4 3.5 N.B. -21.6 29.9 -26.7 2.7 4.1 Québec 44.0 50.9 47.6 44.2 40.3 Québec -8.2 15.6 -6.5 -7.1 -8.8 Ontario 50.1 61.2 67.0 61.8 58.3 Ontario -33.7 22.4 9.3 -7.7 -5.7 Manitoba 4.0 6.0 5.8 5.0 4.7 Manitoba -26.8 49.5 -3.4 -14.3 -6.0 Sask. 3.8 6.1 7.4 7.2 6.8 Sask. -45.2 60.8 21.9 -2.5 -5.6 Alberta 20.0 26.9 25.2 25.8 26.2 Alberta -31.6 34.4 -6.3 2.5 1.6 B.C. 16.0 26.6 27.0 25.1 23.0 B.C. -53.2 66.3 1.4 -7.0 -8.4
2009 2010 2011F 2012F 2013F 2009 2010 2011F 2012F 2013FCANADA 464.5 446.5 456.2 445.0 429.2 CANADA 7.7 -3.9 2.2 -2.4 -3.5 N. & L. 4.4 4.2 4.4 4.5 4.4 N. & L. -5.9 -4.1 4.9 1.2 -2.3 P.E.I. 1.4 1.5 1.5 1.5 1.4 P.E.I. -0.6 5.8 2.1 0.1 -5.2 N.S. 10.0 10.0 10.5 11.0 10.8 N.S. -7.8 0.1 4.6 4.8 -1.5 N.B. 7.0 6.7 6.7 6.8 6.6 N.B. -7.4 -4.3 -0.7 1.7 -2.1 Québec 79.1 80.1 77.2 74.0 74.0 Québec 3.1 1.2 -3.6 -4.2 -0.1 Ontario 195.8 195.6 200.1 194.2 185.0 Ontario 8.2 -0.1 2.3 -2.9 -4.7 Manitoba 13.1 13.2 13.9 13.6 13.0 Manitoba -3.3 0.6 5.5 -2.1 -4.3 Sask. 11.1 10.9 11.9 12.0 11.7 Sask. 5.2 -2.0 9.3 1.0 -2.8 Alberta 57.5 49.7 53.0 53.3 51.9 Alberta 2.7 -13.6 6.6 0.5 -2.7 B.C. 85.0 74.6 77.0 74.1 70.4 B.C. 23.4 -12.2 3.1 -3.7 -5.0
2009 2010 2011F 2012F 2013F 2009 2010 2011F 2012F 2013FCANADA 320.0 338.7 364.1 357.1 344.2 CANADA 5.1 5.8 7.5 -1.9 -3.6 N. & L. 206.4 235.5 253.8 253.3 247.8 N. & L. 15.6 14.1 7.8 -0.2 -2.2 P.E.I. 145.9 147.2 150.2 153.6 149.3 P.E.I. 4.4 0.9 2.0 2.3 -2.8 N.S. 196.6 206.2 212.5 213.1 208.3 N.S. 3.5 4.9 3.0 0.3 -2.3 N.B. 154.9 157.3 160.8 163.3 163.9 N.B. 6.4 1.6 2.2 1.5 0.4 Québec 225.4 241.5 252.3 251.6 239.7 Québec 4.7 7.1 4.5 -0.3 -4.7 Ontario 318.4 342.2 366.5 359.8 349.0 Ontario 5.3 7.5 7.1 -1.8 -3.0 Manitoba 201.3 222.1 234.2 230.8 226.1 Manitoba 5.8 10.3 5.5 -1.5 -2.0 Sask. 233.0 242.3 257.5 258.3 249.1 Sask. 4.1 4.0 6.2 0.3 -3.5 Alberta 341.8 352.3 356.1 355.9 347.2 Alberta -3.4 3.1 1.1 0.0 -2.5 B.C. 465.7 505.1 564.5 544.8 520.8 B.C. 2.4 8.5 11.7 -3.5 -4.4
F:ForecastbyTDEconomicsasatDecember2011
Source:CREA
AVERAGE EXISTING HOME PRICEPercentchange
Source:CREA
F:ForecastbyTDEconomicsasatDecember2011
HOUSING STARTSThousandsofunits
HOUSING STARTSPercentchange
F:ForecastbyTDEconomicsasatDecember2011
Source:CMHC/HaverAnalytics
F:ForecastbyTDEconomicsasatDecember2011
Source:CMHC/HaverAnalytics
EXISTING HOME SALESThousandsofunits
F:ForecastbyTDEconomicsasatDecember2011
Source:CREA
F:ForecastbyTDEconomicsasatDecember2011
Source:CREA
PercentchangeEXISTING HOME SALES
AVERAGE EXISTING HOME PRICEThousandsofC$
TD ECONOMICS’ HOUSING FORECASTS

TD Economics | www.td.com/economics
20December22,2011
ThisreportisprovidedbyTDEconomics.Itisforinformationpurposesonlyandmaynotbeappropriateforotherpurposes.Thereportdoesnotprovidematerial informationabout thebusinessandaffairsofTDBankGroupand themembersofTDEconomicsarenotspokespersonsforTDBankGroupwithrespecttoitsbusinessandaffairs.Theinformationcontainedinthisreporthasbeendrawnfromsourcesbelievedtobereliable,but isnotguaranteedtobeaccurateorcomplete.Thereportcontainseconomicanalysisandviews,includingaboutfutureeconomicandfinancialmarketsperformance.Thesearebasedoncertainassumptionsandotherfactors,andaresubjecttoinherentrisksanduncertainties.Theactualoutcomemaybemateriallydifferent.TheToronto-DominionBankanditsaffiliatesandrelatedentitiesthatcompriseTDBankGrouparenotliableforanyerrorsoromissionsintheinformation,analysisorviewscontainedinthisreport,orforanylossordamagesuffered.