teachers in south africa - embury · 2018-09-14 · pgce postgraduate certificate in education reqv...
TRANSCRIPT

TEACHERS IN SOUTH AFRICA
SUPPLY AND DEMAND 2013–2025
March 2015

Published in March 2015 by The Centre for Development and Enterprise
5 Eton Road, Parktown, Johannesburg 2193, South Africa
P O Box 1936, Johannesburg 2000, South Africa
Tel +27 11 482 5140 • Fax +27 11 482 5089 • [email protected] • www.cde.org.za
© The Centre for Development and Enterprise
All rights reserved. This publication may not be reproduced, stored, or transmitted without the
express permission of the publisher. It may be quoted, and short extracts used, provided the source
is fully acknowledged.
ISBN: 978-1-920653-18-7
The Centre for Development and Enterprise, South Africa’s leading development think tank, focuses on vital
national development issues and their relationship to economic growth and democratic consolidation.
Through examining South African realities and international experience, CDE formulates practical policy
proposals for addressing major social and economic challenges. It has a special interest in the role of business
and markets in development.
Series editor: Ann Bernstein
This report is based on three background research papers written for CDE by Dr Charles Simkins, Dr Roger Deacon
and Dr Peter Robinson. The report was written by Dr Jane Hofmeyr (CDE’s Education Policy and Advocacy Director)
and Dr Kim Draper (CDE’s Education Research Manager).
The research was funded by the Sasol Inzalo Foundation. The funders do not necessarily agree with the views
expressed in the report.
The full report, as well as the CDE Technical Report: Teacher supply and demand 2013-2025, are available on the
website www.cde.org.za.

Contents
Acronyms 2
Introduction 3
Government Strategy and Initiatives 4
Teacher Supply and Demand 8
Matching Teacher Supply and Demand 21
Summary of Main Findings 24
CDE Recommendations 27
Concluding Remarks 33
Endnotes 34

TEACHERS IN SOUTH AFRICA
Centre for Development and Enterprise2
ACRONYMS
ANAs Annual National Assessments
ASS Annual Schools Survey
B Ed Bachelor of Education
CDE Centre for Development and Enterprise
CESM Classification of Educational Subject Matter
CHE Council on Higher Education
CPTD Continuing Professional Teacher Development
DBE Department of Basic Education
DHET Department of Higher Education and Training
ECD Early Childhood Development
FL Funza Lushaka
FET Further Education and Training (Grades 10-12)
FP Foundation Phase (Grades R-3)
HEI Higher Education Institution
HEQC Higher Education Quality Committee
HoD Head of Department
IP Intermediate Phase (Grades 4-6)
ISASA Independent Schools Association of Southern Africa
ISPFTED Integrated Strategic Planning Framework for Teacher Education and Development
ITE Initial Teacher Education
KZN KwaZulu-Natal
LER Learner to Educator Ratio
LSEN Learners with Special Education Needs
MRTEQ Minimum Requirements for Teacher Education Qualifications
NGO Non-Governmental Organisation
NSC National Senior Certificate
NTG New Teacher Graduate
NWU North-West University
PED Provincial Education Department
PERSAL Personnel Salary System
PGCE Postgraduate Certificate in Education
REQV Relative Education Qualification Value
SACE South African Council for Educators
SP Senior Phase (Grades 7-9)
UKZN University of KwaZulu-Natal
UNISA University of South Africa

3March 2015
Supply and Demand 2013–2025
The quality of ITE programmes and teachers is of prime importance
INTRODUCTIONOne of the greatest challenges facing the South African education system is the production
of sufficient competent teachers, who can provide quality teaching for all school subjects
and phases.
Whether South Africa is able to meet this critical challenge is a question that has
motivated the Centre for Development and Enterprise (CDE) to undertake research
on teacher supply and demand. A 2011 CDE report1 indicated that South Africa was
producing only a third of the country’s requirement of some 25,000 new teachers a year,
and particularly too few in key subjects such as mathematics, science, commerce and
technology.
The seriousness of these findings led CDE to revisit teacher supply and demand to
determine if the situation had improved. Accordingly, it commissioned three experts
to update the 2011 research with the latest information. Dr Roger Deacon and Dr Peter
Robinson, respectively, investigated the public and private provision of initial teacher
education (ITE)2, and Dr Charles Simkins modelled teacher supply and demand from
2013 to 2025, using 2012 and 2013 data on public and independent ordinary schools. The
model is presented in detail in the CDE Technical Report: Teacher Supply and Demand
2013-2025,3 which is available on the CDE website.
This report is based on their research findings and seeks to address the key question:
“Will South Africa be able to produce enough qualified competent teachers for all school
phases and subjects over the next ten years?”
To answer this question, this report covers the following areas:
• Government strategy for improving the quantity and quality of ITE provision;
• The demand for teachers in the schooling system;
• The supply of new qualified teachers;
• The size and profile of the current teaching corps;
• The movement of teachers in and out of the schooling system; and
• Matching teacher supply and demand.
The report concludes with a summary of the main findings and recommendations. How
the model was constructed is presented in detail in the CDE Technical Report referred to
above.
Although the research for this report was predominantly quantitative, it also revealed
that the quality of ITE programmes and teachers is of prime importance. Researchers
and government agree that the subject content knowledge and pedagogical knowledge of
most South African teachers is poor and that this is a major cause of inadequate learner
achievement.4 That teachers lack essential knowledge and skills points to inadequate pre-
service teacher training, which is provided through ITE programmes at higher education
institutions (HEIs) in South Africa.

4 Centre for Development and Enterprise
TEACHERS IN SOUTH AFRICA
Researchers and government agree that
the subject content knowledge and
pedagogical content knowledge of most
South African teachers is poor and that this
is a major cause of inadequate learner
achievement
GOVERNMENT STRATEGY AND INITIATIVESIn the late 1990s, provision of ITE programmes plummeted owing to the misperception
that there were too many teachers. This misperception was based on a superficial
understanding of the findings of the 1995 National Teacher Education Audit5 and was
compounded by the subsequent closure of the colleges of education, many of which
were absorbed into universities. Decreased geographical accessibility to teacher
education programmes, coupled with the perceived low status of teaching and improved
career opportunities in other fields, resulted in a significant drop in teacher education
enrolments by black Africans in particular.
The reduction in the number of institutions providing ITE was accompanied by a
marked decline in bursary funding which traditionally had been administered by the
provincial education departments (PEDs).
While the concentration of teacher education in the universities may in general
have enhanced its quality, not all institutions, especially those which themselves were
historically disadvantaged, could offer the same levels of training, engagement or support
to either lecturers or students. This was particularly the case with universities that inherited
a teacher education programme from a poor quality former college rather than developing
the programme themselves. At the same time, the merging and/or restructuring of certain
universities reduced the attention and resources available to assure programme quality.6
In 2009, in response to increasing concern about the poor supply of new teachers
and the quality of ITE programmes, the Department of Basic Education (DBE) and the
Department of Higher Education and Training (DHET) called a multi-stakeholder Teacher
Development Summit to examine all the challenges relating to teacher development
and propose strategies to address them. This resulted in a co-ordinated plan for the
sector in 2011, the Integrated Strategic Planning Framework for Teacher Education and
Development in South Africa 2011-2025, also known as ISPFTED or the Plan.7
T H E I N T E G R AT E D S T R AT E G I C P L A N N I N G F R AM E WO R K F O R T E AC H E R E D U C AT I O N A N D D E V E LO P M E N T
The Plan is a high-level strategy that frames the quantitative and qualitative challenges
for teacher education and development, and outlines a 15-year plan for improved and
expanded teacher education and development opportunities with the primary outcome
as “to improve the quality of teacher education and development in order to improve the
quality of teachers and teaching”.8
The Plan covers schooling from Grades R to 12 and includes all the professionals
involved in the teacher development system – from those in education departments at
all levels, HEIs and statutory bodies, to classroom teachers – and addresses all phases of a
teacher’s career through recruitment, ITE, induction and Continuing Professional Teacher
Development (CPTD). The Plan is also a sectoral one which is aligned with the strategic
plans of both the DBE and DHET. This is most important because teacher education and
development is split across these two departments.9
Four strategic outputs are identified: addressing the individual and systemic needs of
teacher development, attracting increasing numbers of high-achieving school-leavers

5March 2015
Supply and Demand 2013–2025
A strategic plan of this nature and scope was well overdue and it signalled government’s determination to tackle teacher education and development issues.
into teaching, enhancing teacher support at the district level, and expanding and making
more accessible the formal teacher education system. The Plan sets out activities to
achieve short-term (2011-2014), medium-term (2011-2017) and long-term (2011-2025)
goals, and details who will be responsible for undertaking the tasks.
CDE regards the Plan as highly significant. A strategic plan of this nature and scope
was well overdue and it signalled government’s determination to tackle teacher education
and development issues. It was also the result of an inclusive process involving all key
stakeholders, not least the teacher unions.
Despite these strengths, the Plan stops short of identifying measurable deliverables
with specific annual targets for every level of the system (national, provincial, district)
to achieve. This makes it difficult to measure progress. Government has recognised this
and in 2014 launched Operation Phakisa, using the World Bank methodology of ‘Big Fast
Results Now’ to develop a detailed implementation plan for every level of the teacher
development system in order to speed up the achievement of specified deliverables. It is
a whole sector initiative with participation from teacher unions, higher education, basic
education, the private sector and key institutions such as the Council on Higher Education
(CHE), the South African Council for Educators (SACE) and Umalusi. For achieving
system improvement, the commitment of all stakeholders in education is critical.
A key weakness of the Plan is the model of expansion used in the light of the poor quality
of ITE programmes. The Plan is based on increasing the provision of ITE programmes at
all public HEIs for all phases of schooling through expanded enrolments in two existing
ITE qualifications, the Bachelor of Education (B Ed) and the Postgraduate Certificate in
Education (PGCE).
ITE institutional arrangements and approaches in a wide range of other countries were
researched to inform the Plan. The research found that
… multiple and innovative pathways to becoming a teacher have been established,
including the involvement of school consortia in the development of teachers. In some
countries, a nested, integrated, holistic network of delivery institutions have been
established at different levels of the system – national, provincial, regional and district
– to ensure accessibility and wider reach.10
However, none of these were proposed for the country although ‘more flexible and
accessible modes of delivering high-quality teacher education’11 is one of the Plan’s
strategic goals. This was a missed opportunity because internationally the trend is
towards opening up multiple pathways, especially school-based ones, and using different
modes of delivering ITE. These provide the flexibility that meets the needs of different
pools of potential teachers. For example, second-career professionals and later entrants
into the profession require routes into teaching which combine full-time, school-based
training and a qualification through distance education with a monthly allowance or
remuneration. South Africa should seek to introduce a wider range of ITE models instead
of relying on “more of the same” - even if it is of better quality.
Research into private ITE provision was conducted for the ISPFTED and found that
there it was limited, but the Plan did not investigate what role the private sector could
play in future to meet the needs of the country.
The professional development needs of teacher educators at HEIs are another gap in
the Plan, although it does examine CPTD for school teachers in great detail and identifies
the many steps that must be taken to meet their needs and those of the country effectively.
If the overriding goals of the ISPFTED are to expand and improve the quality of ITE, then

6 Centre for Development and Enterprise
TEACHERS IN SOUTH AFRICA
This review found that the majority of teacher education programmes
were not worthy of full accreditation
because they did not meet the minimum
standards as set by the review process. Of the 22 PGCE and 15 B Ed
programmes, only 7 of the former and 6 of the
latter were awarded full accreditation
many more teacher educators will be needed and their quality and ability to teach new
ITE curricula effectively is another important consideration.
I M P L E M E N TAT I O N O F T H E P L A N
In line with the ISPFTED the two national education departments have made impressive
progress in achieving its short and medium-term quantitative goals, and have begun to
address the qualitative ones.
Expansion of ITE
Since 2007 government has successfully launched a number of initiatives to increase the
supply of new teacher graduates: establishing the Funza Lushaka (FL) Bursary Scheme
for teaching students in 2007, expanding university capacity to deliver ITE programmes,
allocating additional funding to ITE provision, improving enrolment planning at provincial
and institutional levels, and increasing the number of universities offering Foundation
Phase (FP) programmes.
Between 2008 and 2010, additional funding of R570 million was provided to HEIs to
improve their infrastructure and efficiency, and thus strengthen their teacher education
provision. The allocation to FL has increased dramatically: from R109 million in 2007 to
just over R940 million in 2014. Between 2009 and 2012 more than 39,000 FL bursaries were
awarded and approximately 9,600 bursars graduated during that time. In 2013, 14,500
bursaries were awarded and more than 3,000 bursary recipients graduated as teachers.
Since 2009, ITE provision has expanded significantly. This is partly as a result of the
financial support of the European Union Sector Policy Support Programme launched in
2011. In 2014, 23 universities offered ITE programmes, including the two new universities,
the Sol Plaatje University in the Northern Cape and the University of Mpumalanga. New
teacher education college campuses are being established in provinces where they are
needed. For instance, in 2013 the former Ndebele College of Education was re-opened
and in 2014 incorporated into the University of Mpumalanga as the Siyabuswa Teacher
Education Campus to offer ITE for the FP and Intermediate Phase (IP), as well as CPTD
programmes.
A focus of government’s efforts has been the expanding and strengthening of the
provision of FP teacher education because of the dearth of FP graduates. Since 2009 the
number of universities committed to offer FP teacher education has increased from 13
to 22 in 2014, 16 of which already have their FP programmes in place and another 3 are
awaiting evaluation of their programmes. Government also allocated R141 million in a
new earmarked grant to research, programme development and materials development
activities focused on FP.
Quality Improvement
The poor quality of ITE programmes became startlingly evident in a review undertaken
by the Higher Education Quality Committee (HEQC) between 2005 and 2007 of four ITE
programmes – the Masters in Education, Advanced Certificate in Education, B Ed, and
PGCE.12 This review found that the majority of teacher education programmes were not
worthy of full accreditation because they did not meet the minimum standards as set by

7March 2015
Supply and Demand 2013–2025
ITE programmes have low entrance requirements in comparison with most other disciplines and students are accepted without any reference to what motivates them to become teachers
the review process. Of the 22 PGCE and 15 B Ed programmes, only seven of the former and
six of the latter were awarded full accreditation. A particular weakness was the practice
teaching component of the programmes.
The 2010 HEQC review had a direct and immediate impact on government planning
regarding the quality of teacher education. In part it influenced the development of the
policy on The Minimum Requirements for Teacher Education Qualifications (MRTEQ)13
in 2011. DHET gave notice that by July 2014, all teacher education programmes had to be
re-designed, so as to give particular emphasis to what is taught (subject or disciplinary
content knowledge), and how it is taught (pedagogical content knowledge), as well as a
strong practice teaching component. Only re-designed ITE programmes that conformed
to the MRTEQ policy would be approved and recognised as sufficient for graduates’
employment in education. By February 2015, 124 of the 169 submitted programmes had
been approved (73 per cent) and others are in the pipeline. DHET expects that in 2016 all
new student registrations will be for MRTEQ-aligned qualifications.
For a considerable time the national departments have been worried about teacher
utilisation because there is evidence that in schools teachers are placed in posts that
do not correspond with their teaching qualifications or subject specialisations.14
Consequently, improving teacher utilisation is one of the objectives of the ISPFTED and
the DBE’s latest Medium-Term Expenditure Framework.15 In order to understand the
extent of the problem so that it can be addressed, the DBE has instructed the PEDs to
enter into the Personnel Salary System (PERSAL) database a minimum of three subjects
that the teachers are qualified to teach, and what they were actually teaching. By August
2014 only a minority of PEDs had completed this task and it was clear that some of the
data was inaccurate and had not been checked.16
More recently, DHET has co-funded a multi-year study investigating the quality of
the English and mathematics curricula offered to B Ed students specialising in the IP
of schooling at five HEIs across South Africa. JET Education Services is conducting the
research and has released the first report.17 This study found that the content of modules
and hence of the B Ed programmes varied widely among institutions, with the greatest
variation in the amount of time devoted to and the quality in teaching practice. Most
programmes also seemed to lack a strong underlying logic and coherence.
The study also pointed to the fact that ITE programmes have low entrance requirements
in comparison with most other disciplines and students are accepted without any
reference to what motivates them to become teachers. The issue of low admission criteria
is an important factor: in most universities the B Ed programme has lower entrance
requirements than other undergraduate degree programmes, which means that weaker
students are attracted to the B Ed programme. By contrast in a country like Finland, the
best students are accepted for ITE qualifications.18
The report concluded that
…while there are some excellent practices, it is clear that, as a whole, none of the five
institutions studied is rising fully to the challenge posed by the country’s low quality
school system … 19
DHET has also launched two research projects to investigate the establishment of Teaching
Schools or ‘teaching laboratories’ where student teachers could engage in learning-from-
practice on a regular basis, and a possible network of Professional Practice Schools where
student teachers can be placed for extended periods of teaching practice.

8 Centre for Development and Enterprise
TEACHERS IN SOUTH AFRICA
Modelling should be seen as a way of
bringing together the influences bearing
on the system in a coherent and
appropriately weighted way to inform decision-
makers about patterns and trends
TEACHER SUPPLY AND DEMANDGiven the development of the Plan in 2011 and the education departments’ initiatives in
recent years, the key question is whether teacher supply and demand has changed since
CDE’s previous model which projected a severe shortage of teachers based on the low
production of new graduates in 2009. It is this question that the new CDE model seeks to
answer.
To construct this new CDE model, a number of datasets were used:
• The population statistics from the Spectrum database used by Statistics South
Africa to project the growth in the learner population over the next 10 years;
• The supply of teachers to the system from audited figures in DHET internal reports,
Trends in Teacher Supply, for four consecutive years, 2009 to 2012;
• The number of teachers in the system for five consecutive years, 2009 to 2013,
obtained from the DBE’s Education Statistics and School Realities;
• The movement of teachers in the system from two sources of teacher information:
PERSAL based on a secondary analysis of two internal DBE reports20, and two
consecutive years (2012 and 2013) of the DBE’s Annual Schools Survey (ASS) data.
The ASS data contain information on educators by characteristics relevant to the
analysis, notably gender, age, citizenship, qualification level, years of experience,
identity of employer (whether government or a school governing board); and
• The General Household Survey (2013) to investigate Grade R enrolments.
In the course of CDE’s research it was found that the various data sources were inaccurate,
incomplete or inconsistent in what they include. In the case of the available data for
PERSAL and the ASS database, the main sources used to construct the model, the
analyses lead to substantially different conclusions. These are discussed in detail in the
CDE Technical Report, which also explains how the model dealt with the data problems.
This means that although the CDE model presented in this report is the most up-to-
date, comprehensive and publicly available one, it cannot resolve the differences between
PERSAL and the ASS. In principle, these differences could be resolved in the future. Even
so, a revised model is a projection rather than a prediction and there will always be some
uncertainty about the information fed into it. For these reasons, even an improved model
should not be regarded as an infallible guide to the future. Rather modelling should be
seen as a way of bringing together the influences bearing on the system in a coherent
and appropriately weighted way to inform decision-makers about patterns and trends in
teacher supply and demand.
Because CDE had primary data from the ASS and it allowed us to analyse data by age,
which the available PERSAL data did not, the findings reported here will come from the
ASS analysis unless otherwise stated.
T E AC H E R D E MA N D
The future demand for teachers is influenced by various factors: demographic trends,
learner enrolment and learner progression rates. All of these were used to construct the
model.

9March 2015
Supply and Demand 2013–2025
The latest population data shows that despite a declining fertility rate, women of child-bearing age are living longer, the number of births is increasing and consequently there will be more learners in the next decade than were projected in 2011
Demography
Population changes influence the numbers of learners who will need to be taught in the
next decade. The previous teacher demand and supply model published by CDE21 was
based on the best information at that time about demographic trends, and projected a
flattening and then decreasing of learner enrolments over the next decade.
However, the latest population data shows that despite a declining fertility rate,22
women of child-bearing age are living longer, the number of births is increasing23 and
consequently there will be more learners in the next decade than were projected in 2011.
Projected Learner Enrolments 2013-2025
To project learner enrolments to 2025 the following were used:
• Registered birth rates seven years earlier to project new arrivals in Grade 1 where
these were available and thereafter model estimates of births;
• Total learner enrolments in Grades 1 to 4 between 2008 and 2013;
• The 2011/12 learner promotion, repetition and dropout rates; and
• Grade R enrolments at 64 per cent of Grade 1 enrolments.24
In the process of constructing the model, we found that both the number of registered
births and total learner enrolments in Grades 1 to 4 from 2008 to 2010 revealed dips
and spikes which will result in uneven learner enrolment as the various age cohorts
move through the schooling system in the next decade. Similarly learner progression
through school, as learners are promoted, drop out or repeat grades, is not smooth, with a
significant bulge of learners in Grades 1 and 10.25
Drawing on all the datasets outlined above, the CDE model projects that learner
enrolments will increase from some 12.4 million in 2013 to in 13.4 million in 2023, after
which they will decrease to 13.3 million in 2025. This projection is shown in Figure 1.
Figure 1: Projected learner enrolments (Grades R-12)
Source: CDE (2015)

10 Centre for Development and Enterprise
TEACHERS IN SOUTH AFRICA
The demand for teachers in the system
will rise from around 426,000 in 2013 to a
maximum of 456,000 in 2023. After that it will start to decline
slowly to 2025
Future Demand for Teachers
The future demand for teachers will depend on the total number of learners in the system,
and how many learners on average a teacher would teach in a class. This is calculated in
terms of the learner to educator ratio (LER) in a schooling system. The model used an
average LER of 31.2 for primary and 26.3 for secondary schools from 2009 to 2012 for the
projection.
From the projected total learner enrolments and these LERs, the demand for teachers
in the system will rise from around 426,000 in 2013 to a maximum of 456,000 in 2023. After
that it will start to decline slowly to 2025. The projected increase of 7 per cent over the
12-year-period needed to produce the extra 30,000 teachers should be quite achievable in
terms of the recent significant increase in new graduates as discussed in the next section.
The future need for teachers, however, is not evenly spread across the schooling system,
as Figure 2 shows.
Figure 2: Projected teacher requirements (2013-2025)
Source: CDE (2015)
If the 13 years of schooling are split into lower primary (Grades R to 3), higher primary
(Grades 4 to 7) and secondary (Grades 8 to 12), by 2025 fewer teachers will be needed in
the lower primary sector of schooling (some 3 per cent less) and more will be needed in
the upper primary (13 per cent more) and secondary school sectors (10 per cent more).26
It is important to note that the lack of adequate data on Grade R enrolments means that
it is not possible to accurately project how many additional teachers might be needed as
Grade R enrolments move through the schooling system and increase.27 However, some
scenarios were modelled. Suffice to say that if in the next decade Grade R enrolments in
public and independent schools increase to 80 per cent of Grade 1 enrolments, then some
4,500 more teachers will be needed in 2025, approximately 8,122 additional teachers if
enrolments increase to 90 per cent, and around 12,000 more teachers if the enrolments
increase to 100 per cent.28

11March 2015
Supply and Demand 2013–2025
The provision of newly qualified teachers to the system is dominated by public facilities, with only a small number of teachers graduating from private institutions
T E AC H E R S U P P LY
Against the projected demand for teachers we look now at the supply of teachers which
is made up of the number of new teachers graduating from ITE programmes and the
number of teachers in the current teaching force.
Initial Teacher Education
In South Africa, ITE is provided by HEIs and is concerned with the academic and
professional development of student teachers in order to prepare them for work in schools
and as a basis for CPTD.
There are two basic models of ITE programmes: the consecutive model and the
concurrent model. In the consecutive model, a teacher first obtains an undergraduate
Bachelor’s degree, and then studies for a further year to obtain a teaching qualification, a
PGCE. In the concurrent model, a student simultaneously studies both the academic and
professional requirements for the four-year B Ed degree.
As both of these are four-year qualifications, the current official requirement for a
qualified teacher in South Africa is known as M+4, a matric (school-leaving) certificate
plus four years of ITE. Until fairly recently, however, M+3 (matric plus three years of ITE)
was the official requirement, and so most teachers in the country are qualified with M+3.
Therefore a qualified teacher in South Africa is one who has acquired a formal accredited
teaching qualification comprising at least three years of training.
‘Qualified’ and ‘quality ’A qualified teacher is not the same as a good teacher. While a qualified teacher in South Africa is one who has at least three years of post-school ITE, not all qualified teachers are competent professionals able to provide quality teaching and learning. In fact, government’s own investigation into the quality of ITE programmes and recent research make it clear that the quality of most of these programmes leaves a lot to be desired. The result is that most of the current teaching force has been inadequately educated and trained, whether during apartheid or in the recent past.
Public provision of ITE
The provision of newly qualified teachers to the system is dominated by public facilities,
with only a small number of teachers graduating from private institutions.
Since 2009 three universities, the University of South Africa (UNISA), North-West
University (NWU) and the University of KwaZulu-Natal (UKZN) have been the largest
providers of ITE. In 2012, UNISA accounted for more than half of all ITE enrolments (52
per cent), followed by NWU (6 per cent), and UKZN (4 per cent). In 2012, these three
universities together produced nearly half of all newly qualified teachers: 30 per cent by
UNISA, followed by UKZN with 9 per cent and NWU with 8 per cent.
Enrolments
In line with the ISPFTED the national departments of education have expended
considerable effort and resources to increase the provision of ITE programmes at HEIs.
As a result the enrolments increased from 35 937 in 2009 to 94 237 in 2012, a 160 per cent
increase.

12 Centre for Development and Enterprise
TEACHERS IN SOUTH AFRICA
There is no doubt that Funza Lushaka
bursaries have been a major contributing factor to the growth and the demand for them is outstripping
the supply
Any expansion of ITE provision requires additional resources. However, the main
funding mechanism for public HEIs is not optimal for ITE. Currently education is
in Classification of Educational Subject Matter (CESM) Level 1 (the lowest level)
of government’s calculation of the teaching input and output components of the block
grant each university receives, from which it decides how many ITE places to allocate. The
B Ed and PGCE are also in the lowest category by level of higher education qualification
and thus attract less funding. This has created a disincentive for the universities to allocate
more money to ITE. By contrast government has used earmarked grants in recent years, to
target specific improvements and the expansion of priority ITE programmes.
There is no doubt that FL bursaries have been a major contributing factor to the growth
and the demand for them is outstripping the supply.29 In January 2015, 78,593 applications
for FL bursaries were received: 14,921 were re-applicants who had obtained FL bursaries
for previous years of study, and 63,672 were new applicants.30
Graduates
With the growth in the number of enrolments the number of graduates has also increased
from 6,978 in 2009, nearly doubling to 13,708 in 2012. However, the number of graduates
is very low compared to the number of enrolments, as Figure 3 shows.
Figure 3: ITE enrolments and graduations (excluding foreign students)
Source: CDE (2015)
Graduation rates
To analyse the throughput of teacher education programmes properly, a cohort study is
needed. This will allow us to track the progress of one or more entering cohorts from the
time of entry until all entrants have either graduated or dropped out. Such a cohort study
has not been undertaken in South Africa so we do not have actual throughput rates.
The graduation rate refers to the number of students who graduate from a programme
in a particular year, expressed as a percentage of the total number of students enrolled
in that programme in the same year. The graduation rate is not an entirely satisfactory
indicator, since the graduations in one year are actually a function of enrolments in earlier
years, not the same year. The graduation rate is also sensitive to changes in the pattern of
enrolment: for example, if the number of enrolees increases significantly in a particular
year, the graduation rate will suddenly drop. It is also affected by whether or not the

13March 2015
Supply and Demand 2013–2025
Progress through both contact and distance ITE programmes is poor and the outputs are low, and particularly so in the case of distance programmes where many students study part-time
programme is offered through contact or distance education, and full-time or part-time
study.
When ITE enrolment and graduation data between 2010 and 2012 was analysed, the
graduation rate for the one-year PGCE programmes was found to be about half of what it
could be. In the case of the four-year B Ed, the graduation rate was less than half of what
it could be.31 For the B Ed distance education programmes offered by UNISA, where most
students study on a part-time basis, the rate was even worse, dropping to around 10 per
cent of what it could be.
The indicator is good enough to make the central point: that progress through both
contact and distance ITE programmes is poor and the outputs are low, and particularly so
in the case of distance programmes where many students study part-time. Hence distance
education programmes are very inefficient and more costly.
Table 1 below compares the graduation rates for the B Ed at UNISA, which provides
distance education, to the other campus-based institutions that provide contact
education.
Table 1: B Ed graduation rates (2010-2012)
YearUNISA (distance education) Other universities (contact education)
Enrolments Graduates Graduation rate Enrolments Graduates Graduation
rate
2010 18,582 488 2.6% 33,481 4,429 13.2%
2011 30,086 611 2.0% 38,104 5,567 14.6%
2012 40,124 1,007 2.5% 41,781 6,996 16.7%
Source: CDE (2015)
The long turnaround time between enrolment and graduation also complicates
government’s ability to plan for the required number of new teacher graduates (NTGs).
Projected number of teacher graduates
To increase the number of NTGs the DHET produced an enrolment plan for the period
2014 to 2019 which was used as the basis for projecting graduation rates. The projection
presented in Table 2 assumes the DHET plan to 2019. However, because the projected
learner enrolments indicate that the demand for secondary school teachers will be greater
than for primary school teachers in the next decade, the projection allows for a 6 per cent
per annum increase in B Ed graduates from 2020 to 2025, and an 8 per cent per annum
increase in PGCE graduates.
14 Centre for Development and Enterprise
TEACHERS IN SOUTH AFRICA
The lack of access to Funza Lushaka bursaries
for students in private ITE institutions affects
their affordability, so their fee levels
have to be kept very competitive with public
universities, without the advantage of a
government subsidy
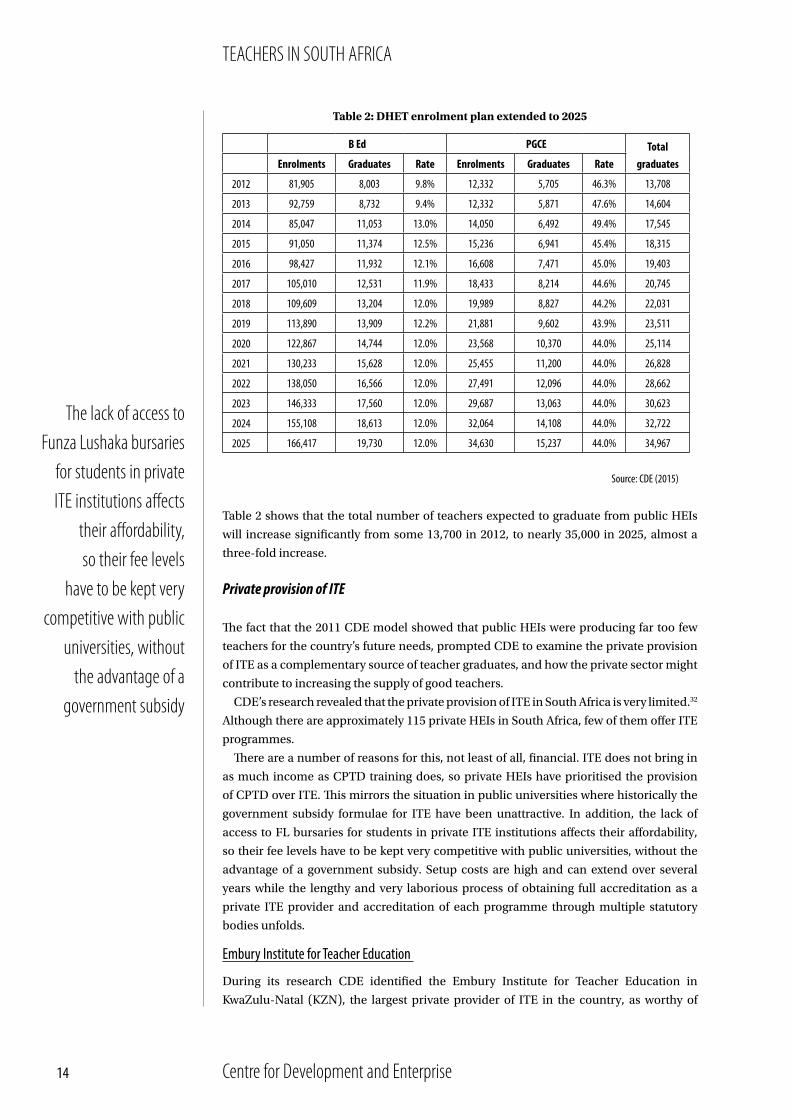
Table 2: DHET enrolment plan extended to 2025
B Ed PGCE TotalgraduatesEnrolments Graduates Rate Enrolments Graduates Rate
2012 81,905 8,003 9.8% 12,332 5,705 46.3% 13,708
2013 92,759 8,732 9.4% 12,332 5,871 47.6% 14,604
2014 85,047 11,053 13.0% 14,050 6,492 49.4% 17,545
2015 91,050 11,374 12.5% 15,236 6,941 45.4% 18,315
2016 98,427 11,932 12.1% 16,608 7,471 45.0% 19,403
2017 105,010 12,531 11.9% 18,433 8,214 44.6% 20,745
2018 109,609 13,204 12.0% 19,989 8,827 44.2% 22,031
2019 113,890 13,909 12.2% 21,881 9,602 43.9% 23,511
2020 122,867 14,744 12.0% 23,568 10,370 44.0% 25,114
2021 130,233 15,628 12.0% 25,455 11,200 44.0% 26,828
2022 138,050 16,566 12.0% 27,491 12,096 44.0% 28,662
2023 146,333 17,560 12.0% 29,687 13,063 44.0% 30,623
2024 155,108 18,613 12.0% 32,064 14,108 44.0% 32,722
2025 166,417 19,730 12.0% 34,630 15,237 44.0% 34,967
Source: CDE (2015)
Table 2 shows that the total number of teachers expected to graduate from public HEIs
will increase significantly from some 13,700 in 2012, to nearly 35,000 in 2025, almost a
three-fold increase.
Private provision of ITE
The fact that the 2011 CDE model showed that public HEIs were producing far too few
teachers for the country’s future needs, prompted CDE to examine the private provision
of ITE as a complementary source of teacher graduates, and how the private sector might
contribute to increasing the supply of good teachers.
CDE’s research revealed that the private provision of ITE in South Africa is very limited.32
Although there are approximately 115 private HEIs in South Africa, few of them offer ITE
programmes.
There are a number of reasons for this, not least of all, financial. ITE does not bring in
as much income as CPTD training does, so private HEIs have prioritised the provision
of CPTD over ITE. This mirrors the situation in public universities where historically the
government subsidy formulae for ITE have been unattractive. In addition, the lack of
access to FL bursaries for students in private ITE institutions affects their affordability,
so their fee levels have to be kept very competitive with public universities, without the
advantage of a government subsidy. Setup costs are high and can extend over several
years while the lengthy and very laborious process of obtaining full accreditation as a
private ITE provider and accreditation of each programme through multiple statutory
bodies unfolds.
Embury Institute for Teacher Education
During its research CDE identified the Embury Institute for Teacher Education in
KwaZulu-Natal (KZN), the largest private provider of ITE in the country, as worthy of

15March 2015
Supply and Demand 2013–2025
Embury has developed a good, replicable model for private delivery of high-quality ITE for ECD and FP teachers, which offers some useful insights for the expansion of private provision
further investigation in a case study. This Institute has been in existence for more than 10
years and has been steadily expanding. In 2013 it was bought by Curro, the fast-growing
independent school chain.
Embury has some important features that have contributed to its success and could
inform other private providers of ITE.
Embur y Institute for Teacher Education• Embury has full registration as an HEI and its certificate, diploma and B Ed (FP) degree programmes are accredited.
• It has a dedicated focus on ITE only and concentrates on a niche market by providing Early Childhood Development (ECD) and FP teacher education, two important areas of ITE to meet future teacher demand.
• It offers three of its own accredited qualifications and tuition for two UNISA degrees, as well as a range of short CPTD courses.
• By 2014 it had expanded to some 2,000 students, of which 590 were enrolled for Embury’s B Ed programme, and another 60 in UNISA’s B Ed.
• The success rates of students in its own programmes compare favourably with, or exceed, the various indicators of throughput at public universities. In 2013, for example, the success rate of the 100 students in their first year of the B Ed programme was 90 per cent, and of the 200 students in their fourth year, 70 per cent.
• The lecturers are highly motivated, professional and experienced and the classes are smaller than those of public universities, allowing for more interaction with students.
• It allocates considerably more time and attention to practical teaching than public HEIs. Their student teachers alternate between a week in schools and a week at Embury for their academic studies. Final year students spend an extended period of six to eight weeks in a school. During their degree they obtain experience in different types of schools – poorly resourced, well-resourced, and special needs schools.
• Over the years Embury has developed several important partnerships: with UNISA to provide accredited tuition for its B Ed and B Ed (Hons) degrees; with the KZN education department and a number of NGOs to train un- and underqualified pre-school teachers; with the DBE to develop new courses and materials for classroom teachers to teach physical education, and the education of the deaf; and with public and independent schools for the placement of students on teaching practice.33
• Interviews with heads and teachers in public and independent schools indicated that generally its students and graduates are highly regarded.
By all accounts, Embury has developed a good, replicable model for private delivery
of high-quality ITE for ECD and FP teachers, which offers some useful insights for the
expansion of private provision.
However, it is not without challenges. It has institutional challenges such as the high
costs of physical infrastructure and the maintenance of high-quality IT equipment and
services, the danger of overextending its capacity as it expands, and the challenge of finding
suitable high-quality teacher educators with the right blend of academic qualifications
and strong classroom experience. In addition, it has to cope with a number of external
challenges, such as an unpredictable operating environment for teacher education
institutions resulting from ongoing policy changes by the education departments, and
the affordability of its fees in comparison with public HEIs where students are eligible for
FL bursaries.
Nonetheless, Embury shows that a private provider that offers high quality ITE
programmes, is entrepreneurial and forms important partnerships with government and

16 Centre for Development and Enterprise
TEACHERS IN SOUTH AFRICA
In the non-profit private sector there have been
some noteworthy developments. Two non-governmental organisations have
developed alternative pathways to becoming
a qualified teacher
donors, can be successful in niche areas, especially where the public universities are weak,
such as ECD, FP and teacher education for learners with special education needs (LSEN).
Private innovation
Although in 2013, when CDE conducted its research on private provision, there were only
limited market-based solutions to the need for more high-quality ITE, in the non-profit
private sector there have been some noteworthy developments. Two non-governmental
organisations (NGO’s) have developed alternative pathways to becoming a qualified
teacher. One, established by the Independent Schools Association of Southern Africa
(ISASA), is the ISASA Mathematics and English Programme, which involves a student
teacher internship in independent schools and distance ITE for the duration of the B Ed
or PGCE, with mentoring and strong academic and psycho-social support. The other,
Teach South Africa, selects quality graduates and places them in poorly resourced public
schools for two years after a short initial intensive course of teacher training, followed by
ITE through distance education.
Government provides bursaries for some of the students in the ISASA internship
programme on condition that the majority teach in public schools, and it pays the salaries
of the Teach South Africa graduates in the public schools where they are placed. The DBE
sees these programmes as potentially scalable models for the country and values what
can be learnt from their strengths to improve public ITE provision. These include the
access they provide to new pools of potential teachers whose needs are not being met
by the traditional pathways, rigorous selection processes to ensure high-quality trainees,
strong student support, mentoring in the schools, and students’ intimate knowledge of
the school curriculum and extensive classroom teaching experience.
Even if their scale cannot match the size of the enrolments in public ITE programmes,
the DBE regards the internship graduates as constituting a corps of high-quality teachers
who can be strategically used in the public school system as future heads of department
(HoDs), teachers at resource centres or subject advisors.
These alternative ITE models illustrate the entrepreneurial and innovative nature of
the private sector, which has the flexibility to introduce new approaches and experiment
more easily and rapidly than large public institutions.
The Teaching Force
The size and nature of the teaching force in schools is the other key component of teacher
supply in South Africa. The number of available teachers depends on the number of new
teachers who enter the system (‘joiners’), those who leave after some time (‘leavers’),
those who return to teaching at a later stage (‘returners’) and those who stay permanently
until they retire (‘stayers’).
On the basis of the DBE’s Education Statistics data for 201234 the model indicates that in
2013 there would be approximately 426,000 teachers in the schooling system. However, it
is also important to take into account the profile of the teachers in the system in terms of
qualifications, age, experience, whether they are in permanent or temporary posts, and
how many are South African or foreign nationals, because all of these have implications
for teacher supply and demand.
From the ASS, CDE used data on 400,75635 teachers, who were South African citizens
between the ages of 22 and 65, to produce the following profile of the South African
teaching force in 2013:

17March 2015
Supply and Demand 2013–2025
In 2013, the number of teachers between 45 and 49 (97,700) was four times higher than the number between 30 and 34 (21,300)
• Some 81 per cent of the teachers were fully qualified to teach.
• Of the qualified teachers, about 15 per cent (59,000) were qualified with a matric
plus a four-year teacher education qualification (M+4); and 66 per cent (265,000)
had a three-year teacher education qualification (M+3).36
• Some 19 per cent (76,000) of teachers were unqualified:37 9 per cent (36,600) had
the equivalent of M+3 but no professional teaching qualification, and 10 per cent
(39,800) had M+2 or lower.
• Nearly 3 per cent (10,600) of teachers were foreign nationals, with two-thirds
(6,700) of those from Zimbabwe.
• About 11 per cent (45,800) of the teaching force consisted of temporary appointees.
• 70 per cent of educators (282,223) were female.
• 22 per cent (86,700) of teachers were employed in KZN, 18 per cent (72,000) in
Gauteng, and 17 per cent (67,300) in the Eastern Cape.
• About 31 per cent of all unqualified teachers (less than matric and three-year
teaching qualification) were employed in KZN.
• The average teacher in service in 2013 had 17 years of experience, but the average
experience reported by educators who had stayed in service until age 65 was 34
years.
• The age distribution was very uneven, with 45 per cent (169,000) of teachers in the
age range of 40 to 49 years.
The most significant features of this profile are discussed below.
Age profile of teachers
In 2013 the age profile of teachers in the system was not a typical bell curve but bimodal,
not unlike two humps of a camel. The number of teachers between 45 and 49 (97,700)
was four times higher than the number between 30 and 34 (21,300) as shown in Figure 4
below. The number of employed teachers declined between 1999 and 2004 from 365,447
to 362,042. Stagnation in the number of teachers employed between 1999 and 2004 would
have led to a decline in the number of young teachers entering the system. In addition,
there was a substantial decline in ITE enrolments in contact colleges between 1994 and
2000, from 71,000 to 10,000. This decrease in enrolments would have resulted in a far
smaller number of NTGs some four to five years later.38
Figure 4: Teachers by age (2013)
Source: CDE (2015)

18 Centre for Development and Enterprise
TEACHERS IN SOUTH AFRICA
In 2013 by far the largest group of
qualified teachers, 66 per cent, had an M+3
qualification – only 15 per cent had an M+4,
the current official requirement for NTGs – and the remaining
19 per cent were unqualified
The earliest age at which NTGs can enter the system after a four-year qualification is 22
years, but surprisingly, very few enter below the age of 24 years. The average age that most
NTGs enter the system is 28 years and so, on average, there is a delay of some six years
before the new graduates actually enter the system. The reason for this delay is not known
but certainly worthy of investigation.
The age profile of the teaching force in 2025 was derived from projections of age-specific
joiner, returner and leaver rates. This shows that by 2025 the significant dip in the current
population of teachers of about 30 to 34 years will move through the system so that the
smallest number of teachers will be 40 to 44 years old and the greatest number will be 50
to 59 years, with many opting for retirement after 55 when they can access their pensions.
Figure 5 illustrates the 2025 age profile.
Figure 5: Teachers by age (2025)
Source: CDE (2015)
The uneven spread of ages in the system has major implications for school leadership in
the future. In 2025 the smallest age group will be at the age at which teachers typically have
sufficient experience to be eligible for senior management positions, such as principal,
deputy-principal and HoD. The very small pool from which they can be drawn means
that less experienced teachers may have to be promoted to those positions. This suggests
that leadership training with a strong emphasis on instructional leadership should be
timeously provided for teachers before they reach the age of 40. The stop-start hiring
of teachers that has happened in the past must not be repeated if the challenges of the
present bimodal age distribution are to be avoided.
Teacher qualifications
In 2013 by far the largest group of qualified teachers, 66 per cent, had an M+3 qualification
– only 15 per cent had an M+4, the current official requirement for NTGs – and the
remaining 19 per cent were unqualified. There are limits on how fast this situation can
improve: the only way it can is by employing NTG with an M+4 or upgrading serving
teachers’ qualifications. Consequently it will take a long time before the majority of
teachers have an M+4 qualification.
When the qualifications profile of the teaching force is considered with the age profile,
an atypical picture emerges. In a developing system younger teachers on average would
be better qualified than older ones, but this is not the case in the 2013 teacher distribution
up to age 50, or after age 30 in the 2025 projection.
19March 2015
Supply and Demand 2013–2025
Interestingly, the greatest number of qualified teachers entering the system comes from those who return to teaching (48 per cent), not the new teacher graduates
More important than the qualifications of new joiners, are the qualifications added
by teachers in employment. Between 2012 and 2013, the nearly 31 per cent of teachers
who upgraded from unqualified to qualified while in employment exceeded the 22 per
cent of newly qualified teachers who entered employment for the first time in 2013. This
suggests that the majority of teachers build up their qualifications on the job, often over
many years. Interestingly, the greatest number of qualified teachers entering the system
comes from those who return to teaching (48 per cent), not the NTGs. This makes keeping
teachers in the system, or encouraging teachers who leave the system to return, of critical
importance.
Teacher attrition
The size of the teaching force at any time will be affected by the rate at which teachers
leave the system. This is known as the attrition rate. However, in South Africa the high
degree of churning in teaching force, with teachers joining, leaving and returning all the
time, means that this is not a simple calculation.
To build the model, therefore, a gross attrition rate and a net attrition rate were calculated:
the gross attrition rate is the number of leavers divided by the employed teachers, while
the net attrition rate subtracts returning joiners from leavers.
However, the conclusions drawn from the secondary analysis of PERSAL data and the
analysis of ASS data are substantially different in terms of gross and net attrition rates as
shown in Table 3.
Table 3: Gross and net attrition rates of teachers
Gross Net
PERSAL 5.37% 2.73%
Annual Schools Survey 8.31% 3.37%
Source: CDE (2015)
In addition the two data sets indicate different net attrition rates in terms of qualified and
unqualified teachers.39
The analysis of both datasets suggests that the PERSAL attrition rates are biased
downwards while the ASS rates are upwardly biased.40 As a result, the estimates from
both datasets were used to produce lower and higher projections of teacher supply and
demand with different profiles of teacher qualifications.41
The main differences between the projections are outlined below:
PERSAL estimates
• The required number of B Ed and PGCE graduates is projected to rise from 7,500
in 2012 to some 12,000 in 2019 and will decline slowly after that. This implies
that current teacher education capacity will suffice until 2017 and needs to be
expanded by only 10 per cent thereafter.
• Until 2018 there may be a very small decline in the proportion of teachers who are
qualified but the proportion should start to rise from 2019, provided that the share
of unqualified teachers among joiners drops from 2013 to 2025.

20 Centre for Development and Enterprise
TEACHERS IN SOUTH AFRICA
93 per cent of 40-year-old educators who left
between 2012 and 2013 were qualified, whereas only 56 per
cent of educators who returned at age 40 were
qualified. For all age groups this picture is
true – more qualified teachers leave than
return to teaching
ASS estimates
• The ASS projection suggests that the number of enrolments will need to increase
to produce the NTGs required: the B Ed intake in accordance with the DHET plan
to 2019 and by 6 per cent each year from 2020; and the PGCE intake in accordance
with the DHET plan to 2019 and by 8 per cent each year thereafter to produce
approximately 35,000 NTG by 2025.
• This will result in the projected proportion of qualified teachers in the entire
teaching force remaining at around 81 per cent, the same in 2025 as it was in 2013.
As is clear from the above, the gap between the PERSAL and ASS conclusions is
uncomfortably wide.42 The PERSAL data suggest that it may be time to think of measures
designed to curb the over-production of teachers down the line because in 2012 there
were already 13,708 NTGs. By contrast the ASS data suggest an increase in intake will be
necessary in the next ten years to produce 35,000 NTGs in 2025.
Notwithstanding these differences, the overall conclusion is positive: the required
increases in first-time enrolments in ITE programmes are attainable in the next decade
and South Africa is highly unlikely to have an overall shortage of teachers.
Teacher turnover
Another factor affecting the proportion of qualified and unqualified teachers in the
teaching force is the very high rate of teacher turnover.
Of those teachers who leave the system, some return but many more do not. The loss of
teachers is particularly significant for qualified teachers. Whereas 81 per cent of teachers
were qualified in 2013, by 2025, based on the DHET’s Enrolment Plan, the projected
number of qualified teachers is only 7 per cent higher in 2025, even if gross attrition
rates drop relative to 2013.43 In fact the model’s projections show the stock of unqualified
teachers fluctuating between 2013 and 2025, peaking in 2023, and higher in 2025 than at
present.
Why is this the case? Returning teachers, on average, are less well qualified than those
who leave at the same ages. For example, 93 per cent of 40-year-old educators who
left between 2012 and 2013 were qualified, whereas only 56 per cent of educators who
returned at age 40 were qualified. For all age groups this picture is true – more qualified
teachers leave than return to teaching.
This means that qualified teachers are more likely than unqualified teachers to leave the
system permanently. In effect the teaching force is like a leaky bucket. Almost as fast as
new qualified teachers enter the system, experienced qualified teachers are leaving it in
net terms. Between 2012 and 2013, approximately 27,000 qualified teachers were added to
the pool of qualified teachers through NTGs (24 per cent), returning qualified teachers (43
per cent) and teacher upgrades (33 per cent), and about 29,000 qualified teachers left. It is
worth noting that the NTGs add the smallest proportion of qualified teachers to the pool.
A key finding of this research is that pumping more newly qualified educators into
the system will not in itself improve the average level of qualification among employed
teachers. Every effort needs be made to retain qualified teachers as well.44
The leaky bucket also has cost implications: resources – time, skills and money – are
wasted if qualified teachers never enter teaching or depart permanently after a period of
employment.

21March 2015
Supply and Demand 2013–2025
The demand for teachers in the system over the next 10 years will closely match the supply, and the current average LER of 29.2 learners to 1 teacher will remain almost constant across the system over the next 10 years
MATCHING TEACHER SUPPLY AND DEMAND The model used the calculations of the demand for teachers and the available supply that
are outlined earlier in this report as the basis for projecting the match between supply and
demand over the next 10 years. The result of that modelling is shown in Figure 6.
Figure 6: Teacher supply and demand (2013-2025)
Source: CDE (2015)
The two lines on the graph are closely aligned. This means that the demand for teachers
in the system over the next 10 years will closely match the supply, and the current average
LER of 29.2 learners to 1 teacher will remain almost constant across the system over the
next 10 years. This is good news for the system!
MATC H I N G T E AC H E R S U P P LY A N D D E MA N D F O R S C H O O L P H A S E S A N D S U B J E C TS
Although the projected number of teachers required and supplied will closely match
during the next decade, a far more important consideration is whether sufficient numbers
are being trained for the needs of the different school phases and subjects. The devil, as
they say, is in the detail.
The internal 2009 DHET report, Trends in Teacher Education, includes graduates by
learning area for the Intermediate and Senior phases and graduates by subject in the
Further Education and Training (FET) Phase. As no such information appears in the later
Trends in Teacher Education, the 2009 trends data was used by CDE to analyse the match
between the teacher supply and demand for school subjects, and school phases. This
revealed that there will be shortages in the case of both phase and subject requirements.

22 Centre for Development and Enterprise
TEACHERS IN SOUTH AFRICA
There is an oversupply of teachers in some
subjects and a shortage in others.
The worst shortages are in languages and
mathematics
Phase Requirements
For the period 2013 to 2017 too many secondary school teachers and far too few higher
primary school teachers are being produced.45 During this time, more than 60 per cent of
teachers will graduate as secondary school teachers, while the system needs only some
15 per cent. By contrast some 36 per cent of teachers will graduate as primary school
teachers, even though the system requires around 85 per cent of NTGs for the primary
school phases. After 2017, the pattern of demand for new graduates shifts, and between
2018 to 2025 the required distribution across the higher primary and secondary school
systems is likely to match the phase qualifications of NTGs.
There is, however, a significant misalignment in the case of the FP, the first four years
of schooling. As a result of the dedicated focus of the national departments of education
on strengthening FP teacher education, since 2008 there has been considerable growth in
NTGs qualified to teach in that phase. However, in a 2014 journal article,46 DHET officials
report on research they conducted which found that the proportion of FP graduates from
2008 to 2012, relative to teachers qualifying to teach in other school phases, is declining
and the number of FP graduates is too low for the needs of that phase. The average
percentage share of FP teacher graduates over the five years (2008 to 2012) was about 18
per cent of all graduates, yet in 2012 FP enrolments constituted some 400,000 learners, 33
per cent of all enrolments in ordinary schools.
The 2012 Trends in Teacher Supply shows that across the universities which offer a range
of different teacher education programmes that include FP, fewer than 4,200 graduates
who can teach in that phase were produced. In fact, the DHET researchers’ model projects
that even by 2020, the demand for FP teachers will largely outstrip supply.
However, an important development with regard to private provision of ITE is pointed
out by the researchers: the output of new FP teachers has been augmented since 2011
by a small number of private providers entering the ITE domain. The DHET officials’
expectation that the contribution of the private providers will increase substantially in
future years is supported by the number of private providers, whose MRTEQ-aligned
programmes, many focused on the FP, have recently been approved by the DHET.47
Subject Needs
Similarly there is a cause for concern when it comes to the supply of subject teachers. On
the assumption that the proportion of subject teachers has remained fairly constant over
the past few years, there is an oversupply of teachers in some subjects and a shortage in
others. The worst shortages are in languages and mathematics, particularly in the IP Grades
4-7. While precise numbers of mathematics and language teachers were not available
for this report, the ratio of demand to supply is around 2 to 1 for both mathematics and
languages for these grades.
In the FET Phase, the greatest shortage of teachers is in languages, with the demand
almost double the supply. An oversupply of mathematics teachers, but a significant
shortage of mathematical literacy teachers, is projected, which will only worsen as the
trend towards more learners choosing mathematical literacy as a subject continues.48
Figure 7 illustrates the graduate requirement relative to the subject teacher demand.

23March 2015
Supply and Demand 2013–2025
There is a dire shortage of NTGs whose mother tongue is an indigenous African language
Figure 7: Distribution of learning areas: Intermediate, Senior and FET Phase graduates
Source: CDE (2015)
The shortage of language teachers in the three school phases depicted above highlights
the immediate need to increase enrolments of teaching students who want to specialise
in languages.
However, even more disturbing is the dire shortage of NTGs in the FP whose mother
tongue is an indigenous African language. In 2007, the DBE estimated the home language
proportion of learners in the system as follows: 10 per cent Afrikaans, 7 per cent English,
and the remaining 83 per cent an African language. By contrast, of the 1,275 NTGs
expected to graduate in 2009 with an FP qualification, only 13 per cent had an African
language as their mother tongue (with the overwhelming majority isiZulu speakers) and
most were Afrikaans (44 per cent) and English speakers (43 per cent).
In 2012 there were not enough FP mother tongue teachers for any language group of
learners, with isiXhosa the most under-represented language in terms of sheer numbers,
as Figure 8 demonstrates.
Figure 8: Supply-demand gap in Foundation Phase teacher graduates per mother tongue (2012)49
Source: Green, Adendorff and Mathebula (2014)

24 Centre for Development and Enterprise
TEACHERS IN SOUTH AFRICA
The lack of sufficient qualified African teachers for the
Foundation Phase has severe implications
for the effective development of
numeracy and literacy by the mass of learners whose mother tongue
is an indigenous African language
The lack of sufficient qualified African teachers for the FP has severe implications for the
effective development of numeracy and literacy by the mass of learners whose mother
tongue is an indigenous African language.
Without a doubt one of the biggest challenges for the future will be the adequate
production of new FP teachers able to use indigenous African languages as languages
of instruction, and in particular those able to teach these languages as school subjects.
This will become even more pressing if the proposed policy, Incremental Introduction of
African Languages,50 which would make the inclusion of at least one African Language
compulsory for all learners in the system, is implemented.
SUMMARY OF MAIN FINDINGS
CDE’s research and the modelling have covered extensive ground. We briefly summarise
the key findings in the section that follows.
Positive Effect of the ISPFTED and Government Initiatives
The development of the ISPFTED was a significant development in tackling the quantity
and quality of ITE provision. It provided a clear government strategy and plan that was
accepted by all stakeholders and covered the full scope of teacher development.
Certain weaknesses in the Plan can be identified: the lack of measurable deliverables
and specific annual targets; a model of expansion based on the existing models of ITE
at public HEIs which excluded new and innovative approaches; neglect of professional
development for teacher educators; a lack of attention to the role the private sector could
play in the future; and most important of all, an inadequate emphasis on quality of ITE
programmes as the most urgent national priority.
However, as a result of government’s considerable efforts, achievement of the
quantitative goals is well on track and important initial steps have been undertaken to
understand and address the quality problems.
Adequate Supply of Teachers for the Next Decade
Despite a rise in learner enrolments to 2023 and the consequent increase in teacher
demand, the DHET’s enrolment plan until 2019 is well on track and the model’s projections
based on ASS show that South Africa will have sufficient teachers for the next decade to
maintain the current LER of 29.2 learners to one teacher for the whole system.
Mismatch between Teacher Supply and Phase Requirements
The current mismatch between the qualifications and specialisations of NTGs and the
demand for teachers able to teach in all phases is serious. Between 2013 and 2017 the
system requires fewer secondary school NTGs and considerably more primary school
teachers. In the case of the FP the shortage is particularly severe.

25March 2015
Supply and Demand 2013–2025
While there has been a dramatic increase in the number of students enrolling in and graduating from ITE programmes, the ITE system is inefficient and both money and learning time are wasted
However, after 2017, the pattern of demand for new graduates shifts such that from
2018 to 2025, the required distribution across the higher primary and secondary school
systems is likely to match the phase qualifications of NTGs.
Shortage of Teachers for Key Subjects
There is a mismatch between the qualifications and specialisations of NTGs and the
system’s demand for teachers able to teach effectively in all subjects, particularly languages
in all phases, mathematics in the Intermediate and Senior phases, and mathematical
literacy in the FET Phase.
The marked shortage of FP teachers able to use indigenous African languages as
languages of instruction is deeply worrying.
Inefficient ITE System
While there has been a dramatic increase in the number of students enrolling in and
graduating from ITE programmes, the ITE system is inefficient and both money and
learning time are wasted.
In the absence of throughput rates to calculate properly how long it takes for the average
cohort of teaching students to complete their qualifications, graduation rates are used
as the next best indicator. These show that the percentage of graduates in a given year
relative to the enrolments in ITE programmes in the same year is low, especially in the B
Ed, and very much worse in the case of the distance ITE offered at UNISA. The fact that
UNISA is the largest provider of NTGs only exacerbates the problem.
The inefficiency of the ITE system increases the costs of producing NTGs and the
long turnaround time between enrolment and graduation complicates planning for the
required number of NTGs. Moreover, as only degreed students can undertake a PGCE,
these graduates are likely to be of better quality.
Limited Private Provision of ITE
While market-based solutions to the ITE challenges have been very limited in the past, the
case of Embury shows that a private provider can be successful and grow very rapidly in
niche areas, especially where the public universities are weak (such as teacher education
for ECD, FP and LSEN). There are also indications that private provision is set to grow.
The February 2015 list of MRTEQ-aligned ITE programmes approved by the DHET reveals
that many of these are offered by private institutions and that FP programmes are a strong
focus.
Private Innovation
Two NGOs within the private sector have developed innovative ITE models: the internship
model of ISASA’s Mathematics and English Programme, and the postgraduate model of
Teach South Africa.

26 Centre for Development and Enterprise
TEACHERS IN SOUTH AFRICA
Not only is there a high degree of churning
in the teaching force, but it is in fact a leaky
bucket with more qualified teachers
leaving than returning
Problematic Age Profile of Teacher Corps
The bimodal age distribution of the teaching force will create a significant problem by
2025. By then, the current bulge of teachers who are 40 to 49 years old will be 50 to 59
years old, with many in the process of retiring, and the smallest number of teachers will
be aged 40 to 49 years, typically the age group from which senior managers and principals
are drawn. This means that teachers with less experience will have to be promoted to fill
leadership and management posts with potentially negative consequences for effective
management, and especially instructional leadership, which is vital for quality teaching
and learning.
High Turnover of Teachers
One of the most important findings of the modelling is the extent to which teachers move
in and out of the system. NTGs typically do not enter the teaching force until they are
about 28 years old. Many qualified teachers leave and fewer return, and many unqualified
teachers stay and upgrade their qualifications or are new hires. Not only is there a high
degree of churning in the teaching force, but it is in fact a leaky bucket with more qualified
teachers leaving than returning.
As a result of the drain of qualified teachers from the system, the ASS-based projection
indicates that the percentage of unqualified teachers, currently 19 per cent, is unlikely
to reduce by 2025. If unqualified teachers are hired only when qualified teachers are
unavailable, an improvement in the qualifications profile would be possible.
Primacy of Quality
As government’s own quality assurance processes and recent research have revealed,
there can be no doubt that in general the quality of ITE programmes has been poor and
most NTGs have not been adequately educated or trained in the past. Unless teachers
have the essential subject and pedagogical content knowledge required to provide quality
teaching and learning, the very low level of learner achievement will not improve.
Government has begun to address the quality challenge in ITE with the MRTEQ
policy, which has resulted in the redesign of most ITE programmes in line with the
new requirements by allocating additional funding to public HEIs to strengthen their
programmes, and funding research into the quality of programmes and in particular how
the weakness of the teaching practice component can be improved.
Research has also indicated that the selection of teaching students is problematic both
in terms of their academic quality and their motivation.
In order to understand and address the extent of misutilisation of teachers in schools,
the PEDs now have to enter new data into the PERSAL database about what subjects
teachers are qualified to teach as opposed to what they are actually teaching in the schools.
However, the progress of the PEDs is slow and the accuracy of the data questionable.
Significant Data Challenges
As is abundantly clear from CDE’s research and modelling, education researchers
encounter enormous data problems. Typically education databases are unreliable
because the data is not entered correctly or complete or it is out of date. None of the
27March 2015
Supply and Demand 2013–2025
Poor data is a fact of life for education policy-makers and planners, and limits the early identification of problems, appropriate strategy development, effective planning and timely action to address them
datasets used for the CDE research agree on key issues like Grade R enrolments, or even
the number of teachers. In addition, in some years government reports include certain
important data and then in other years this is omitted.
As the CDE Technical Report shows, in 2012 KZN returned no ASS data on educators to
the DBE. As KZN is the province which has the most learners and employs the greatest
number of teachers, this presented a significant challenge for the modelling. Consequently,
CDE has had to spend considerable resources to try to unravel the inconsistencies and
reconstruct missing information.
Access to databases is one of the most critical issues. At the time of the CDE research,
access to the primary PERSAL database was not made available to the researcher on
grounds of the confidentiality of teacher information. Access to this would have made
all the difference to the reliability of the CDE model’s projections, because it would have
enabled a direct comparison with the ASS dataset.
The data constraints posed significant challenges for CDE’s modelling and despite every
effort made resulted in substantial differences between conclusions of the ASS-based and
PERSAL-based projections. These differences mean that the modelling does not allow
government to accurately determine the adequacy of ITE enrolments and graduates to
meet future teacher demand and plan accordingly.
Poor data is a fact of life for education policy-makers and planners, and limits the early
identification of problems, appropriate strategy development, effective planning and
timely action to address them.
Despite the lack of accurate and comprehensive data, CDE’s research and the model
have identified the main patterns and trends in the teaching force and teacher supply
and demand, as well as their implications for the future. These should be factored into
government’s strategy, planning, policy and interventions, and the initiatives of the
private sector.
CDE RECOMMENDATIONS
From the findings and implications of its research and modelling CDE has developed the
following recommendations to inform the strategies, policies and initiatives of decision-
makers in the public and private sectors, and to stimulate public debate.
Collection of More and Better Information
What South Africa urgently needs is reliable data systems that are compatible across all
levels of the education sector – national, provincial and district. Existing databases must
be improved so that they contain accurate, comprehensive and up-to-date information.
This will depend on diligent collection and recording of annual data by all government
departments at every level, and careful monitoring and checking of the process.
Government is fully aware of this imperative and has made ‘Effective systems for planning,
information management, assessment and district monitoring’ one of the six priorities of
Operation Phakisa.
For the future, monitoring of demographic developments is crucial to update the
demand for teachers because year-to-year fluctuations in births can be substantial.

28 Centre for Development and Enterprise
TEACHERS IN SOUTH AFRICA
Existing databases must be improved so that
they contain accurate, comprehensive and
up-to-date information. This will depend on
diligent collection and recording of annual
data by all government departments at every
level, and careful monitoring and
checking of the process
Planners need to keep their eyes closely on birth registration statistics to determine the
size of Grade R and Grade 1 enrolments in five or six years’ time.
Access to the primary PERSAL database should be made available to reputable policy
research organisations like the CDE. The confidentiality problem can be overcome
through a variety of means, with a confidentiality agreement as the simplest. In the case
of CDE’s model presented in this report, it is not too late to refine it. Access to PERSAL
data for the same month as the ASS is undertaken, for two successive years, would make
it possible to combine the best features of both in order to construct a single and more
reliable set of estimates.
In addition to more and better data, targeted quantitative and qualitative research is
needed for a proper diagnosis of the problems impeding the effective recruiting, training
and retaining of qualified, competent and committed teachers, and how best to address
them.
There are key issues that CDE was not able to research in this project that need
investigation:
• The throughput rates of ITE programmes. A proper cohort study is needed to
track cohorts of student teachers through the years of their studies to accurately
quantify the throughput rate, and understand how blockages could be removed
and the efficiency of ITE programmes be improved. This would enable students to
graduate more quickly and thus reduce the cost of their training.
• Why teachers enter the system late, leave and do not return. Qualitative research
would throw light on why there is a delayed entry of NTGs and why older qualified
teachers leave temporarily or permanently.
• How teachers are utilised in schools. Many teachers are not teaching the subjects
or phases in which they specialised. Misutilisation of teachers undermines
quality education, and if we know the extent to which this is happening, we will
have a better understanding of the match between teacher supply and demand,
especially in the subjects and phases most needed. Poor national data in this
regard compound the problem of vacant posts and excess teachers.
• The medium- and long-term cost implications of increasing numbers of teachers
with M+4 qualifications. Raising the qualification bar to M+4 for all NTGs has
funding implications. It increases the cost of qualifying as a teacher, both in terms
of student fees and the amount of FL bursaries, and as more of M+4 teachers enter
the teaching force, so will the PEDs’ already unsustainable salary budgets have to
grow.51
• The value of introducing knowledge and practice standards for teachers and
teacher educators to improve the quality of teachers. International research is
needed to investigate the experience of other countries in introducing professional
practice standards, the processes involved in developing them and their core
elements to inform the development of similar professional standards in South
Africa.
• Whether a wider range of formally recognised pathways to a B Ed or PGCE teaching
qualification could improve the quality, flexibility and accessibility of public
ITE programmes. Research is needed into international and local experience of
different models, their strengths and weaknesses, and the extent to which they
could be taken to scale.

29March 2015
Supply and Demand 2013–2025
The low funding category and status of ITE qualifications does not provide any incentive for universities to adequately fund ITE programmes or expand them.
Teacher Supply Aligned to School Phase and Subject Needs
The focus in the DHET enrolment plan for the next decade should be on supplying
teachers for the phases and subjects where the need is greatest: more language teachers
are essential in every phase, and especially more African language-speakers for the FP;
more mathematics teachers in most phases; and in the FET Phase, there is a projected
more mathematical literacy teachers. Specific enrolment and graduation targets for
phases and subjects should be established, and through the FL bursaries, the maximum
financial support given to students wanting to qualify in the areas of greatest need.
Because it takes more years for a B Ed student to graduate compared to a PGCE student,
for the next four or five years the output of NTGs from the B Ed is set. Thus in planning
for the future, adjustments to the number of PGCE enrolments will be a better strategy to
match the supply and demand of teachers in subjects and phases where the need will be
greatest. Moreover, as only students with a degree can undertake a PGCE, these graduates
are likely to be of better quality.
Given the dire shortage of FP teachers able to teach through the medium of African
languages or teach them as subjects, direct interventions are needed to grow the number
of these new FP teacher graduates. Specific interventions should include intentionally
recruiting and providing FL bursary funding to more African home language students
to become FP teachers, and ensuring that the language practices at universities move
beyond recruitment to putting programmes in place that develop students’ capacity to
use African languages as languages of instruction and teach them as subjects.
Until the numbers of NTGs with these competencies increase, however, government
is unlikely to be able to implement the proposed Incremental Introduction of African
Languages policy on scale.52 The low graduation rates and small numbers of graduates
qualifying to teach in these languages in the next five to six years suggest that in the next
decade this is not achievable.
Similarly if government plans any changes to the subject requirements of the National
Senior Certificate (NSC), it needs to consider the knock-on effects on teacher supply.
Curriculum change always carries implications for teacher supply and demand.
Improved Funding of ITE Programmes
The low funding category and status of ITE qualifications does not provide any incentive
for universities to adequately fund ITE programmes or expand them. Unless providing
quality ITE is seen as a national priority and the qualifications are accorded higher status
for university funding, it is difficult to see how this situation will improve.
The teaching practice component of ITE has been identified as one of the weakest areas
of ITE. If it is to be extended and strengthened it should receive special attention to ensure
it is not underfunded as it has been in the past.
Government should continue to use earmarked grants for achieving specific objectives
in order to shape and improve ITE provision, because apart from engaging with
universities, government cannot determine how they spend the money within their block
grant allocation.

30 Centre for Development and Enterprise
TEACHERS IN SOUTH AFRICA
The expansion of ITE programmes at HEIs
and higher enrolments will not lead to
improved learner achievement in schools
unless the critical challenges of quality are urgently resolved
Increasing the Employment of Qualified Teachers
Based on the findings of research into why NTGs delay their entry into the teaching force
and older qualified teachers leave and return, or leave permanently, government must
develop strategies to encourage NTGs to join earlier, incentivise experienced competent
qualified teachers to remain in teaching, and take steps to prevent the hiring of unqualified
teachers when qualified ones are available, especially in KZN.
Leadership and Management Training
As a result of the bimodal age profile of the teaching corps by 2025, and even before that,
senior management posts will have to be filled from the smallest group of teachers aged 40
to 49. Thus leadership and management training, with a strong emphasis on instructional
leadership, needs to be provided to teachers who are potential managers before they
reach 40 years of age.
Ensuring High-Quality ITE
The expansion of ITE programmes at HEIs and higher enrolments will not lead to
improved learner achievement in schools unless the critical challenges of quality are
urgently resolved.
This must be the most urgent priority, otherwise the expansion of provision will only
reproduce more poor quality teachers with inadequate subject and pedagogical content
knowledge and limited teaching experience, which leaves them ill-prepared for the
challenges of classroom teaching.
In particular, improving the quality of distance ITE provision is critical because more
HEIs will be offering it in the future. UNISA’s graduation rates indicate that studying part-
time through distance education is a long and difficult process for students and they need
more support. NWU53 has developed a blended learning model which does provide more
student support and could be adopted by more HEIs.
The quality of the teaching students receive from teacher educators is key to improving
the standards of ITE. To meet the future demand for new high quality teachers, both the
number and quality of teacher educators needs to increase.
Current teacher educators should be assessed on their ability to convey their subject
content and pedagogical content knowledge in ways that enable student teachers to
develop their knowledge and skills. This will require the collection of quantitative and
qualitative data on all education faculty staff – their qualifications, age, experience,
subject knowledge and pedagogical skills, as well as their workloads, remuneration,
status, and job mobility trends. From this information, appropriate CPTD programmes
can be developed for teacher educators.
To give more substance to MRTEQ, the national education departments have identified
professional standards for teachers and teacher educators as a priority. These provide
more detail about the standards of proficiency in both subject knowledge and pedagogy
that are required and are becoming the norm in other countries.
Student selection for teaching needs to be rethought. Given the high demand for places,54
the points required for admission to ITE programmes can be increased, and selection
processes and mechanisms should become more rigorous. The selection of high-quality
applicants who are likely to succeed will improve the efficiency of programmes and

31March 2015
Supply and Demand 2013–2025
For the next decade the public HEIs will be able to provide enough graduates overall for the system’s needs, so the role of the private sector in future should be a strategic, targeted one
reduce costs. Equally, applicants’ motivation for choosing to study teaching should be
probed if we want committed teachers in our schools.
Targeted Role for the Private Sector
CDE’s research in 2013 for this report found that there were few market-based solutions
to the need for more high-quality ITE. However, in the case of FP programmes especially,
there are indications that private provision has begun to expand.
The projections of the CDE model indicate that for the next decade the public HEIs
will be able to provide enough graduates overall for the system’s needs, so the role of the
private sector in future should be a strategic, targeted one.
Market-based private initiatives
The Embury model could be replicated by the private sector, especially to meet the demand
in niche areas where the system’s need is greatest: ECD, FP, languages, mathematics and
mathematical literacy. Private providers also are able to develop new courses, materials
and programme to respond to new, emerging demands for teacher education.
Public-private partnerships
One of greatest strengths of Embury is the excellent partnerships it has formed with the
PED, DBE, foundations and schools. Among the other benefits accruing from these,
they have enabled it to give its trainee teachers extended, meaningful practical work
experience, and to develop new courses and materials with government funding.
Because private providers are able to respond quickly to areas of urgent need,
government should incentivise private ITE institutions to initiate or expand programmes
where the public HEIs will be hard pushed to produce enough NTGs in the near future
and where new teacher education needs emerge. The provision of student bursaries
would enable private providers to focus on recruiting students for these programmes.
For their part, private providers should engage regularly with the national and provincial
education departments around ITE priorities and needs.
Expertise
Government’s Operation Phakisa will take place in the second half of the year. The
objective is to bring all the key education stakeholders together to develop detailed
implementation plans that tackle education priorities and effect ‘big, fast results’. The
private sector should contribute its expertise to the task teams that, amongst others, will
focus on developing effective data and information systems, improving the quality and
efficiency of ITE, and aligning teacher supply and demand.
Alternative models and approaches to ITE
Both for-profit companies and institutions and not-for-profit organisations should use
the private sector’s entrepreneurial nature and flexibility to be innovative. They can
experiment with alternative pathways to becoming a qualified teacher, different structures
for ITE provision and a range of modes of delivery.

32 Centre for Development and Enterprise
TEACHERS IN SOUTH AFRICA
The expansion of ITE programmes means
that substantially more competent teacher
educators are required. Because they are
central to the quality of ITE programmes, any
initiative to strengthen their teaching will have
a multiplier effect
Corporate social investment
Private donors could fund strategic initiatives to strengthen ITE in public HEIs in areas
where maximum impact on quality, efficiency and teacher shortages can be achieved. Ad
hoc projects will not do the job.
The expansion of ITE programmes means that substantially more competent teacher
educators are required. Because they are central to the quality of ITE programmes, any
initiative to strengthen their teaching will have a multiplier effect in terms of the added
benefit to all the students they teach.
On the basis of the evaluation of teacher educators’ knowledge and skills, donors could
fund professional development programmes for teacher educators to upgrade their
competencies in areas where they are weak. An initiative could begin with UNISA, NWU
and UKZN, the three public HEIs that produce most NTGs.
Priority areas would be professional development courses in language, mathematics
and mathematical literacy. For instance, in FP programmes, it is critical that teacher
educators know how to teach students to educate reading effectively, given the very low
levels of learners’ reading proficiency as the 2014 Annual National Assessments (ANAs)
have revealed.
Funders could also assist in recruiting and incentivising new high-quality teacher
educators to staff the many expanded ITE programmes.
Another strategic area would be for donors to fund the research outlined above to
produce the evidence needed to effectively diagnose and address critical problems in ITE
as well as investigate new potentially promising initiatives to improve ITE.
Typically donors have invested heavily in CPTD for teachers in service rather than ITE.
CPTD is important as nearly a fifth of the teaching force is unqualified and most lack the
necessary subject and pedagogical content knowledge to teach the school curriculum
effectively. Unfortunately in the past, most CPTD initiatives have achieved few, if any,
positive effects on learner achievement. Evidence is emerging of promising models that
have been implemented in South Africa and these should inform future CPTD efforts.55
However, CDE would argue that unless we get the quality and focus of ITE provision
right so that all newly qualified teachers are able to teach effectively and have specialised
in the subjects and phases of greatest need, the country will not have teachers for critical
subjects and will be engaged continually in remedial in-service training. Strengthening
ITE is one of the most urgent and strategic national interventions needed to improve
South African schooling and requires the combined resources and expertise of the public
and private sectors. However, this needs to be coupled with effective teacher performance
management and capacity-building through targeted professional development for the
teachers in service.
33March 2015
Supply and Demand 2013–2025
Even if existing and new teachers possess all the necessary knowledge and skills, their professionalism and commitment to fulfilling their teaching responsibilities in the best interests of the learners is of paramount importance
CONCLUDING REMARKSGovernment must be commended for turning around a severe shortage of teacher
graduates in 2009, such that it is meeting its targets of new graduates; and that if this
continues, the production of sufficient teachers for the schooling system during the next
ten years is achievable. The education departments have also taken important initial steps
to improve the quality of ITE. However, as CDE’s study has revealed, much still needs to
be done to address the many challenges inherent in the composition of the teaching force,
the quality of ITE provision, and the teacher shortages in key phases and subjects.
Teachers are at the centre of any education system and their quality directly affects
learner achievement. Unless ITE programmes prepare teachers with all the competencies
to provide quality teaching and learning, then all the resources poured into ITE will not
achieve what must be the absolutely fundamental goal of our schooling system: improved
learner achievement.
However, high quality ITE is not a sufficient condition for improving learner
achievement. Even if existing and new teachers possess all the necessary knowledge and
skills, their professionalism and commitment to fulfilling their teaching responsibilities in
the best interests of the learners is of paramount importance.
This challenge is aptly summed up in a recent report of the National Treasury:
Above all, it is the commitment of teachers that will ensure the success of the education
system: to arrive at school on time, every school day; to be prepared for each day’s
lessons; and to be in their classes, teaching. If the system can ensure this, better basic
education and effective expenditure will be within reach. 56
Where this commitment is found wanting and teachers are not fulfilling their
responsibilities, they need to be held accountable.
In conclusion, a final word about the CDE model is appropriate. It was developed in close
co-operation with the national departments and other researchers. CDE brought together
experts in and outside government for the first time to engage with drafts of the model and
help refine it. There are only a few researchers in the country with the necessary expertise
for such a complex task, and as new and better data becomes available, the group should
continue to meet to refine the model further. To ensure that the small pool of these skills
is increased for the future, more researchers, especially young African researchers with
an interest in modelling, should be brought on board to learn from the group’s expertise.
It is clear that CDE’s study is not the last word on South Africa’s teacher supply and
demand challenges, but it is the first word on key aspects of the teacher supply and
demand processes and the future implications of the profile of the current teaching force.
Additional research, integrating PERSAL with ASS data, would improve the reliability
of the model’s projections and facilitate effective planning. However no future model
could provide the various agents in the system with a precise plan of what to do. Rather,
modelling should be the basis for a dialogue to create greater consensus about the best
strategies for the future to produce the quality teachers South Africa needs.

34
Endnotes1. Centre for Development and Enterprise, Value in the Classroom (Johannesburg: CDE, 2011). This report
modelled teacher supply and demand based on 2009 data.
2. R. Deacon, Overview of Teacher Education Challenges and Prospects. Research Report for CDE
(Johannesburg: CDE, 2013).
3. P.S. Robinson, Embury Institute for Teacher Education – A Case Study. Research Report for CDE
(Johannesburg: CDE, 2012).
4. Centre for Development and Enterprise, CDE Technical Report: Teacher supply and demand 2013-2025
(Johannesburg: CDE, 2015).
5. Centre for Development and Enterprise, Mathematics Outcomes in South African Schools: What are the
facts? What should be done? (Johannesburg: CDE, 2013).
6. J. Hofmeyr, G. Hall, The National Teacher Education Audit: Synthesis report (Pretoria: Department of
Education, 1995).
7. CHE, ‘Report on the National Review of Academic and Professional Programmes in Education,’ HE
Monitor 11, 2010.
8. Department of Basic Education, Department of Higher Education and Training, Integrated Strategic
Planning Framework for Teacher Education and Development in South Africa, 2011–2025 (Pretoria: DBE
& DHET, 2011).
9. DBE, DHET, 1
10. For example, while DHET is responsible for initial teacher education, the management of the Funza
Lushaka Bursary Scheme and the implementation of the ISPTED are located in the DBE. This structural
divide makes concerted effective efforts to improve the teacher development system difficult to achieve.
11. DBE, DHET, 123
12. DBE, DHET
13. CHE
14. Department of Higher Education and Training, The Minimum Requirements for Teacher Education
Qualifications (Pretoria: DHET, 2011).
15. CDE (2011)
16. DBE presentation: Basic Education Sector Plans for Six Priorities in the Sector, presented at national
education workshop in preparation for Operation Phakisa (10 December 2014).
17. DBE presentation: Educator Human Resource Management: A Broad Overview, Operation Phakisa (10-
11 December 2014).
18. JET Education Services, The Initial Teacher Education Research Project: An examination of aspects of
initial teacher education curricula at five higher education institutions, Progress Report (Johannesburg:
JET, 2014).
19. CHE, 92
20. JET Education Services, 19
21. The analysis of PERSAL data was based on two internal departmental reports by Martin Gustafsson,
adviser to the Minister of Basic Education. At the time of this study the PERSAL database was not made
available to Dr Simkins on the grounds of confidentiality. The reports are “Teacher supply patterns in
the payroll data” (unpublished, 2009) and “Inflow of new teachers into the public system” (unpublished,
2014).
22. CDE (2011)
23. Total fertility rate represents the number of children that would be born to a woman if she were to live
to the end of her childbearing years and bear children in accordance with current age-specific fertility
rates.

35
24. The number of births continues to rise because the population of mothers is rising faster than fertility
falls.
25. There is no reliable, comprehensive data on the number of learners in Grade R, the reception year for
primary schooling. As the majority of learners now start school in Grade R, these enrolments were
included in the model. After an examination of all the available datasets and recent research, it was
decided to use the ratio of 64 per cent of Grade R to Grade 1 enrolments in public and independent
ordinary schools drawn from DBE statistics. This decision is explained in the CDE Technical Report.
26. Department of Basic Education, School Realities 2013 (Pretoria: Ministry of Education, 2014).
27. The 13 years of schooling are divided into four phases: the Foundation Phase (Grades R -3), the
Intermediate Phase (Grades 4-6), the Senior Phase (Grades 7-9) and the Further Education and Training
Phase (Grades 10-12). For the purposes of the model these were simplified into three categories: lower
primary (FP), higher primary (IP, IP/SP and SP) and secondary (SP/FET and FET).
28. The CDE Technical Report discusses the problem of calculating the teachers required for Grade R in
detail.
29. This is very unlikely because there will always be independent/community-based pre-schools with
Grade R that parents prefer for their children.
30. The Funza Lushaka Bursary Scheme can at most provide bursaries for only 25 per cent of student
teachers.
31. Figures obtained from the DBE in February 2015.
32. The fact that the PGCE students already have a degree is a key factor in the better graduation rate of
PGCE programmes.
33. Although CDE did not undertake specific research on the extent of private provision of ITE internationally
and neither did the researchers for the ISPFTED Technical Report, a scan of the literature suggests that
in many countries, public ITE provision dominates.
34. For example in 2013 the various partnerships included the training of unqualified and under-qualified
pre-school teachers in collaboration with Engen, Highbury Preparatory School (Thuthukisa Initiative)
and the KZN Department of Education as described in the Embury Institute for Teacher Education
Prospectus. Embury Institute for Teacher Education, Embury Institute for Teacher Education Prospectus
(Durban: Embury Institute for Teacher Education, 2013), 15.
35. Department of Basic Education, Education Statistics in South Africa 2013 (Pretoria: DBE, 2014).
36. In the case of the ASS, which is based on data entered by schools, the modelling was confined to only
those teachers who had South African citizenship and were between the ages of 22 and 65 because the
use of South African ID numbers was central to the methodology. As a result the population of teachers
used in the ASS modelling was 400,756 teachers.
37. In his analysis of PERSAL data, Gustafsson took a qualified educator to be one with REQV13 (Relative
Education Qualification Value) and above and an unqualified educator with REQV12 and below.
This resulted in qualified teachers comprising 87 per cent of the teaching force. However, teachers
are individually assessed for assignment to REVQ levels, and this is not wholly dependent on their
qualifications, and REVQ entries are not always complete. Consequently CDE used actual teacher
qualifications, which indicated that in 81 per cent of teachers were qualified in 2013.
38. CDE has included professionally unqualified teachers in the unqualified category, because they do not
have a teaching qualification. Government figures tend to categorise only those with M+2 and lower
qualifications as unqualified. In that case the number would decrease to about 40,000 (10 per cent).
39. P. Vinjevold, Initial and In-service Teacher Education: Skills training in relation to national needs and
interests, quoting a Committee of College of Education Rectors of South Africa, Report prepared for Joint
Education Trust, January 2000 (Johannesburg: JET, 2001).
36
40. In the case of the PERSAL data available, it had to be assumed that the attrition rates of qualified and
unqualified educators were the same. By contrast, the ASS indicates considerably worse net attrition of
qualified educators over unqualified educators. This is explained in detail in the CDE Technical Report.
41. The PERSAL net attrition rate seems too low, since it implies very long average periods of completed
service (36 years as opposed to 30 on the ASS estimates). However, the ASS attrition rates are likely to
be too high, because of the methodology adopted and inaccuracies in the data (some teachers may be
counted as joiners or leavers, whereas they were in fact stayers).
42. These are fully discussed in the CDE Technical Report with an Appendix on each.
43. The lower attrition rates from the PERSAL data would be a major cause of the differences. Gustaffson’s
higher percentage of qualified teachers would also be a factor. Only a comparison of the full PERSAL
database with the ASS could throw more light on the discrepancies.
44. This is based on the DHET’s Enrolment Plan 2013-2019.
45. We do not know why qualified teachers leave permanently. This can happen because teachers leave
when they have worked off their bursaries, they come under severe financial pressure at certain stages
of their career, or the shortage of high-level kills in the labour market means that qualified teachers as
university graduates can find other jobs.
46. For the purposes of this analysis, teachers qualifying for lower primary are those students who specialise
in FP and FP/IP, those qualifying for higher primary are those students who major in IP, IP/SP and SP,
and those qualifying for secondary are those students who specialise in SP/FET and FET.
47. W. Green, M. Adendorff, B. Mathebula, ‘“Minding the gap?” A national foundation phase teacher
supply-demand analysis 2012-2020,’ South African Journal of Childhood Education 4(2), 2014, 1-23.
48. Information supplied to CDE by the DHET in February 2015.
49. CDE (2013)
50. Green, Adendorff and Mathebula
51. The draft policy was introduced in 2013, and set to be implemented in 2015. At the time of writing this
report, the policy had not yet been formally adopted in the system.
52. L. Chisholm, ‘The Textbook Saga and Corruption in Education,’ Southern African Review of Education
19(1), 2013, 7-22.
53. The intention of this policy, which is being piloted, is to make at least one African Language compulsory
in the FP and to extend this up to the FET Phase over time.
54. See www.nwu.ac.za/c-gov/teaching-and-learning
55. Applications to study teacher education have been increasing way beyond the capacity of institutions
to accommodate them, with media reports suggesting that just six institutions received almost 13,000
applications in early 2011. Times Live, Star pupils opting to become teachers (19 February 2011),
available online at www.uj.ac.za/EN/Newsroom/News/Pages/Starpupilsoptingtobecometeachers.
aspx, accessed 20 March 2011.
56. Eric Schollar Associates, Epoch and Optima Trusts: Public Schools Maths Challenge Programme (An
Impact Evaluation) (Johannesburg: Tshikululu Social Investments, 2014).
57. P. Hobden, S. Hobden, Going to Scale: What is required for intervention projects to go to scale?
Johannesburg: Centre for Development and Enterprise, 2012).
58. National Treasury, Provincial Budgets and Expenditure Review: 2010/11 – 2016/17 (Pretoria: National
Treasury, 2014), 49.

Previous publications in this series
THE MISSING SECTOR: Contract Schools - International experience and South African prospects (August 2013)
ROUTES INTO FORMAL EMPLOYMENT: Public and Private Assistance to Young Job Seekers (July 2012)
VALUE IN THE CLASSROOM: The quantity and quality of South Africa’s teachers (September 2011)
HIDDEN ASSETS: South Africa’s low-fee private schools (August 2010)
IMMIGRANTS IN JOHANNESBURG: Estimating numbers and assessing impacts (August 2008)
SOUTH AFRICA’S ‘DOOR KNOCKERS’: Young people and unemployment in metropolitan South Africa (July 2008)
UNDER THE RADAR: Pentecostalism in South Africa and its potential social and economic role (March 2008)
THE SKILLS REVOLUTION: Are we making progress? (October 2007)
SKILLS, GROWTH AND MIGRATION POLICY: Overcoming the ‘fatal constraint’ (February 2007)
Can Black Economic Empowerment Drive New Growth? (January 2007)
PRIVATE SCHOOLING FOR THE POOR? International research raises new questions for South Africa (November 2005)
GROWTH AND DEVELOPMENT IN SOUTH AFRICA’S HEARTLAND: Silence, exit and voice in the Free State (July 2005)
LABOUR-INTENSIVE PUBLIC WORKS: Towards providing employment for all South Africans willing to work (April 2003)

BOARD
L Dippenaar (chairman), A Bernstein (executive director), A Ball, N Behrens,
E Bradley, C Coovadia, B Figaji, M le Roux, S Maseko, I Mkhabela, W Nkuhlu,
S Pityana, S Ridley, A Sangqu.
INTERNATIONAL ASSOCIATE
Peter L Berger
5 Eton Road, Parktown, Johannesburg, South Africa
P O Box 1936, Johannesburg 2000, South Africa
Tel 27 11 482 5140 • Fax 27 11 482 5089
[email protected] • www.cde.org.za
This CDE project was funded bythe Sasol Inzalo Foundation