technical analysis software automates the charting
DESCRIPTION
jjTRANSCRIPT
Technical analysis software automates the charting, analysis and reporting functions that support technical analysts in their review and prediction of financial markets (e.g. the stock market).
Features[edit]
The following are the most common features of technical analysis applications. Some software may focus on only one aspect (say back testing) and the combination of more than one software package is often required to build a fully automated trading system.
Charting[edit]
A graphical interface that presents price, volume and technical analysis indicators through a variety of visual interfaces such as line, bar, candlestick and open-high-low-close (OHLC) charts. The chart data is presented as a time series and users typically have the ability to view historical data with varying interval (sampling) periods. Interval periods range from seconds through to months; short term traders tend to use frequent interval periods, such as 1 minute i.e. the price data is updated every 1 minute, whereas longer term traders tend to use daily, weekly or monthly interval periods when trying to identify price and technical analysis trends. Some charting packages enable users to draw support and resistance trend line or for example Fibonacci retracements to help establish trending patterns.
Back testing[edit]
Enables traders to test technical analysis investment timing strategies against historical price movement for one or more specific securities. Strategies are compared to each other using diverse performance measurements such as maximum drawdown, annual profit and Sharpe ratio. The objective is to try and develop a trading strategy based on technical analysis indicator criteria, which will generate a positive return. This concept was computerized and introduced to traders by Louis B. Mendelsohn in 1983 with his ProfitTaker Futures Trading Software (see August 2010 issue of Stocks, Futures & Options Magazine).
Optimization[edit]
A process of testing technical analysis indicator parameters, with the view to developing an investment strategy that generates the maximum return based on historical price movement. The optimization process is achieved through the fine-tuning of the associated technical analysis charting parameters. Typically technical analysis indicators have a range of parameters that can be adjusted, such as the interval period and the technical analysis indicator variables. For example the stochastic indicator has four parameters that effect its results: %k, %d, slowing period, interval period. Optimization must be performed carefully to avoid curve fitting. Back testing of an over-optimized system will perform real-time. One way to diminish over-optimization is by carrying out optimization on historical data and then performing future testing (sometimes referred to as 'out of sample') before making a final evaluation of a trading strategy.
Scanner[edit]
Scanners enable users to 'scan' the market, be it stocks, options, currencies etc., to identify investment opportunities that meet a user's specific investment criteria. Using a technical analysis scanner, a user could, for example, scan the market to identify oversold stocks that have stochastic and RSI value of less than 20% and 30 respectively.
Alerts[edit]
Alert software is used to monitor specific equities, such as stocks, options, currencies, warrants, etc., and provide a notification of when specific price, volume and technical analysis investment conditions are met. As an example, a person who uses technical analysis might want to be notified when the RSI indicator rises above 70, followed by the price falling below its 20 day moving average; using alerting software the user will be able to create an alert, which will provide a notification of when the technical analysis investment conditions are met. When alert conditions are met, a notification is typically communicated via an on screen pop up or sent as an email, instant message or text alert (to a mobile phone).
Custom indicators[edit]
Most technical analysis software includes a library of de facto standard indicators (e.g. moving averages and MACD). Some software will also provide a mean to customize, combine or create new indicators. This is typically achieved with a proprietary scripting or graphical language.
Data feed[edit]
Technical analysis software is typically used with end of day (EOD), delayed or real time data feeds. EOD data feeds provide the end of day closing price for the given equity and is typically updated once a day at market close. Delayed data is typically delayed 15 to 30 minutes depending on the exchange and is the most commonly used data feed type.[citation needed] Real time data feeds provide tick by tick 'real time' data. Real time data is licensed on a per-exchange basis whereas delayed data is typically purchased on a regional basis, such as US markets, rather than an exchange basis.[citation needed]
Broker interface[edit]
Some technical analysis software can be integrated with brokerage platforms to enable traders to place trades via a user interface that they are familiar with. Typically these software providers try to differentiate themselves from the brokerage software through enhanced features such as automated trading.
Platforms[edit]
Technical analysis software is available in the form of commercial or open source software. Such software may be available on a computer, or on a mobile phone or personal digital assistant
(PDA). Mobile phones and PDAs allow a user to access online technical analysis packages when away from their computer. However, packages that require the use of Java applets may not work on older model mobile phones or PDAs. Online technical analysis software packages provide access from any Internet-connected computer (including a suitably equipped mobile or PDA), but may require the user to store their information with the provider. Installed, downloaded software will only be available on the computers that the user has downloaded and installed it on.
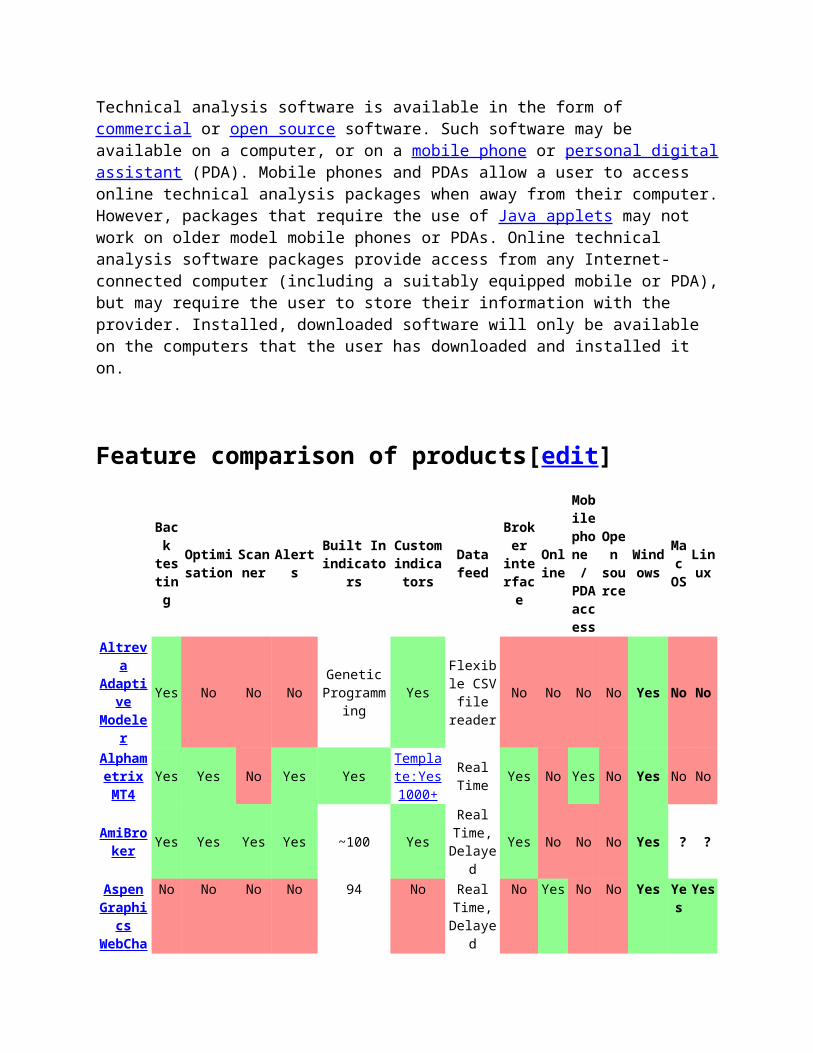
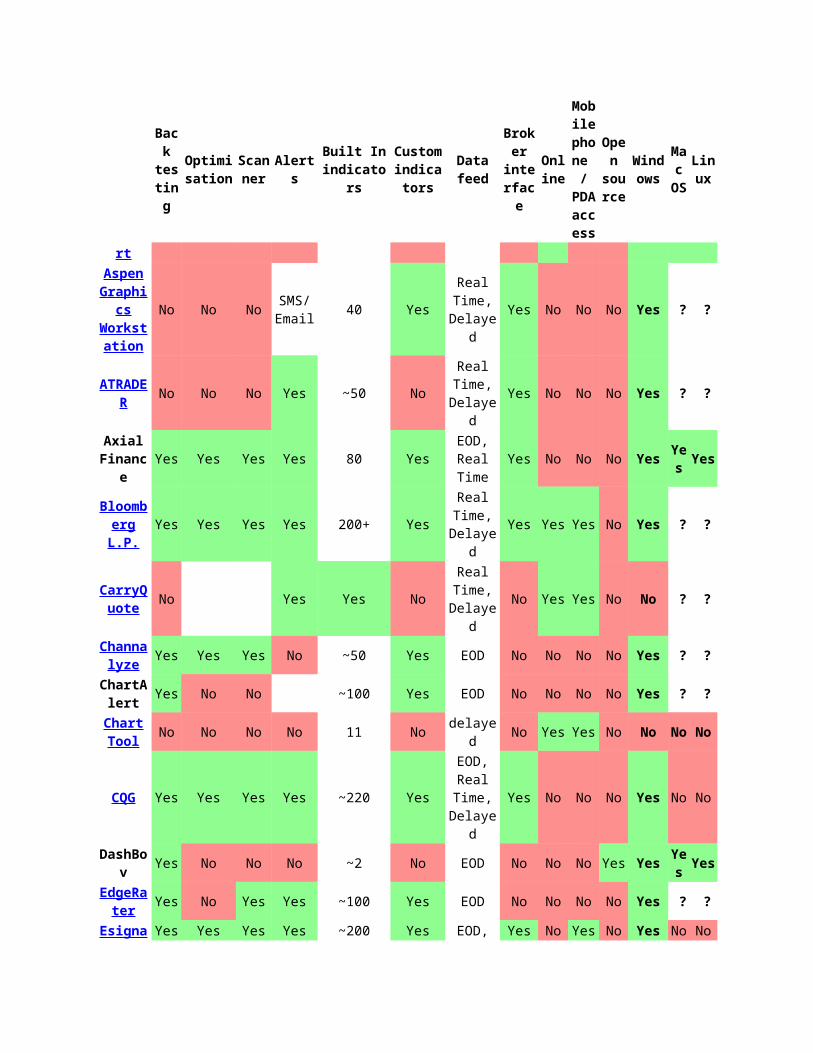
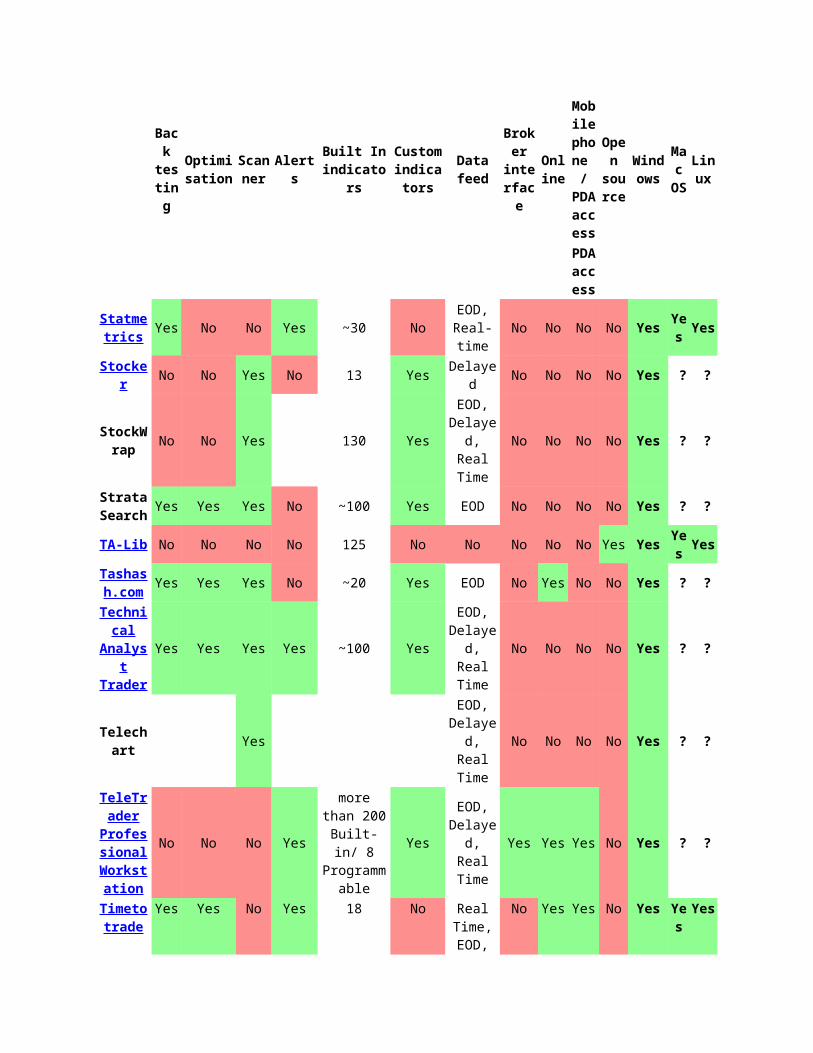
Feature comparison of products[edit]
Back
testing
Optimisation
Scanner
AlertsBuilt In
indicators
Custom indicator
s
Data feed
Broker
interface
Online
Mobile
phone /
PDA acce
ss
Open
source
Windows
Mac OS
Linux
Altreva Adaptive Modeler
Yes No No NoGenetic
Programming
YesFlexible CSV file
readerNo No No No Yes No No
Alphametrix MT4
Yes Yes No Yes YesTemplate
:Yes 1000+
Real Time
Yes No Yes No Yes No No
AmiBroker
Yes Yes Yes Yes ~100 YesReal
Time, Delayed
Yes No No No Yes ? ?
Aspen Graphics WebCha
rt
No No No No 94 NoReal
Time, Delayed
No Yes No No YesYes
Yes
Aspen Graphics Workstat
ion
No No NoSMS/Email
40 YesReal
Time, Delayed
Yes No No No Yes ? ?
ATRADER
No No No Yes ~50 NoReal
Time, Delayed
Yes No No No Yes ? ?
Axial Finance
Yes Yes Yes Yes 80 YesEOD, Real Time
Yes No No No YesYes
Yes
Bloomberg L.P.
Yes Yes Yes Yes 200+ YesReal
Time, Delayed
Yes Yes Yes No Yes ? ?
CarryQuote
No Yes Yes NoReal
Time, Delayed
No Yes Yes No No ? ?
Channalyze
Yes Yes Yes No ~50 Yes EOD No No No No Yes ? ?
ChartAlert
Yes No No ~100 Yes EOD No No No No Yes ? ?
Back
testing
Optimisation
Scanner
AlertsBuilt In
indicators
Custom indicator
s
Data feed
Broker
interface
Online
Mobile
phone /
PDA acce
ss
Open
source
Windows
Mac OS
Linux
Chart Tool
No No No No 11 No delayed No Yes Yes No No No No
CQG Yes Yes Yes Yes ~220 Yes
EOD, Real
Time, Delayed
Yes No No No Yes No No
DashBov Yes No No No ~2 No EOD No No No Yes YesYes
Yes
EdgeRater
Yes No Yes Yes ~100 Yes EOD No No No No Yes ? ?
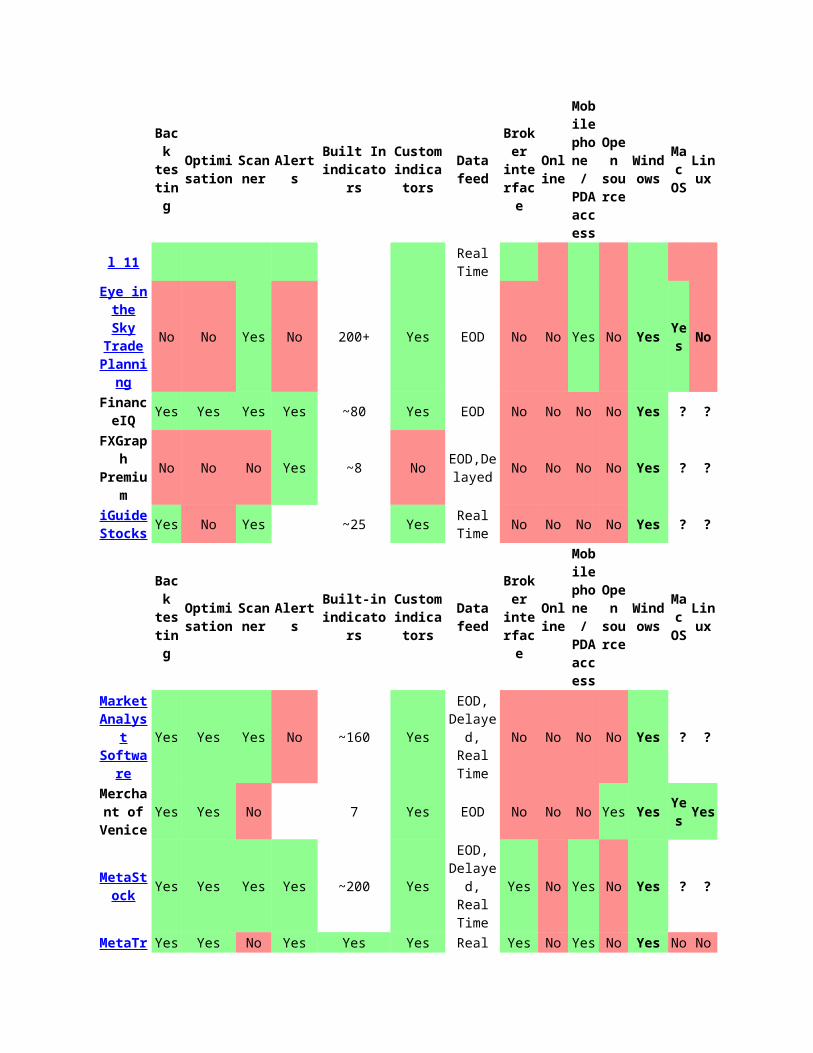
Esignal 11
Yes Yes Yes Yes ~200 YesEOD, Real Time
Yes No Yes No Yes No No
Eye in the Sky Trade
Planning
No No Yes No 200+ Yes EOD No No Yes No YesYes
No
FinanceIQ
Yes Yes Yes Yes ~80 Yes EOD No No No No Yes ? ?
FXGraph
PremiumNo No No Yes ~8 No
EOD,Delayed
No No No No Yes ? ?
iGuideStocks
Yes No Yes ~25 YesReal Time
No No No No Yes ? ?
Back
testing
Optimisation
Scanner
AlertsBuilt-in
indicators
Custom indicator
s
Data feed
Broker
interface
Online
Mobile
phone /
PDA acce
ss
Open
source
Windows
Mac OS
Linux
Market Analyst
SoftwareYes Yes Yes No ~160 Yes
EOD, Delayed,
Real Time
No No No No Yes ? ?
Merchant of
VeniceYes Yes No 7 Yes EOD No No No Yes Yes
Yes
Yes
MetaStock
Yes Yes Yes Yes ~200 Yes
EOD, Delayed,
Real Time
Yes No Yes No Yes ? ?
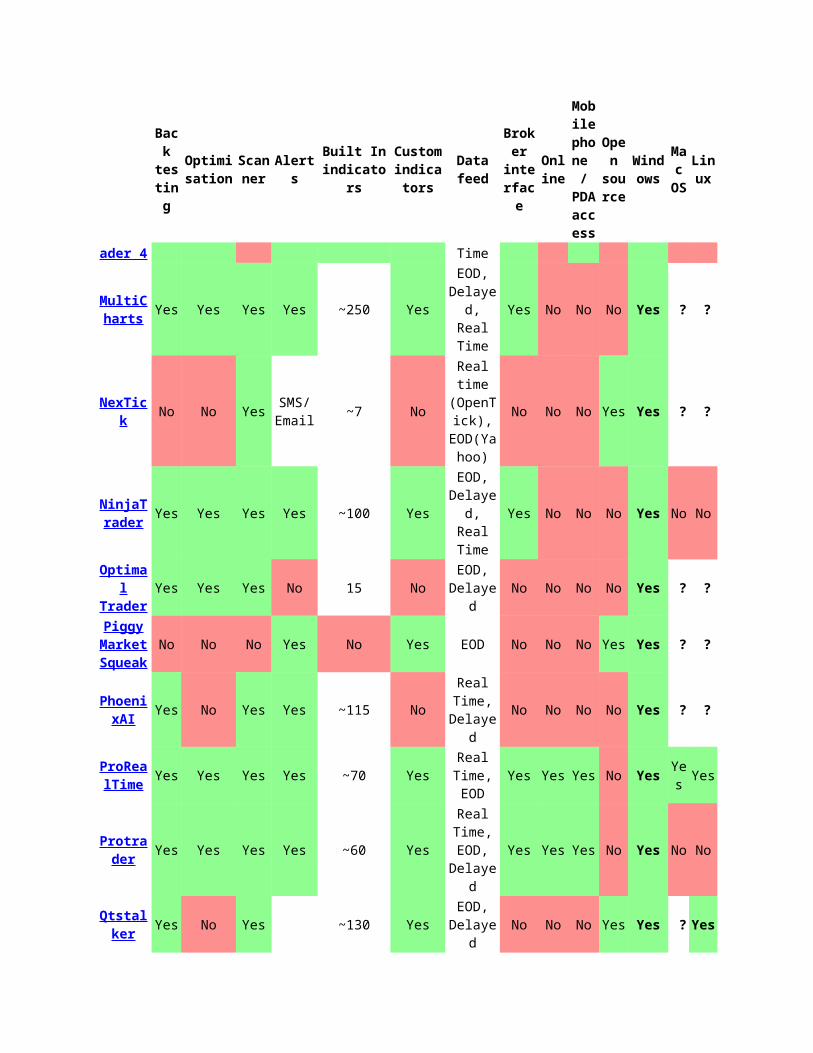
MetaTrader 4
Yes Yes No Yes Yes YesReal Time
Yes No Yes No Yes No No
MultiCharts
Yes Yes Yes Yes ~250 Yes EOD, Delayed,
Real
Yes No No No Yes ? ?
Back
testing
Optimisation
Scanner
AlertsBuilt In
indicators
Custom indicator
s
Data feed
Broker
interface
Online
Mobile
phone /
PDA acce
ss
Open
source
Windows
Mac OS
Linux
Time
NexTick No No YesSMS/Email
~7 No
Real time (OpenTic
k), EOD(Ya
hoo)
No No No Yes Yes ? ?
NinjaTrader
Yes Yes Yes Yes ~100 Yes
EOD, Delayed,
Real Time
Yes No No No Yes No No
Optimal Trader
Yes Yes Yes No 15 NoEOD,
DelayedNo No No No Yes ? ?
Piggy Market Squeak
No No No Yes No Yes EOD No No No Yes Yes ? ?
PhoenixAI
Yes No Yes Yes ~115 NoReal
Time, Delayed
No No No No Yes ? ?
ProRealTime
Yes Yes Yes Yes ~70 YesReal
Time, EOD
Yes Yes Yes No YesYes
Yes
Protrader
Yes Yes Yes Yes ~60 Yes
Real Time, EOD,
Delayed
Yes Yes Yes No Yes No No
Qtstalker Yes No Yes ~130 YesEOD,
DelayedNo No No Yes Yes ? Yes
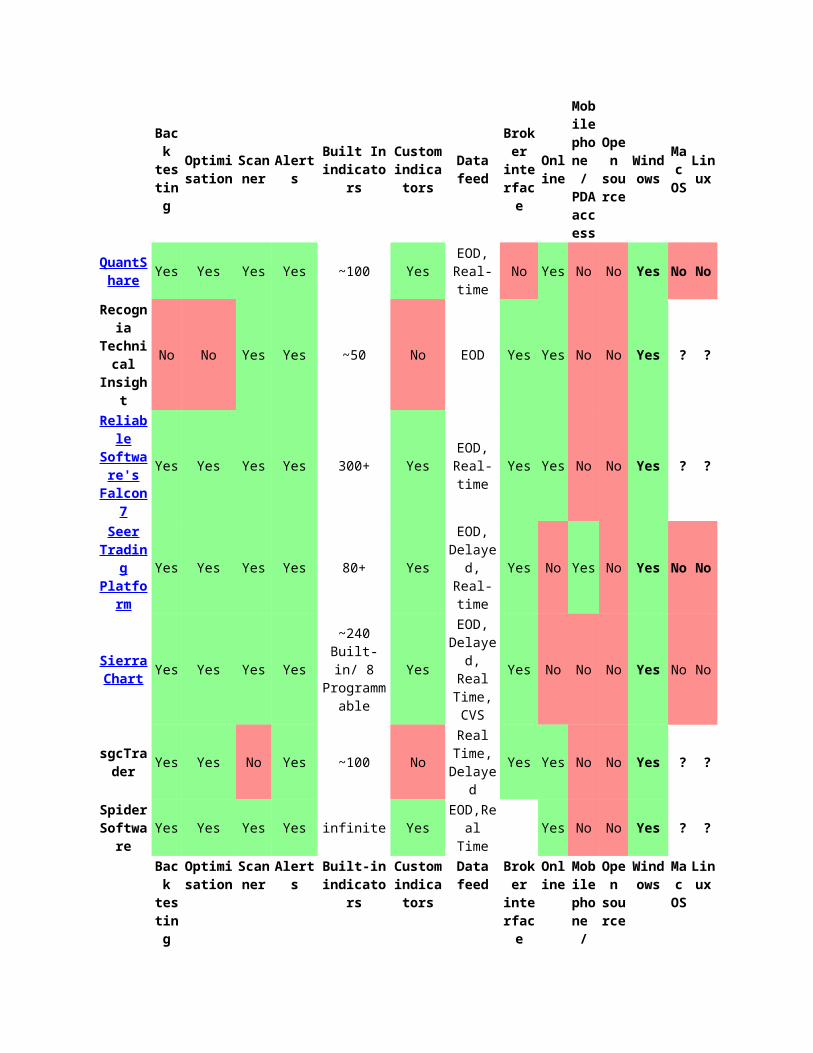
QuantShare
Yes Yes Yes Yes ~100 YesEOD,
Real-timeNo Yes No No Yes No No
Recognia Technical Insight
No No Yes Yes ~50 No EOD Yes Yes No No Yes ? ?
Reliable Software's Falcon7
Yes Yes Yes Yes 300+ YesEOD,
Real-timeYes Yes No No Yes ? ?
Seer Trading Platform
Yes Yes Yes Yes 80+ YesEOD,
Delayed, Real-time
Yes No Yes No Yes No No
Sierra Chart
Yes Yes Yes Yes
~240 Built-in/ 8
Programmable
Yes
EOD, Delayed,
Real Time, CVS
Yes No No No Yes No No
sgcTrader
Yes Yes No Yes ~100 NoReal
Time, Delayed
Yes Yes No No Yes ? ?
Back
testing
Optimisation
Scanner
AlertsBuilt In
indicators
Custom indicator
s
Data feed
Broker
interface
Online
Mobile
phone /
PDA acce
ss
Open
source
Windows
Mac OS
Linux
Spider Software
Yes Yes Yes Yes infinite YesEOD,Rea
l TimeYes No No Yes ? ?
Back
testing
Optimisation
Scanner
AlertsBuilt-in
indicators
Custom indicator
s
Data feed
Broker
interface
Online
Mobile
phone /
PDA acce
ss
Open
source
Windows
Mac OS
Linux
Statmetrics
Yes No No Yes ~30 NoEOD,
Real-timeNo No No No Yes
Yes
Yes
Stocker No No Yes No 13 Yes Delayed No No No No Yes ? ?
StockWrap
No No Yes 130 Yes
EOD, Delayed,
Real Time
No No No No Yes ? ?
StrataSearch
Yes Yes Yes No ~100 Yes EOD No No No No Yes ? ?
TA-Lib No No No No 125 No No No No No Yes YesYes
Yes
Tashash.com
Yes Yes Yes No ~20 Yes EOD No Yes No No Yes ? ?
Technical Analyst Trader
Yes Yes Yes Yes ~100 Yes
EOD, Delayed,
Real Time
No No No No Yes ? ?
Telechart Yes
EOD, Delayed,
Real Time
No No No No Yes ? ?
TeleTrader
Professional
Workstation
No No No Yes
more than 200 Built-in/
8 Programmab
le
Yes
EOD, Delayed,
Real Time
Yes Yes Yes No Yes ? ?
Timetotrade
Yes Yes No Yes 18 No
Real Time, EOD,
Delayed
No Yes Yes No YesYes
Yes
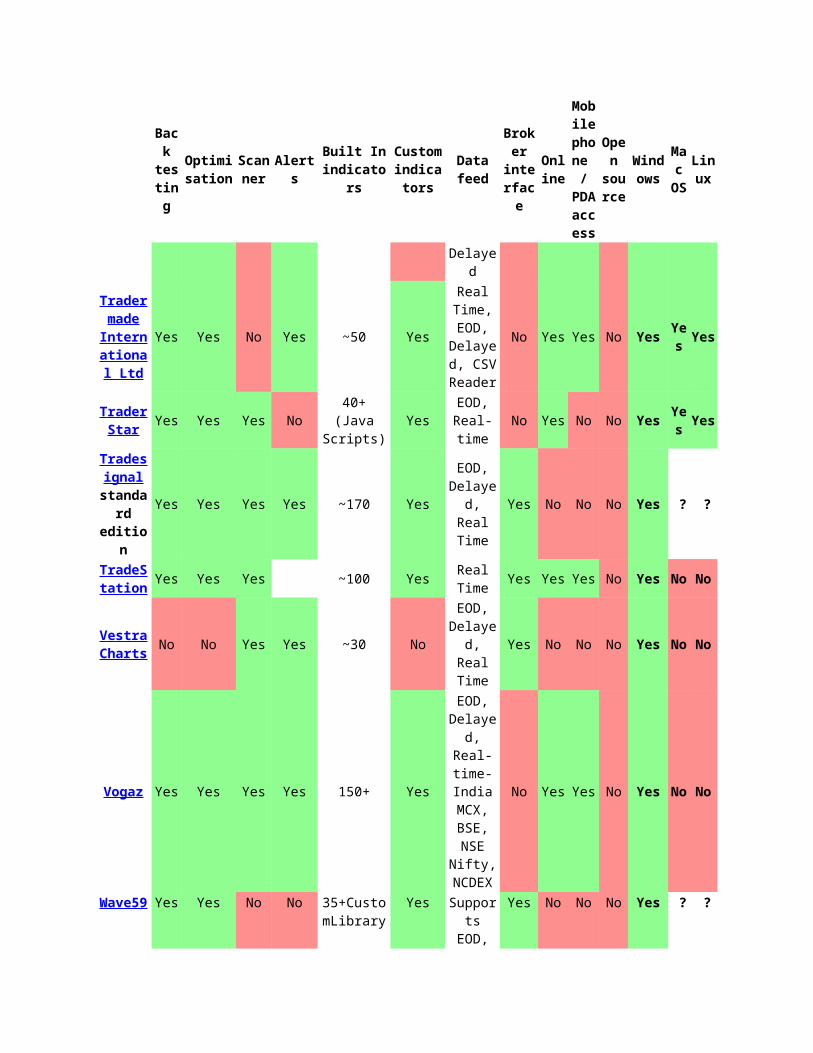
Tradermade
International Ltd
Yes Yes No Yes ~50 Yes
Real Time, EOD,
Delayed, CSV
Reader
No Yes Yes No YesYes
Yes
TraderSt Yes Yes Yes No 40+ (Java Yes EOD, No Yes No No Yes Ye Yes
Back
testing
Optimisation
Scanner
AlertsBuilt In
indicators
Custom indicator
s
Data feed
Broker
interface
Online
Mobile
phone /
PDA acce
ss
Open
source
Windows
Mac OS
Linux
ar Scripts) Real-time sTradesig
nal standard edition
Yes Yes Yes Yes ~170 Yes
EOD, Delayed,
Real Time
Yes No No No Yes ? ?
TradeStation
Yes Yes Yes ~100 YesReal Time
Yes Yes Yes No Yes No No
VestraCharts
No No Yes Yes ~30 No
EOD, Delayed,
Real Time
Yes No No No Yes No No
Vogaz Yes Yes Yes Yes 150+ Yes
EOD, Delayed,
Real-time- India MCX, BSE, NSE Nifty,
NCDEX
No Yes Yes No Yes No No
Wave59 Yes Yes No No35+CustomL
ibraryYes
Supports EOD,
Delayed, Real Time
Yes No No No Yes ? ?
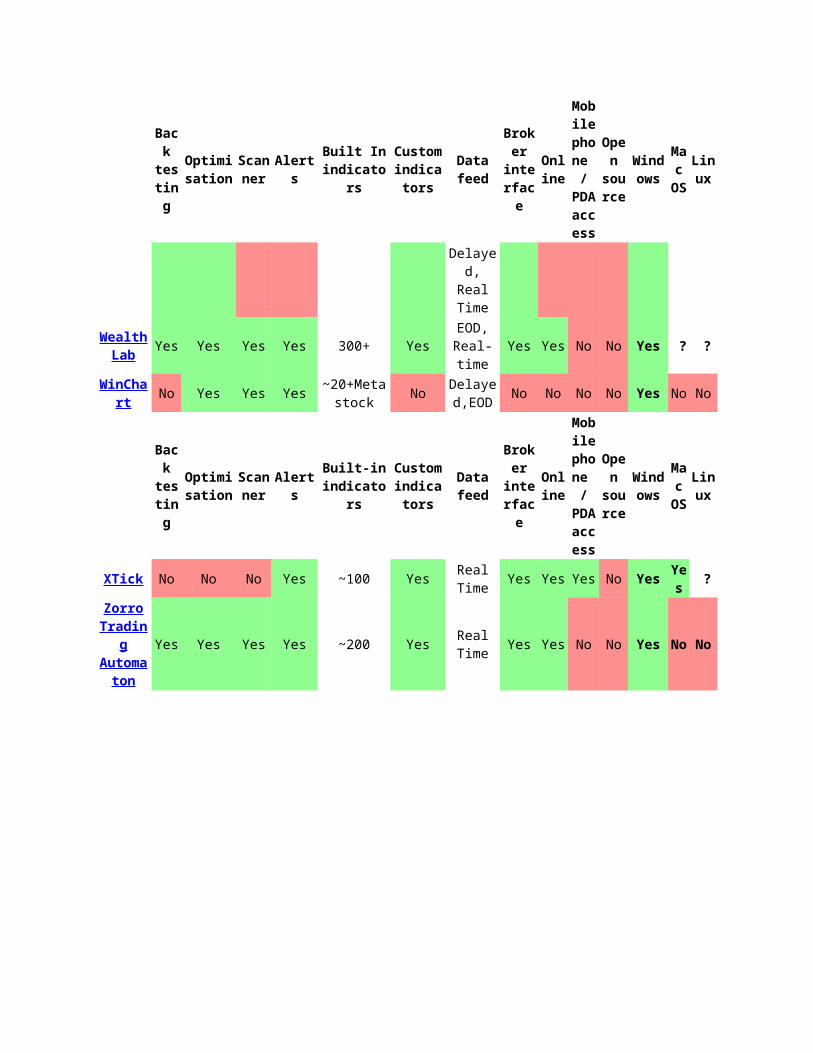
Wealth Lab
Yes Yes Yes Yes 300+ YesEOD,
Real-timeYes Yes No No Yes ? ?
WinChart
No Yes Yes Yes~20+Metasto
ckNo
Delayed,EOD
No No No No Yes No No
Back
testing
Optimisation
Scanner
AlertsBuilt-in
indicators
Custom indicator
s
Data feed
Broker
interface
Online
Mobile
phone /
PDA acce
ss
Open
source
Windows
Mac OS
Linux
XTick No No No Yes ~100 YesReal Time
Yes Yes Yes No YesYes
?
Zorro Trading Automat
on
Yes Yes Yes Yes ~200 YesReal Time
Yes Yes No No Yes No No
Major players in technical analysis software in india
Spider
Falcon
Meta stock
Amibroker
Spider:
About Us
Spider Software Pvt Ltd is a pioneer in developing Real Time and End of Day technical analysis software for stock market traders in India. Through our persistent innovation and smarter ways to provide unswerving Real Time technical analysis software, we have been able to develop one of the most equipped and accurate platforms in the field of stock market trading analysis.
Since its inception in the year 2000, Spider Software Pvt Ltd has continuously developed unique and exceedingly effective and superior software being used by more than 5000 users all over in
India. Spider Software offers a wide range of products and services in the field of Real Time and End of Day technical analysis.
Our strength in the field of software development and capability to understand market needs has helped us forge our place as frontiers in stock market trading software development. Our company is powered by a pool of experience and talented professionals across stock market trading with fundamental and technical analysis to provide you guaranteed win-win situations while trading in the stock market. The company is a licensed vendor of BSE and NSE Real Time Price Feed. It uses internet based client server model for distribution of real-time data feed. The client side software’s are decision making terminals with facilities for technical analysis, fundamental analysis and numerical analysis which help traders take right decision.
Spider Software provides financial stock solutions and makes stock market really simple to understand. We make working with charts and figures more practical and lucrative. With more than 10 years of prudent and applied research, Spider Software Pvt Ltd is one of the most trusted names when it comes to knowledge on technical analysis and Indian stock market trading.
Company Mission
Spider Software Pvt Ltd aims at providing the best in class stock market solutions that help businesses and individuals grow revenue, generate profits, and manage business to run more efficiently and in a sustainable way. By exploring the proper usage of company’s services and tools, every person can effectively earn money from the biggest financial plot of the country – The Stock Market.The company also realizes the effort required behind making this dream turn into reality. It needs to achieve leading market benchmarks, deliver excellent client support and impart the no lesser amount of knowledge to their clients as much as the company’s professional’s posses regarding stock trading. That is exactly what the company is successfully abiding by.
At Spider Software Pvt Ltd, we aspire to provide superior customer support that complements the quality of our products and cater our customers’ needs. To upgrade our level of customer support services, we conduct regular seminars and workshops in various parts of the country where we encourage our customers to leave us their valuable feedbacks and other queries. After having received the feedbacks, we sincerely try to implement ways to enhance our services to better serve our customers in every possible way.
We always aim at providing logical and profitable solutions in order to avoid unexpected incur of losses in the stock market by edifying everyone to best use their assets and to earn profits from their investments.
Amibroker
Features of AmiBroker :
True Portfolio Backtesting & Optimization, drag-and-drop indicator creation, formula-based alerts, unique composite indicators, built-in web research browser, Walk-Forward Testing, Multi-monitor floating charts, Free Fundamental data, Multiple Time-Frame support, Drawing layers, Multi-window layouts, Easy-to-use formula editor, Both the editions of AmiBroker are realtime. - Compare Editions Direct link to eSignal, Interactive Brokers, IQFeed, myTrack, FastTrack, QP2, TC2000, any DDE compliant feed, MS and many others...
Best Stock Analysis Software – Falcon7 from Reliable Software
Reliable Software humbly presents unto you highly reliable software which ought to help you in Technical Analysis.
Our Promise
Easy-to-use technical analysis prospecting tools whose sole purpose is to help you in day-to-day trading and stock investing. It helps you in the following trades
Stock research Investment research Stock pick Share prices of BSE and NSE stocks shares Stock chart
We promise that this software will help you determine trading & investing opportunities in Indian stocks and futures -- the ultimate content a retail trader or investor would wish to have!
Emphasizing Features
Falcon7 possesses a lot of advantages which makes it a reliable one. Some of its features are listed below
Falcon7 comes along with data, thus making it a one stop solution. Time saving for short-term trading or long-term investment Our content also covers industry groups, sector and index aggregates, and can be used
to analyze individual stocks, industry groups, sectors, and indices.
Armed with these tools, you will have the knowledge and the confidence to execute profitable trades.
Take a Free Trial of the Best Indian made Technical Analysis software named Falcon7. Trust us!! It has all features which every expensive software has and even much more than that.
A single click to view average Volume, Price and Quantity changes!!!!!!!!!!!!!!!!!
Overview
MetaStock 12 is now released! In this newest version of MetaStock we’ve packed in more power, more flexibility, more features ... more of what YOU need to make your best, most profitable trades.
MetaStock Pro is specifically designed who use intra-day data to transact in real-time through the trading day. Whether you're an experienced, active trader or just learning how to trade the markets, MetaStock helps you succeed. The software contains powerful analysis tools to help you make informed decisions about what to buy & sell and when to execute to make the most money possible. MetaStock comes with many out-of-the box trading solutions that are reliable and easy to use. And if you want to take your analysis to the next level, MetaStock gives you the ability to customize these solutions to your particular trading style.
Whether you trade stocks, bonds, mutual funds, futures, commodities, FOREX, or indices, MetaStock has the tools you need for superior market analysis and financial success. In fact, 84% of our customers report that they have been successful using the MetaStock software! Here is what one of our customers has to say about MetaStock:
"MetaStock is obviously made by people who understand traders' needs. It's a complete package that's easy to use, no matter what kind of securities you trade. It's the single tool that's allowed me to fine-tune my trading approach, pursue my avocation and build a satisfying retirement
Compararing various softwares
Spider
Products:
Real time
Eod
Real time u ve four:
Spider iris
Spider iris plus
Spider iris cfx
Spided iris ctcl
Live Data of NSE, Futures & Options
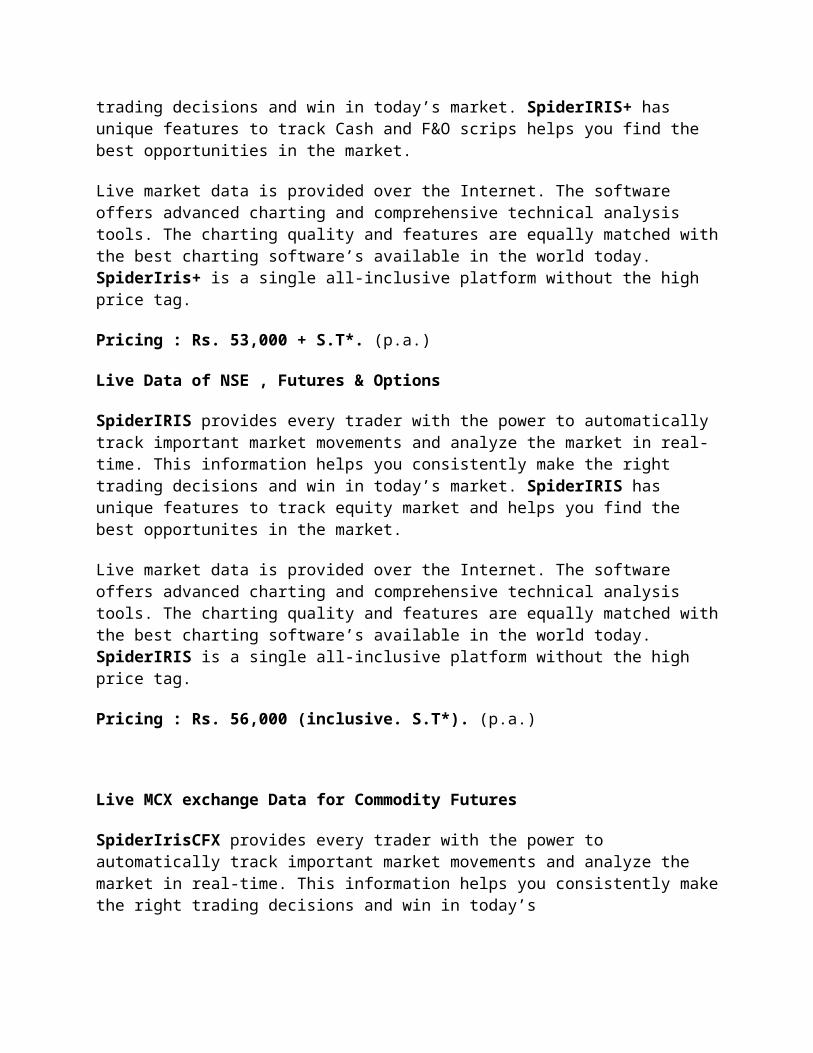
SpiderIris+ provides every trader with the power to automatically track important market movements and analyze the market in real-time. This information helps you consistently make the right trading decisions and win in today’s market. SpiderIRIS+ has unique features to track Cash and F&O scrips helps you find the best opportunities in the market.
Live market data is provided over the Internet. The software offers advanced charting and comprehensive technical analysis tools. The charting quality and features are equally matched with the best charting software’s available in the world today. SpiderIris+ is a single all-inclusive platform without the high price tag.
Pricing : Rs. 53,000 + S.T*. (p.a.)
Live Data of NSE , Futures & Options
SpiderIRIS provides every trader with the power to automatically track important market movements and analyze the market in real-time. This information helps you consistently make the right trading decisions and win in today’s market. SpiderIRIS has unique features to track equity market and helps you find the best opportunites in the market.
Live market data is provided over the Internet. The software offers advanced charting and comprehensive technical analysis tools. The charting quality and features are equally matched with the best charting software’s available in the world today. SpiderIRIS is a single all-inclusive platform without the high price tag.
Pricing : Rs. 56,000 (inclusive. S.T*). (p.a.)
Live MCX exchange Data for Commodity Futures
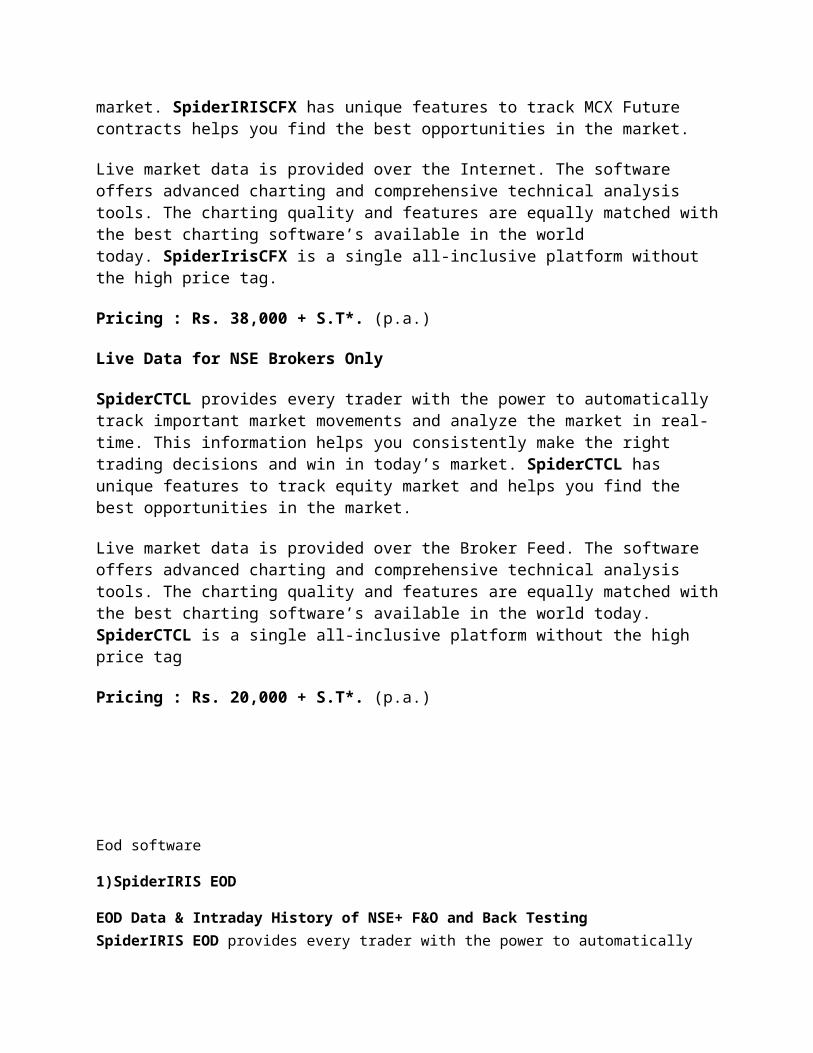
SpiderIrisCFX provides every trader with the power to automatically track important market movements and analyze the market in real-time. This information helps you consistently make the right trading decisions and win in today’s market. SpiderIRISCFX has unique features to track MCX Future contracts helps you find the best opportunities in the market.
Live market data is provided over the Internet. The software offers advanced charting and comprehensive technical analysis tools. The charting quality and features are equally matched with the best charting software’s available in the world today. SpiderIrisCFX is a single all-inclusive platform without the high price tag.
Pricing : Rs. 38,000 + S.T*. (p.a.)
Live Data for NSE Brokers Only
SpiderCTCL provides every trader with the power to automatically track important market movements and analyze the market in real-time. This information helps you consistently make the right trading decisions and win in today’s market. SpiderCTCL has unique features to track equity market and helps you find the best opportunities in the market.
Live market data is provided over the Broker Feed. The software offers advanced charting and comprehensive technical analysis tools. The charting quality and features are equally matched
with the best charting software’s available in the world today. SpiderCTCL is a single all-inclusive platform without the high price tag
Pricing : Rs. 20,000 + S.T*. (p.a.)
Eod software
1)SpiderIRIS EOD
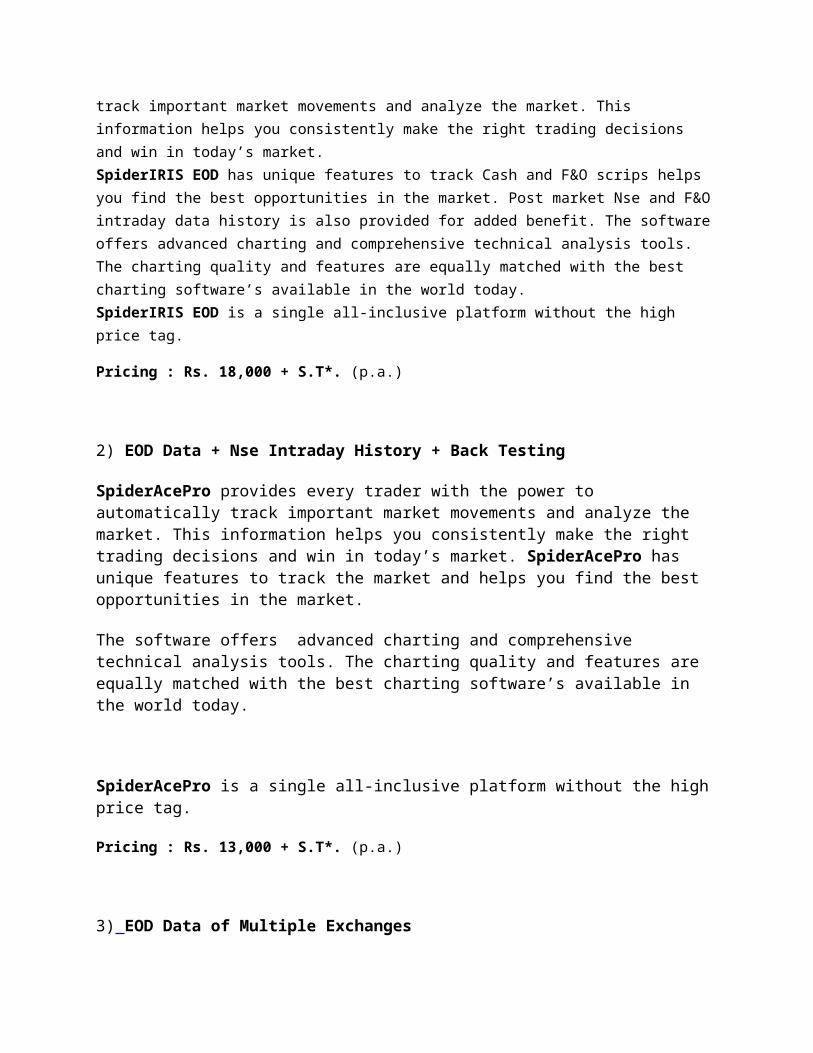
EOD Data & Intraday History of NSE+ F&O and Back TestingSpiderIRIS EOD provides every trader with the power to automatically track important market movements and analyze the market. This information helps you consistently make the right trading decisions and win in today’s market.SpiderIRIS EOD has unique features to track Cash and F&O scrips helps you find the best opportunities in the market. Post market Nse and F&O intraday data history is also provided for added benefit. The software offers advanced charting and comprehensive technical analysis tools. The charting quality and features are equally matched with the best charting software’s available in the world today.SpiderIRIS EOD is a single all-inclusive platform without the high price tag.
Pricing : Rs. 18,000 + S.T*. (p.a.)
2) EOD Data + Nse Intraday History + Back Testing
SpiderAcePro provides every trader with the power to automatically track important market movements and analyze the market. This information helps you consistently make the right trading decisions and win in today’s market. SpiderAcePro has unique features to track the market and helps you find the best opportunities in the market.
The software offers advanced charting and comprehensive technical analysis tools. The charting quality and features are equally matched with the best charting software’s available in the world today.
SpiderAcePro is a single all-inclusive platform without the high price tag.
Pricing : Rs. 13,000 + S.T*. (p.a.)
3) EOD Data of Multiple Exchanges
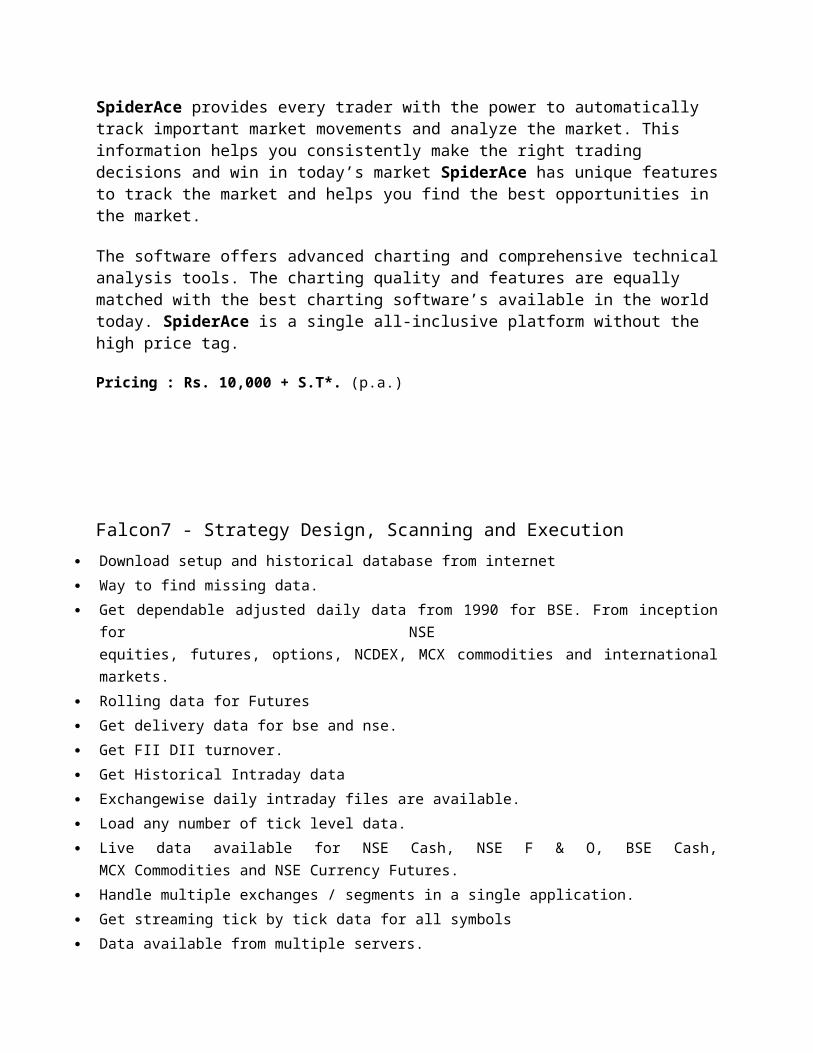
SpiderAce provides every trader with the power to automatically track important market movements and analyze the market. This information helps you consistently make the right trading decisions and win in today’s market SpiderAce has unique features to track the market and helps you find the best opportunities in the market.
The software offers advanced charting and comprehensive technical analysis tools. The charting quality and features are equally matched with the best charting software’s available in the world today. SpiderAce is a single all-inclusive platform without the high price tag.
Pricing : Rs. 10,000 + S.T*. (p.a.)
Falcon7 - Strategy Design, Scanning and Execution
Download setup and historical database from internet
Way to find missing data.
Get dependable adjusted daily data from 1990 for BSE. From inception for NSE
equities, futures, options, NCDEX, MCX commodities and international markets.
Rolling data for Futures
Get delivery data for bse and nse.
Get FII DII turnover.
Get Historical Intraday data
Exchangewise daily intraday files are available.
Load any number of tick level data.
Live data available for NSE Cash, NSE F & O, BSE Cash,
MCX Commodities and NSE Currency Futures.
Handle multiple exchanges / segments in a single application.
Get streaming tick by tick data for all symbols
Data available from multiple servers.
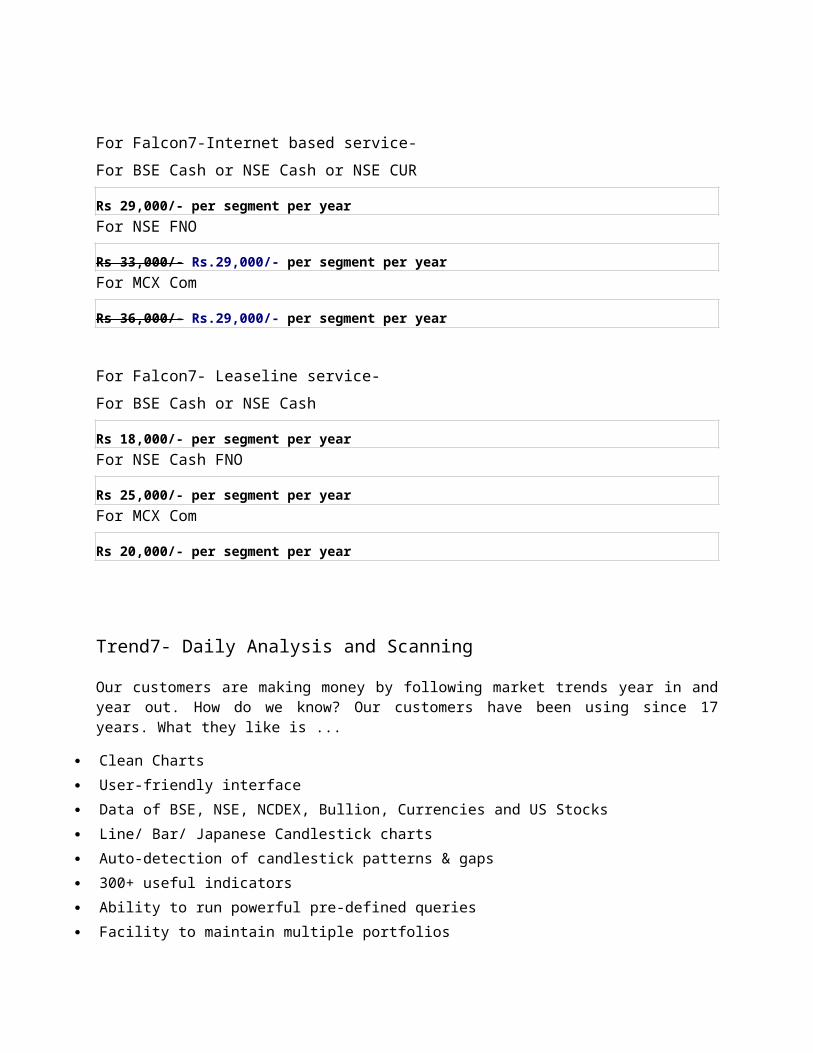
For Falcon7-Internet based service-
For BSE Cash or NSE Cash or NSE CUR
Rs 29,000/- per segment per year

For NSE FNO
Rs 33,000/- Rs.29,000/- per segment per year
For MCX Com
Rs 36,000/- Rs.29,000/- per segment per yearFor Falcon7- Leaseline service-
For BSE Cash or NSE Cash
Rs 18,000/- per segment per year
For NSE Cash FNO
Rs 25,000/- per segment per year
For MCX Com
Rs 20,000/- per segment per year
Trend7- Daily Analysis and Scanning
Our customers are making money by following market trends year in and year out. How do we know? Our customers have been using since 17 years. What they like is ...
Clean Charts
User-friendly interface
Data of BSE, NSE, NCDEX, Bullion, Currencies and US Stocks
Line/ Bar/ Japanese Candlestick charts
Auto-detection of candlestick patterns & gaps
300+ useful indicators
Ability to run powerful pre-defined queries
Facility to maintain multiple portfolios
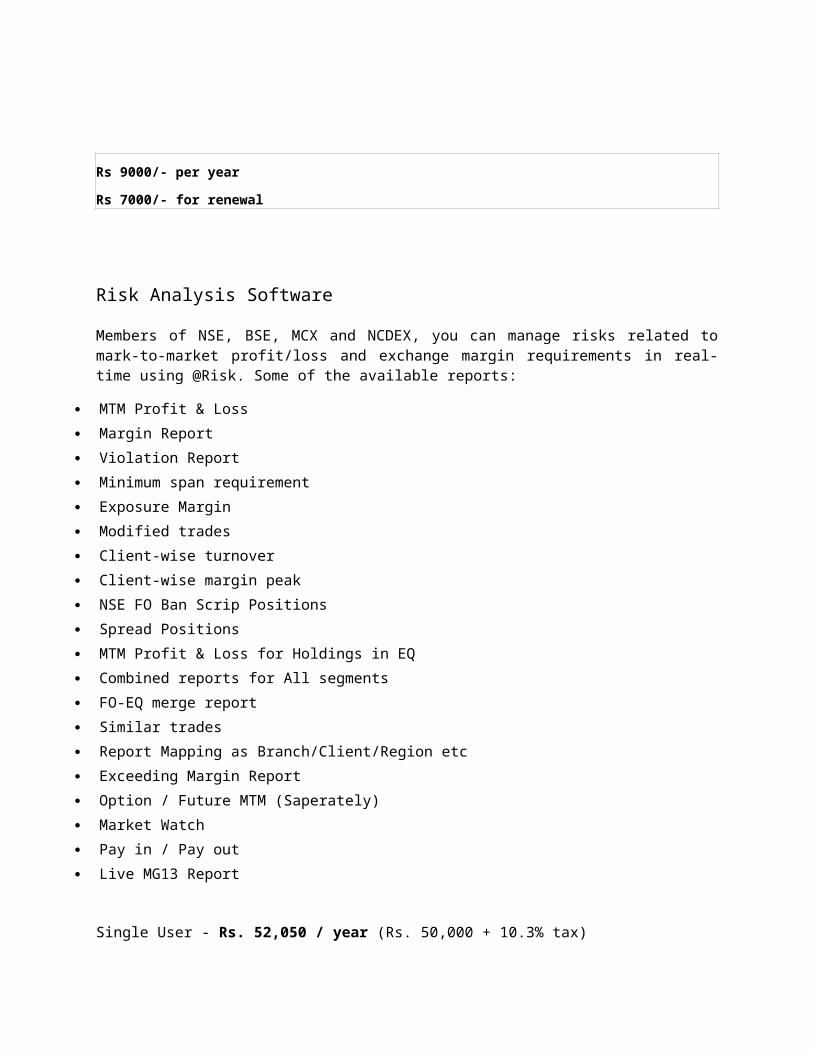
Rs 9000/- per year
Rs 7000/- for renewal
Risk Analysis Software
Members of NSE, BSE, MCX and NCDEX, you can manage risks related to mark-to-market profit/loss and exchange margin requirements in real-time using @Risk. Some of the available reports:
MTM Profit & Loss
Margin Report
Violation Report
Minimum span requirement
Exposure Margin
Modified trades
Client-wise turnover
Client-wise margin peak
NSE FO Ban Scrip Positions
Spread Positions
MTM Profit & Loss for Holdings in EQ
Combined reports for All segments
FO-EQ merge report
Similar trades
Report Mapping as Branch/Client/Region etc
Exceeding Margin Report
Option / Future MTM (Saperately)
Market Watch
Pay in / Pay out
Live MG13 Report
Single User - Rs. 52,050 / year (Rs. 50,000 + 10.3% tax)
A AmiBroker Standard Edition + RT Data r Standard Edition + RT Data
This is a combo product. Alongwith AmiBroker Standard Edition, you can also opt for realtime data.
In case you already have AmiBroker with you and wish to have only RT data from us, you should choose this product.
RT Data means Realtime data. We supply realtime, tick-by-tick data of Futures & Options Segment of NSE.
Features of the data sent are as follows...
Data directly from NSE Servers. We are authorised distributor of National Stock Exchange of India for the data (through our sister concern Global Financial Datafeeds LLP).
Low latency realtime data with ultrafast delivery. True tick-by-tick data with time-stamp of 1 sec.
Futures & Options of all months, of all stocks / indices and for all strike rates are available (limit of 200 symbol viewing at a time).
Total number of scrips cross 36,000+. As an example, just for symbol NIFTY, total number of scrips cross 900+.#
Intraday history of 1month (1min format) and EOD History of 1 year (from 01.01.2010) is available for all symbols.
You can search and add scrips directly from our servers in AmiBroker. Sufficient redundancy at all levels to ensure smooth and uninterrupted flow of data
during market hours. The data contains Open, High, Low, Close, Volume, Open Interest, Bid, Bid Size, Ask,
Ask Size, Trade Size, Change and % Change for all symbols. Data is highly accurate - all scrips report exact values for all these fields. Candles
once formed do not change after relogin / next day.
Data comes directly into AmiBroker - the renowned and widely respected advanced Technical Analysis and Charting Software.
Data is downloaded simultaneously for all the symbols so you can Scan or Explore in AmiBroker in realtime.
All data stays in AmiBroker - only incremental data is downloaded from servers on login.
No need to connect to internet / login to our servers during off-market hours for Scanning / Exploration.
Data with no gaps - irrespective of when you start your PC, the data will always be continuous without any gaps (backfill is entirely automatic).
Intraday Data of entire F&O Segment of NSE (1minute format) is sent to all users after market hours by email.
You can import historical data provided by us in realtime database - thus making larger historical data available than 1month history provided by our servers.
Single click support directly from application - just click on Contact Live Support link in the application DashBoard.
You may choose for any duration in multiples of months. Select the appropriate no. of months from drop down list box titled 'RT Data' from above.
Important Notes : 1. We normally send registration mail within 2-3 hours during market hours, after order confirmation. During non-market hours, please allow 24 hours so as to start your subscription.2. Legend for calculation of subscription : 1 month = 30 days. 2 months - 60 days. 3 months = 90 days. 6 months = 180 days. 12 months = 365 days.
3. Please allow 24-48 working hours so as to send you AmiBroker Registraion Mail.
Price: Rs15,000.00 (Rs13,869.63 excl. VAT & LBT)
Price: Rs8,150.00 (Rs7,535.83 excl. VAT & LBT)
AmiBroker Professional Edition + RT Data
This is a combo product. Alongwith AmiBroker Professional Edition, you can also opt for realtime data.
RT Data means Realtime data. We supply realtime, tick-by-tick data of Futures & Options Segment of NSE.
Features of the data sent are as follows...
Data directly from NSE Servers. We are authorised distributor of National Stock Exchange of India for the data (through our sister concern Global Financial Datafeeds LLP).
Low latency realtime data with ultrafast delivery. True tick-by-tick data with time-stamp of 1 sec.
Futures & Options of all months, of all stocks / indices and for all strike rates are available (limit of 200 symbol viewing at a time).
Total number of scrips cross 36,000+. As an example, just for symbol NIFTY, total number of scrips cross 900+.#
Intraday history of 1month (1min format) and EOD History of 1 year (from 01.01.2010) is available for all symbols.
You can search and add scrips directly from our servers in AmiBroker. Sufficient redundancy at all levels to ensure smooth and uninterrupted flow of data
during market hours. The data contains Open, High, Low, Close, Volume, Open Interest, Bid, Bid Size, Ask,
Ask Size, Trade Size, Change and % Change for all symbols. Data is highly accurate - all scrips report exact values for all these fields. Candles
once formed do not change after relogin / next day. Data comes directly into AmiBroker - the renowned and widely respected advanced
Technical Analysis and Charting Software. Data is downloaded simultaneously for all the symbols so you can Scan or Explore in
AmiBroker in realtime. All data stays in AmiBroker - only incremental data is downloaded from servers on
login. No need to connect to internet / login to our servers during off-market hours for
Scanning / Exploration. Data with no gaps - irrespective of when you start your PC, the data will always be
continuous without any gaps (backfill is entirely automatic). Intraday Data of entire F&O Segment of NSE (1minute format) is sent to all users
after market hours by email. You can import historical data provided by us in realtime database - thus making
larger historical data available than 1month history provided by our servers. Single click support directly from application - just click on Contact Live Support link
in the application DashBoard.
You may choose for any duration in multiples of months. Select the appropriate no. of months from drop down list box titled 'RT Data' from above.
Important Notes : 1. We normally send registration mail within 2-3 hours during market hours, after order confirmation. During non-market hours, please allow 24 hours so as to start your subscription.2. Legend for calculation of subscription : 1 month = 30 days. 2 months - 60 days. 3 months = 90 days. 6 months = 180 days. 12 months = 365 days.
3. Please allow 24-48 working hours so as to send you AmiBroker Registraion Mail.
Price: Rs20,500.01 (Rs18,955.16 excl. VAT & LBT)
Price: Rs9,525.00 (Rs8,807.21 excl. VAT & LBT)
AmiBroker Ultimate Pack Pro + RT Data
As the name suggests, it is a complete suite of AmiBroker Products suitable for serious trader. It consists of a single user license which hold good for both, your laptop and desktop computer.
The suite consists of :1. AmiBroker Professional Version 5.40 (code AP-5.40-D) - This is the Technical Analysis Platform.2. AmiQuote (code AQ-2.11) - Used for importing quotes (data) directly into AmiBroker.3. AFL Code Wizard (code ACW-5.40) - Wizard for non-programmers to create code for Entry and Exit conditions for Long as well as Short positions.
Alongwith AmiBroker Ultimate Pack Pro, you may also opt for RT (real time) Data of NSE F&O Segment from us (Optional Component).
RT Data means Realtime data. We supply realtime, tick-by-tick data of Futures & Options Segment of NSE.
Features of the data sent are as follows...
Data directly from NSE Servers. We are authorised distributor of National Stock Exchange of India for the data (through our sister concern Global Financial Datafeeds LLP).
Low latency realtime data with ultrafast delivery. True tick-by-tick data with time-stamp of 1 sec.
Futures & Options of all months, of all stocks / indices and for all strike rates are available (limit of 200 symbol viewing at a time).
Total number of scrips cross 36,000+. As an example, just for symbol NIFTY, total number of scrips cross 900+.#
Intraday history of 1month (1min format) and EOD History of 1 year (from 01.01.2010) is available for all symbols.
You can search and add scrips directly from our servers in AmiBroker. Sufficient redundancy at all levels to ensure smooth and uninterrupted flow of data
during market hours. The data contains Open, High, Low, Close, Volume, Open Interest, Bid, Bid Size, Ask,
Ask Size, Trade Size, Change and % Change for all symbols. Data is highly accurate - all scrips report exact values for all these fields. Candles
once formed do not change after relogin / next day. Data comes directly into AmiBroker - the renowned and widely respected advanced
Technical Analysis and Charting Software. Data is downloaded simultaneously for all the symbols so you can Scan or Explore in
AmiBroker in realtime. All data stays in AmiBroker - only incremental data is downloaded from servers on
login.
No need to connect to internet / login to our servers during off-market hours for Scanning / Exploration.
Data with no gaps - irrespective of when you start your PC, the data will always be continuous without any gaps (backfill is entirely automatic).
Intraday Data of entire F&O Segment of NSE (1minute format) is sent to all users after market hours by email.
You can import historical data provided by us in realtime database - thus making larger historical data available than 1month history provided by our servers.
Single click support directly from application - just click on Contact Live Support link in the application DashBoard.
You may choose for any duration in multiples of months. Select the appropriate no. of months from drop down list box titled 'RT Data' from above.
Important Notes : 1. We normally send registration mail within 2-3 hours during market hours, after order confirmation. During non-market hours, please allow 24 hours so as to start your subscription.2. Legend for calculation of subscription : 1 month = 30 days. 2 months - 60 days. 3 months = 90 days. 6 months = 180 days. 12 months = 365 days.
3. Please allow 24-48 working hours so as to send you AmiBroker Registraion Mail.
Price: Rs29,950.00 (Rs27,693.02 excl. VAT & LBT)
Price: Rs9,525.00 (Rs8,807.21 excl. VAT & LBT)
AmiQuote is a companion program to AmiBroker charting/analysis software. The main purpose of AmiQuote is to simplify and automate downloading daily and historical quotation data from free Yahoo! Finance (USA, major European exchanges and some other countries), Quote.com (USA only) sites, MSN (USA and some European exchanges), Integratir (US stocks), Forex (Finam free site)
AmiQuote seamlessly integrates with AmiBroker (standard as well as Professional) directly through main menu.
Price: Rs4,725.00 (Rs4,368.93 excl. VAT & LBT)
AFL Code Wizard
Click Here for Larger Image
Price: Rs4,725.00 (Rs4,368.93 excl. VAT & LBT)
Code: ACW
Qty:
Add to Cart
View Cart
Highlights:
You can buy in Indian Rupees (INR) as well as US$ by using various payment options like
cheque, Demand Draft, Pay Order, Cash, Net Banking, Debit Cards, Master Credit Cards, Visa Credit Cards, American Express
and Discover cards.
Click here to see all payment options with details.
DESCRIPTION
AFL Code Wizard is automatic formula creation program for people without any programming experience. It seamlessly integrates with AmiBroker (standard as well as Professional) directly through main menu.
51 132 product_details.p 1162598198 ADD
8.150 amp=%2B%26%2 desc
1