technical evaluation of solar lighting systems...
TRANSCRIPT


Technical Evaluation of Solar Lighting Systems (SLSs) and their Socio-Economic Impacts - A case study in Fiji
By
Neil Vikash Singh
A thesis submitted in fulfillment of the requirements for the Degree of Master of Science in Physics
School of Engineering and Physics
Faculty of Science, Technology and Engineering, The University of the South Pacific
February 2016
© Neil Vikash Singh 2016

Declaration of Originality I, Neil Vikash Singh, hereby declare that this thesis is my original work and wherever the work of others has been used has been clearly referenced. Name Neil Vikash Singh Student ID S11013816 Signature Date 7/02/2016 Statement by Principal Supervisor The research in this thesis was performed under my supervision and to my knowledge is the sole work of Mr. Neil Vikash Singh. Supervisor Name Dr. Atul Raturi Staff ID: H11046444 Signature Date 11/02/2016 Co-Supervisor Mr. Gyaneshwar Rao Staff ID: H15008479 Signature Date 07/02/2016

i
Acknowledgement I would like to express my most sincere gratitude to my supervisor, Dr. Atul Raturi, for his guidance, insight and support during the preparation of this thesis. I would also like to thank my co-supervisor, Dr. Gyaneshwar Rao, for his input and guidance on the economic and financial aspects on the results of the survey. I also wish to thank the French Government for providing assistance to support the “Banish the kerosene lamp project”. My sincere appreciation also goes to the technical staff of the School of Engineering and Physics; Mr. Amit Deo, Mr. Viti Buadromo, Mr. Joape Cawanibuka and Mr. Abhinay Shandil for assisting me during the experimental stages of my thesis especially the technical assistance with operation of the instruments. I would also like to thank Mr. Radhesh Lal, Ms. Martha Volou, Ms. Iona Ravai and Ms. Hasina Bano for providing guidance in the procurement process. Special thanks also go to my dear friends: Mr. Kapil Nadan, Mr. Atesh Gosai, and Ms. Pritika Bijay. Last but not least, I wish to thank my family for their unconditional encouragement and patience and my wife, Ms. Aveline Singh, who gave assistance in proof reading the chapters of the thesis. Without her support, it would have been difficult for me in compiling my thesis.

ii
Abstract Pacific Island Countries (PICs) encounter the challenge of not having proper infrastructure to provide electricity access to rural communities. The cost of taking the grid to the remote areas and islands is expensive which leaves no choice but to look for substitutes. Most developing countries have considered off-grid lighting products such as SHSs and SLSs as an option. Fiji, as part of the Pacific, encounters the same problem. People in the remote islands of Fiji with no grid-connectivity, are heavily dependent on the highly inefficient traditional or fuel based lighting systems which emit greenhouse gases (GHGs) and pollutants that contribute to global warming and many health related issues. A solution to these challenges is the usage of cleaner and sustainable lighting systems such as solar lighting systems (SLSs) and small solar lights with Light Emitting Diode (LED) lamps which are financially viable and robust decentralised options for providing efficient lighting solutions to rural populace. The main objective of this work is to assess the performance of different SLSs available in Fiji in terms of their solar Photovoltaic (PV) characteristics, illumination levels, system efficacy and socio economic viability. A survey of SLSs available in Fiji markets was undertaken and sample of seven lighting systems namely, Dlight S250, Sun King Pro, Nokero Light, Barefoot Connect, Solar Lantern, Solar Light 10-01 and Dlight Kiran, were tested for PV characteristics, run time and illumination distribution. The lighting systems were categorised and ranked accordingly. The most economical of the seven systems were found to be Barefoot Connect, Solar 10-01, Sun King Pro and Dlight S250 in that order. These systems possess key qualities which make them most efficient and suitable for wide use in Fiji and other Pacific countries. The second objective of this work was to carry out an impact assessment of the lighting systems that were distributed in four remote villages in Fiji. These were Namou village in Ba, Valelawa 1 & 2 and Lagalaga in Labasa.. The impact assessment was carried out by the means of a questionnaire as well as interviewing different groups of people. The first part of the survey was a group interview to determine the background of the village followed by a tour of the village. The second part was the individual and household interview which was on the technical aspects of the usage of the SLSs. The responses were recorded and an analysis was carried out to determine social and financial benefits of the SLSs over traditional fuel based systems. Findings revealed that savings in terms of fuel and money, was a core benefit for the villagers. Smaller systems could replace at least 1 to 1.5 traditional lighting systems and save approximately 2-3 litres of fuel per month. The total savings for having a small systems or combination of systems at home was in the range of $FJD17 - $FJD30 per month, with an allowance of 10% for maintenance, such as, lamp and battery replacement.

iii
Qualitatively, SLS provides better quality of light, increased safety, improved child performance in schools, a healthy environment with less carbon emissions and overall an improved social life.
iv
Table of Contents Acknowledgement i Abstract ii - iii Table of Contents iv – v List of Abbreviation, Units and Nomenclature vi – x List of Figures and Tables xi – xii 1. Chapter 1 – Introduction 1 – 33
1.1. Background PICs 1 – 2 1.2. Pacific Island Countries (PICs) Energy Situation 2 – 7 1.3. Important Baseline Data, Facts and Figures 7 1.4. Energy From Renewable Sources 7 1.5. Renewable Energy Development 8 – 19 1.6. Different Type of Renewable Energy Business Model Across the Globe 19 – 21 1.7. Solar Energy 21 1.8. Solar Home Systems (SHSs) Development 21 – 29 1.9. Overview on the Usage of SHSs 29 – 32 1.10. Objectives of Thesis 32 1.11. Structure of the Thesis 32 - 33 1.12. Relevance of the Thesis 33
2. Chapter 2 – Literature Review 34 – 47 2.1. Fuel Based Lighting Systems 34 - 36 2.2. Photovoltaic (PV) System 36 – 44 2.3. Quality Assurance 44 – 46 2.4. Comparison between Incandescent, CFL and LED light bulbs 46 – 47
3. Chapter 3 – Methodology 48 – 71 3.1. Fraunhofer ISE Stand-Alone LED Lighting Systems QSTM 51 – 57 3.2. Photovoltaic (PV) Module I-V Characteristic Curve 57 – 62 3.3. Autonomous Run Time (ART) 62 3.4. Light distribution over 360 range 63 3.5. Light distribution over a surface 63 3.6. Efficacy 63 – 65 3.7. Economic Analysis of Solar Lighting Systems (SLSs) 65 – 68 3.8. Survey 68 – 71

v
4. Chapter 4 - Results and Discussion 72 – 107 4.1. IV Characteristics for the SLSs 72 – 77 4.2. Measurement for Illumination for the SLSs 77 – 81 4.3. Light Distribution characteristic over a range of 360 degrees angle 82 – 87 4.4. Light Distribution characteristic of SLSs on a plane surface 87 – 95 4.5. Efficacy of the SLSs 95 – 98 4.6. Findings of the Impact Survey 98 – 107
5. Chapter 5 – Conclusions and Recommendations 108 – 113 Annex 1 - References 114 – 125 Annex 2 - Questionnaire 126 – 127 Annex 3 – Survey 128 - 131
vi
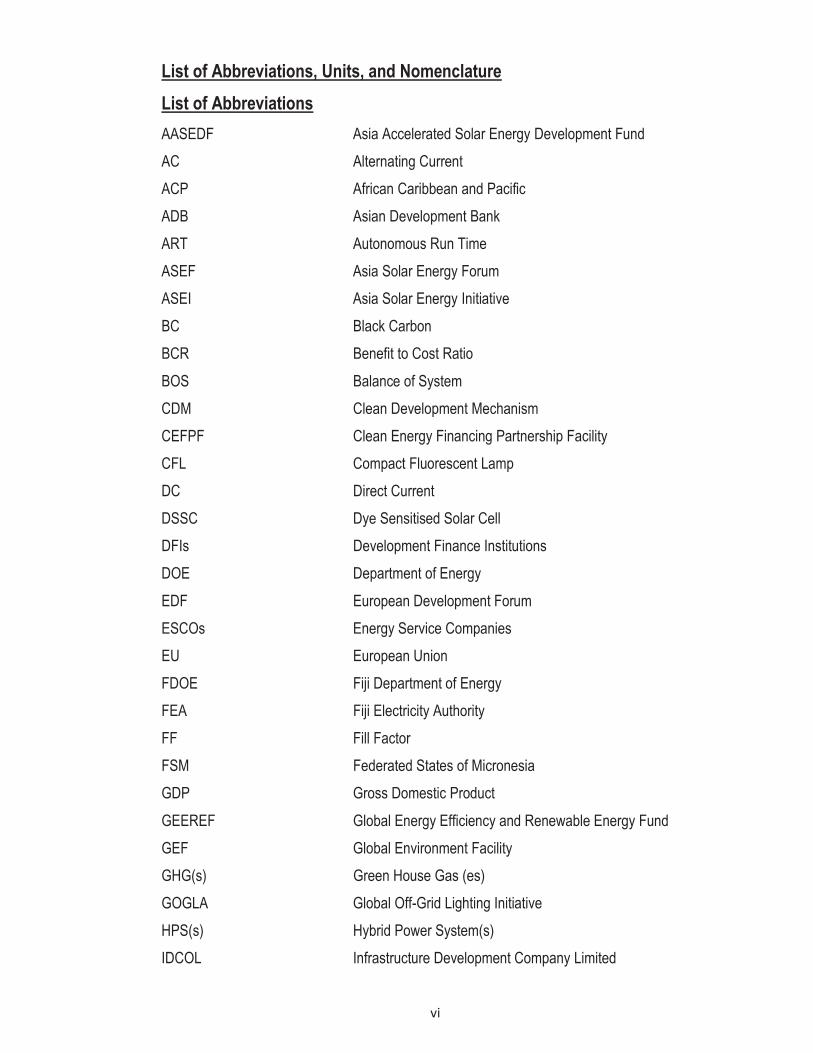
List of Abbreviations, Units, and Nomenclature List of Abbreviations AASEDF Asia Accelerated Solar Energy Development Fund AC Alternating Current ACP African Caribbean and Pacific ADB Asian Development Bank ART Autonomous Run Time ASEF Asia Solar Energy Forum ASEI Asia Solar Energy Initiative BC Black Carbon BCR Benefit to Cost Ratio BOS Balance of System CDM Clean Development Mechanism CEFPF Clean Energy Financing Partnership Facility CFL Compact Fluorescent Lamp DC Direct Current DSSC Dye Sensitised Solar Cell DFIs Development Finance Institutions DOE Department of Energy EDF European Development Forum ESCOs Energy Service Companies EU European Union FDOE Fiji Department of Energy FEA Fiji Electricity Authority FF Fill Factor FSM Federated States of Micronesia GDP Gross Domestic Product GEEREF Global Energy Efficiency and Renewable Energy Fund GEF Global Environment Facility GHG(s) Green House Gas (es) GOGLA Global Off-Grid Lighting Initiative HPS(s) Hybrid Power System(s) IDCOL Infrastructure Development Company Limited

vii
IEC International Electrotechnical Commission IFC International Finance Corporation IPP Independent Power Producer IRENA International Renewable Energy Agency IRR International Rate of Return ISE Institute for Solar Energy System JICA Japanese International Cooperation Agency KOICA Korea International Cooperation Agency Labl Lighting a Billion Lives LAQTM Lighting Africa Quality Test Method LCOE Levelised Cost of Energy LEAP Lighting and Energy Access Partnership LED Light Emitting Diode LVD Low Voltage Disconnect MEC Marshalls Energy Company M3P Melanesia Million Miracle Program NEP National Energy Policy NGO(s) Non-Government Organisation(s) NLTC National Lighting Test Center NORTH – REP North Pacific Renewable Energy Efficiency Project NPV Net Present Value ODI Overseas Development Institute OVP Over Voltage Protection OPC Organic Photovoltaic Cells OPIC Overseas Private Investment Corporation OPRET Office for the Promotional of Renewable Energy Technology OECD Organisation for Economic Co-operation and Development PAYG Pay – as- you - go PIGGARE Pacific Islands Greenhouse Gas Abatement through
Renewable Energy PCU Power Conditioning Unit PEC Pacific Environment Committee PELs Pacific Regional Efficient Lighting Strategy PICs Pacific Island Countries
viii
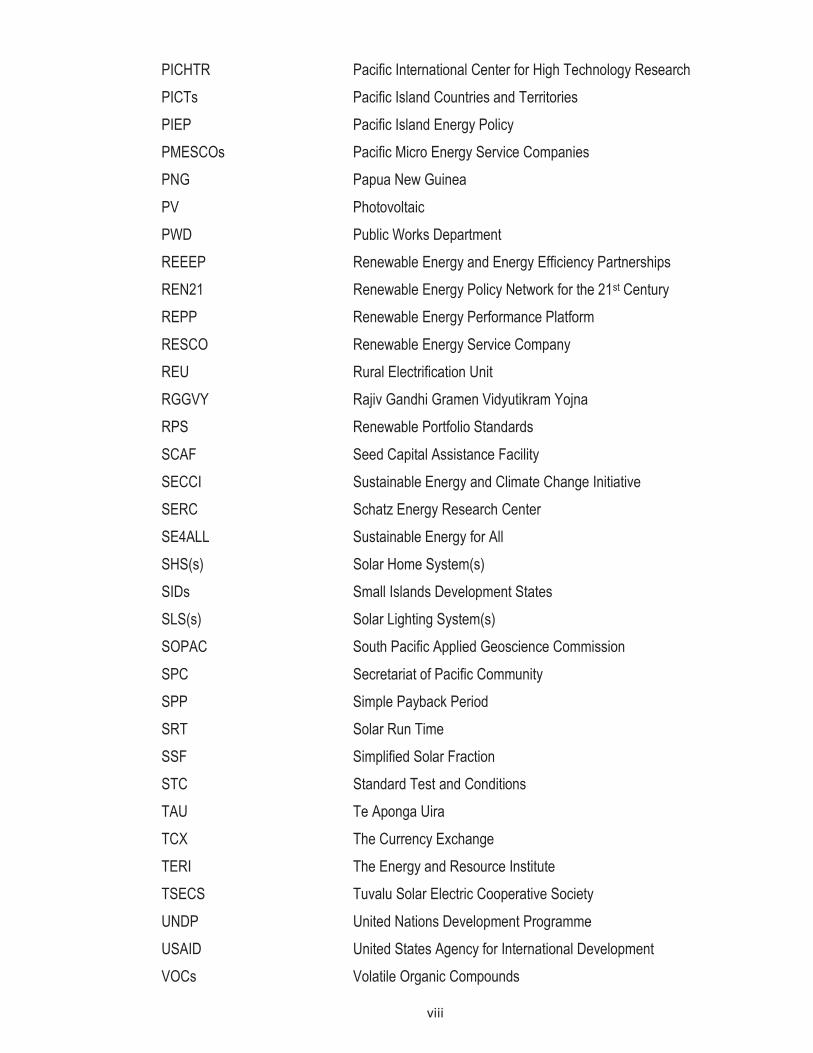
PICHTR Pacific International Center for High Technology Research PICTs Pacific Island Countries and Territories PIEP Pacific Island Energy Policy PMESCOs Pacific Micro Energy Service Companies PNG Papua New Guinea PV Photovoltaic PWD Public Works Department REEEP Renewable Energy and Energy Efficiency Partnerships REN21 Renewable Energy Policy Network for the 21st Century REPP Renewable Energy Performance Platform RESCO Renewable Energy Service Company REU Rural Electrification Unit RGGVY Rajiv Gandhi Gramen Vidyutikram Yojna RPS Renewable Portfolio Standards SCAF Seed Capital Assistance Facility SECCI Sustainable Energy and Climate Change Initiative SERC Schatz Energy Research Center SE4ALL Sustainable Energy for All SHS(s) Solar Home System(s) SIDs Small Islands Development States SLS(s) Solar Lighting System(s) SOPAC South Pacific Applied Geoscience Commission SPC Secretariat of Pacific Community SPP Simple Payback Period SRT Solar Run Time SSF Simplified Solar Fraction STC Standard Test and Conditions TAU Te Aponga Uira TCX The Currency Exchange TERI The Energy and Resource Institute TSECS Tuvalu Solar Electric Cooperative Society UNDP United Nations Development Programme USAID United States Agency for International Development VOCs Volatile Organic Compounds

ix
List of Units Amps Amperes Ah Ampere Hour cd Candela $FJD or $ Fijian Dollar GW Gigawatt h Hours K Kelvin km Kilometer km2 Kilometer Square kW Kilowatt kWp Kilowatts Peak L Litres lm Lumen lx Lux Lm/W Lumens per Watts m Meter m2 Square Meter min Minutes Mt Million Tonnes MW Mega Watt ton Tonnes TW Tera Watt TWh Tera Watt Hour V Voltage W Watts Wp Peak Watts W/m2 Watts per Square Meter ° Degrees °C Degree Celsius % Percent $USD United States Dollar
x
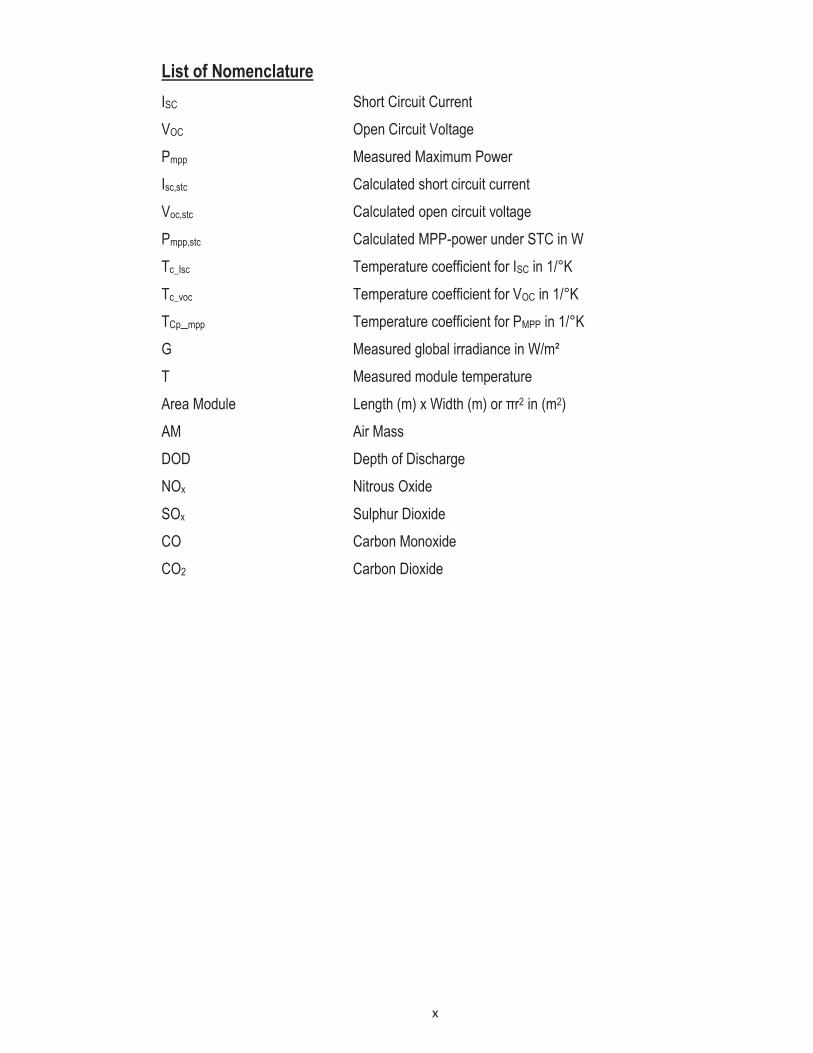
List of Nomenclature ISC Short Circuit Current VOC Open Circuit Voltage Pmpp Measured Maximum Power Isc,stc Calculated short circuit current Voc,stc Calculated open circuit voltage Pmpp,stc Calculated MPP-power under STC in W Tc_Isc Temperature coefficient for ISC in 1/°K Tc_voc Temperature coefficient for VOC in 1/°K TCp_mpp Temperature coefficient for PMPP in 1/°K G Measured global irradiance in W/m² T Measured module temperature Area Module Length (m) x Width (m) or πr2 in (m2) AM Air Mass DOD Depth of Discharge NOx Nitrous Oxide SOx Sulphur Dioxide CO Carbon Monoxide CO2 Carbon Dioxide
xi
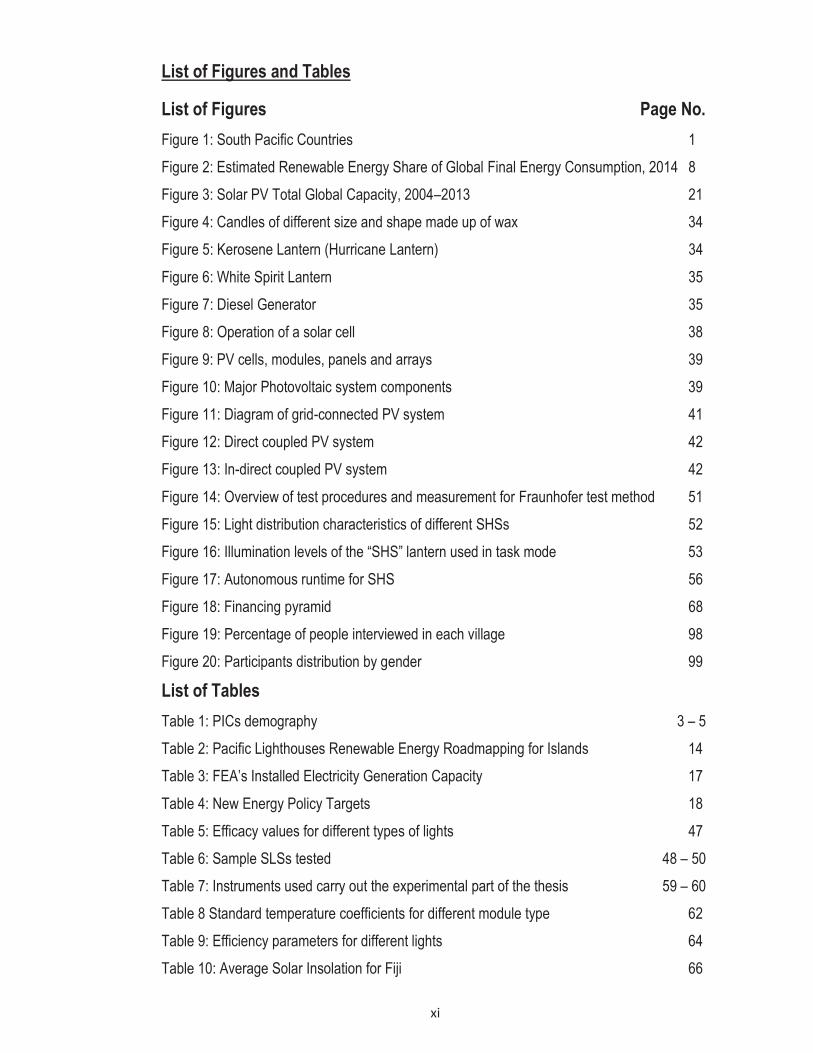
List of Figures and Tables
List of Figures Page No. Figure 1: South Pacific Countries 1 Figure 2: Estimated Renewable Energy Share of Global Final Energy Consumption, 2014 8 Figure 3: Solar PV Total Global Capacity, 2004–2013 21 Figure 4: Candles of different size and shape made up of wax 34 Figure 5: Kerosene Lantern (Hurricane Lantern) 34 Figure 6: White Spirit Lantern 35 Figure 7: Diesel Generator 35 Figure 8: Operation of a solar cell 38 Figure 9: PV cells, modules, panels and arrays 39 Figure 10: Major Photovoltaic system components 39 Figure 11: Diagram of grid-connected PV system 41 Figure 12: Direct coupled PV system 42 Figure 13: In-direct coupled PV system 42 Figure 14: Overview of test procedures and measurement for Fraunhofer test method 51 Figure 15: Light distribution characteristics of different SHSs 52 Figure 16: Illumination levels of the “SHS” lantern used in task mode 53 Figure 17: Autonomous runtime for SHS 56 Figure 18: Financing pyramid 68 Figure 19: Percentage of people interviewed in each village 98 Figure 20: Participants distribution by gender 99
List of Tables Table 1: PICs demography 3 – 5 Table 2: Pacific Lighthouses Renewable Energy Roadmapping for Islands 14 Table 3: FEA’s Installed Electricity Generation Capacity 17 Table 4: New Energy Policy Targets 18 Table 5: Efficacy values for different types of lights 47 Table 6: Sample SLSs tested 48 – 50 Table 7: Instruments used carry out the experimental part of the thesis 59 – 60 Table 8 Standard temperature coefficients for different module type 62 Table 9: Efficiency parameters for different lights 64 Table 10: Average Solar Insolation for Fiji 66

xii
Table 11: System components life time 68 Table 12: IV Characteristics of different SLSs 72 – 76 Table 13: Runtime for different SLSs 77 – 80 Table 14: Light distribution characteristic over range of 360 degrees for different SLS 82 – 86 Table 15: Light distribution characteristic over a surface for different SLSs 87 – 94 Table 16: Efficacy values of the SLSs 95 - 96 Table 17: Cost($) per lumen value for the SLSs 96 Table 18: Kilowatt hour (KWh) per Cost($) value for the SLSs 97 Table 19: Cost9$) of utilising various combinations of the systems 102 – 103 Table 20: Savings from utilising various combinations of the systems 104 – 105

1
Chapter 1 – Introduction 1.1. Background – Pacific Island Countries (PICs) The Pacific sub-region consists of 22 countries and territories. These countries are grouped into three major cultural groups: Melanesia, Micronesia and Polynesia (Mohanty, 2012). Fiji, Solomon Islands New Caledonia, Papua New Guinea, and Vanuatu are categorised as Melanesian countries. Guam, Nauru, Northern Mariana Islands, Kiribati, Marshall Islands, Federated States of Micronesia, and Palau are part of Micronesian countries and American Samoa, Cook Islands, French Polynesia, Niue, Samoa, Tokelau, Tonga, Tuvalu and Wallis and Futuna Islands are part of the Polynesian countries. The figure below shows the geographic location of the Pacific Island Countries (PICs):
Figure 1: South Pacific Countries1
Some characteristics of PICs are their dispersed nature over millions of square kilometers, distance from international markets, vulnerability to natural disasters and an abundant supply of natural resources. The impacts of climate change are also exacerbated in the Pacific region. The effects of climate change on PICs are reflected in terms of low levels of sea harvest, coastal degradation, coral bleaching, temperature changes, heat waves, the
1 http://www.mappery.com/south-pacific-countries-map

2
increasing frequency of natural disasters and also coastal settlement relocations and sea water rising in coastal homes, to name a few. Even the harvest from the land as agricultural produce can be observed to have a degrading effect. The siltation of land, loss of fertility in soils, soil erosion can all be attributed to climate change. Since the economy of the PICs, except PNG, is dependent mostly on agriculture, fishery and tourism, economic growth in these small nations has been quite low due to the characteristics mentioned.
1.2. Pacific Island Countries (PICs) Energy Situation Social and economic developments in the Pacific Islands are occurring at a very generous rate. As a result, the need to meet these developments gives rise to a larger demand for energy and other related resources. These energy needs are used to deliver and gain access to basic human needs such as cooking, heating, lighting, communications and to further modern services (IPCC, 2012).
As economic growth is quite low in small island developing countries in the Pacific, a major challenge that exists is the need to mitigate the increasing energy demands while maintaining the level of the nation’s economic growth. These nations rely on the imports of enormous amounts of fossil fuel for their power generation and transportation requirements. The heavy reliance on expensive fossil fuels places a burden on the economy of these island nations. The PICs did not perform well with renewable energy projects and were far away from achieving the previously set Millennium Development Goals (MDGs) on ensuring environmental sustainability. The struggle in meeting the MDG targets was not only for PICs but for the whole world. The MDGs has now been expanded as Sustainable Development Goals (SDGs) to further strengthen the achievements or objectives with 17 goals and 169 targets (Hak et al., 2015). The sustainable practices and energy sustainability is related to “SDG 7” which is to ensure access to affordable, reliable, sustainable and modern energy for all. They further provide the target to ensure universal access to affordable, reliable and modern energy services; substantially increase the share of renewable energy in the global energy mix; double the global rate of improvement in energy efficiency; enhance international cooperation to facilitate access to clean energy research and technology, including renewable energy, energy efficiency and advanced and cleaner fossil-fuel technology; promote investment in energy infrastructure and clean energy technology; expand infrastructure and upgrade technology for supplying modern and sustainable energy services for all in developing countries, in particular least developed countries, small island developing states,
3
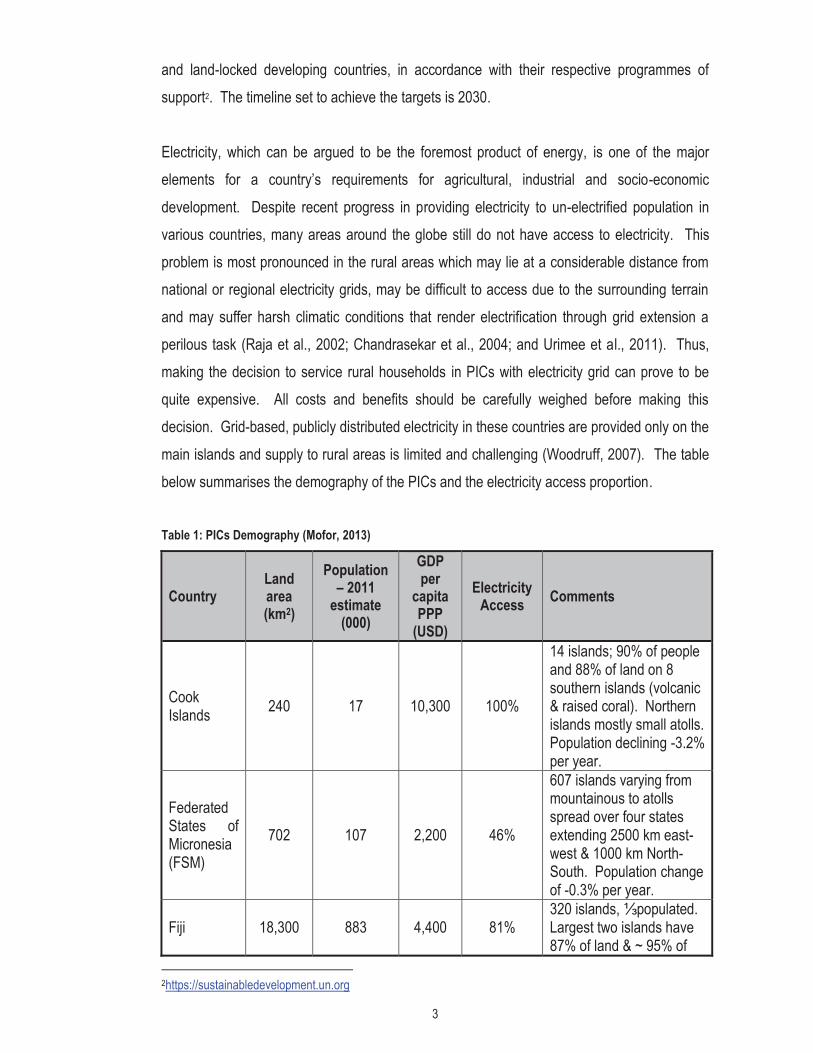
and land-locked developing countries, in accordance with their respective programmes of support2. The timeline set to achieve the targets is 2030. Electricity, which can be argued to be the foremost product of energy, is one of the major elements for a country’s requirements for agricultural, industrial and socio-economic development. Despite recent progress in providing electricity to un-electrified population in various countries, many areas around the globe still do not have access to electricity. This problem is most pronounced in the rural areas which may lie at a considerable distance from national or regional electricity grids, may be difficult to access due to the surrounding terrain and may suffer harsh climatic conditions that render electrification through grid extension a perilous task (Raja et al., 2002; Chandrasekar et al., 2004; and Urimee et al., 2011). Thus, making the decision to service rural households in PICs with electricity grid can prove to be quite expensive. All costs and benefits should be carefully weighed before making this decision. Grid-based, publicly distributed electricity in these countries are provided only on the main islands and supply to rural areas is limited and challenging (Woodruff, 2007). The table below summarises the demography of the PICs and the electricity access proportion. Table 1: PICs Demography (Mofor, 2013)
Country Land area (km2)
Population – 2011
estimate (000)
GDP per
capita PPP
(USD)
Electricity Access Comments
Cook Islands 240 17 10,300 100%
14 islands; 90% of people and 88% of land on 8 southern islands (volcanic & raised coral). Northern islands mostly small atolls. Population declining -3.2% per year.
Federated States of Micronesia (FSM)
702 107 2,200 46%
607 islands varying from mountainous to atolls spread over four states extending 2500 km east-west & 1000 km North-South. Population change of -0.3% per year.
Fiji 18,300 883 4,400 81% 320 islands, ⅓populated. Largest two islands have 87% of land & ~ 95% of
2https://sustainabledevelopment.un.org
4
population. Population growth 0.8% per year.
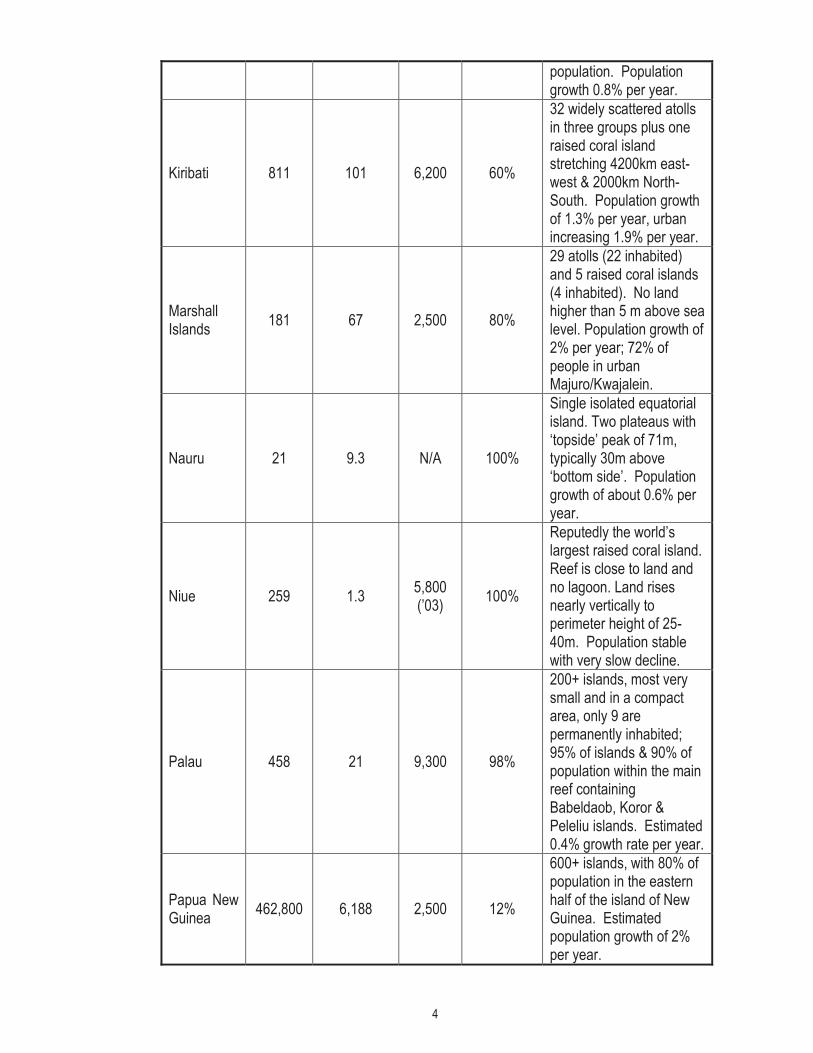
Kiribati 811 101 6,200 60%
32 widely scattered atolls in three groups plus one raised coral island stretching 4200km east-west & 2000km North-South. Population growth of 1.3% per year, urban increasing 1.9% per year.
Marshall Islands 181 67 2,500 80%
29 atolls (22 inhabited) and 5 raised coral islands (4 inhabited). No land higher than 5 m above sea level. Population growth of 2% per year; 72% of people in urban Majuro/Kwajalein.
Nauru 21 9.3 N/A 100%
Single isolated equatorial island. Two plateaus with ‘topside’ peak of 71m, typically 30m above ‘bottom side’. Population growth of about 0.6% per year.
Niue 259 1.3 5,800 (’03) 100%
Reputedly the world’s largest raised coral island. Reef is close to land and no lagoon. Land rises nearly vertically to perimeter height of 25-40m. Population stable with very slow decline.
Palau 458 21 9,300 98%
200+ islands, most very small and in a compact area, only 9 are permanently inhabited; 95% of islands & 90% of population within the main reef containing Babeldaob, Koror & Peleliu islands. Estimated 0.4% growth rate per year.
Papua New Guinea 462,800 6,188 2,500 12%
600+ islands, with 80% of population in the eastern half of the island of New Guinea. Estimated population growth of 2% per year.

5
Samoa 2,934 193 5,500 98%
Volcanic islands of Savai’i (58% of land & 24% of population) and Upolu (38% & 76% respectively) plus 8 small islands. Population growth of 0.6% per year.
Solomon Islands 28,450 572 2,900 ~10%
Nearly 1000 islands of which 350 are inhabited. 6 main islands account for 80% of land area and bulk of population. Population growth of 2.2%, urban growth 4.2% per year.
Tokelau 12 1.4 N/A 100%
Three atolls: Atafu, Fakaofo and Nukunonu. Highest land about 5 m above sea level. Population changing very little. No urban population.
Tonga 748 106 6,100 ~90%
176 islands in 4 groups (Tongatapu, Ha’apai, Vava’u & Niua) with 36 inhabited islands. Population growth estimated at 0.25% per year.
Tuvalu 26 10.5 3,400 94%
6 atolls with large lagoons enclosed by a reef plus 3 raised coral islands without large lagoons. Funafuti with 22% of land has about 50% of population. Estimated annual growth rate 0.7%.
Vanuatu 12,200 225 5,100 28%
Over 80 islands, mostly volcanic, 65 populated. 80% of the population is on 7 islands. Population grew by 2.6% per year from 1986-1996 but current rate is 1.3%.
The main source of electricity generation for most of these PICs is diesel generators. Thus, almost all PICs are heavily dependent on imported fossil fuels and natural gas for energy. These are finite resources that will someday diminish, and either become too costly or too much of an environmental hazard to retrieve. The heavy reliance on diesel for electricity

6
generation and transport also makes PICs extremely vulnerable to unpredictable global fuel price changes. Moreover, diesel is non-renewable and the resulting carbon emissions contribute to climate change. Fossil fuel distribution also presents a potential pollution hazard as it is transported through the Pacific’s delicate marine environment. Nations with big economies spend a large amount on subsidies to fossil fuel companies. The International Energy Agency (IEA) estimates that USD$523 billion in subsidies went to fossil fuel companies across the world in 2011. According to a report released by the Overseas Development Institute (ODI), a global development think tank, G-20 countries, including the U.S., China and Japan, spend an average of USD$112 per adult on fossil fuel subsidies3. However, since the burning of fossil fuels is a contributory factor towards climate change, the future use of fuel is challenged by the Kyoto Protocol greenhouse gas (GHG) reduction targets (Akella, 2009). Likewise, the 2015 United Nations Climate Change Conference of the Parties held in Paris formally endorsed a legally binding universal agreement on climate. The expected outcome of the agreement is to limit global warming to below 2 degrees celsius by 2100. This target was based on the submissions received from the Intended Nationally Determined Contributions (INDCs).
Pacific governments also spend huge amounts on importing petroleum products. According to an article published in the Fiji Times on 20 September 2012, as a percentage of total merchandise imports, the bill for fuel in 2010 ranged from around 16 percent of imports in New Caledonia, 18 percent in Samoa and Vanuatu and 23 percent in Tonga. Interestingly, Fiji had the largest fuel import costs in the region (this is also due to re-export to other PICs). In 2010, Fiji spent 32 percent of the value of all its merchandise imports on bringing in petroleum products. According to a Secretariat of Pacific Community (SPC) statement, the increase in the cost of imported petroleum products between November 2010 and November 2011 reflected both an increase in litres imported as well as rising prices, demonstrating the dominant role petroleum plays in the country's imported commodities4. There is an urgent need for cheaper, cleaner, more accessible and sustainable sources of energy across the world. Renewable energy technologies provide a cost-effective source of
3 http://ecowatch.com/2013/11/07/worlds-richest-countries-spent-500-billion-fossil-fuel-subsidies/ 4 http://www.fijitimes.com/
7
electricity in rural areas where distances are large, populations are small, and demand for energy is low (Woodruff, 2007).
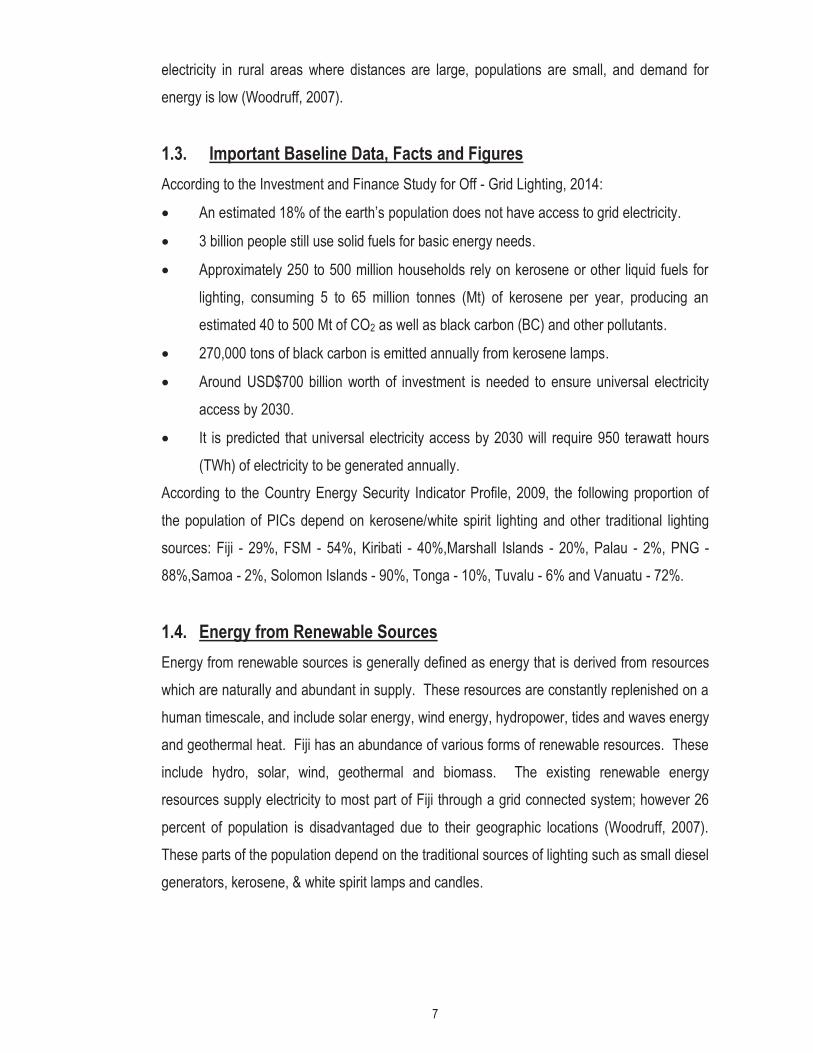
1.3. Important Baseline Data, Facts and Figures According to the Investment and Finance Study for Off - Grid Lighting, 2014:
� An estimated 18% of the earth’s population does not have access to grid electricity.
� 3 billion people still use solid fuels for basic energy needs.
� Approximately 250 to 500 million households rely on kerosene or other liquid fuels for lighting, consuming 5 to 65 million tonnes (Mt) of kerosene per year, producing an estimated 40 to 500 Mt of CO2 as well as black carbon (BC) and other pollutants.
� 270,000 tons of black carbon is emitted annually from kerosene lamps.
� Around USD$700 billion worth of investment is needed to ensure universal electricity access by 2030.
� It is predicted that universal electricity access by 2030 will require 950 terawatt hours (TWh) of electricity to be generated annually.
According to the Country Energy Security Indicator Profile, 2009, the following proportion of the population of PICs depend on kerosene/white spirit lighting and other traditional lighting sources: Fiji - 29%, FSM - 54%, Kiribati - 40%,Marshall Islands - 20%, Palau - 2%, PNG - 88%,Samoa - 2%, Solomon Islands - 90%, Tonga - 10%, Tuvalu - 6% and Vanuatu - 72%.
1.4. Energy from Renewable Sources Energy from renewable sources is generally defined as energy that is derived from resources which are naturally and abundant in supply. These resources are constantly replenished on a human timescale, and include solar energy, wind energy, hydropower, tides and waves energy and geothermal heat. Fiji has an abundance of various forms of renewable resources. These include hydro, solar, wind, geothermal and biomass. The existing renewable energy resources supply electricity to most part of Fiji through a grid connected system; however 26 percent of population is disadvantaged due to their geographic locations (Woodruff, 2007). These parts of the population depend on the traditional sources of lighting such as small diesel generators, kerosene, & white spirit lamps and candles.
8
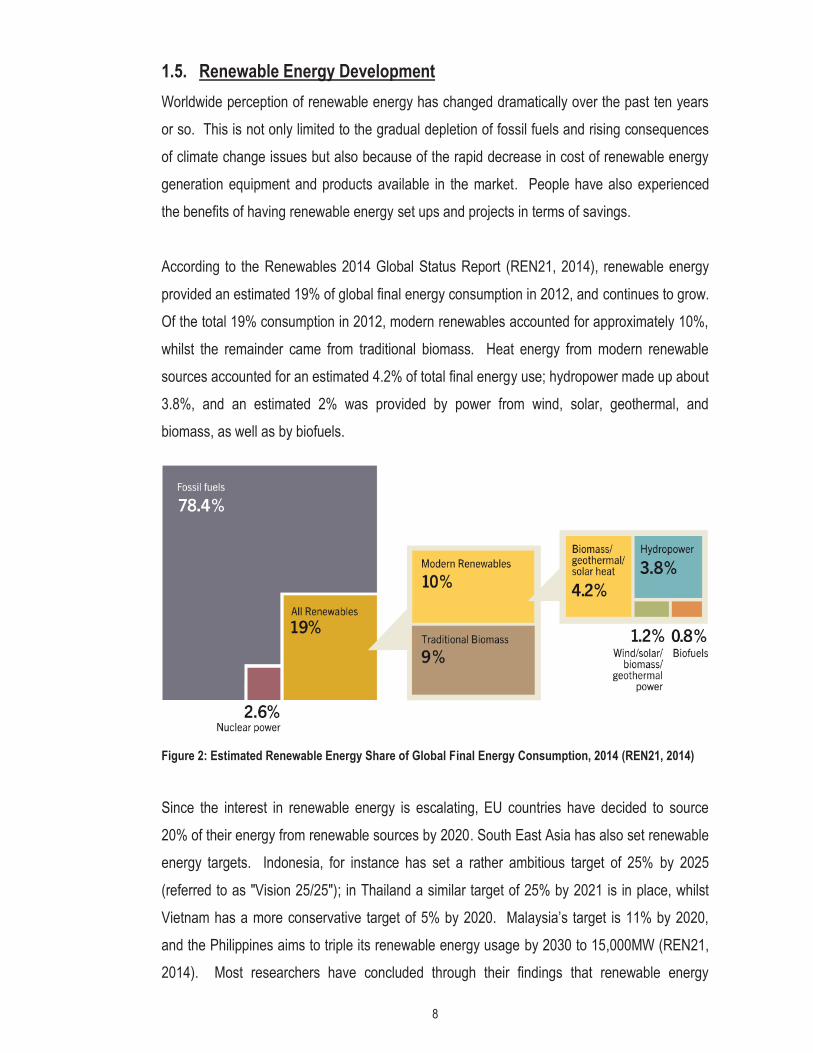
1.5. Renewable Energy Development Worldwide perception of renewable energy has changed dramatically over the past ten years or so. This is not only limited to the gradual depletion of fossil fuels and rising consequences of climate change issues but also because of the rapid decrease in cost of renewable energy generation equipment and products available in the market. People have also experienced the benefits of having renewable energy set ups and projects in terms of savings. According to the Renewables 2014 Global Status Report (REN21, 2014), renewable energy provided an estimated 19% of global final energy consumption in 2012, and continues to grow. Of the total 19% consumption in 2012, modern renewables accounted for approximately 10%, whilst the remainder came from traditional biomass. Heat energy from modern renewable sources accounted for an estimated 4.2% of total final energy use; hydropower made up about 3.8%, and an estimated 2% was provided by power from wind, solar, geothermal, and biomass, as well as by biofuels.
Figure 2: Estimated Renewable Energy Share of Global Final Energy Consumption, 2014 (REN21, 2014)
Since the interest in renewable energy is escalating, EU countries have decided to source 20% of their energy from renewable sources by 2020. South East Asia has also set renewable energy targets. Indonesia, for instance has set a rather ambitious target of 25% by 2025 (referred to as "Vision 25/25"); in Thailand a similar target of 25% by 2021 is in place, whilst Vietnam has a more conservative target of 5% by 2020. Malaysia’s target is 11% by 2020, and the Philippines aims to triple its renewable energy usage by 2030 to 15,000MW (REN21, 2014). Most researchers have concluded through their findings that renewable energy

9
implementation will not fully succeed without the presence of robust renewable energy policies/legislations, programs and realistic policy targets. A good practice for any country is to adopt a mix of policies that will best suit their domestic situation. As featured in the Renewable Energy Global Status Report, a mix of regulatory policies, fiscal incentives, and public financing mechanisms - including feed-in policies, renewable portfolio standards (RPS), net metering, tax reductions or exemptions, grants, low-interest loans, and public competitive bidding/tendering - continued to be adopted around the globe to promote increased renewable power capacity or generation (REN21, 2014). In terms of policy targets, setting unrealistic targets may lead to wastage of resources and poor management of projects. For example, Fiji had initially set a goal to provide 100% of final energy from renewables, which was not practical to achieve. The target has now been reduced to 23% by 2030 (REN21, 2014).
1.5.1. Global Renewable Energy Developments Germany hosted the world’s first government international conference on renewable energy in 2004. As a result, the REN21 was born! REN21 stands for Renewable Energy Policy Network for The 21st
Century. It is the first international organisation to track renewable energy developments. Its goal is to facilitate knowledge exchange, policy development and joint action towards a rapid global transition to renewable energy. According to the Renewable Energy Global Status Report released by REN21 in 2014, by the end of 2013, China, the United States, Brazil, Canada, and Germany remained the top countries for total installed renewable power capacity; the top countries for non-hydro capacity were again China, the United States, and Germany, followed by Spain, Italy, and India. Denmark had a clear lead for total capacity per capita. Meanwhile, Uruguay, Mauritius, and Costa Rica were among the top countries for investment in new renewable power and fuels relative to annual GDP. Furthermore, in 2013, China’s new renewable power capacity surpassed new fossil and nuclear capacity for the first time and all renewables accounted for more than 20% of China’s electricity generation. For European Union, renewable power installations represented 72% of new electric capacity. In the United States, the share of renewable generation rose to nearly 12.9%. Spain became the first country to generate 20.9% of the total electricity from wind

10
power than from any other source for the entire year. India added more than 4GW of renewable capacity for a total of about 70.5GW. Brazil had 3.5MW of commissioned wind power capacity, and more than 10GW of additional capacity was under contract. By early 2013, at least 18 countries generated more than 10% of their electricity with non-hydro renewable resources. Major European green power markets include Germany, Austria, Belgium, Finland, Hungary, the Netherlands, Sweden, Switzerland, and the United Kingdom. Green power markets also exist in Australia, Canada, Japan, South Africa, and the United States. 1.5.2. Major Initiatives in Renewable Energy: A. The Renewable Energy and Energy Efficiency Partnership (REEEP) aims to enhance
and promote renewable energy and energy efficiency partnerships by funding small-to-medium scale projects, providing internet-based information resources for clean energy funded jointly by connecting and supporting clean energy via several strategic sub-networks of stakeholders. .
B. The “Sustainable Energy for All”, also known as the SE4ALL initiative, was launched to motivate societies to recognise sustainable energy for all by 2030. It is aimed at providing universal access to modern energy services, doubling the global rate of improvement in energy efficiency and doubling the share of renewable energy in the global energy mix (Tedsen, 2014). This initiative was joined by more than 80 developing countries by early 2014. The 2014 Finance Committee SE4ALL Report (Finance Committee SE4ALL, 2014), predicts that for the period covering 2010 to 2030, around USD$45 billion is required annually to provide access to energy, USD$320billion for moving the renewable energy activities, and USD$390 billion for maintaining energy efficiency around the globe. Investments in renewable energy by developing countries also supports in providing access to energy. However, there are some overriding challenges in meeting this investment such as the need for a regulatory framework and the capacity to prepare and implement transparent pricing structures and clear power purchase agreements. To overcome this issue there is a need for national/local finance infrastructures like local investment pools, commercial banks, state-owned utilities and collaboration to speed-up de-risking opportunities. The authorities have identified Green bonds market development; structures that use Development Finance Institutions’ (DFIs) de-risking

11
instruments to mobilize private capital; insurance products that focus on removing specific risks and aggregation structures that focus on bundling and pooling approaches for small-scale opportunities, as having the potential to boost finance for sustainable energy. The Mexico Energy Efficiency Project and Jamaica Energy Security and Efficiency Enhancement Project are examples of Green bond projects. The former project supports replacement of 22.9 million incandescent light bulbs with compact fluorescent lights and 1.7 million inefficient refrigerators and air conditioners, while latter supports investment promotion measures for greater participation of renewable energy and gas-based generation in Jamaica's energy mix, and development of standards and labeling for energy efficient appliances and air conditioning (Finance Committee SE4ALL, 2014). The report further mentions various advisory programs that are deployed to improve the quality of project preparation such as the Asian Development Bank’s (ADB’s) Clean Energy Financing Partnership Facility (CEFPF), which was established to help improve energy security in ADB’s developing member countries and decrease the rate of climate change. Moreover, the report mentions that CEFPF resources are intended to finance policy, regulatory, and institutional reforms that encourage sustainable energy development. Another programme named Inter-American Development Bank’s Sustainable Energy and Climate Change Initiative (SECCI) assess the potential for renewable energy and energy efficiency to meet energy needs identified during country programming and strategy development, by carrying out analyses of renewable energy and energy efficiency, mapping exercises, and advisory support for governments (Finance Committee SE4ALL, 2014). The Renewable Energy Performance Platform (REPP), another network according to the report, was registered to help improve access to risk mitigation instruments and long-term lending and results-based finance. REPP reduces transaction costs by standardising due diligence, reporting, negotiating of contracts, and access to shared facilities such as The Currency Exchange (TCX) for foreign exchange hedging. The Seed Capital Assistance Facility (SCAF) was developed to encourage fund managers

12
and project developers to target early stage investments in sustainable energy and enterprise developments in Asia and Africa. Various funding facilities have also been established to support the investment plan for the SE4ALL project. For example, the Azuri Debt Fund for Pre-Paid Energy Access is targeting a USD$50 million fund for investors, which will be collaterised against the assets and forward revenue streams from customers. This facility can potentially grow to USD$1 billion in the next 5 years. The Global Energy Efficiency and Renewable Energy Fund (GEEREF) is an emerging markets equity fund of funds, launched by the European Commission (EC) (Finance Committee SE4ALL, 2014).
C. Asia Solar Energy Initiative (ASEI) aims to develop a regional knowledge platform dedicated to solar energy in Asia and the Pacific; assist in the identification and development of 3,000MW of solar generation and associated smart grid projects; and provide financing solutions for projects to mitigate risks and encourage solar energy development (Asia Solar Energy Initiative – A Primer, 2011). The ASEI is supported by the Asia Solar Energy Forum (ASEF) which is a regional knowledge management platform facilitating the transfer of solar energy to Asia and the Pacific, and The Asia Accelerated Solar Energy Development Fund (AASEDF) which supports solar projects by providing power generation incentives which protects consumers from having to bear high technology costs (Asia Solar Energy Initiative – A Primer, 2011).
D. Global Off-Grid Lighting Initiative (GOGLA) is a public-private initiative established to help provide a sustainable exit strategy for Lighting Africa in the future (Investment and Finance Study for Off - Grid Lighting, 2014).
E. Global Lighting and Energy Access Partnership (Global LEAP), was created to continue the work of the Clean Energy Ministerial’s Solar and LED Energy Access Initiative. Major projects include development of a quality assurance standard for solar LED lanterns within the framework of the International Electrotechnical Commission (IEC) and launching product award competitions for off grid appliances (Tedsen, 2013).
F. An influential program is the Energy and Resources Institute’s (TERI) Lighting a Billion Lives (LaBL) in India, which provides solar lanterns to poor rural households and has coordinated the supply of around 75,000 solar lights to villages in India and Africa. Other initiatives such as Solar Aid involve public private partnerships between businesses and NGOs or for-profit social enterprises that aim to increase access to modern lighting technology (Tedsen, 2013).

13
1.5.3. Pacific Islands Renewable Energy Developments Renewable energy projects in the Pacific, have had mixed success rates in the past highlighting the need to use appropriate technology and develop necessary local knowledge and support to operate and maintain systems when they are in place5. The North Pacific ACP Renewable Energy and Energy Efficiency Project (North-REP) was a European Union (EU) funded project set up in 2010 and targeted the reduction of poverty through the promotion of social development by increasing access to basic electricity as well as improving environmental responsibility through reduced dependence on fossil fuels and thus reducing CO2 emissions. Another objective of the project was addressing governance issues through enhanced institutional capacity for planning and implementation of transparent and accountable energy efficiency management and introduction of mature renewable energy technologies6. Developing new generation projects is only one part of any smart energy strategy – energy efficiency is also essential. Developing a sector as complex and vital as energy requires a comprehensive, planned approach that maps out all factors. The Tonga Energy Roadmap which is a 10-year plan for the Government of Tonga’s energy sector is aimed at minimising the import of fuel for electricity generation. A constituent of Roadmap is the Village Network Upgrade project, which targets the provision on reliable, safe and efficient electricity distribution to households. The Cook Islands (which is fully dependent on diesel for electricity generation) has set ambitious renewable electricity targets of 50 percent by 2015, and 100 percent by 2020. The target could be achieved by targeting the development of solar and wind. Rarotonga, in collaboration with the electricity provider, Te Aponga Uira (TAU,) is developing a grid connected PV installation. Meanwhile, the Government of Tuvalu is also supporting a Renewable Energy and Energy Efficiency Unit project within the Tuvalu Electricity Corporation, focusing on capacity building which will assist in the development of energy sector plans and the ability to investigate the feasibility of renewable energy generation options. Likewise, other PICs are also setting targets which are ambitious, yet will have
5 https://www.mfat.govt.nz/media-and-publications/development-stories/july-august-2011/renewable-energy pacific 6 http://www.spc.int/northrep/images/uploads//northrep_project_web.pdf
14
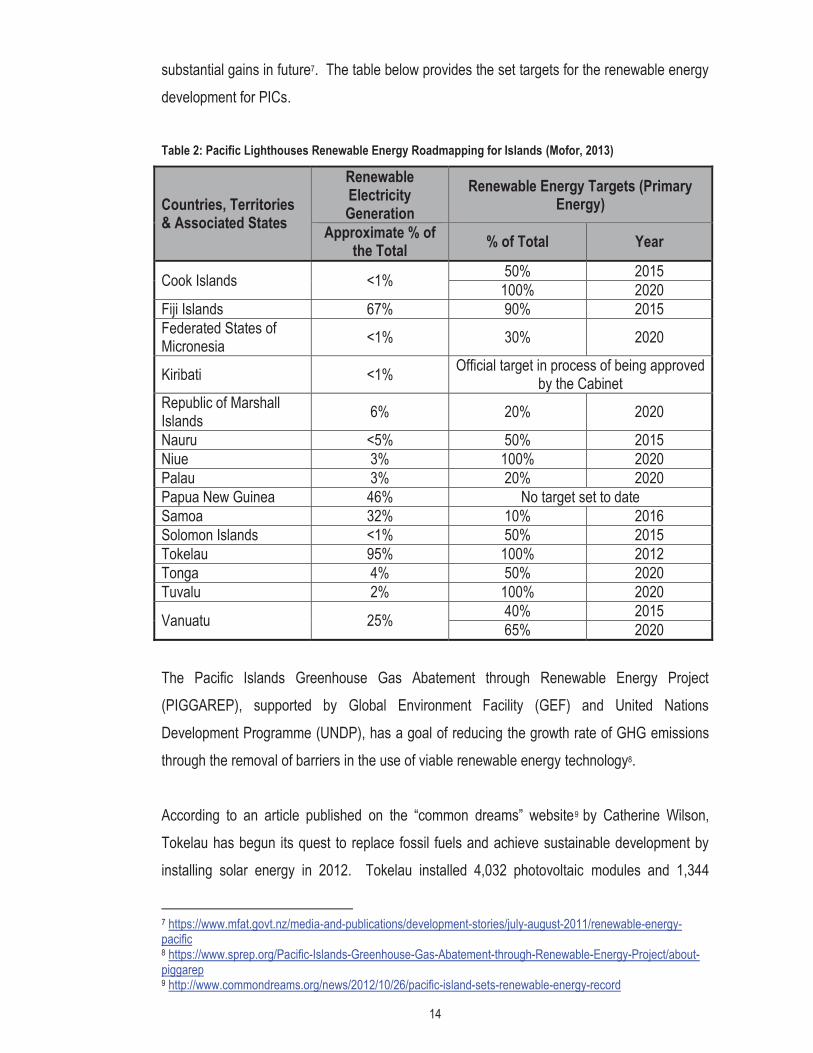
substantial gains in future7. The table below provides the set targets for the renewable energy development for PICs. Table 2: Pacific Lighthouses Renewable Energy Roadmapping for Islands (Mofor, 2013)
Countries, Territories & Associated States
Renewable Electricity Generation
Renewable Energy Targets (Primary Energy)
Approximate % of the Total % of Total Year
Cook Islands <1% 50% 2015 100% 2020
Fiji Islands 67% 90% 2015 Federated States of Micronesia <1% 30% 2020
Kiribati <1% Official target in process of being approved by the Cabinet
Republic of Marshall Islands 6% 20% 2020
Nauru <5% 50% 2015 Niue 3% 100% 2020 Palau 3% 20% 2020 Papua New Guinea 46% No target set to date Samoa 32% 10% 2016 Solomon Islands <1% 50% 2015 Tokelau 95% 100% 2012 Tonga 4% 50% 2020 Tuvalu 2% 100% 2020
Vanuatu 25% 40% 2015 65% 2020
The Pacific Islands Greenhouse Gas Abatement through Renewable Energy Project (PIGGAREP), supported by Global Environment Facility (GEF) and United Nations Development Programme (UNDP), has a goal of reducing the growth rate of GHG emissions through the removal of barriers in the use of viable renewable energy technology8. According to an article published on the “common dreams” website9 by Catherine Wilson, Tokelau has begun its quest to replace fossil fuels and achieve sustainable development by installing solar energy in 2012. Tokelau installed 4,032 photovoltaic modules and 1,344
7 https://www.mfat.govt.nz/media-and-publications/development-stories/july-august-2011/renewable-energy-pacific 8 https://www.sprep.org/Pacific-Islands-Greenhouse-Gas-Abatement-through-Renewable-Energy-Project/about-piggarep 9 http://www.commondreams.org/news/2012/10/26/pacific-island-sets-renewable-energy-record

15
batteries, with the assessed capability of providing 150% of electricity demand, on its three atolls in 2012. The article also calculated that petroleum comprises 32 percent of Fiji’s total imports and 23 percent of Tonga’s, while Samoa, Fiji, Vanuatu and the Solomon Islands were rated among the most oil price vulnerable countries in the world. Transport to outer island settlements could add a further 20 to 40 percent to the price of fuel. As a result, Ministers representing small island developing states (SIDS) in a conference on sustainable energy organised in Barbados in May 2012, agreed to the Barbados Declaration, which included ambitious renewable energy targets by several Pacific island states. Consequently, Fiji planned to convert to 100 percent renewable energy by 2013, while the Cook Islands, Niue and Tuvalu targeted 100 percent electricity generation from renewable sources by 2020. The Solomon Islands and Federated States of Micronesia, on the other hand, announced targets of 50 percent renewable electricity generation by 2015 and 2020, respectively. Cook Islands expressed confidence in reaching 80 percent (renewable energy) by 201810. Examples of other initiatives by organisations include the University of the South Pacific being a partner in Project DIREKT, the Small Developing Island Renewable Energy Knowledge and Technology Transfer Network, a collaboration between universities in Germany, Fiji, Mauritius, Barbados, Trinidad and Tobago towards raising the level of scientific expertise in African, Caribbean and Pacific small island developing nations. The USD$66 million Pacific Environment Community (PEC) Fund, financed by the Japanese government and administered by the Pacific Islands Forum, has enabled island nations to access money to develop solar energy projects and expand rural electrification. The PEC-funded projects have provided power to the lives of thousands of people11. In another recent development, the Pacific Island Countries and Territories (PICTs) have reviewed the Pacific Islands Energy Policy (PIEP 2004) and developed a Framework which provides guidance on how to enhance the achievement of energy security and provides classification on how regional services can support countries in the development and achievement of their national plans. The framework is based on 11 guiding principles (Towards Energy Secure Pacific, 2011):
10 http://www.globalissues.org/news/2012/10/26/15141 11 http://www.globalissues.org/news/2012/10/26/15141

16
1. The importance of leadership, transparency, decision-making and governance 2. National-led solutions supported by regional initiatives 3. A coordinated whole-of- sector approach 4. The need for sustainable livelihoods, and recognition of culture, equity and gender
issues 5. The link between sources of energy (primary and secondary) and its uses, and the
importance of treating energy as an integrated sector 6. Cost effective, technically proven and appropriate technological solutions 7. ‘Environment friendly’ energy solutions 8. Evidence-based planning – the importance of energy statistics 9. Appropriate investment in human capital 10. Many partners, one team 11. Financing, monitoring and evaluation The principles take into consideration gender and cultural issues, capacity development, climate change, as well as the need for improved planning, sustainable livelihoods and energy efficiency. 1.5.4. Fiji Islands Renewable Energy Developments Fiji has an abundant supply of hydro, wind, solar, geothermal and biomass energy resources. If these resources are developed, it would lower the vulnerability of the overall economy and enhance the ability of the isolated communities to access energy. The Rural Electrification Unit (REU) of the Department of Energy’s (DOE) has the responsibility of providing electricity to rural area, through the FEA and also through renewable energy projects such as biofuel, solar, wind, biogas and micro-hydro. The Fijian Government also places lot of importance on the conservation of energy which is evident through its Energy Conservation Program which involves energy audits and energy efficiency related savings. The Office for the Promotion of Renewable Energy Technology (OPRET), established within DOE through financial assistance provided by Global Environmental Facility (GEF), has developed a framework which sets a guideline for the participation of Renewable Energy Service Companies (RESCO’s) in rural electrification. Other organisations such as Pacific International Center for High Technology Research (PICHTR) has previously supported DOE in promoting and disseminating renewable energy technologies, facilitation of funds and capacity building for staff and rural dwellers. For
17
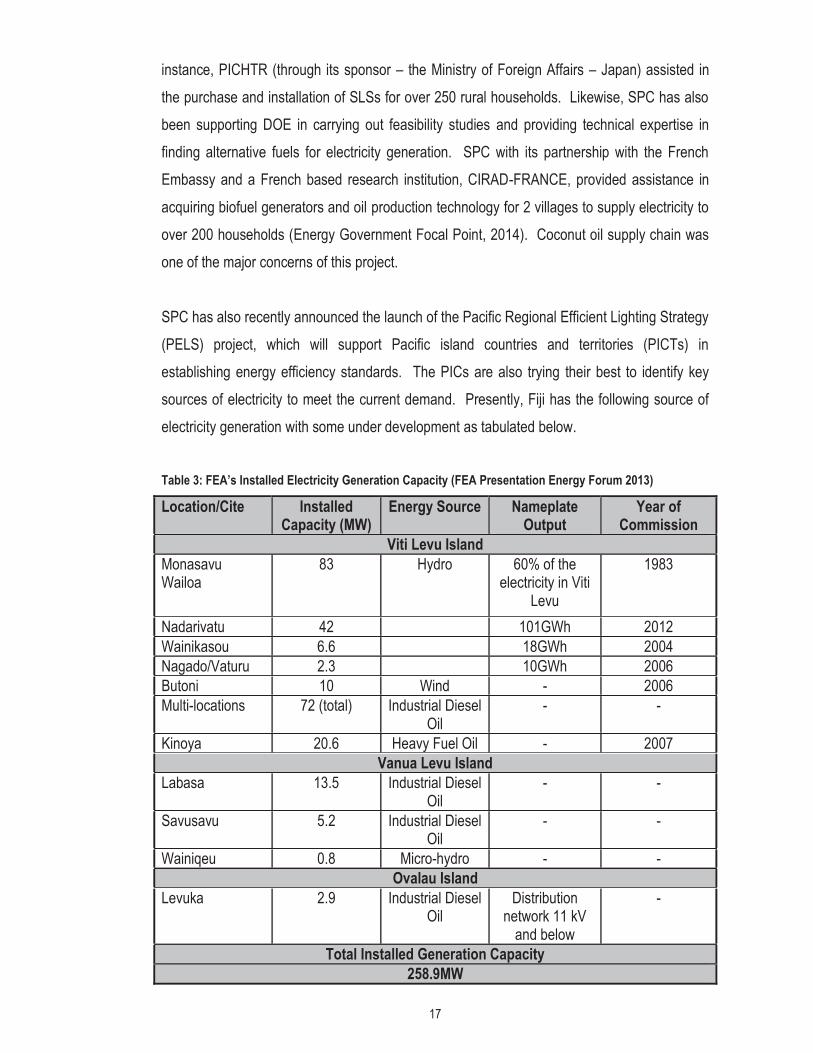
instance, PICHTR (through its sponsor – the Ministry of Foreign Affairs – Japan) assisted in the purchase and installation of SLSs for over 250 rural households. Likewise, SPC has also been supporting DOE in carrying out feasibility studies and providing technical expertise in finding alternative fuels for electricity generation. SPC with its partnership with the French Embassy and a French based research institution, CIRAD-FRANCE, provided assistance in acquiring biofuel generators and oil production technology for 2 villages to supply electricity to over 200 households (Energy Government Focal Point, 2014). Coconut oil supply chain was one of the major concerns of this project. SPC has also recently announced the launch of the Pacific Regional Efficient Lighting Strategy (PELS) project, which will support Pacific island countries and territories (PICTs) in establishing energy efficiency standards. The PICs are also trying their best to identify key sources of electricity to meet the current demand. Presently, Fiji has the following source of electricity generation with some under development as tabulated below. Table 3: FEA’s Installed Electricity Generation Capacity (FEA Presentation Energy Forum 2013) Location/Cite Installed
Capacity (MW) Energy Source Nameplate
Output Year of
Commission Viti Levu Island
Monasavu Wailoa
83 Hydro 60% of the electricity in Viti
Levu
1983
Nadarivatu 42 101GWh 2012 Wainikasou 6.6 18GWh 2004 Nagado/Vaturu 2.3 10GWh 2006 Butoni 10 Wind - 2006 Multi-locations 72 (total) Industrial Diesel
Oil - -
Kinoya 20.6 Heavy Fuel Oil - 2007 Vanua Levu Island
Labasa 13.5 Industrial Diesel Oil
- -
Savusavu 5.2 Industrial Diesel Oil
- -
Wainiqeu 0.8 Micro-hydro - - Ovalau Island
Levuka 2.9 Industrial Diesel Oil
Distribution network 11 kV
and below
-
Total Installed Generation Capacity 258.9MW

18
The Fijian Government carried out a review of the 2006 National Energy Policy (NEP) in March 2013 with the aim to develop a new policy that would reflect changing realities in both international energy markets and in domestic developments. The development of NEP was led by the Government’s vision for Fiji’s energy sector. It defines three high level objectives, which are aligned to this vision: To provide all Fijians with access to affordable and reliable modern energy services, to establish environmentally sound and sustainable systems for energy production, procurement, transportation, distribution and end-use, to increase the efficient use of energy and the use of indigenous energy sources to reduce the financial burden of energy imports on Fiji (Chen, et al. 2015). The NEP also has targets which are aligned with the SE4ALL initiative of the United Nations. Table 4: New Energy Policy Targets (Chen, et al. 2015)
Indicator Baseline Targets 2015 2020 2030
Access to modern energy services Percentage of population with electricity access
89%12 (2007) 90% 100% 100%
Percentage of population with primary reliance on wood fuels for cooking
20%13 (2004) 18% 12% ˂ 1%
Improving energy efficiency14
Energy intensity (consumption of imported fuel per unit of GDP in mega joules (MJ)/FJD)
28.915 (2011) 2.89% (-0%) 2.86% (-1%) 2.73 (-5.5%)
Energy intensity (power consumption per unit of GDP in kWh/FJD)
0.2316 (2011) 0.219 (-4.7)%
0.215 (-6.5%)
0.209 (-9.1%)
Share of renewable energy RE share in electricity generation
56%17 (2011) 67% 81% 99%
RE share in total energy consumption
13%18 (2011) 15% 18% 25%19
12 Preliminary data from 2007 Census, Fiji Islands Bureau of Statistics 2012b 13 2002-2003 Household Income and Expenditure Survey, Fiji Islands Bureau of Statistics, (2004). Reliance on wood fuels alone for cooking. 14 Based on 15% fuel substitution to local fuels and a 3% annual efficiency improvement. 15 Fiji Islands Bureau of Statistics based on average 36 MJ per litre of fuel. 16 Fiji Islands Bureau of Statistics based on average 36 MJ per litre of fuel. 17 Annual report 2011, FEA 18 Based on total energy consumption of 16,500 terajoules (TJ) (Fiji Islands Bureau of Statistics, 2011) and 55% power generation from renewables (FEA). 19 Based on 99% renewable power and 25,000 kL of biofuel
19
The draft NEP 2014 is articulate and focuses on seven priority areas, which are, grid-based power supply, rural electrification, renewable energy, energy efficiency, transport, petroleum products and biofuels and implementation arrangements (Chen et al., 2015). It is accompanied by a detailed strategic action plan which addresses all policy areas listed above and describes actions required to achieve the respective policies. The policies include a legislative gap analysis with the aim to identify areas where changes in legislation may improve energy sector co-ordination and trigger a more effective management of the energy sector. The purpose of the legislative gap analysis was to identify, if and what, new legislation is needed and which existing legislation needs to be amended to assist effective implementation of the NEP and Strategic Action Plan. The six relevant key legislations that govern energy production in Fiji are the Electricity Act, the Public Enterprise Act, the Land Transport Act, the Environmental Management Act, the Commerce Commission Decree and the Minerals Exploration and Exploitation Bill. The legislative gap analyses lead to short and long term changes to these legislations.
1.6. Different Types of Renewable Energy Business Models Across the Globe
Households incur high upfront costs and maintenance costs, therefore, many countries have been making use of fiscal incentives such as grants, loans and tax reductions in order to address this issue. The Renewables 2014 Global Status Report (REN21, 2014) defines the various types of energy business models as below: 1.6.1. Public – Private Partnership Model This model is mainly for mini-grid systems, where all movable assets are owned by the private entity, while fixed assets, such as power plants and distribution lines, are publicly owned. The plant is usually managed by the village committee and is designed to meet customer needs. Customers are allotted energy blocks according to their energy demand requirements and capacity to pay. This model is being replicated in the Philippines, Nepal, and other Asian countries.

20
1.6.2. Pay-as-you-go (PAYG) micro-payment schemes Under this scheme, customers typically pay a small upfront fee for a solar charger kit, a portable system that includes a solar PV module, and a control unit that can be used for powering LED lights and charging devices for mobile phones. They then pay for the energy they need, either in advance or on a regular basis, depending on consumption. An increasing number of households in sub-Saharan Africa are accessing energy through the PAYG system, paying about half of what it would cost them to get the same services with kerosene. Such schemes were also used in India during 2013 to provide off-grid and decentralised solar power (Patil, et al. 2013). However, some challenges still need to be addressed. For example, companies face severe cash flow constraints when consumers default on payments because the market currently lacks debt-servicing instruments (Patil, et al. 2013). 1.6.3. One-stop-shop models Under this model, a single organisation sells the renewable energy home systems and also provides loans to pay for them. This is common in Bangladesh, where one organisation sells SHSs with a 15% down-payment, provides customers with three-year loans at 6%, after-sale services, and long-term product warranties (Ballesteros, et al. 2013). It also provides technical training across rural Bangladesh and trains entrepreneurs, particularly women, to become owners of their own renewable energy businesses (Ballesteros, et al. 2013). 1.6.4. Franchise Models In franchise models, local entrepreneurs in rural areas are trained to run micro-enterprises. A variation of this model is used for the Lighting a Billion Lives campaign in India, which is helping to set up solar businesses that rent out charged solar lanterns on a daily basis in poorly electrified villages (Ballesteros, et al. 2013). 1.6.5. Crowd funding This model allows individual private investors to make payments to local partners via an online platform; over time, the partner makes repayments to the funder who, in turn, repays investors. A recent example is a portal that raised more than USD$15,000 to fund solar kits for lighting and mobile phone charging systems for 19,000 households in Uganda (Guay, 2013).
21
Most business models, combined with renewable energy technologies, have proven to be reliable and affordable methods for achieving access to modern energy services, advancing quality of life, and improving human and environmental health (REN21, 2014).
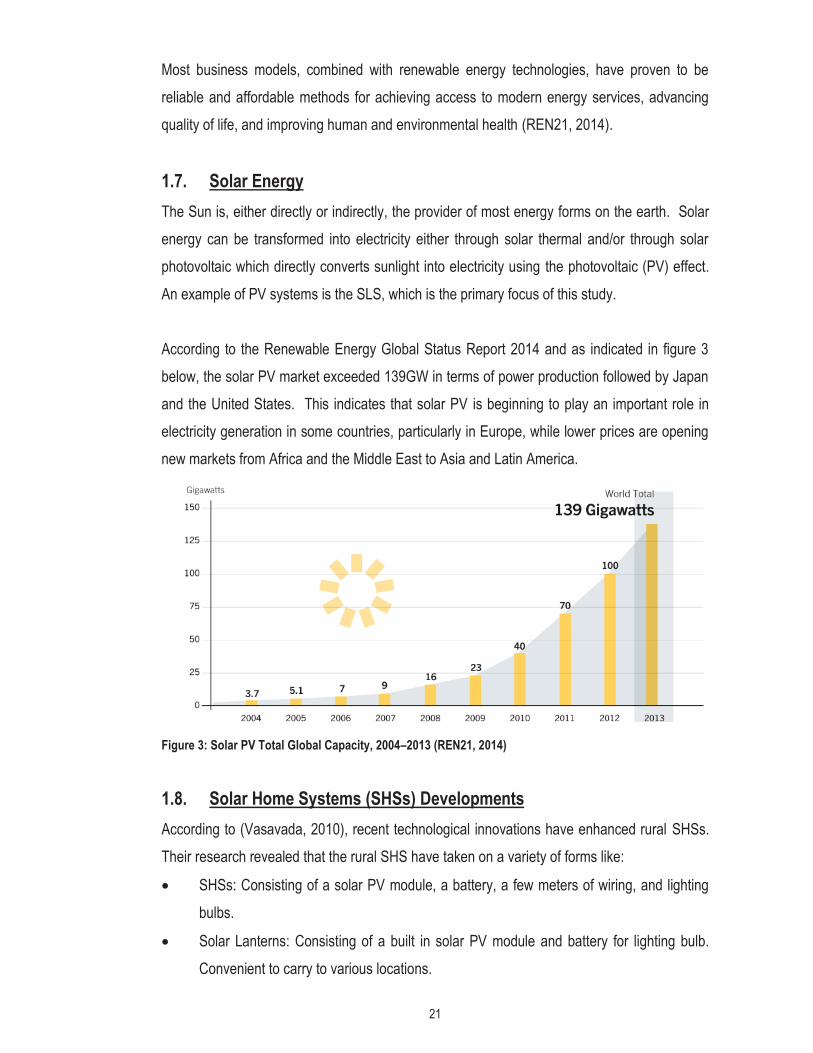
1.7. Solar Energy The Sun is, either directly or indirectly, the provider of most energy forms on the earth. Solar energy can be transformed into electricity either through solar thermal and/or through solar photovoltaic which directly converts sunlight into electricity using the photovoltaic (PV) effect. An example of PV systems is the SLS, which is the primary focus of this study. According to the Renewable Energy Global Status Report 2014 and as indicated in figure 3 below, the solar PV market exceeded 139GW in terms of power production followed by Japan and the United States. This indicates that solar PV is beginning to play an important role in electricity generation in some countries, particularly in Europe, while lower prices are opening new markets from Africa and the Middle East to Asia and Latin America.
Figure 3: Solar PV Total Global Capacity, 2004–2013 (REN21, 2014)
1.8. Solar Home Systems (SHSs) Developments According to (Vasavada, 2010), recent technological innovations have enhanced rural SHSs. Their research revealed that the rural SHS have taken on a variety of forms like:
� SHSs: Consisting of a solar PV module, a battery, a few meters of wiring, and lighting bulbs.
� Solar Lanterns: Consisting of a built in solar PV module and battery for lighting bulb. Convenient to carry to various locations.

22
� Street lighting systems: Is a stand-alone unit with solar PV module, battery, light bulb and wires.
PV systems, such as SHS, are being promoted by government and international aid organisation as a feasible and cost effective alternative for the basic electrification of rural households (Chow, 2010). According to a report published by the International Renewable Energy Agency (IRENA), SHS installations in developing countries have increased from 1.3 million in 2002 to 6 million presently, mainly due to the Government of Bangladesh having installed more than 3 million SHS targets (Kempener et al., 2015). According to the International Finance Corporation (IFC), total sales in Asia in 2011 reached 2.2-2.4 million systems, nearly half of which were located in India (IFC, 2012). Despite some commercial success in Kenya - Africa’s leader in SHSs with 320,000 units cumulative installed capacity at the end of 2010 and a market growth of around 10% per year (Ondraczek, 2011), Kempener et al. (2015) note that Africa’s solar industry faces numerous challenges to growth and job creation. These include: Domestic financing; the quality of imported solar PV modules; and lack of technical training. 1.8.1. Global SHS Developments SHSs already provide power to millions of homes around the globe, in Africa, Asia, Latin America and PICs. The information given in this section is captured from the Renewables 2012 Global Status Report (REN21, 2012). Africa, Gambia, Ghana, and Nigeria (to name a few) have approved policies which assist in providing electricity to rural areas. As a result, these countries have seen many significant achievements. For example, the Botswana Village electrification project had successfully provided electricity to 35 villages by March 2011. In Ghana, households have been receiving a total of 4,200 solar PV systems since 2009. Zambia households received around 450 solar PV systems through the Energy Service Companies (ESCOs) pilot project. Cameroon inaugurated its first solar village and high school in 2011. These projects have been possible through the support given by multilateral banks and bilateral aid organisations. The Lighting Africa initiative program (of Africa), which was launched in 2007, had the objective of providing the people of Asia with affordable, quality and clean solar lighting products. As a result of adopting the program, around 7.7 million people to date in Africa have access to cleaner and cheaper solar powered lighting.
23
Focusing now on Asia, China, with a population of 1.3 billion, is also investing heavily, to satisfy its growing energy requirements. Consequently only around 5 million Chinese in remote areas today lack access to modern energy sources. On the other hand, almost 25% of India’s population still does not have access to electricity, and the Philippines aims to provide 90% of its households with electricity, by 2017, through its Rural Electrification Program (REP). Nepal also aims to promote rural electrification through its Rural Energy for Rural Livelihood Program. The Power Ministry and the Renewable Energy Organisation of Iran, SUNA together, have been responsible for providing electricity to more than 233 households in Iran. Bangladesh, managed to successfully distribute 1.3 million SHSs through the Solar Energy Program. Development banks have also developed and implemented a number of initiatives in these countries. For example, Germany’s KfW financed a project in Bangladesh that assisted about 450,000 SHSs. In fact, NGOs are also playing an important role in providing viable electrification. For example, the LaBL initiative of TERI of India was launched with the aim to manage charging stations and as users. Furthermore, 110,000 villages had been electrified under India’s Rajiv Gandhi Grameen Vidyutikaran Yojana (RGGVY) scheme with the Government providing 90% subsidy. Lack of access to electricity is basically a rural area issue, especially in the Latin American region where only around 1% of the urban population lacks electricity while the rural share is 28%. Overall, nearly 31 million people of the Latin America region do not have access to electricity whilst 85 million still depends on traditional biomass. The only feasible solution for the affected rural area population is renewable off-grid technology. As a result, a number of off-grid and mini-grid solutions have been created in countries from Argentina to Mexico. This includes the installation of 170 electrification systems in the Argentinian province of Neuquén and the installation of a 1 MW PV plant in Calama in northern Chile. Honduras and Nicaragua have distributed around 1,600 and 840 systems respectively, through national programmes. Brazil developed 12 mini PV plants with mini networks in 2011 which measure consumption and invoice consumers accordingly through a prepayment system. Brazil established the Luz para Todos (“Light for All”) programme in 2003 with the aim of providing universal electricity access by 2014. As of end-2011, 14.5 million people (2.9 million households) had benefited, with almost half of them in the poorest part of Brazil’s northeast region.
24
1.8.2. Pacific Islands SHS Developments In the Pacific region, an estimated 70% of households do not have access to electricity (Dornan, 2013). This is because PICs are isolated, dispersed in nature, and have long distances between islands where supplying electricity is a challenge. Traditional approaches to expanding access to electricity, which are focused on grid extension, are often not feasible in these areas. However, several initiatives such as clear policies, better institutional arrangements, consistent and transparent subsidy arrangements and reconsideration of tariff policies would and have contributed towards improving the rate of rural electrification substantially in some PICs (Dornan, 2013). In Tonga, community operated diesel grids prevail in the larger rural islands like Tongatapu, ‘Eua, Lifuka (Ha’apai) and Neiafu (Vava’u), whilst SHSs provide power for almost all of the homes in the smaller outer islands, with the most recent installations providing 160 watts-peak (Wp) of solar PV capacity (IRENA, 2013m). The SHSs provide 24-hour power for lighting and running small appliances. Tonga has been using solar PV for rural household electrification for nearly 20 years now, and although earlier projects were not so successful, the newer projects have improved in quality. Recent implementations in the Ha’apai group of islands involved rehabilitating SHS in the islands of Mo’unga’one and Mango and installing new SHS in Lofanga. The rehabilitation work in Mango and Mo’unga’ were completed in 2009 with 64 SHSs installed. The Lofanga SHS were commissioned in 2012, with 52 systems installed (IRENA, 2013m). Currently, the Energy Division of Ministry of Lands, Survey, Natural Resources, and Environment are involved in replacing the old SHS (Raturi, 2011). Moving on, as one of the world pioneers of rural electrification using solar PV, Tuvalu, had installed more than 400 SHSs between1984-1994. Unfortunately, the Tuvalu Solar Electric Cooperative Society (TSECS), which was in charge of operating the system, collapsed in the mid 1990’s and can no longer provide electricity services (IRENA, 2013n). In Samoa, 10 households and a village church were electrified using the first independent solar mini-grid in the Pacific in 2006. The system has 13.76 kWp of modules with battery storage which provides uninterrupted AC power supply to the island. The system has worked very well and, despite some minor problems with the controllers’ cooling fans and the settings on one inverter, no power outages have occurred since it was commissioned (IRENA, 2013j). Approximately 1,600 Samoan homes (5%) are not connected to the grid, and in 2008 a

25
feasibility study was conducted for their electrification with various sizes of SHSs. So far 46 systems donated by a Chinese company after the 2009 tsunami, have been installed in these homes. They also provided two off-grid solar installations for government facilities and one for an NGO (IRENA, 2013j). The American Solar Electric Light Fund in the Solomons provided around 110 SHSs in Sukiki and Makaruka during 1997–1998, but these were later stolen during the civil unrest. In 2012, Japan provided SBD29.4 million (USD4 million) through its Pacific Environment Community (PEC) Fund for about 2,000 SHSs to be installed under a “solar utility” or RESCO concept which was mentioned earlier (Kempener et al., 2015). Under this concept, the credit schemes and associations will act as financial institutions from which members can obtain loans to buy SHSs. Due to public interest, the project is also available to members of the public who are not members of any credit schemes/associations on the condition that they pay 100% of costs upfront before installation and servicing take place (Kempener et al., 2015). In 2013, the Kiu village on the island of Malaita in the Solomon Islands received US$3.99 million funds, for the installation of 2,000 SHSs. This project helped residents to use electricity for lighting and basic electrical appliances20. Another project aimed at replacing kerosene lights by small solar PV LED lighting systems in the Solomon Islands was known as Establish Pacific Micro Energy Service Companies (PMESCOs), which was a joint initiative of REEEP and SOPAC. This project was based on the barter model and let farmers trade their crops as installment payments to pay off their loans for their SHSs21. In PNG, there were sales of around 3,000 SHSs between 1998 and 2002, with almost 1,000 new systems sold every year since then (IRENA, 2013i). Moreover, PNG, Solomon Islands and Vanuatu are member countries of the Small Island Developing States (SIDS) and are partners of the Melanesia Million Miracle Programme (M3P), which is an initiative of SPC, aimed at bringing electricity to one million people in Melanesia within 5 years (2014-2020). The objective is to assist in bridging the existing gap on the level of modern energy access between the rural and urban areas. The partnership will
20 http://www.pacifictradeinvest.com/wp/ 21 http://www.reeep.org/projects/establish-pacific-micro-energy-service-companies-pmescos

26
prove beneficial to SIDS in the sense that it is expected to reduce the dependence and expenditure on fossil fuel, lower poverty levels and enhance the livelihoods of around a million households in the rural areas of PNG, Solomon Islands and Vanuatu, through an appropriate rural electrification programme. Some of the key targets of the M3P is to achieve the following by 2020: Improved literacy and technical skills, economic empowerment of local NGOs and communities, achieve a 80% reduction in the use of fossil fuel (kerosene) for lighting and ensure that a total of 1,065,030 people in PNG, Solomon Islands and Vanuatu have access to electricity through solar lights22. In Kiribati, 64% of the population has access to some form of electrical power. The Installation of 100Wp SHSs in 57 households on Tarawa and 600Wp in one community building was completed in 1992. The European Union funded an additional 300 installations in 1994. A few years after the successful installation of these systems, the EU provided funds for the installation of a further 1,700 SHSs and 140 maneabas. These were finally installed and operational by 2006 (IRENA, 2013d). The Japan International Co-operation Agency (JICA) provided funding in 2005–2006, for the upgrade of the grid power system on Tarawa. Under the Cotonou Agreement (EDF-9), the Republic of Marshall Islands received an EU grant of about USD 2 million for renewable energy development and energy efficiency measures. Combined with another donor programme from institutions from Chinese Taipei, this led to the installation of around 1,500 SHSs in residences and has provided solar electricity for six schools. Marshalls Energy Company (MEC) managed the project under the government contract (IRENA, 2013e). 1.8.3. Fiji Islands SHS Developments Similar to the aforementioned PICs, Fiji’s first rural electrification with a RESCO management structure was funded by the United States Agency for International Development (USAID), through the Peace Corps, in 1983 (IRENA, 2013c). This was first tried at Namara (Kadavu) and Vatulele (Koro) with an average of 30 and 40 solar PV systems each. The work continued further on Totoya but the installation was shelved as a result of Peace Corps volunteers leaving early. Similarly, the Koro project failed after the Peace Corps volunteer manager left and the village cooperative spent the accumulated funds on other projects, leaving no money for battery replacements (IRENA, 2013c). The Namara cooperative also failed as an 22 http://www.sids2014.org/index.php?page=view&type=1006&nr=2504&menu=1507

27
organisation due to similar reasons. However, in this case, villagers successfully took over management of the systems, using the technician trained under the original project. Several projects in the late 1980s and mid-1990s increased module capacity at Namara and provided high-quality battery replacements, allowing the project to continue operating. The Namara solar installation could be the longest continuously running solar electrification project in the Pacific islands region (IRENA, 2013c). These early pilot projects provided much useful information for the PV projects. Over 100 SHS were installed in cane farm settlements in Viti Levu in 1987. These were maintained by the Fiji Department of Energy (FDOE) with a monthly fee arrangement. However, customers were not satisfied with the small sizes of the systems, leading to the project being abandoned. In the late 1980s PV electrification was tried at ten community centers to provide lighting and video power in rural Viti Levu. Results were mixed, neither very positive nor completely negative (IRENA, 2013c). The Rural Electrification Policy was revised and endorsed by Cabinet in 1993 and a REU was set up to facilitate the implementation of the Policy (Renewable Energy Report, 2004). As per the Policy, rural villages or settlements are entitled to request Government assistance for electrification. The two main concepts which appeared to have wide applicability in locations are SHS and hybrid power systems (HPS). Few locations also had potential for mini hydro systems for producing electricity. The FDOE, under the 1993 Policy, provided three service choices to the disadvantaged. Firstly, they extended the FEA grid or government station mini-grid to provide 24 hours per day service. These included the use of diesel generators (gensets) operated by the Public Works Department (PWD) at five government stations in Kadavu (Vunisea), Lakeba (Tubou), Rotuma (Ahau), Taveuni (Waiyevo) and later at Vanua Levu (Nabouwalu). The gensets supplied electricity to government offices, community hospitals, public institutions, stores, icehouses, and nearby villages. PWD operated the government station schemes under a yearly budget. The fees collected from consumers were forwarded to the central government and not correlated to the cost-of-electricity production (Renewable Energy Report, 2004). The maintenance, repairs and replacements were typically postponed, unfortunately. Secondly, FDOE provided a diesel generator with mini-grid system for evening lights and small electrical appliances; and thirdly, FDOE provided renewable energy systems like solar PV or small
28
hydro for evening lights23. This was subsidised through the effort of the applicant and the Government. The applicants paid 5% upfront of the total capital costs, while the Government subsidised the remaining 95% (Renewable Energy Report, 2004). The village of Naroi on the island of Moala was electrified in 1999 using SHSs funded by France. The systems used 100Wp of modules, a high quality industrial battery, and a French designed charge control system that included a type of prepayment meter that would turn on the power for a month if a 16-digit code generated by the FDOE was entered (IRENA, 2013c). The codes were sent by radio to the post office near Naroi where, for FJD$14.50 (USD$7.35) villagers could purchase the code and obtain a month’s electricity supply. The FDOE received FJD$14 (USD$7.10) and the Post Office received the remaining FJD$0.50 (USD$0.253) for their clerical services (IRENA, 2013c). Local technicians were trained in maintenance and placed under FDOE contract. However, there were a number of problems which included poor performance by the technicians due to inadequate supervision by FDOE, high costs due to failures of the expensive prepayment meters and loss of confidence in the programme due to failed systems not being repaired. Although the project could not be considered a success, the lessons learned from it were later used in designing the larger scale Vanua Levu projects that currently form the FDOE’s primary solar based rural electrification efforts (IRENA, 2013c). In 2001, the FDOE introduced standalone PV-based SHS for areas with adequate solar resource. It began with an installation of 250 systems provided through funding from the Ministry of Foreign Affairs of the Government of Japan and coordinated through the PICHTR in Hawaii (Renewable Energy Report, 2004). A further funding of around 100 systems was provided thereafter. Over the years, through the Government Rural Electrification program, a total of 1,200 systems were installed in Vanua Levu, and a private company was trained and contracted to maintain the system.
In 2012, the PEC Fund contributed US$2.3 million towards a rural SHSs project in Fiji24. The initiative targeted the reduction of carbon emissions through increasing the use of renewable energy and reducing dependence on fossil fuels. Forty one rural villages around Fiji are expected to receive the SHS as part of the project25. The project was named as Fiji 1000 23 http://data.reegle.info/?uri=http://reegle.info/profiles 24 http://www.forumsec.org/pages.cfm/newsroom/press-statements/2012/usd23-million-for-fiji-solar%20initiative.html 25 http://www.forumsec.org/pages.cfm/newsroom/press-statements/2012/usd23-million-for-fiji-solar%20initiative.html

29
Solar Home Systems Project and the village of Matasawalevu in Kadavu was the first recipient of theinitiative26. Compared to most other Pacific Island countries, Fiji has only a few small on-grid PV installations as FEA does not have a viable feed-in tariff for solar PV and disallows net metering, i.e. the off-setting of households power consumption through decentralised PV installations. The largest installation is the 54 kilowatt-peak (kWp) installation at the University of the South Pacific in Suva that is part of a renewable energy project funded by the Korea International Cooperation Agency (KOICA) (IRENA, 2013c). This project uses expensive ground mounting and its cost is not a useful reference for evaluating the economic merits of grid-connected solar (Chen, et al. 2015). Looking at the situations in the Pacific, the SHS projects was not successful due to various issues. These include the lack of knowledge of the system, maintenance issue, and upfront costs of the system not being paid by the users.
1.9. Overview on the usage of Solar Home Systems (SHSs) A number of success stories for SHS projects in South Africa, India, Colombia, Ecuador, Bolivia, and Peru, Mexico, Brazil, Argentina etcetera gave SHSs more popularity and portrayed it as a feasible option for rural electrification (REN21, 2012). Demand for the SHS is increasing day by day in the various parts of the world which lack access to electricity. India alone has a target to set up 20 million SHS by 2022 (REN21, 2012). The RESCO program in Fiji is the latest attempt to promote solar based rural electrification in a fee for service model, aiming to remove the high upfront capital costs associated with solar technologies and using a public and private sector partnerships for maintenance (Dornan, 2011). A survey revealed major problems with the maintenance of solar systems provided under this program. Studies also revealed that in the rural and remote communities, people have different attitudes towards SHS. The SHS could not be afforded by a lot of the households even when the costs were heavily subsidised (Mala et al., 2009). In many circumstances, SHS could only be afforded at the cost of using up income saved for some other activity.
26 http://www.forumsec.org/pages.cfm/newsroom/press-statements/2013/forum-dsg-congratulates-fiji-on-commissioning-of-rural-solar-project.html

30
There is a need for users to have at least minimal technical knowledge in order to be able to maintain the SHSs (Mala et al., 2009). The SHS program has been the most successful in Bangladesh by far. Studies indicated by Urmee and Harries (2011) and Wong (2012) highlight the program’s success as it targets households with very low incomes using a purely market-based approach. Those participating in the program pay the full, unsubsidised cost of their SHS using a micro-credit loan facility, and are charged high interest rates (Urmee & Harries, 2011). This provides lessons for other developing countries in the stage of developing SHS programs. The program’s success was primarily due to its strong focus on meeting householders’ needs and on its ability to make the SHS as affordable as possible (Urmee & Harries, 2011). The continued success of the program was attributed to a likely set of factors, including the ability of program implementers to control increases in the cost of SHS; to maintain the quality of SHS and components and to increase program loan recovery rates; the degree to which the program is integrated into national energy policy; and the degree to which local banks become involved in the program (Urmee & Harries, 2011). The success of the Bangladesh program can be put down largely to the refinancing, regular monitoring, the availability of spare parts, reliable after sales service and linking the system with productive use. The success stories from East Timor introduce distribution of SHS in the sub-district of East Timor (Bond et al., 2010). Results of the survey indicate that users prefer SHS rather than lanterns (Bond, et al. 2010). This is because SHS is perceived as providing better lighting quality (with the ability to illuminate the whole house) and longer duration. The use of SHS also has socioeconomic impacts. The related work of Bond et al. (2010), Gustavsson and Ellegard (2004), Singal et al. (2007), Kanagawa & Nakata 2008 and Urmee and Harries (2011) focused on the distribution of the SHS to the rural areas in order to gather information on their impacts on the livelihood of people. According to the authors, the integration of the solar system in peoples’ lives resulted in improvements and new possibilities, such as doing domestic work at night, reading and studying as well as watching video (Gustavsson & Ellegard, 2004). It has also (as mentioned above) increased the perception of a better light quality; ability to illuminate the whole house; reduced risk of damage to the PV equipment; and longer duration

31
of nightly operation (Bond et al., 2010). However, high upfront costs and maintenance issues have limited their use to date as mentioned by Dornan (2011). He further suggested institutional arrangements put in place by governments and donors to overcome the cost barriers have often failed to ensure that appropriate maintenance of solar systems is provided. In his comparative study, Mondal (2010), found out that the SHS is financially attractive for small rural businesses. Furthermore, Mala et al. (2009) supported the work of above authors and stated that the SHS does satisfy basic energy needs, is easy to operate and maintain, and is a means of promoting small-scale income generating activities. However, users should have at least the basic knowledge to maintain the system. Gustavsson (2007) noted that people increase the number of appliance for the system which results in deteriorating batteries through operation on long or low state of charge. To meet the increasing load demand on the system one needs to increase the module effect. In addition, the focus by Wong (2012) was on the subsidising scheme set up by the government to promote the use of SHS in rural areas. According to him, it does not seem to be working due to inappropriate cost management, such as the heavy down-payment, paying monthly subscription charges in a lump-sum and the non-discriminatory subsidy policies. Further Kanagawa and Nakata (2008) revealed that energy access improvement for lighting demand through electrification, which is achieved by the dissemination of electric lighting appliances, creates desirable educational environment for children. Poverty reduction through advancement in socio-economic condition might be achieved by energy access improvement (Kanagawa & Nakata, 2008). The problems associated with the Fiji program stem from the lack of maintenance and after sales service, which make the project unreliable to the users and decrease the faith of the customer on the technology (Urmee & Harries, 2011). Training could be provided to people and users to reduce the maintenance costs. There is a need for consultation sessions with the people on the program development, in order to bring users to become part of the program. Consultation with the community on program development and management is necessary in order to create a sense of ownership among users. Further studies conducted in Bangladesh and India explores obstacles that hinder poor people from obtaining solar lighting (Mondal, 2010). These are financial exclusion, weak governance, and passive Non-Government Organisations (NGO) and customer participation (Mondal, 2010). To overcome

32
these obstacles, creating easy access to credit, establishing a robust complaint system, and developing strategic partnership is necessary (Mondal, 2010).
1.10. Objective of Thesis In Fiji, there are currently no mechanisms in place to control the quality of imported PV products, including SLSs. There is a need to carry out quality tests according to certain standards, to filter non-economical lighting systems, and also to carry out quantitative and qualitative researches on the socio-economic impact of SLS on the lives of rural dwellers in Fiji, as there are no current reports which focus on this. There have been various projects carried out by relevant authorities in Fiji in the past whereby SHSs had been distributed to households in remote areas. However, no study has ever been conducted on the quality of lights distributed and the improvement in the daily lives of the people as a result of using these lighting systems. Thus, the objective of this thesis is to investigate the socio-economic impact and the quality of the locally available SLSs. The thesis is divided into two parts; the first part deals with the characteristics of samples of SLSs available in various shops in Fiji. The second part comprises a survey, investigating the socio-economic impact of these systems distributed in some villages of Fiji. Specific objectives of the study are:
i. To evaluate the different SLSs available in Fiji in terms of solar PV properties, illumination and battery characteristics.
ii. To investigate the performance of different SLS under field conditions; iii. To determine socio-economic impact of SLS in the rural areas of Fiji; iv. To analyse the financial benefits of SLS over the traditional fuel based lighting in the
rural areas of Fiji.
1.11. Structure of the Thesis This thesis is organised as follows: 1.11.1. Chapter 1 begins with an introduction which provides an overview of the research
background, discusses the objectives and outline of the thesis.

33
1.11.2. Chapter 2 provides an overview of the literature on the types of photovoltaic system and especially on SLS, the components used to assemble a SLS, the characteristics of the components such as module, battery, and charge controller etcetera. This chapter briefly outlines the techniques and results obtained by various authors that have used SLSs in their research.
1.11.3. Chapter 3 discusses the techniques and methods used in data collection for this work. This chapter has two parts. The first part describes the procedure of determining the characteristics and SLS and the second part is the data collection. Questionnaire was used as an instrument to obtain the response.
1.11.4. Chapter 4 presents the results, discussions and their implications. This includes the tabulated results from the experiment and response from the survey. Based on the results a detailed discussion was done comparing the results obtained from the experiment with the feedback received by villagers who received the SLSs.
1.11.5. Chapter 5 provides the conclusion and recommendations of the study. It summarises the thesis and highlights the major findings and gaps.
1.12. Relevance of the Thesis The findings obtained can contribute towards developing knowledge on the rural electrification methods and the socio-economic benefits behind it. The study will provide an important source of information to policy/decision makers, academics, businesses, higher education institutions, energy departments, ministries, industries and other interested groups. Some of the findings established in the research are completely new as this is a first for the products available in Fiji. The success stories from other countries together with the results of the research can contribute to a review of the rural electrification policy and the energy policy of Fiji. The academics can use the findings in the teaching and learning process and to conduct further research.

34
Chapter 2 – Literature Review 2.1. Fuel Based Lighting Systems A significant part of the world is still without any access to electricity even though the demand is high. The main source of lighting for people not connected to the grid are fuel-based lighting systems such as kerosene lamps, white spirit lamps, diesel generators and candles as described below. 2.1.1. Traditional Lighting Systems Today, when technology is so well advanced, we still have homes which do not have electricity. The use of fuel-based lighting systems like candles, kerosene, white spirit, diesel and so forth are high as well as the risks to health and the environment. Some Common Traditional Lighting Systems used around the world: a. Candles
Figure 4: Candles of different size and shape made up of wax27
b. Kerosene Lantern
Figure 5: Kerosene Lantern (Hurricane Lantern) uses cotton weak and kerosene as fuel28
27 http://chicagoacs.net/statefair/CD-2015/ChemMatters/2007_12_smpissue.pdf
A Candle is made up of wax with a wick embedded in the wax. The wick is ignited to produce light. The life of the candle depends on the quantity of the wax. Wax is made from paraffin. Paraffin is a by-product of the distillation of crude oil which is a mixture of several different heavier hydrocarbons. The mixture provides the burning characteristic to waxes that can be used as a fuel.
The Kerosene Lamp uses kerosene as a fuel. It has a wick as light source, confined by a glass globe. This is also known as a hurricane lamp. It is a portable lighting system.

35
c. White Spirit Lantern
Figure 6: White Spirit Lantern works on pressure to ignite the mantle and uses white spirit as fuel29
d. Diesel Generator based lighting
Figure 7: Diesel Generator uses mechanical energy and diesel as fuel to produce electrical energy30
2.1.2. Impact of Traditional Lighting Systems Traditional lighting systems use heavily subsidised fossil fuels which are a risk to the life, health and the environment. When not in use, the liquid fuels such as kerosene and white spirit can be hazardous if it is kept within reach of small children. The color and odour of the fuel makes it attractive and countries have experienced causalities where children have died from consuming kerosene and white spirit. Usually, rural homes are poorly ventilated which causes breathing and optical problems. Mostly women are affected since they are predominantly exposed to the traditional lighting systems (Vasavada & Gupta, 2010). Children, while studying, face difficulty studying under low illumination and are also exposed to fumes which affect their health and vision. The emissions from kerosene and white spirit are toxic which can give rise to health issues. The use of candles, kerosene and white spirit lamps is also a fire risk. The light intensity of these traditional systems is low and does not 28 https://commons.wikimedia.org/wiki/File:Kerosene_lantern.jpg 29 http://fuel.papo-art.com/ 30 http://www.generatorpower.com.au/cat/yanmar-generators/
The White Spirit lantern uses white spirit as fuel which consists 60% Hexane and 40% Heptane. It is a colorless fuel. The lamp has a mantle as a light source, protected by a glass or globe. There is a pressure pump available which, if pushed, will make the mantle glow brighter. This is expensive and provides brighter light than the kerosene lamp.
A Diesel Generator produces electrical energy using diesel engine. It could be used to produce light and also operate electric appliances like TV, Radio, and Refrigerator etcetera. The machine works with diesel and is more efficient than candles, kerosene and White Spirit lamps. However, it is expensive and creates noise while in operation.

36
meet recommended reading requirements effectively (Vasavada & Gupta, 2010). Moreover, in the rural setting, shops and fuel distributers are situated far away from the households and people have to travel long distances to get their fuel supply. A study by Buragohain (2012) showed that burning a candle for a few hours in a closed room results in lead concentrations sufficient to cause fatal damage and can also harm the mental development of children. Lead poisoning can lead to behavior changes and damage internal organs, such as kidneys. This study mainly focuses on the lifestyle of women and children in the villages in India. Women in villages spend 2-6 hours a day collecting firewood; and children spent huge amounts of their day time doing household chores. They know it would be difficult to carry out or perform duties during the night time due to limited access to electricity. Rural electrification is considered as basic necessity to improve socio-economic conditions in rural areas (Buragohain, 2012). A similar research carried out by (Pode, 2010) revealed that kerosene is an ineffective source of lighting and is only 2 - 4 lumens compared to a 60W bulb with 900 lumens. Lighting systems operating on fuel are severe health and fire hazards. It is estimated that fuel based lighting systems are currently contributing around 244 million tons of CO2 emissions to the atmosphere each year, or 58% of the CO2 emissions from residential electric lighting (Pode, 2010). The fumes also consist of Carbon monoxide (CO) that replaces the oxygen indoors and can be fatal Nitrogen oxides and Sulfur oxides (NOx, SOx) which can cause lung and eye infections, respiratory problems and cancer (Pode, 2010). To overcome the issue of GHGs, sensible utilisation of energy resources are recommended, such as utilisation of most efficient energy saving appliances, avoiding or minimising usage of fuel based systems and utilising SHSs with a compact fluorescent lamp (CFL) and white LEDs as a substitute since they consume minimum power and do not contaminate the environment. 2.2. Photovoltaic (PV) System 2.2.1. Photovoltaic Introduction Semiconductor devices that are used to produce solar cells convert sunlight into electricity (direct current DC). The combinations of solar cells are electrically arranged into modules and arrays, which can be used to charge batteries and power electrical loads31. PV systems can produce alternating current (AC) by utilising a conversion device called inverter. This enables 31 http://pveducation.org/

37
the system to operate appliances that work on AC load and the system could also be connected to the utility grid. A PV system has no moving parts, is easily expandable and is compatible to the environment. The sun’s energy is free and PV operation does not contribute to noise or environmental pollution. If well designed and properly installed, it can have a long life. The price of PV systems is continuously decreasing and the PV modules require minimal maintenance to keep them in operation. Research and development activities are on improving the efficiency/cost ratio of the PV modules.
2.2.2. The Photovoltaic Effect The conversion of solar energy into electricity is often defined as a PV energy conversion since it is based on the PV effect. PV effect is described as the generation of a potential difference at the junction of two different materials when visible or other radiation falls on the material. The potential difference is created due to the generation of the electron-hole pairs when light falls on the material and their movement to the respective contacts. Only photons of appropriate energy can be absorbed and generate the electron-hole pairs in the semiconductor material. Doping is another important feature of the photovoltaic effect which manipulates the concentrations of electrons and holes in a semiconductor which is usually carried out by adding atoms with three or five valence electrons, such as boron or phosphorous to the semiconductor material. The electrical conductivity in semiconductors depends on the concentration of electrons and holes and their mobility. The concentration of electrons and holes is influenced by the amount of the impurity atoms that are introduced into the atomic structure of the semiconductor. A semiconductor is denoted as p-type or n-type when holes or electrons, respectively, dominate its electrical conductivity (Zeman, 1987). The other important feature of the photovoltaic effect is the band gap. The band gap of a semiconductor is the minimum energy required to excite an electron that is stuck in its bound state into a free state where it can participate in conduction 32. The band structure of a semiconductor gives the energy to the electrons. The lower energy level of a semiconductor is called the "valence band" (EV) and the energy level at which an electron can be considered free is called the "conduction band" (EC). The band gap (EG) is the gap in energy between the bound state and the free-state, between the valence band and conduction band. Therefore, 32 http://pveducation.org/
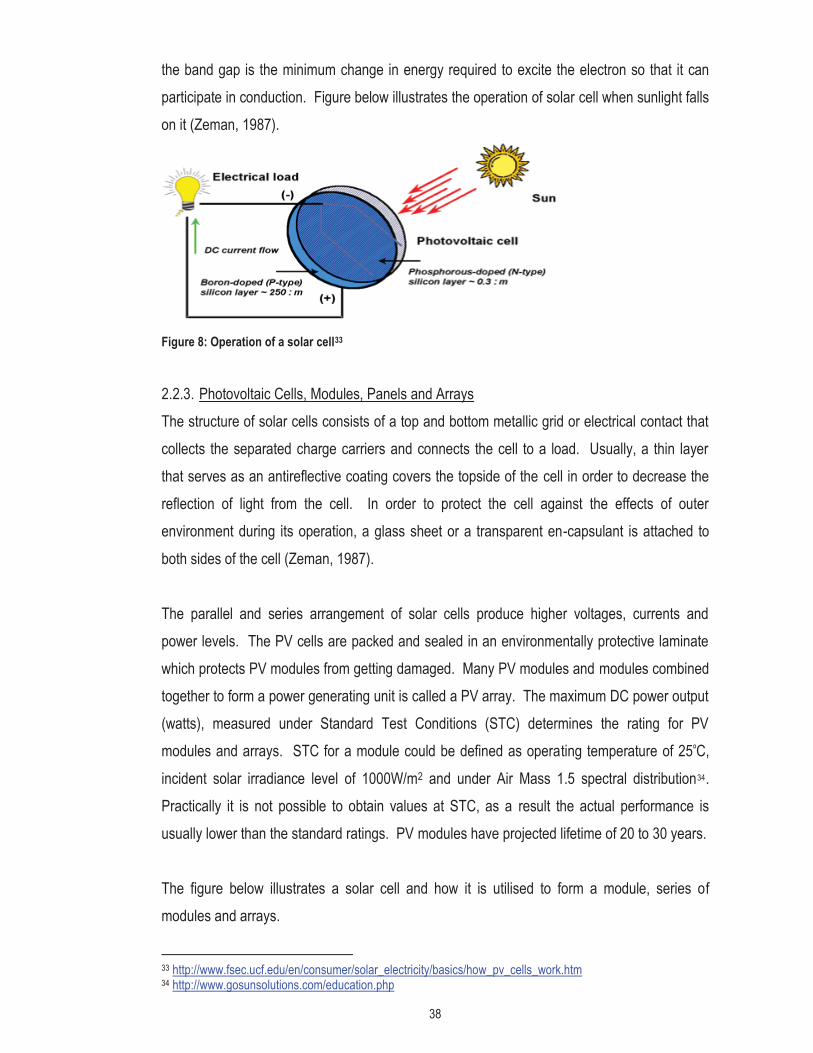
38
the band gap is the minimum change in energy required to excite the electron so that it can participate in conduction. Figure below illustrates the operation of solar cell when sunlight falls on it (Zeman, 1987).
Figure 8: Operation of a solar cell33
2.2.3. Photovoltaic Cells, Modules, Panels and Arrays The structure of solar cells consists of a top and bottom metallic grid or electrical contact that collects the separated charge carriers and connects the cell to a load. Usually, a thin layer that serves as an antireflective coating covers the topside of the cell in order to decrease the reflection of light from the cell. In order to protect the cell against the effects of outer environment during its operation, a glass sheet or a transparent en-capsulant is attached to both sides of the cell (Zeman, 1987). The parallel and series arrangement of solar cells produce higher voltages, currents and power levels. The PV cells are packed and sealed in an environmentally protective laminate which protects PV modules from getting damaged. Many PV modules and modules combined together to form a power generating unit is called a PV array. The maximum DC power output (watts), measured under Standard Test Conditions (STC) determines the rating for PV modules and arrays. STC for a module could be defined as operating temperature of 25ºC, incident solar irradiance level of 1000W/m2 and under Air Mass 1.5 spectral distribution34. Practically it is not possible to obtain values at STC, as a result the actual performance is usually lower than the standard ratings. PV modules have projected lifetime of 20 to 30 years. The figure below illustrates a solar cell and how it is utilised to form a module, series of modules and arrays.
33 http://www.fsec.ucf.edu/en/consumer/solar_electricity/basics/how_pv_cells_work.htm 34 http://www.gosunsolutions.com/education.php
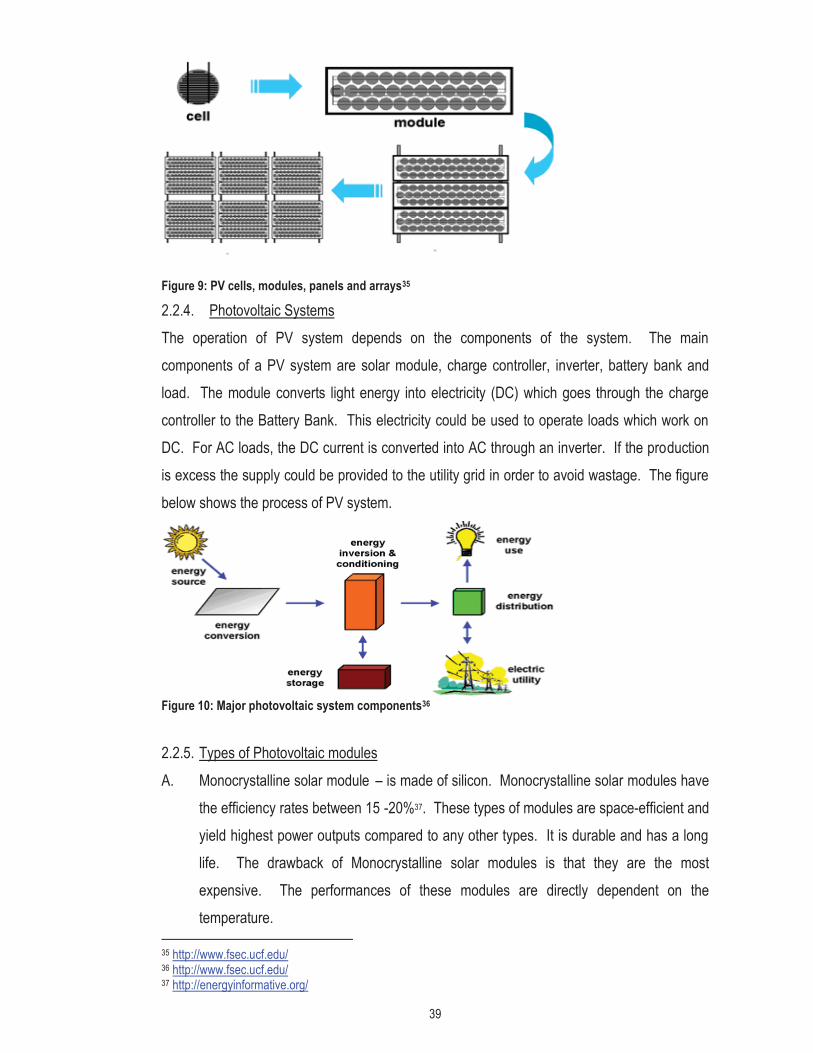
39
Figure 9: PV cells, modules, panels and arrays35
2.2.4. Photovoltaic Systems The operation of PV system depends on the components of the system. The main components of a PV system are solar module, charge controller, inverter, battery bank and load. The module converts light energy into electricity (DC) which goes through the charge controller to the Battery Bank. This electricity could be used to operate loads which work on DC. For AC loads, the DC current is converted into AC through an inverter. If the production is excess the supply could be provided to the utility grid in order to avoid wastage. The figure below shows the process of PV system.
Figure 10: Major photovoltaic system components36
2.2.5. Types of Photovoltaic modules A. Monocrystalline solar module – is made of silicon. Monocrystalline solar modules have
the efficiency rates between 15 -20%37. These types of modules are space-efficient and yield highest power outputs compared to any other types. It is durable and has a long life. The drawback of Monocrystalline solar modules is that they are the most expensive. The performances of these modules are directly dependent on the temperature.
35 http://www.fsec.ucf.edu/ 36 http://www.fsec.ucf.edu/ 37 http://energyinformative.org/

40
B. Polycrystalline solar cells – are simpler and cheaper to make as opposed to Monocrystalline solar cells. However, they have a lower temperature coefficient and performance slightly more than Monocrystalline solar modules at high temperatures. The efficiency of polycrystalline-based solar modules is typically between 13-16%38.
C. Thin-Film solar cells – are manufactured by depositing one or several thin layers of photovoltaic material onto a substrate. These can be categorised as:
� Amorphous silicon (a-Si)
� Cadmium telluride (CdTe)
� Copper indium gallium selenide (CIS/CIGS)
� Organic photovoltaic cells (OPC) Thin-film module prototypes have efficiencies between 7–13% and production modules operate at about 9%39. Advantages of these types of modules are that they make mass-production simple. This makes them cheaper to produce than polycrystalline solar cells. Also, performance is not hindered much due to shades or high temperatures. Thin-Film solar modules, however, produce less power than monocrystalline solar cells. Other disadvantages are that they are not very useful in most residential situations and require a lot of space even though they are cheap. In addition, thin-film solar modules worsen faster than the other types of modules mentioned, thus, the shorter warranty.
D. Dye sensitized solar cells (DSSC) - are third generation PV cells which enable users to transform light into energy that can be used to power a range of electronic devices as well as outdoors. It works in the following manner40.
� The dye is the photoactive material of DSSC, and can produce electricity once it is sensitized by light
� The dye catches photons of incoming light (sunlight and ambient artificial light) and uses their energy to excite electrons, behaving like chlorophyll in photosynthesis
� The dye injects this excited electron into the Titanium Dioxide (a white pigment commonly found in white paint)
� The electron is conducted away by nanocrystalline titanium dioxide (a nano-scale crystallized form of the titanium dioxide).
38 http://energyinformative.org/best-solar-panel-monocrystalline-polycrystalline-thin-film/ 39 http://energyinformative.org/best-solar-panel-monocrystalline-polycrystalline-thin-film/ 40 http://gcell.com/dye-sensitized-solar-cells

41
� A chemical electrolyte in the cell then closes the circuit so that the electrons are returned back to the dye
� It is the movement of these electrons that creates energy which can be harvested into a rechargeable battery, super capacitor or another electrical device.
2.2.6. Types of Photovoltaic Systems A. Grid Connected Photovoltaic System:
Grid connected PV systems are connected to an inverter or power conditioning unit (PCU). The inverter converts the DC power produced by the module into AC which is used to operate appliances that work in AC. Excess electricity is sent to the grid. A bidirectional interface is made between the PV system AC output circuits and the electric utility network, typically at an on-site distribution module or service entrance. This allows the AC power produced by the PV system to either supply on-site electrical loads or to back-feed the grid when the PV system output is greater than the on-site load demand. At night and during other periods when the electrical loads are greater than the PV system output, the balance of power required by the loads is received from the electric utility. This anti-islanding feature is required in all grid-connected PV systems, and ensures that the PV system will not continue to operate and feed back into the utility grid when the grid is down for service or repair. The schematic diagram below explains the process.
Figure 11: Diagram of grid-connected PV system
B. Stand-Alone Photovoltaic Systems a) Direct Coupled Photovoltaic Systems
A direct coupled PV system is a system where the DC output of a PV module is directly connected to a DC load. The system does not have energy storage (Battery) and the
PV Array Inverter/Power Conditioner
AC Loads
Distribution Module
Electric Utility

42
load only operates during sunlight hours. The schematic diagram below explains the process.
Figure 12: Direct coupled PV system
b) Indirect coupled Photovoltaic Systems
PV systems that use a battery bank to store energy to power DC and AC loads. The figure below shows a diagram of a stand-alone PV system powering DC and AC loads.
Figure 13: In-direct coupled PV system Solar Home Systems (SHSs) is a particular case of indirect coupled PV systems. SHS consists of components such as a solar module, charge controller/regulator, a battery, and electrical loads. The advanced SHS has features which enable it to run a television set, music systems, fans, radios and so forth. The additional features simply mean higher watt capacity which raises the price of the system. The SHS is normally designed to provide power for up to 6 hours. Each component of SHS has a specific function as outlined below:
i. Charge Controller A charge controller works as a regulator that manages the flow of electricity between the module, battery and the loads. It provides protection to the battery since it controls the charge levels in the system. It works on a cut-off system, that is, if the charge rate drops below a certain level it will cut-off the current to the loads to avoid further discharge. In case of overcharging, it will cut the current from the module. Some SHSs do not have an external charge controller. It is built into the system instead. There is
PV Array DC Load
PV Array Charge Controller
Battery
DC Load
Inverter
AC Load

43
an indicator light to display the state of charge of the battery. The consequence of not following the indication by device can lead to overuse of the battery. In rural areas, the presence of the charge controller built into the system prevents overuse of the battery, especially when there is inadequate training.
ii. Battery A battery is an electrochemical device that stores chemical energy and converts it into electricity when there is a demand (Chow, 2010). Batteries are susceptible to changes in temperature, climate, age, and so forth. Performance is affected likewise. Batteries are of different types and the common ones are lead-acid, NiMH and Lithium-ion batteries. The capacity of a battery is determined in ampere hours (Ah). Batteries are rated according to their "cycles". Batteries can have shallow cycles with depth of discharge (DoD) of 10% to 15%, or deep cycles with DoD up to 50% to 80%41.
iii. Loads Loads are electrical appliances connected to the battery. Each load will have certain rated power that will utilise equivalent amount of energy from the battery. Usually home electrical appliances are AC powered and the energy from the system is DC. An inverter is used to convert the DC to AC in order to run the appliances that work on AC. Normally an inverter is not included in SHSs due to cost and system abuse concerns (Chow, 2010). Some of the appliances that an SHS can run are CFL and LED lights, radios, portable DVD players, TVs and such that are connected into the 12V DC SHS circuit. DC SHSs are cheap and easy to install due to low power requirements.
iv. Balance of system components According to (Chow, 2010), all other SHS systems components not included in the above main categories are termed balance of system (BOS) components. These include module installation posts, mounts, hardware, wires, switches, circuit breakers, fuses, installation tools, digital multi-meters, future maintenance items, lightening protection, grounding, and such.
2.2.7. Solar Lighting Systems (SLSs) part of the SHSs The present project focuses on small SLSs which are a part of the SHS family. They have all the components mentioned above built into a compact structure. SLSs work as a bridge between the traditional fuel based lighting systems and electric grid (Sharma, 2011). They have become popular in developing countries due to their low cost, robustness and low energy 41 http://www.researchgate.net/post/What_are_the_main_characteristics_of_stoarge_devices_batteries

44
consumption. They are compact and more affordable when compared to other technologies. There are numerous commercially available solar off-grid products with different charging and storage technologies (Sharma, 2011). These products are commonly used for ambient lighting, as flashlights, and also for task lighting in both commercial and domestic applications. These small portable products use solar modules to charge a small battery that runs the lighting device. Furthermore, many of these products have been designed to incorporate grid charging as an additional feature. The development and commercialisation of these products has increased the access of affordable and clean lighting technologies to low income households. The market for off-grid solar power in developing countries has experienced sustained growth over the past 30 years (Mints, 2010). Due to socioeconomic reasons there is a tremendous demand in developing nations for clean and affordable lighting options. Installing off-grid PV has become more cost-effective than grid connected and diesel generator based systems though such calculations vary according to the location, the quality of the PV resource, the cost of fuel, the type of system, and other factors (Sharma, 2011). In Ethiopia, researchers discovered that off-grid SHS systems were considerably more profitable than installing on-grid PV in more developed nations; though the smaller size of the systems means that more individual systems must be sold to realize similar revenue (Sharma, 2011). However, while costs over time are often lower, the up-front cost of installing PV systems is higher than that for diesel generators. PV systems could contribute towards financial improvement for the families by reducing cost of purchasing fuel and dry cell batteries. The cost on fuel and batteries for running a few lamps and a radio takes the, considerable portion of the family budget. Furthermore, purchasing kerosene and batteries can often mean lengthy shopping trips and long waits to replenish supplies, and even then, there can be issues with availability.
2.3. Quality Assurance It is important to find out the best and the most efficient product amidst the huge market for the solar off grid products that currently exists. For instance, the variable quality of low cost lighting devices is a cause for concern and a limitation to the growth in the off-grid lighting market. Regulatory control over the quality of the products entering the market would help

45
reduce this problem. A lot of effort has been placed to develop standards and requirements to evaluate the quality of off-grid lighting products in the market over the past few years. The Lighting Global program supports the sustainable growth of the international off-grid lighting industry by providing energy access to the users who do not have the luxury of grid electricity. As part of the program, the International Finance Corporation (IFC) and the World Bank work with the Global Off-Grid Lighting Association (GOGLA), manufacturers, distributors, and other development partners to develop the off-grid lighting market. It further provides market insights, steers development of quality assurance frameworks for modern, off-grid lighting devices and systems and promotes sustainability, in partnership with the industry42. Lighting Global program supports the growing global market for modern off-grid lighting with a widely applicable, robust Quality Assurance (QA) framework, which is based on the guiding principles such as; Affordability – to support an appropriate balance between product cost, quality, and performance, Diversity & Innovation – to encourage product diversity and innovation with non-prescriptive, outcomes-based benchmarks, Rigor & Accessibility – to use rigorous tests that can be carried out with reasonably low-cost instruments, stability to maintain stable and transparent policies so stakeholders know what to expect and Insight - to effectively communicate key product quality and performance information to buyers43.
Likewise, various other Institutes like the Schatz Energy Research Center (SERC), National Lighting Test Center (NLTC), Fraunhofer Institute for Solar Energy Systems (Fraunhofer ISE), (IEC), and so forth have been working on developing test procedures and standards for the measurement and verification of various aspects of off-grid lighting products through the Lighting Africa Program (Mendonca, 2012). This program assists in improving the market for off-grid lighting products in Africa. The goal of the program is to create a market for good quality and affordable off-grid lighting products for low-income consumers. One of the initiatives of the Lighting Africa program is the development of a quality assurance framework for off-grid lighting products known as Lighting Africa Quality Test Method (LAQTM) (Mendonca, 2012). The name of the framework is the Lighting Global Quality Assurance Protocol and it aims to expedite the development of commercial off-grid lighting markets in Africa, Asia, and beyond as part of the World (Lighting Global, 2012). Similarly, the
42 http://www.lightingglobal.org/ 43 https://www.lightingglobal.org/qa/

46
Fraunhofer ISE has also developed a Stand-Alone LED Lighting Systems Quality Screening standard, similar to the LAQTM, for testing various lighting systems. Both, the Fraunhofer Test Method and LAQTM, presents a quality assurance framework that includes test methods, product specifications and standardised specifications sheets. Any lighting product should fulfill the stipulated test requirements, that is, product design, manufacture, and marketing aspects, product durability and workmanship aspects, lighting durability aspects, battery performance aspects, solar module aspects, run time aspects, light output aspects, circuit efficiency aspects, self-certification aspects and integrated assessment (Lighting Global, 2012). The Lighting Global program has also given birth to the Lighting Asia and Lighting Pacific programs that provide similar support as Lighting Africa program to the Asia Pacific region. For the purpose of this thesis, the Fraunhofer test method has been used.
2.4. Comparison between Incandescent, CFL and LED light bulbs 2.4.1. System Efficacy
When calculating the total efficacy of a SHS, efficacies and/or efficiencies of all of its individual components must be taken into consideration. The calculation is relevant to the size of the SHS. The total system efficacy of a lighting system is associated with the efficacy of the light source and the efficiencies of the other system components. For the light source, one must consider the following44: A. Lumen (lm) package - total light output of the light source B. Power requirements - total watts required to power the light source C. System efficacy - efficacy of the light source and any ballast or driver needed to
operate it D. Environmental issues - impacts the system will have on the environment such as
disposal of components and reduction in atmospheric pollution from lower power plant emissions
E. Climate - effect of high or low temperatures on the light source's light output and life
44 http://www.lrc.rpi.edu/programs/nlpip/lightingAnswers/photovoltaic/15-photovoltaic-efficacy.asp

47
F. Lumen maintenance - ability of the light source to sustain its light output over time
G. Life of the light source - amount of time over which the light source will operate reliably
Since there is a rapid evolution of LED technology, efficiency is also expected to rise considerably. LED is considered to be a mature technology when compared to Incandescent and fluorescent lamps. It is an established and effective tool for delivering quality lighting solutions that requires extremely low or no maintenance and delivers excellent efficacy (Energy efficient lighting technology report, 2014). The following table demonstrates the general overall efficiency of different light sources.
Table 5: Efficacy values for different types of lights (Energy efficient lighting technology report, 2014)
Category Type Overall luminous efficacy (lm/W)
Overall luminous efficiency
(%) Incandescent 100–200 W tungsten incandescent (220 V) 13.8 – 15.2 2.0 – 2.2
100–200–500 W tungsten glass halogen (220 V)
16.7 – 19.8 2.4 – 29
5–40–100 W tungsten incandescent (120 V)
5.0 – 17.5 0.7 – 2.6
2.6 W tungsten glass halogen (5.2 V) 19.2 2.8 Tungsten quartz halogen (12–24 V) 24.0 3.5 Photographic and projection lamps
Light emitting diodes (LED)
White LED (raw, without power supply) 4.5 – 200.0 0.66 – 22.0
4.1 W LED screw base lamp (120 V) 58.5 – 82.9 8.6 – 12.0 6.9 W LED screw base lamp (120 V) 55.1 – 81.9 8.1 – 12.0 7 W LED PAR20 (120 V) 28.6 4.2 8.7 W LED screw base lamp (120 V) 69.0 – 93.1 10.1 – 13.6
Fluorescent lamps
T12 tube with magnetic ballast 60.0 9.0 9–32 W compact fluorescent 46.0 – 75.0 8.0 – 11.4 T8 tube with electronic ballast 80.0 – 100.0 12.0 – 15.0 T5 tube 70.0 – 104.2 10.0 –15.6
High intensity discharge (HID)
Metal halide lamp 65.0 – 115.0 9.5 – 17.0 High pressure sodium lamp 85.0 – 150.0 12.0 – 22.0 Low pressure sodium lamp 100.0 – 200.0 15.0 – 29.0

48
Chapter 3 – Methodology The methodology is divided into two parts, the first is the experimental part which is carried under standard conditions and the second is the survey carried out in the 4 remote areas of Fiji. The project commenced with the collection of the range of literature available on web and in the USP library. Each article and paper was analysed according to the objective of the study and relevant information was collated as the literature review of the study. The focus of this study is on the usage of SLSs in Fiji and to determine the characteristic of systems available in Fiji. The study began with a visit to various retail shops such as Clay Energy, CBS Power Solutions, S250, Dick Smith Universal Electronics (currently known as JAYCAR Electronics) and Glitz to purchase the samples of SLSs available in Fiji. These lighting systems could be categorised into Ambient lights, Task lights and Portable lights. The table below shows the type of solar lights that were purchased for testing purposes. Table 6: Sample SLSs tested
# Name Common Features
1 Sun King Pro45
� 1 W power LED with heat sink � Minimum luminous flux: 120 Lumens. � Life of 15,000 hours � Battery-Lithium Ferro-Phosphate (LFP) 6.6
V, 1450 mAh, 2000 cycles at 100% depth of discharge
� Solar Panel - 2.5 Wp, 7.8 V polycrystalline solar module with 5-meter wire. Industrial-grade glass/aluminium framing
� Enclosure - Polycarbonate and ABS, IP54 rated, water-sealed enclosure with additional sliding cover and rubber gasket to protect electrical charging ports
� Microprocessor-based active charge controller prevents over-charging or deep discharge of battery
� Smart battery management technology automatically switches out of high power modes when battery is running low, giving users 5 additional hours of low power light
45 http://glenergy.ca/products/sun-king-pro

49
2 Nokero Light46
� Durable � Rainproof � Rechargeable battery lasts approximately
1.5 - 2 years � Portable � Simple to use � AA-sized recyclable battery � Automatically switches off in bright light to
save charge � 4 LEDs � Solar Powered � 3 Modes - High, Low, Off
3 Dlight S25047
� Bright and Durable � Charged through AC Power Grid � High Performance LiFePO4 Battery � Efficient Portable Solar Panel � 4 Modes - Low, Medium, High and sleep. � Overcharge Protection � Mobile Charger � 85 Lumens � LED Lighting � Solar Powered � Charging Indicator � Over Discharge Protection
4 Dlight Kiran48
� Two brightness settings o 4 Hours on High o 8 Hours on Medium
� > 5 Year Lifetime � No Battery Replacements Needed � Integrated Solar Panel � Dual Solar and AC Charging � Full Charge from Solar/AC – 8 Hours � Battery Charge Level Indicator � 3 modes medium, high and off
46 http://www.chylan.ca/crestone-solar-light-bulb.html 47 http://www.epaal.com/index.php?route=product/product&product_id=84 48 http://yusud.org/solarsystems.html
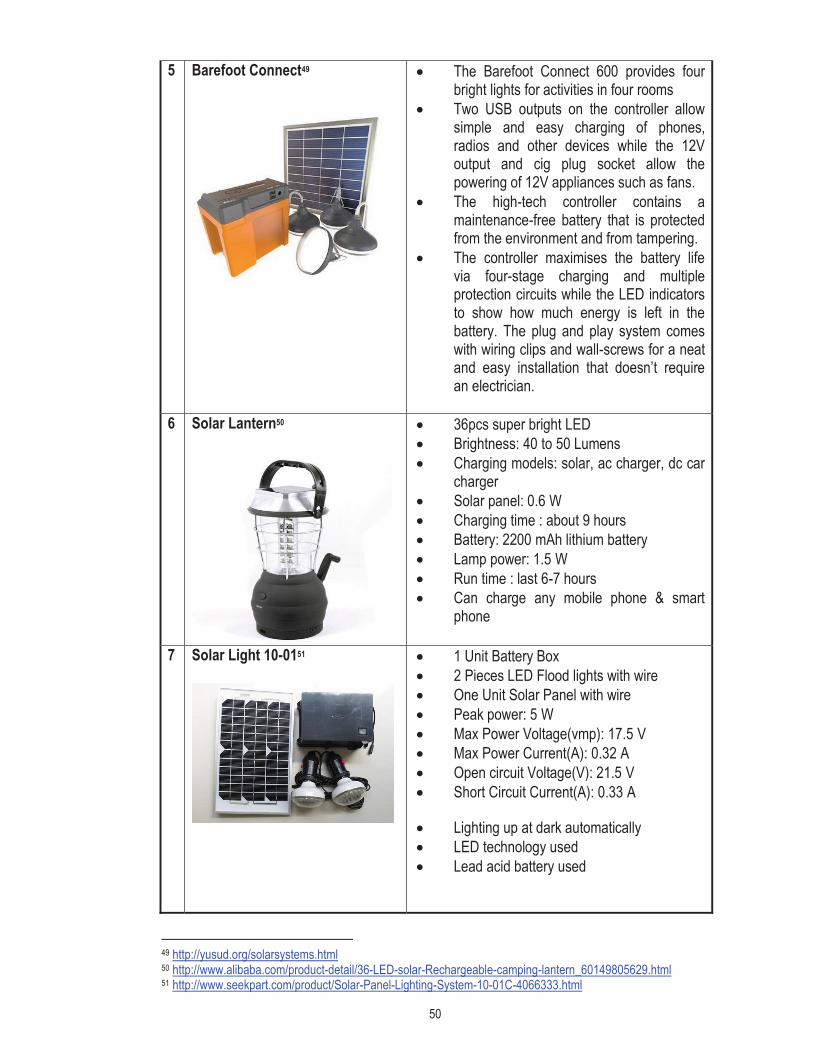
50
5 Barefoot Connect49
� The Barefoot Connect 600 provides four bright lights for activities in four rooms
� Two USB outputs on the controller allow simple and easy charging of phones, radios and other devices while the 12V output and cig plug socket allow the powering of 12V appliances such as fans.
� The high-tech controller contains a maintenance-free battery that is protected from the environment and from tampering.
� The controller maximises the battery life via four-stage charging and multiple protection circuits while the LED indicators to show how much energy is left in the battery. The plug and play system comes with wiring clips and wall-screws for a neat and easy installation that doesn’t require an electrician.
6 Solar Lantern50
� 36pcs super bright LED � Brightness: 40 to 50 Lumens � Charging models: solar, ac charger, dc car
charger � Solar panel: 0.6 W � Charging time : about 9 hours � Battery: 2200 mAh lithium battery � Lamp power: 1.5 W � Run time : last 6-7 hours � Can charge any mobile phone & smart
phone
7 Solar Light 10-0151
� 1 Unit Battery Box � 2 Pieces LED Flood lights with wire � One Unit Solar Panel with wire � Peak power: 5 W � Max Power Voltage(vmp): 17.5 V � Max Power Current(A): 0.32 A � Open circuit Voltage(V): 21.5 V � Short Circuit Current(A): 0.33 A
� Lighting up at dark automatically � LED technology used � Lead acid battery used
49 http://yusud.org/solarsystems.html 50 http://www.alibaba.com/product-detail/36-LED-solar-Rechargeable-camping-lantern_60149805629.html 51 http://www.seekpart.com/product/Solar-Panel-Lighting-System-10-01C-4066333.html
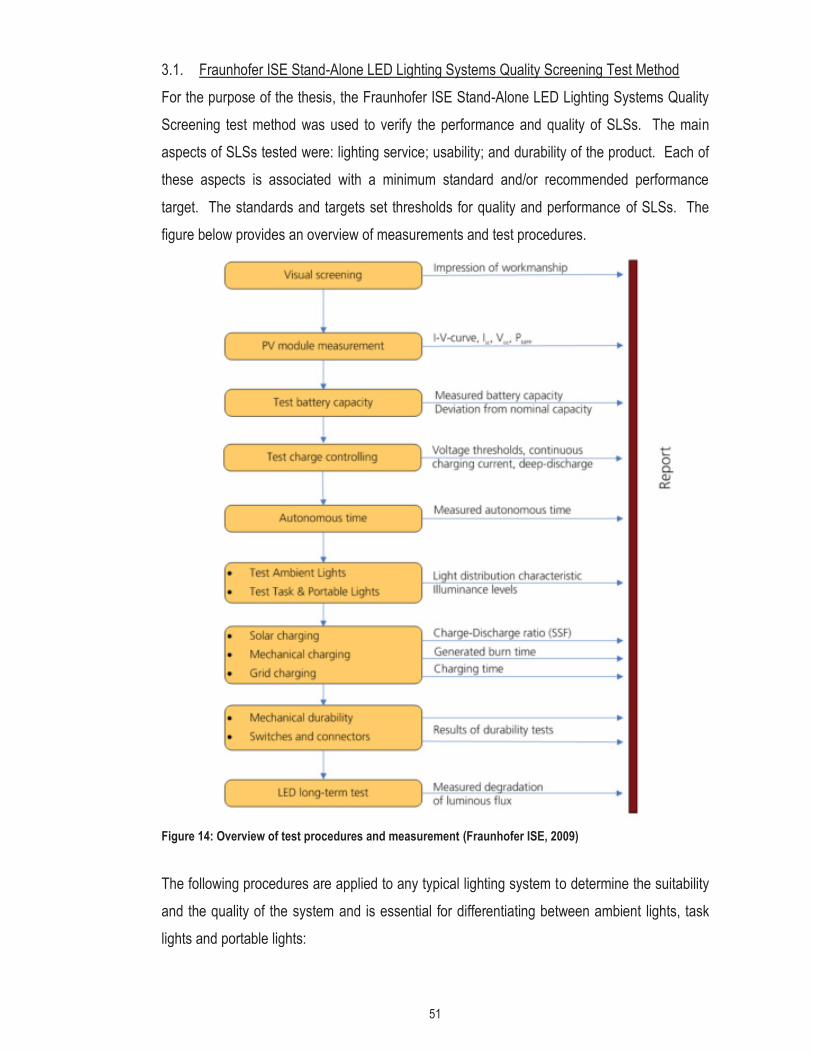
51
3.1. Fraunhofer ISE Stand-Alone LED Lighting Systems Quality Screening Test Method For the purpose of the thesis, the Fraunhofer ISE Stand-Alone LED Lighting Systems Quality Screening test method was used to verify the performance and quality of SLSs. The main aspects of SLSs tested were: lighting service; usability; and durability of the product. Each of these aspects is associated with a minimum standard and/or recommended performance target. The standards and targets set thresholds for quality and performance of SLSs. The figure below provides an overview of measurements and test procedures.
Figure 14: Overview of test procedures and measurement (Fraunhofer ISE, 2009)
The following procedures are applied to any typical lighting system to determine the suitability and the quality of the system and is essential for differentiating between ambient lights, task lights and portable lights:

52
A. Lighting Services Lighting service tests measure the quality of light that the SLS gives, for example light distribution and luminous flux measurements. The measurement of luminous flux is mostly used for characterising ambient lights. Two methods are frequently used to assess luminous flux and efficacy. One involves integrating the light intensity of a SLS over the whole solid angle (Goniophotometry). The other, (simpler) method uses a sphere for integration of the luminous flux (Integrating Sphere Measurement). SLSs can be classified in three categories according to their characteristics. The first group consists of ambient lights, which are used to light up the surroundings. High luminous flux is therefore needed, in rooms with low reflectance walls and ceilings, and the light flux must be spread over a wide angle. The second group comprises task lights, intended to illuminate a limited area for working. These lights are usually placed on the working surface, e.g. a table or workbench. In cases where the light output can be concentrated to achieve a small spot of high intensity, the light can also be used as a torch (portable light). In the third group, portable lights represent a different class of lighting systems. It mainly includes torches and flashlights, but also “multipurpose” lights which can be switched into torch-mode. They are mainly intended for mobile usage. Their job is to produce a bright spot of light at a long distance. Depending on the size of the spot and the brightness, they also can be used as task lights. They are not (normally) suitable for ambient lighting. The figure below is an example that shows light distribution pattern for different SLSs.
Figure 15: Light distribution characteristics of different SLSs (Fraunhofer ISE, 2009)
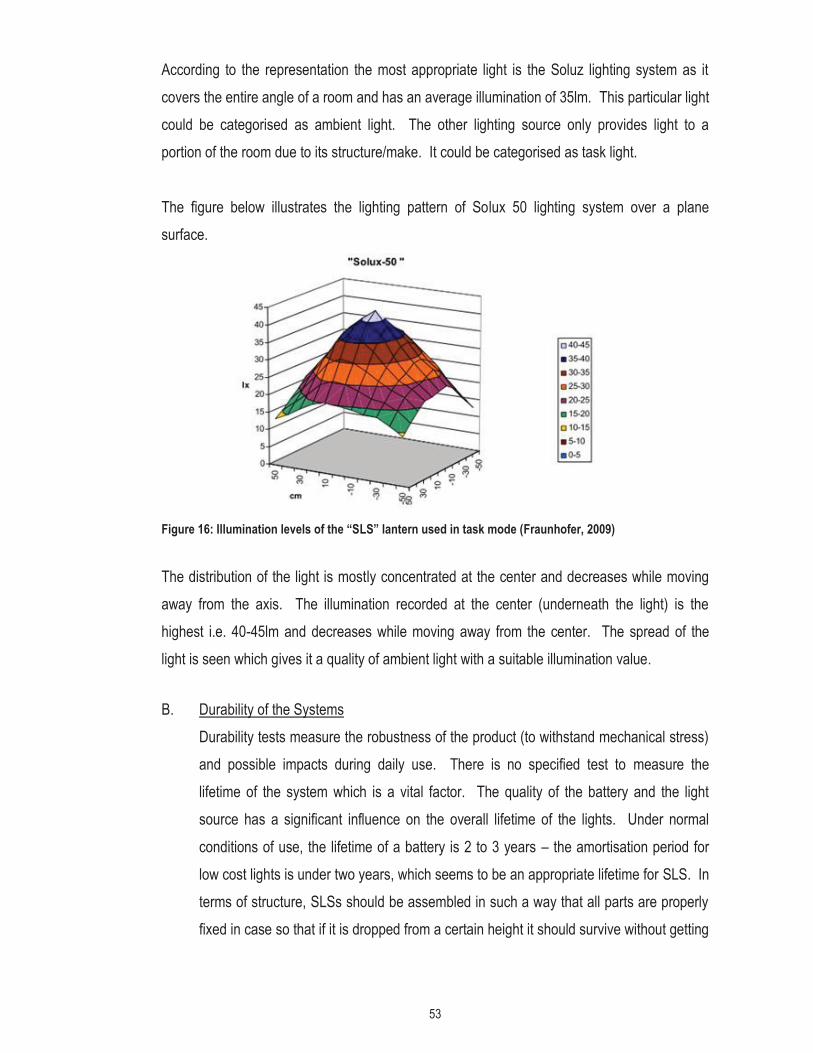
53
According to the representation the most appropriate light is the Soluz lighting system as it covers the entire angle of a room and has an average illumination of 35lm. This particular light could be categorised as ambient light. The other lighting source only provides light to a portion of the room due to its structure/make. It could be categorised as task light. The figure below illustrates the lighting pattern of Solux 50 lighting system over a plane surface.
Figure 16: Illumination levels of the “SLS” lantern used in task mode (Fraunhofer, 2009)
The distribution of the light is mostly concentrated at the center and decreases while moving away from the axis. The illumination recorded at the center (underneath the light) is the highest i.e. 40-45lm and decreases while moving away from the center. The spread of the light is seen which gives it a quality of ambient light with a suitable illumination value.
B. Durability of the Systems Durability tests measure the robustness of the product (to withstand mechanical stress) and possible impacts during daily use. There is no specified test to measure the lifetime of the system which is a vital factor. The quality of the battery and the light source has a significant influence on the overall lifetime of the lights. Under normal conditions of use, the lifetime of a battery is 2 to 3 years – the amortisation period for low cost lights is under two years, which seems to be an appropriate lifetime for SLS. In terms of structure, SLSs should be assembled in such a way that all parts are properly fixed in case so that if it is dropped from a certain height it should survive without getting
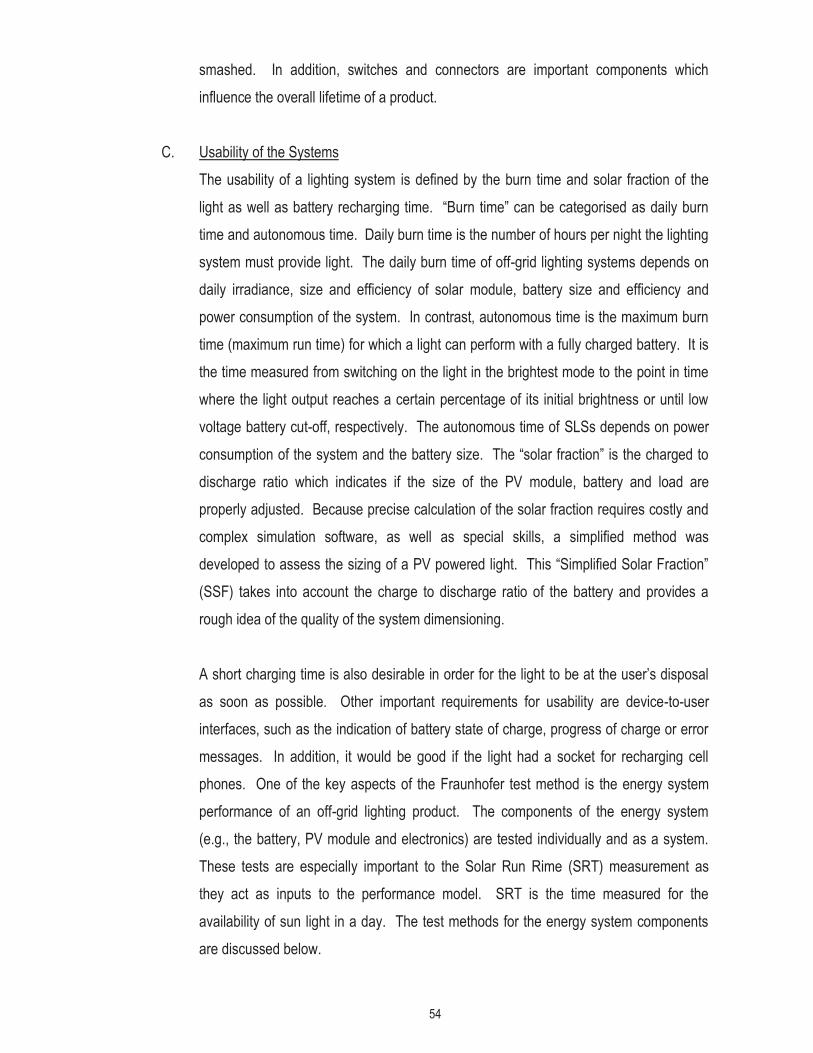
54
smashed. In addition, switches and connectors are important components which influence the overall lifetime of a product.
C. Usability of the Systems The usability of a lighting system is defined by the burn time and solar fraction of the light as well as battery recharging time. “Burn time” can be categorised as daily burn time and autonomous time. Daily burn time is the number of hours per night the lighting system must provide light. The daily burn time of off-grid lighting systems depends on daily irradiance, size and efficiency of solar module, battery size and efficiency and power consumption of the system. In contrast, autonomous time is the maximum burn time (maximum run time) for which a light can perform with a fully charged battery. It is the time measured from switching on the light in the brightest mode to the point in time where the light output reaches a certain percentage of its initial brightness or until low voltage battery cut-off, respectively. The autonomous time of SLSs depends on power consumption of the system and the battery size. The “solar fraction” is the charged to discharge ratio which indicates if the size of the PV module, battery and load are properly adjusted. Because precise calculation of the solar fraction requires costly and complex simulation software, as well as special skills, a simplified method was developed to assess the sizing of a PV powered light. This “Simplified Solar Fraction” (SSF) takes into account the charge to discharge ratio of the battery and provides a rough idea of the quality of the system dimensioning. A short charging time is also desirable in order for the light to be at the user’s disposal as soon as possible. Other important requirements for usability are device-to-user interfaces, such as the indication of battery state of charge, progress of charge or error messages. In addition, it would be good if the light had a socket for recharging cell phones. One of the key aspects of the Fraunhofer test method is the energy system performance of an off-grid lighting product. The components of the energy system (e.g., the battery, PV module and electronics) are tested individually and as a system. These tests are especially important to the Solar Run Rime (SRT) measurement as they act as inputs to the performance model. SRT is the time measured for the availability of sun light in a day. The test methods for the energy system components are discussed below.

55
D. Component Level Tests a. Battery
The battery is tested for its capacity in ampere-hours (Ah). The test involves cycling the battery through a number of charge and discharge tests using a battery analyser. There are different test procedures for different types of batteries under the Fraunhofer test method. For example, a nickel metal hydride battery undergoes a conditioning process of three cycles of charge and discharge before the battery capacity test. This cycling is not included in the test for sealed lead acid batteries. The battery capacity is determined by measuring the ampere-hours delivered by the battery after receiving a full charge. The measured capacity is compared to the rated capacity to determine if the battery is damaged or if the rating is correct.
b. PV module The PV module is tested for its rated power and to determine the characteristic current-voltage (I-V) curve. Besides the maximum rated operating power point of the PV module, the curve determines the open circuit voltage and short circuit current for the module. This information is used to determine if the PV module is damaged or if the rating is correct. The test is conducted using an I-V curve analyser that records the module current and voltage over the full range of loads. Using the I-V curves, various module parameters like the Fill Factor (FF) and efficiency could be determined.
c. Charge controller The lighting device is examined to determine if it has a deep discharge or over voltage protection built into the charge controller. This is important for safety of the lighting device and to increase the life of the battery. Under this test, the lamp of the lighting device discharges the battery and the voltage is monitored to ensure that the product has low voltage protection. In order to maintain a minimum recommended voltage, the charge controller must have a built-in low voltage disconnect (LVD) circuit. Similarly when a maximum allowable voltage is reached for a particular battery, an over voltage protection (OVP) device must prevent the battery from receiving any additional charge. There are specific recommendations for the OVP and LVD for different battery chemistries.
56
E. System Level Tests These tests include a combination of two or more components of the energy system of the lighting product. The Fraunhofer test methods are described in the subsections below.
a. Autonomous Runtime (ART) Test The autonomous runtime of the product is defined as the number of hours the lighting product will run on a fully charged battery until it reaches seventy percent of the initial light output. The ART is a key metric for assessing the lighting product performance. The test combines the battery capacity and the energy required to run the light and informs the user about product usability. The test involves running the light with a fully charged battery and measuring the variation in the luminous flux of the lighting product. The time that it takes the flux value to reach 70% of its initial value is reported as the ART of the lighting product.
Figure 17: Autonomous Runtime for SLS (Fraunhofer ISE, 2009)
The graph illustrates the performance of the SLS. The flat portion of the graph indicates that the system is a good system since it maintains its illumination level for a longer period of time. In the above case it maintains its illumination for approximately 200 minutes which is above 3 hours. The light intensity for 3 hours does not drop keeping the surface bright and visible.
b. SRT Calculation The daily solar runtime (SRT) is estimated using a model for predicting the daily runtime of a solar off-grid lighting device given a certain number of sun hours in the day. It is an important parameter in the performance evaluation since it informs the consumer about the usability of a lighting product by combining the performance and capacity of different components within the device. The efficiency of various components (PV module,

57
battery and electronics) in the lighting product determines what fraction of the incident energy is stored and used to run the light source. The solar runtime estimation model combines these efficiencies, the battery capacity, and the PV module rating to estimate the hours of operation of a lighting product in the night.
c. Evaluating the PV charge behavior of a lighting product A solar lighting product must have its PV module, battery and lamp sized appropriately to give the best results as a system. To understand this interaction the SRT and SSF of a lighting product are estimated. The SSF is simply the ratio of the daily charge to the daily discharge of a product (in amp-hours) as a percentage.
(1)
Where: Daily Charge is the amount of charge received from the solar module into the battery in ampere hours Daily Discharge is the amount of discharge from the battery to the lamp in ampere-hours A SSF value close to one hundred percent indicates that the PV module is sufficiently sized to charge the battery of the lighting product in one solar day. However, a SSF value that is much lower or higher than hundred percent can provide information about a mismatch between the solar module and the battery chosen for the lighting product.
3.2. Photovoltaic Module I-V Characteristic Curve The sample SLSs were tested at field conditions. The amount of solar energy converted into electric energy by a PV module is dependent on the spectral distribution of sun light, the total irradiance and the cell temperature (Fraunhofer ISE, 2009). The irradiance sensor along with the sun dial was used to determine the effective solar irradiance. For establishing a base of comparison between different modules, the following values were adopted as standard for the I-V curve determination:
� Irradiance = 1000W/m2
� Temperature = 25ºC
� Spectral distribution = AM1.5 (air mass 1.5) The air mass index is the relative thickness of the atmosphere, i. e., the radiation path length through the atmosphere considering the zenith path at sea level as unity. AM1.5 is obtained when the angle formed by the zenith and the line of sight to the Sun is about 48º.
58
Nevertheless, while in operation the modules are normally not under standard condition. So another condition was defined, named "normal operation condition, which presents the following values (Fraunhofer ISE, 2009):
� Irradiance = 800W/m2
� Ambient temperature = 20ºC
� Wind speed = 1m/s
� Spectral distribution = AM1.5 In this case the temperature of the photovoltaic cells will depend on the ambient temperature, speed of the wind and the module thermal performance. Using an inclinometer, angle of inclination for the module was set to 18º for Suva, Fiji. The tests were taken in clear sky days in order to get the irradiance and spectral distribution values as close as possible to the standard condition. The module temperature was sensed by an Infrared Thermometer. The thermometer was pointed to the front surface of the module to record the module temperature. A multi-meter was connected to the module to measure Voc and Isc. Using the Battery/PV Analyser and the CBA software the IV curve was plotted and data was also exported to MS Excel. The rated and measured value for ISC, VOC, IMP, VMP, Pmax, FF, and Efficiency (η) were tabulated for different modules to predict the best performing module. The module efficiency (η) and fill factor was determined by the following equations:
(252)
(3)
Instruments that were used to conduct the experiment are given below.
52 http://www.civicsolar.com/forum/11815/how-do-you-calculate-efficiency-solar-panel

59
Table 7: Instruments used to carry out the experimental part of the thesis
Instrument Used Function
1. Irradiance Sensor (Daystar DS-05A)53
Irradiance Sensor provides an accurate reading (3%) from 0 - 1200 W/m2 when pointed at the sun, has a 0.75 inch with the 9V battery. The meter uses a polycrystalline silicon PV cell as the sensor. The cell is mounted on the top end of the meter, perpendicular to the display. The sensor responds to a spectrum bandwidth of approximately 0.3-1.1 microns. The meter is intended for outdoor measurements of natural sunlight. The meters are designed for use in the field but you should handle them carefully.
2. Infrared Thermometer (EXTECH IR400)54
Infrared Thermometer measures the cell and module temperature using infrared pointer. The temperature range for the meter ranges from -20 to 332°C. It has a field of view that is distance to target ratio is 8:1. The thermometer has a built-in laser pointer that identifies target area and improves aim. There is an automatic data hold when the trigger is released. A 9V battery is used to make the thermometer work.
3. Battery/PV Analyser West Mountain Radio CBA IV-PRO55
The Battery/PV Analyser measures module and battery characteristics using computer software. It performs battery capacity tests for any type of battery and automatically pre-sets for NiCad, NiMH, Lead Acid, Li Ion, Li Poly, Alkaline, Carbon Zinc, Mercury batteries. The results are graphically displayed. It uses solid state switch and fan cooled electronic load. The analyser is capable of doing solar cell profiling and can test lower current down to 10mA. It is very safe to use the analyser since it has automatic voltage shut off and automatic over temperature shut off feature. The software of the analyser saves display and print battery/module test graphs and battery labels.
53 http://www.gogreensolar.com/products/daystar-ds-05a-solar-digital-meter 54 http://www.extech.com/instruments/product.asp?catid=62&prodid=670 55 http://www.westmountainradio.com/product_info.php?products_id=cba4
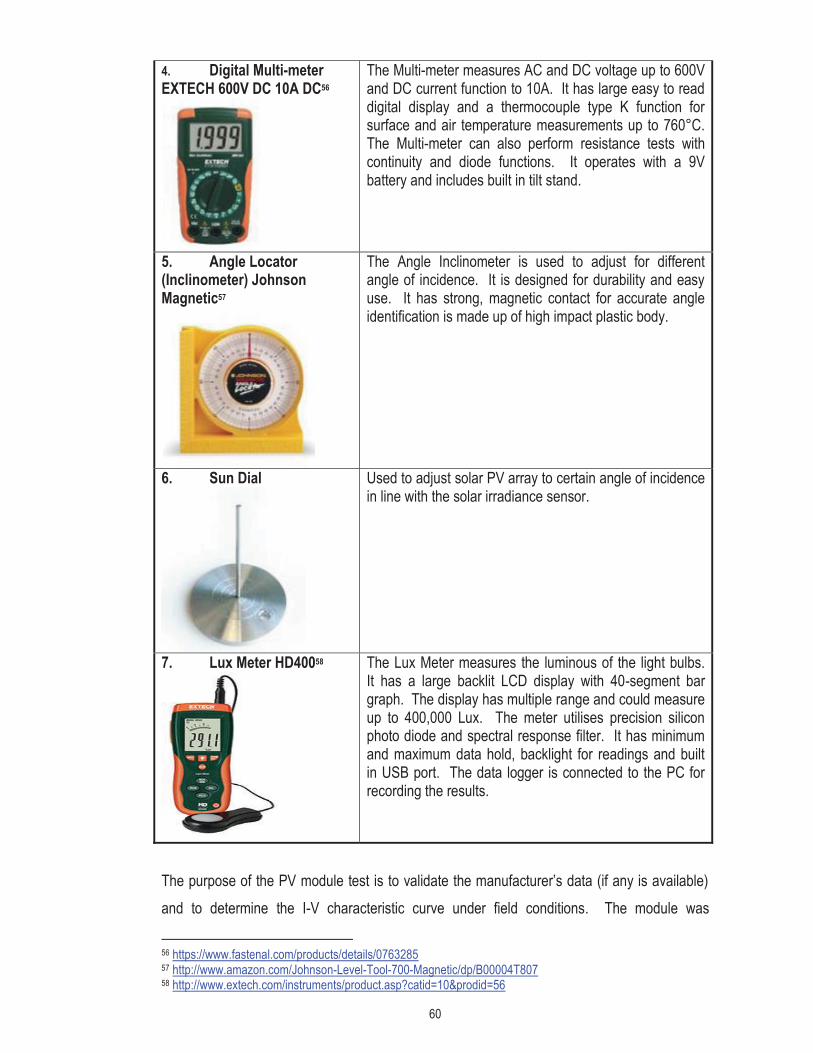
60
4. Digital Multi-meter EXTECH 600V DC 10A DC56
The Multi-meter measures AC and DC voltage up to 600V and DC current function to 10A. It has large easy to read digital display and a thermocouple type K function for surface and air temperature measurements up to 760°C. The Multi-meter can also perform resistance tests with continuity and diode functions. It operates with a 9V battery and includes built in tilt stand.
5. Angle Locator (Inclinometer) Johnson Magnetic57
The Angle Inclinometer is used to adjust for different angle of incidence. It is designed for durability and easy use. It has strong, magnetic contact for accurate angle identification is made up of high impact plastic body.
6. Sun Dial
Used to adjust solar PV array to certain angle of incidence in line with the solar irradiance sensor.
7. Lux Meter HD40058
The Lux Meter measures the luminous of the light bulbs. It has a large backlit LCD display with 40-segment bar graph. The display has multiple range and could measure up to 400,000 Lux. The meter utilises precision silicon photo diode and spectral response filter. It has minimum and maximum data hold, backlight for readings and built in USB port. The data logger is connected to the PC for recording the results.
The purpose of the PV module test is to validate the manufacturer’s data (if any is available) and to determine the I-V characteristic curve under field conditions. The module was
56 https://www.fastenal.com/products/details/0763285 57 http://www.amazon.com/Johnson-Level-Tool-700-Magnetic/dp/B00004T807 58 http://www.extech.com/instruments/product.asp?catid=10&prodid=56
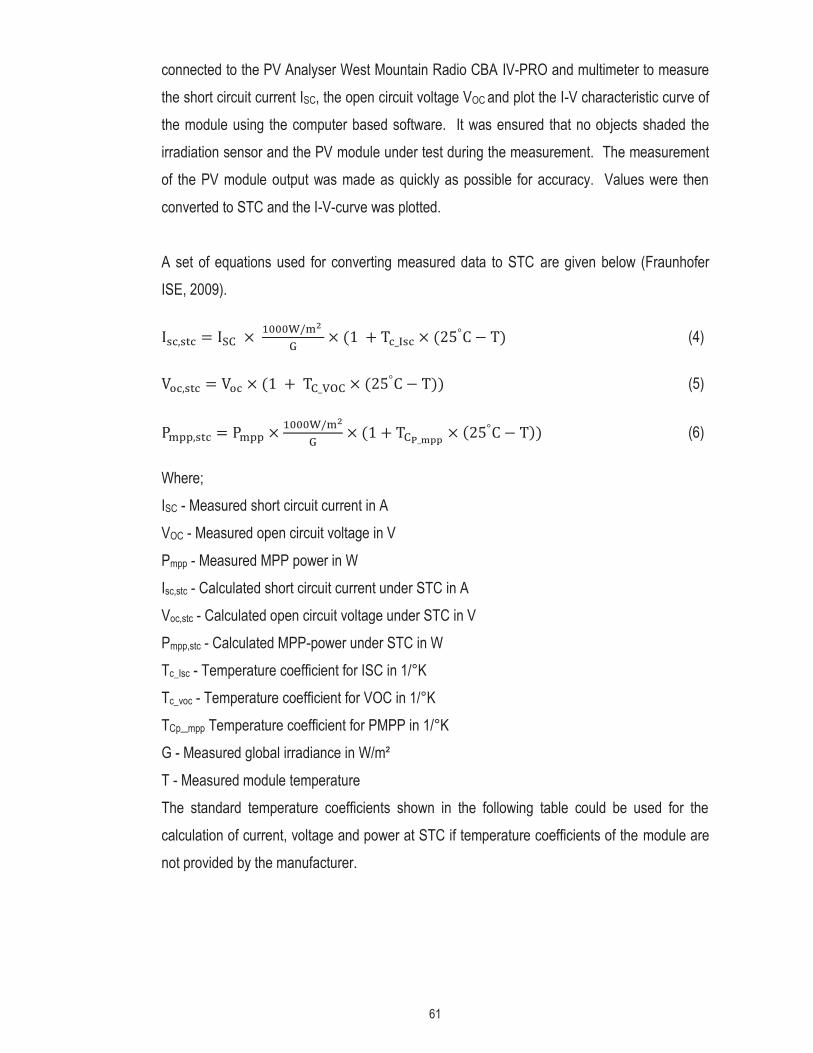
61
connected to the PV Analyser West Mountain Radio CBA IV-PRO and multimeter to measure the short circuit current ISC, the open circuit voltage VOC and plot the I-V characteristic curve of the module using the computer based software. It was ensured that no objects shaded the irradiation sensor and the PV module under test during the measurement. The measurement of the PV module output was made as quickly as possible for accuracy. Values were then converted to STC and the I-V-curve was plotted. A set of equations used for converting measured data to STC are given below (Fraunhofer ISE, 2009).
(4)
(5)
(6)
Where; ISC - Measured short circuit current in A VOC - Measured open circuit voltage in V Pmpp - Measured MPP power in W Isc,stc - Calculated short circuit current under STC in A Voc,stc - Calculated open circuit voltage under STC in V Pmpp,stc - Calculated MPP-power under STC in W Tc_Isc - Temperature coefficient for ISC in 1/°K Tc_voc - Temperature coefficient for VOC in 1/°K TCp_mpp Temperature coefficient for PMPP in 1/°K G - Measured global irradiance in W/m² T - Measured module temperature The standard temperature coefficients shown in the following table could be used for the calculation of current, voltage and power at STC if temperature coefficients of the module are not provided by the manufacturer.

62
Table 8: Standard temperature coefficients for different module type (Fraunhofer ISE, 2009)
Temperature coefficient in 1/°K
Monocrystalline Silicon
Polycrystalline Silicon
Amorphous Silicon
CIS CdTe
Tc_Isc 0.0004 0.0005 0.00075 0.0005 0.0008 Tc_voc -0.0043 -0.0035 -0.0031 -0.0029 -0.0025 TCp_mpp -0.0045 -0.005 -0.0023 -0.0036 -0.0018 The irradiation sensor was cooled to ambient temperature before measuring the output of the next module. 3.3. Autonomous Run Time (ART) The available capacity of a battery under realistic operating conditions was evaluated by the run time achieved by a light. To estimate the run time, one of the ways was to determine a minimum luminous flux over a certain period of operation. If the luminous flux of the light falls below the defined minimum level, the end of luminous period is reached, however, since the luminous flux of LED lights varies over a wide range, it is not appropriate to determine an absolute value for light output. The test method proposed here is based on measuring the variation in luminous flux in relative terms.
(7)
If the light output ΦVrel reaches 70 percent of the initial luminous flux ΦV(t0), the end of the luminous period is reached. To ensure that the light is measured in its thermal balance and with stabilized battery voltage (after initial voltage drop); the initial luminous flux (t0) is measured after 20 minutes (Bopp, et al. 2009). The illumination level must be measured under constant conditions. To ensure these constant conditions and to avoid stray light, this part of the experiment was performed in the dark room. Before taking measurements, the system was fully charged. A clamp stand was used to fix a light to the height of 0.75m which directly faced the lux meter set on the table. The lux meter with a data logging function was connected to a laptop to record the results. The illumination was set to be recorded every 2 minutes. The system was switched on at its highest lighting level and measurement was started. The initial luminance value was measured after 20 minutes (t0). The end of the luminous period was reached when the luminance was only 0.7 times the value of t0. The result was noted.
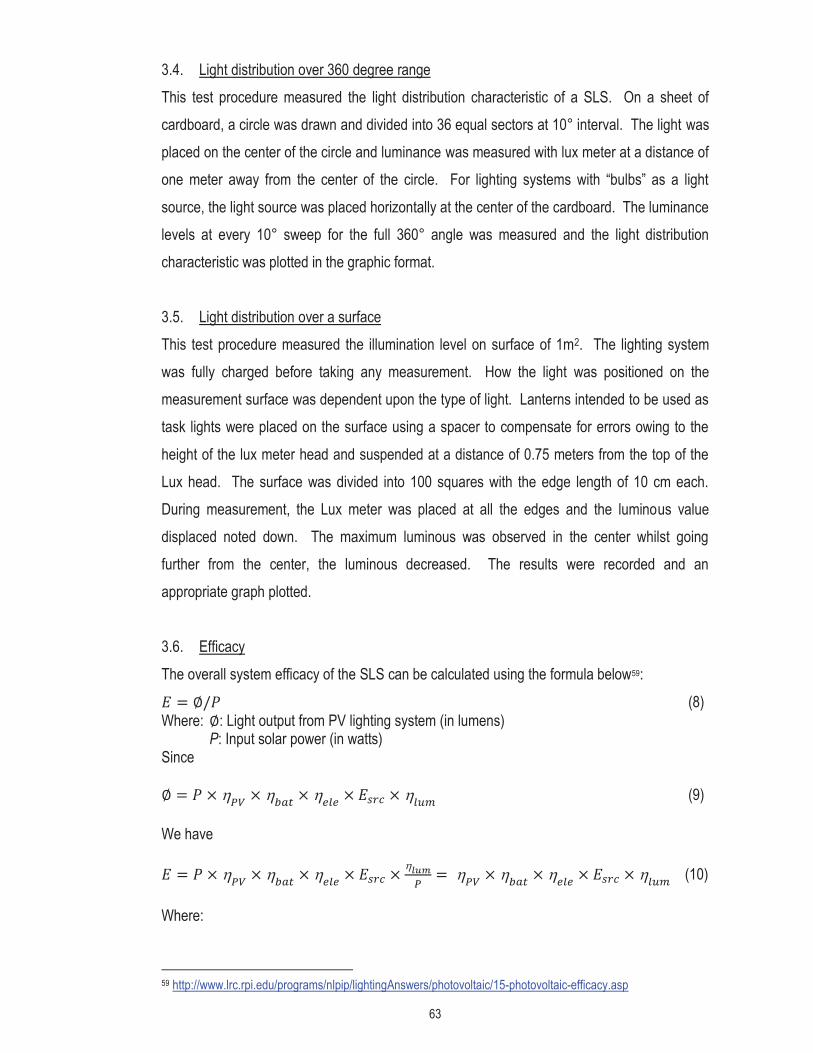
63
3.4. Light distribution over 360 degree range This test procedure measured the light distribution characteristic of a SLS. On a sheet of cardboard, a circle was drawn and divided into 36 equal sectors at 10° interval. The light was placed on the center of the circle and luminance was measured with lux meter at a distance of one meter away from the center of the circle. For lighting systems with “bulbs” as a light source, the light source was placed horizontally at the center of the cardboard. The luminance levels at every 10° sweep for the full 360° angle was measured and the light distribution characteristic was plotted in the graphic format. 3.5. Light distribution over a surface This test procedure measured the illumination level on surface of 1m2. The lighting system was fully charged before taking any measurement. How the light was positioned on the measurement surface was dependent upon the type of light. Lanterns intended to be used as task lights were placed on the surface using a spacer to compensate for errors owing to the height of the lux meter head and suspended at a distance of 0.75 meters from the top of the Lux head. The surface was divided into 100 squares with the edge length of 10 cm each. During measurement, the Lux meter was placed at all the edges and the luminous value displaced noted down. The maximum luminous was observed in the center whilst going further from the center, the luminous decreased. The results were recorded and an appropriate graph plotted. 3.6. Efficacy The overall system efficacy of the SLS can be calculated using the formula below59:
(8) Where: : Light output from PV lighting system (in lumens)
P: Input solar power (in watts) Since
� � � � (9)
We have
� � ��
� � � � (10)
Where:
59 http://www.lrc.rpi.edu/programs/nlpip/lightingAnswers/photovoltaic/15-photovoltaic-efficacy.asp
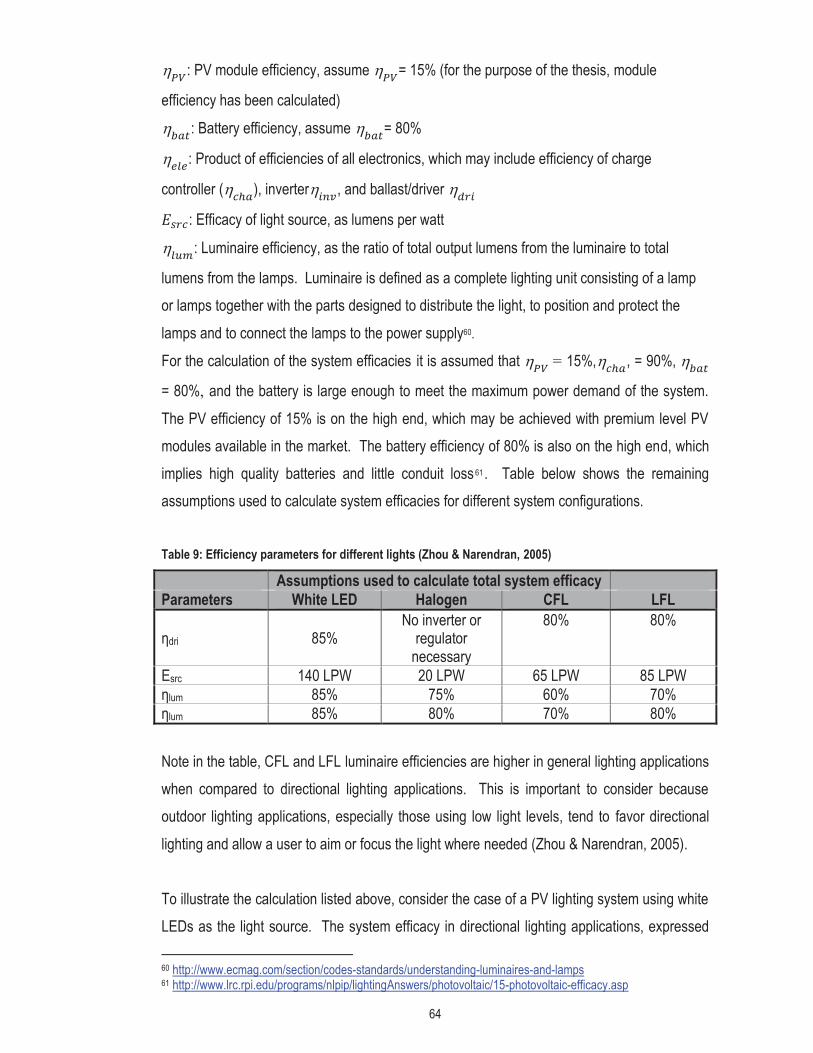
64
� : PV module efficiency, assume � = 15% (for the purpose of the thesis, module
efficiency has been calculated)
� : Battery efficiency, assume � = 80%
� : Product of efficiencies of all electronics, which may include efficiency of charge
controller (� ), inverter� , and ballast/driver �
: Efficacy of light source, as lumens per watt
� : Luminaire efficiency, as the ratio of total output lumens from the luminaire to total
lumens from the lamps. Luminaire is defined as a complete lighting unit consisting of a lamp or lamps together with the parts designed to distribute the light, to position and protect the lamps and to connect the lamps to the power supply60. For the calculation of the system efficacies it is assumed that � = 15%,� , = 90%, �
= 80%, and the battery is large enough to meet the maximum power demand of the system. The PV efficiency of 15% is on the high end, which may be achieved with premium level PV modules available in the market. The battery efficiency of 80% is also on the high end, which implies high quality batteries and little conduit loss61. Table below shows the remaining assumptions used to calculate system efficacies for different system configurations. Table 9: Efficiency parameters for different lights (Zhou & Narendran, 2005)
Assumptions used to calculate total system efficacy Parameters White LED Halogen CFL LFL
ηdri 85% No inverter or
regulator necessary
80% 80%
Esrc 140 LPW 20 LPW 65 LPW 85 LPW ηlum 85% 75% 60% 70% ηlum 85% 80% 70% 80% Note in the table, CFL and LFL luminaire efficiencies are higher in general lighting applications when compared to directional lighting applications. This is important to consider because outdoor lighting applications, especially those using low light levels, tend to favor directional lighting and allow a user to aim or focus the light where needed (Zhou & Narendran, 2005). To illustrate the calculation listed above, consider the case of a PV lighting system using white LEDs as the light source. The system efficacy in directional lighting applications, expressed 60 http://www.ecmag.com/section/codes-standards/understanding-luminaires-and-lamps 61 http://www.lrc.rpi.edu/programs/nlpip/lightingAnswers/photovoltaic/15-photovoltaic-efficacy.asp

65
as lumens per watt (LPW) of solar power reaching the PV modules, can be calculated as follows62:
� � � �
In comparison, a lighting system using a CFL as the light source does not need a dc current regulator, but it does need a dc-to-ac inverter. The system efficacy can be calculated as follows63:
� � � �
Note that the efficacy values above are calculated for every watt of solar power that arrives at the PV modules. The ideal solar radiation power is 1000 watts per square meter at sea level. The lumens per watt value can be easily converted to lumens per cost($) by using the following conversion factor:
(11) 3.7. Economic Analysis of SLSs The villages that were part of the study mostly depended on traditional lighting sources when the SLSs were distributed. Wood, hurricane (kerosene) lamp, white spirit lantern, diesel generators, candles, torch were the main sources of electricity for the people. Residents spent substantial amounts of money on purchasing fuel and traditional candles. Thus, it was important to determine the economic viability of a SLS as an alternate energy source to the electricity from the fuel based systems. The economic analysis considered a number of factors such as system price, fuel price, operational and maintenance cost, accessory replacement cost, savings from replacing the fuel based system, wattage cost and loan interest rates if system was purchased on loan. The following table provides the average Solar Insolation for Fiji which is key parameter while determining output of any PV system.
62 http://www.lrc.rpi.edu/programs/nlpip/lightingAnswers/photovoltaic/15-photovoltaic-efficacy.asp 63 http://www.lrc.rpi.edu/programs/nlpip/lightingAnswers/photovoltaic/15-photovoltaic-efficacy.asp

66
Table 10: Average Solar Insolation for Fiji64
Area
Jan
Feb
Mar
Apr
May
Jun
Jul
Aug
Sept
Oct
Nov
Dec
Year
Avg
(k
Wh/
m^2
/da
y)
Fiji 6.52 6.24 5.70 5.03 4.46 4.18 4.44 4.97 5.61 6.40 6.59 6.73 5.57 Assumption: Module direction North North West 22.5 degrees from North and the average sunshine hours as 3.6 hours/day. The economic analysis of SLS was based on various financial parameters such as Cost benefit analysis, Simple payback period (SPP), Net present value (NPV), Internal rate of return (IRR), Benefit to cost ratio (BCR) and Levelised Cost of Energy (LCOE). The SPP is the period of time that recoups the initial investment. Simple payback assesses how quickly an investment might pay back and whether the investment is likely to pay back within the expected lifetime of the project. The smaller the simple payback, better the investment. However, the simplicity of the simple payback calculation has limitations when assessing the economic feasibility of an energy project. The simple payback calculation ignores several critical investment characteristics, including: the time value of money, energy price escalation, variable rate electricity pricing, alternative investment options, and what happens after payback. NPV is calculated by bringing all the cost and income to the year zero. IRR is the discount rate that makes the NPV zero. BCR is calculated by dividing total benefit to total cost throughout the project life. A short payback period, higher NPV, IRR and BCR are necessary to ensure that the investment is quickly recovered and risk free investment. LCOE is calculated by summing all the costs incurred during the lifetime of the generating technology divided by the units of energy produced during the lifetime of the project expressed as dollars per kilowatt hour ($/kWhr). In calculating LCOE the time value of money has to be accounted for. LCOE enables a comparison of different energy generating technologies of unequal life times and differing capacities and permits grid competiveness comparisons to be readily made for different locations. All the financial parameters were calculated by using the following equations (Mondal, 2010): 64 http://solarelectricityhandbook.com/solar-irradiance.html
67
(12)
If BCR ≥ 1, the system is making a profit or breakeven
(13) If NPV is positive, system is viable
(14) The IRR for an investment is the discount rate for which total present value of future cash flows equals the cost of investment. This is the discount rate at which NPV is zero
(15) and
(16) Where, I: Investment, R: Return, E: Expenses, Bn: Total benefit, Cn Total cost, r: Discounting rate, NPV1 and NPV2 for two different interest rates and NPV1 is positive and NPV2 is negative, n: Lifetime of system (1, 2, 3……….20), Annual Yield is the energy output in kWh. All the calculations were based on the present market price of the equipment and the discount rate was considered as 8% and 10% reflecting the capital cost and expected rate of return of investments. For economic analysis, all the benefits and costs were determined in monetary value. The financial benefits included savings from fuel, light charging, and small income generation due to extension of working hours excluding the environmental impacts and other long term social benefits. On the contrary, the total cost included investment cost of systems, repair and maintenance expenses, replacement of accessories like battery, the charge controller, bulbs and tube, controller, switch throughout the lifetime of the system. Furthermore, the following assumptions were made for financial analysis as presented in Table below.
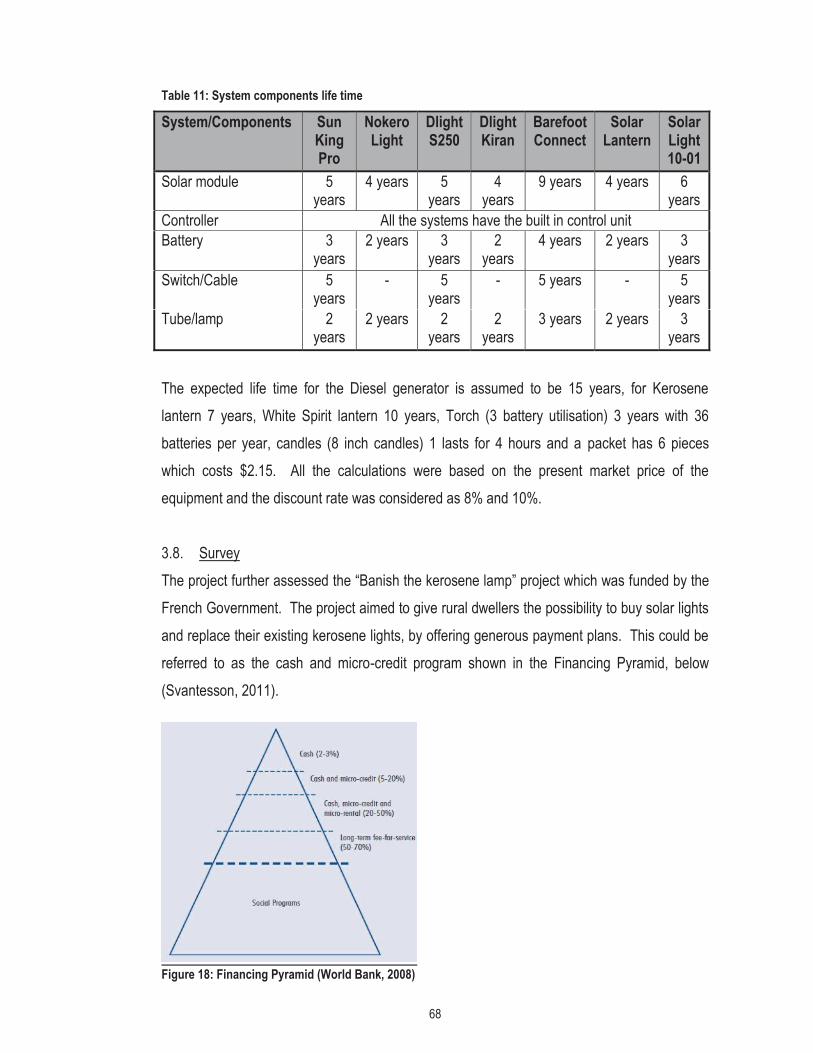
68
Table 11: System components life time System/Components Sun
King Pro
Nokero Light
Dlight S250
Dlight Kiran
Barefoot Connect
Solar Lantern
Solar Light 10-01
Solar module 5 years
4 years 5 years
4 years
9 years 4 years 6 years
Controller All the systems have the built in control unit Battery 3
years 2 years 3
years 2
years 4 years 2 years 3
years Switch/Cable 5
years - 5
years - 5 years - 5
years Tube/lamp 2
years 2 years 2
years 2
years 3 years 2 years 3
years The expected life time for the Diesel generator is assumed to be 15 years, for Kerosene lantern 7 years, White Spirit lantern 10 years, Torch (3 battery utilisation) 3 years with 36 batteries per year, candles (8 inch candles) 1 lasts for 4 hours and a packet has 6 pieces which costs $2.15. All the calculations were based on the present market price of the equipment and the discount rate was considered as 8% and 10%. 3.8. Survey The project further assessed the “Banish the kerosene lamp” project which was funded by the French Government. The project aimed to give rural dwellers the possibility to buy solar lights and replace their existing kerosene lights, by offering generous payment plans. This could be referred to as the cash and micro-credit program shown in the Financing Pyramid, below (Svantesson, 2011).
Figure 18: Financing Pyramid (World Bank, 2008)

69
The project was implemented in a number of remote villages and four of them, namely Namou, Lagalaga, Valelawa 1 and Valelawa 2; the first is located on Viti Levu and the rest on Vanua Levu. The electricity usage patterns were observed and dialogues were held with the villagers on their views on the SLSs. The villages, which are part of the study, generate the majority of the income from vegetable, sugar cane and rice farming. The lands are mostly owned by the natives “mataqali” and are leased to the dwellers. The villages are almost 40km away on average from the main town centers. The women are mainly involved in domestic duties, looking after children and the elderly while men work in the farms to produce vegetables and maintain sugarcane in order to sell them in the market for income. To support the family, most of the men also work as part time labourers. Those with some skills leave their villages and work in towns to earn a living. In assessing the level of development of these villages, the surroundings of the villages play important roles. The dilapidated conditions of the houses that had mostly been passed down to the descendants from ancestors were observed. Comparing Lagalaga and Valelawa 1 & 2, Laglaga seemed drastically underprivileged although income and expenditures were similar. Primary schools in the village go up to Class 8 and High Schools are situated nearer to town. Only top students with strong financial support attend higher levels of education out of the villages. Important local institutions including, farming associations, Fiji Cane Growers Council (FCGC), Fiji Development Bank (FDB), Fiji Sugar Cooperation (FSC) and Ministry of Agriculture play a role in distributing government funds to the farmers for cultivating their land. The following is a brief description of each of the villages that were surveyed:
Namau is comprised of thirty six households and is located approximately, forty kilometres from Ba town. The road leading to the village is not in a good state. The village can be reached by carrier van, three tonne vans and cane trucks or the buses, which enabled the farmers to get their vegetables to the town. The bus stops at a point after which people walk to reach their home. The village has a primary school which is partially powered by the solar module and partially by generator. It is a community school so most of the maintenance and repair work is carried out by the people. Under the “Banish the kerosene lamp project”, 22 households received different types of SLSs of their choice. Most of the households were distributed with 15W, 10W, Sun King Pro and Kiran system. Under the project, a nominated
70
person from the village was trained on basic maintenance of SLSs to address issues raised by users. There was a contact person appointed who was responsible to collect installments from the users, however, for some reason or other this strategy did not work and users are still having dues. Valelawa 1 and Valelawa 2 are located side by side in Labasa. They are situated 30km away from the Labasa town and almost a kilometre inside the main road. The settlement has a community Primary School and has altogether thirty one households. The major demand in the villages was for the 10W and 15W systems. Few of the households bought smaller portable systems to use at night for studies and gatherings. Some of the houses were connected to a solar module distributed by FDOE through the rural electrification project. Three people from the villages were trained to maintain the distributed systems. The recovery of installments was difficult from villages. The common reason was the flood which had hit the village in 2013, where most of the crops were destroyed.
Lagalaga village is situated on the other side of the Labasa town, almost 35km from the Labasa town. There are altogether 37 households in the village, each having issues of electricity and water supply. The people of the village ordered different sets of lighting systems for their home. People of this particular village cleared all their dues. The SLSs distributed in the villages were different in sizes and capacity. The 10W and 15W systems which were priced around $355 to $475 respectively, were the most common systems that people ordered. The systems contained combination of CFL and LED lights with the strength of giving electricity to three rooms at a time. Smaller systems like Sun King Pro, Dlight Kiran, Nokero and other portable systems with mobile charging features were ordered by people who used to move at night to other places, or for studying, and were inexpensive, costing less than $100 per system. The villagers were given training on installing the lighting systems at home. The villagers were to form a village lighting group to be responsible for the various aspects of the project such as maintaining the systems, collecting the installments from households, and so forth. At the time of the survey, 72 SLSs were in the 4 villages. These systems had been functioning in homes for the past 9 months. It was learnt from the assessment that most of the people had not used these kinds of systems at all and had very little knowledge on how PV systems work. The survey was conducted to compare the socio-economic changes in the

71
lives of the people before and after acquiring of SLSs. Some of the indicators used were lighting use patterns, advantages and disadvantages of the system, changes in the expenditure and levels of satisfaction. A questionnaire based survey and face-to-face interviews were conducted to record vital information on the project. A sample survey questionnaire is attached as an annex to this report. In some cases, a translator was used to conduct interviews. The villagers did not refuse household interviews and were brilliant hosts. Key questions that the households were asked (refer to Annex 2):
Source of Income: This was a vital parameter in determining the economic status of the village. Percentage Household Expenditure: The household spending figures were important for gauging the impact of changes in fuel expenditure and interest to purchase SLSs. Source of Light and SLSs information: Changes seen in lighting used prior and after implementation of SLSs. The idea was to figure out the impact of SLSs on people’s habit on lighting.
End-User Opinion and Satisfaction with LED lighting: This was carried out to determine the user perception on SLSs and how it impacted the user’s daily life. Willingness to pay: The households were asked how much they could afford to pay and their opinion on taking loan to purchase the system and making regular installments. Together with the household survey, group interviews were also conducted with the heads of the villages and various committees to get a broader view of the villagers. These interviews helped by providing information related to the development of villagers in terms of electricity access and how ready people are to accept innovation like SLSs. Group meetings also discussed similar issues as above with an added focus on project implementation assessment and organisational aspects. This included critical needs to be dealt with in order to expand the project further. Women were also interviewed to determine how the SLSs changed their ways of performing household activities. Children and elderly were also interviewed to capture how they utilised the SLSs in their daily activities.

72
Chapter 4 - Results and Discussions This chapter has two main sections. The first section determines the characteristics of sample SLSs performed at irradiance of 800W/m2, ambient temperature in the range of 20ºC to 25ºC and spectral distribution of AM1.5. The Fraunhofer standard derived an equation to convert values to STC as stated in the methodology. The first part deals with experiments starting with determining the IV characteristics of modules, assessing the run time of lighting systems, plotting light distribution patterns and also measurements of illumination levels on a given surface. The second section presents and discusses the response obtained from social impact survey carried out in the villages where the lighting systems were distributed followed by the financial and economic analysis of the systems. 4.1. IV Characteristics for the Solar Lighting Systems (SLSs) Table 12: IV Characteristics of different SLSs
# SLS Measurement Parameters Result 1 Dlight
S250 Module peak power (measured) 1.12WP Short circuit current (measured) 276.81mA Open circuit voltage (measured) 5.91V Module peak power (rated) 1.30WP Short circuit current (rated) 236mA Open circuit voltage (rated) 5.50V Discrepancy (compared to data provided by the manufacturer) (Module Power (measured)/Module Power (rated))
86.15%
Module characteristic curves
Fill Factor (Module Power Measured/Isc*Voc 0.68 Efficiency (η) 12.82%
The result was taken at a solar irradiance of 879W/m2 and module temperature of 55.7ºC. The module has an efficiency of 12.82%. The module might perform even better at higher irradiance on clear sunny days. The module size is suitable for the system since it only needs to support one light that provides different illumination at different modes, turbo mode
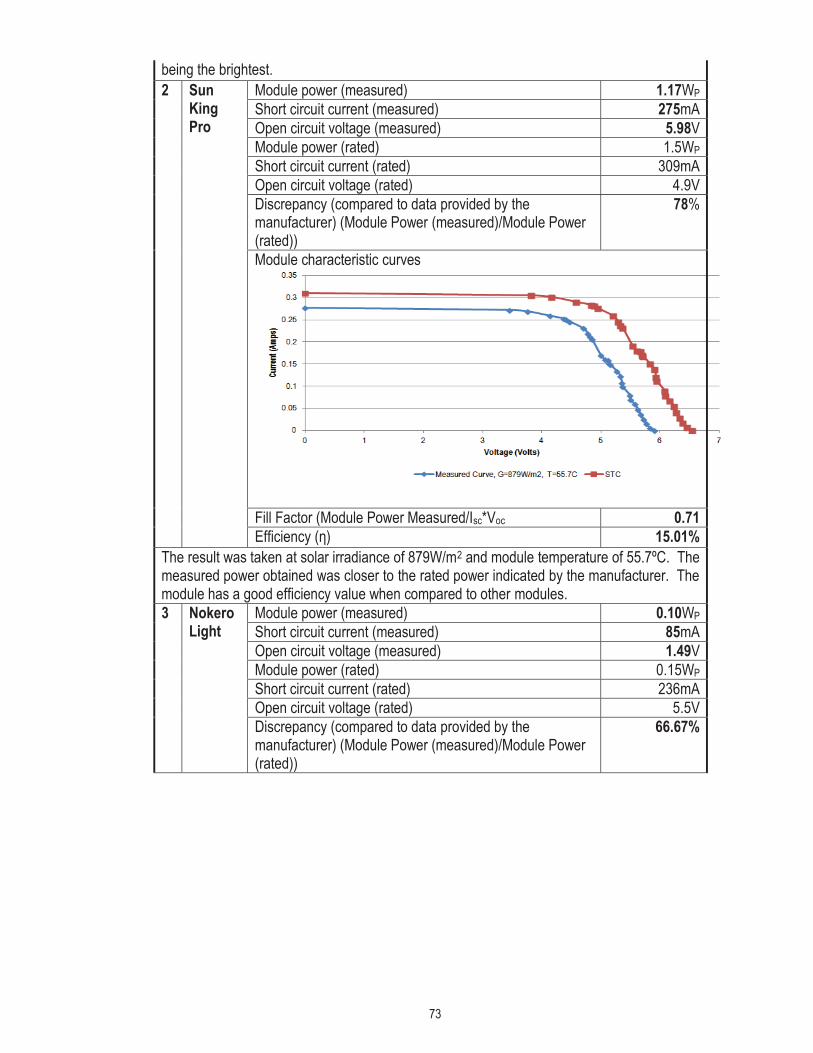
73
being the brightest. 2 Sun
King Pro
Module power (measured) 1.17WP Short circuit current (measured) 275mA Open circuit voltage (measured) 5.98V Module power (rated) 1.5WP Short circuit current (rated) 309mA Open circuit voltage (rated) 4.9V Discrepancy (compared to data provided by the manufacturer) (Module Power (measured)/Module Power (rated))
78%
Module characteristic curves
Fill Factor (Module Power Measured/Isc*Voc 0.71 Efficiency (η) 15.01%
The result was taken at solar irradiance of 879W/m2 and module temperature of 55.7ºC. The measured power obtained was closer to the rated power indicated by the manufacturer. The module has a good efficiency value when compared to other modules. 3 Nokero
Light Module power (measured) 0.10WP Short circuit current (measured) 85mA Open circuit voltage (measured) 1.49V Module power (rated) 0.15WP Short circuit current (rated) 236mA Open circuit voltage (rated) 5.5V Discrepancy (compared to data provided by the manufacturer) (Module Power (measured)/Module Power (rated))
66.67%

74
Module characteristic curves
Fill Factor (Module Power Measured/Isc*Voc 0.79 Efficiency (η) 5.3%
This lighting system has a built in module. In order to charge the system, the whole lamp needs to be oriented towards the sunlight. The result was taken at solar irradiance of 964W/m2 and module temperature of 40.6ºC. The measured power obtained was almost two thirds of the rated power indicated by the manufacturer. It takes lesser time to charge the Nokero light when compared to other systems, however, this factor could not determine whether Nokero is the best lighting system. 4 Barefoo
t Connect
Module power (measured) 5.76WP Short circuit current (measured) 384.51mA Open circuit voltage (measured) 19.21V Module power (rated) 6WP Short circuit current (rated) 387mA Open circuit voltage (rated) 21.3V Discrepancy (compared to data provided by the manufacturer) (Module Power (measured)/Module Power (rated))
96%
Module characteristic curves
Fill Factor (Module Power Measured/Isc*Voc 0.78 Efficiency (η) 9.23%
The result was taken at solar irradiance of 943W/m2 and module temperature of 60ºC. The

75
measured power obtained was slightly less than the rated power indicated by the manufacturer. However, due to the area, the module efficiency was lower when compared to other systems. 5 Solar
Lantern Module power (measured) 2.78WP Short circuit current (measured) 770mA Open circuit voltage (measured) 4.24V Module power (rated) 3WP Short circuit current (rated) 650mA Open circuit voltage (rated) 5V Discrepancy (compared to data provided by the manufacturer) (Module Power (measured)/Module Power (rated))
92.67%
Module characteristic curves
Fill Factor (Module Power Measured/Isc*Voc 0.85 Efficiency (η) 10.53%
The result was taken at solar irradiance of 1011W/m2 and module temperature of 61.5ºC. Solar Lantern has a built in solar module which produces power slightly lower than the rated power indicated by the manufacturer. The IV Characteristics for the measured values were slightly higher than the STC curve and was due to higher value of solar irradiance. The module temperature may have affected the efficiency of the module. 6 Solar
Light 10-01
Module power (measured) 4.8WP Short circuit current (measured) 329.1mA Open circuit voltage (measured) 19.39V Module power (rated) 5WP Short circuit current (rated) 310mA Open circuit voltage (rated) 21.81V Discrepancy (compared to data provided by the manufacturer) (Module Power (measured)/Module Power (rated))
96%
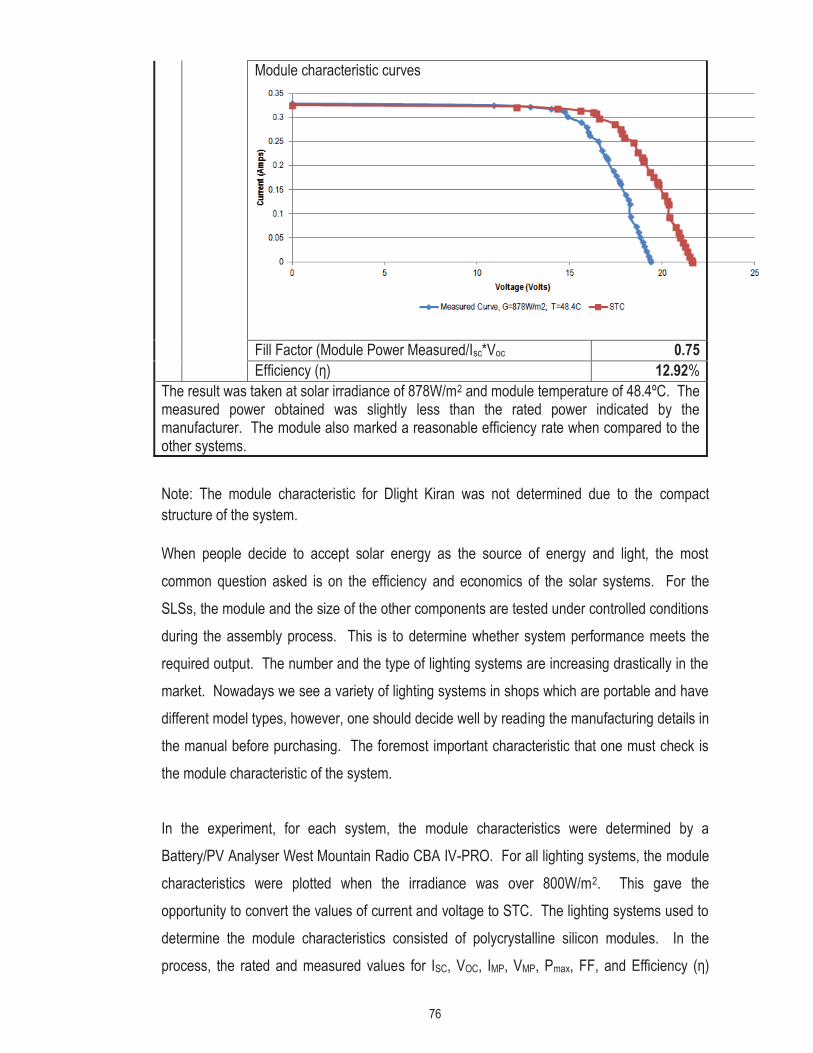
76
Module characteristic curves
Fill Factor (Module Power Measured/Isc*Voc 0.75 Efficiency (η) 12.92%
The result was taken at solar irradiance of 878W/m2 and module temperature of 48.4ºC. The measured power obtained was slightly less than the rated power indicated by the manufacturer. The module also marked a reasonable efficiency rate when compared to the other systems. Note: The module characteristic for Dlight Kiran was not determined due to the compact structure of the system. When people decide to accept solar energy as the source of energy and light, the most common question asked is on the efficiency and economics of the solar systems. For the SLSs, the module and the size of the other components are tested under controlled conditions during the assembly process. This is to determine whether system performance meets the required output. The number and the type of lighting systems are increasing drastically in the market. Nowadays we see a variety of lighting systems in shops which are portable and have different model types, however, one should decide well by reading the manufacturing details in the manual before purchasing. The foremost important characteristic that one must check is the module characteristic of the system. In the experiment, for each system, the module characteristics were determined by a Battery/PV Analyser West Mountain Radio CBA IV-PRO. For all lighting systems, the module characteristics were plotted when the irradiance was over 800W/m2. This gave the opportunity to convert the values of current and voltage to STC. The lighting systems used to determine the module characteristics consisted of polycrystalline silicon modules. In the process, the rated and measured values for ISC, VOC, IMP, VMP, Pmax, FF, and Efficiency (η)

77
were determined and compared to predict the most efficient solar module. Using the standard temperature coefficients, the values were converted to STC and the comparative graph was plotted against the measured value graph. The efficiency values in decreasing order are as follows: 1. Sun King Pro, η = 15.01% 2. Solar Light 10-01, η = 12.92% 3. Dlight S250, η = 12.82%, 4. Solar Lantern, η = 10.53% 5. Barefoot Connect, η = 7.68% 6. Nokero Light, η = 5.30% For all the modules, the measured efficiency values were within the typical efficiency values of the type i.e. 13-17% for the polycrystalline-based solar modules. This concludes that the in-coming power of the module was of reasonable amount and unless the other components or whole system were tested, it was unfair to determine and declare the best type of the system. For this reason, it was necessary to measure the illumination level and the light distribution pattern of the lighting systems. 4.2. Measurement for Illumination for the Solar Lighting Systems (SLSs) Table 13: Runtime for different SLSs
# SLS Measurement Parameters Result 1 Dlight
Kiran Autonomous time 192min Daily Burn time 360min Average luminous flux (Autonomous time) 7lm Relative luminous flux
The Dlight Kiran system has a decreasing luminous trend. The illumination trend was
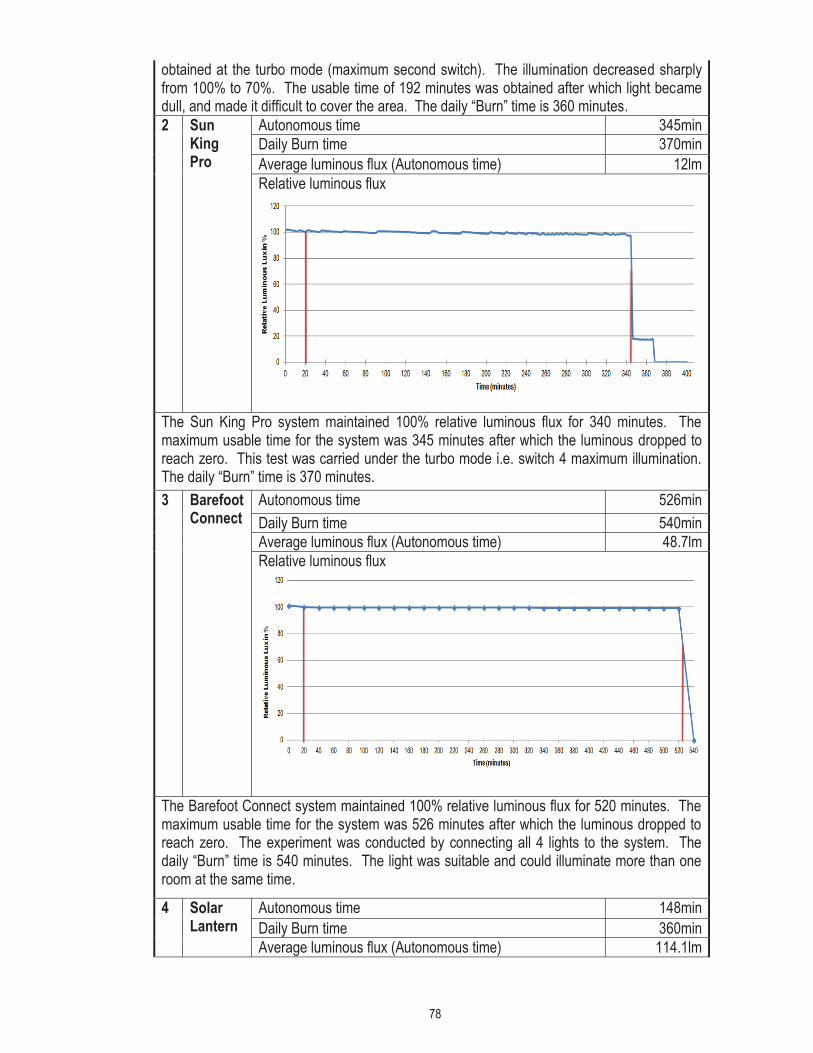
78
obtained at the turbo mode (maximum second switch). The illumination decreased sharply from 100% to 70%. The usable time of 192 minutes was obtained after which light became dull, and made it difficult to cover the area. The daily “Burn” time is 360 minutes. 2 Sun
King Pro
Autonomous time 345min Daily Burn time 370min Average luminous flux (Autonomous time) 12lm Relative luminous flux
The Sun King Pro system maintained 100% relative luminous flux for 340 minutes. The maximum usable time for the system was 345 minutes after which the luminous dropped to reach zero. This test was carried under the turbo mode i.e. switch 4 maximum illumination. The daily “Burn” time is 370 minutes. 3 Barefoot
Connect Autonomous time 526min Daily Burn time 540min Average luminous flux (Autonomous time) 48.7lm Relative luminous flux
The Barefoot Connect system maintained 100% relative luminous flux for 520 minutes. The maximum usable time for the system was 526 minutes after which the luminous dropped to reach zero. The experiment was conducted by connecting all 4 lights to the system. The daily “Burn” time is 540 minutes. The light was suitable and could illuminate more than one room at the same time.
4 Solar Lantern
Autonomous time 148min Daily Burn time 360min Average luminous flux (Autonomous time) 114.1lm
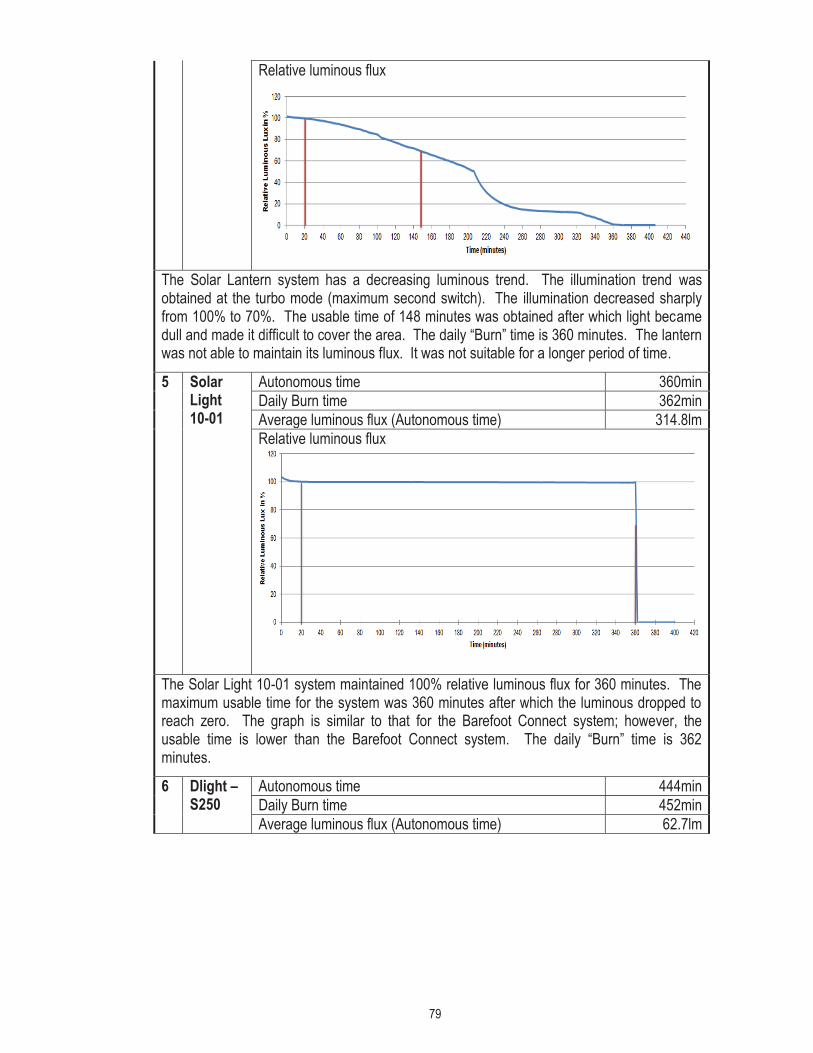
79
Relative luminous flux
The Solar Lantern system has a decreasing luminous trend. The illumination trend was obtained at the turbo mode (maximum second switch). The illumination decreased sharply from 100% to 70%. The usable time of 148 minutes was obtained after which light became dull and made it difficult to cover the area. The daily “Burn” time is 360 minutes. The lantern was not able to maintain its luminous flux. It was not suitable for a longer period of time.
5 Solar Light 10-01
Autonomous time 360min Daily Burn time 362min Average luminous flux (Autonomous time) 314.8lm Relative luminous flux
The Solar Light 10-01 system maintained 100% relative luminous flux for 360 minutes. The maximum usable time for the system was 360 minutes after which the luminous dropped to reach zero. The graph is similar to that for the Barefoot Connect system; however, the usable time is lower than the Barefoot Connect system. The daily “Burn” time is 362 minutes.
6 Dlight – S250
Autonomous time 444min Daily Burn time 452min Average luminous flux (Autonomous time) 62.7lm

80
Relative luminous flux
The Dlight S250 system maintained 100% relative luminous flux for 420 minutes. The maximum usable time for the system was 444 minutes after which the luminous dropped to reach zero. The pattern shows minor fluctuations which may be due to the led type. Test was carried under the turbo mode i.e. switch 3 maximum illumination. The daily “Burn” time is 452 minutes.
7 Nokero Autonomous time 45min Daily Burn time 90min Average luminous flux (Autonomous time) 2.1lm Relative luminous flux
The Nokero system has a decreasing luminous trend. The illumination trend obtained at the turbo mode (maximum second switch). The illumination decreased sharply from 100% to 70%. The usable time of 45 minutes was obtained after which light became dull and made it difficult to cover the area. The daily “Burn” time is 90 minutes. The light was not suitable for a longer period of time. The daily “Burn’ time, Autonomous Run time and Solar Run time are vital parameters in determining the quality of the system. The run time shows how sustainable the quality of light is when it is used for a period of time. It is a measure of the relative luminous flux in percentage versus time. Often the system which has constant relative luminous flux is categorised as an economical system. For all the systems, the autonomous time, daily burn time and the average luminous flux at the autonomous time were determined.

81
For Dlight Kiran, the burn time was 360 minutes and its usable time was between 0 to 192 minutes and the average luminous flux at the autonomous time was 7lm. For Sun-King Pro, the burn time was 368 minutes and its usable time was between 0 to 364 minutes and the average luminous flux at the autonomous time was 12lm. Moving on, for Barefoot Connect, the burn time was 540 minutes and its usable time was between 0 to 524 minutes and the average luminous flux at the autonomous time was 48.7lm. Furthermore, for the Solar Lantern, the burn time was 360 minutes and its usable time was between 0 to 148 minutes and the average luminous flux at the autonomous time was 114.1lm. In addition, for the Solar Light 10-01, the burn time was 362 minutes and its usable time was between 0 to 360 minutes and the average luminous flux at the autonomous time was 62.7lm. The Dlight S250 system had a very unique run time pattern. The illumination level fluctuated around 100%. The burn time was 450 minutes and its usable time was between 0 to 444 minutes and the average luminous flux at the autonomous time was 62.7lm. Lastly, for Nokero, the burn time was 90 minutes and its usable time was between 0 to 44 minutes and the average luminous flux at the autonomous time was 2.1lm. Considering the values of usable time and the average luminous flux, the most economical system was the Barefoot Connect system followed by Solar Light 10-01, and Sun King Pro. These systems could be used for longer periods of time with reasonable brightness. The Barefoot Connect and Solar Light 10-01 were more suitable for lighting up a room, while Sun King Pro were used as portable lighting systems.
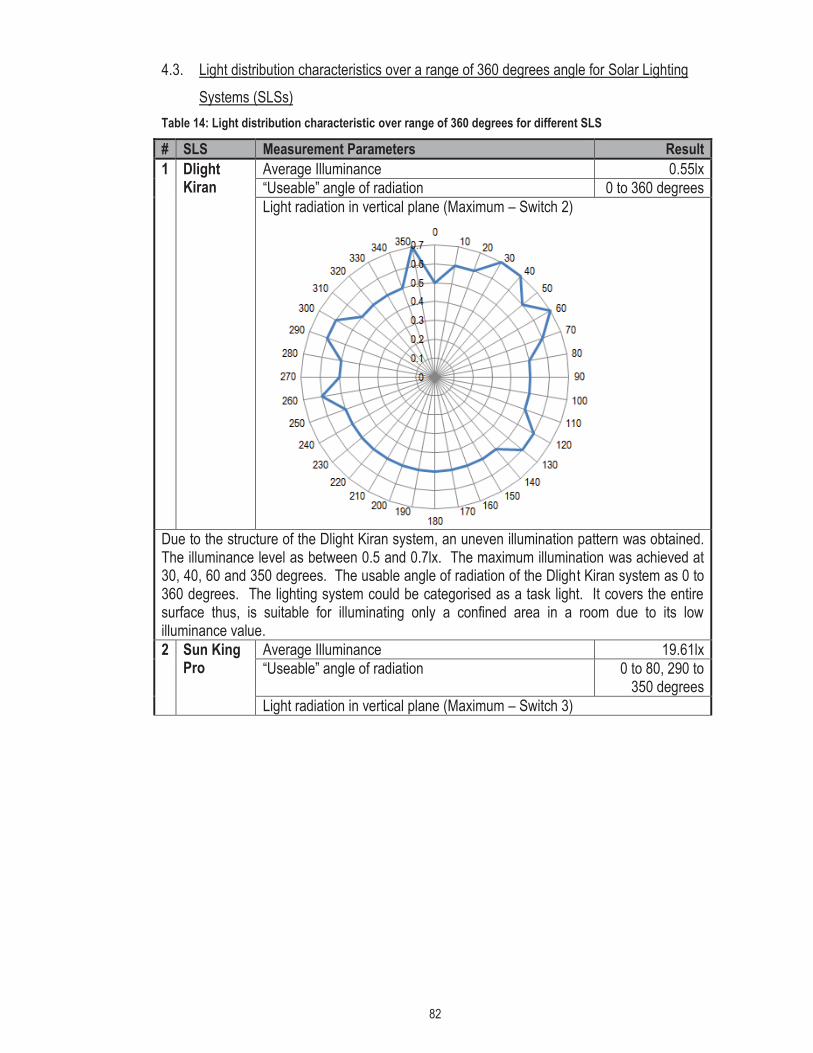
82
4.3. Light distribution characteristics over a range of 360 degrees angle for Solar Lighting Systems (SLSs)
Table 14: Light distribution characteristic over range of 360 degrees for different SLS # SLS Measurement Parameters Result 1 Dlight
Kiran Average Illuminance 0.55lx “Useable” angle of radiation 0 to 360 degrees Light radiation in vertical plane (Maximum – Switch 2)
Due to the structure of the Dlight Kiran system, an uneven illumination pattern was obtained. The illuminance level as between 0.5 and 0.7lx. The maximum illumination was achieved at 30, 40, 60 and 350 degrees. The usable angle of radiation of the Dlight Kiran system as 0 to 360 degrees. The lighting system could be categorised as a task light. It covers the entire surface thus, is suitable for illuminating only a confined area in a room due to its low illuminance value. 2 Sun King
Pro Average Illuminance 19.61lx “Useable” angle of radiation 0 to 80, 290 to
350 degrees Light radiation in vertical plane (Maximum – Switch 3)

83
The Sun King Pro system produced maximum illumination of 51lx at 0 degree. The usable angles of radiation were 0 to 80, 290 to 350 degrees. For other angles illumination was not possible since the base of the system faced the lux meter. The lighting system achieved a better illumination value, however, due to its make and structure it could be categorised as a task light. At times this light can also be used as a portable light. 3 Barefoot
Connect Average Illuminance 18.16lx “Useable” angle of radiation 0 to 80 and 280
to 350 degrees Light radiation in vertical plane
The Barefoot Connect system produced maximum illumination of 50lx at 0 degree. The usable angles of radiation were 0 to 80 and 280 to 350 degrees. For other angle, illumination was not possible since the base of the holder of the light blocked the light falling onto the lux meter. The light was placed on top of the surface. If hung from the ceiling, it can provide light to the entire room. Thus, it could be categorised as an ambient lighting system.

84
4 Solar Lantern
Average Illuminance 32.30lx “Useable” angle of radiation 60 to 120, 160 to
220 and 280 to 340degrees
Light radiation in vertical plane
Due to structure of the Solar Lantern system which is kind of a triangular prism, an uneven illumination pattern was obtained. The illuminance level was between 15 and 48lx. The maximum illumination was achieved at 60 to 120, 160 to 220 and 280 to 340 degrees. The usable angle of radiation of the Dlight Kiran system was 0 to 360 degrees. The lighting system can provide light to the entire room, thus, could be categorised as ambient lighting system. 5 Solar
Light 10-01
Average Illuminance 92.07lx “Useable” angle of radiation 0 to 60 and 290
to 350 degrees Light radiation in vertical plane

85
The Solar Light 10-01 system produced maximum illumination of 300lx at 0 degree. The usable angles of radiation were 0 to 60 and 290 to 350 degrees. For other angle illumination was not possible since the base of the holder of the light blocked the light falling onto the lux meter. The lighting system consisted of close to 100 small LED lights which produced maximum illumination. If the system was hung from the ceiling, it could provide light to the entire room. Just like Barefoot Connect system, this system could also be categorised as ambient lighting system. 6 Dlight-
S250 Average Illuminance 18.50lx “Useable” angle of radiation 0 to 60 and
290 to 350 degrees
Light radiation in vertical plane (Maximum – Switch 4)
The Dlight S250 system produced maximum illumination of 65lx at 0 degree. The usable angles of radiation were 0 to 60 and 290 to 350 degrees. Illumination was not possible for other angles since the base of the light blocked the light falling onto the lux meter. The
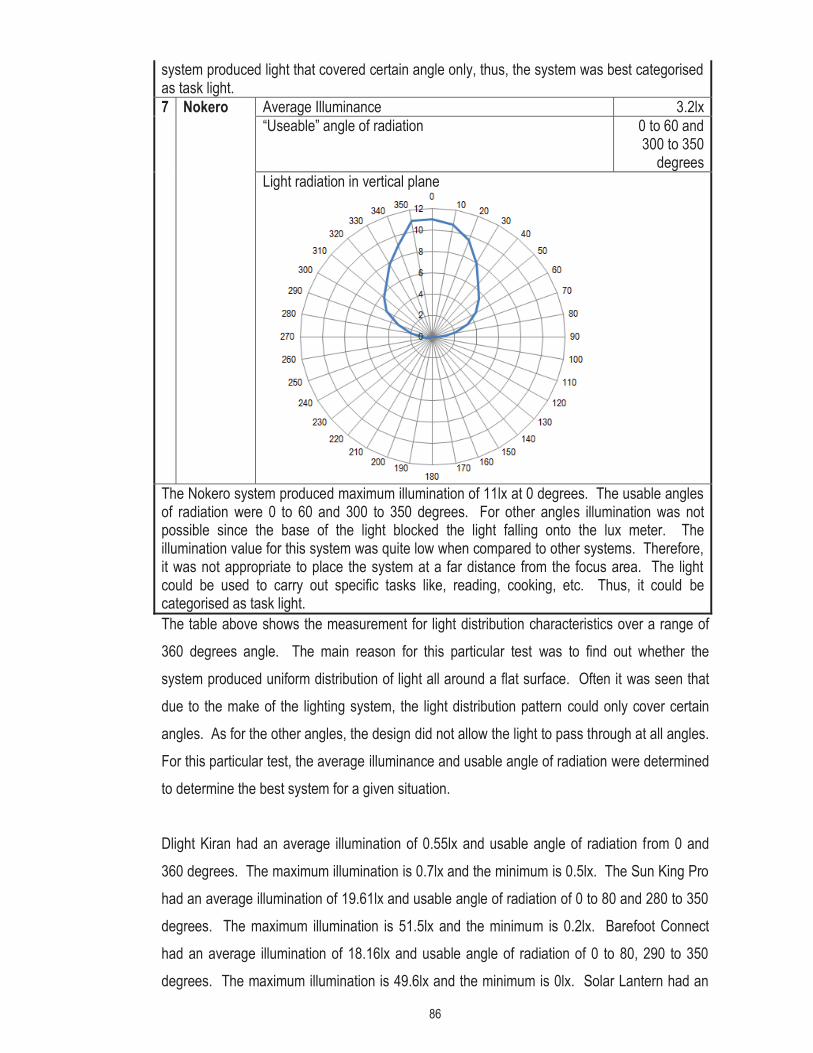
86
system produced light that covered certain angle only, thus, the system was best categorised as task light. 7 Nokero Average Illuminance 3.2lx
“Useable” angle of radiation 0 to 60 and 300 to 350
degrees Light radiation in vertical plane
The Nokero system produced maximum illumination of 11lx at 0 degrees. The usable angles of radiation were 0 to 60 and 300 to 350 degrees. For other angles illumination was not possible since the base of the light blocked the light falling onto the lux meter. The illumination value for this system was quite low when compared to other systems. Therefore, it was not appropriate to place the system at a far distance from the focus area. The light could be used to carry out specific tasks like, reading, cooking, etc. Thus, it could be categorised as task light. The table above shows the measurement for light distribution characteristics over a range of 360 degrees angle. The main reason for this particular test was to find out whether the system produced uniform distribution of light all around a flat surface. Often it was seen that due to the make of the lighting system, the light distribution pattern could only cover certain angles. As for the other angles, the design did not allow the light to pass through at all angles. For this particular test, the average illuminance and usable angle of radiation were determined to determine the best system for a given situation. Dlight Kiran had an average illumination of 0.55lx and usable angle of radiation from 0 and 360 degrees. The maximum illumination is 0.7lx and the minimum is 0.5lx. The Sun King Pro had an average illumination of 19.61lx and usable angle of radiation of 0 to 80 and 280 to 350 degrees. The maximum illumination is 51.5lx and the minimum is 0.2lx. Barefoot Connect had an average illumination of 18.16lx and usable angle of radiation of 0 to 80, 290 to 350 degrees. The maximum illumination is 49.6lx and the minimum is 0lx. Solar Lantern had an

87
average illumination of 32.31lx and usable angle of radiation of 60 to 120, 160 to 220 and 280 to 340 degrees. The maximum illumination is 48.6lx and the minimum is 16.3lx. Solar Light 10-01 had an average illumination of 92.07lx and usable angle of radiation of 0 to 60 and 290 to 350 degrees. The maximum illumination is 290lx and the minimum is 1lx. Dlight - S250 had an average illumination of 3.2lx and usable angle of radiation of 0 to 60 and 290 to 350 degrees. The maximum illumination is 64.5lx and the minimum is 0lx. Nokero had an average illumination of 18.5lx and usable angle of radiation of 0 to 60 and 300 to 350 degrees. The maximum illumination is 11lx and the minimum is 0lx. The systems which had a 360 degree reach were Dlight Kiran and Solar Lantern while Solar Light 10-01 produced maximum average illuminance. Dlight Kiran, Sun King Pro, Nokero and Dlight S250 are examples of task lighting systems while Solar Lantern, Barefoot Connect and Solar Light 10-01 are part of the ambient lighting system. 4.4. Light distribution characteristic of Solar Lighting Systems (SLSs) on a plane surface Table 15: Light distribution characteristic over a surface for different SLSs # SLS Measurement Parameters Result
1 Dlight Kiran
Average illuminance 9.63lx “Usable” working surface From center,
0.16m2
Light uniformity on the working surface (Maximum – Switch 2) 3D Plane

88
2D Plane
The Dlight Kiran system yielded maximum illuminance at the center of the 1m2 area. The spread of lighting pattern weakened away from the center. The area which recorded more than 10lx is 0.16m2 around the center. The rest of the area had lower illumination value which made it difficult for people to see and adjust. 2 Sun
King Pro
Average illuminance 69.18lx “Usable” working surface From center
0.20m2
Light uniformity on the working surface (Maximum – Switch 3) 3D Plane
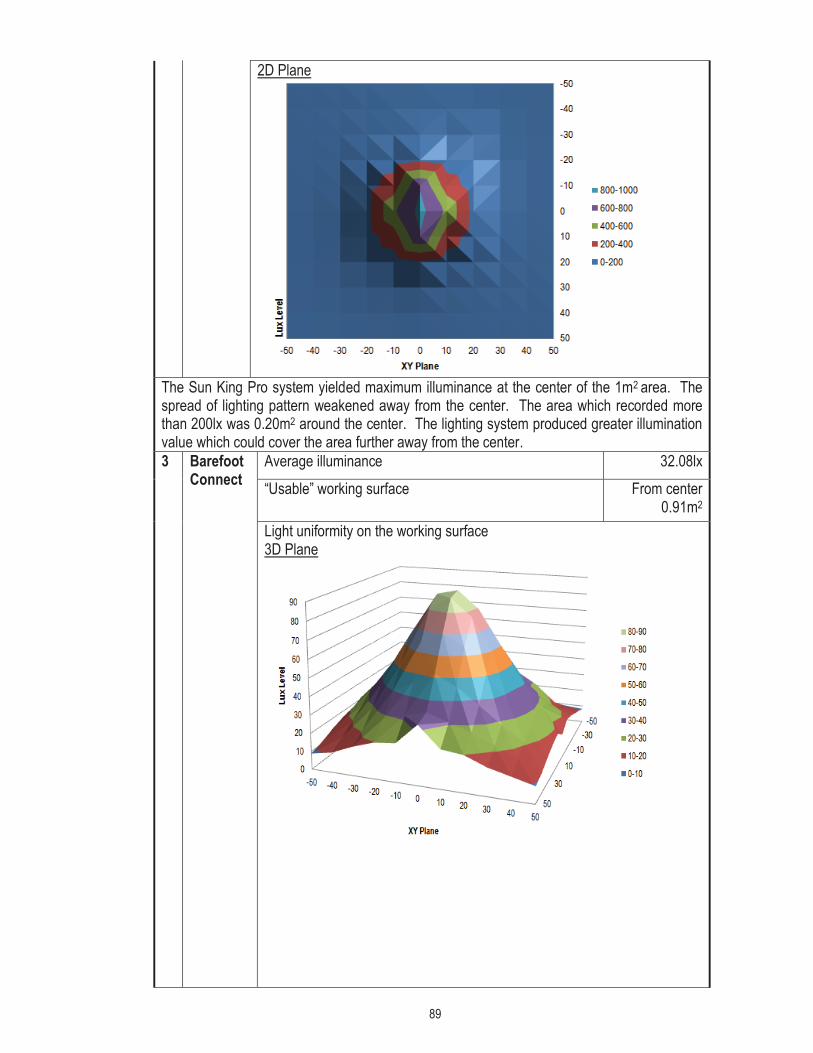
89
2D Plane
The Sun King Pro system yielded maximum illuminance at the center of the 1m2 area. The spread of lighting pattern weakened away from the center. The area which recorded more than 200lx was 0.20m2 around the center. The lighting system produced greater illumination value which could cover the area further away from the center. 3 Barefoot
Connect Average illuminance 32.08lx “Usable” working surface From center
0.91m2
Light uniformity on the working surface 3D Plane

90
2D Plane
The Barefoot Connect system yielded maximum illuminance at the center of the 1m2 area. The spread of lighting pattern weakened away from the center. The area which recorded more than 20lx was 0.91m2 around the center. The spread of the light covered most of the area, thus it was suitable for illuminating the entire room. 4 Solar
Lantern Average illuminance 111.62lx “Usable” working surface From center
0.56m2
Light uniformity on the working surface 3D Plane

91
2D Plane
The Solar Lantern system has a unique structure which yielded maximum illuminance at the center of the 1m2 area and further spread in a triangular pattern with an angle of symmetry of 120 degrees. The spread of lighting pattern weakened away from the center. The area which recorded more than 20lx was 0.56m2 around the center. The lantern also covered a wide area and was suitable for illuminating a room. 5 Solar
Light 10-01
Average illuminance 113.79lx “Usable” working surface From center
0.64m2 Light uniformity on the working surface 3D Plane
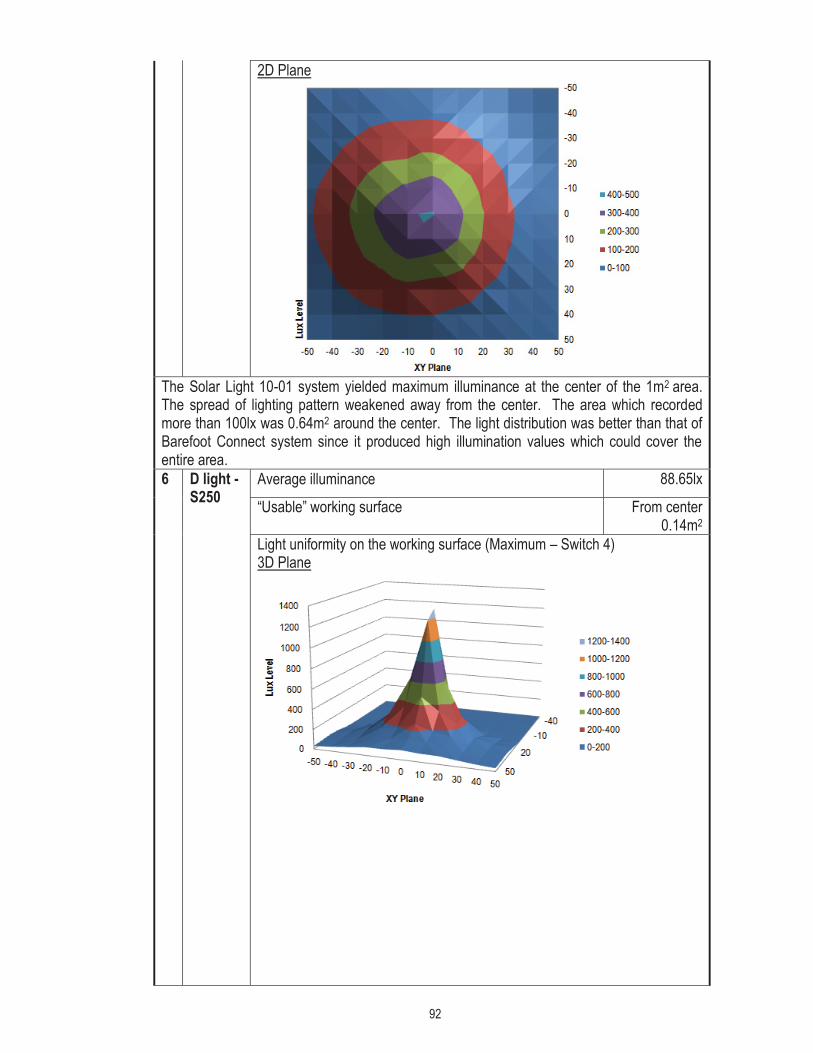
92
2D Plane
The Solar Light 10-01 system yielded maximum illuminance at the center of the 1m2 area. The spread of lighting pattern weakened away from the center. The area which recorded more than 100lx was 0.64m2 around the center. The light distribution was better than that of Barefoot Connect system since it produced high illumination values which could cover the entire area. 6 D light -
S250 Average illuminance 88.65lx
“Usable” working surface From center 0.14m2
Light uniformity on the working surface (Maximum – Switch 4) 3D Plane

93
2D Plane
The Dlight S250 system yielded maximum illuminance at the center of the 1m2 area. The spread of lighting pattern weakened away from the center. The area which recorded more than 500lx was 0.14m2 around the center. The lighting system could be used as a task light. 7 Nokero Average illuminance 4.16lx
“Usable” working surface From center 0.25m2
Light uniformity on the working surface (Maximum – Switch 2) 3D Plane

94
2D Plane
The Nokero system yielded maximum illuminance at the center of the 1m2 area. The spread of lighting pattern weakened away from the center. The area which recorded more than 2lx was 0.25m2 around the center. The illumination value for this particular system was quite low, therefore it was difficult to cover the entire area. The other important characteristic that was vital to predict the quality of lighting system was the light distribution pattern examined on a plane surface. The set of lighting systems were tested under controlled conditions and the average illuminance and usable working surface was determined. Dlight Kiran showed a moderate decrease of illuminance from the center to the edges. For area of about 0.16m2, the illuminance level was above 10lx from the center. The Sun King Pro system showed a somewhat high light intensity in a limited angle sweep that corresponded to a high illuminance of around 800lx in the center of the measured area. However, it declined rapidly away from the center, and only an area of about 0.2m2 showed values above 100lx. For Barefoot Connect, there was a moderate decrease of illuminance value of 89.2lx from the center to the edges. Almost every square in the measured area showed an illuminance level of 8lx or more. For Solar Lantern, a very fascinating pattern was seen due to the triangular beam of LED lights in the middle of the light. The usable working surface of 0.56m2 was observed, which showed values above 100lx. The higher value illuminance pattern was observed near to the center. For Solar Light 10-01, the distribution pattern could be seen on an area of 0.64m2 with the illumination level over 50lx. There was a decrease of illuminance value from center to edges. For D light S250, the light distribution pattern appeared to be a

95
narrow beam concentrated mainly in the center. The highest intensity was observed at the center which gradually decreaseed as we moved towards the edges. The illuminance of the system within the usable area was more than 200lx. Nokero light was a portable light which had a usable working surface of 0.25m2 and the illuminance level was above 1lx from the center. Overall, the best pattern seen was for the Solar Light 10-01, Barefoot Connect and Sun King Pro respectively. The illuminance was higher at the center and spread over the surface. 4.5. Efficacy of the Solar Lighting Systems(SLSs) As elaborated in the methodology, system efficacy could be calculated using the following equation:
Where; - Light output from PV lighting system (in lumens) and P - Input solar power (in
watts) Since
� � � �
We have
� � ��
� � � �
The table below provides the efficacy values sample SLSs. Table 16: Efficacy values of the SLSs
System �� Assumptions (All efficiency values in percentage) Efficacy, E (Lumens/Watts) �� �� �� (Lumans/Watts) ��
Sun King Pro
15.01 80 90 85 140 85 10.93
Solar Light 10-01
12.92 80 90 85 140 85 9.41
Dlight S250
12.82 80 90 85 140 85 9.34
Solar Lantern
10.53 80 90 85 140 85 7.67
Barefoot Connect
7.68 80 90 85 140 85 5.59

96
Nokero Light
5.30 80 90 85 140 85 3.86
Note: Dlight Kiran efficiency was not determined due to structure of the lighting system. The efficacy of the lighting system is dependent on the solar module and the components of the lighting system. It is the measure of how well a lighting system produces visible light and is calculated by the ratio of luminous flux to power. Sun King Pro recorded the highest efficacy value. The efficacy values for the tested lighting systems are given in a decreasing order in the table above. Converting Lumens per Watts to Cost($) per lumen:
(17)
The cost($) per lumen value for each system is given in the following table. Table 17: Cost($) per lumen value for the SLSs System Efficacy, E
(Lumens/Watts) System
Price (FJD)
System Power (Watts)
Power (Watts)/Cost($)
Cost($)/Lumens
Sun King Pro
10.93 $40 1.5 0.0375 0.4099
Solar Light 10-01
9.41 $100 5 0.0500 0.4705
Dlight S250
9.34 $50 1.3 0.0260 0.2428
Solar Lantern
7.67 $55 3 0.0550 0.4219
Barefoot Connect
5.59 $300 6 0.0200 0.1118
Nokero Light
3.86 $20 0.15 0.0075 0.0289
The cost($) per lumen value is used to determine the most cost effective lighting system. Different lighting systems are tagged at different prices due to their size and the make. However, the cost must be reasonable to buyers when compared to its output. Though the Nokero system is small, it is the most economical; having a cost($) per lumen value of approximately 3 cents compared to other portable systems such as Solar Lantern, Sun King Pro and Dlight S250 system which are 42 cents, 41 cents and 24 cents respectively. For
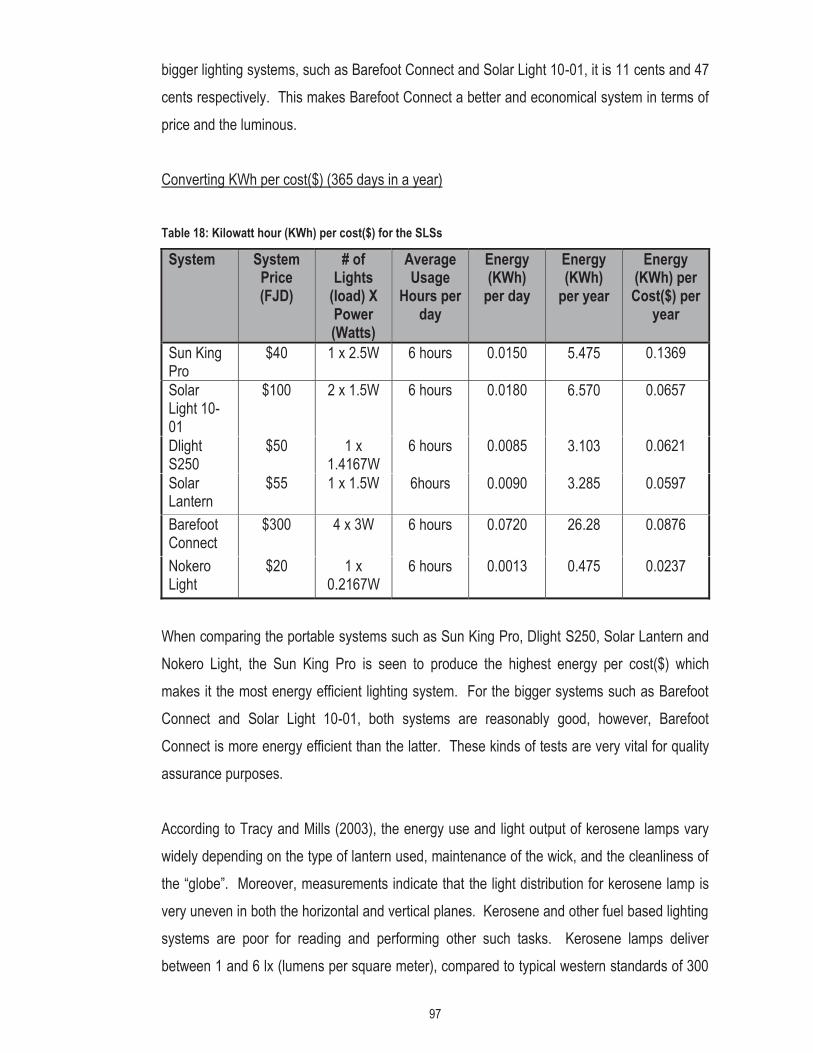
97
bigger lighting systems, such as Barefoot Connect and Solar Light 10-01, it is 11 cents and 47 cents respectively. This makes Barefoot Connect a better and economical system in terms of price and the luminous. Converting KWh per cost($) (365 days in a year) Table 18: Kilowatt hour (KWh) per cost($) for the SLSs System System
Price (FJD)
# of Lights
(load) X Power (Watts)
Average Usage
Hours per day
Energy (KWh)
per day
Energy (KWh)
per year
Energy (KWh) per Cost($) per
year
Sun King Pro
$40 1 x 2.5W 6 hours 0.0150 5.475 0.1369
Solar Light 10-01
$100 2 x 1.5W 6 hours 0.0180 6.570 0.0657
Dlight S250
$50 1 x 1.4167W
6 hours 0.0085 3.103 0.0621
Solar Lantern
$55 1 x 1.5W 6hours 0.0090 3.285 0.0597
Barefoot Connect
$300 4 x 3W 6 hours 0.0720 26.28 0.0876
Nokero Light
$20 1 x 0.2167W
6 hours 0.0013 0.475 0.0237
When comparing the portable systems such as Sun King Pro, Dlight S250, Solar Lantern and Nokero Light, the Sun King Pro is seen to produce the highest energy per cost($) which makes it the most energy efficient lighting system. For the bigger systems such as Barefoot Connect and Solar Light 10-01, both systems are reasonably good, however, Barefoot Connect is more energy efficient than the latter. These kinds of tests are very vital for quality assurance purposes. According to Tracy and Mills (2003), the energy use and light output of kerosene lamps vary widely depending on the type of lantern used, maintenance of the wick, and the cleanliness of the “globe”. Moreover, measurements indicate that the light distribution for kerosene lamp is very uneven in both the horizontal and vertical planes. Kerosene and other fuel based lighting systems are poor for reading and performing other such tasks. Kerosene lamps deliver between 1 and 6 lx (lumens per square meter), compared to typical western standards of 300
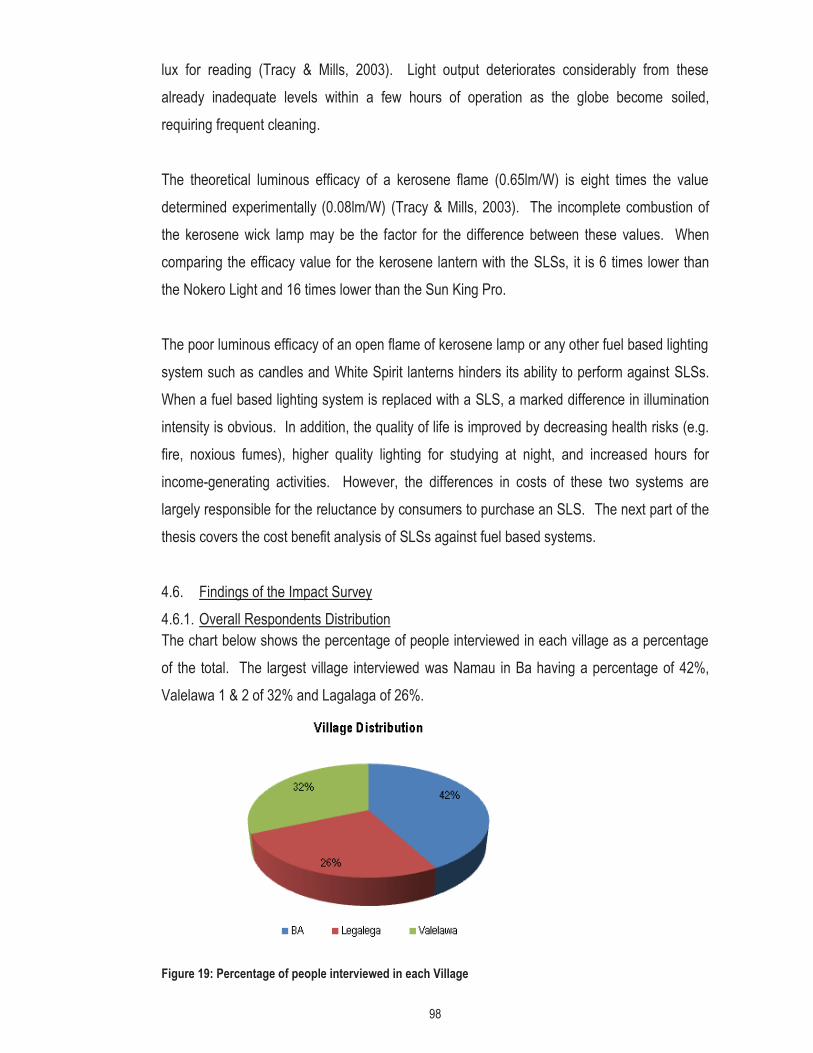
98
lux for reading (Tracy & Mills, 2003). Light output deteriorates considerably from these already inadequate levels within a few hours of operation as the globe become soiled, requiring frequent cleaning.
The theoretical luminous efficacy of a kerosene flame (0.65lm/W) is eight times the value determined experimentally (0.08lm/W) (Tracy & Mills, 2003). The incomplete combustion of the kerosene wick lamp may be the factor for the difference between these values. When comparing the efficacy value for the kerosene lantern with the SLSs, it is 6 times lower than the Nokero Light and 16 times lower than the Sun King Pro. The poor luminous efficacy of an open flame of kerosene lamp or any other fuel based lighting system such as candles and White Spirit lanterns hinders its ability to perform against SLSs. When a fuel based lighting system is replaced with a SLS, a marked difference in illumination intensity is obvious. In addition, the quality of life is improved by decreasing health risks (e.g. fire, noxious fumes), higher quality lighting for studying at night, and increased hours for income-generating activities. However, the differences in costs of these two systems are largely responsible for the reluctance by consumers to purchase an SLS. The next part of the thesis covers the cost benefit analysis of SLSs against fuel based systems. 4.6. Findings of the Impact Survey 4.6.1. Overall Respondents Distribution The chart below shows the percentage of people interviewed in each village as a percentage of the total. The largest village interviewed was Namau in Ba having a percentage of 42%, Valelawa 1 & 2 of 32% and Lagalaga of 26%.
Figure 19: Percentage of people interviewed in each Village

99
It is a tradition in the rural areas of Fiji that males generally make decisions whilst females carry out home chores. This was very much evident in the survey done. During the interviews, males from each household came forward for the interview while females were reluctant to answer the questions and make any decisions. In very few cases wives came forward in the presence of husbands to answer queries. However, females and children are more impacted by having good lighting in the house than males. The distribution is represented in the following representation.
Figure 20: Participants distribution by Gender
4.6.2. Lighting Appliance Preference Before the installation of the SLS, the main source of lighting in the villages had been through diesel generators (limited hours where available) and mostly kerosene lamps. In Valelawa, 67% percent of people use a combination of diesel generator and kerosene lamps, while 37% people use it in Namau, Ba and 40% in Lagalaga. The second common combination among the villages was kerosene and white spirit lanterns followed by the candles and kerosene lanterns combination. The primitive ways of lighting such as candles are phasing out slowly. People are adapting to new technology available to them that is cost effective and reliable. 4.6.3. SLS - A Better Lighting System Approximately 50% of the people interviewed from the villages chose solar as the best system available for lighting. These are the people who understood the concept behind the system, appreciated the system and agreed that it is clean and can yield multi-room-illumination Around 33% complained about thecost and maintenance of the system and had a negative opinion about the systems as well. This particularly happened when there were people in the village who had not been trained to properly maintain the system installed. There are

100
instances whereby the modules are not positioned properly and, in some cases, are in the shade. While interviewing these people, it seemed that they did not have confidence in the new system. They responded that SLSs cannot provide the services they would get from a generator. Around 17% of the villages supported SLSs, however, they had a view that mix combination of SLSs and traditional lighting systems work better for them. While interviewing specific group of people, farmers mentioned that it was easier to locate farm tools and equipment in early morning using the portable SLS. The housewives revealed that it was easy for them to have ritual ceremonies, hosting visitors, preparing meals and also organising activities. Children use the system while studying and got motivated in carrying out their school work. The men of the village found it useful during gatherings and meeting friends. People also found the SLS to pose less fire risks and provided security as it covers a wide area and is visible from a far distance. 4.6.4. Maintenance of the System The types of SLSs distributed were of various specifications and models. The basic wiring connections for larger systems like the Barefoot power system were demonstrated to the people during the distribution. Few were also trained on the basic maintenance of the systems and change of accessories. Often when recipients had issues, these helpers moved around to rectify the issues. Many a time the helpers were not able to assist the owner due to major faults to the lighting systems or due to physical damage. Most people tried to modify the system by extending the length of wires to cover other parts of the home. Improper module orientation with shading was observed in most of the houses. Some people get restless when the lights do not function and intend to disconnect the system and perform modifications. The basic instructions on how to connect, position the module and maintain SLSs seem to be lacking. There seemed to be a huge issue of maintenance in the village of Valelawa and some of the recipients made a decision to return the system. 4.6.5. Situation on the Ground The distribution of SLSs to the four villages was part of the banish the kerosene lamp project funded by the French Government. The lighting systems were distributed among people on the condition that they will pay back the price in installments. Prior to the distribution of lighting systems, villagers mainly used four types of fuel to light up their homes i.e. kerosene, candles, white spirit and diesel. The most popular combination in the village was kerosene lamp and diesel generator. The diesel generator is used mostly from 6pm to 10pm to produce
101
light in the sitting room, in the veranda and the kitchen. This is due to the size of the generator and the fuel cost. The kerosene lamp is also used from time to time during night and early morning when housewives wake up for cooking or when kids wake up early to study. On average, three to four rooms or places are lit up by the fuel based lighting systems. The second combination was the white spirit and kerosene lantern followed by the kerosene lantern and candles combination. The average cost for purchasing of fuel or candles per month per household is provided in the section below. The section also shows the amount of savings when different combinations are used to replace the traditional lighting systems. Usually one SLS is used to replace one traditional lighting system. A household with four lamps system could replace the whole arrangement. Smaller systems with one or two lamps could replace 1 to 1.5 traditional lighting systems. People found it difficult to fork out a huge sum of money in order to purchase the system. The main reason behind this was lack of knowledge of payback time and long term savings. The cost analysis clearly shows that if a $75 system is bought, 6 months of savings can recover initial cost and the rest could be used to purchase accessories, buy bigger systems with more number of lamps, upgrade the system and to install another system for more lighting. During the survey, various technical issues were observed such as batteries not supporting the system for long and no mechanism to replace them due to limited supply and high costs. Most of the houses that were visited had issues with wiring and a few tried to modify the system to extend the wires to cover other rooms. The users also complained about charging the system due to poor solar irradiance during cloudy days. Lack of technical knowledge and long-term savings awareness were the biggest challenges observed during the survey. Though the people enjoy the usage of SLS, they take their time in clearing their dues. The village that cleared all the dues during the time of the survey was Lagalaga. The villagers even requested for more systems. 4.6.6. Economic Impact of the Solar Lighting System (SLS) According to the survey, most of the households are dependent on diesel & kerosene lanterns, white spirit & kerosene lanterns and kerosene lanterns and candle combinations. The table below provides the yearly usage and expenditure of using the mentioned fuel based systems.

102
Table 19: Cost of utilising various combinations of the systems Combination
Average rooms to be illuminated
Appliance used
Number of systems
Unit Cost (FJD)
Fuel Usage per month
Usage per year
Cost of fuel per liter (2015 Price FJD)
Total Cost per year (FJD)
1. Diesel Generator and Kerosene Lantern
3 Bedroom 1 Sitting room 1 Verandah 1 kitchen
Generator supply electricity for TV, sitting room light, Verandah light and kitchen light and Kerosene Lantern provides light in the bedroom.
1 Diesel Generator - Rated Power: 2kW Rated Current: 3A Rated Voltage: 110-240v Speed: 3000r/m Frequency: 50/60 Hz Output Type: AC Single Phase 3 Kerosene Lantern
Diesel Generator - $750 Kerosene Lantern - $30
15 liters of Diesel and 9 liters of Kerosene
180 liters of Diesel and 108 liters of Kerosene
Diesel: $1.79 Kerosene: $1.67
Diesel: $322.20 Kerosene: $180.36 Total cost: $502.56
2. White Spirit Lantern and Kerosene Lantern
2 Bedroom 1 Sitting room 1 Verandah 1 kitchen
White Spirit light support sitting room, verandha and kitchen and Kerosene Lantern
2 White Spirit Lantern 2 Kerosene Lantern
White spirit Lantern - $65 Kerosene Lantern - $30
12 liters of White Spirit and 6 liters of Kerosene
144 liters of White Spirit and 72liters of Kerosene
White Spirit: $2.21 Kerosene: $1.67
White Spirit: $318.24 Kerosene: $120.24 Total cost: $438.48
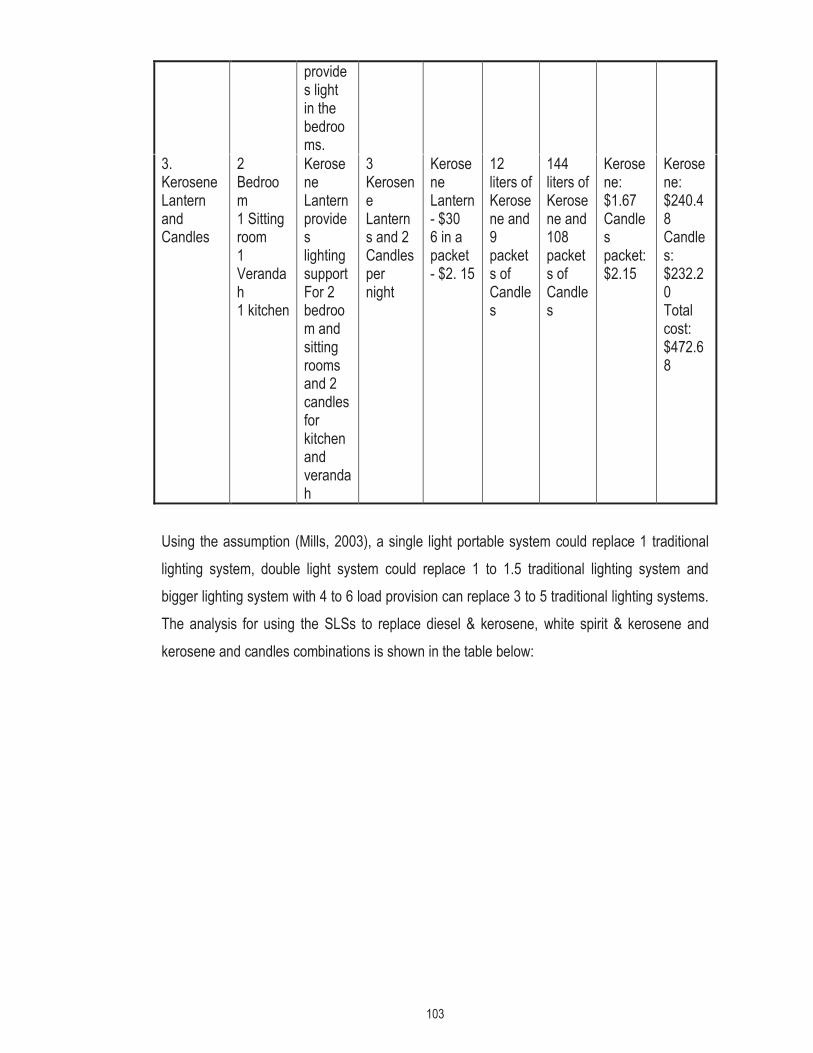
103
provides light in the bedrooms.
3. Kerosene Lantern and Candles
2 Bedroom 1 Sitting room 1 Verandah 1 kitchen
Kerosene Lantern provides lighting support For 2 bedroom and sitting rooms and 2 candles for kitchen and verandah
3 Kerosene Lanterns and 2 Candles per night
Kerosene Lantern - $30 6 in a packet - $2. 15
12 liters of Kerosene and 9 packets of Candles
144 liters of Kerosene and 108 packets of Candles
Kerosene: $1.67 Candles packet: $2.15
Kerosene: $240.48 Candles: $232.20 Total cost: $472.68
Using the assumption (Mills, 2003), a single light portable system could replace 1 traditional lighting system, double light system could replace 1 to 1.5 traditional lighting system and bigger lighting system with 4 to 6 load provision can replace 3 to 5 traditional lighting systems. The analysis for using the SLSs to replace diesel & kerosene, white spirit & kerosene and kerosene and candles combinations is shown in the table below:
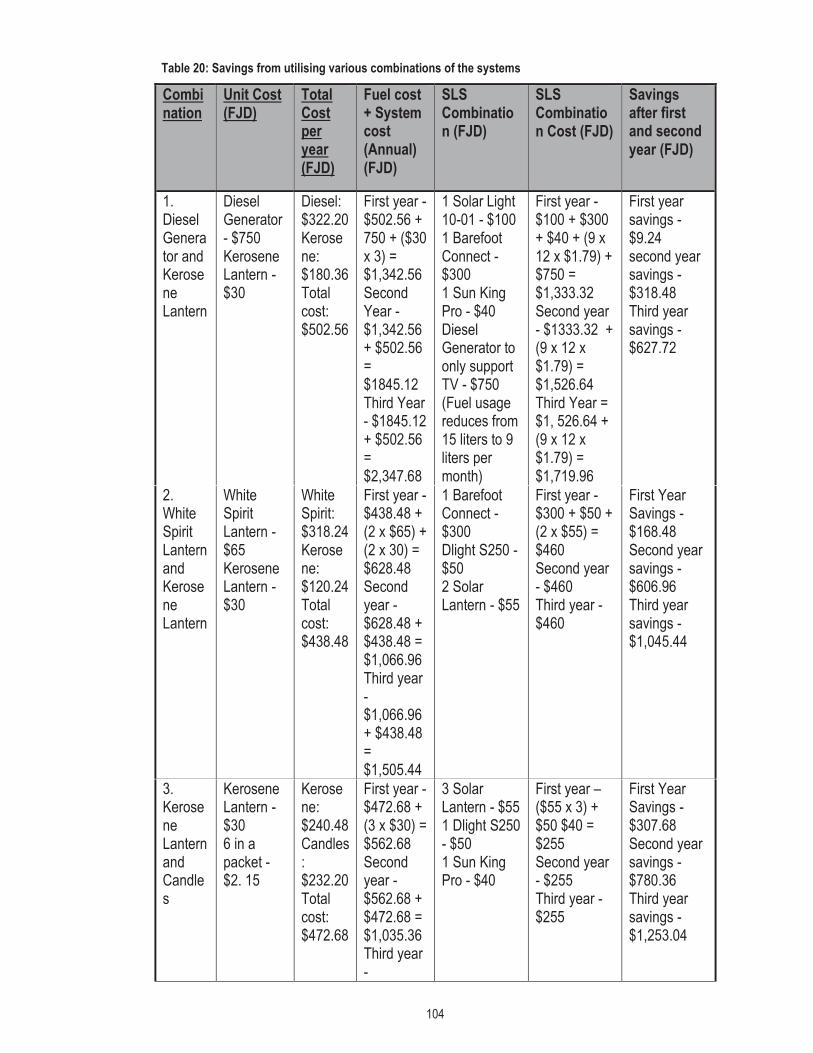
104
Table 20: Savings from utilising various combinations of the systems
Combination
Unit Cost (FJD)
Total Cost per year (FJD)
Fuel cost + System cost (Annual) (FJD)
SLS Combination (FJD)
SLS Combination Cost (FJD)
Savings after first and second year (FJD)
1. Diesel Generator and Kerosene Lantern
Diesel Generator - $750 Kerosene Lantern - $30
Diesel: $322.20 Kerosene: $180.36 Total cost: $502.56
First year - $502.56 + 750 + ($30 x 3) = $1,342.56 Second Year - $1,342.56 + $502.56 = $1845.12 Third Year - $1845.12 + $502.56 = $2,347.68
1 Solar Light 10-01 - $100 1 Barefoot Connect - $300 1 Sun King Pro - $40 Diesel Generator to only support TV - $750 (Fuel usage reduces from 15 liters to 9 liters per month)
First year - $100 + $300 + $40 + (9 x 12 x $1.79) + $750 = $1,333.32 Second year - $1333.32 + (9 x 12 x $1.79) = $1,526.64 Third Year = $1, 526.64 + (9 x 12 x $1.79) = $1,719.96
First year savings - $9.24 second year savings - $318.48 Third year savings - $627.72
2. White Spirit Lantern and Kerosene Lantern
White Spirit Lantern - $65 Kerosene Lantern - $30
White Spirit: $318.24 Kerosene: $120.24 Total cost: $438.48
First year - $438.48 + (2 x $65) + (2 x 30) = $628.48 Second year - $628.48 + $438.48 = $1,066.96 Third year - $1,066.96 + $438.48 = $1,505.44
1 Barefoot Connect - $300 Dlight S250 - $50 2 Solar Lantern - $55
First year - $300 + $50 + (2 x $55) = $460 Second year - $460 Third year - $460
First Year Savings - $168.48 Second year savings - $606.96 Third year savings - $1,045.44
3. Kerosene Lantern and Candles
Kerosene Lantern - $30 6 in a packet - $2. 15
Kerosene: $240.48 Candles: $232.20 Total cost: $472.68
First year - $472.68 + (3 x $30) = $562.68 Second year - $562.68 + $472.68 = $1,035.36 Third year -
3 Solar Lantern - $55 1 Dlight S250 - $50 1 Sun King Pro - $40
First year – ($55 x 3) + $50 $40 = $255 Second year - $255 Third year - $255
First Year Savings - $307.68 Second year savings - $780.36 Third year savings - $1,253.04
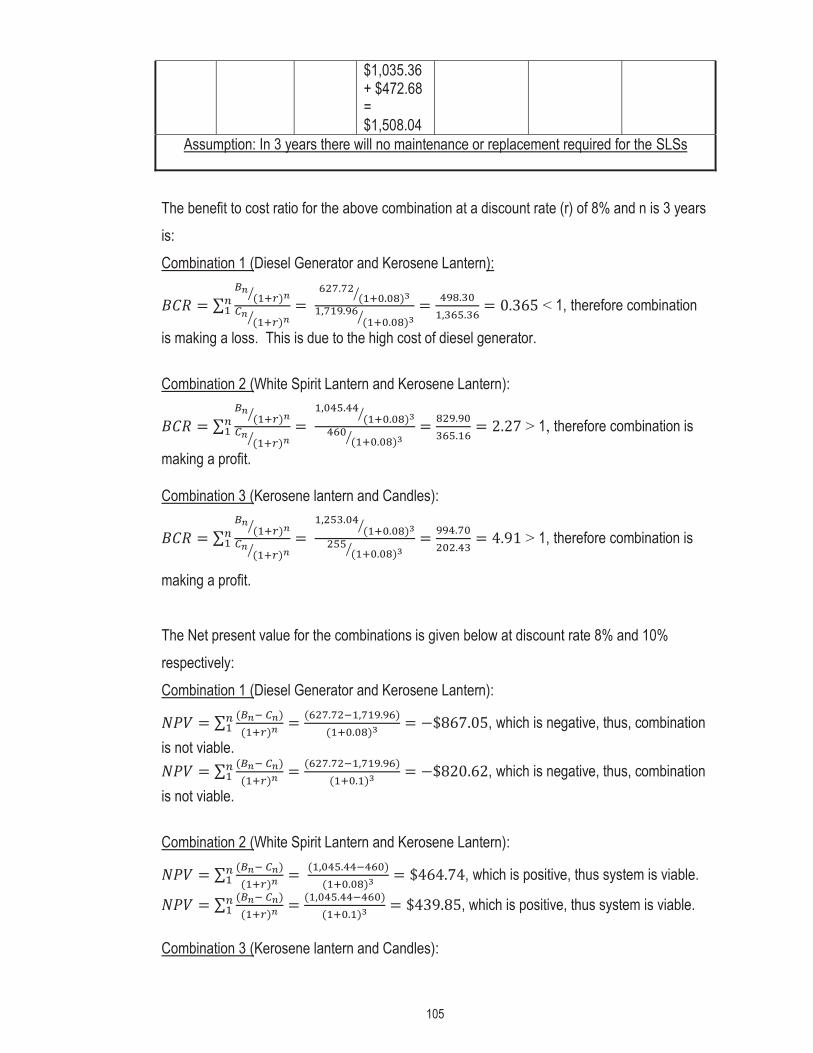
105
$1,035.36 + $472.68 = $1,508.04
Assumption: In 3 years there will no maintenance or replacement required for the SLSs
The benefit to cost ratio for the above combination at a discount rate (r) of 8% and n is 3 years is: Combination 1 (Diesel Generator and Kerosene Lantern):
˂ 1, therefore combination
is making a loss. This is due to the high cost of diesel generator. Combination 2 (White Spirit Lantern and Kerosene Lantern):
˃ 1, therefore combination is
making a profit. Combination 3 (Kerosene lantern and Candles):
˃ 1, therefore combination is
making a profit. The Net present value for the combinations is given below at discount rate 8% and 10% respectively: Combination 1 (Diesel Generator and Kerosene Lantern):
, which is negative, thus, combination is not viable.
, which is negative, thus, combination is not viable. Combination 2 (White Spirit Lantern and Kerosene Lantern):
, which is positive, thus system is viable.
, which is positive, thus system is viable. Combination 3 (Kerosene lantern and Candles):

106
, which is positive, thus system is viable.
, which is positive, thus system is viable. The internal rate of return (IRR) of the combinations is calculated as follows: Combination 1 (Diesel Generator and Kerosene Lantern):
Combination 2 (White Spirit Lantern and Kerosene Lantern):
0.453 Combination 3 (Kerosene lantern and Candles):
The simple payback period (SPP) of the combination is given below: Combination 1 (Diesel Generator and Kerosene Lantern):
Years (approximately, 2 years and 9 months)
Combination 2 (White Spirit Lantern and Kerosene Lantern):
Years (approximately, 6 months) Combination 3 (Kerosene lantern and Candles):
Years (approximately, 3 months)
On a comparative note, SLSs have economic and environmental benefits to a fuel based system. Quantitatively, SLSs are the most cost-effective solution and have payback times ranging from several months to two years. Most households owned diesel generators which were used to operate TVs and tube lights. It was obvious that SLSs would not be able to substitute diesel generators, thus, for households that used the combination of diesel generator and kerosene lantern, only kerosene lanterns were replaced by the SLSs. Due to the high cost of diesel generator plus operational cost of fuel and maintenance, it would take a longer period to recover the investment. As per the calculations, the SPP to replace this combination partially with SLSs was 2 years and 9 months. Users buy a kerosene/white spirit lantern for a small amount initially and then make small weekly payments for fuel. SLSs, on the other hand, have a much higher initial capital

107
investment, which is a deterrent for would-be buyers. Thus, for replacing combinations such as white spirit & kerosene lanterns and kerosene lantern & candles with SLSs, the key parameters such as BCR, NPV, IRR at a discount rate of 8% and 10% was viable. The SPP to replace white spirit & kerosene lanterns with SLSs was 6 months and 3 months for kerosene lantern & candles. Social gains, such as better quality of light, increased safety and minimised risks of fire, improved child performance in schools, cleaner atmosphere with reduced smoke, improved leisure time, and so forth, add value to the analysis above and make the BCR and NPV much more acceptable. The cost of solar modules and the system will most probably decrease further in the future due to demand, thus, the BCR and NPV would improve even more. 4.6.7. Issues with the Installation of Solar Lighting Systems (SLSs) Modules were placed flat on the roof with no proper orientation. Connections were not done properly, at some instances; the module was directly connected to load, especially for the Barefoot systems. It was also noticed that children were playing with wires and modified connections in order to operate other electrical appliances such as a radio. Systems which had charge controllers were not properly installed. The battery got fully discharged and the module was not able to bring the charge above the cut off value due to irregular irradiance.

108
Chapter 5 – Conclusions and Recommendations SLSs have been successful in providing light to remote areas in the world where grid connection is impossible due to the dispersed nature of the islands/villages. Various studies in countries like India, Nepal, Bangladesh, Myanmar, Zambia, South Africa, China, Kenya, Sri Lanka, Indonesia, Zimbabwe, Morocco and such, have shown the advantage of utilising the SLS in order to bring change to the living standards of the people. The present study deals with Fiji, a small developing island state, where rural electrification is an issue and policy makers are continuously trying various means to provide electricity to the remote locations on more than 100 Islands. SLSs including small solar lamps, solar flashlights and lanterns, or solar home systems are promising new technological options. Many firms in Fiji import SLSs for distribution in remote areas. However, the quality of the lighting products has become a serious issue. There must be a quality monitoring system in place for all imported or locally assembled products. Field tests are vital to see the actual performance of the systems under real conditions and also to provide a baseline to help establish standards. This study has attempted to characterise various SLSs available in Fiji. This was accomplished by performing quality tests using the Fraunhofer test method. The module characteristics, solar run time, light distribution characteristic over a plane surface and over a range of 360 degrees of lights, system efficacy and economic benefit of replacing fuel based systems with SLSs were determined. Systems tested were of mixed category and belong to the group of ambient, task and portable lights. The Barefoot Connect and Solar 10-01 were part of the ambient lighting system. These systems are used to illuminate rooms or the surroundings. The Sun King Pro, Dlight Kiran, Dlight S250, Nokero and Solar Lantern are used, both, as task and as portable lighting systems. In the ambient category, the most efficient module was for the Solar 10-01 system with the efficiency value of 12.92% and Barefoot Connect with the value of 7.68%. For the task lighting category, the most efficient module was for Sun King Pro with the efficiency value of 15.01% followed by Dlight S250 system with the value of 12.82%. The Solar Lantern and Nokero had the efficiency value of 10.53% and 5.30% respectively. However, determining only module characteristics does not give a clear indication of the most efficient and suitable system. Thus, other tests like Solar Run Time and Light Distribution Characteristics were performed.

109
For the ambient category, the best run time result was obtained for the Solar 10-01 system with autonomous time of 360 minutes and an average luminous flux of 314.8lm, followed by the Barefoot Connect system with autonomous time of 526 minutes and an average luminous flux of 48.7lm. In the task lighting category, Dlight S250 and Sun King Pro system performed well in the test. The Dlight S250 maintained autonomous time of 444 minutes and an average luminous flux of 62.7lm while Sun King Pro recorded the autonomous time of 345 minutes with an average luminous flux of 12lm. The Solar Lantern and Nokero system had a decreasing average luminous flux with increasing time. Furthermore, the light distribution characteristics over a range of 360 degrees showed that the design structure of light affects the light distribution pattern. The illumination level differs from angle to angle. In the ambient light category, Barefoot Connect and Solar 10-01 system showed a similar pattern of light distribution. However, Solar 10-01 system recorded the highest illumination value. These two systems did not produce any pattern on the other side of the axis. For the task lights, the most efficient pattern was noted for the Solar Lantern and Dlight Kiran system since it covers the whole 360 degree range. The highest illumination value was for the Solar Lantern, followed by Sun King Pro, then Dlight S250 and then the Nokero system. Moving on, the light distribution characteristics over a surface showed that the Solar 10-01 system covers the usable area of 0.64m2 with an average illuminance of 113.79lx compared to Barefoot Connect which recorded the usable area of 0.91m2 with an average illuminance of 32.08lx. In the task light category, Nokero and Dlight Kiran covered the usable surface area of 0.25m2 and 0.14m2 respectively with an average illuminance of less than 10lx. Solar Lantern recorded the highest average illuminance of 111.62lx with usable area of 0.56m2. Dlight S250 had a usable area of 0.14m2 and an average illuminance of 88.65lx while Sun King Pro had a usable are of 0.2m2 with an average illuminance of 69.18lx. Comparing the efficacy values for the SLSs, for the ambient lighting systems, Solar 10-01 recorded 9.41 lumens per watt while Barefoot Connect system had 7.67 lumens per watt. For the task lights, Sun King Pro recorded the highest efficacy of 10.93 lumens per watt, Dlight S250 recorded 9.34 lumens per watt, and Solar Lantern registered the value of 7.67 lumens per watt followed by Nokero with the value of 3.86 lumens per watt. Looking at the performance of each system, for the ambient lighting systems, the Solar 10-01 was a better

110
system when compared to the Barefoot Connect system however; Barefoot Connect system should not be ruled out of the competition. For the task lighting systems, Sun King Pro and Dlight S250 systems could be categorised as most economical systems. They all possess key qualities which make them the most efficient and widely used system in Fiji. This work also involved a survey that was carried out to determine the socio-economic impacts of the SLSs. The major aim of the survey was to find out how these systems have changed the lives of people in rural areas where grid power supply has not reached till today. For decades, these people have used traditional lighting systems for their daily needs.
Villages selected for this study were part of the “Banish the kerosene lamp project” funded by the French Government. These were Namau, Valelawa 1 & 2 and Lagalaga. Various lighting systems were distributed and the villagers were encouraged to payback the cost in installments. The recovery was essential for the expansion of project to cover other needy areas. Before asking questions on the impact of SLSs in their lives, a background study was carried out on the village itself. The background of the village was studied, including the number of households in the village and their distance from town; the main source of income; the number of schools, hospitals or health centers and other government services available; transportation; the kinds of traditional lighting systems the villagers use; the forms of natural disasters affecting the villages; how the villagers maintain their houses or schools since expertise is not available in the village; how often people gather in the village for functions; and how villagers provide light in functions held at night. This information was vital to understanding the economic background of the village.
The second phase of the study was to interview individuals, households and groups of people to determine the impact of the SLS which was distributed. A major finding of the thesis is the impact on the household lighting utilisation and benefits from savings on fuel and purchase of traditional lighting systems. The introduction of SLSs clearly improved the social lives of people in the village. Men, women, children and the elderly can perform their respective duties better and in an organised manner as well as enjoy their leisure time which had been a bit of challenge in the earlier days.
Generally, smaller systems with one or two lamps were found to replace 1 to 1.5 fuel based lighting systems which save approximately 2-3 litres of fuel per month. There were substantial differences in savings when utilising SLSs over a period of time. It was observed that families

111
mostly had three combinations of fuel based lighting systems. The first was diesel generator and kerosene lantern combination, the second was white spirit lantern and kerosene lantern combination, and the third was the kerosene lantern and candles combination. It was very difficult to replace the diesel generator since it was utilised for the operation of television and tube lights. Watching television was one of the important parts for any gathering in the village. Usually, villagers that did not have a television sets used to meet at a house where a television and generator were available. For this particular combination, buying a generator and a couple of SLSs to replace the kerosene lantern was the fixed cost and purchasing of diesel to run the generator was the operational cost. The SPP for the combination was 2 years 9 months. Replacing combinations such as white spirit & kerosene lanterns and kerosene lantern and candles SLSs, the key parameters such as BCR, NPV, IRR at a discount rate of 8% and 10% was viable. The SPP to replace white spirit & kerosene lanterns with SLSs was 6 months and 3 months for kerosene lantern & candles. Households will also save an estimate $17 - $30 per month thereafter, with an allowance of 10% for maintenance, like lamp and battery replacement. After the survey it was found that the impacts of SLSs in the villages were genuine and long-lasting. Users were impressed with the improved lighting and eager to get more systems. A positive change was noticed in both, social and economic contexts. Socially, SLSs give better quality of light than prior arrangement, increased safety and minimised risks of fire, improved child performance in schools, reduced smoke in the atmosphere, improved leisure time and storytelling. Owning a SLS also contributed to the status of a household in the village.
Recommendations
The study was a learning experience as it gave me an opportunity to visit the remote locations in Fiji where grid electricity is a challenge. It was a humbling experience to observe the challenges faced by people in getting access to electricity and I am certain there are many more areas in Fiji which encounter the same plight. The Fijian Government, through the FEA, DOE and other independent power providers, is trying its best to supply electricity to each and every household. However, having over 300 far-flung, related islands makes it difficult for the Government to achieve this task. International practices and studies have endorsed that grid connection is an expensive exercise and may not be beneficial for the economy in the long run

112
due to the high operational and maintenance costs involved. Studies in parts of Africa, Asia and Latin America have shown that off-grid lighting product is the cheaper and best possible option for providing electricity to the people not connected to grid. However, the initiative of providing off-grid products such as SHSs and SLSs needs to be planned well before implementation. The number of off-grid products entering the Fiji market is increasing day by day. Some shops are specialised in lighting products and become distributors while others sell the product to generate some extra revenue. Lighting systems are not core products for most businesses in Fiji. The following recommendations on improving the sustainability and scalability of rural electrification project and distribution of off-grid lighting product initiative has been made based on the field visits carried out whilst compiling the thesis and knowledge gathered from the studies carried out abroad. The recommendations cover a broad range of areas, from policy development and regulations, planning and implementation; to technical aspects of SHS/SLS design and quality assurance; to finance models and subsidy schemes; and capacity development. It has to be noted that the SLSs are the most basic component of the overall electricity access process and are useful as the entry-level products while the communities progress to SHSs and mini-grid systems. Policy Development and Regulation There is need for a robust policy on the off-grid lighting products clearly outlining the obligation of Ministry and Government Departments, conditions of importing off-grid products, quality assurance mechanisms, provision for soft loans and subsidies etc.. Planning and Implementation Importing off-grid lighting products is expensive; thus, Government must engage in partnership arrangements and sign agreements with overseas manufacturers and distributors of off-grid lighting products to get good quality lights at a cheaper price. They must also provide investment incentives to the manufacturers or distributors of off-grid lighting products to enable them to invest in Fiji and other PICs. Other initiatives could include, gathering baseline data on households without electricity and analysing their energy demands, setting up consumer related schemes and having contact point or offices covering the whole area of Fiji and providing relevant information on the off-grid lighting products to all stakeholders.
113
Technical Aspects and Quality Assurance Quality assurance framework and standards should be developed, in consultation with other partners and counterparts, to test the off-grid products coming to Fiji. A Testing Centre or Lab could be set up where lighting systems could be tested as per the standards. If the lighting system does not meet certain stipulated standards, the consignment must be returned to the vendor. A system that satisfies the requirements should be provided with a certificate that is publically advertised to create awareness. The lighting system should be available in all the districts and islands so that people can visit the nearest shop if they need the product. The shops must also ensure that system accessories are also available in case there is a need for replacement. Repair and maintenance facilities should also be available in districts and islands to attend to faults. Financing Models and Subsidy Schemes Government and other finance institutions must come up with micro-finance and other suitable schemes to support people with no access to electricity. A good subsidy or incentive scheme must be worked out to assist these people. People must be encouraged to move away from the traditional lighting systems. This will only happen if the cost of the lighting system is reasonable, which is why Government subsidy is vital. Loan schemes with minimal interest rates, or higher purchase schemes/facilities should also be available. For these schemes to be sustainable a firm arrangement for collection of installment payment should also be in place. Recently introduced mobile money-transfer services such as M-Paisa, SMS Banking or others should be utilised for payment collection. Capacity Building Government and the relevant Ministries must create awareness among people on the usage of off-grid lighting products and the advantages of using the system over traditional lighting systems. Each particular location in Fiji needs to receive basic training on managing, operating and repairing off-grid lighting products. Refresher trainings should also be organised to revisit knowledge gained in previous trainings. Basic training in cost benefit analysis is also vital and people must be able to carry out a cost benefit analysis to gauge how much they would save by replacing traditional lighting system with off-grid lighting system.
The End

114
Annex 1 - References 1. Akella, A., Saini, R. & Sharma, M. (2009) Social, economic and environmental impacts
of renewable energy systems. Renewable Energy. 34, pp 390-396. 2. Amazon Try Prime (1996) Johnson level & tool and tool 700 magnetic angle locator.
[Online] Available from: http://www.amazon.com/Johnson-Level-Tool-700-Magnetic/dp/B00004T807 [Accessed 13 August 2015].
3. Asia Development Bank (2011). Asia solar energy initiative - a primer. Asia Development Bank Initiative. [Online] Available from: http://www.se4all.org/wp-content/uploads/2014/12/SE4All-Advisory-Board-Finance-Committee-Report_04072015.pdf [Accessed 30 March 2015].
4. Ballesteros, A., Norford, E., Nagle, T., Yonavjak, L. & Alzner,S (2013) Keys to achieving
universal energy access series - implementation strategies for renewable energy services in low-income, rural areas. World Resources Institute. [Online] Available from: http://www.wri.org/sites/default/files/pdf/implementation_strategies_renewable_energy_services_low_income_rural_areas.pdf [Accessed 1 January 2016].
5. Bond, M., Aye, L. & Fuller, R. (2010) Solar lanterns or solar home lighting systems – Community preferences in East Timor. Renewable Energy. 35 (5), pp, 1076–1082.
6. Bopp, G., Lux, S., Pfanner, N., Strasser, M. & Wiezorek, C. (2009) Stand-alone led
lighting systems quality screening – report task 2. Fraunhofer ISE. 7. Buragohain, T. (2012) Impact of Solar Energy in Rural Development in India.
International Journal of Environmental Science and Development. 3 (4), pp 334 – 338. [Online] Available from: http://www.ijesd.org/papers/242-B10021.pdf [Accessed 10 February 2013].
8. Chandrasekar, B. & Kandpal, T. (2004) Effect of financial and fiscal incentives on the effective capital cost of solar energy technologies to the user. Solar Energy. 78, pp 147-156.
9. ChemMatters (2007) The Captivating Chemistry of Candles. [Online] Available from: http://chicagoacs.net/statefair/CD-2015/ChemMatters/2007_12_smpissue.pdf [Accessed 28 June 2016].
10. Chen, Y., Gonul, G. & Zieroth, G. (2015) Fiji renewables readiness assessment, International Renewable Energy Assessment (IRENA). [Online] Available from: http://www.irena.org/DocumentDownloads/Publications/IRENA_RRA_Fiji_2015.pdf [Accessed 20 January 2016].
115
11. Chow, J. (2010) Assessment of Solar Home Systems (SHS) for Isolated Rural
Communities in Vanuatu Using Project Lifecycle/Sustainability Framework. Master’s thesis. Michigan Technological University. [Online] Available from: https://www.mtu.edu/peacecorps/programs/civil/pdfs/jack-chow-thesis-final.pdf [Accessed 28 October 2014].
12. Chylan (2014) Crestone solar light bulb. [Online] Available from: http://www.chylan.ca/crestone-solar-light-bulb.html [Accessed 14 February 2015].
13. Civic Solar (2009) How do you calculate the efficiency of a solar panel? [Online] Available from: http://www.civicsolar.com/forum/11815/how-do-you-calculate-efficiency-solar-panel [Accessed 13 August 2015].
14. Dornan, M. (2014) Access to electricity in small island developing states of the pacific: issues and challenges. Renewable and Sustainable Energy Reviews, 31, pp 726-735.
15. Dornan, M. (2011) Solar-based rural electrification policy design: The Renewable Energy Service Company (RESCO) model in Fiji. Renewable Energy, 36, pp 797-803.
16. Energy Saver (2014) Energy efficient lighting technology report. Australia [Online] Available from: http://www.environment.nsw.gov.au/resources/business/140017-energy-efficient-lighting-tech-rpt.pdf [Accessed 23 June 2016]
17. Energy Quest (1994) The Energy Story. [Online] Available from: www.energyquest.ca.gov [Accessed 21 March 2015].
18. Extech Instruments (2015) Heavy Duty Light Meter. [Online] Available from: http://www.extech.com/instruments/product.asp?catid=10&prodid=56 [Accessed 13 August 2015].
19. Extech Instruments (2015) Infrared thermometer with built-in laser pointer. [Online] Available from: http://www.extech.com/instruments/product.asp?catid=62&prodid=670 [Accessed 13 August 2015].
20. Fastenal Products (2015) EXTECH MN15A max 10A DC, 600V AC/DC, 20 MΩ digital
multimeter. [Online] Available from: https://www.fastenal.com/products/details/0763285 [Accessed 13 August 2015].
21. Fiji Department of Energy (2004) Renewable energy report – Fiji. Department of Energy consultancy by the Asian and Pacific Centre for Transfer of Technology (APCTT). [Online] Available from: http://www.fdoe.gov.fj/ReportsRenewableEnergy/Fiji%20RenewableEnergyAssessmentMarch122004.pdf [Accessed 17 August 2012].
116
22. Florida Solar Energy Center (2007) Cells, modules and arrays. [Online] Available from: http://www.fsec.ucf.edu/en/consumer/solar_electricity/basics/cells_modules_arrays.htm [Accessed 26 July 2014].
23. Florida Solar Energy Center (2007) How PV cells work. [Online] Available from: http://www.fsec.ucf.edu/en/consumer/solar_electricity/basics/how_pv_cells_work.htm [Accessed 26 July 2014].
24. Florida Solar Energy Center (2007) How PV system works. [Online] Available from: http://www.fsec.ucf.edu/en/consumer/solar_electricity/basics/how_pv_system_works.htm [Accessed 26 July 2014].
25. Florida Solar Energy Center (2007) Types of PV systems. [Online] Available from: http://www.fsec.ucf.edu/en/consumer/solar_electricity/basics/types_of_pv.htm [Accessed 26 July 2014].
26. GCell (2015) Dye sensitized solar cells. [Online] Available from: http://gcell.com/dye-sensitized-solar-cells [Accessed 21 October 2015].
27. Glenergy Sensible Energy Alternatives (2014) Solar phone charger & led lamp - sun
king pro. [Online] Available from: http://glenergy.ca/products/sun-king-pro [Accessed 15 March 2013].
28. Global Issues - Social, Political, Economic and Environmental Issues That Affect Us All, (2012). Pacific island sets renewable energy record. [Online] Available from: http://www.globalissues.org/news/2012/10/26/15141 [Accessed 14 November 2014].
29. Go Green Solar.com (2006) Daystar DS-05A Solar Digital Meter. [Online] Available from: http://www.gogreensolar.com/products/daystar-ds-05a-solar-digital-meter [Accessed 13 August 2015].
30. Go Solutions.com (2011) Education center – PV technology. [Online] Available from: http://www.gosunsolutions.com/education.php [Accessed 7 June 2011].
31. GOGLA (2014) Investment and finance study for off - grid lighting. An A. T. Kearnay report in collaboration with GOGLA. [Online] Available from: http://global-off-grid-lighting-association.org/wp-content/uploads/2014/09/Investment-Study-Vol-2.pdf [Accessed 6 November 2014].
32. Guay, J. (2013) Solar Crowdfunding's Lessons Learned. Huffington Post. [Online] Available from: http://www.huffingtonpost.com/justin-guay/solar-crowdfundings-lesso_b_3751247.html [Accessed 1 January 2016].
33. Gustavsson, M. (2007) With time comes increased loads - An analysis of solar home system use in Lundazi, Zambia. Renewable Energy. 32, pp 796 - 813.

117
34. Gustavsson, M. & Ellegard, A. (2004) The impact of solar home systems on rural livelihoods - experiences from the Nyimba energy service company in Zambia. Renewable Energy. 29, pp, 1059 – 1072.
35. Hak, T. Skova, S. Moldan, B. (2015). Sustainable Development Goals: A need for relevant indicators. Ecological Indicators. 60, pp 565 -573.
36. Intergovernmental Panel on Climate Change (IPCC) (2012) Renewable Energy Sources
and Climate Change Mitigation, Potsdam Institute for Climate Impact Research, Cambridge University Press
37. New York, USA. [Online] Available from: https://books.google.com.fj/books?hl=en&lr=&id=AjP9sVg01zoC&oi=fnd&pg=PR2&dq=Renewable+Energy+Sources+and+Climate+Change+Mitigation&ots=pZ2YX3cVBH&sig=hIazflnh103Bssgp50LBuWoap8o&redir_esc=y#v=onepage&q=Renewable%20Energy%20Sources%20and%20Climate%20Change%20Mitigation&f=false [Accessed 21 January 2016].
38. International Renewable Energy Agency (IRENA) (2015) SE4ALL Rapid Assessment
and Gap Analysis Report. [Online] Available from: http://www.se4all.org/wpcontent/uploads/2015/05/Fiji_RAGA.pdf [Accessed 30 November 2015].
39. International Renewable Energy Agency (IRENA), (2013a) Pacific Lighthouses Renewable energy opportunities and challenges in the Pacific Islands region – Cook
Islands. [Online] Available from: http://www.irena.org/DocumentDownloads/Publications/Cook/Islands.pdf [Accessed 29 September 2014].
40. International Renewable Energy Agency (IRENA), (2013b) Pacific Lighthouses Renewable energy opportunities and challenges in the Pacific Islands region –
Federated States of Micronesia. [Online] Available from: http://www.irena.org/DocumentDownloads/Publications/FSM.pdf [Accessed 21 September 2014].
41. International Renewable Energy Agency (IRENA), (2013c) Pacific Lighthouses Renewable energy opportunities and challenges in the Pacific Islands region – Fiji. [Online] Available from: http://www.irena.org/DocumentDownloads/Publications/Fiji.pdf [Accessed 28 August 2014].
42. International Renewable Energy Agency (IRENA), (2013d) Pacific Lighthouses Renewable energy opportunities and challenges in the Pacific Islands region – Kiribati.
118
[Online] Available from: http://www.irena.org/DocumentDownloads/Publications/Kiribati.pdf [Accessed 3 December 2014].
43. International Renewable Energy Agency (IRENA), (2013e) Pacific Lighthouses Renewable energy opportunities and challenges in the Pacific Islands region – Marshall
Islands. [Online] Available from: http://www.irena.org/DocumentDownloads/Publications/Marshall/Islands.pdf [Accessed 20 October 2014].
44. International Renewable Energy Agency (IRENA), (2013f) Pacific Lighthouses Renewable energy opportunities and challenges in the Pacific Islands region – Nauru. [Online] Available from: http://www.irena.org/DocumentDownloads/Publications/Nauru.pdf [Accessed 26 September 2014].
45. International Renewable Energy Agency (IRENA), (2013g) Pacific Lighthouses Renewable energy opportunities and challenges in the Pacific Islands region – Niue. [Online] Available from: http://www.irena.org/DocumentDownloads/Publications/Niue.pdf [Accessed 25 October 2014].
46. International Renewable Energy Agency (IRENA), (2013h) Pacific Lighthouses Renewable energy opportunities and challenges in the Pacific Islands region – Palau. [Online] Available from: http://www.irena.org/DocumentDownloads/Publications/Palau.pdf [Accessed 21 October 2014].
47. International Renewable Energy Agency (IRENA), (2013i) Pacific Lighthouses Renewable energy opportunities and challenges in the Pacific Islands region – Papua
New Guinea. Online] Available from: http://www.irena.org/DocumentDownloads/Publications/Papua%20New%20Guinea.pdf [Accessed 1 December 2014].
48. International Renewable Energy Agency (IRENA), (2013j) Pacific Lighthouses Renewable energy opportunities and challenges in the Pacific Islands region – Samoa. [Online] Available from: http://www.irena.org/DocumentDownloads/Publications/Samoa.pdf [Accessed 28 August 2014].

119
49. International Renewable Energy Agency (IRENA), (2013k) Pacific Lighthouses Renewable energy opportunities and challenges in the Pacific Islands region – Solomon
Islands. [Online] Available from: http://www.irena.org/DocumentDownloads/Publications/Solomon/Islands.pdf [Accessed 27 November 2014].
50. International Renewable Energy Agency (IRENA), (2013l) Pacific Lighthouses Renewable energy opportunities and challenges in the Pacific Islands region – Tokelau. [Online] Available from: http://www.irena.org/DocumentDownloads/Publications/Tokelau.pdf [Accessed 25 September 2014].
51. International Renewable Energy Agency (IRENA), (2013m) Pacific Lighthouses Renewable energy opportunities and challenges in the Pacific Islands region – Tonga. [Online] Available from: http://www.irena.org/DocumentDownloads/Publications/Tonga.pdf [Accessed 21 September 2014].
52. International Renewable Energy Agency (IRENA), (2013n) Pacific Lighthouses Renewable energy opportunities and challenges in the Pacific Islands region – Tuvalu. [Online] Available from: http://www.irena.org/DocumentDownloads/Publications/Tuvalu.pdf [Accessed 29 May 2014].
53. International Renewable Energy Agency (IRENA), (2013o) Pacific Lighthouses Renewable energy opportunities and challenges in the Pacific Islands region – Vanuatu. [Online] Available from: http://www.irena.org/DocumentDownloads/Publications/Vanuatu.pdf [Accessed 21 October 2014].
54. Island Voices Global Choices (2014). UN conference on small islands development
states (SIDs) – Samoa pathway. [Online] Available from: http://www.sids2014.org/index.php?page=view&type=1006&nr=2504&menu=1507 [Accessed 28 October 2015].
55. Kanagawa, M. & Nakata, T. (2008) Assessment of access to electricity and the socio-economic impacts in rural areas of developing countries. Energy Policy. 36 pp 2016 - 2029.
56. Kempener, R., Ortigue, O., Saygin, D., Skeer, J., Vinci, S. & Gielen, D. (2015) Off-grid
renewable energy systems: status and methodological issues. International Renewable
120
Energy Agency (IRENA). [Online] Available from: http://www.irena.org/DocumentDownloads/Publications/IRENA_Offgrid_Renewable_Systems_WP_2015.pdf [Accessed 29 May 2015].
57. Li, G., Niu, S., Maa, L. & Zhang, X. (2009) Assessment of environmental and economic costs of rural household energy consumption in Loess Hilly Region, Gansu Province, China. Renewable Energy. 34, pp 1438–1444.
58. Lighting Global (2012) Quality Assurance Protocols 3.0. An Innovation of International Finance Corporation. [Online] Available from: http://global-off-grid-lighting-association.org/wp-content/uploads/2013/09/LightingGlobal-QTM-V3-June2012.pdf [Accessed 2 January 2013].
59. Lighting Research Center (2006) How is system efficacy calculated for PV lighting
systems using various light sources? [Online] Available from: http://www.lrc.rpi.edu/programs/nlpip/lightingAnswers/photovoltaic/15-photovoltaic-efficacy.asp [Accessed 30 August 2013].
60. Lighting Global Services (2015). An innovation of World Bank group. [Online] Available from: http://www.lightingglobal.org/ [Accessed 21 January 2016].
61. Lighting Global Services (2015). Quality Assurance. [Online] Available from: https://www.lightingglobal.org/qa/ [Accessed 21 January 2016].
62. Maehlum, M. (2015) Which Solar Panel Type is Best? Mono- vs. Polycrystalline vs. Thin
Film. Energy Informative. [Online] Available from: http://energyinformative.org/best-solar-panel-monocrystalline-polycrystalline-thin-film/ [Accessed 21 October 2015].
63. Mala, K., Schlapfer, A. & Pryor, T. (2009) Better or worse? The role of solar photovoltaic (PV) systems in sustainable development: Case studies of remote atoll communities in Kiribati. Renewable Energy, 34, pp 386 – 361. [Online] Available from: http://www.rise.org.au/pubs/KirtiMalaRenewableEnergy1.pdf [Accessed 11 April 2010].
64. Mappery (2008) South Pacific Countries Map. [Online] Available from: http://www.mappery.com/south-pacific-countries-map [Accessed 21 March 2015].
65. Mendonca, B. (2012) Methods and analysis for estimating the daily operating time of
solar charged off-grid lighting products. Master’s thesis. Humboldt State University. [Online] Available from: http://humboldt-dspace.calstate.edu/bitstream/handle/2148/951/Mendonca.pdf [Accessed 30 August 2013].
66. Ministry of Works and Energy Fiji (2010). Energy government focal point. Department of Energy. [Online] Available from:
121
http://www.un.org/esa/agenda21/natlinfo/countr/fiji/energy.pdf [Accessed 3 September 2011].
67. Mints, P. (2010) Off-grid solar: PV industry survivor. Renewable Energy World.com. [Online] Available from: http://www.renewableenergyworld.com/articles/2010/05/off-grid-solar-pv.html [Accessed 30 June 2012].
68. Mofor, L., Isaka, M., Wade, H., & Soakai, A. (2013) Pacific lighthouses renewable
energy roadmapping for island. International Renewable Energy Agency (IRENA). [Online] Available from: http://www.irena.org/DocumentDownloads/Publications/Pacific-Lighthouse-Roadmapping.pdf [Accessed 5 September 2014].
69. Mohanty, M (2013) Income support schemes in Pacific Island Countries: a brief
overview. United Nations Economic and Social Commission for Asia and the Pacific. [Online] Available from: http://www.unescapsdd.org/files/documents/Income%20support%20schemes%20in%20Pacific%20island%20countries.pdf [Accessed 28 April 2015].
70. Mondal, A. (2010) Economic viability of solar home systems: Case study of Bangladesh. Renewable Energy. 35, pp 1125 - 1129.
71. New Zealand Foreign Affairs and Trade (2011) Renewable energy pacific. [Online] Available from: https://www.mfat.govt.nz/media-and-publications/development-stories/july-august-2011/renewable-energy-pacific [Accessed 2 May 2015].
72. Ondraczek, J. (2011) The sun rises in the east (of Africa): a comparison of the
development and status of the solar energy markets in Kenya and Tanzania. University of Hamburg, Hamburg, Germany. [Online] Available from: http://kerea.org/wp-content/uploads/2012/12/111216_The-Sun-Rises-in-the-East-of-Africa_Working-Paper-2_Final.pdf [Accessed 02 Jan 2015].
73. Pacific Energy Summit (2013) Pacific energy sector profile. [Online] Available from: http://www.pacificenergysummit2013.com/assets/PacificEnergySummitStatement5April2013.pdf [Accessed 6 November 2014].
74. Pacific Islands Forum Secretariat (2013) Fiji solar initiative – PEC fund. [Online] Available from: http://www.forumsec.org/pages.cfm/newsroom/press-statements/2012/usd23-million-for-fiji-solar%20initiative.html [Accessed 1 January 2013].
75. Pacific Islands Forum Secretariat (2013) Solar project for rural community – Fiji.
[Online] Available from: http://www.forumsec.org.fj/pages.cfm/newsroom/press-

122
statements/2013/forum-dsgcongratulates-fiji-on-commissioning-of-rural-solar-project.html [Accessed 11 September 2013].
76. Pacific Islands Trade & Invest (2013) Pacific Periscope - Solomon Islands commissions
Solar Home Systems Project. [Online] Available from: http://www.pacifictradeinvest.com/wp/?p=4943 [Accessed 11 September 2013].
77. Patil, A., Acharya. J. & Jain, A. (2013) Affordable pay-as-you-go solar power for India's
energy-poor homes. ADB Knowledge Showcases. [Online] Available from: http://www.adb.org/sites/default/files/publication/30383/affordable-solar-power-india-energy-poor-homes.pdf [Accessed 1 January 2016].
78. Pode, R. (2013) Financing LED solar home systems in developing countries. Renewable and Sustainable Energy Reviews. 25, pp 596 – 629.
79. Pode, R. (2010) Solution to enhance the acceptability of solar-powered LED lighting technology. Renewable and Sustainable Reviews. 14, pp 1096 – 1103.
80. PV Education.Org (2014) Band gap. [Online] Available from: http://pveducation.org/pvcdrom/solar-cell-operation/solar-cell-structure [Accessed 29 September 2014].
81. Raja, P., Ramaseshan, B. & Nayar, C. (2002) Conceptual model for marketing solar based technology to developing countries. Renewable Energy. 25, pp 511–524.
82. Raturi, A. (2011) Pacific SIDS Energy, Ecosystems and Sustainable Livelihoods
Initiative: Managing the Ecosystem Implications of Energy Policies in the Pacific Island
States. International Union for the Conservation of Nature and Natural Resources (IUCN). [Online] Available from: https://cmsdata.iucn.org/downloads/pacific_sids_energy__ecosystems_and_sustainable_livelihoods_initiative___managing_the.pdf [Accessed 30 November 2015].
83. REEEP (2010) Energy globe award for Solomon Islands lighting project. Solomon Islands. [Online] Available from: http://www.reeep.org/news/energy-globe-award-solomon-islands-lighting-project [Accessed 28 October 2015].
84. REN21 (2014) Renewables 2014 global status report. Paris. [Online] Available from: http://www.ren21.net/portals/0/documents/resources/gsr/2014/gsr2014_full%20report_low%20res.pdf [Accessed 31 August 2014].
85. REN21 (2012) Renewables 2012 global status report. Paris. [Online] Available from: http://www.ren21.net/Portals/0/documents/activities/gsr/GSR2012_low%20res_FINAL.pdf [Accessed 21 August 2014].
123
86. Renewables (2013) World’s richest countries spent $500 Billion on fossil fuel subsidies. [Online] Available from: http://ecowatch.com/2013/11/07/worlds-richest-countries-spent-500-billion-fossil-fuel-subsidies/ [Accessed 22 March 2015].
87. Sanneh, E., & Hu, A. (2009) Lighting rural and peri-urban homes of the Gambia using solar photovoltaic (PV). The Open Renewable Energy Journal. 2(1), pp 99-110. [Online] Available from: http://www.ntut.edu.tw/ezfiles/0/academic/75/academic_51679_1238186_59632.pdf [Accessed 13 September 2014]
88. Secretariat of the Pacific Regional Environment Programme (SPREP) (2014). About
PIGGAREP. [Online] Available from: https://www.sprep.org/Pacific-Islands-Greenhouse-Gas-Abatement-through-Renewable-Energy-Project/about-piggarep [Accessed 14 November 2014].
89. Secretariat of the Pacific Community (2009) Country energy security indicator profile.
Energy Programme, Economic Development Division. [Online] Available from: http://www.spc.int/edd/section-01/energy-overview/179-country-energy-security-indicator-profiles-2009 [Accessed 6 November 2014].
90. Secretariat of Pacific Community (SPC) (2011) North pacific ACP renewable energy
and energy efficiency project (North-REP) - project brief. [Online] Available from: http://www.spc.int/northrep/images/uploads//northrep_project_web.pdf [Accessed 16 November 2012].
91. Secretariat of Pacific Community (SPC) (2012) Pacific fuel imports. [Online] Available from: http://www.fijitimes.com/errors/404.aspx [Accessed 1 June 2014].
92. Secretariat of the Pacific Community (SPC) (2011). Towards an energy secure pacific -
a framework for action on energy security in the pacific. [Online] Available from: http://www.sprep.org/att/irc/ecopies/pacific_region/686.pdf [Accessed 23 June 2012].
93. Seekpart.com (2010) Solar Panel Lighting System (10-01). [Online] Available from: http://www.seekpart.com/product/Solar-Panel-Lighting-System-10-01C-4066333.html [Accessed 28 October 2015].
94. Sharma, V. (2011) Off-grid solar PV: opportunities & barriers. Solar Power. [Online] Available from: http://www.energetica-india.net/download.php?seccion=articles&archivo=U8f3dGqtOcfph9dgvMCw3tQjMO7CEH6ZEZRhf8QuZwY7t2beCdP6Lgd.pdf [Accessed 30 October 2012].
95. SIDS Action Platform (2014). Melanesia's million miracle programme (M3P). [Online] Available from:

124
http://sids2014.org/index.php?nr=2504&page=view&template=919&type=1006 [Accessed 28 October 2015].
96. Singal, S., Varun, & Singh, R. (2007) Rural electrification of a remote island by renewable energy sources. Renewable Energy. 32, pp 2491 - 2501.
97. Suncowboy (2011) Introduction to solar in non-technical terms. [Online] Available from: http://www.suncowboy.com/solar101.php [Accessed 14 October 2011].
98. Sustainable Energy for All (2014). SE4ALL Finance Committee Report, Sustainable Energy for All Initiative. [Online] Available from: http://www.se4all.org/wp-content/uploads/2014/12/Finance-Committee-Report.pdf [Accessed 1 May 2015].
99. Svantesson, J. & Linder, E. (2011) Solar electricity for rural households at the Fiji
islands. BSc thesis. Royal Institute of Technology. [Online] Available from: http://www.diva-portal.org/smash/get/diva2:540264/FULLTEXT01.pdf [Accessed 13 November 2014].
100. Tedsen, E. (2013) Black carbon emissions from kerosene lamps - potential for a new
CCAC initiative. Clean Air Task Force. [Online] Available from:http://www.ecologic.eu/sites/files/publication/2014/black-carbon-and-kerosene-lampsstudy.pdf [Accessed 16 October 2014].
101. The Nature Conservancy (2015) Climate change threats and impacts. [Online] Available from: http://www.nature.org/ourinitiatives/urgentissues/global-warming-climate-change/threats-impacts/ [Accessed 30 November 2015].
102. Tracy, J. & Mills, E. (2010) Illuminating the pecking order in off-grid lighting- a
demonstration of LED lighting for saving energy in the poultry sector. Available from: https://lightingafrica.org/wp-content/uploads/bsk-pdf-manager/20_Illuminating-the-pecking-order.pdf. [Accessed 13 October 2015].
103. United Nations Framework Convention on Climate Change (2015) Intended nationally
determined contributions (INDCs). [Online] Available from: http://unfccc.int/focus/indc_portal/items/8766.php [Accessed 30 November 2015].
104. United Nations Sustainable Development Knowledge Platform (2015). Sustainable
Development Goals. [Online] Available from: https://sustainabledevelopment.un.org/?menu=1300 [Accessed 23 January 2016].
105. Urmee, T., & Harries, D. (2011) Determinants of the success and sustainability of Bangladesh’s SHS program. Renewable Energy. 36, pp 2822-2830. [Online] Available from: http://dx.doi.org/10.1016/j.renene.2011.04.021 [Accessed 21 October 2012].

125
106. Urmee, T., Harries, D. & Sclapfer, A. (2009) Issues related to rural electrification using renewable energy in developing countries of Asia and Pacific. Renewable Energy. 34, pp, 354 - 357.
107. Vasavada, S. & Gupta, N. (2010) Removing the darkness and improving livelihoods -
solar home lighting system learning from practice. The Livelihood School. [Online] Available from: http://www.thelivelihoodschool.in/file-for-pdf/Graphic1.pdf [Accessed 30 May 2010].
108. West Mount Radio (2014) CBA IV - computerized battery analyser. [Online] Available from: http://www.westmountainradio.com/product_info.php?products_id=cba4 [Accessed 13 August 2015].
109. WhatIs.com (2005) Definition of lumen. [Online] Available from: http://whatis.techtarget.com/definition/lumen [Accessed 30 March 2008].
110. Wilson, C. (2012) Pacific island sets renewable energy record. Common Dreams - Breaking News and Views for the Pacific Community. [Online] Available from: http://www.commondreams.org/news/2012/10/26/pacific-island-sets-renewable-energy-record [Accessed 14 November 2014].
111. Wong, S. (2012) Overcoming obstacles against effective solar lighting interventions in South Asia. Energy Policy, 40, pp 110 – 120.
112. Woodruff, A. (2007) An Economic Assessment of Renewable Energy Options for Rural
Electrification in Pacific Island Countries. Pacific Islands Applied Geoscience Commission (SOPAC). Technical Report number 397. Suva.
113. Zeman, M. (1987) Introduction to photovoltaic solar energy. Solar cells theory. [Online] Available from: http://aerostudents.com/files/solarCells/solarCellsTheoryFullVersion.pdf [Accessed 30 May 2014].
114. Zhou, Y. & Narendran, N. (2005) Photovoltaic-powered light emitting diode lightings systems. Optical Engineering. 44 (11), pp 111311 – 111316.
115. Zieroth, G. (2014). Renewable energy readiness assessment Fiji - background paper. International Renewable Energy Agency (IRENA) Country Support and Partnership (CSP). [Online] Available from: http://www.se4all.org/wp-content/uploads/2015/05/Fiji_RAGA.pdf [Accessed 8 June 2015].

126
Annex 2 Questionnaire
The following questionnaire is for my Masters Research Thesis based on Solar LED Lighting System in Rural Areas. Any information gathered from this survey will be kept highly confidential. Your response will be much appreciated to make this research a success. Name: _____________________________________ Age: ________years
Occupation: ____________________ Number in family: _________
Gender: Male Female
1. Which type of lighting system you were using before receiving the SLS?
Please specify. _________________________________________________________________
2. How long you have been using the SLS?
1 month 3 months 6 months 12 months 12 months or more
3. If you compare the traditional system and solar, which type of system do you feel is better
for home lighting?
Traditional System: Solar:
4. Why do you choose the option mentioned above?
__________________________________________________________________________________________________________________________________________________________________________________________________________________________________________
5. What was the monthly cost associated in using the traditional source of lighting?
Type 1: _____________________ Monthly Cost: _____________________
Type 2: _____________________ Monthly Cost: ______________________
Type 3:______________________ Monthly Cost: ______________________
6. What is the cost of the SLS which you have at home?
Amount: ___________________
127
7. Have you spent money on replacing accessories or did any maintenance work onto your system?
Yes: No:
If yes, please specify the amount: __________________________________________________
8. For how long you have not purchased the traditional lighting source?
1 month 3 months 6 months 12 months 12 months or more
9. List down few incidents in which the SLS has helped you which may not have been possible using the traditional lighting system. Answer the question in terms of:
a. Your bed and wake up time: ___________________________________________________________________________________________________________________________________________________________________________________________________
b. Entertainment and hosting or attending village functions: ___________________________________________________________________________________________________________________________________________________________________________________________________
c. Child/Children studying: ___________________________________________________________________________________________________________________________________________________________________________________________________
d. Security: ___________________________________________________________________________________________________________________________________________________________________________________________________
10. Do you know how to do maintenance of the SLS?
Yes No
If yes, up to what extent: ____________________________________________________
11. Does anyone know how to do the maintenance in the community for the SLS?
Yes No
12. Is there any shop available nearby to purchase the system accessories?
Yes No
If yes, how far it is from your village: _______________________________________________
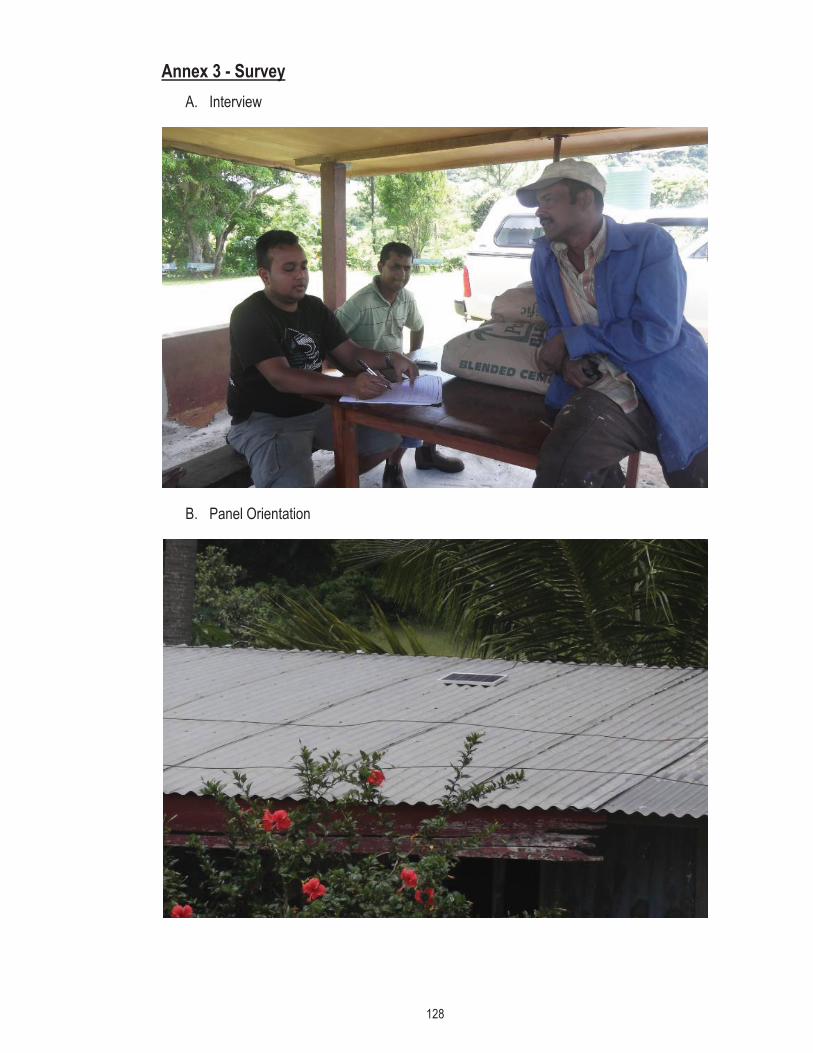
128
Annex 3 - Survey A. Interview
B. Panel Orientation

129
C. Replacement of Accessories
D. System with charge controller
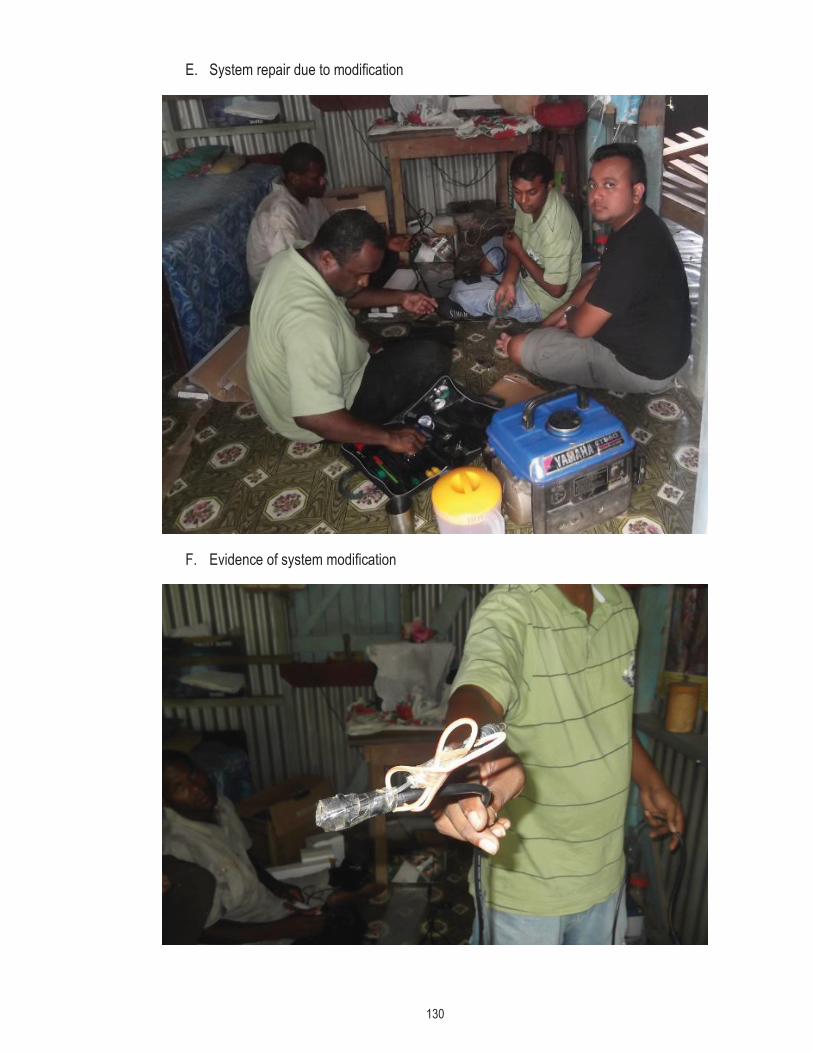
130
E. System repair due to modification
F. Evidence of system modification
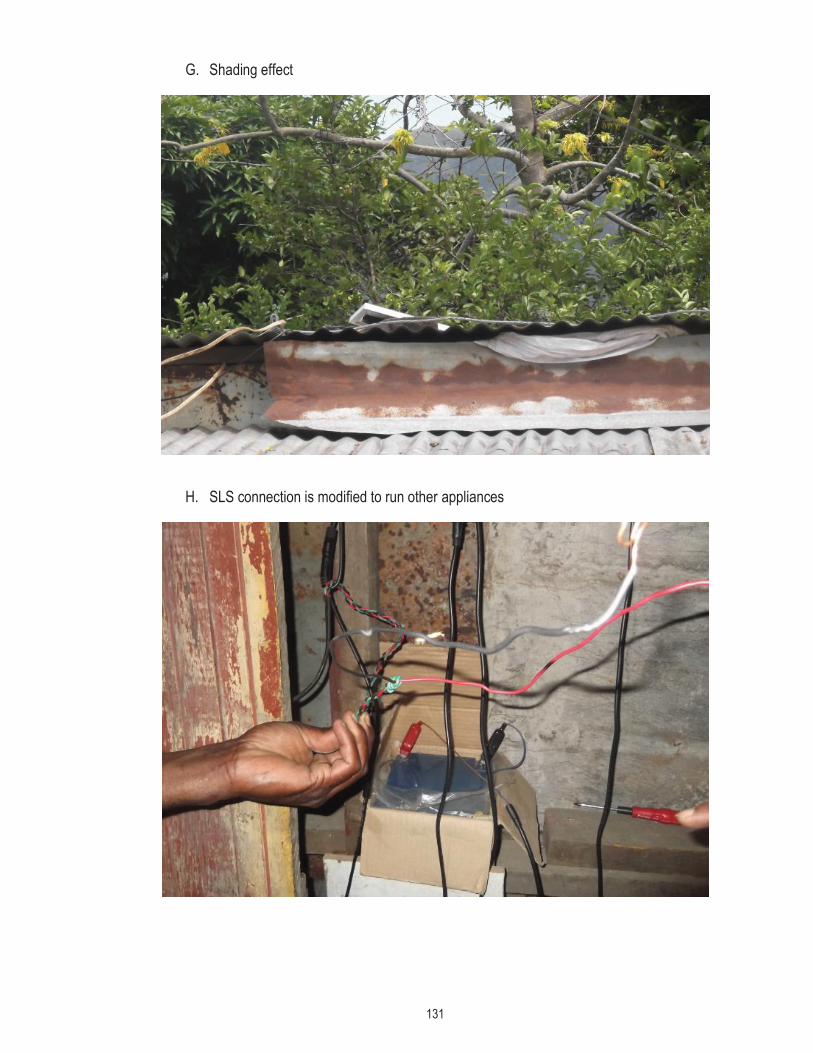
131
G. Shading effect
H. SLS connection is modified to run other appliances