technical paper - conservatives
TRANSCRIPT
P1 5800307v1
Technical Paper
Our ref 41306/02/MW/BOC/CRO
Date 15 November 2013
To High Peak Borough Council / Staffordshire Moorlands District Council
From Nathaniel Lichfield & Partners
Subject Housing Requirement Technical Note
1.0 Introduction
1.1 The purpose of this briefing note is to provide an overview of the PopGroup
model and the HEaDROOM methodology underpinning the housing projections.
It also sets out the preliminary modelling results and emerging findings for High
Peak Borough Council [HPBC] and Staffordshire Moorlands District Council
[SMDC].
2.0 Overall Approach
2.1 NLP uses specialist demographic modelling and forecasting tool PopGroup to
model future trends in demography, household and dwelling estimates. The
PopGroup software uses a variety of inputs including ONS population
projections and comparable CLG household forecasts. It is widely used by over
100 LA and private sector bodies including Sheffield and Leeds.
2.2 Essentially, PopGroup is a family of software developed to forecast population,
household and labour force for areas and social groups. Users develop
alternative assumptions as scenarios. PopGroup replicates official projections
in regular Data Modules for population and households, with plans for Data
Modules for illness and disability, the labour force, ethnic groups and adult
care. PopGroup incorporates an age cohort component methodology for its
population projection model; a headship rate model for its household
projections; and an economic activity rate model for its labour-force projection
model.
2.3 Historical data on population, births, deaths and migration flows provides the
basis for the development of alternative population forecasts. PopGroup
provides national fertility, mortality and migration schedules against which local
profiles can be calibrated. For scenario development, users may choose a time
horizon up to 50 years and may select a variety of demographic assumptions
and constraints to which scenarios are linked, allowing comparisons of a variety
of official projections, trend-based scenarios or policy-constrained forecasts.
2.4 More information on PopGroup and the technical methodology of the model
itself, can be found via the following weblink: www.ccsr.ac.uk/popgroup.
P2 5800307v1
3.0 Underlying Assumptions
3.1 For the purposes of the High Peak and Staffordshire Moorlands SHMA, a
baseline PopGroup model has been run for both areas. This produces a
trajectory of demographic change over the Local Plan period (between 2011
and 2031), incorporating the latest government projections to provide
population, households, economically active residents and job growth over time
(of which the latter can be translated into a supply-led employment land
requirement for the purposes of the scenario modelling).
3.2 The most up-to-date information available for the PopGroup model comprises
the 2011-based (interim) ONS SNPP and the equivalent 2011-based (interim)
CLG household projections.
3.3 There are a number of underlying assumptions in the modelling including:
• Fertility rates are applied to the population using projected Fertility Rates
and differentials for High Peak and Staffordshire Moorlands from the ONS
2010 based SNPP;
• Mortality rates are applied to the population forecast using projected
Mortality rates and differentials for High Peak and Staffordshire
Moorlands from the ONS 2010-based SNPP;
• Inputs on headship rates apply the CLG 2011-based household forecast
headship rates up to 2021, indexed to the 2008-based rate of change
after this time;
• In High Peak and Staffordshire Moorlands (as in any area), it is expected
that housing vacancies and second homes will result in the number of
dwellings exceeding the number of households. In establishing future
projections, it is likewise expected that the dwelling requirement will
exceed the household forecast. Hence a rate of 3.2% and 4.6% has been
factored into the model for High Peak and Staffordshire Moorlands
respectively, based upon the most recent vacancy data available for the
districts;
• To calculate the unemployment rate, NLP took the December 2010
NOMIS unemployment figure (6.7% and 4.6% for High Peak and
Staffordshire Moorlands respectively) to equate to the 2010 rate; the
December 2011 figure (6.4% and 5.6) to equate to the 2011 rate; and
the December 2012 figure (7.4% and 5.5%) to equate to 2012. NLP kept
the former figure constant for 2013 and 2014 to reflect initial
stabilisation at the current high rate, and then gradually reduced the rates
on a linear basis to the 7-year averages (05-12) of 5.48% and 4.24% over
a five year time frame. These figures were then held constant to the end
of the forecasting period on the grounds that this is a better reflection of
the long term trend than the current high rates;
P3 5800307v1
• It has been assumed that the commuting rates remain static (1.32 and
1.45 for High Peak and Staffordshire Moorlands respectively) with no
inferred increase or decrease in commuting levels for the majority of the
scenarios (see below). We have run sensitivities on reducing out-
commuting by 5% on a number of the economic led scenarios.
3.4 There will also be an additional driver underpinning growth in household
formation due to the strong trend towards smaller average household sizes
nationally.
3.5 A more detailed tabulated methodology is provided in Appendix 1.
4.0 Scenario Modelling
4.1 Whilst the above baseline assumptions are able to be tweaked, the main input
which will be changed between each modelled scenario is the level of
migration.
4.2 The scenarios adopted for testing fall into three broad groups: demographic-led,
economic-led and supply/policy-led. These are set out as follows:
Demographic-led – “How much development is required to meet projected levels
of population change?”:
i Scenario A: Baseline 2011 – A scenario utilising the latest ONS
2011-based sub-national population projections [SNPP] and the
headship rates from the CLG 2011-based household projections. It
has been assumed that post 2021, the 2008-based headship rates
are applied (the ‘index’ approach);
Sensitivity Tests:
- Scenario Aa: Static Headship Rates – A scenario which
incorporates the ONS/CLG inputs of Scenario A to provide a
projections to 2021; between 2022 and 2030, the 2021 headship
rate are held constant;
- Scenario Ab: Trend Headship Rates – As above, although post-
2021 the CLG 2011-based household projection trends are
continued on a linear basis;
- Scenario Ac: Catch-Up Headship Rates – As above; change post
2021 is targeted to achieve the CLG 2008-based Household
Projections end-rates by 2033;
ii Scenario B: Natural Change – Where in and out-migration is
reduced to zero, hence growth is driven purely by natural change, or
the interaction between births and deaths;
iii Scenario C: Zero Net-Migration – A theoretical demographic
scenario whereby in and out migration is balanced, meaning there
is only population ‘churn’ within each district and no growth from
net in-migration;
P4 5800307v1
iv Scenario D: Short Term Migration Trends – A scenario based upon
migration trends observed for High Peak and Staffordshire
Moorlands over the previous 5 years;
v Scenario Da: Short Term Migration Trends + 50% Unattributal
Change – A scenario based upon migration trends observed for
High Peak and Staffordshire Moorlands with a 50% allowance for
‘unattributal change’1 over the previous 5 years;
vi Scenario E: Long Term Migration Trends – A scenario based upon
migration trends observed for High Peak and Staffordshire
Moorlands over the previous 10 years;
vii Scenario Ea: Long Term Migration Trends + 50% Unattributal
Change – A scenario based upon migration trends observed for
High Peak and Staffordshire Moorlands with a 50% allowance for
unattributal change over the previous 10 years;
viii Scenario F: CLG Household Projections – annualising the CLG
Household Projections (2011-2021) whilst making an allowance for
vacancy rates (416 dpa for High Peak and 252 dpa for Staffordshire
Moorlands);
2 Economic-led – “How much development is required to ensure forecasts of
future employment change are supported by the local labour supply?”:
i Scenario G: Oxford Economics Job Growth – A ‘policy-off’ trend-
scenario based upon Oxford Economics local area-based
econometric model. This provides potential unconstrained
employment growth in High Peak (-73 jobs 2013-2031) and
Staffordshire Moorlands (2,538 jobs 2013-2031) over the Plan
period;
ii Scenario Ga: Oxford Economics Job Growth + 5% Reduction in
Out-commuting – A ‘policy-off’ trend-scenario based upon Oxford
Economics local area-based model. This provides potential
unconstrained employment growth in High Peak and Staffordshire
Moorlands between 2011 and 2031 whilst factoring in a 5%
reduction in out-commuting;
iii Scenario H: Employment Land Review Job Target – estimating the
number of jobs created on a pro rata basis based on the
employment land needs as set out in the relevant Employment Land
Review (based on making an assumption as to the likely level of job
growth associated with a net increase in employment land of 35ha
for High Peak and 22.2ha for Staffordshire Moorlands);
1 Within the ONS’s revised Mid-Year Population Estimates rebased to the 2011 Census, an allowance is made for ‘other
unattributable populations’. These comprise differences between the rolled forward MYE and the revised MYE, which ONS are
unable to statistically account for (i.e. they are people that are definitively living in a particular area, but ONS cannot specifically
account for how they got there). One explanation is that the level of migration estimated in the MYE, which is notoriously difficult
to accurately register, was incorrect.
P5 5800307v1
iv Scenario Ha: Employment Land Review Job Target – estimating the
number of jobs created on a pro rata basis based on the
employment land needs as set out in the ELR for both districts
whilst factoring in a reduced commuting rate of 5%;
v Scenario I: Job Stabilisation – taking forward a net total of zero job
growth over the period 2013-31.
3 Policy/Supply led – “What are the implications in terms of the number of
people, households and jobs of delivering a certain amount of
development?”
i Scenario J: Average Past Delivery – using past delivery trends to
illustrate what the market has previously delivered and project
these forward over the Plan periods (287 dpa for High Peak and
227 dpa for Staffordshire Moorlands net).
ii Scenario K: Regional Strategy Housing Requirement – using the
housing requirements as set in the relevant Regional Strategies as
a comparator (300 dpa for both authority areas).
5.0 Dealing with Housing Backlog
5.1 The draft beta Planning Practice Guidance has the following to say regarding
how past under-delivery should be factored into the establishment of OAN:
“Formation rates may have been suppressed historically by under-supply and
worsening affordability of housing. The assessment will therefore need to reflect
the consequences of past under-delivery of housing. As household projections do
not reflect unmet housing need, LPAs should take a view based on available
evidence of the extent to which household formation rates are or have been
constrained by supply.”
5.2 This is clarified further: “If the historic rate of development shows that actual
supply falls below planned supply, future supply should be increased to reflect
the likelihood of under-delivery of a plan.”
5.3 In respect of how this is practically achieved, the Planning Advisory Service
[PAS] Guidance note on OAN (July 2013) [1] discusses the issue of backlog. It
provides two views surrounding unmet need:
a that household projections, if they are based on the most up to date
data, take into account unmet need and as such does not need adding
into a future housing target based on these projections;
b that both demand and supply side constraints on housing development in
recent years has forced people into sub-optimal housing arrangements
which have manifested themselves in the household projections, with the
PAS guidance stating this view is taken:
“…because there has been a lack of suitable accommodation, households
have not formed which means that the trends on which the projections are
based do not reflect the real need. This creates a ‘pent-up demand’ for
housing, which should be measured or estimated, and added on to
household projections.”
P6 5800307v1
5.4 One way to overcome the difficulties of dealing with backlog needs is to
compare past completions against the relevant housing requirement for that
period; assuming that this housing requirement was a reasonable and fully
tested basis for that period in order to meet development requirements. This
provides an indicator of the extent to which there may have been previous
unmet needs.
5.5 The backlog of housing need identified between 2006 and 2011 would equate
to an additional 4 dpa for High Peak, and an additional 22 dpa for Staffordshire
Moorlands between 2011 and 2031. This has been included in the total
dwelling requirement per annum of each demographically modelled scenario. It
is assumed that this backlog element is necessary to meet needs that have
been suppressed within the existing demographic characteristics of the two
districts, and therefore would only meet change within the existing population
such as allowing concealed households to ‘emerge’.
5.6 An additional allowance for backlog of need has not been added to the
economic scenarios. This is because the economic scenarios are modelled to
a constrained job number and housing need is measured against this figure,
hence adding on an additional backlog requirement would be unnecessary when
the outcome of the scenario is solely linked to labour force jobs. Furthermore,
it could be argued that the economic scenarios (particularly the more
aspirational projections), are already planning for an upsurge in demand and
levels of in-migration, which would eliminate a significant proportion of the
outstanding backlog.
P7 5800307v1
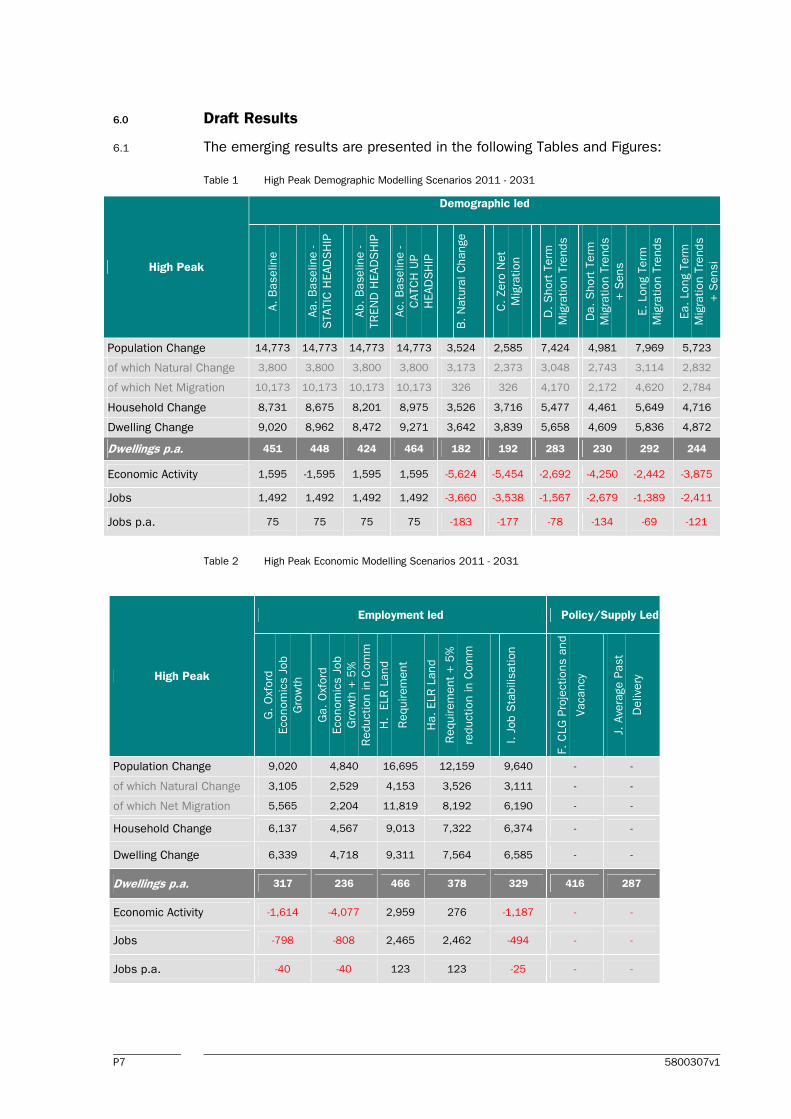
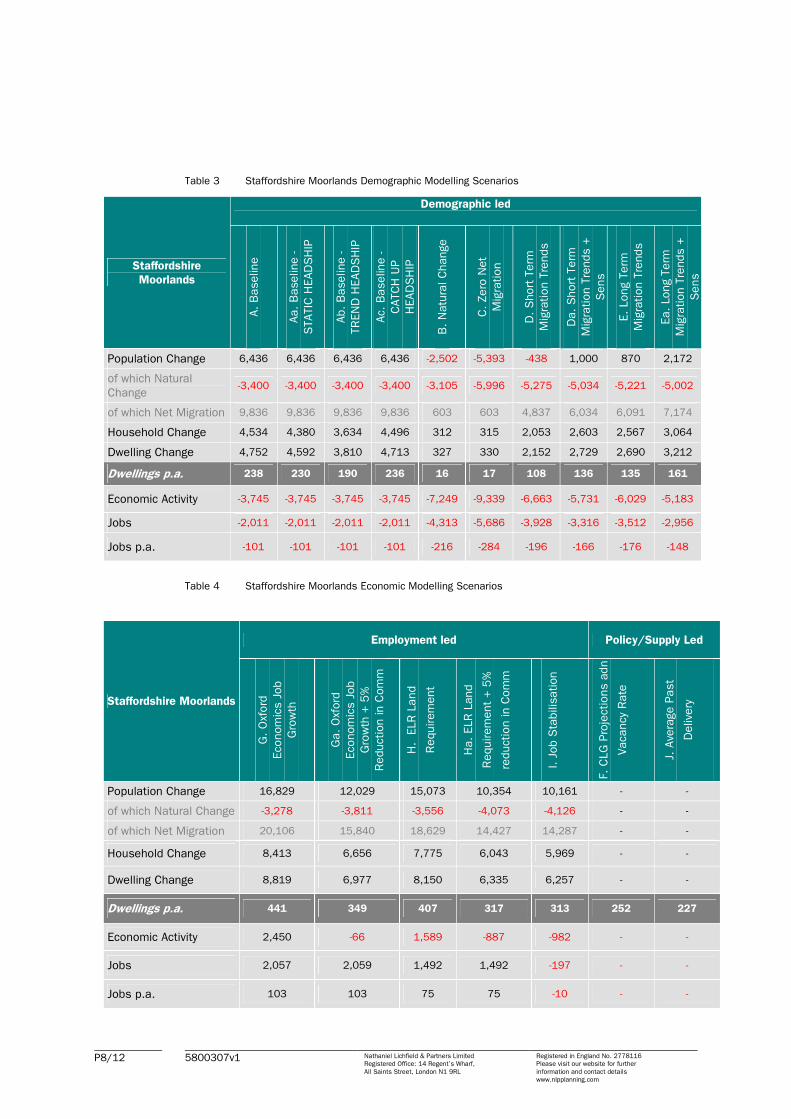
6.0 Draft Results
6.1 The emerging results are presented in the following Tables and Figures:
Table 1 High Peak Demographic Modelling Scenarios 2011 - 2031
Table 2 High Peak Economic Modelling Scenarios 2011 - 2031
High Peak
Demographic led
A.
Baselin
e
Aa.
Baseline -
STATIC
HEAD
SH
IP
Ab.
Baseline -
TR
EN
D H
EAD
SH
IP
Ac.
Baselin
e -
CATC
H U
P
HEAD
SH
IP
B.
Natu
ral C
hange
C.
Zero
Net
Mig
ration
D.
Short
Term
Mig
ration T
rends
Da.
Short
Term
Mig
ration T
rends
+ S
ens
E.
Long T
erm
Mig
ration T
rends
Ea.
Long T
erm
Mig
ration T
rends
+ S
ensi
Population Change 14,773 14,773 14,773 14,773 3,524 2,585 7,424 4,981 7,969 5,723
of which Natural Change 3,800 3,800 3,800 3,800 3,173 2,373 3,048 2,743 3,114 2,832
of which Net Migration 10,173 10,173 10,173 10,173 326 326 4,170 2,172 4,620 2,784
Household Change 8,731 8,675 8,201 8,975 3,526 3,716 5,477 4,461 5,649 4,716
Dwelling Change 9,020 8,962 8,472 9,271 3,642 3,839 5,658 4,609 5,836 4,872
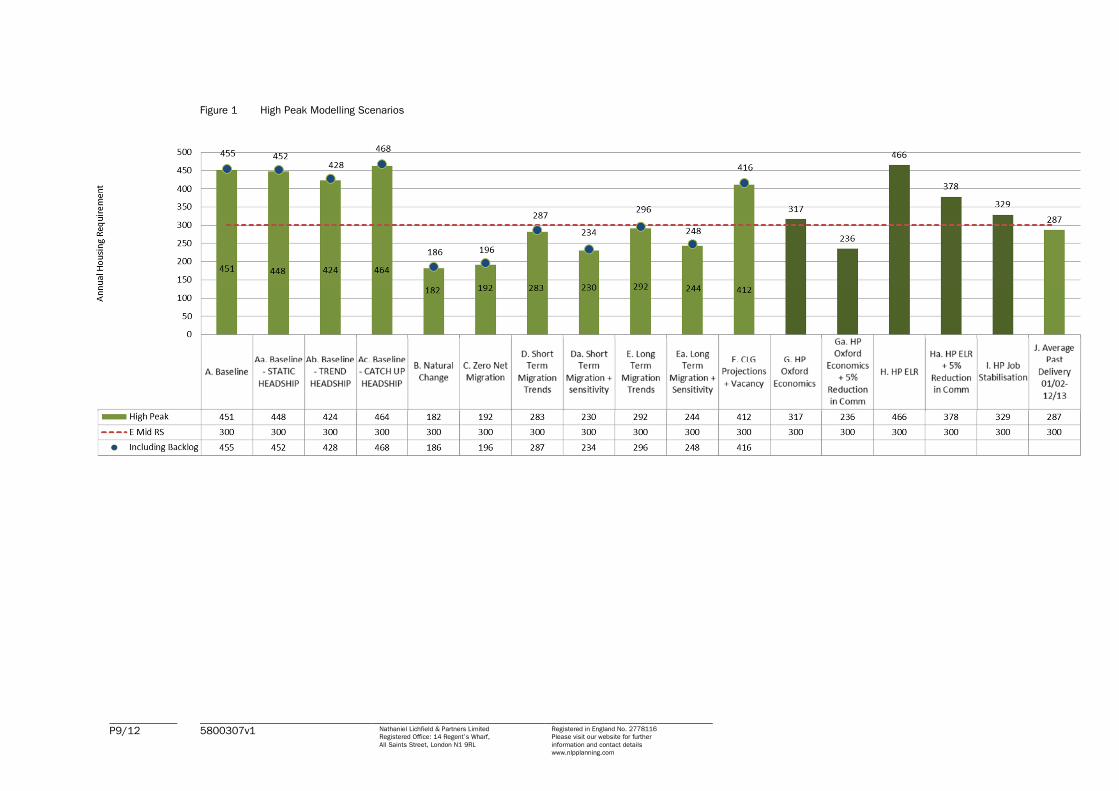
Dwellings p.a. 451 448 424 464 182 192 283 230 292 244
Economic Activity 1,595 -1,595 1,595 1,595 -5,624 -5,454 -2,692 -4,250 -2,442 -3,875
Jobs 1,492 1,492 1,492 1,492 -3,660 -3,538 -1,567 -2,679 -1,389 -2,411
Jobs p.a. 75 75 75 75 -183 -177 -78 -134 -69 -121
High Peak
Employment led Policy/Supply Led
G.
Oxf
ord
Econom
ics J
ob
Gro
wth
Ga.
Oxf
ord
Econom
ics J
ob
Gro
wth
+ 5
%
Reduction in C
om
m
H.
ELR
Land
Requirem
ent
Ha.
ELR
Land
Requirem
ent
+ 5
%
reduct
ion in C
om
m
I. J
ob S
tabilis
ation
F.
CLG
Pro
jections a
nd
Vacancy
J. A
vera
ge P
ast
Delive
ry
Population Change 9,020 4,840 16,695 12,159 9,640 - -
of which Natural Change 3,105 2,529 4,153 3,526 3,111 - -
of which Net Migration 5,565 2,204 11,819 8,192 6,190 - -
Household Change 6,137 4,567 9,013 7,322 6,374 - -
Dwelling Change 6,339 4,718 9,311 7,564 6,585 - -
Dwellings p.a. 317 236 466 378 329 416 287
Economic Activity -1,614 -4,077 2,959 276 -1,187 - -
Jobs -798 -808 2,465 2,462 -494 - -
Jobs p.a. -40 -40 123 123 -25 - -
P8/12 5800307v1 Nathaniel Lichfield & Partners Limited Registered Office: 14 Regent’s Wharf,
All Saints Street, London N1 9RL
Registered in England No. 2778116 Please visit our website for further
information and contact details www.nlpplanning.com
Table 3 Staffordshire Moorlands Demographic Modelling Scenarios
Table 4 Staffordshire Moorlands Economic Modelling Scenarios
Staffordshire
Moorlands
Demographic led
A.
Baselin
e
Aa.
Baseline -
STATIC
HEAD
SH
IP
Ab.
Baseline -
TR
EN
D H
EAD
SH
IP
Ac.
Baselin
e -
CATC
H U
P
HEAD
SH
IP
B.
Natu
ral C
hange
C.
Zero
Net
Mig
ration
D.
Short
Term
Mig
ration T
rends
Da.
Short
Term
Mig
ration T
rends +
Sens
E.
Long T
erm
Mig
ration T
rends
Ea.
Long T
erm
Mig
ration T
rends +
Sens
Population Change 6,436 6,436 6,436 6,436 -2,502 -5,393 -438 1,000 870 2,172
of which Natural
Change -3,400 -3,400 -3,400 -3,400 -3,105 -5,996 -5,275 -5,034 -5,221 -5,002
of which Net Migration 9,836 9,836 9,836 9,836 603 603 4,837 6,034 6,091 7,174
Household Change 4,534 4,380 3,634 4,496 312 315 2,053 2,603 2,567 3,064
Dwelling Change 4,752 4,592 3,810 4,713 327 330 2,152 2,729 2,690 3,212
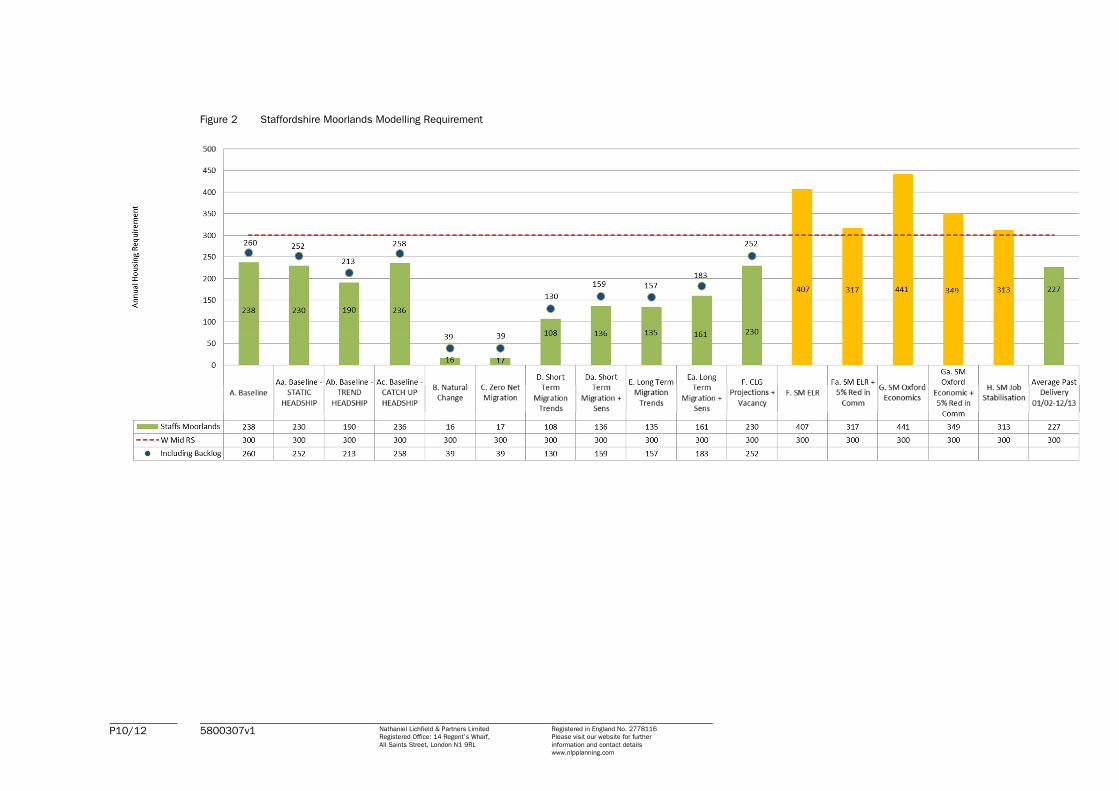
Dwellings p.a. 238 230 190 236 16 17 108 136 135 161
Economic Activity -3,745 -3,745 -3,745 -3,745 -7,249 -9,339 -6,663 -5,731 -6,029 -5,183
Jobs -2,011 -2,011 -2,011 -2,011 -4,313 -5,686 -3,928 -3,316 -3,512 -2,956
Jobs p.a. -101 -101 -101 -101 -216 -284 -196 -166 -176 -148
Staffordshire Moorlands
Employment led Policy/Supply Led
G.
Oxf
ord
Econom
ics J
ob
Gro
wth
Ga.
Oxf
ord
Econom
ics J
ob
Gro
wth
+ 5
%
Reduction in C
om
m
H.
ELR
Land
Requirem
ent
Ha.
ELR
Land
Requirem
ent
+ 5
%
reduct
ion in C
om
m
I. J
ob S
tabilis
ation
F.
CLG
Pro
jections a
dn
Vacancy
Rate
J. A
vera
ge P
ast
Delive
ry
Population Change 16,829 12,029 15,073 10,354 10,161 - -
of which Natural Change -3,278 -3,811 -3,556 -4,073 -4,126 - -
of which Net Migration 20,106 15,840 18,629 14,427 14,287 - -
Household Change 8,413 6,656 7,775 6,043 5,969 - -
Dwelling Change 8,819 6,977 8,150 6,335 6,257 - -
Dwellings p.a. 441 349 407 317 313 252 227
Economic Activity 2,450 -66 1,589 -887 -982 - -
Jobs 2,057 2,059 1,492 1,492 -197 - -
Jobs p.a. 103 103 75 75 -10 - -
P9/12 5800307v1 Nathaniel Lichfield & Partners Limited Registered Office: 14 Regent’s Wharf,
All Saints Street, London N1 9RL
Registered in England No. 2778116 Please visit our website for further
information and contact details www.nlpplanning.com
Figure 1 High Peak Modelling Scenarios
P10/12 5800307v1 Nathaniel Lichfield & Partners Limited Registered Office: 14 Regent’s Wharf,
All Saints Street, London N1 9RL
Registered in England No. 2778116 Please visit our website for further
information and contact details www.nlpplanning.com
Figure 2 Staffordshire Moorlands Modelling Requirement
P11/12 5800307v1 Nathaniel Lichfield & Partners Limited Registered Office: 14 Regent’s Wharf,
All Saints Street, London N1 9RL
Registered in England No. 2778116 Please visit our website for further
information and contact details www.nlpplanning.com
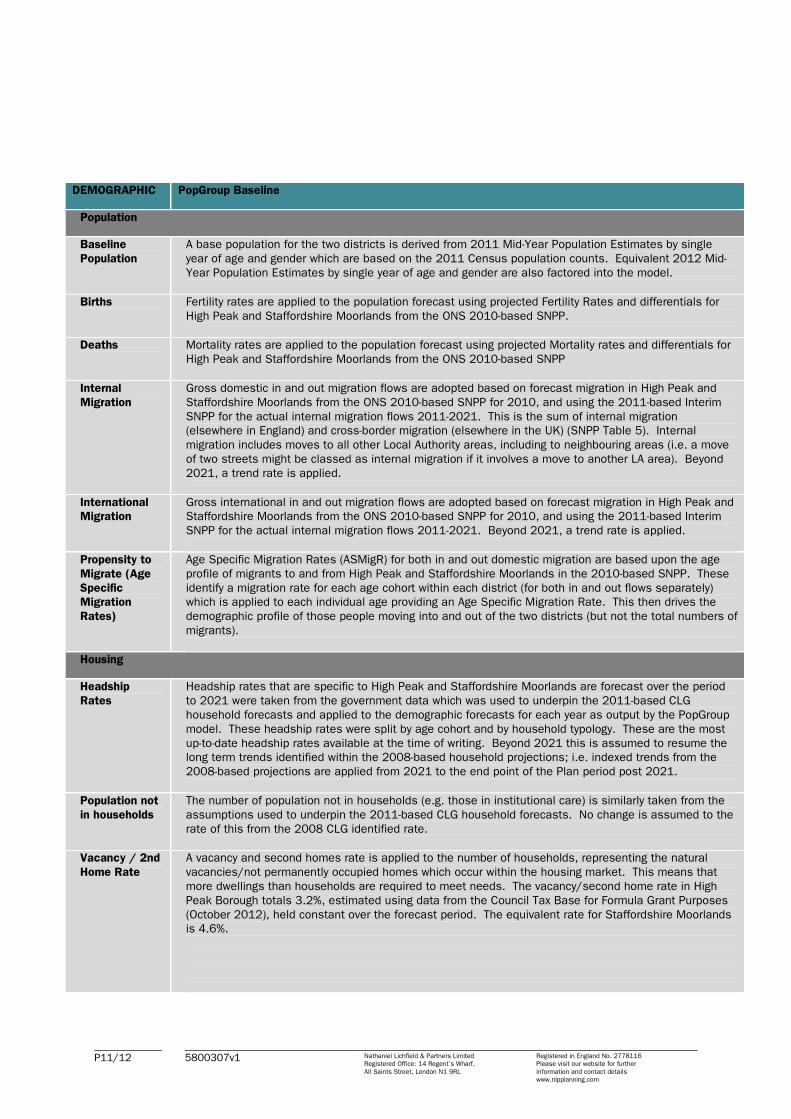
DEMOGRAPHIC PopGroup Baseline
Population
Baseline
Population
A base population for the two districts is derived from 2011 Mid-Year Population Estimates by single
year of age and gender which are based on the 2011 Census population counts. Equivalent 2012 Mid-
Year Population Estimates by single year of age and gender are also factored into the model.
Births Fertility rates are applied to the population forecast using projected Fertility Rates and differentials for
High Peak and Staffordshire Moorlands from the ONS 2010-based SNPP.
Deaths Mortality rates are applied to the population forecast using projected Mortality rates and differentials for
High Peak and Staffordshire Moorlands from the ONS 2010-based SNPP
Internal
Migration
Gross domestic in and out migration flows are adopted based on forecast migration in High Peak and
Staffordshire Moorlands from the ONS 2010-based SNPP for 2010, and using the 2011-based Interim
SNPP for the actual internal migration flows 2011-2021. This is the sum of internal migration (elsewhere in England) and cross-border migration (elsewhere in the UK) (SNPP Table 5). Internal
migration includes moves to all other Local Authority areas, including to neighbouring areas (i.e. a move
of two streets might be classed as internal migration if it involves a move to another LA area). Beyond
2021, a trend rate is applied.
International
Migration
Gross international in and out migration flows are adopted based on forecast migration in High Peak and Staffordshire Moorlands from the ONS 2010-based SNPP for 2010, and using the 2011-based Interim
SNPP for the actual internal migration flows 2011-2021. Beyond 2021, a trend rate is applied.
Propensity to
Migrate (Age
Specific
Migration
Rates)
Age Specific Migration Rates (ASMigR) for both in and out domestic migration are based upon the age
profile of migrants to and from High Peak and Staffordshire Moorlands in the 2010-based SNPP. These
identify a migration rate for each age cohort within each district (for both in and out flows separately) which is applied to each individual age providing an Age Specific Migration Rate. This then drives the
demographic profile of those people moving into and out of the two districts (but not the total numbers of
migrants).
Housing
Headship
Rates
Headship rates that are specific to High Peak and Staffordshire Moorlands are forecast over the period
to 2021 were taken from the government data which was used to underpin the 2011-based CLG
household forecasts and applied to the demographic forecasts for each year as output by the PopGroup
model. These headship rates were split by age cohort and by household typology. These are the most
up-to-date headship rates available at the time of writing. Beyond 2021 this is assumed to resume the long term trends identified within the 2008-based household projections; i.e. indexed trends from the
2008-based projections are applied from 2021 to the end point of the Plan period post 2021.
Population not
in households
The number of population not in households (e.g. those in institutional care) is similarly taken from the
assumptions used to underpin the 2011-based CLG household forecasts. No change is assumed to the
rate of this from the 2008 CLG identified rate.
Vacancy / 2nd
Home Rate
A vacancy and second homes rate is applied to the number of households, representing the natural
vacancies/not permanently occupied homes which occur within the housing market. This means that
more dwellings than households are required to meet needs. The vacancy/second home rate in High
Peak Borough totals 3.2%, estimated using data from the Council Tax Base for Formula Grant Purposes
(October 2012), held constant over the forecast period. The equivalent rate for Staffordshire Moorlands is 4.6%.
P12/12 5800307v1 Nathaniel Lichfield & Partners Limited
Registered Office: 14 Regent’s Wharf, All Saints Street, London N1 9RL
Registered in England No. 2778116
Please visit our website for further
Information and contact details
www.nlpplanning.com
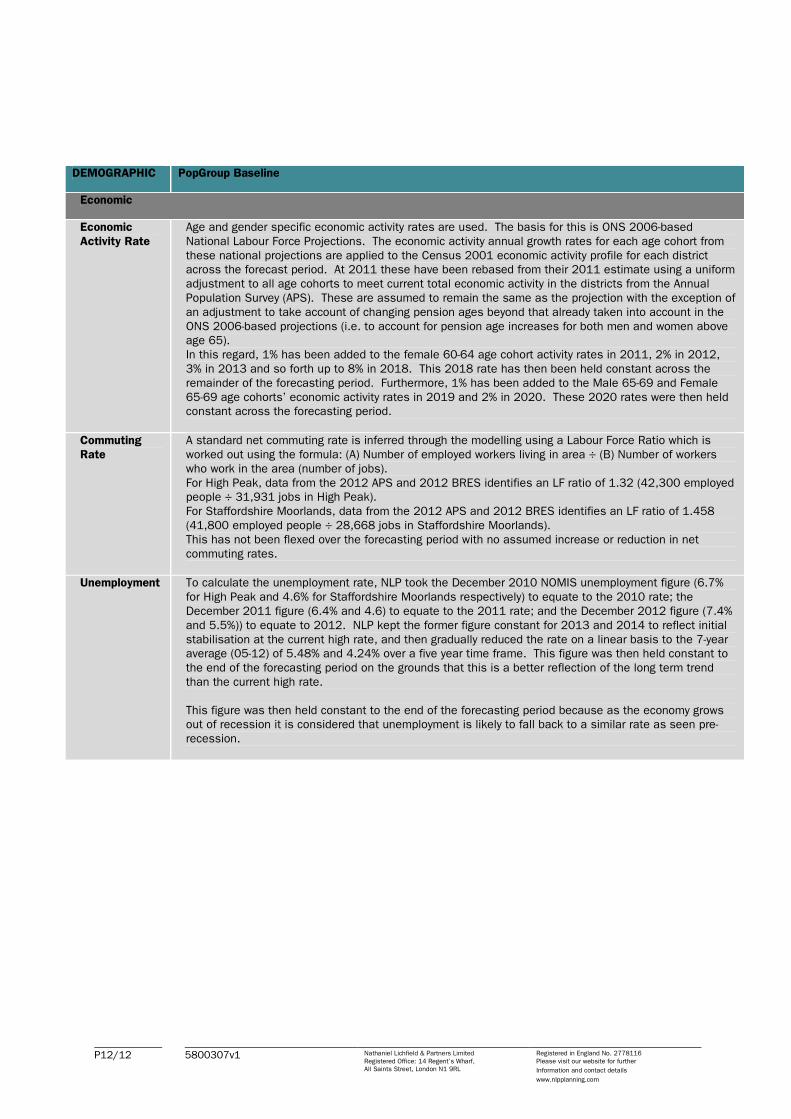
DEMOGRAPHIC PopGroup Baseline
Economic
Economic
Activity Rate
Age and gender specific economic activity rates are used. The basis for this is ONS 2006-based
National Labour Force Projections. The economic activity annual growth rates for each age cohort from
these national projections are applied to the Census 2001 economic activity profile for each district across the forecast period. At 2011 these have been rebased from their 2011 estimate using a uniform
adjustment to all age cohorts to meet current total economic activity in the districts from the Annual
Population Survey (APS). These are assumed to remain the same as the projection with the exception of
an adjustment to take account of changing pension ages beyond that already taken into account in the
ONS 2006-based projections (i.e. to account for pension age increases for both men and women above age 65).
In this regard, 1% has been added to the female 60-64 age cohort activity rates in 2011, 2% in 2012,
3% in 2013 and so forth up to 8% in 2018. This 2018 rate has then been held constant across the
remainder of the forecasting period. Furthermore, 1% has been added to the Male 65-69 and Female
65-69 age cohorts’ economic activity rates in 2019 and 2% in 2020. These 2020 rates were then held constant across the forecasting period.
Commuting
Rate
A standard net commuting rate is inferred through the modelling using a Labour Force Ratio which is
worked out using the formula: (A) Number of employed workers living in area ÷ (B) Number of workers
who work in the area (number of jobs).
For High Peak, data from the 2012 APS and 2012 BRES identifies an LF ratio of 1.32 (42,300 employed people ÷ 31,931 jobs in High Peak).
For Staffordshire Moorlands, data from the 2012 APS and 2012 BRES identifies an LF ratio of 1.458
(41,800 employed people ÷ 28,668 jobs in Staffordshire Moorlands).
This has not been flexed over the forecasting period with no assumed increase or reduction in net
commuting rates.
Unemployment To calculate the unemployment rate, NLP took the December 2010 NOMIS unemployment figure (6.7%
for High Peak and 4.6% for Staffordshire Moorlands respectively) to equate to the 2010 rate; the
December 2011 figure (6.4% and 4.6) to equate to the 2011 rate; and the December 2012 figure (7.4%
and 5.5%)) to equate to 2012. NLP kept the former figure constant for 2013 and 2014 to reflect initial
stabilisation at the current high rate, and then gradually reduced the rate on a linear basis to the 7-year average (05-12) of 5.48% and 4.24% over a five year time frame. This figure was then held constant to
the end of the forecasting period on the grounds that this is a better reflection of the long term trend
than the current high rate.
This figure was then held constant to the end of the forecasting period because as the economy grows out of recession it is considered that unemployment is likely to fall back to a similar rate as seen pre-
recession.