technological and nutritional studies on sweet lupine ... · technological and nutritional studies...
TRANSCRIPT

Technological and Nutritional Studies on Sweet Lupine Seeds and itsApplicability in Selected Bakery Products
vorgelegte Dissertation von
M.Sc. Abdelrahman Ragab Abdelrahman Ahmed
aus Kairo (Ägypten)
von der Fakultät III – Prozesswissenschaften,
Institut für Lebensmitteltechnologie und Lebensmittelchemie
der Technischen Universität Berlin
zur Erlangung des akademischen Grades
Doktor der Ingenieurwissenschaften
-Dr.-Ing.-
genehmigte Dissertation
Promotionsausschuss:
Vorsitzender: Prof. Dr. Eckhard Flöter
Gutachter: Prof. Dr. sc. techn. B. Senge
Gutachter: Prof. Dr.-Ing. Dr. Iryna Smetanska
Tag der wissenschaftlichen Aussprache: 27.8.2012
Berlin 2012
D83

Technological and Nutritional Studies on Sweet Lupine Seeds and itsApplicability in Selected Bakery Products
Submitted Thesis by
M.Sc. Abdelrahman Ragab Abdelrahman Ahmed
from Cairo, Egypt
Faculty III - Process Science, Institute of Food Technology and Food Chemistry,
Technical University of Berlin,
Submitted in Partial Fulfillment of the Requirements for
The Degree Academic of Doctor of Engineering (Food Science)
-Dr.-Ing.-
Approved Thesis
Promotion committee:
Vorsitzender: Prof. Dr. Eckhard Flöter
Gutachter: Prof. Dr. sc. techn. B. Senge
Gutachter: Prof. Dr.-Ing. Dr. Iryna Smetanska
Date of examination: 27.8.2012
Berlin 2012
D83

Acknowledgements
I
AcknowledgementsI would like to thank Prof. Dr. sc techn. B. Senge, my sincere thanks for technical
assistance support for this work. My special thanks for his valuable scientific advice and work
experience during my time at the Institute for Food Rheology, for continuous supervision and
every possible help during the preparation of written my thesis.
My sincere gratitude is due to my supervisor, Prof. Dr.-Ing. Dr. Iryna Smetanska for her
helping and given me the opportunity to complete the thesis in department of Methods of Food
Biotechnology, Institute of Food Technology and Food Chemistry, Faculty of Process
Engineering, Berlin University of Technology, Germany. I would like to express my deepest and
sincere appreciation to her for the continuous support, scientific advice, providing the necessary
laboratory facilities, guiding the experimental work.
I cannot forget to extend my thanks to Dr.-Ing. Idriss Mohammed, department of Food
Rheology, Institute of Food Technology and Food Chemistry, Faculty of Process Engineering,
Berlin University of Technology, Germany for his valuable advice, encouragement and scientific
contributions.
I would like to thank Prof. Dr. Eckhard Flöter for his approval to be a Head of the
examination committee.
To all present and former colleagues at the Department of Methods of Food Biotechnology,
Institute of Food Technology and Food Chemistry, Faculty of Process Engineering, Berlin
University of Technology, I am thankful for providing a very comfortable atmosphere to
complete my work.
Gratitude is also extended to all staff members, my colleagues and workers of the Home
Economics Department, Faculty of Education, Ain Shams University, Egypt for their continuous
encouragements.
Finally, my sincere thanks and gratitude are for my parents, my dear wife Haiam Elkatry,
my daughter Toqa and my son Ahmed throughout my studies and during these years abroad. In
spite of being away, they were always present for their advices and encouragement during my
stay in Germany.
Abdelrahman Ragab Abdelrahman Ahmed
Abstract
II
AbstractLegume seeds are an abundant source of proteins and, among them; lupine is one of the
richest. Lupine seed deserves great interest due to its chemical composition and augmentedavailability in many countries in recent years. The aim of this research was to study the chemicaland nutritional properties of sweet lupine seeds and effects of its addition at differentconcentration (5, 10 and 15 %) on the dough rheology and backing characteristics of wheat flourenrichment lupine flour and lupine fiber.
Lupine flour showed higher levels of moisture, crude protein, ash, crude fat and dietaryfiber than the wheat flour. Conversely, wheat flour showed higher levels of starch. The lupinefiber showed higher levels ash, crude fat and dietary fiber than the wheat flour. Essential aminoacids (lysine, threonine, isoleucine, phenylalanine and tryptophane) in lupine flour were higherthan those in wheat flour except methionine content which was higher in wheat flour (1.7 g/kg).The lupine flour showed higher levels of total phenolic and total flavonoids than the wheat flour.Conversely, wheat flour showed higher levels of total flavonols. Results clearly indicate thatlupine flour exhibited higher antioxidant activity with DPPH and ABTS than the wheat flour. Theconventional rheological studies of dough (Farinograph) show clear differences between wheatflour, lupine flour, lupine fiber and their blends. With increasing concentration of lupine flour orfiber, the viscoelastic properties were decrease.
The dough blends demonstrated a deformation-dependent behavior and a distinctive linearviscoelastic behavior in the range of 10-4 ≤ γ ≤ 10-3. The curves slope of storage modulus G´ andloss modulus G'' nearly parallel in frequency sweep measurements for all concentrations, G´ wasmuch greater than G'' this indicates the distinctive solid state characteristics of all dough’s anddemonstrated that dough promoted dispersion and not gel-like structure. The level of G' and G"increase with increasing the lupine proportion. By the temperature sweep, simulated the bakeryprocess, increase from 15 to 90 °C can be detected the changes of material and process asdenaturation of proteins, pre-and gelatinization of starch granules and the immobilization ofwater. A sensory acceptability of the bread or cake is satisfactory up to 10 % concentration oflupine flour or fiber given. Even though deterioration in the structural formation and a weakeningof the gluten formation in the dough system after the addition of lupine flour or fiber weredetected that the blends have relatively good viscoelastic behavior (viscoelastic properties will bemaintained by the dominance of wheat) to bake acceptable, protein enriched consumable andbread.
Finally, the addition of lupine flour or fiber reduced the blood glucose, total cholesterol andtotal lipid for diabetic rats. Lupine flour or fiber can be used successfully as hypoglycemic agentsin bakery products. This could be utilized for the development of composite blends from locallyproduced lupine at small scale industry level as value-add products.
Keywords: Lupine; Nutrition Value; Chemical Composition; Rheological Properties; BakingApplications; Diabetic Rats
Abstract
III
AbstractDer Einsatz von Leguminosenprotein für die menschliche Ernährung stellt eine
hochwertige natürliche Ressource dar. Die Lupineinhaltsstoffe sind auch für Entwicklungs- undSchwellenländer als eigenständige landwirtschaftliche Ressourcen verfügbar und sichern dieProteinversorgung mit hohem Gesundheitsbezug. Ziel dieser Arbeit ist es, die physio-chemischenund ernährungsphysiologischen Eigenschaften von Süßlupinen beim Einsatz mit einerKonzentration von 5, 10 und 15 % auf Weizenmehl zu untersuchen. Die Veränderungen derTeigrheologie und der Backeigenschaften bei Zugabe von Lupinenmehl und Lupinenfasern sowiedie nutritive Bewertung sind Gegenstand der vorgelegten Arbeit.
Der Einsatz von LF als Zumischung zum WF bewirkt eine Veränderung desWasserbindevermögens, von Rohprotein, Asche, Rohfett und dem Ballaststoffgehalt. WährendWeizenmehl einen höheren Eiweißgehalt aufweist, besitzen Lupinenfasern höhere Anteile anAsche, Rohfett und Ballaststoffen. Ebenso erhöht im Süßlupinemehl ist der Anteil essentiellerAminosäuren wie Lysin und Threonin. Aus ernährungsphysiologischer Sicht ergänzen sichWeizen- und Süßlupineneiweiß im Aminosäurespektrum. Weiter weist LF einen höheren Gehaltvon phenolischen Flavanoiden auf. Ebenso ist eine höhere antioxidative Aktivität am Beispielvon DPPH und ABTS als im WF vorhanden.
Bereits konventionelle rheologische Untersuchungen von Teigen mit dem Farinopraphweisen deutliche Unterschiede zwischen WF, LF und L- fasern im untersuchtenKonzentrationsbereich auf. Mit zunehmendem Anteil LF wird eine Abnahme derviskoelastischen Relation festgestellt. Die mit LF und –fasern angereicherten Teige zeigen einlinear- und viskoelastisches Verhalten nur in einem schmalen Bereich von 10-4 ≤ γ ≤ 10-3 auf.Der parallele Verlauf der G' und G′′ - kurven mit Anstieg im Frequenzsweep weist für jededurchgeführte Messanstellung eine Dispersion nach. Die Backeigenschaften werden mit Hilfevon Temperatusweeps untersucht. Zusätzliche Kriechtestmessungen liefern Kennwerte zurRuhescherviskosität, zum Gesamtschubmodul und zur Komplianz. Die Level von G' und G′′sinken generell bei Erhöhung der LF- zugabe, was auf eine Inkompatibilität von Weizen- undLeguminoseneiweiß hindeutet. Als akzeptable Grenz-konzentration für die Implementierung wirdeine Zumischung von 10 % anerkannt, um die Teig- und Backwarenstruktur zu sichern. Unterdiesen Bedingungen ist auch die sensorische Akzeptanz von Backwaren wie Brot und Kuchengesichert.
Die schlechtesten Strukturen werden bei Einsatz von L- fasern mit hohem Anteil anPolysacchariden bzw. Polyphenolen erhalten. Gerade der Einsatz von Lupinenfasermaterial alsBallaststoffmaterial bewirkt aus diesem Grunde eine Absenkung des Blutzuckergehaltes, desGesamtcholesteringehaltes, des Lipidgehaltes sowie eine antidiabetische Wirkung, die beiumfangreichen Untersuchungen mit diabetischen Ratten nachgewiesen wurden. Die Ergebnissedieser Arbeit können in Mehlmischungen aus lokal produzierten Lupinen in Schwellen- undEntwicklungsländern genutzt werden. Die problematische Eiweißversorgung gerade von ärmerenBevölkerungsschichten kann so bei Beibehaltung bekannter Weizenbacktechnologienperspektivisch besser gesichert werden.
Schlüsselwörter: Lupine; Nährwert; chemische Zusammensetzung; rheologische Eigenschaften;Backanwendungen; diabetische Ratten

List of Contents
IV
List of ContentsAcknowledgements .............................................................................................................................................. I
Abstract ................................................................................................................................................................ II
Abstrakt ............................................................................................................................................................. III
List of Contents ................................................................................................................................................. IV
List of Figures ................................................................................................................................................... IX
List of Tables..................................................................................................................................................... XI
List of Symbols .............................................................................................................................................. XIII
List of Greek Symbols ................................................................................................................................... XIV
List of Abbreviations .......................................................................................................................................XV
1. Introduction ..................................................................................................................................................... 1
1.1. Background of the study .......................................................................................................................... 1
1.2. Statement of the problem ......................................................................................................................... 2
2. Tasks and Objectives ...................................................................................................................................... 4
3. Review of literature ........................................................................................................................................ 6
3.1. Taxonomy and classification ................................................................................................................... 6
3.2. Centers of origin ....................................................................................................................................... 7
3.3. Production and utilization ........................................................................................................................ 8
3.3.1. Worldwide production of L. albus ................................................................................................... 8
3.3.2. History of L. albus utilization........................................................................................................... 9
3.3.3. Some Common Lupine Based Food Types ..................................................................................... 9
3.4. Chemical and Nutritional Composition of lupine grains ..................................................................... 10
3.4.1. Crud protein ..................................................................................................................................... 12
3.4.2. Amino acids content ....................................................................................................................... 12
3.4.3. Crud fiber ......................................................................................................................................... 13
3.4.4. Crud fat ............................................................................................................................................ 14
3.5. Chemical and nutritional composition of wheat grains........................................................................ 14
3.5.1. Crud protein ..................................................................................................................................... 15
3.5.2. Amino acids content ....................................................................................................................... 15

List of Contents
V
3.5.3. Crud fiber ......................................................................................................................................... 15
3.5.4. Crud fat ............................................................................................................................................ 16
3.6. Phenolic compounds and active components ....................................................................................... 16
3.6.1. Content of total phenolic and tannins in leguminous seeds ......................................................... 17
3.6.2. Phenolic composition of leguminous seeds ................................................................................... 18
3.6.3. Antioxidant activity of lupine seeds or their extracts ................................................................... 18
3.7. Milling/Particle size analysis ................................................................................................................. 19
3.7.1. Milling ............................................................................................................................................. 19
3.7.2. Hammer mills .................................................................................................................................. 21
3.7.3. Particle size analysis ....................................................................................................................... 21
3.8. Rheological properties of wheat and composed flour dough .............................................................. 22
3.8.1. Definition of Rheology ................................................................................................................... 22
3.8.2. Factors affecting dough rheological properties ............................................................................. 23
3.8.2.1. Water absorption and structure formation .............................................................................. 23
3.8.2.2. Temperature ............................................................................................................................. 23
3.8.2.3. Sodium chloride ....................................................................................................................... 24
3.8.2.4. Mixing process ......................................................................................................................... 25
3.8.2.5. Effects of lupine flour or fiber addition on dough quality .................................................... 25
3.8.3. Rheological behaviour measurements ........................................................................................... 26
3.8.3.1. Empirical rheology .................................................................................................................. 27
3.8.3.2. Fundamental rheology ............................................................................................................. 29
3.9. Effects of lupine flour or fiber addition on quality of bakery products .............................................. 31
3. 10. Nutritional benefits of legumes .......................................................................................................... 33
3.10.1. Lupine flour ................................................................................................................................... 34
3.10.2. Lupine fiber ................................................................................................................................... 36
3.11. Review conclusion ............................................................................................................................... 38

List of Contents
VI
4. Materials and Methods ................................................................................................................................. 40
4.1. Materials.................................................................................................................................................. 40
4.2. Chemical analysis ................................................................................................................................... 40
4.2.1. Proximate composition ................................................................................................................... 40
4.2.2. Amino acid analysis ........................................................................................................................ 40
4.2.3. Determination of total phenolics .................................................................................................... 41
4.2.4. Determination of total flavonoids .................................................................................................. 41
4.2.5. Determination of total flavonols .................................................................................................... 41
4.2.6. Antioxidant activity of extracts ...................................................................................................... 41
4.2.6.1. DPPH· radical-scavenging activity .............................................................................................. 42
4.2.6.2. ABTS radical-scavenging activity ............................................................................................... 42
4.2.7. HPLC analysis ................................................................................................................................. 42
4.3. Particle size analysis by laser particle analysis .................................................................................... 43
4.4. Doughs preparation ................................................................................................................................ 44
4.5. Empirical rheological properties of dough ........................................................................................... 44
4.6. Fundamental rheological properties of bread dough and cake batter ................................................. 45
4.6.1. Oscillation test ................................................................................................................................. 46
4.6.1.1. Amplitude sweep ..................................................................................................................... 46
4.6.1.2. Frequency sweep ...................................................................................................................... 46
4.6.1.3. Temperature sweep .................................................................................................................. 46
4.6.2. Creep test ......................................................................................................................................... 47
4.7. Technological properties methods......................................................................................................... 47
4.7.1. Bread formulation and baking ........................................................................................................ 47
4.7.2. Cake formulation and baking ......................................................................................................... 47
4.7.3. Loaf volume determination ............................................................................................................ 48
4.7.4. Color measurements........................................................................................................................ 48

List of Contents
VII
4.7.5. Sensory evaluation .......................................................................................................................... 48
4.8. Diet and experimental animals design: ................................................................................................. 48
4.9. Statistical analysis .................................................................................................................................. 49
5. Chemical composition .................................................................................................................................. 50
5.1. Wheat flour, lupine flour and their blends ............................................................................................ 50
5.2. Wheat flour, lupine fiber and their blends ............................................................................................ 51
5.3. Amino acids content ............................................................................................................................... 52
5.4. Phenolic compounds and antioxidants capacity ................................................................................... 54
5.4.1. Wheat flour, lupine flour and their blends ..................................................................................... 54
5.4.2. Wheat flour, lupine fiber and their blends ..................................................................................... 57
6. Physical investigation ................................................................................................................................... 58
6.1. Milling and particle size distribution .................................................................................................... 58
6.2. Dough physical tests (farinograph test) ................................................................................................ 59
6.2.1. Wheat flour ...................................................................................................................................... 59
6.2.2. Flour mixtures (5, 10 and 15 % lupine flour or lupine fiber) ....................................................... 61
6.3. Oscillation measurments ........................................................................................................................ 64
6.3.1. Amplitude sweep measurements .................................................................................................... 64
6.3.1.1. Wheat and lupine flour dough ................................................................................................. 64
6.3.1.2. Wheat and lupine fiber dough ................................................................................................. 66
6.3.1.3. Wheat and lupine flour batter .................................................................................................. 68
6.3.1.4. Wheat and lupine fiber batter .................................................................................................. 69
6.3.2. Frequency sweep measurements .................................................................................................... 71
6.3.2.1. Wheat and lupine flour dough ................................................................................................. 71
6.3.2.2. Wheat and lupine fiber dough ................................................................................................. 73
6.3.2.3. Wheat and lupine flour batter .................................................................................................. 74
6.3.2.4. Wheat and lupine fiber batter .................................................................................................. 76
6.3.3. Temperature sweep measurements (TSM) .................................................................................... 77
List of Contents
VIII
6.3.3.1. Wheat and lupine flour dough ................................................................................................. 77
6.3.3.2. Wheat and lupine fiber dough ................................................................................................. 80
6.3.3.3. Wheat and lupine flour or fiber batter .................................................................................... 82
6.4. Creep tests for wheat and lupine flour or fiber dough ......................................................................... 87
7. Baking properties .......................................................................................................................................... 89
7.1. Influence of lupine flour or fiber incorporation on bread properties .................................................. 89
7.2. Influence of lupine flour or fiber incorporation on cake properties .................................................... 93
8. Biological evaluation of lupine flour (LF) and lupine fiber (L-fiber) ....................................................... 98
8.1. Body weight and Food intake ................................................................................................................ 98
8.2. Biochemical analysis ............................................................................................................................ 100
8.2.1. Glucose level ................................................................................................................................. 100
8.2.2. Serum cholesterol and total lipids ................................................................................................ 100
9. Conclusion................................................................................................................................................... 103
10. References ................................................................................................................................................. 107
11. Appendix ................................................................................................................................................... 127
List of Figures
IX
List of FiguresFigure 1: Flowers of different lupine species .................................................................................................... 6
Figure 2: Pods of L. albus seeds ........................................................................................................................ 7
Figure 3: Primary (single line circle) and secondary (double line circles) centers of origin for L. albusin the Mediterranean Region (Noffsinger and Van Santen, 2005). .............................................. 8
Figure 4: Some model foods containing lupine protein ................................................................................. 10
Figure 5: Seed coat and cotyledon composition of other species of Lupinus genus .................................... 11
Figure 6: Comparative whole grain content of the major domesticated species .......................................... 12
Figure 7: Longitudinal section of grain of wheat............................................................................................ 14
Figure 8: Hammer mill ..................................................................................................................................... 20
Figure 9: Creep and recovery test (Kunzek et al., 1997). ............................................................................... 22
Figure 10: Farinogram of wheat flour ............................................................................................................. 28
Figure 11: Particle size analyzer HORIBA LA-950 Retsch .......................................................................... 44
Figure 12: Brabender Farinograph ................................................................................................................... 45
Figure 13: Laboratory instrument universal dynamic spectrometer UDS 200 plate–plate system(measure system MP 31 right side) ............................................................................................... 46
Figure 14: Laboratory instrument universal dynamic spectrometer 200 cylinder measure system ............ 47
Figure 15: HPLC chromatogram of methanol extract of: wheat flour (A), lupine flour (B) and wheatflour supplemented with lupine flour at different concentration, 5 % (C). 10 % (D) and 15% (E). 1. gallic, 2. procatechuic, 3. p-hydroxybenzoic, 4. vanillin, 5. P coumaric, 6.chlorogenic, 7. cinnamic 8. sinapine and 9. ferulic acid. ............................................................ 57
Figure 16: Laser diffractionetry of wheat flour (WF), lupine flour (LF) and lupine fiber (L-fiber). .......... 59
Figure 17: Farinogram for wheat flour (WF). ................................................................................................. 60
Figure 18: Farinograph data of doughs made from wheat flour (WF), lupine flour (LF) and lupine fiber(L-fiber) (3 replicates) ................................................................................................................... 61
Figure 19: Farinogram data of doughs made from flour mixtures (5, 10 and 15 % lupine flour). .............. 62
Figure 20: Farinogram data of doughs made from flour mixtures (5, 10 and 15 % lupine fiber). .............. 62
Figure 21: Amplitude sweep the flour mixture in dough (5, 10 and 15 % lupine flour) .............................. 65
Figure 22: Amplitude sweep the flour mixture in dough (5, 10 and 15 % lupine fiber) .............................. 67
Figure 23: Amplitude sweep the flour mixture in batter cake (5, 10 and 15 % lupine flour). ..................... 68
Figure 24: Amplitude sweep the flour mixture in batter cake (5, 10 and 15 % lupine fiber). ..................... 70

List of Figures
X
Figure 25: Frequency sweep the flour mixture in dough (5, 10 and 15 % lupine flour). ............................. 71
Figure 26: Frequency sweep the flour mixture in dough (5, 10 and 15 % lupine fiber). ............................. 73
Figure 27: Frequency sweep the flour mixture in batter cake (5, 10 and 15 % lupine flour). ..................... 74
Figure 28: Frequency sweep the flour mixture in batter cake (5, 10 and 15 % lupine fiber) ...................... 76
Figure 29: Temperature sweep the flour mixture in dough (5, 10 and 15 % lupine flour). ......................... 78
Figure 30: Temperature sweep the flour mixture in dough (5, 10 and 15 % lupine fiber). ......................... 81
Figure 31: Temperature sweep for flour mixture in dough (5, 10 and 15 % lupine flour). ......................... 83
Figure 32: Temperature sweep the flour mixture in dough (5, 10 and 15 % lupine fiber). ......................... 84
Figure 33: Creep comparison for wheat and lupine flour or fiber dough. ..................................................... 87
Figure 34: Dough properties compared between wheat flour dough and flour mixtures with lupineflour. ................................................................................................................................................ 89
Figure 35: Dough properties compared between wheat flour dough and flour mixtures with lupinefiber. ................................................................................................................................................ 89
Figure 36: Comparison of the baking properties of wheat flour and mixes with lupine flour or fiberbread. ............................................................................................................................................... 91
Figure 37: Comparison of the baking properties of wheat flour and mixes with lupine flour or fibercake. ................................................................................................................................................ 95
Figure 38: Crumb color of wheat flour and mixes with lupine flour or fiber cake. ..................................... 97

List of Tables
XI
List of TablesTable 1: Chemical composition of wheat flour (WF), lupine flour (LF) and their blends ........................... 51
Table 2: Chemical composition of wheat flour (WF), Lupine fiber (L-fiber) and their blends................... 52
Table 3: The total amino acids % dry matter, for wheat (WF) and lupine flour (LF). ................................. 53
Table 4: Extract yield, total polyphenols content and antioxidant capacity of wheat flour (WF), lupineflour (LF) and their blends. ........................................................................................................... 54
Table 5: Extract yield, total polyphenols content and antioxidant capacity of wheat flour (WF), lupinefiber (L-fiber) and their blends. ..................................................................................................... 57
Table 6: Laser particle analysis for wheat flour (WF), lupine flour (LF) and lupine fiber (L-fiber) .......... 59
Table 7: Farinogram data of doughs made from wheat flour (WF), lupine flour (LF) and lupine fiber(L-fiber). ......................................................................................................................................... 60
Table 8: Amplitude sweep data for the flour mixture in dough (5, 10 and 15 % lupine flour). .................. 65
Table 9: Amplitude sweep data for the flour mixture in dough (5, 10 and 15 % lupine fiber). .................. 67
Table 10: Amplitude sweep data for the flour mixture in batter (5, 10 and 15 % lupine flour). ................. 69
Table 11: Amplitude sweep data for the flour mixture in batter (5, 10 and 15 % lupine fiber). ................. 70
Table 12: Frequency sweep data for the flour mixture in dough (5, 10 and 15 % lupine flour). ................ 72
Table 13: Frequency sweep data for the flour mixture in dough (5, 10 and 15 % lupine fiber).................. 73
Table 14: Frequency sweep data for the flour mixture in batter cake (5, 10 and 15 % lupine flour). ......... 75
Table 15: Frequency sweep data for the flour mixture in batter cake (5, 10 and 15 % lupine fiber). ......... 76
Table 16: Temperature sweep the flour mixture in dough (5, 10 and 15 % lupine flour)............................ 79
Table 17: Temperature sweep for flour mixture in dough (5, 10 and 15 % lupine fiber). ........................... 82
Table 18: Temperature sweep for flour mixture in batter (5, 10 and 15 % lupine flour). ............................ 85
Table 19: Temperature sweep an flour mixture in batter (5, 10 and 15 % lupine fiber). ............................. 86
Table 20: Creep comparison for wheat and lupine flour or fiber dough. ...................................................... 88
Table 21: Loaf characteristics of wheat flour and lupine flour or fiber composite flours. .......................... 90
Table 22: Color measurements of bread from wheat flour and lupine flour or fiber composite flours. ..... 92
Table 23: Sensory evaluation of bread from wheat flour and lupine flour or fiber composite flours. ........ 93
Table 24: Cake characteristics of wheat flour and lupine flour or fiber composite flours. .......................... 94
Table 25: Color measurements of cake from wheat flour and lupine flour or fiber composite flours. ....... 96
Table 26: Sensory evaluation of bread from wheat flour and lupine flour or fiber composite flours. ........ 97

List of Tables
XII
Table 27: Gain in body weight, feed intake and feed efficiency ratio (FER) of healthy and diabetic ratsfed on basal diet supplemented with different levels of lupine flour (LF) and lupine fiber(L-fiber). ......................................................................................................................................... 99
Table 28: Glucose, cholesterol and total lipid contents (mg/100 ml) of healthy and diabetic rats fed onbasal diet supplemented with different levels of lupine flour (LF) and lupine fiber (L-fiber).101
List of Symbols
XIII
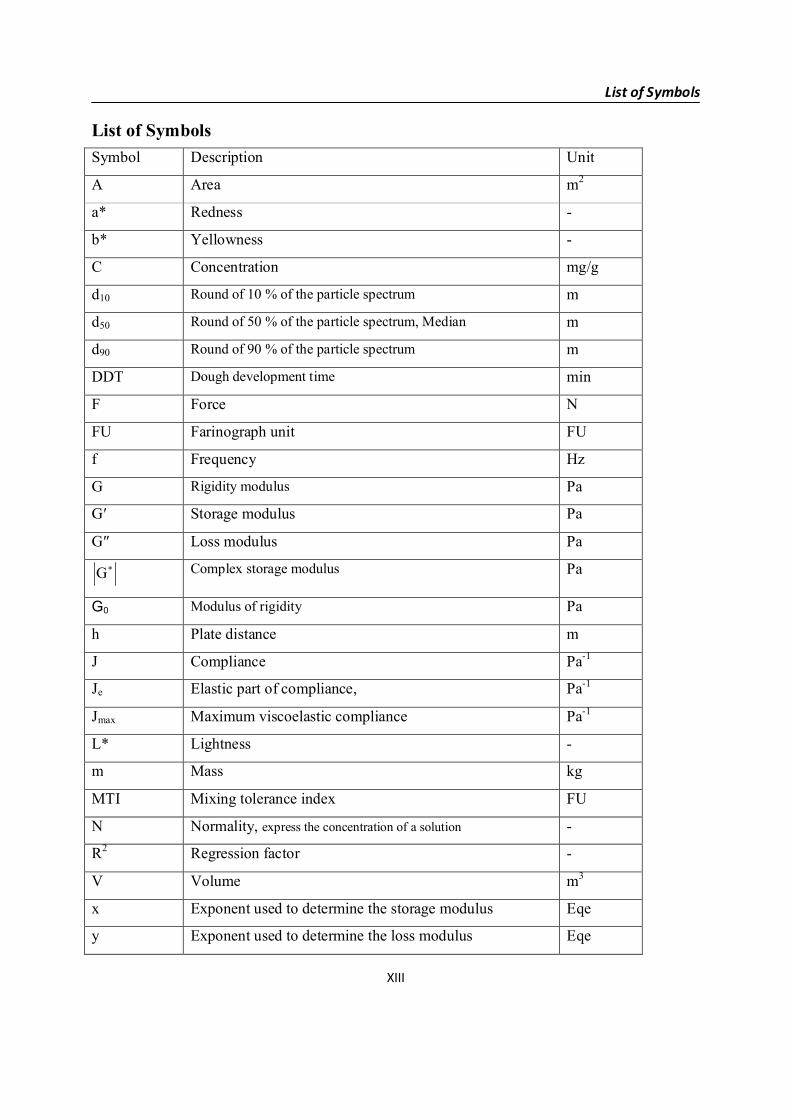
List of SymbolsSymbol Description Unit
A Area m2
a* Redness -
b* Yellowness -
C Concentration mg/g
d10 Round of 10 % of the particle spectrum m
d50 Round of 50 % of the particle spectrum, Median m
d90 Round of 90 % of the particle spectrum m
DDT Dough development time min
F Force N
FU Farinograph unit FU
f Frequency Hz
G Rigidity modulus Pa
G′ Storage modulus Pa
G″ Loss modulus Pa*G Complex storage modulus Pa
G0 Modulus of rigidity Pa
h Plate distance m
J Compliance Pa-1
Je Elastic part of compliance, Pa-1
Jmax Maximum viscoelastic compliance Pa-1
L* Lightness -
m Mass kg
MTI Mixing tolerance index FU
N Normality, express the concentration of a solution -
R2 Regression factor -
V Volume m3
x Exponent used to determine the storage modulus Eqe
y Exponent used to determine the loss modulus Eqe
List of Symbols
XIV
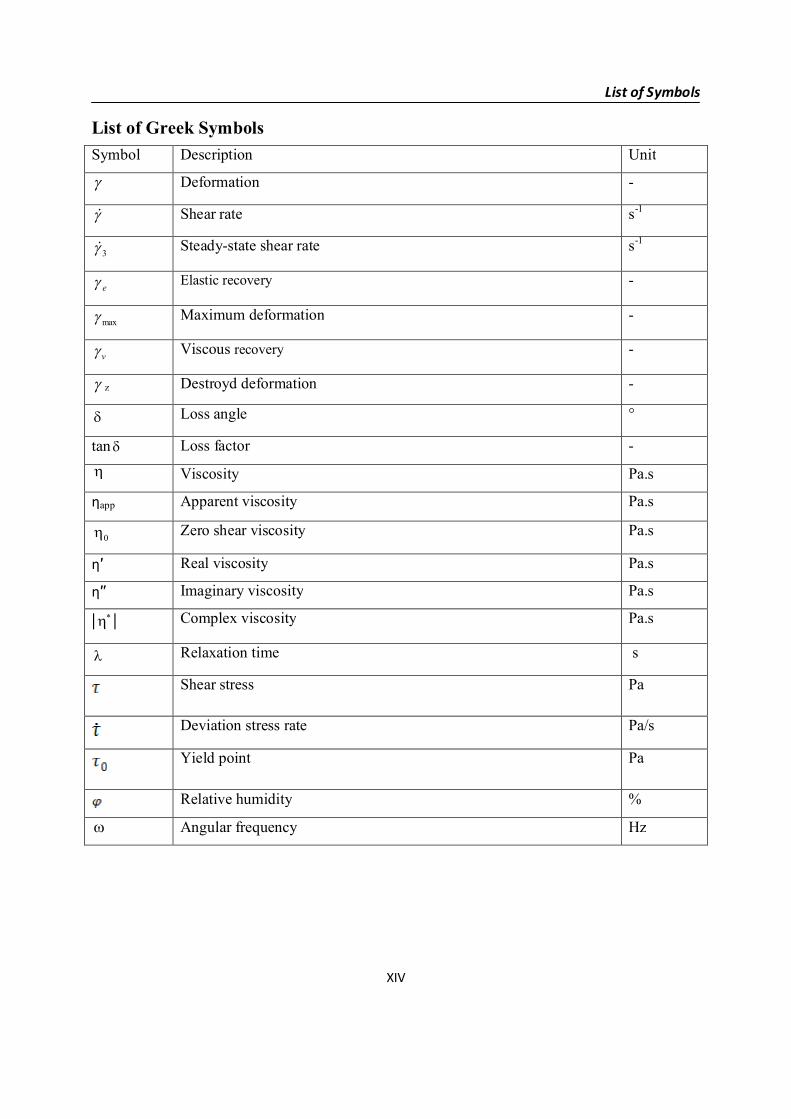
List of Greek SymbolsSymbol Description Unit
g Deformation -
g& Shear rate s-1
3g& Steady-state shear rate s-1
eg Elastic recovery -
maxg Maximum deformation -
vg Viscous recovery -
g z Destroyd deformation -
d Loss angle °
tan d Loss factor -
h Viscosity Pa.s
ηapp Apparent viscosity Pa.s
0h Zero shear viscosity Pa.s
η′ Real viscosity Pa.s
η′′ Imaginary viscosity Pa.s
| *h | Complex viscosity Pa.s
l Relaxation time s
Shear stress Pa
Deviation stress rate Pa/s
Yield point Pa
Relative humidity %
w Angular frequency Hz

List of Abbreviations
XV
List of AbbreviationsAbbreviation Clarification
AACC American association of cereal chemistry
Ab Absorbance
ABTS 2, 2′-azinobis (3-ethylbenzthiazoline- sulphonic acid)
ACNFP Advisory Committee on Novel Foods and Processes
AHC Australian Health Info Center
ANN Artificial neural network
ANOVA Analysis of variance
AOAC Association of official analytical chemists
ARC Center of excellence for integrative legume research
BSA Bovine serum albumin
CS Chemical score
Control A* Normal rats fed on basal diet
Control B* Diabetic rats fed on basal diet
DDT Dough development time
DPPH 1,1-diphenyl-2-picrylhydrazyl
DW Dry weight
EAA Essential amino acid
EAAI Essential amino acid index
FAO Food and Agriculture Organization
FU Farinograph unit
FER Feed efficiency ratio
GAE Galic acid equivalents
HPLC High-performance liquid chromatography
ICC International Association for Cereal Chemistry
IDF Insoluble dietary fibre
ISO International Standard Organization
LF Lupine flour
L-fiber Lupine fiber
LSD Least significant difference

List of Abbreviations
XVI
LVR Linear viscoelastic region
MTI Mixing tolerance index
P Probability
PER Protein efficiency ratio
QE Quercetin equivalent
SAS Statistical analysis system
SDF Soluble dietary fibre
TDF Total dietary fibre
TPC Total phenolic content
TSM Temperature sweep measurements
UDS Universal dynamic spectrometer
WF Wheat flour
WHO World Health Organization

Introduction
1
1. Introduction
1.1. Background of the study
Leguminosae is one of the three largest families of flowering plants, comprising nearly 700
genera and 18,000 species. The legumes used by humans are commonly called food legumes or
grain legumes. The food legumes can be divided into two groups, the pulses and the oilseeds.
Pulses group consists of dried seeds of cultivated legumes, which have been eaten for a long time
(Asian Productivity Organization, 2003).
In general, cereals and legumes take a large place of human food consumption. Animal
proteins being more expensive, especially people in developing countries depend largely on plant
to fulfill their protein requirements. Grain legumes alone contribute to about 33 % of the dietary
protein nitrogen needs of humans. Moreover, it is also a good source of minerals (Kirmizi and
Guleryuz, 2007). Besides being a good source of nutrition, there is a considerable interest in the
relationship between plant-based diets and the prevention of certain human diseases, in which
increased levels of radicals are implicated. Likewise legumes seem to be responsible for
improving health and can prevent chronic diseases (Frias et al., 2005). Cholesterol-free legumes
in combination with their low sodium content form a good food stuff not only for people living in
developing countries but also for those living in industrialized nations (Sebastiá et al., 2001).
Lupine has been used as a source of protein and oil since ancient times. Currently interest
in a wider utilization of this legume seed is rising. This is mainly due to its similarity with
soybeans as a high source of protein and to the fact that it can be grown in wider climatic range.
Moreover; its adaptation to poor (i.e. leached) soil, makes it economically feasible (Sujak et al.,
2006). Lupine is commonly consumed as a snack in the Middle East and is coming into use as a
high-protein soy substitute in the other parts of the world (Kurzbaum et al., 2008).
Out of the many species of lupine, Lupinus albus native to Mediterranean area is
agriculturally important (Kurzbaum et al., 2008). During the past 3000 years, L. albus has been
used as a minor crop in the old and new world. Human movement and de-centralization has
helped L. albus to diversify considerably in the primary and secondary centers of its origin. This
diversification has helped for the development of interesting characteristics of the plant. These
include cold and disease tolerant, having improved leaflet and seed size and shape, flower and

Introduction
2
seed color, and degree of apical and branch dominance characteristics of the plant (Noffsinger
and Van Santen, 2005).
Lupine flour is widely considered an excellent raw material for supplementing different
food products owing to its high protein content (Sironi et al., 2005) and is largely used as eggs
substitute, for example in cakes, pancakes, biscuits, or brioche (Tronc, 1999), and has been added
to spaghetti (Rayas-Duarte et al., 1996), pasta, crisps (Lampart-Szczapa et al., 1997), and bread
(Dervas et al., 1999). It has been also used as a butter substitute in cake, brioche, and croissant
(Tronc, 1999). Lupine does not contain gluten, thus it is sometimes used as a functional
ingredient in gluten-free foods (Scarafoni et al., 2009). Lupine kernel fiber has also a potential as
a human food ingredient as it has been used in the production of fiber-enriched baked goods and
pasta (Smith et al., 2006).
From the 1st step in the bread making process (blending of flour and water with other
ingredients) to the final step (baking), the ingredients used undergo a number of physical and
chemical changes (Faridi and Faubion, 1990) such as evaporation of water, formation of porous
structure, volume expansion, protein denaturation, starch gelatinization, crust formation etc. take
place during bread baking. Crumb structure of cereal products like bread is a very important
factor determining the sensorial quality as may be quantified for example as texture or crispness
as well as storage and staling properties (Regier et al., 2007).
1.2. Statement of the problem
Many researchers have paid more attention towards the possibility of using lupins as a
human food (Petterson and Mackintosh, 1997) and their potential health benefits. Due to low
glycemic index of lupine seeds, it was found that lupine kernel fibers have appetite suppression
(Archer et al., 2004) and cholesterol lowering properties, that they lower blood glucose and
insulin levels, and aid bowel health as a fecal bulking agent. However, little is known about their
photochemistry and antioxidant activity (Hall et al., 2005).
Full understanding of the rheological behavior of flour dough is of great importance from
the practical point of view. Dough rheology directly affects the baking performance of flours, and
rheological analyses have been made in order to optimize dough formulation and dough quality.
Although dough rheology has long been investigated, there remains a significant lack of
Introduction
3
understanding. This lacks of progress is due to the complexity of this biological system (Masi et
al., 2001).
The nutritional quality of wheat protein is lower than that of proteins from pulses and
oilseeds due to its low levels of lysine, methionine, and threonine (Kulp, 1988). Nevertheless,
demand for wheat-based bakery products is increasing, particularly in developing countries
where the major grain is wheat (Quail, 1996). The nutritional quality of these products could be
improved by supplementation with non wheat proteins such as those from pulses, including
lupine, which would increase the protein content and improve the essential amino acid balance of
the baked product.
The aim of this research was to study the chemical and nutritional properties of sweet
lupine flour and fiber and effects of its addition as food material sciences examination at different
concentration (5, 10 and 15 %) on the dough rheology and backing characteristics. This could be
utilized for the development of composite blends from locally produced lupine at small scale
industry level as value-add products.

Tasks and Objectives
4
2. Tasks and ObjectivesThe aim of this study is investigate innovative bakery products with increased functionality
and examine its composition; taste; texture and structure of conventional differ on the market
with a balanced content of nutritionally valuable substances. The main focus is using of mixtures
of wheat and lupine flours or fiber for qualitative and quantitative improvement to able to use in
bread in particular, the rheological properties of dough for these flour mixtures in three different
mixing ratios of lupine flour or fiber (5, 10, and 15 %).
These changes in dough structure due to different ingredients have significant impact on the
further processing steps used in the selection of process technology, on the fermentation times
and on the baking process and finally to the quality of the baked goods.
To investigate the comminution and the optimal wetting of lupine flour in the laboratory or
small-scale of the entire technological process, we need to study the lupine flour and its blends
themselves by hydrothermal milling.
Wheat and lupine flour were mixed. This dough was prepared under determinate condition
and studied material science. The characterization of the rheological or baking properties of
wheat flour mixed with lupine to share with conventional tests (farinograph) and dynamic tests
(oscillatory, creep and temperature sweep) test, with modern measuring methods (air bearing
technology) performed comparatively. The effect of adding of lupine flour and lupine fiber, and
the influence of dough temperature on the processing behavior of the dough should be
investigated and evaluate professionally. Sensory tests are the acceptance and the quality of the
manufactured baked goods (bread and cake). Finally, effects of different sweet lupine seed
derivatives (flour and fiber) at different concentration (5, 10 and 15 %) on diabetic rats were also
studied.
The specific objectives of this research include also:
1. To access the antioxidant/antiradical activities of crude methanolic extracts, their phenolic
fractions, their flavonoids and flavonols fractions from sweet lupine seeds and its fiber,
which is the dominant variety grown in Egypt. The chemical constituents of the crude
phenolic extracts were then characterized with HPLC.

Tasks and Objectives
5
2. To assess the effects of partial substitution of wheat flour with lupine flour or lupine fibre
at different concentrations (5, 10 and 15 %) on dough rheological properties (fundamental
and empirical rheology) and baking performance of final products (bread and cake)
3. To study the nutritional potential, (amino acids content, and biological effects) of lupine
flour and fiber in final bakery products.
Review of literature
6
3. Review of literature
3.1. Taxonomy and classification
Lupins (Lupinus spp.) belong to the Genisteae family, Fabaceae or Leguminosae (Pastor-
Cavada et al., 2009). Second to cereal crops, leguminosae is agriculturally important and one of
the three largest families of flowering plants. Leguminosae has been divided into three sub-
families named as Caesalpinieae, Mimosoideae and Papilionoideae (Phan et al., 2006). Lupine is
the common name for members of the genus Lupinus of the legume family (Kurzbaum et al.,
2008). From the genus Lupinus more than 400 species are known, from which only four are of
agronomic interest (Reinhard et al., 2006): (L. albus L.: white lupine, L. angustifolius L.: blue or
narrow-leafed lupine, L. luteus L.: yellow lupine and L. mutabilis L.: pearl or Tarrwi lupine)
(Uzun et al., 2007). The first three species originate from the Mediterranean area, including
Turkey, while L. mutabilis belongs to South America (Mülayim et al., 2002). These species are
known as sweet lupins due to their low levels (0.003 %) of bitter-tasting and potentially toxic
alkaloids (Wasche et al., 2001) and, therefore, there is no risk of toxicity for animals and humans
(Martínez-Villaluenga et al., 2006a).
The name lupine is derived from the Latin word Lupus, meaning ’wolf’. The Romans
believed that lupins robbed the soil nutrients in the same way that wolf would steal domestic
animal (ARC, 2009). It is known as lupines in the United States, as turmus in the Middle East
and Tawari in Latin America. The plant is characterized by having various flowering spikes in
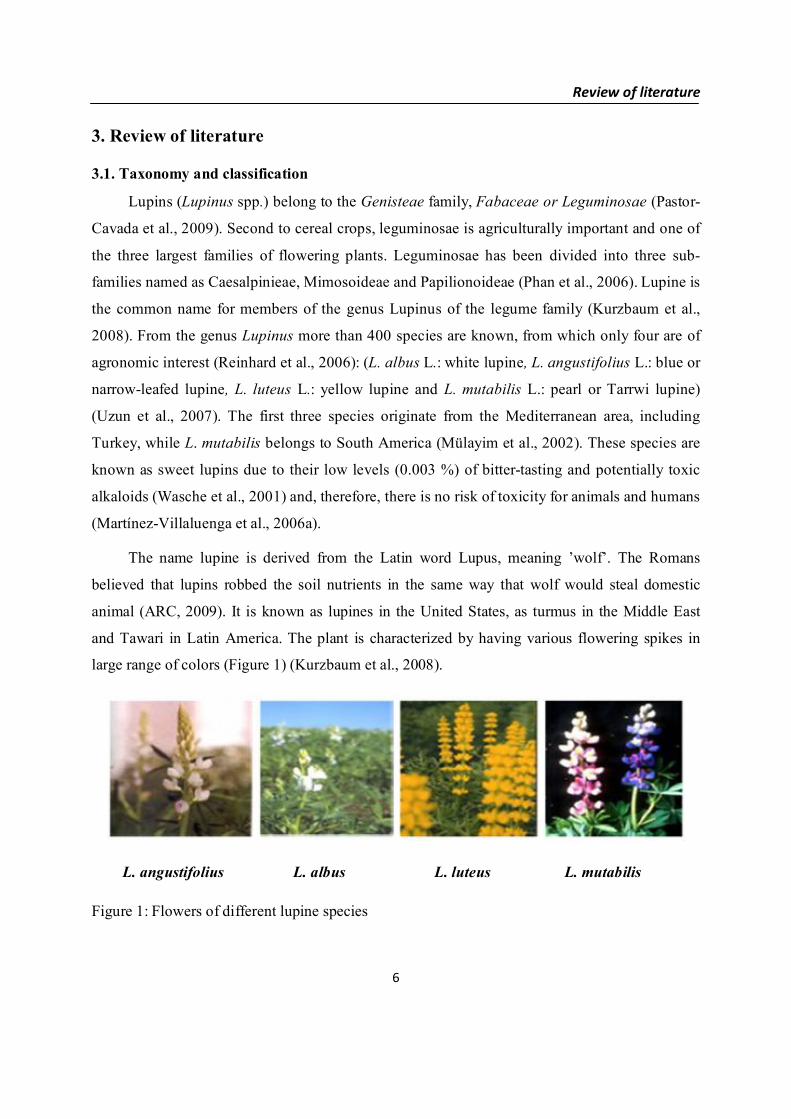
large range of colors (Figure 1) (Kurzbaum et al., 2008).
L. angustifolius L. albus L. luteus L. mutabilis
Figure 1: Flowers of different lupine species

Review of literature
7
Commonly, four lupine species are reported as cultigens in the world (Figure 1). These
include L.albus L, L.angustifolius L., L.leutus Land L.mutabilis L. (Kurzbaum et al., 2008).
Trivially, these species are called white lupine, narrow-leafed (blue) lupine, yellow lupine and
pearl lupine respectively (ARC, 2009). Out of these four species the focus area of this research is
on Lupinus albus L. This species is also called white lupine in most part of the world. In this
document we will use its scientific name L. albus L consistently to refer the crop. The lupine seed
is produced in pods which develop on the main stem of the lupine plant (Figure 2). Pods contain
between three and seven seeds and these seeds vary in size, color, appearance and composition
depending on the species of lupine. Among them the seeds of L. albus are the largest. They have
a circular flattened shape and are cream in color (AHC, 2009).
Figure 2: Pods of L. albus seeds
3.2. Centers of originFour different centers of origin have been proposed for the genus lupinus. These include the
Mediterranean region (including northern Africa), North America, South America, and East Asia.
Today, approximately 90 % of the recognized species are found in alpine, temperate and
subtropical zones of North and South America, which ranges from Alaska to Southern Argentina
and Chile. The remaining species are native to the Mediterranean region and Africa. But due to
their larger seeds, most of the economically important species come from the Mediterranean
region (Figure 3) (ARC, 2009).

Review of literature
8
Figure 3: Primary (single line circle) and secondary (double line circles) centers of origin for L.albus in the Mediterranean Region (Noffsinger and Van Santen, 2005).
In places where no other crops can be grown profitably, Lupins could be considered as a
model for low input plants. Among the common species L. albus L., L. luteus L. and L.
angustifolius L. are Old World species whereas; L. mutabilis is a new world species originating
from South America (Cowling et al., 1998).
3.3. Production and utilization
3.3.1. Worldwide production of L. albusThe world production of legume seeds, 'the poor man's meat' as developed-country
producers call them, was about 58 million tons in 1994 (FAO estimations). Of this, the major
part, 40 million tons, was produced by developing countries, especially India and China with
only 8.5 % consumed outside the country in which it was produced. Only Argentina, Mexico, the
USA and China export significant quantities of legume grain, while Europe is the main importing
continent (Heiser, 1996). In some European countries, pickle is produced from lupine seeds
(Vasilakis and Doxastakis, 1999). White lupine, which has been consumed as a food in a narrow
area for a long time, was accepted for human consumption by the Australian government in 1987
and by the United Kingdom government in 1996 (Swam, 2000). The average price of lupine
seeds is about 185 $/ton (GrainPool, 2003). In Australia, 1.6 million tones of lupine seed is

Review of literature
9
produced annually, representing 80 % of the total world production (Pollard et al., 2002). The
other important lupine producers are Poland, France and South America.
3.3.2. History of L. albus utilizationLegume seeds are protein valuable foods which have been present in the Mediterranean diet
since ancient times. Among them, lupins are high protein crops (Frias et al., 2005). Wild and
partially domesticated lupine species were grown thousands of years ago both in the
Mediterranean region and in the South American Andes before the Incan Empire. The cultivation
of L. albus was well known to the ancient Greeks and Romans and its cultivation has been
mentioned by early writers including the poet Virgil and Pliny the Elder (AHC, 2009). It was in
the twentieth century that the old bitter types of lupine were replaced by ‘sweet’ low alkaloid
types. Before this major development, bitter lupins were spread in southern Europe and North
Africa. They were also introduced in northern Europe when Frederick the Great of Prussia sent
for lupine seeds from Italy in 1781 to improve the poor soils in north Germany (Frias et al.,
2005). Before 1926, lupines had been used as side rates only. The issue of natural existence of
low alkaloid lupines was raised by E. Bauer and A. Pryanishnikov. However; works in this field
were held back by the absence of reliable and rapid methods of quantifying alkaloids in plants. In
1928, Reinhold von Sengbusch from the Central German Institute of Genetics proposed a method
which was applied to analyze alkaloid in plants (Maknickiene and Asakaviciute, 2008). Lupine is
an economically and agriculturally valuable plant (Gulewicz et al., 2008). Its seeds are employed
as a protein source for animal and human nutrition in various parts of the world, not only for their
nutritional value, but also for their adaptability to marginal soils and climates. Human
consumption of lupins has increased in recent years (De Cortes Sánchez et al., 2005).
3.3.3. Some Common Lupine Based Food TypesL. albus seeds meet the requirements as alternative home prepared diets with high
nutritional value and reasonable price among leguminous plants (Zraly et al., 2007). Lupines and
lupine products have traditionally formed part of the human diet. Food products available on
different markets of Europe are lupine snacks, lupine pasta, lupine bread and cookies, lupine
coffee and some vegetarian instant meals (Figure 4) (AHC, 2009).
Review of literature
10
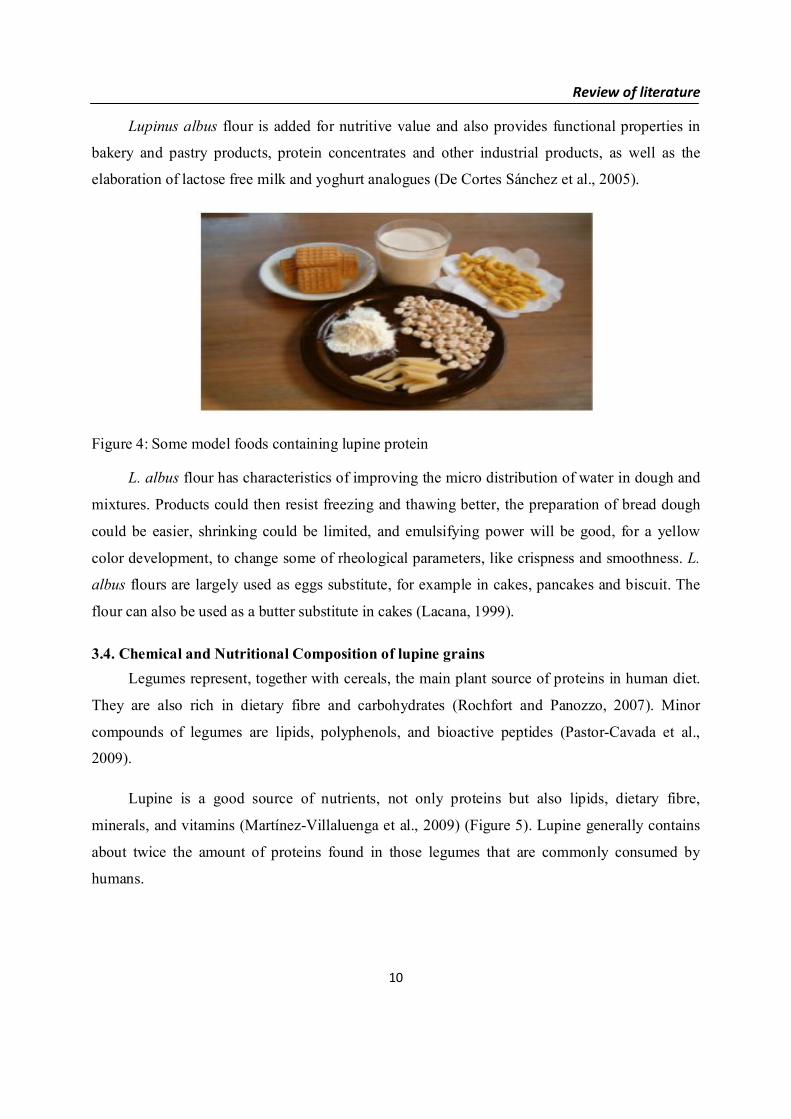
Lupinus albus flour is added for nutritive value and also provides functional properties in
bakery and pastry products, protein concentrates and other industrial products, as well as the
elaboration of lactose free milk and yoghurt analogues (De Cortes Sánchez et al., 2005).
Figure 4: Some model foods containing lupine protein
L. albus flour has characteristics of improving the micro distribution of water in dough and
mixtures. Products could then resist freezing and thawing better, the preparation of bread dough
could be easier, shrinking could be limited, and emulsifying power will be good, for a yellow
color development, to change some of rheological parameters, like crispness and smoothness. L.
albus flours are largely used as eggs substitute, for example in cakes, pancakes and biscuit. The
flour can also be used as a butter substitute in cakes (Lacana, 1999).
3.4. Chemical and Nutritional Composition of lupine grainsLegumes represent, together with cereals, the main plant source of proteins in human diet.
They are also rich in dietary fibre and carbohydrates (Rochfort and Panozzo, 2007). Minor
compounds of legumes are lipids, polyphenols, and bioactive peptides (Pastor-Cavada et al.,
2009).
Lupine is a good source of nutrients, not only proteins but also lipids, dietary fibre,
minerals, and vitamins (Martínez-Villaluenga et al., 2009) (Figure 5). Lupine generally contains
about twice the amount of proteins found in those legumes that are commonly consumed by
humans.

Review of literature
11
Figure 5: Seed coat and cotyledon composition of other species of Lupinus genus
Lupins have a typical dicotyledon structure. Their thick seed coat (hull or testa) comprises
about 30 % of the seed weight. This is considerably higher than for most domesticated grain
species. The thick seed coat is mostly cellulose and hemicellulose, means that it is important to
consider the composition and nutritional value of their cotyledons (kernel). Within the cotyledons
(kernels), energy is mostly stored in form of thickened cell wall material, about 25 % of the
cotyledons, and oil bodies, comprising from 6 to 14 % of the cotyledons in domestic species.
There is virtually no starch (2 %) in any of the lupine species. This is in marked contrast to
crops such as field peas and chickpeas, which can have 50-70 % of the cotyledon weight as starch
and have low protein and oil content, and the soybean with 15-20 % oil and high protein content.
Their crude protein content ranges from about 28 to 42 %. There are variations in the protein
content between species and cultivars as a result of the characteristics of the growing conditions
and soil types (Martínez-Villaluenga et al., 2006a) from 28 % in to 48 % (Capraro et al., 2008).
Proximate analyses for whole grain of the major domesticated species, and the Andean lupine,
are shown in Figure (6).

Review of literature
12
Figure 6: Comparative whole grain content of the major domesticated species
3.4.1. Crud proteinLegumes play an important role in human nutrition since they are rich sources of protein,
calories, certain minerals and vitamins. In African diets legumes are also, the major contributors
of protein and calories for economic and cultural reasons (El Maki et al., 2007). Analyses of
nutritional values of Lupinus albus have shown that the bio-availability of the constituents is
comparable to those of processed soybeans (Joray et al., 2007). Grain legumes are main sources
of vegetable protein, among which L. albus is known to have seeds with the highest protein
content like soybean (Sujak et al., 2006). Based on this fact L. albus seeds have been employed
as a protein source for animal and human nutrition in various parts of the world (De Cortes
Sánchez et al., 2005).
The requirements with regard to chemical composition, nutritional value and product safety
were laid down by the Advisory Committee on Novel Foods and Processes (ACNFP) in 1996 for
certified lupins (sweet lupins). Based on the strength of this certification, these products were
recommended as feedstuffs and food ingredients (e.g. lupine flours for baked goods) (AHC,
2009).
3.4.2. Amino acids contentLegume proteins are rich in lysine and deficient in sulphur containing amino acids, whereas
cereal proteins are deficient in lysine, but have adequate amounts of sulphur amino acids (Eggum
and Beame, 1983). As a member of legume family lupine bean protein is rich in lysine and
deficient in sulfur containing amino acids (Phan et al., 2007). In contrast its arginine content is
markedly higher (Zraly et al., 2007). And also the value of leucine is satisfactory for most of the
species of lupines. Apart from the highest level of amino acids within the crude protein, it was
Review of literature
13
found to have a better and nutritionally more beneficial amino acid composition and the highest
essential amino acid level (EAA) (Sujak et al., 2006). It is also characterized by a higher essential
amino acid index (EAAI) as well as chemical score (CS) of restrictive amino acids, and the
highest protein efficiency ratio (PER), expressed in terms of the availability of leucine and
tyrosine as compared to blue and yellow lupine variety (Sujak et al., 2006). Currently, there are
only few companies in Europe that produce L. albus protein ingredients for food use. The
products available are toasted and non-toasted lupine flour, grits, granulates, fiber and protein
concentrates from the non-defatted seed. Lupins and lupine products were considered to be
traditional foods even before the introduction of the Novel Food Decree (1997) (AHC, 2009).
3.4.3. Crud fiberPulses, the edible seeds of leguminous crops, are a rich food source of dietary fibers that
promote various beneficial physiological effects for human health. Canada is a major world
producer and exporter of pulses, but the whole seeds have a low market value. Milling and
fractionation of pulse seeds can isolate important dietary fibre components for incorporation into
commercial food products to enrich their fibre content and/or serve as functional ingredients.
Expanding pulse utilization through such applications can serve to enhance human health while
increasing the market value of the crops.
The dietary fibre is composed of total dietary fibre (TDF), which includes both soluble
(SDF) and insoluble dietary fibre (IDF). In terms of health benefits, both kinds of fibre
complement with each other. A well balanced proportion is considered when there is 70-50 %
insoluble and 30-50 % soluble DF (Grigelmo-Miguel et al., 1999).
Lupine kernel fibre is a novel food ingredient containing both soluble and insoluble
fractions (Hall et al., 2005). It is extracted from the kernel of Australian sweet lupine (L.
angustifolius), a legume grown in large quantities in Australia and considered to be underutilized
as a human food source (Petterson, 1998). Currently, it is being used mainly as an animal feed.
The dietary fibre content of Australian sweet lupine kernels is higher than that of most other
legumes, making up approximately 40 % of the kernel weight (Guillon and Champ, 2002).
Lupine kernel fibre has shown potential for the manufacture of palatable, fibre-enriched products
such as baked goods and pasta (Clark and Johnson, 2002).

Review of literature
14
3.4.4. Crud fatThe fat level in lupine is ranked third after ground nut (Arachis hypogeae L.) and soybean
(Glycin max) among legumes (Uzun et al., 2007). The lipid contents of L. albus are similar to
other species of the genus lupinus like L. campestris (Jimenez-Martinez et al., 2003). The mean
value of crude fat in L. albus grown in different parts of the world is 13 % (Phan et al., 2006).
The oil extracted from L. albus seed consist various types of fatty acids. The fatty acids of
the oil from the raw seed are composed of more of unsaturated fatty acid and small percentage of
saturated fatty acids. This means L. albus can be a potential source of considerable amount of
useful vegetable fat. Among the unsaturated fatty acids, majority oleic and linolenic acids are
found (Uzun et al., 2007). The high content of ω-6 and ω-3 fatty acids, make the crop a healthy
alternative edible oil source (Joray et al., 2007).
3.5. Chemical and nutritional composition of wheat grainsWheat kernels have three main parts: the endosperm, the germ, and the bran (Figure 7).
While whole wheat flour contains all three parts of the kernel, white flour is milled from the
endosperm. Whole wheat flour is considered a whole grain product because it contains the entire
wheat kernel. The endosperm makes up the bulk of the kernel. It is the whitest part, partly
because it contains mostly starch typically 70–75 %. The starch is embedded in chunks of
protein. (See, 2008)
Figure 7: Longitudinal section of grain of wheat

Review of literature
15
3.5.1. Crud proteinWheat flour contains two types of proteins, gliadin and glutenin. The prolamins of wheat
(gliadin) that comprise 40–50 % of the proteins are extremely sticky and inelastic is responsible
for the cohesiveness of doughs. On the other hand, the glutelins was also named glutenins,
provides resistance to extension (Singh and MacRitchie, 2001). The prolamins and glutelins
combined during mixing to form the elastic protein gluten complex resulting in viscoelastic
dough. The dough has the ability to form thin sheets that will able to retain gas and produce a
light baked product (Gujral and Rosell, 2004). Wheat flour can be made from whole wheat or the
germ and bran can be separated from the endosperm is then ground into flour. The strong flour
has protein content in the range of 10.5-14.5 % and the weak flour has less than 8.5 % protein.
According to Cauvain, (2003), hard wheat with strong gluten and high protein content in the flour
has better ability to trap and retain carbon dioxide gas and resulted in higher volume of bread.
3.5.2. Amino acids contentLysine is the limiting amino acid in wheat (Kent and Evers, 1994). The shortage of energy,
protein and essential amino acids are the main problems of human nutrition in developing and
under developed countries. The nutritional quality can be improved by increasing protein content
and limiting amino acids especially lysine. Protein content of wheat can be significantly
increased through breeding. Unfortunately, a negative correlation exists between lysine expressed
as a percent of protein and percent protein in common and durum wheat. Therefore, lysine as
percent of protein can be used as a measure of protein quality while lysine as percent of sample is
a function of both the protein and lysine (percent of protein) concentrations of a sample (Pogna et
al., 1994). The nutritional importance of wheat in human diet and in animal feed necessitates
pursuing study for detailed and accurate knowledge of the amino acid composition of wheat
proteins and its products. Such information is especially required to develop specific food
recommendations and feed formulations.
3.5.3. Crud fiberThe bran (outer layers of wheat grain) is made up of several layers, which protect the main
part of the grain. Bran is rich in B vitamins and minerals; it is separated from the starchy
endosperm during the first stage of milling. In order to protect the grain and endosperm material,
the bran comprises water-insoluble fibre. More than half the bran consists of fibre components
(53 %). Chemical composition of wheat bran fibre is complex, but it contains, essentially,
Review of literature
16
cellulose and pentosans, polymers based on xylose and arabinose, which are tightly bound to
proteins. These substances are typical polymers present in the cell walls of wheat and layers of
cells such as aleurone layer. Proteins and carbohydrates each represent 16 % of total dry matter of
bran. The mineral content is rather high (7.2 %). The two external layers of the grain (pericarp
and seed coat) are made up of dead empty cells. The cells of the inner bran layer- aleurone layer
are filled with living protoplasts. This explains the rather high levels of protein and carbohydrate
in the bran. There are large differences between the levels of certain amino acids in the aleurone
layer and those in flour. Glutamine and proline levels are only about one half, while arginine is
treble and alanine, asparagine, glycine, histidin and lysine are double those in wheat flour
(Cornell, 2003).
3.5.4. Crud fatLipids are present only in a small extent in cereals but they have a significant effect on the
quality and the texture of foods because of their ability to associate with proteins due their
amphipatic nature and with starch, forming inclusion complexes. Lipids are minor components of
wheat flour with essential function in wheat end-use quality. Total lipids account for 3–4 % of
the wheat kernels and about 45 % of these are located in the starchy endosperm (Chung, 1986).
The content of lipids in wheat flour varied between 1.5 % and 2.0 % and most of them are
contributed from the endosperm whilst the others are from germ and aleurone in tissue fragments
and as oil adhering to the flour particle surface. Lipids in wheat or wheat flour can be grouped
into three categories: non-starch lipids, starch lipids and starch surface lipids, according to their
location in flour components and their extraction methods (Pomeranz, 1988). Non-starch lipids,
especially the free lipids, including non-polar and polar lipids, have attracted more interest since
their contribution to end-use quality of wheat flour has been recognised.
3.6. Phenolic compounds and active componentsLeguminous seeds are an important source of nutrient compounds such as protein, starch,
dietary fiber, and minerals, particularly in third-world countries. Incorporation of leguminous
seeds into the human diet in developing countries can offer protective effects against chronic
diseases (Leterme, 2002). Legumes contain a number of bioactive substances including phenolics
that can diminish protein digestibility and mineral bioavailability (Sandberg, 2002). On the other
hand, phenolic compounds such as flavonoids, phenolic acids, lignans, and tannins have
antioxidant properties, and these are very important from nutritional and technological points of

Review of literature
17
view. Various evidences suggest that oxidative stress is closely associated with a diverse
assortment of diseases such as cancer and cardiovascular disease. The antioxidant capacity of
legumes depends on the biological variety of the plant, and is observed over broad ranges.
Technological processing and seed germination can impact the levels of natural endogenous
antioxidants (e.g. phenolics, tocopherols; vitamin C) in leguminous seeds. An important point of
consideration is the high content of phenolic antioxidants present in seed coats.
3.6.1. Content of total phenolic and tannins in leguminous seedsThe total phenolic content (TPC) in leguminous seeds or extracts prepared from such plant
materials is one of the main parameters dictating the potential antioxidant capacity of seeds or the
antioxidant activity of extracts there from. Determination of the TPC in legumes includes an
extraction step followed by a colorimetric reaction under alkaline conditions between the
extracted phenolic constituents and Folin-Ciocalteu’s phenol reagent. The results of the assay are
reported as the quantity of equivalents of standard compounds (i.e. typically gallic acid or
catechin) per mass unit of raw material or extract.
The type of solvent used for extraction of various classes of phenolic compounds from
legumes is very broad and typical examples include water, methanol, ethanol, methanol/water,
ethanol/water, and acetone/water (Turkmen et al., 2005). Details pertaining to the application of
different solvents for the extraction of phenolics from plant material have been reviewed by
Naczk and Shahidi, (2006). A comparative study of phenolic profiles and antioxidant activities of
legumes, as affected by extraction solvents, has been reported by Xu and Chang, (2007); the
results of their study showed that 50 % (vol/vol) acetone extracts exhibited the highest TPC for
yellow pea, green pea, and chickpea. Amarowicz et al., (1995) reported that an acetone/water
system extracted greater quantities of phenolic compounds from lentil seeds compared with
methanol/water or ethanol/ water systems. In the acetonic extract, thin-layer chromatography
revealed the presence of tannins of higher molecular weight that were not present in ethanolic and
methanolic extracts. For some preparations, an absolute value is given based on the reference, but
in other cases, a range is provided. It is clear that wide variations exist in the TPC, depending on
the source of the leguminous seed as well as on how it has been processed or extracted.
Condensed tannins (i.e. proanthocyanidins) are flavan-3-ol-based biopolymers that, at high
temperature in alcohol solutions of strong mineral acids, release anthocyanidins and catechins as
end groups. Several studies have reported on the antioxidant and antiradical activity of tannins

Review of literature
18
(Amarowicz, 2007). The most common methods used for condensed tannin analysis include the
vanillin/HCl method, the bovine serum albumin (BSA) precipitation method and the
proanthocyanidin method after n-butanol/HCl hydrolysis. The results are generally presented as
catechin equivalents per mass unit (i.e. the vanillin/HCl method) or as absorbance units at 500
nm (i.e. the vanillin/HCl method), 510 nm (i.e. the BSA precipitation method) or 550 nm (i.e. the
proanthocyanidin method) per mass unit.
3.6.2. Phenolic composition of leguminous seedsThe dominant phenolic compounds present in leguminous seeds are flavonoids, phenolic
acids, and procyanidins. Seeds with colored coats are also rich in anthocyanidins (Choung et al.,
2003). The content of total flavonoids in seeds from six legumes, green pea, yellow pea,
chickpea, lentil, red kidney, and black bean ranged from 0.08 to 3.21 mg catechin equivalents/g
(Xu and Chang, 2007); the highest quantity of total phenolics was determined in seeds of red
kidney and black bean. Flavonoids present in leguminous seeds belong to flavanols, flavan-3-ols,
flavones, and anthocyanidins (Amarowicz et al., 2008). The majority of them, however, are
present as glycosides in the seeds. Diaz-Batalla et al., (2006) also detected isoflavones in
germinated beans. In the study of Sosulski and Dabrowski, (1984), the phenolic constituents in
defatted flours and hulls of ten leguminous species, mung bean, smooth field pea, yellow lentil,
small faba bean, pigeon pea, navy bean, white lupine, baby lima bean, chickpea, and cow pea,
were fractionated into free acids, soluble esters, and residue compounds. The flours contained
only soluble esters; hydrolysis of these revealed the presence of trans-ferulic, trans-p-coumaric,
and syringic acids in nearly all of the species examined. The lowest amount of phenolic acids was
found in mung bean, field bean, lentil, faba bean, and pigeon pea, with 2–3 mg of phenolic acids
per 100 g of flour. Navy bean, lupine, lima bean, and cowpea were characterized as possessing
the highest level of phenolic acids. The hulls contained p-hydroxybenzoic, protocatechuic,
syringic, gallic, trans-p-coumaric, and trans-ferulic acids in the soluble ester fraction. Madhujith
et al., (2004) reported vanillic, caffeic, p-coumaric, ferulic, and sinapic acids as the main phenolic
acids identified in bean hull extracts.
3.6.3. Antioxidant activity of lupine seeds or their extractsEarlier research (Sosulski and Dabrowski, 1984) indicated that lupine (Lupinus albus L.)
flour contains only soluble esters (71 mg phenolics/kg flour) comprised of transferulic, p-
hydroxybenzoic, syringic and trans-p-coumaric acids (55, 17, 15 and 13 % of the soluble ester

Review of literature
19
fraction, respectively), while the hulls constituting 12.6 % of the whole seed phenolics consists
mainly of trans-ferulic and p-hydroxybenzoic acids (60 and 40 % of the soluble ester fraction,
respectively). However, recent HPLC analysis (Lampart-Szczapa et al., 2003b) revealed the
presence of procatechuic, p-hydroxybenzoic, vanillin, p-coumar and ferulic acids in lupine hulls
with only trace amounts of ferulic acid present in dark hulls.
Total phenolic and procyanidin contents of aqueous acetone (70 % v/v) extracts of lupine
cultivars (Lupinus albus L., Lupinus angustifolius L., Lupinus luteus L., Lupinus mutabilis L. and
Lupinus hispanicus L. species) varied from 7 to 70 g/kg (expressed in gallic acid) and 70 to 530
mg/kg (expressed as +catechin) seed, respectively. Significant (p<0.01) differences in total
phenolics and proanthocyanidin contents were observed among cultivars of the same species (L.
albus) grown in one location and one cultivar grown in six locations in Portugal. The total
phenolic content in the cotyledons of lupine cultivars Mirela and Wersal were 1878 and 336
mg/kg, respectively and in the hulls 288 and 184 mg/kg, respectively when extracted with 80 %
aqueous ethanol (Lampart-Szczapa et al., 2003b).
Biological activity and quality attributes have been associated with phenolic content of
lupine. Thus, antibacterial activity displayed by lupine hulls was dependent on the content of total
phenolic compounds. However, antioxidant activity of lupine cultivars was independent of hull
color or content of polyphenols (Lampart-Szczapa et al., 2003a). Lupine seed flour, on the other
hand, exhibits antioxidant activity (evaluated by the β-carotene bleaching method) that correlates
with the presence of total phenolics (13.6 and 20.7 % polyphenolic content) when extracted with
cold and hot methanol, respectively. A weak antioxidant activity (10 and 6 % hydroperoxide
inhibition at 500 and 5000 ppm extract levels, respectively) was reported for an aqueous
methanolic extract (80 %) of L. angustifolius that had total phenolic content of 4.7±0.1 mg gallic
acid equivalents, (GAE)/g dry matter (Kähkönen et al., 1999).
3.7. Milling/Particle size analysis
3.7.1. MillingMilling is a complex industrial process which involves a set of grinding and sieving
operations, the objectives of which are to break the grain, separate the starchy endosperm from
brans and reduce it to flours. The milling properties of wheat grains and the end-use of the
resulting flour are mainly determined by hardness. For example hard wheat requires more energy

Review of literature
20
than soft wheat during flour milling (Kilborn et al., 1982) and using hard or soft wheat flour
affects the formation of cookies (Abboud et al., 1985). Variations in wheat hardness mainly result
in different particle sizes for the meal, and hard wheat breaks into larger particles than soft wheat.
This property is the basis of the most popular tests for measuring wheat hardness, ie the Particle
Size Index (PSI) or the Near Infrared Reflectance Index (Williams and Sobering, 1986a, b).
The process of particle size reduction improves ingredient performance during mixing and,
in most cases; the nutritive value of an ingredient can be improved or more nearly realized. There
are many ways to reduce the particle size of ingredients. Two of the most common pieces of
equipment used are the hammer mill and the roller mill (Figure 8).
The initial reduction of cereal grains begins by disrupting the outer protective layer of the
seed (hull), exposing the interior. Continued size reduction increases both the number of particles
and the amount of surface area per unit of volume. It is this increased surface area that is of
primary importance. A greater portion of the grain’s interior is exposed to digestive enzymes,
allowing increased access to nutritional components such as starch and protein. The enhanced
breakdown of these nutritional components improves absorption in the digestive tract. Size
reduction is also used to modify the physical characteristics of ingredients resulting in improved
mixing, pelleting, and, in some instances, handling or transport.
Figure 8: Hammer mill

Review of literature
21
3.7.2. Hammer millsHammer mills accomplish size reduction by impacting a slow moving target, such as a
cereal grain, with a rapidly moving hammer. The target has little or no momentum (low kinetic
energy), whereas the hammer tip is travelling at a minimum of 16,000 feet per minute (4,880
m/min) and perhaps in excess of 23,000 feet per minute (7,015 m/min) (high kinetic energy). The
transfer of energy that results from this collision fractures the grain into many pieces. Sizing is a
function of hammer-tip speed; hammer design and placement; screen design and hole size; and
whether or not air assist is used. Because impact is the primary force used in a hammer mill to
reduce particle size, anything that: increases the chance of a collision between a hammer and a
target, increases the magnitude of the collision, or improves material take-away, would be
advantageous to particle size reduction. The magnitude of the collisions can be escalated by
increasing the speed of the hammers. Anderson, (1994) stated that when drive speed and screen
size were kept constant, the increased hammer-tip speed obtained from increased rotor diameter
produced particles of smaller mean geometric size. Particles produced using a hammer mill will
generally be spherical in shape with a surface that appears polished. The distribution of particle
sizes will vary widely around the geometric mean such that there will be some large-sized and
many small-sized particles. Particlization, useful application for grain kinds sorts.
3.7.3. Particle size analysisFew studies have reported the determination of detailed particle size distributions to
evaluate and compare wheat properties. Wu et al., (1990) studied the size distributions of flours
measured by sieving and air classification. They found that the mean particle size and the
percentage of flour being passed through a 53 µm screen and retained by a 44 µm screen differed
between hard and soft wheat. Detailed particle size distributions can be easily determined by
using a laser light diffraction apparatus. The advantage is to be able to analyze the amount of
small particle < 50 µm in a rapid and simple way. Moreover, particle size distribution can be
determined by laser diffraction for milling fractions such as flour or bran as well as for the whole
wheat meal. Detailed distributions measured by laser diffraction can be considered as
characteristic curves to study and compare powdered samples. Such an approach has been tested
by Hareland, (1994), who compared flour particle size distribution among different wheat types
and milling methods. He showed that the milling method affected the particle size distributions of
hard wheat flours but not those of soft wheat flours.
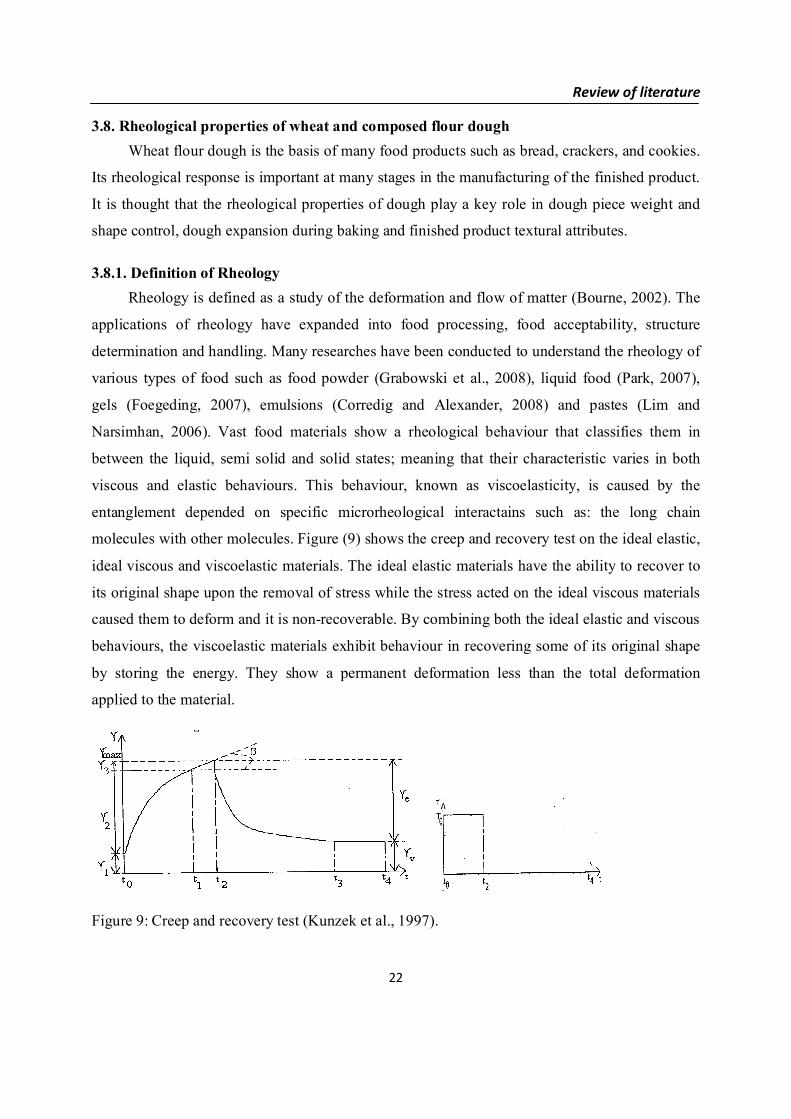
Review of literature
22
3.8. Rheological properties of wheat and composed flour doughWheat flour dough is the basis of many food products such as bread, crackers, and cookies.
Its rheological response is important at many stages in the manufacturing of the finished product.
It is thought that the rheological properties of dough play a key role in dough piece weight and
shape control, dough expansion during baking and finished product textural attributes.
3.8.1. Definition of RheologyRheology is defined as a study of the deformation and flow of matter (Bourne, 2002). The
applications of rheology have expanded into food processing, food acceptability, structure
determination and handling. Many researches have been conducted to understand the rheology of
various types of food such as food powder (Grabowski et al., 2008), liquid food (Park, 2007),
gels (Foegeding, 2007), emulsions (Corredig and Alexander, 2008) and pastes (Lim and
Narsimhan, 2006). Vast food materials show a rheological behaviour that classifies them in
between the liquid, semi solid and solid states; meaning that their characteristic varies in both
viscous and elastic behaviours. This behaviour, known as viscoelasticity, is caused by the
entanglement depended on specific microrheological interactains such as: the long chain
molecules with other molecules. Figure (9) shows the creep and recovery test on the ideal elastic,
ideal viscous and viscoelastic materials. The ideal elastic materials have the ability to recover to
its original shape upon the removal of stress while the stress acted on the ideal viscous materials
caused them to deform and it is non-recoverable. By combining both the ideal elastic and viscous
behaviours, the viscoelastic materials exhibit behaviour in recovering some of its original shape
by storing the energy. They show a permanent deformation less than the total deformation
applied to the material.
Figure 9: Creep and recovery test (Kunzek et al., 1997).

Review of literature
23
3.8.2. Factors affecting dough rheological propertiesRheological properties of dough and gluten during mixing are affected greatly by the flour
composition (low or high protein content), kind of proteins, processing parameters (mixing time,
energy, temperature) and ingredients (water, salt, yeast, fats and emulsifiers). Studies were
conducted to investigate the effect of protein content on the gluten quality and rheological
properties (Sliwinski et al., 2004a), on bread making quality (Sliwinski et al., 2004b) and also on
volume expansion resulted from frying (Chiang et al., 2006). These works, conclusively
suggested that the strong flour produces a better gluten and dough quality than the weak flour in
terms of giving a higher response in extensibility, bread loaf volume and height and also volume
expansion.
3.8.2.1. Water absorption and structure formationWater is responsible in hydrating the protein fibrils and start the interactions between the
proteins cross links with the disulphide bonds during dough mixing (mechanical agitation). Too
much water addition to the flour will result in slurry and too little water results in slightly
cohesive powder (Faubion and Hoseney, 1989). Hence, an optimum water level is required to
develop cohesive, viscoelastic dough with optimum gluten strength depended on gluten
behaviour. While the optimum water level differs from flour to flour, the strong flours require
higher water level than weak flours largely due to the higher protein content and dense particles
in the strong flours. Protein content is known to be an important factor in determining the water
uptake of flour (Sliwinski et al., 2004a). Janssen et al., (1996) reported that the G' and G"
decreased as the water content of dough increased in rheological relevant / valid ranges. Ablett et
al., (1985) explained the effect of water content on gluten networks in terms of a rubber network
such that its elongation reduced as water content increased as if in rubber network. However, for
dough, the elongation increased as water content increased. It was suggested that the soft
continuous phase of dough will swell in direct proportion of free-water which is responsible in
the increase of the elongation.
3.8.2.2. TemperatureTemperatures are very important in dough systems because dough displays different
rheological characteristics depending on the ambient or applied temperature. Temperature sweeps
are performed in oscillatory testing by keeping the frequency and applied strain constant and
running a temperature profile on the rheometer. Temperature profiles are easily programmable on

Review of literature
24
rheometers and can be set to have any number of temperature ramps and cooling periods to best
measure the material (Salvador et al., 2006). This allows for a simulation of rheology changes
due to temperature during baking. As would be expected, lower temperatures provide easier
testing and fewer difficulties than higher temperatures.
Oscillatory testing from 20-40 ºC is below the gelatinization point of wheat flour dough;
therefore, dough shows a high frequency dependence and changes over this temperature range are
reversible (Song and Zheng, 2007). Higher temperatures show irreversible changes as the dough
approaches its gelatinization temperature, especially when temperatures near 80 ºC. At high
temperatures (after dough’s gelatinization temperature of about 60 ºC), the dough system
becomes stronger and the G′ becomes much larger than the G″ (Salvador et al., 2006). This
transition of the dough into a more solid system could be caused by sulphhydryl/disulfide
exchange (Song and Zheng, 2007), or starch granule rupture to form a gel amylase matrix
coupled with protein denaturation (Salvador et al., 2006). The starch gelatinization that occurs at
elevated temperature has a great effect on the viscoelastic properties of the dough, and
temperature sweeps in oscillatory testing are a useful way to study these changes. The only
restriction in using this method is that it cannot be used above 90 ºC. Higher temperatures and
cooling from higher temperatures causes extra loss of moisture and shrinkage of the sample,
which has the effect of the sample pulling away from the measurement apparatus and
inconsistency of measurements.
3.8.2.3. Sodium chlorideSodium chloride or commonly known as salt is said to have a strengthening or tightening
effect on the gluten during mixing of dough (Niman, 1981). Salt must be added early in the
dough-mixing to give maximum dissolution time and accelerate gluten formation, tighten the
dough and increase the mixing time. Salt is used to overcome the low pH of dough since the
effect of pH will alter the mixing time; a low pH gives a shorter time and a high pH gives a
longer time (Hoseney, 1985). Roach et al., (1992) suggested that the influences of salt on the
protein solubility affect the dough properties. Salt decreases the water activity of protein in the
wheat flour dough as its concentration increases. Salvador et al., (2006) found that the elastic
modulus (G') falls slightly in the presence of salt. This reduction is probably due to the decrease
in inter-protein hydrophobic interactions which reduce the tendency of the proteins to aggregate
and thus reduce the elasticity. The amount of salt added into the dough mixing can be varied from

Review of literature
25
1.8-2.1 % on flour basis (Farahnaky and Hill, 2007). However, due to increase concern in health
related issues by consumers in food intake, addition of lower amount of salt has become one of
the main focus in recent studies (Farahnaky and Hill, 2007). Omission of salt entirely leads to a
significant reduction in dough and bread quality and also the sensory attributes of bread, where
the bread was described as sour/acidic and having yeasty flavour (Lynch et al., 2009).
3.8.2.4. Mixing processMixing is an important step in producing gluten with desired strength as to produce a good
quality end-product. Processing factors during flour-water mixing include the mixing time, work
input, mixer type and temperature. In order to achieve optimum dough development, the mixing
time and work input must be above the minimum critical level (Angioloni and Rosa, 2005).
Different wheat flour has different optimum mixing time. A longer mixing time is expected for
mixing dough from strong flour. It is probably due to the dense particles of strong flour and
slower water penetration (Hoseney, 1985). Sliwinski et al., (2004a) reported that a positive
correlation was observed between dough mixing time and the percentage of glutenin protein in
flour. Dobraszczyk and Morgenstern, (2003) related optimum mixing time of dough with the
development of the glutens networks and monomers. Increasing mixing time and work input
above the optimum level during mixing induces the changes in mechanical properties of dough
(Cuq et al., 2002).
3.8.2.5. Effects of lupine flour or fiber addition on dough quality In general, the addition of up to 10 % lupine flour improves water binding, texture, shelf-
life, and aroma (Martínez-Villaluenga et al., 2006b). The presence of lupine flour in the products
increased the amount of water required for the optimum bread making absorption. It was also
concluded that lupine flour, at 5 % substitution level, increased the stability and tolerance index
of the dough (Dervas et al., 1999), however, the mixing time and dough stability decreased as the
substitution level increased (Doxastakis et al., 2002). The unique bread-making properties of
wheat flour can be attributed mainly to the ability of its gluten proteins to form a viscoelastic
network when mixed with water. The worsening of the viscoelastic properties of wheat flour
dough, after substitution with lupine, reduces the bread-making potential. It was suggested that
the weakening effect of foreign proteins (lupine) on wheat flour doughs is the result of the
dilution of the gluten structure by the protein added (Mohammed, 2011).
Review of literature
26
The assessment of the suitability of high dietary fiber lupine product and its utilization as a
valuable source of dietary fiber was carried out in experimental baking, where 10 %, 15 %, and
20 % additions of high dietary fiber lupine product to wheat dough were used. It was found that
the contribution of high dietary fiber lupine product in the mixture with wheat flour affects the
increase the water absorption capability (of water absorbability) in comparison with the control
dough. Also, advantageous effects were observed of high dietary fiber lupine product on the
rheological properties of dough such as its development, time stability, and index tolerance to
kneading. The best organoleptic effect was obtained when a 10 % addition of high dietary fiber
lupine product was used. Furthermore, a delicate structure of crumb was also observed (Ciesiołka
et al., 2005; Mohammed, 2011).
3.8.3. Rheological behaviour measurementsRheological behaviour of dough can be determined by two distinct measurements that are
fundamental and empirical. Studies on the fundamental rheology of dough are usually carried out
using small deformation while the empirical measurements are measured using large
deformation. Nonetheless, fundamental dough rheological testing using large deformation is
growing popularity with the presence of newer techniques and equipment. Thus, the rheological
behaviour of dough was predicted using molecular models of gluten development during mixing
by Letang et al., (1999). In these models, gluten development mainly involves glutenin proteins
interactions with each other in the loop by disulphide bonds. At the early stage of mixing, the
gluten fibrils are in contact with the mixer blade, the sides of the bowl and other flour particles.
The hydrated gluten fibrils and starch granules are continuously dispersed throughout.
Glutenins, which are the long polymeric proteins, are folded and the chains are in random
orientation. As mixing proceeds, more protein becomes hydrated and the glutenins tend to align
because of the shear and stretching forces imposed. At this stage, gluten networks are more
developed by the cross-linking of protein with disulphide bonds. At optimum dough
development, the interactions between the polymers cross-links are becoming stronger which
leads to an increase in dough strength, maximum resistance to extension and restoring force after
deformation. When the dough is mixed longer past its optimum development, the cross-links
begin to break due to the breaking of disulphide bonds. The glutenins become depolymerised and
the dough is over mixed. The presence of smaller chains in the dough makes the dough stickier.
The monomeric proteins, gliadins form a matrix within the long polymer networks and contribute

Review of literature
27
to resistance to extension by forming viscous behaviour. Increasing the interactions between
protein polymers increases gluten viscous resistance and resistance to extension. It was said that
gliadins show dominant viscous behaviour and acted like a plasticiser, promoting viscous
behaviour and extensibility of gluten (Kuktaite, 2004).
3.8.3.1. Empirical rheologyThe mixograph and farinograph (Brabender 1927) are the empirical instruments and
techniques that have been developed and utilized for the measurement of the empirical properties
of dough (Ross et al., 2004).
During processing, the empirical tests have been used to characterize the behavior of bread
doughs (Dobraszczyk and Schofield, 2002). The interactions between flour type, breadmaking
process and antistaling additives in wheat dough were studied by Armero and Collar, (1998)
while the mixing characteristics of flour water dough were studied by Rao et al. (2000).
Farinograph is the most frequently used equipment for empirical rheological measurements
(Razmi-Rad et al., 2007) for rheological characterization. They used artificial neural network
(ANN) technology for predicting the correlation between farinographic properties of wheat flour
dough like water absorption, dough development time, dough stability time, degree of dough
softening (Figures 10) with its chemical composition like protein content, wet gluten,
sedimentation value and falling number etc. Since the approach of ANN analysis is a black box
simulation, this type of study fails to reveal the physical understanding behind established
correlations, even though these might be excellent. The texture and density of baked products
such as bread and cakes are controlled by the way their rheology and vapor content change
during the baking process. Dobraszczyk and Morgenstern, (2003) reviewed the rhological
properties of gluten polymers of wheat flour which in tern affects the rhological properties of
bread.

Review of literature
28
Figure 10: Farinogram of wheat flour
Farinogram parameters:
1. Water absorption: is the amount of water required to center the farinograph curve on the 500
Farinograph Unit (FU) line. This relates to the amount of water needed for a flour to be optimally
processed into end products. Absorption is expressed as a percentage.
2. Peak Time: indicates dough development time, beginning the moment water is added until the
dough reaches maximum consistency. This gives an indication of optimum mixing time under
standardized conditions. Peak time is expressed in minutes.
3. Arrival Time is the time when the top of the curve touches the 500-FU line. This indicates the
rate of flour hydration (the rate at which the water is taken up by the flour). Arrival time is
expressed in minutes.
4. Departure Time is the time when the top of the curve leaves the 500-FU line this indicates the
time when the dough is beginning to break down and is an indication of dough consistency
during processing. Departure time is expressed in minutes.
5. Stability Time is the difference in time between arrival time and departure time. This indicates
the time the dough maintains maximum consistency and is a good indication of dough strength.
Stability time is expressed in minutes

Review of literature
29
6. Mixing Tolerance Index (MTI) is the difference in FU value at the top of the curve at peak
time and the value at the top of the curve 5 minutes after the peak. This indicates the degree of
softening during mixing. Mixing tolerance index is expressed in FU
The mixograph is a rapid tool for measuring the mixing behavior of dough because of the
reduced small sample size (Chung et al., 2001). The mixograph data are empirical in nature and
the parameters measured by it are 15 poorly defined (Bourne, 2002). The mixograph provides the
important information on the reaction of the input materials being utilized in the formulation of
the dough based products and state of the mixing process. Wheat proteins are directly correlated
with flour’s water absorption capacity, oxidation requirements and mixing strength (Bushuk,
1998).
Scanlon et al., (2000) studied the mechanical properties of bread crumb prepared from
flours of different dough strength. Because starch is damaged in hard wheat during milling, the
flour consequently absorbs more water. The viscoelastic properties of weaker flours changed
more markedly during storage than those of stronger flours in the sense of a significant
improvement of their quality. The flour with higher water absorption may give more favorable
products, because the bread may remain softer for a longer period (Hruskova and Machova,
2002).
The rheological properties of dough are dependent on both time and strain. During the
empirical tests, Irreversible changes in samples occur which are major disadvantage in some
empirical tests (Dobraszczyk and Morgenstern, 2003).
3.8.3.2. Fundamental rheologyFundamental rheometry describes the physical properties of a material over a wide range of
strains. The small strain rheological properties of cereal doughs are measured through the
fundamental rheological techniques by the application of sinusoidally oscillating stress or strain
with time and measuring the resulting response. These techniques have the advantage of a well
developed theoretical background, readily available instrumentation, and simultaneous
measurement of elastic and viscous moduli, while the nondestructive nature of the test enables
multiple measurements to be performed as temperature, strain or frequency are varied (Steffe,
1996).

Review of literature
30
One of the advantages of dynamic rheometry is the possibility of utilizing various strains to
obtain more complete information of a material's physical properties. Very low strains will allow
measurements and will not disturb or destroy the inherent structure, are important in describing
the time and temperature dependent changes in materials. Several researchers have demonstrated
that rheometry that can give a better prediction to the quality of final products (Shiau and Yeh,
2001).
Several different fundamental rheological measurements, differing in terms of magnitude of
stress or deformation, in type of deformation (shear, compression, extension, and biaxial
extension), or in deformation rate or in terms of the length of time of the constant stress (creep) or
deformation (relaxation) have been used to measure the rheological properties of wheat doughs.
The measurement should also be sensitive to the water content of doughs because the best
mechanical properties are achieved by an optimum flour-to-water ratio.
Oscillatory measurements of wheat doughs in the linear viscoelastic region with strains < 0.1 %
have been used to study effects of water, ingredients, and flour type. Most rheological
measurements on dough have been performed in shear because shear deformation is easier to
measure. The elastic component is accounted as the storage modulus (G') and the viscous
component is measured as the loss modulus (G"). The ratio of the viscous to elastic modulus
(G′′/G') is equal to the tangent of the phase angle (tan δ). Both storage modulus (G′) and loss
modulus (G′′) decrease as the water content of doughs increase. Oscillatory measurements in the
linear viscoelastic region have not been able to predict the baking quality of different flours
(Safari-Ardi and Phan-Thien, 1998). Some studies suggest that these tests can show differences
between different baking-quality wheat glutens (Kokelaar, 1994). The application of larger
strains is more relevant to doughs; therefore high-amplitude oscillatory measurements have also
been done (Miller and Hoseney, 1999). When working within the linear viscoelastic range, data
analysis can be conducted with the mathematical theory of linear viscoelasticity. This is not the
case in the nonlinear region.
In the study of Tronsmo et al., (2003), wet gluten was tested with a small strain of 2 % and
frequency between 0.005-10 Hz. They reported that the elastic modulus (G') was higher than the
viscous modulus (G"). This result agrees with studies by Amemiyaa and Menjivar, (1992) who
found that the storage modulus (G') for all tested doughs are higher than the loss modulus (G").

Review of literature
31
They further described that the gluten network behaves like a cross-linked polymer at the tested
frequency. Uthayakumaran et al., (2002) who conducted a study on rheological behavior of wheat
gluten using dynamic oscillation testing found that both the elastic and viscous modulus of flour
doughs were significantly higher than gluten doughs. This indicates that starch content in the
flour dough influence the viscoelasticity of the flour dough. Other work which utilised this
testing method on dough include studies on effect of different protein content, water level
(Uthayakumaran et al., 2002) and mixing time on the rheological properties of dough and gluten.
Tronsmo et al., (2003) found that dough with higher protein content gave lower G' and G" but
higher tan δ. Janssen et al., (1996) found that the resistance to small deformation was higher and
more elastic for gluten with higher protein content and as the angular frequency to increased, G"
increased more than G', indicating a viscous behaviour of gluten due to more bonds are involved
in the response of stress or strain. Generally, it can be concluded that gluten from poor quality
wheat are reologically characterised as less elastic and more viscous than glutens from good
quality wheats (Khatkar et al., 2002).
Creep recovery test
Creep recovery test is performed by subjecting the material to a constant shear stress and
the shear strain is monitored as a function of time. Sivaramakrishnan et al., (2004) performed
creep recovery test on pure wheat flour and combinations with long/short grain rice flour found
that the pure wheat flour dough showed high recovery of elastic strain after removal of load while
the creep behaviour of the two composite flours with long and short grain rice flour showed
considerable variation with the pure rice flours. Janssen et al., (1996) conducted creep recovery
test on two different wheat flours, weak (Obelisk) and strong flour (Katepwa) found that Obelisk
showed a higher recovery of elastic strain after removal of load compared to Katepwa. Janssen et
al., (1996) suggested that the apparent viscosity (ηapp) can be estimated from the slope of the
creep curve and from their observation there was no clear strain hardening in creep tests since the
slope of the curve was nearly independent of time and strain at the end of the load phase.
3.9. Effects of lupine flour or fiber addition on quality of bakery productsBread and bakery products have an important role in human nutrition. Generally, wheat
bread is considered to be a good source of energy and irreplaceable nutrients for the human body.
This is especially true for the products made from wholegrain or high-yield flour types. Bread

Review of literature
32
prepared from refined flour is nutritionally much poorer and does not adequately meet the
requirements for many macro- or micro-nutrients. It has been reported that bread made from
refined flour has low micronutrient content (Isserliyska et al., 2001). Also, wheat protein lacks
the balance of essential amino acids such as lysine, threonine and valine. Therefore, there have
been many on-going investigations on enhancing the nutritive value of bread to fulfill the
expanding demands of modern dietary habits, considering the products’ protein, mineral, vitamin
and/or fibre contents. Bakery products, supplemented with various nutritious, protective and
ballast substances, have been gaining popularity worldwide. Mixed grain, wholegrain breads and
related products are even considered as functional foods because they are convenient vehicles for
important nutrients and phytochemicals.
Composite breads are made from blends of wheat and non-wheat flour. These flours are
advantageous to developing countries because wheat imports can be reduced and elevate the use
of locally grown grains (Hugo et al., 2003). Lupine flour can be incorporated into wheat flour to
improve the nutritional value of the final products without detrimental effects on the quality
(Pollard et al., 2002). Furthermore, lupine exhibits useful techno-functional properties allowing
its use as an ingredient in the production of several palatable food products, such as biscuits,
pasta and bread (Drakos et al., 2007) while producing satiety at the same time (Lee et al., 2006).
According to literature, about 10 % of lupine replacement is the most convenient amount to
improve breadmaking properties (Doxastakis et al., 2002) and the allowed upper limit by the
European food authorities.
Studies have shown that lupine flour can be successfully incorporated into products (Hung
et al., 1990), at up to 20 % inclusion, to produce products that rate higher in terms of color,
texture, taste and overall acceptability than the control. A number of pasta products containing
lupine flour are currently available on the domestic market. Lupine flour is also being tested as a
base for vermicelli like product. Also, lupine can be incorporated at up to 50 % level in biscuits
(Kyle, 1994).
The development of breads enriched in lupine proteins, by incorporating lupine flours, has
been the subject of research conducted by Doxastakis et al., (2002). These workers demonstrated
that substitution of wheat flour by full fat lupine flour, concentrated lupine flour and defatted
concentrated lupine flour, at a 5 % substitution level, increased the stability and the tolerance
Review of literature
33
index of the dough, while a marked decrease was noted at higher levels (15 %) of
supplementation. In addition, the bread volume decreased as the level of lupine flour increased
something that was primarily attributed to the dilution of the wheat gluten structure by the added
protein. However, as wheat flour fortification was conducted only with lupine flour with a protein
content ranging between 30 % and 36 %, it was not possible to appreciate the real impact of the
proteins of lupine flour on the dough properties since other lupine flour constituents (mainly
fiber) could, also, have an effect. Furthermore, no information was reported in these studies on
the effect of lupine flour addition on the Bread staling performance.
3. 10. Nutritional benefits of legumesLegumes play an important role in human nutrition since they are rich sources of protein,
calories, certain minerals and vitamins. In African diets, legumes are also the major contributors
of protein and calories for economic and cultural reasons (El Maki et al., 2007). Madhusudhan
and Tharanathan, (1995) found that, legumes have been shown to decrease blood glucose
responses compared to other cereal based foods such as whole meal bread and are of very vital
benefit in the diets of diabetes and hyperlipidemia patients. Moreover, Wolever et al., (2003)
reported that the low fat, high-carbohydrate diets are known to stimulate hepatic triglyceride
production in diabetic subjects.
Legumes supply protein, complex carbohydrates, fibre and essential vitamins and minerals
to the diet, which are low in fat and sodium and contain no cholesterol. Legumes have been
identified as low glycaemic index foods (Bornet et al., 1997). Selecting foods of low glycaemic
index is very important in the dietary treatment of diabetes mellitus, increases satiety, facilitates
the control of food intake and has other health benefits for healthy subjects in terms of post-
prandial glucose and lipid metabolism (Rizkalla et al., 2002). Regular consumption of pulses may
have important protective effects on risk for cardiovascular disease (Anderson and Major, 2002).
Moreover, pulses contain a rich variety of compounds, which, if consumed in sufficient
quantities, may help to reduce tumour risk (Mathers, 2002). In fact, most health organizations
encourage their frequent consumption (Leterme, 2002).
These nutritional benefits are related to the reduced digestibility of legume starch and
dietary fibre content of legumes, mainly located in their husk fractions. The low digestibility of
legume starch has been attributed to its amylose, which is considerably branched and of high
Review of literature
34
molecular weight (Tharanathan and Mahadevamma, 2003). In the last decades, attitudes and
perceptions towards legumes have been changing, bringing about a revival of interest on the part
of consumers (Morrow, 1991). The annual per capita consumption of pulses in 1999 was 5.9 kg
worldwide, and 2.8 kg in Europe. These consumption figures rose by 10 % from 1989 to 1999
but they could increase even further if the food industry and professional organizations take up
the challenge to incorporate grain legumes in novel, convenient and healthy food products
(Schneider, 2002).
Several studies about the influence of the addition of legume flours on the functional
properties of bread dough and final bread quality have been reported in the last 30 years. Among
the legumes tested, it is worth mentioning the addition of chickpea flour (Mohammed, 2011),
germinated chickpea flour (Fernandez and Berry, 1989), germinated pea flour (Sadowska et al.,
2003), lupine flour (Pollard et al., 2002), fermented lentil flour (Sadowska et al., 1999), lentil and
bean flours (Lorimer et al., 1991) to wheat flour for obtaining bread. However, despite the good
results obtained with bread, those studies have not been extended to other cereal baked products.
3.10.1. Lupine flourThere is growing interest in industrial exploitation of new protein sources such as plant
proteins to broaden the range and variety of foods. Sweet lupine seeds (e.g. Lupinus albus L.)
seem to be particularly promising as a source of innovative ingredients having, on average, a
protein content similar to soybean (34-43 % of dry matter) and an adequate composition of
essential amino acids (Yanez et al., 1983). Foods based on sweet lupine protein are gaining
attention from industry and consumers because of their possible role in the prevention of
cardiovascular disease as well as in reduction of blood glucose and cholesterol levels (Duranti,
2006).
The lupines (Family, Fabaceae–pea family) belong to a diverse group of plants that contain
a large number of biologically active compounds in their leaves and seeds. The seeds in particular
contain a significant number of alkaloids, predominantly with anticholinergic activity (Ruiz and
Sotelo, 2001). The white lupine is also known to contain hypoglycemic agents [Lupinus albus (L.
termis L.)] (Kubo et al., 2000). Lupine is also valuable nutritionally and is of particular interest
due to the large seed size and the ability to remove the unpleasant and potentially toxic alkaloid
components by soaking in water (Santana et al., 2002). The white lupine has been reportedly used

Review of literature
35
in Egypt by people having type II diabetes, although the outcome in humans of this use has not
been documented (Eskander and Won Jun, 1995). Mansour et al., (2002) suggest that the white
lupine would be useful for lowering blood glucose levels post-prandially and by inference from
allopathic medications, would decrease glycosylated hemoglobin levels.
Lupine kernel flour is a novel food ingredient derived from the endosperm of lupine, a
grain legume. It contains 40–45 % protein, 25–30 % fiber, and negligible sugar and starch (Evans
et al., 1993). It can be incorporated into high carbohydrate foods, resulting in significant
increases in protein and fiber, reductions in refined carbohydrate, and little change in product
acceptability (Lee et al., 2006). Increasing protein at the expense of refined carbohydrate in the
diet may benefit blood pressure. An inverse association between estimated protein intake and
blood pressure was reported in many cross-sectional population studies (Appel, 2003). In
randomized controlled trials, lower blood pressure with protein, in comparison to carbohydrate, is
also a consistent finding (Hodgson et al., 2006).
A meta-analysis of randomized controlled trials comparing carbohydrate with
monounsaturated fat found that a higher intake of carbohydrate of 55 g/d resulted in higher
systolic and diastolic blood pressures of 1.3 and 0.9 mm Hg, respectively (Shah et al., 2007). An
increased intake of dietary fiber may also lower blood pressure. Many randomized controlled
trials have now investigated the effects of increasing fiber intake on blood pressure. Meta-
analyses of these trials showed that an increase in fiber intake of 10–15 g/d was associated with
falls in systolic and diastolic blood pressures of 1–1.5 mm Hg (Whelton et al., 2005). Soluble
fiber may be more effective than insoluble fiber (Streppel et al., 2005). In addition, more
substantial decreases in systolic and diastolic blood pressures were observed in trials of 8 weeks
duration (3.1 and 2.6 mm Hg; systolic and diastolic blood pressures, respectively) and in
hypertensive subjects (6.0 and 4.2 mm Hg; systolic and diastolic blood pressures, respectively)
(Whelton et al., 2005). Increasing both protein and fiber intakes, at the expense of refined
carbohydrate, may benefit blood pressure.
Lupine flours can be an excellent choice for improving the nutritional value of bread. The
high-lysine, low methionine content complements that of wheat flour proteins, which are poor in
lysine and relatively higher in the sulphur-containing amino acids (Bloksma and Bushuk, 1988).
In lupins, the main limiting amino acids are methionine and cystine followed by valine and then

Review of literature
36
tryptophan. Since lupins are legumes, the lack of sulphur-containing amino acids is not
surprising. Valine seems to be adequate in L. albus (Aguilera and Trier, 1978). Lupine protein
isolates, prepared on a bench scale, have been shown to have good nutritional properties when
supplemented with methionine or mixed with cereals. Functional properties of proteins, such as
solubility, water absorption and binding, viscosity, gelation, cohesion-adhesion, elasticity,
emulsification, fat absorption, flavour binding, foaming and color control are influenced by
agronomic factors, storage, composition and processing (Cherry et al., 1979). Although
carbohydrate is the major component of legumes, the protein component has received
considerably more attention (McWatters, 1990). The use of vegetable proteins as functional
ingredients in foods depends mainly on the benefits that they can produce (Kyle, 1994).
3.10.2. Lupine fiberThe interest in foods rich in dietary fibre increased in the recent decades and this led to the
development of a large market for fibre-rich products and ingredients (Drzikova et al., 2005). The
specific properties of dietary fibre has been reported to play an important role in the prevention
and treatment of various gastrointestinal disorders (hernia, duodenal ulcer, gall stones,
appendicitis, constipation, hemorrhoids, colon carcinoma), obesity, atherosclerosis, coronary
heart diseases, colorectal cancer and diabetes (De Escalada Pla et al., 2007). Addition of fibre to
foods is an alternative way to compensate for the existent deficiency in the diet. Apart from the
nutritional application, fibre can be used for technological purposes such as bulking agent or fat
substitute in foods (Guillon and Champ, 2000).
The World Health Organization (WHO, 2003) currently recommends consumption of foods
containing > 25 grams (30-45 g) of total dietary fibre/day. In fact, WHO has identified dietary
fibre as the only dietary ingredient with “Convincing Evidence” showing a protective effect
against weight gain and obesity. Bread can be enriched with dietary fibre such as wheat bran,
gums such as guar gum and modified celluloses and beta-glucans. Wheat flour contains 1.5–2.5 %
total arabinxylans, non-starch polysaccharides of cereal which is an important source of dietary
fibre where one-third to half is water-extractable and the other is water-unextractable (Su et al.,
2005). According to Peng, (2002), the pumpkin polysaccharide had the function of reducing the
blood sugar and showed that it had very important value in auxiliary cure for diabetes.
Review of literature
37
The dietary fibre is composed of total dietary fibre (TDF), which includes both soluble
(SDF) and insoluble dietary fibre (IDF). In terms of health benefits, both kinds of fibre
complement with each other. A well balanced proportion is considered when there is 70-50 %
insoluble and 30-50 % soluble dietary fibre F (Grigelmo-Miguel et al., 1999).
Soluble fibre is found in fresh and dried fruit, vegetables, oats, legumes and seeds.
Examples of the soluble fibre are pectins, gums, mucillages and some hemicellulose. Some
soluble fibres increase the viscosity of the intestinal contents and assist in reducing cholesterol
absorption. Other soluble fibres are fermented by the bacteria within the large intestine and can
assist in maintaining colon health and increasing the mineral absorption. Soluble fibre
fermentation results in the production of short-chain fatty acids, principally acetate, propionate
and butyrate. Butyrate has been found to act as a protective agent against experimental tumor
genesis of these cells. Propionate could be related to hypocholesterolemic effects (Redondo-
Cuenca et al., 2007).
Insoluble fibre is found in the plant cell walls of whole grain bread, whole grain cereals,
fruits, vegetables, unprocessed bran and wheat germ. Examples of the insoluble fibre are
cellulose, lignan and hemicellulose. Many insoluble fibres, including cellulose and psyllium, are
not fermentable. Insoluble dietary fibre has a high water-holding capacity, increases the fecal
bulk and reduces the gastro intestinal transit time. This effect may be related to the prevention
and treatment of different intestinal disorders, such as constipation, diverticulitis, haemorrhoids
and other bowel conditions (Goñi and Martin-Carrón, 1998).
Lupine kernel fiber is a novel food ingredient that can be isolated from the endosperm of
Australia’s major animal feed legume crop, the Australian sweet lupine (Lupinus angustifolius).
This legume has already gained legislative approval for use as human food in some countries,
including Australia. Demonstration that lupine kernel fiber can be used to formulate food
products with acceptable sensory properties is required to introduce this novel ingredient into the
food supply system. This fiber is predominantly nonstarch polysaccharide in the form of
thickened cell walls of the lupine seed endosperm, with some residual protein. Although it is
primarily insoluble in nature, the nonstarch polysaccharide component has paradoxically been
described as a “pectin- like” rhamnogalacturonan, pectin generally being considered a soluble
fiber. Lupine kernel fiber has been described as a powder that is pale in color, low in odor and

Review of literature
38
flavor, and suitable for use as a ‘nonintrusive’ fiber ingredient in foods such as baked goods and
meat products (Johnson and Gray, 1993).
Nevertheless, there is a lack of published data on the sensory acceptability of foods
containing lupine kernel fiber. Comparisons may be tentatively drawn, however, from published
studies on flour derived from other lupine species, since nonstarch polysaccharide (chemically
similar to that found in Australian sweet lupine kernel fiber) is a major component of the
cotyledons of many lupine species (Brillouet and Riochet, 1983). Accordingly, the properties of
the nonstarch polysaccharide would be predicted to influence the sensory performance of the
flour in food products. Ballester et al., (1984) added to bread full-fat sweet lupine flour derived
from Lupinus albus cv Multolupa, which resulted in increased water absorption, loaf volume, and
loaf weights. Crust color and bread texture were reportedly not affected by lupine flour addition,
though the method of determining these parameters was not clarified. Villarroel et al., (1996)
evaluated the sensory acceptability of marmalade that incorporated lupine flour as a replacement
for fructose by using a facial hedonic test, and found no statistically significant difference
between the control and lupine marmalade.
3.11. Review conclusionTo summarize the literature review, legumes represent, together with cereals, the main
plant source of proteins in human diet. They are also generally rich in dietary fibre and
carbohydrates. Minor compounds of legumes are lipids, polyphenols, and bioactive peptides. It
turns out that the protein potential of wheat and legumes (lupine flour) approach, from a
nutritional, nutritional view almost perfect complements (cysteine and methionine are sulfur-
containing essential amino acid as enriched). The implementations of the concept of enrichment
of wheat flour proteins with proteins leguminous crops are facing back technical concerns. When
necessary processes deliver dough the protein / starch together an implementation of the wheat to
be relatively ideal processing dough as the primary protein-water interaction. The result is a
viscoelastic system with known stable processing properties. The admixture of a primarily non-
compliant egg white prevents compounds the formation of a known viscoelastic system based on
gluten interactions in the matrix. Further, changes in the sensory acceptance, depending on the
mixing ratio to be expected, with crumb pore structure, etc. The critical mixing ratio of the lupine
flour or fibers with wheat flour is approximately 20 : 80 %. This mixture has acceptable technical
and sensory characteristics. All conventional and modern dough rheological measurement

Review of literature
39
techniques can be a specific control or comparison methods were used. Since the results are not
modern rheological measurement techniques in the literature extensively be described, is a
particular focus on the application / results oscillation and its generalizable measurement
guidelines.
Materials and Methods
40
4. Materials and Methods
4.1. Materials
Local Egyptian breeds of lupine (Lupinus albus L. variety Giza) were obtained from theAgricultural Research Centre, Giza, Egypt. Lupine flours and hulls were obtained after grindinglupine grains in a laboratory hammer mill (Retsch - Germany) until they could pass througha 250 µm screen. Commercial wheat flour type 405 was obtained from Lidl Market (Berlin-Germany). All other chemical reagents used in the experimental analysis were of analyticalgrade.
4.2. Chemical analysis
4.2.1. Proximate composition
Proximate composition was carried out according to ICC Standard Methods (ICC, 2001).Moisture content was determined by drying the samples at 105 °C to constant weight (ICC109/01). Ash content was determined by calcinations at 900 °C (ICC 104/1). Nitrogen contentwas determined by using Kieldahl method with factor of 5.7 to determine protein content (ICC105/2). The total lipid content was determined by defeating in the Soxhelt apparatus with hexane(ICC 136). The determination of starch content was assessed using a polarimetric methodaccording to Ewers, modified by (Davidek et al., 1981). All the measurements of analyzedsamples were made in triplicate.
4.2.2. Amino acid analysis
Amino acid content was determined as described by Moore et al., (1958). The analysis wasperformed in Central Service Unit, National Research Centre, Egypt using LC3000 amino-acidanalyzer (Eppendorf-Biotronik, Germany). The technique was based on the separation of theamino acids using strong cation exchange chromatography followed by the ninhydrin colourreaction and photometric detection at 570 nm. Standard amino acids were used for comparison ofresulting profiles, allowing quantitation of amino-acid residues. The defatted powdered seedswere hydrolyzed with 6 N HCl at 110 °C in teflon capped vials for 24 h. After vacuum removal ofHCl, the residues were dissolved in a lithium citrate buffer, pH 2.2. Twenty µL of the solutionwere loaded into the cation exchange column (pre-equilibrated with the same buffer), then fourlithium citrate buffers with pH values of 2.2, 2.8, 3.3 and 3.7, respectively, were successivelyapplied to the column at a flow rate of 20 mL/min. The ninhydrin flow rate was 10 mL/h underthese conditions and a typical analysis required 160 min.
Materials and Methods
41
Methionine was determined as methionine sulfone, after oxidation with performic acid. Anamino acid standards containing cysteine were treated parallel with the samples and used toquantify the methionine content. The amino acid content of the reference protein was taken from(FAO/WHO, 2007).
4.2.3. Determination of total phenolics
Total phenolic content was determined by the Folin–Ciocalteu micro-method (Arabshahi-Delouee and Urooj, 2007). A 20 µL aliquot of extract solution was mixed with 1.16 mL ofdistilled water and 100 μL of Folin–Ciocalteu’s reagent followed by 300 μL of 200 g L−1 Na2CO3
solution. The mixture was incubated in a shaking incubator at 40 ◦C for 30 min and its absorbanceat 760 nm was measured. Gallic acid was used as standard for the calibration curve. Totalphenolic content expressed as gallic acid equivalent (GAE) was calculated using the followinglinear equation based on the calibration curve:
Ab = 0.98C + 9.925 * 10−3 (R2 = 0.9996) (1)where Ab is the absorbance and C is the concentration (mg GAE g−1 dry weight (DW)).
4.2.4. Determination of total flavonoids
Total flavonoid content was determined by the method of Ordoñez et al., (2006). A 0.5 mLaliquot of 20 g L−1 AlCl3 ethanolic solution was added to 0.5 ml of extract solution. After 1 h atroom temperature the absorbance at 420 nm was measured. A yellow color indicated the presenceof flavonoids. Extract samples were evaluated at a final concentration of 0.1 mg ml−1. Totalflavonoid content expressed as quercetin equivalent (QE) was calculated using the followingequation based on the calibration curve:C = 0.0255 * Ab (R2 = 0.9812) (2)where Ab is the absorbance and C is the concentration (mg QE g−1 DW).
4.2.5. Determination of total flavonols
Total flavonol content was determined by the method of Kumaran and Joel Karunakaran,(2007). To 2 mL of extract solution, 2 mL of 20 g L−1 AlCl3 ethanolic solution and 3 mL of 50 gL−1 sodium acetate solution were added. The absorption at 440 nm was read after 2.5 h at 20 ◦C.Extract samples were evaluated at a final concentration of 0.1mg mL−1. Total flavonol contentexpressed as QE was calculated using the same equation of flavonoids.
4.2.6. Antioxidant activity of extracts
Because of the differences among the various test systems available, the results of a single
method can provide only a limited assessment of the antioxidant properties of a substance (Sacchetti et

Materials and Methods
42
al., 2005). For that reason, in this study the antioxidant capacity of each extract was determined through
two complementary assay procedures.
4.2.6.1. DPPH· radical-scavenging activity
The DPPH assay according to Lee et al., (2003) was utilised with some modifications. The stock
reagent solution (1 x 10⁻³ mol L−1) was prepared by dissolving 22 mg of DPPH in 50 mL of methanol
and stored at −20 ºC until use. The working solution (6 x 10⁻⁵ mol L−1) was prepared by mixing 6 mL of
stock solution with 100 mL of methanol to obtain an absorbance value of 0.8±0.02 at 515 nm, as
measured using a spectrophotometer. Extract solutions of different concentrations (0.1 mL of each)
were vortexed for 30 s with 3.9 mL of DPPH solution and left to react for 30 min, after which the
absorbance at 515 nm was recorded. A control with no added extract was also analysed. Scavenging
activity was calculated as follows:
DPPH radical-scavenging activity (%) = [(Abcontrol − Absample)/ Abcontrol] * 100 (3)
where Ab is the absorbance at 515 nm.
4.2.6.2. ABTS radical-scavenging activity
For the ABTS assay the method of Re et al., (1999) was adopted. The stock solutions were
7 mmol L−1 ABTS solution and 2.4 mmol L−1 potassium persulfate solution. The working solution was
prepared by mixing the two stock solutions in equal quantities and allowing them to react for 12–16 h at
room temperature in the dark. Then 1 mL of the resulting ABTS•+ solution was diluted with 60 mL of
methanol to obtain an absorbance of 0.706 ± 0.001 units at 734 nm, as measured using a
spectrophotometer. ABTS•+ solution was freshly prepared for each assay. Extract solutions of different
concentrations (1 mL of each) were allowed to react with 1 mL of ABTS•+ solution for 7 min, after
which the absorbance at 734 nm was recorded. A control with no added extract was also analysed.
Scavenging activity was calculated as follows:
ABTS radical-scavenging activity (%) = [(Abcontrol − Absample)/Abcontrol] * 100 (4)
where Abcontrol is the absorbance of ABTS radical + methanol
Absample is the absorbance of ABTS radical + extract
4.2.7. HPLC analysis
A total of 20 mg grounded dried samples were extracted for 15 min using 750 µL 70 %
methanol (v/v, pH 4, phosphoric acid) in an ultrasonic water bath (Sonorex digital 10p ,

Materials and Methods
43
Bandelin) on ice. Samples were centrifuged for 5 min at 6000 rpm. The supernatants were
collected and the pellets were re-extracted twice more with 500 µL 70 % methanol. The
combined supernatants from each sample were reduced to near dryness in a centrifugation
evaporator (Speed Vac, SC 110) at 25 °C. Samples were then made up to 1 ml with 40 %
acetonitrile. The samples were filtrated using 0.22 µm filter, and then analyzed with HPLC
(Dionex Summit P680A HPLC-System), equipped with P680 pump, ASI-100 automated sample
injector, a Narrow-Bore Acclaim PA C16-column (3 μm, 2.1 * 150 mm, Dionex) and PSA-100
photodiode array detector (Dionex) and software Chromeleon 6.8 (Dionex, USA). The column
was operated at a temperature of 35 °C.
The mobile phase consisted of 0.1 % (v/v) phosphoric acid in ultrapure water (eluent A)
and of 40 % (v/v) acetonitrile in ultrapure water (eluent B). A multistep gradient was used for all
separations with an initial injection volume of 40 μL and a flow rate of 0.4 mL/min. The
multistep gradient was as follows: 1 min: 0.5 % (v/v) B; 1-10 min: 0.5-40 % B; 10-12 min:
40 % B; 12-18 min: 40-80 % B; 18-20 min: 80 % B; 20-24 min: 80-99 % B; 24-30 min: 99- 100 %
B; 30-34 min: 100-0.5 % B; 34-39 min: 0.5 % B. Simultaneous monitoring was performed at
290, 330 and 254 nm at a flow rate of 0.4 mL/min. Phenolic acid quantity was calculated from
HPLC peak areas at 290 nm against the internal standard and external standards. Identification
and quantification of phenolic acids present was done by comparing retention time and area of
the peaks in the extracts with that of the standard phenolic acids (chlorogenic acid, caffeic acid,
cinnamic acid, coumaric acid, rosmarinic acid and sinapic acid).
4.3. Particle size analysis by laser particle analysisTo determine the grain size distribution of the flour and the flour fractions, a counting or
scattered light measuring procedures was used. The measurement of particle size distribution was
carried out in the laser-light scattering spectrometer "HORIBA LA-950" manufactured by Retsch
(Figure 11), on the basis of static laser light scattering, according to DIN / ISO 13320. Formed by
the diffraction of the laser beam through the solid diffraction pattern which projected through a
lens onto a screen and scanned.

Materials and Methods
44
Figure 11: Particle size analyzer HORIBA LA-950 Retsch
The resulting diffraction rings whose intensity and scattering angle for particle size
proportionally. The statistical analysis of grain size distribution, the volume fractions and the
specific surface of the sample was carried out by the computerized data processing. Th main
parameters for characterizing the grain size distribution are: d10, d50, d90 and the specific surface
of the powder. Module operating air pressure 0.3 MPa was used in the measurement.
4.4. Doughs preparation
Blends were prepared according to Mohammed, (2011) by mixing the wheat flour with
lupine flours or lupine fibre in the proportions of 5, 10 and 15 % substitutions of wheat flour
using a mixer with a spiral blade, which is usually used for dough mixing. The doughs were
prepared by mixing different blends with 58 % water for 5 min in a Kitchene Aid Professional
mixer (KPM5) at 25 °C. The concentration (5, 10 and 15 % from wheat flour) of lupine fibre but
with different amount of water (62, 64 and 68 % respectively) was done.
4.5. Empirical rheological properties of dough
The dough mixing of the different wheat /lupine flour or fiber blends were studied using
farinograph instrument Farinograph Brabender, (Brabender, Duisburg, Germany) (Figure 12)
according to Mohammed, (2011). To determine the absorption of water and kneading flour, 50 g
of flour input to the farinograph and kneaded with a supply of water. The resistance of the
forming dough against the mechanical stress is a farinogram torque measurement recorded over
time. The measurements were conducted according to the constant flour weight procedure of ICC
method 115/1 and all measurements were made at room temperature (25 ºC). From the
farinograph curves, water absorption (percentage of water required to yield dough consistency of
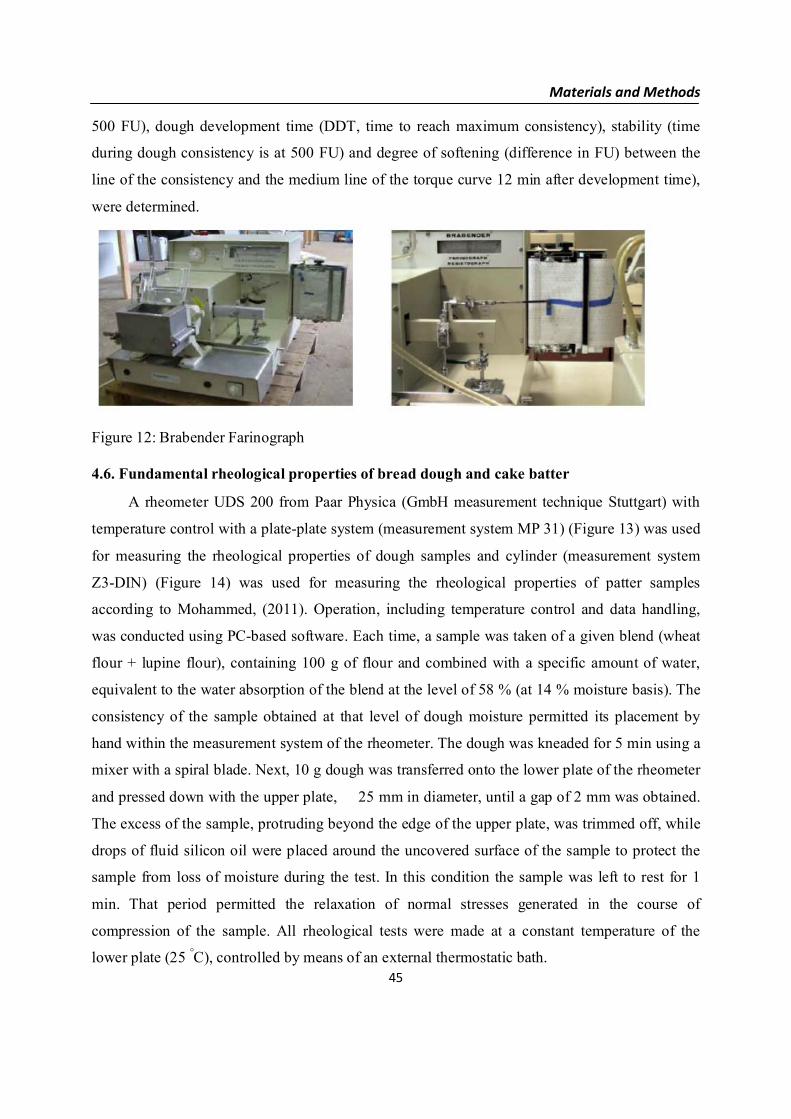
Materials and Methods
45
500 FU), dough development time (DDT, time to reach maximum consistency), stability (time
during dough consistency is at 500 FU) and degree of softening (difference in FU) between the
line of the consistency and the medium line of the torque curve 12 min after development time),
were determined.
Figure 12: Brabender Farinograph
4.6. Fundamental rheological properties of bread dough and cake batter
A rheometer UDS 200 from Paar Physica (GmbH measurement technique Stuttgart) with
temperature control with a plate-plate system (measurement system MP 31) (Figure 13) was used
for measuring the rheological properties of dough samples and cylinder (measurement system
Z3-DIN) (Figure 14) was used for measuring the rheological properties of patter samples
according to Mohammed, (2011). Operation, including temperature control and data handling,
was conducted using PC-based software. Each time, a sample was taken of a given blend (wheat
flour + lupine flour), containing 100 g of flour and combined with a specific amount of water,
equivalent to the water absorption of the blend at the level of 58 % (at 14 % moisture basis). The
consistency of the sample obtained at that level of dough moisture permitted its placement by
hand within the measurement system of the rheometer. The dough was kneaded for 5 min using a
mixer with a spiral blade. Next, 10 g dough was transferred onto the lower plate of the rheometer
and pressed down with the upper plate, 25 mm in diameter, until a gap of 2 mm was obtained.
The excess of the sample, protruding beyond the edge of the upper plate, was trimmed off, while
drops of fluid silicon oil were placed around the uncovered surface of the sample to protect the
sample from loss of moisture during the test. In this condition the sample was left to rest for 1
min. That period permitted the relaxation of normal stresses generated in the course of
compression of the sample. All rheological tests were made at a constant temperature of the
lower plate (25 °C), controlled by means of an external thermostatic bath.

Materials and Methods
46
Figure 13: Laboratory instrument universal dynamic spectrometer UDS 200 plate–plate system(measure system MP 31 right side)
4.6.1. Oscillation test
The characteristic values of storage modulus, loss modulus and loss factor were recorded
during the measurement with air bring measurement system.
4.6.1.1. Amplitude sweep
The amplitude of relative strain was 10-4£ g £1 and fell within the linear viscoelastic region
for all samples. The limits of the region were determined based on an experiment in which
increasing stress was applied, at constant oscillation frequency of 1 Hz.
4.6.1.2. Frequency sweep
Applying oscillation frequencies within the range from 0.1 to 20 Hz at constant strain g = 10-3.
Each logarithmic frequency decade corresponded to 10 measurement points nearly, all about 30
points.
4.6.1.3. Temperature sweep
Temperature dependence of storage (G') and loss (G′′) modulus as well as loss tangent (tan δ)
were measured by heating the systems from 15 to 90 ºC. The temperature gradient was 1 K/min
on heating scan, while the strain was fixed to g = 10-3 with a constant frequency of 1 Hz. This
heating rate was chosen in order to secure gradient in the sample and to detect the occurring
processes such as denaturizing of proteins, gelatinization of starch and the immobilization of the
water. The baking properties of wheat lupine flour or fiber dough’s with temperature sweep are
comparatively simulated.
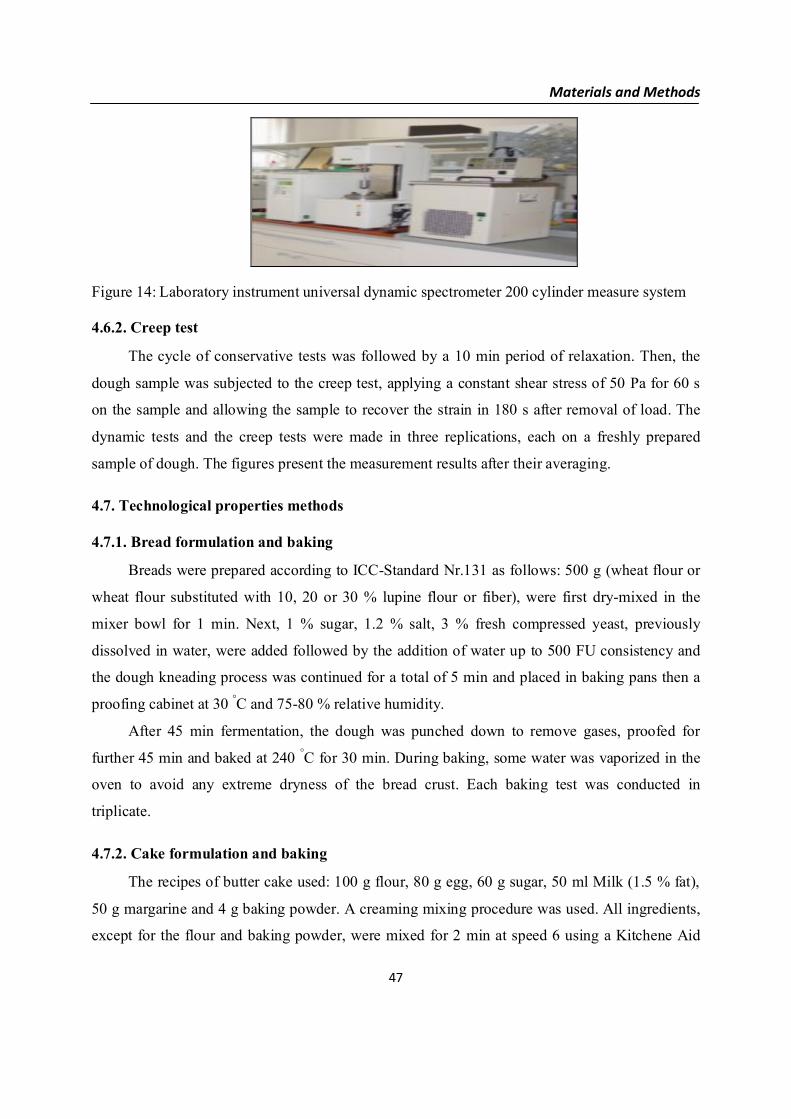
Materials and Methods
47
Figure 14: Laboratory instrument universal dynamic spectrometer 200 cylinder measure system
4.6.2. Creep test
The cycle of conservative tests was followed by a 10 min period of relaxation. Then, the
dough sample was subjected to the creep test, applying a constant shear stress of 50 Pa for 60 s
on the sample and allowing the sample to recover the strain in 180 s after removal of load. The
dynamic tests and the creep tests were made in three replications, each on a freshly prepared
sample of dough. The figures present the measurement results after their averaging.
4.7. Technological properties methods
4.7.1. Bread formulation and baking
Breads were prepared according to ICC-Standard Nr.131 as follows: 500 g (wheat flour or
wheat flour substituted with 10, 20 or 30 % lupine flour or fiber), were first dry-mixed in the
mixer bowl for 1 min. Next, 1 % sugar, 1.2 % salt, 3 % fresh compressed yeast, previously
dissolved in water, were added followed by the addition of water up to 500 FU consistency and
the dough kneading process was continued for a total of 5 min and placed in baking pans then a
proofing cabinet at 30 °C and 75-80 % relative humidity.
After 45 min fermentation, the dough was punched down to remove gases, proofed for
further 45 min and baked at 240 °C for 30 min. During baking, some water was vaporized in the
oven to avoid any extreme dryness of the bread crust. Each baking test was conducted in
triplicate.
4.7.2. Cake formulation and baking
The recipes of butter cake used: 100 g flour, 80 g egg, 60 g sugar, 50 ml Milk (1.5 % fat),
50 g margarine and 4 g baking powder. A creaming mixing procedure was used. All ingredients,
except for the flour and baking powder, were mixed for 2 min at speed 6 using a Kitchene Aid

Materials and Methods
48
Professional mixer (KPM5). After the addition of the flour and baking powder, the mixing
process continued for 3 min at speed 8. 200 g of cake batter were placed into 120 mm diameter
and 45 mm height, metallic, lard coated pan, and were baked in an electric oven for 25 min at 200 ºC.
Wheat flour was substituted by lupine flour or fibre, based on the same way in bread making.
4.7.3. Loaf volume determinationBread or cake mass was weighted after 3 hours at room temperature. The volume (cm3) was
measured by rapeseed replacement method described in the (AACC, 1983). The specific volume
was obtained by dividing the volume of loaves by their weights.
4.7.4. Color measurements
Crumb and crust color of fresh bread was measured with a Minolta Calorimeter (CR 200
Japan). Color readings were expressed by Hunter values for L*, a* and b*.
4.7.5. Sensory evaluation
Evaluation of the baked loaves quality characteristics was carried out following cooling to
room temperature for 2 h. Sensory evaluation was performed by ten panelists who were graduate
students and staff members of the Department of Rheology, Institute of Food Technology and
Food Chemistry, Technical University, Berlin. Loaves were randomly assigned to each panelist.
The panelists were asked to evaluate each loaf for appearance, crumb texture, crumb grain, crust
color, taste, odor and overall acceptability. A 10 point scale was used where 10 "excellent and
1 "extremely unsatisfactory.
4.8. Diet and experimental animals design:Forty eight male albino rats (Sprague dawleey strain) ranged weight 110-120 g were
obtained from National Research Center, Giza, Dokki, Egypt. They were housed in individual
cages at room temperature. The animals were left to acclimatize for ten days before the start of
experiment. They were fed with standard laboratory diet according to (AOAC, 2002) and
randomly divided into two main groups. First group (6 rats) was fed on a basal diet without
lupine flour or fiber for 35 days and considered as control rats (control A). The second main
group (42 rats) was fasted overnight and injected with alloxan solution (120 mg/kg rat weight) to
induce hyperglycemia (Arbeeny and Bergquist, 1991). After 48 h of injection, the second main
group was divided into seven subgroups (6 rats each). The first subgroup represents the diabetic

Materials and Methods
49
rats (control B) was fed on basal diet without lupine flour or fiber. The rats of 2nd, 3ed and 4th
subgroups were fed separately on basal diet plus different levels (5, 10 and 15 %) of lupine flour
respectively. The rats of 5nd, 6ed and 7th subgroup were fed separately on basal diet plus
different levels (5, 10 and 15 %) of lupine fiber respectively. Animals were weighted weekly and
sacrificed at the end of the experiment. Blood samples were collected from hepatic portal vein;
serum was separated by centrifugation at 3000 rpm, for 15 minutes and kept at -5 ºc tell analysis.
Serum cholesterol, total lipids and glucose levels were determined according to Hewitt and
pardue, (1973); Frings and Dunn, (1970); Trinder, (1969) respectively.
4.9. Statistical analysis
Analysis of variance (ANOVA) was carried out using SAS program (Statistical Analysis
System version. 9.1) SAS Institute Inc. (SAS, 2004). The rheological properties and bread
characteristics of wheat dough with or without lupine flour or fiber were analysed using
ANOVA. When the treatment factor effect was found significant, indicated by a significant F-test
(p < 0.05), differences between the respective means were determined using least significant
difference (LSD) and considered significant when p < 0.05. Mean ± standard deviation of mean
was used.

Results and discussion
50
5. Chemical compositionThe objectives of this study were to investigate chemical composition (proteins, lipids,
starch, sugars, fiber, ash, amino acids), phytochemicals compounds (total phenolic, flavonoids,
flavonols contents) and antioxidant capacity (DPPH and ABTS). The potential use of different
sweet lupine seed derivatives (flour and fiber) at different concentration (5, 10 and 15 %) for
baking applications (bread and cake) and the influence of lupine addition on the rheological
properties (empirical rheology and fundamental) of dough and quality of final products were also
described. Effects of different sweet lupine seed derivatives (flour and fiber) at different
concentration (5, 10 and 15 %) on diabetic rats were also studied.
5.1. Wheat flour, lupine flour and their blendsLupine is a good source of nutrients, not only proteins but also lipids, dietary fibre,
minerals, and vitamins (Martínez-Villaluenga et al., 2009). The results for the chemical
composition of wheat flour (WF), lupine flour (LF), and their blends are shown in Table (1). The
lupine flour showed higher levels of moisture, crude protein, ash, crude fat and dietary fiber than
the wheat flour. Conversely, wheat flour showed higher levels of starch. These results confirmed
by statistical analysis, which highly significant differences (P < 0.05) were observed between the
two types of flours. Mean protein and dietary fiber increased with increasing amount of lupine
flour added to be 13.73 ± 0.24, 14.75 ± 0.27, 16.28 ± 0.31 and 4.66 ± 0.27, 6.61 ± 0.43 8.57 ±
0.60 g/100 g for substituting wheat flour with lupine flour at 5, 10 and 15 %, respectively on dry
weight basis. There was no significant difference between wheat flour and supplemented flour
with different concentration of lupine for moisture, ash and fat content.
The chemical properties of wheat flours have been studied previously by several
researchers and they found that moisture content ranged between 12.5 to 14.6 % crude protein
content 8.23 to 12.71 % and ash content 0.42 to 0.66 (Ahmad et al., 2001).

Results and discussion
51
Table 1: Chemical composition of wheat flour (WF), lupine flour (LF) and their blends
Analysis WF LFLF level (%)
5 10 15Moisture 11.27 ± 0.09 12.37 ± 0.46 11.35 ± 0.19 11.42 ± 0.17 11.54 ± 1.16Protein 12.1 ± 0.20 38.6 ± 0.87 13.73 ± 0.24 14.75 ± 0.27 16.28 ± 0.31Ash 0.40 ± 0.02 3.41 ± 0.03 0.55 ± 0.01 0.70 ± 0.04 0.85 ± 0.03Fat 1.62 ± 0.19 9.94 ± 0.16 2.04 ± 0.19 2.45 ± 0.17 2.87 ± 0.16Starch 69.8 ± 1.96 0.98 ± 0.04 66.36 ± 3.94 62.92 ± 1.88 59.48 ± 2.84S. D. F 1.1 ± 0.09 11.0 ± 1.36 1.60 ± 0.14 2.09 ± 0.27 2.59 ± 0.31I. D. F 1.6 ± 0.23 30.8 ± 2.45 3.06 ± 0.31 4.52 ± 0.42 5.98 ± 0.53T. D. F 2.7 ± 0.15 41.8 ± 3.08 4.66 ± 0.27 6.61 ± 0.43 8.57 ± 0.60
Mean ± standard deviation of mean
Protein content of lupine (38.6 %) was higher than that of a lot of legumes. Favier et al.,
(1995) reported that haricot bean, lentil and soy bean contain 28.8 %, 26.7 % and 40.5 % protein,
respectively. Because of the high protein content, lupine flour could be used in the human diet.
Also, temperature of denaturation of these proteins is higher than animal protein, so they are
technologically easier to handle (Chapleau and de Lamballerie-Anton, 2003). Lupine flour had a
high amount of crude fibre (16.2 %). These fibres have many desirable properties, including
white color, high water-holding capacity (7.1 g H2O/g) and beneficial effects on human health
(Huyghe, 1997). Therefore, lupine flour can be incorporated into a wide range of foods to make
dietary products.
5.2. Wheat flour, lupine fiber and their blends
The proximate compositions of wheat flour (WF), lupine fiber (L-fiber) and wheat floursubstituted with different levels of lupine fiber are given in Table (2). The lupine fiber showedhigher levels ash, crude fat and dietary fiber than the wheat flour. Conversely, wheat flourshowed higher levels of moisture, crude protein and starch. These results confirmed by statisticalanalysis, which highly significant differences (P < 0.05) were observed between wheat flour andlupine fiber. Mean dietary fiber increased with increasing amount of lupine fiber added to be6.82 ± 0.32, 10.95 ± 0.53 and 15.07 ± 0.75 for substituting wheat flour with lupine flour at 5, 10and 15 %, respectively on dry weight basis. There was no significant difference between wheatflour and supplemented flour with different concentration of lupine fiber for moisture, ash and fatcontent.

Results and discussion
52
Table 2: Chemical composition of wheat flour (WF), Lupine fiber (L-fiber) and their blends
Analysis WF L-fiberL-fiber level (%)
5 10 15Moisture 11.27 ± 0.09 8.76 ± 0.06 11.14 ± 0.08 11.02 ± 0.07 10.89 ± 0.16
Protein 12.1 ± 0.20 4.8 ± 0.26 11.74 ± 0.23 11.37 ± 0.25 11.01 ± 0.29
Ash 0.40 ± 0.02 2.57 ± 0.18 0.51 ± 0.12 0.62 ± 0.06 0.73 ± 0.44
Fat 1.62 ± 0.19 2.1 ± 0.11 1.64 ± 0.17 1.67 ± 0.14 1.69 ± 0.18
Starch 69.8 ± 1.96 0.20 ± 0.04 66.32 ± 1.91 62.84 ± 1.86 59.36 ± 3.82
S. D. F 1.1 ± 0.09 43.7 ± 2.19 3.23 ± 0.15 5.36 ± 0.32 7.49 ± 0.45
I. D. F 1.6 ± 0.23 41.5 ± 1.12 3.60 ± 0.25 5.59 ± 0.27 7.59 ± 0.34
T. D. F 2.7 ± 0.15 85.19 ± 4.38 6.82 ± 0.32 10.95 ± 0.53 15.07 ± 0.75
Mean ± standard deviation of mean
5.3. Amino acids contentLupine seeds represent a good balance of essential amino acids (Drakos et al., 2007). They
are considered to be a good source of lysine, and are generally poor in the sulfur-containing
amino acids (methionine and cysteín) (Gulewicz et al., 2008) and threonine (Pisariková et al.,
2008).
The results for the amino acid content of wheat flour (WF) and lupine flour (LF) are shown
in Table (3). In contrast to plants, humans and animals are able to synthesize only 9 amino acids
used in protein synthesis (non-essential amino acids). The biosynthesis of the remaining
(essential) amino acids, thereby the protein synthesis, is not possible without their continuous
supply through food consumption. In the case of low-protein diets, symptoms, such as delay in
growth, negative nitrogen uptake or disturbances in protein synthesis, can take place. Therefore
foods rich in exogenous amino acids are desirable.

Results and discussion
53
Table 3: The total amino acids % dry matter, for wheat (WF) and lupine flour (LF).
Amino Acidg/kg
WF LF FAO/WHO** Amino Acidg/kg
FAO/WHO WF LF
Lysin* 3,0 ± 0.13 16.35 ± 0.56 5.8 Leucin 6.6 6,7 ± 0.12 26.13 ± 1.08
Threonin* 2,7 ± 0.08 11.48 ± 0.47 3.4 Phenylalanin* 6.3 4,1 ± 0.16 14.20 ± 0.40
Valin 4,8 ± 0.28 16.65 ± 0.76 3.5 Tyrosin 6.1 2,6 ± 0.10 13.90 ± 0.53
Methionin* 1,7 ± 0.15 1.59 ± 0.16 2.5 Tryptophan* 1.1 1,4 ± 0.07 10.94 ± 0.70
Serine 2,3 ± 0.50 1.52 ± 0.60 - Arginin - 4,3 ± 0.18 36.13 ± 3.78
Isoleucin* 3,4 ± 0.20 14.85 ± 0.36 2.8 Histidin 1.9 2,5 ± 0.19 5.89 ± 0.33
*Essential Amino Acids **FAO/WHO, (2007)
The results showed that the essential amino acids (lysine, threonine, isoleucine,phenylalanine and tryptophane) in lupine flour were higher than those in wheat flour exceptmethionine content which was higher in wheat flour (1.7 g/kg). This result was confirmed byLubowicki et al., (2000). Sujak et al., (2006) reported that lupine seeds of different speciesrepresenting diverse varieties of sweet lupine grown in Poland manifest a large deficiency ofsulphur containing amino acids, for which the recommended level is 3.5 g/16 g N (Molvig et al.,1997). Methionine levels of 1.59 g/kg, found for the lupine flour was low but comparable toresults reported previously for other lupins (El-Adawy et al., 2001). The recommended level ofmethionine is 2.5 g/kg (Tabe and Higgins, 1998). Of great importance is the presence of sulphurcontaining amino acids, mainly methionine, which is necessary for the synthesis of cysteine, aswell as phenylalanine needed for the synthesis of tyrosine (Molvig et al., 1997).
The protein demand of different organisms depends on their physiological state stipulatedmainly by age. For example, young and growing mammals (up to approximately two years inhumans) need proteins rich in amino acids, such as arginine and histidine, as such amino acidsare the source of the active centers of many enzymes. In contrast, adults show almost nophysiological demand for these amino acids.
From the results we can noticed that lupine flour is rich with arginine and histidine (36.13and 5.89 g/kg respectively). Protein quantity, as well as composition, is the limitation of proteinquality (Tabe and Higgins, 1998). For humans, adequate quantities of lysine, methionine andtryptophan are considered necessary in food of high nutritive value (Molvig et al., 1997). A number

Results and discussion
54
of approaches, based on the analysis of amino acids, have been considered for the estimation ofprotein quality in human and fodder foods. According to Alsmeyer et al., (1974), the nutritionalvalue of food should be expressed in terms of leucine and tyrosine contents, while otherclassifications are based on the chemical scores for 9–11 amino acids considered essential. Lupineflour showed high content of lysine (16.35 g/kg) more than wheat flour (3.0 g/kg).
5.4. Phenolic compounds and antioxidants capacity
Phenolic compounds ubiquitous in plants are key phytochemical drivers of the health andfunctional foods and nutraceutical industry. Research with polyphenol compounds from variouscrops has created a growing market for polyphenol-rich ingredients, estimated to be worth around$ 99 million in Europe in 2003 (Nutraingredients, 2005).
5.4.1. Wheat flour, lupine flour and their blends
Conventional solvent extraction has been reported in a laboratory scale using acetone,hexane, methanol and ethanol (Kosar et al., 2004). In this study, methanol was used for theextraction of antioxidant compounds from wheat, lupine flour and their blends (Table 4). Theextraction yield 13.7 and 36.2 g/100g dry weight for wheat and lupine flour respectively.
Table 4: Extract yield, total polyphenols content and antioxidant capacity of wheat flour (WF),lupine flour (LF) and their blends.
Analysis WF LFLF level (%)
5 10 15
Yield extract (%) 13.7 ± 3.99 36.2 ± 1.73 11.9 ± 0.35 13.6 ± 1.35 14.0 ± 1.21
Total phenolic
(µg GAE/g DW)126.63 ± 3.52 138.17 ± 8.35 132.17 ± 0.58 142.5 ± 7.10 156.53 ± 3.88
Total flavonoids
(µg QE/g DW)6.33 ± 0.15 8.93 ± 0.06 7.67 ± 1.27 7.93 ± 0.06 8.4 ± 0.52
Total flavonols
(µg QE/g DW)32.03 ± 6.13 31.60 ± 4.70 29.10 ± 2.48* 28.27 ± 2.96* 27.00 ± 1.08*
DPPH (%) 3.31 ± 0.35 20.62 ± 1.22 5.1 ± 0.10* 6.04 ± 0.77* 7.16 ± 0.26*
ABTS (%) 26.7 ± 0.21 43.42 ± 0.37 29.41 ± 0.37* 31.09 ± 0.00* 32.35 ± 0.37*
Mean ± standard deviation of mean, * 3replicates, Deviation of mean correctly calculated

Results and discussion
55
The lupine flour showed higher levels of total phenolic and total flavonoids than the wheatflour. Conversely, wheat flour showed higher levels of total flavonols. These results confirmedby statistical analysis, which highly significant differences (P<0.05) were observed between thetwo type of flours. Total phenolic and total flavonoids increased with increasing amount of lupineflour added to be 132.17 ± 0.58, 142.5 ± 7.10, 156.53 ± 3.88 (µg GAE/g DW) and 7.67 ± 1.27,7.93 ± 0.06, 8.4 ± 0.52 (µg QE/g DW) for substituting wheat flour with lupine flour at 5, 10 and15 %, respectively on dry weight basis. The contents of phenolic acids in lupine used in thisstudy are comparable to levels reported previously (Ricardo-da-Silva et al., 1993), especially incultivars of L. albus grown in Portugal. Phenolic content of lupins were higher than those of beancultivars grown in Manitoba (Oomah et al., 2005) probably as a result of relatively highflavonoid content. The methanolic extracts of lupine seed were analysed by high performanceliquid chromatography to see the phenolic profiles Figure (15).
As shown in Figure (15), nine phenolic acids were separated and identified. This method iswell reproducible and provides good separation in terms of migration time and resolution.
The antioxidant effects of extracts of various wheat flour (WF), lupine flour (LF) and theirblends at different concentration (5, 10 and 15 %) were measured. Since the active substances offlour extracts tested are different, the antioxidant activities of these extracts cannot be evaluatedby only a single method. Therefore, two different models were used in this study (Huang et al.,2005).
Free radicals which are involved in the process of lipid peroxidation are considered to playa major role in numerous chronic pathologies, such as cancer and cardiovascular diseases amongothers (Dorman et al., 2003). The DPPH radical has been widely used to evaluate the freeradicals’ scavenging ability of various natural products and has been accepted as a modelcompound for free radicals originating in lipids (Da Porto et al., 2000). The effect of antioxidantson diphenyl-p-picryl hydrazyl (DPPH) radical scavenging was thought to be due to theirhydrogen donating ability. DPPH is a stable free radical and accepts an electron or hydrogenradical to become a stable diamagnetic molecule. The assay is based on the reduction of DPPH.Because of its odd electron, DPPH gives strong absorption maxima at 515 nm (purple color) byvisible spectroscopy. As the odd electron of the radical becomes paired off in the presence of ahydrogen donor, i.e., a free radical scavenging antioxidant, the absorption intensity is decreased,and the resulting decolorization is stochiometric with respect to the number of electrons captured(Yamaguchi et al., 2000).

Results and discussion
56
A B
C D
E

Results and discussion
57
Figure 15: HPLC chromatogram of methanol extract of: wheat flour (A), lupine flour (B) andwheat flour supplemented with lupine flour at different concentration, 5 % (C). 10 %(D) and 15 % (E). 1. gallic, 2. procatechuic, 3. p-hydroxybenzoic, 4. vanillin,5. P coumaric, 6. chlorogenic, 7. cinnamic 8. sinapine and 9. ferulic acid.
Table (4) showed that the scavenging activity of methanolic extracts against DPPH• forwheat flour (WF), lupine flour (LF) and their blends. Significant (p < 0.05) differences betweenwheat and lupine flour extracts were observed. Results clearly indicate that lupine flour exhibitedhigher antioxidant activity with DPPH and ABTS than the wheat flour. The antioxidant activityincreased with increasing amount of lupine flour added to be 5.1 ± 0.10, 6.04 ± 0.77, 7.16 ± 0.26in DPPH and 29.41 ± 0.37, 31.09 ± 0.00, 32.35 ± 0.37 in ABTS respectively, for substitutingwheat flour with lupine flour at 5, 10 and 15 %, respectively on dry weight basis.
Wang et al., (1998) found that some compounds which have ABTS+ scavenging activitydid not show DPPH scavenging activity. In this study, there was not the case. The ABTS•+
scavenging data suggests that the components within the extracts are capable of scavenging freeradicals via a mechanism of electron/hydrogen donation and should be able to protect susceptiblematrices from free radical-mediated oxidative degradation.
5.4.2. Wheat flour, lupine fiber and their blends
The hull constitutes a considerable part of the lupine seeds (ca. 20 %) with a high contentof dietary fibre (50–54 %) of good functionality (Gorecka et al., 2000). Compared to otherleguminous crops, lupine seeds have a large proportion of hulls, which can be a source ofvaluable health promoting ingredients, including those with antioxidant properties. Thereforelupine hulls were also estimated.
Table 5: Extract yield, total polyphenols content and antioxidant capacity of wheat flour (WF),lupine fiber (L-fiber) and their blends.
Analysis WF L-fiberL-fiber level (%)
5 10 15
Yield Extract (%) 13.7 ± 3.99 16.1 ± 0.46 14.2 ± 0.52 15.1 ± 0.96 15.4 ± 0.46
Total Phenolic(µg GAE/g DW)
126.63 ± 3.52 43.63 ± 2.57 126.27 ± 2.08 114.37 ± 2.05 105.17 ± 1.79
Total Flavonoids(µg QE/g DW)
6.33 ± 0.15 7.63 ± 0.06 6.63 ± 1.47 7.00 ± 0.95 7.30 ± 0.72
Total Flavonols(µg QE/g DW)
32.03 ± 6.13 30.53 ± 3.97 30.57 ± 3.38 29.5 ± 6.94 28.50 ± 7.18

Results and discussion
58
DPPH (%) 3.31 ± 0.35 3.75 ± 1.64* 3.98 ± 0.25* 4.15 ± 0.54* 4.76 ± 0.68*
ABTS (%) 26.7 ± 0.21 27.54 ± 0.40* 27.45 ± 1.09* 28.90 ± 0.29* 29.83 ± 0.00*
Mean ± standard deviation of mean, * 3replicates, Deviation of mean correctly calculated
Table (5) showed that extract yield, total polyphenols content and antioxidant capacity of
wheat flour (WF), lupine fiber (L-fiber) and their blends. It was noticed that lupine fiber had total
phenolic, and flavonols lower than wheat flour or lupine flour. No significant difference between
wheat flour and lupine fiber in flavonoids content. The same trend was observed with the
antioxidant activity for lupine fiber in DPPH and ABTS tests. These results were similar with the
results of Lampart-Szczapa et al., (2003a) who studied the antioxidant properties of lupine flours
and hulls using the rancimat and oxidograph tests and he found that lupine tannins contents in the
flours were a few times higher than in the hulls. Antioxidant activity was found both in the flours
and in the hulls.
6. Physical investigation
6.1. Milling and particle size distributionThe grinding of the respective cereal raw material produced the dough as an intermediate of
the bakery products after the addition of water and mechanical agitation. The degree of grinding
of the grain may be determined by a sieve or laser particle analysis and is also an indicator of the
mechanical disruption of the raw material and its baking characteristics. Before grinding lupine
was wetted to 14 % moisture to a optimum moisture content to ensure a good separation of the
shells from the endosperm and flour to finer particles to obtain. Addition of water leads to
improve the fracture properties and brittle behavior. The crushing of the lupine in a hammer mill,
resulting in a nearly complete dissolution of the grain structure in the cell exposed starch granules
and protein particles exposed. It is assumed that the composition of the flour content of the
crushing does not change. Due to the different methods of starting flour milling (wheat and
lupine flour) is on the determination of particle size fractions and different mass fractions
example of single-frequency determined.
The lupine was crushed by the hammer mill and preliminary tests of the total lupine flour
fractionated by sieving and others. A criterion of the fractionation is ≤ 250 μm.
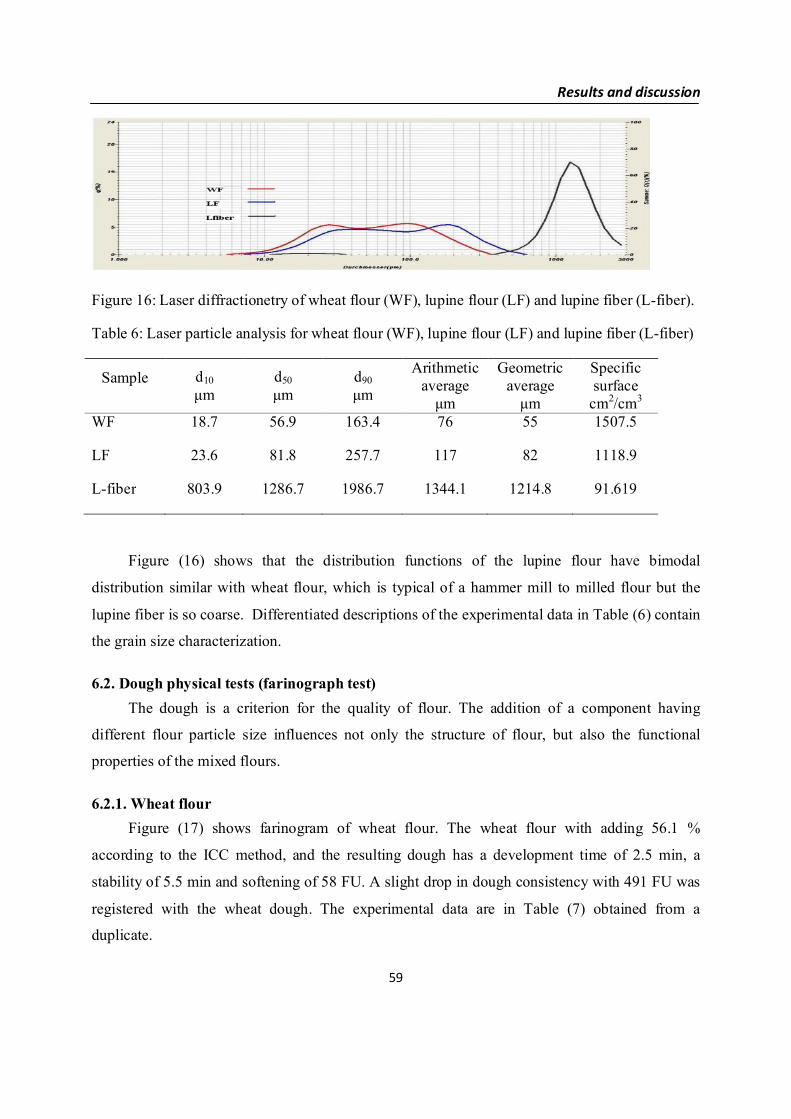
Results and discussion
59
Figure 16: Laser diffractionetry of wheat flour (WF), lupine flour (LF) and lupine fiber (L-fiber).
Table 6: Laser particle analysis for wheat flour (WF), lupine flour (LF) and lupine fiber (L-fiber)
Sample d10μm
d50μm
d90μm
Arithmeticaverage
μm
Geometricaverage
μm
Specificsurface
cm2/cm3
WF 18.7 56.9 163.4 76 55 1507.5
LF 23.6 81.8 257.7 117 82 1118.9
L-fiber 803.9 1286.7 1986.7 1344.1 1214.8 91.619
Figure (16) shows that the distribution functions of the lupine flour have bimodal
distribution similar with wheat flour, which is typical of a hammer mill to milled flour but the
lupine fiber is so coarse. Differentiated descriptions of the experimental data in Table (6) contain
the grain size characterization.
6.2. Dough physical tests (farinograph test)The dough is a criterion for the quality of flour. The addition of a component having
different flour particle size influences not only the structure of flour, but also the functional
properties of the mixed flours.
6.2.1. Wheat flourFigure (17) shows farinogram of wheat flour. The wheat flour with adding 56.1 %
according to the ICC method, and the resulting dough has a development time of 2.5 min, a
stability of 5.5 min and softening of 58 FU. A slight drop in dough consistency with 491 FU was
registered with the wheat dough. The experimental data are in Table (7) obtained from a
duplicate.

Results and discussion
60
Figure 17: Farinogram for wheat flour (WF).
Table 7: Farinogram data of doughs made from wheat flour (WF), lupine flour (LF) and lupinefiber (L-fiber).
SampleWater absorption
%
Development time
min
Dough stability
min
Dough softening
FU
WF 56,1 2,5 5,5 58
LF 5 % 57,6 3,5 9,8 18
LF 10 % 57,5 4,5 6,5 50
LF 15 % 57,2 5,5 3,5 120
L. Fibre 5 % 60,5 6 8,5 -
L. Fibre 10 % 64,8 7,5 6,5 -
L. Fibre 15 % 68,5 6,5 8,0 -
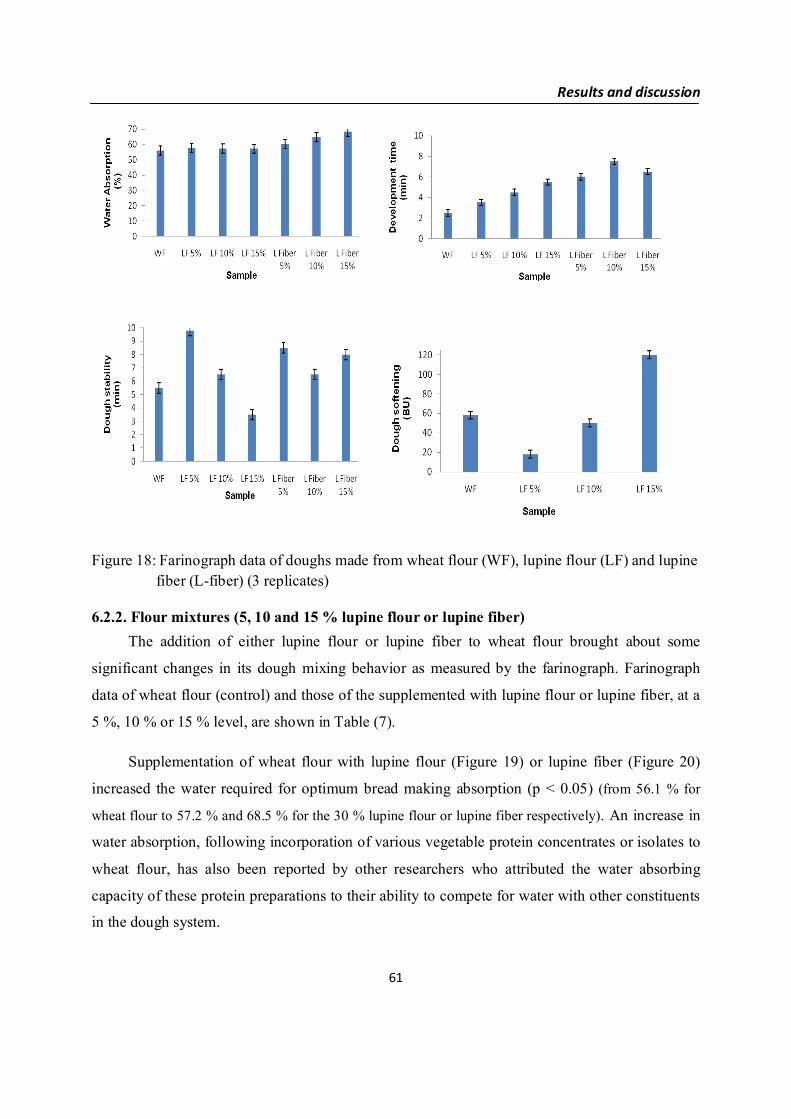
Results and discussion
61
Figure 18: Farinograph data of doughs made from wheat flour (WF), lupine flour (LF) and lupinefiber (L-fiber) (3 replicates)
6.2.2. Flour mixtures (5, 10 and 15 % lupine flour or lupine fiber)The addition of either lupine flour or lupine fiber to wheat flour brought about some
significant changes in its dough mixing behavior as measured by the farinograph. Farinograph
data of wheat flour (control) and those of the supplemented with lupine flour or lupine fiber, at a
5 %, 10 % or 15 % level, are shown in Table (7).
Supplementation of wheat flour with lupine flour (Figure 19) or lupine fiber (Figure 20)
increased the water required for optimum bread making absorption (p < 0.05) (from 56.1 % for
wheat flour to 57.2 % and 68.5 % for the 30 % lupine flour or lupine fiber respectively). An increase in
water absorption, following incorporation of various vegetable protein concentrates or isolates to
wheat flour, has also been reported by other researchers who attributed the water absorbing
capacity of these protein preparations to their ability to compete for water with other constituents
in the dough system.

Results and discussion
62
According to these authors the ability of these proteins to absorb high quantities of water
results in doughs which exhibit increased farinograph water absorption values (Doxastakis et al.,
2002). The quantity of added water is considered to be very important for the distribution of the
dough materials, their hydration and the gluten protein network development.
Figure 19: Farinogram data of doughs made from flour mixtures (5, 10 and 15 % lupine flour).
These results confirmed by Sudha et al., (2011) who studied the effects of wheat bran and
oat bran as sources rich in insoluble dietary fiber and soluble dietary fiber in the formulation of
instant vermicelli and study its influence on the rheological characteristics and product quality.
The incorporation of wheat bran and oat bran from (0 to 20 %) in the blends increased the water
absorption significantly from 58.3 to 64.1 %.
Figure 20: Farinogram data of doughs made from flour mixtures (5, 10 and 15 % lupine fiber).
Rosell et al., (2001) reported that the differences in water absorption is mainly caused by
the greater number of hydroxyl group that exist in the fiber structure and allow more water
interaction through hydrogen bonding. It could be noticed that water absorption increased with

Results and discussion
63
increasing amount of lupine fiber. The observed effect agrees with the increased water absorption
found by Sosulski and Wu, (1988) when they added field pea hulls, wheat, corn and wild oat
brans to the bread dough.
The time required for the control dough to reach 500 FU consistency was also modified by
lupine flour addition. During this phase of mixing, the water hydrates the flour components and
the dough is developed. Dough development time (DDT) was significantly higher (p < 0.05) for all
wheat-lupine flour or fiber blends than control (2.5 min), also between lupine samples significant
difference was observed at different concentration (p > 0.05) (Table 7). The increase in dough
development time resulting from lupine flour or fiber addition could have been due to the
differences in the physicochemical properties between the constituents of the lupine and those of
the wheat flour, as has been previously reported by Paraskevopoulou et al., (2010) who studied
the incorporation of lupine protein in wheat flour.
The time required for the dough development or time necessary to reach 500 FU of dough
consistency was modified in a different by each cereal bran. Highest development time values
were obtained in doughs with lupine fiber (5, 10 and 15 %) (Figure 20). Similar results were
expressed by Daglioglu and Gundogdu, (1999) who studied with stabilized rice bran in bread
making.
Regarding dough stability, it appears that the dough sample containing 5 % lupine
exhibited higher stability and resistance to mechanical mixing values than the control, while it
decreased as the substitute level increases from 10 % to 15 %. In general, the stability value is an
index of the dough strength, with higher values indicating stronger dough. The increase in the
stability time was related to the amount of substitution. Thus, stability times of 6.5 and 3.5 min
are observed for the dough supplemented with 10 and 15 % lupine, respectively.
Dough softening degree increased significantly with increasing amount of lupine flour in
blends. Similar dominant viscoelastic behavior in dough characteristics on blending with cowpea
flour and chickpea flour were observed by Sharma et al., (1999). The changes in dough
characteristics upon addition of lupine flour may be attributed to dilution of gluten-forming
proteins causing weakening of dough’s. Variation in hydration behavior of two proteins may be
another reason for differences in dough characteristics.
Results and discussion
64
In general, the increasing of the dough development time from 2.5 min for wheat flour
dough to 5.5 min for 15 % lupine flour and the reduction of dough stability to 3.5 min
demonstrated to weakening of the gluten network configuration during the kneading. This is
attributed to an intense incompatibility between the protein spectrum of lupine and wheat gluten
protein. It is assumed that the increasing of lupine in blend-flours, the requirements energy for the
optimal development of dough consistency increased, which lead to increased mechanical
agitation requirement of non-gluten proteins in the dough system through the lupine proportion.
This conclusion is consistent with the results of studies by Roccia et al., (2009) who found that
the substitution of wheat protein by soy protein decreased mixture elasticity, indicating dough
network weakening. One other reason for the weakening of dough strength resulting from
vegetable protein addition could stem from the fact that the substitution of gluten proteins by the
non-gluten-forming vegetable proteins causes a dilution effect and consequently weakens the
dough. This confirms the data from literature that the both protein fractions (gliadin and glutenin)
must be present for optimal gluten network development in a specific ratio. Trend to viscoelastic
behavior is given.
6.3. Oscillation measurmentsFundamental rheometry is capable of describing the physical properties of a material over a
wide range of strains and strain rates. The mechanical tests conducted within the linear
viscoelastic region are useful for understanding the dough properties in terms of physical and
chemical structure. The rheological properties of the dough reflect its machine properties during
processing and the quality of the end product (Mani et al., 1992).
Following a strain sweep at 1 Hz within the linear viscoelastic region (LVR) was selected
for additional testing.
6.3.1. Amplitude sweep measurementsThe amplitude sweep is used to determine the linear viscoelastic region of the matrix.
6.3.1.1. Wheat and lupine flour doughBelow are the results of the fundamental rheological studies of wheat and lupine flour
dough listed.

Results and discussion
65
102
103
104
105
Pa
G'
G''
0.2
0.4
0.6
0.8
1
1.2
1.4
1.6
1.8
2
tan(d)
0.0001 0.001 0.01 0.1 1Strain g
WF
G'
G''
tan(d)
LF
G'
G''
tan(d)
LF 5%
G'
G''
tan(d)
LF 10%
G'
G''
tan(d)
LF 15%
G'
G''
tan(d)
Figure 21: Amplitude sweep the flour mixture in dough (5, 10 and 15 % lupine flour)
Table 8: Amplitude sweep data for the flour mixture in dough (5, 10 and 15 % lupine flour).
Strain Sample G′104 Pa
G″104 Pa
dtan *h104 Pa ×s
*G104 Pa
g = 10-3
WF 1.51 0.52 0.35 0.25 1.59LF 5 % 1.35 0.51 0.37 0.23 1.44
LF 10 % 1.19 0.46 0.38 0.20 1.28LF 15 % 1.11 0.44 0.40 0.19 1.19
LF 5.11 1.48 0.29 0.85 5.32
Figure (21) is a collection of storage and loss modulus and loss factor for lupine dough
compared with wheat flour dough. In the double logarithmic representation of the deformation-
dependent behavior of the studied dough is pronounced with a dominant LVR solid behavior
(G' > G" or detect loss factor < 1), followed by a decrease of both moduli and an increase in the
loss factor with structural break (tan δ > 0.1). The overall structure and macro-structure is
experiencing a "break down", will be completely destroyed. A substructure is not available. The
destruction of deformation γz with G' = G" is located at wheat flour dough at 0.6, with 0.5 lupine
flour dough. The shape of the curves shows a linear viscoelastic behavior in the area of 10-4 ≤ γ ≤ 10-3.
LVR

Results and discussion
66
Made for the implementation of the frequency sweep defining the boundary of the LVR with γ =
10-3. Compared to the wheat flour dough should be noted that despite the higher protein content,
the higher level structure and the relatively larger particulation at lupine dough quickly leads to a
structural instability of the dough, recognizable by the curve of tan δ (Table 8).
This higher strength / stiffness mainly results from the present at lupine flour-dough non-
cross linked starch particles, as dispersion point of contact and there are no interacting network.
Of interest is the tan δ clearly lies with wheat flour dough with 0.35 ratio in a well-known
viscoelastic compared with 0.29 lupine flour dough (more viscoelastic, stronger, stiffer and more
brittle) as the material properties before.
Subsequently, the influence of the lupine-additive in three different mixing ratios to wheat
flour, the rheological properties of dough were examined. In Figure (21) is a compilation of
storage modulus and tan δ of the three dough preparations compared to the wheat and lupine flour
dough. The storage and loss modulus level of the flour mixture has reduced differences among
themselves in compared to the wheat flour-dough. LVR for the mixtures with deformation was of
10-4 ≤ γ ≤ 10-3.
Table (8) showed that the moduli (G', G" and G*) with increasing lupine flour content in
the mixtures in comparison to the wheat flour with a deformation of γ = 10-3 decreased slightly. A
stable structure in hibernation is determined based on the dominance of the wheat flour in the
blends.
6.3.1.2. Wheat and lupine fiber dough Below are the results of the fundamental rheological studies of dough of wheat flour
supplemented different levels of lupine fiber.

Results and discussion
67
102
103
104
105
Pa
G'
G''
0.2
0.4
0.6
0.8
1
1.2
1.4
1.6
1.8
2
tan(d)
0.0001 0.001 0.01 0.1 1Strain g
WF
G'
G''
tan(d)
L.Fibre 5%
G'
G''
tan(d)
L.Fibre 10%
G'
G''
tan(d)
L.Fibre 15%
G'
G''
tan(d)
Figure 22: Amplitude sweep the flour mixture in dough (5, 10 and 15 % lupine fiber)
Table 9: Amplitude sweep data for the flour mixture in dough (5, 10 and 15 % lupine fiber).
Strain Sampel G′104 Pa
G″104 Pa
dtan *h104 Pa ×s
*G104 Pa
g = 10-3
WF 1.51 0.52 0.35 0.25 1.59L- Fibre 5 % 1.49 0.51 0.34 0.25 1.58L-Fibre 10 % 1.72 0.56 0.33 0.29 1.81L- Fibre 15 % 2.47 0.81 0.33 0.41 2.59
The addition of lupine fiber caused a shift of curves G' and G" towards higher values, while
curve tan δ moved towards lower values. The data indicate that the additions applied caused an
increase in wheat flour dough elasticity (G') and viscosity (G"), the increase in elasticity
dominating over that in viscosity, as a result of which tan δ decreased. Likewise, Lamacchia et
al., (2010) studying doughs with a constant addition of water (30 %), recorded significantly
higher values of G' and G" for oat whole meal dough than for wheat (semolina) dough. Also, oat
whole meal dough, compared to wheat dough, was characterized by significantly higher values of
tan δ.
LVR

Results and discussion
68
Subsequently, the influence of the lupine fiber-additive in three different mixing ratios to
wheat flour, the rheological properties of dough were examined. In Figure (22) is a compilation
of storage modulus and tan δ of the three dough preparations compared to the wheat dough. The
storage and loss modulus level of the flour mixture had increased differences among themselves in
compared to the wheat flour-dough. LVR for the mixtures with deformation was of 10-4 ≤ γ ≤ 10-3.
Table (9) showed that the moduli (G', G" and G*) with increasing lupine fiber content in
the mixtures in comparison to the wheat flour with a deformation of γ = 10-3 increased slightly. A
stable structure in hibernation is determined based on the dominance of the wheat flour in the
blends.
6.3.1.3. Wheat and lupine flour batterBelow are the results of the fundamental rheological studies of wheat and lupine flour
dough listed.
100
101
102
103
104
Pa
G'
G''
0
0.5
1
1.5
2
2.5
3
3.5
4
4.5
5
5.5
6
tan(d)
0.0001 0.001 0.01 0.1 1 10Strain g
WF. Cake
G'
G''
tan(d)
LF. Cake 5%
G'
G''
tan(d)
LF. Cake 10%
G'
G''
tan(d)
LF. Cake 15%.
G'
G''
tan(d)
Figure 23: Amplitude sweep the flour mixture in batter cake (5, 10 and 15 % lupine flour).
LVR
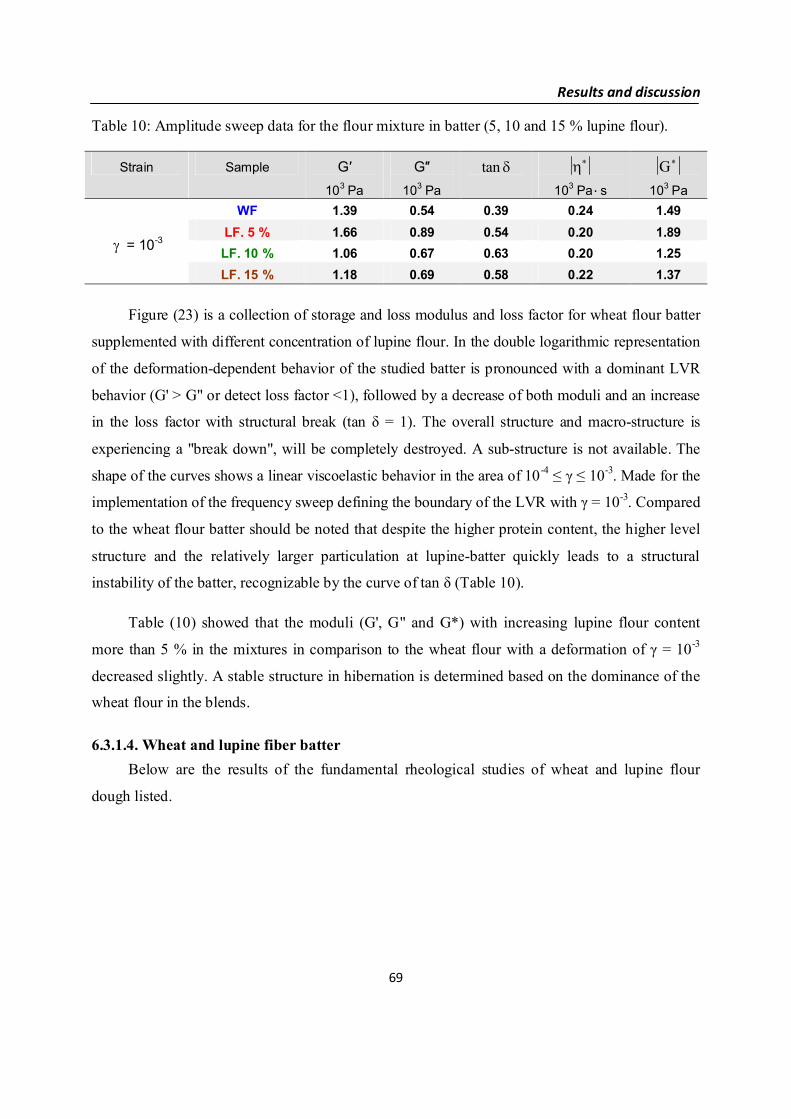
Results and discussion
69
Table 10: Amplitude sweep data for the flour mixture in batter (5, 10 and 15 % lupine flour).
Strain Sample G′103 Pa
G″103 Pa
dtan *h103 Pa ×s
*G103 Pa
g = 10-3
WF 1.39 0.54 0.39 0.24 1.49LF. 5 % 1.66 0.89 0.54 0.20 1.89LF. 10 % 1.06 0.67 0.63 0.20 1.25LF. 15 % 1.18 0.69 0.58 0.22 1.37
Figure (23) is a collection of storage and loss modulus and loss factor for wheat flour batter
supplemented with different concentration of lupine flour. In the double logarithmic representation
of the deformation-dependent behavior of the studied batter is pronounced with a dominant LVR
behavior (G' > G" or detect loss factor <1), followed by a decrease of both moduli and an increase
in the loss factor with structural break (tan δ = 1). The overall structure and macro-structure is
experiencing a "break down", will be completely destroyed. A sub-structure is not available. The
shape of the curves shows a linear viscoelastic behavior in the area of 10-4 ≤ γ ≤ 10-3. Made for the
implementation of the frequency sweep defining the boundary of the LVR with γ = 10-3. Compared
to the wheat flour batter should be noted that despite the higher protein content, the higher level
structure and the relatively larger particulation at lupine-batter quickly leads to a structural
instability of the batter, recognizable by the curve of tan δ (Table 10).
Table (10) showed that the moduli (G', G" and G*) with increasing lupine flour content
more than 5 % in the mixtures in comparison to the wheat flour with a deformation of γ = 10-3
decreased slightly. A stable structure in hibernation is determined based on the dominance of the
wheat flour in the blends.
6.3.1.4. Wheat and lupine fiber batterBelow are the results of the fundamental rheological studies of wheat and lupine flour
dough listed.
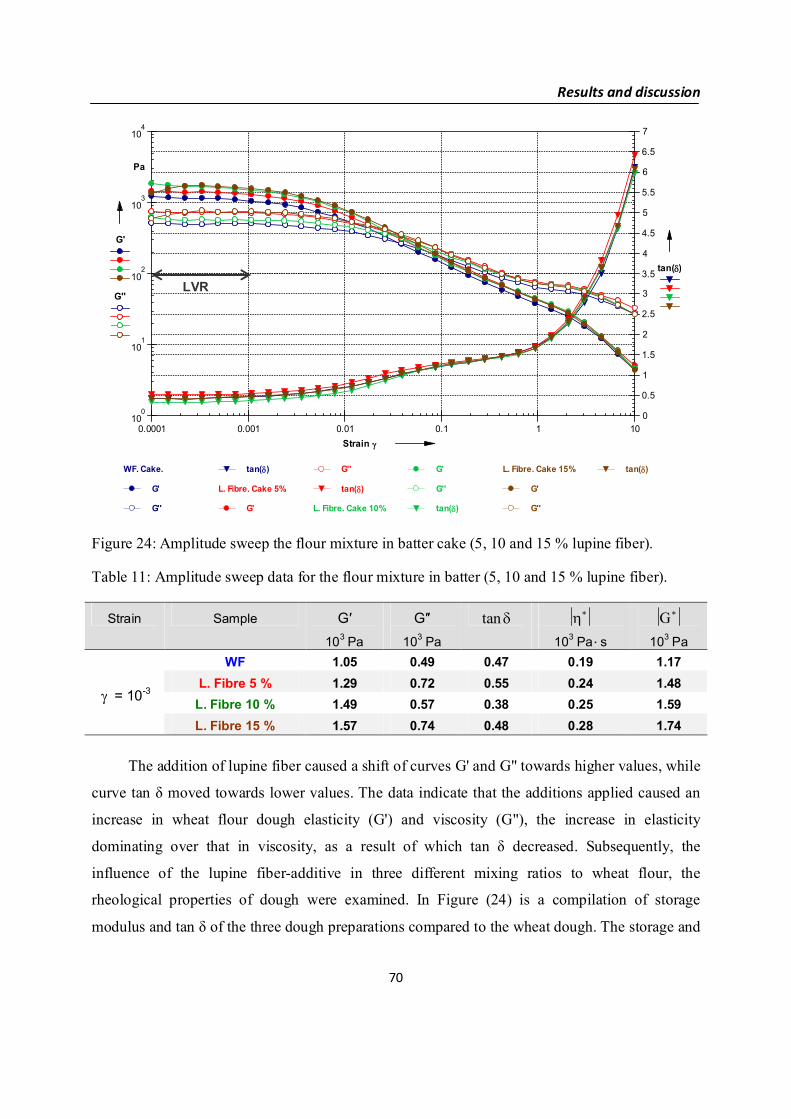
Results and discussion
70
100
101
102
103
104
Pa
G'
G''
0
0.5
1
1.5
2
2.5
3
3.5
4
4.5
5
5.5
6
6.5
7
tan(d)
0.0001 0.001 0.01 0.1 1 10Strain g
WF. Cake.
G'
G''
tan(d)
L. Fibre. Cake 5%
G'
G''
tan(d)
L. Fibre. Cake 10%
G'
G''
tan(d)
L. Fibre. Cake 15%
G'
G''
tan(d)
Figure 24: Amplitude sweep the flour mixture in batter cake (5, 10 and 15 % lupine fiber).
Table 11: Amplitude sweep data for the flour mixture in batter (5, 10 and 15 % lupine fiber).
Strain Sample G′103 Pa
G″103 Pa
dtan *h103 Pa ×s
*G103 Pa
g = 10-3
WF 1.05 0.49 0.47 0.19 1.17L. Fibre 5 % 1.29 0.72 0.55 0.24 1.48
L. Fibre 10 % 1.49 0.57 0.38 0.25 1.59L. Fibre 15 % 1.57 0.74 0.48 0.28 1.74
The addition of lupine fiber caused a shift of curves G' and G" towards higher values, while
curve tan δ moved towards lower values. The data indicate that the additions applied caused an
increase in wheat flour dough elasticity (G') and viscosity (G"), the increase in elasticity
dominating over that in viscosity, as a result of which tan δ decreased. Subsequently, the
influence of the lupine fiber-additive in three different mixing ratios to wheat flour, the
rheological properties of dough were examined. In Figure (24) is a compilation of storage
modulus and tan δ of the three dough preparations compared to the wheat dough. The storage and
LVR
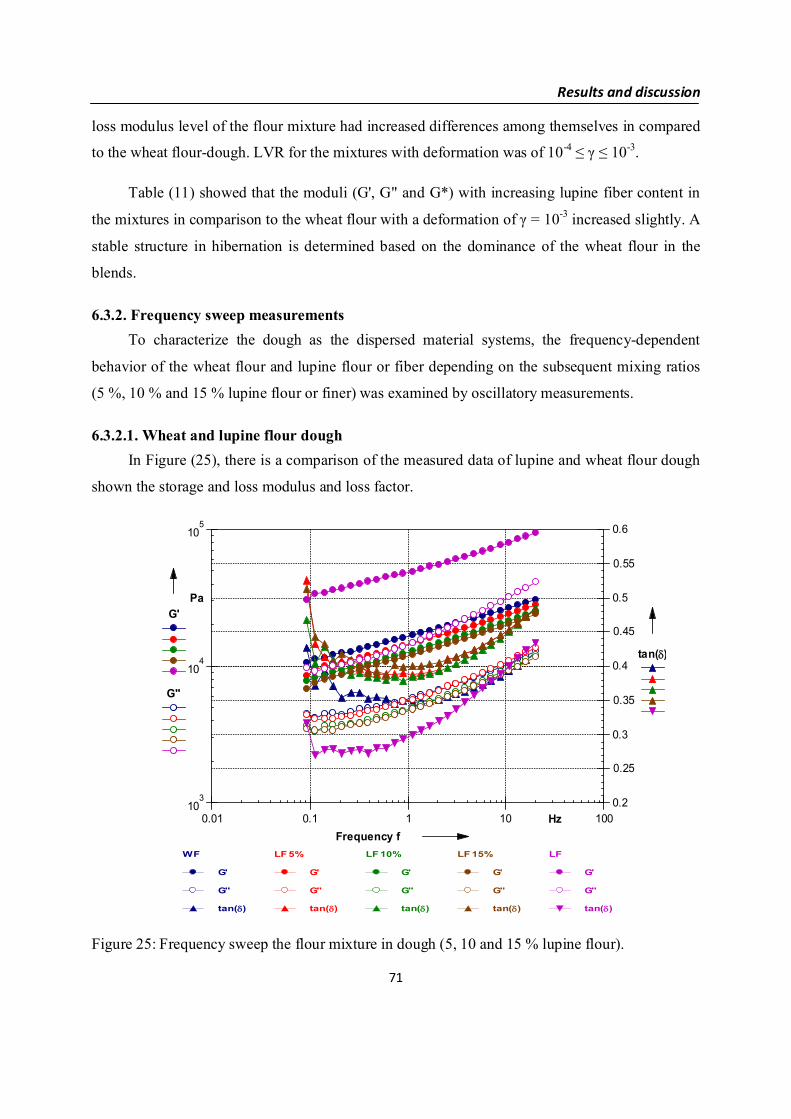
Results and discussion
71
loss modulus level of the flour mixture had increased differences among themselves in compared
to the wheat flour-dough. LVR for the mixtures with deformation was of 10-4 ≤ γ ≤ 10-3.
Table (11) showed that the moduli (G', G" and G*) with increasing lupine fiber content in
the mixtures in comparison to the wheat flour with a deformation of γ = 10-3 increased slightly. A
stable structure in hibernation is determined based on the dominance of the wheat flour in the
blends.
6.3.2. Frequency sweep measurementsTo characterize the dough as the dispersed material systems, the frequency-dependent
behavior of the wheat flour and lupine flour or fiber depending on the subsequent mixing ratios
(5 %, 10 % and 15 % lupine flour or finer) was examined by oscillatory measurements.
6.3.2.1. Wheat and lupine flour doughIn Figure (25), there is a comparison of the measured data of lupine and wheat flour dough
shown the storage and loss modulus and loss factor.
103
104
105
PaG'
G''
0.2
0.25
0.3
0.35
0.4
0.45
0.5
0.55
0.6
tan(d)
0.01 0.1 1 10 100HzFrequency f
WF
G'
G''
tan(d)
LF 5%
G'
G''
tan(d)
LF 10%
G'
G''
tan(d)
LF 15%
G'
G''
tan(d)
LF
G'
G''
tan(d)
Figure 25: Frequency sweep the flour mixture in dough (5, 10 and 15 % lupine flour).

Results and discussion
72
Table 12: Frequency sweep data for the flour mixture in dough (5, 10 and 15 % lupine flour).
Sample
Dynamic parameters (Moduls)
coefficient G′1 Hz
104 Pa
x coefficient G″1 Hz
104 Pa
y tan d *h
104 Pa × s
*G
104 Pa
WF 1.69 0.195 0.59 0.206 0.35 0.26 1.78
LF 5 % 1.47 0.210 0.57 0.228 0.39 0.23 1.58
LF 10 % 1.29 0.213 0.49 0.236 0.38 0.20 1.38
LF 15 % 1.21 0.220 0.48 0.234 0.40 0.19 1.30
LF 4.93 0.196 1.48 0.283 0.30 0.74 5.15
The relations G', G" and tan δ with frequency sweep for pure wheat flour dough, composite
flour dough’s and pure lupine flour dough are presented in Figure (25). Particle system
(dispersion), no see lihe system because measurements curves have slop.
The presented data indicate that increase of oscillation frequency within the range from 0.1
to 20 Hz caused an increase in the values of the dynamic moduli – the storage modulus and the
loss modulus for pure wheat- and lupine flour dough as well as for composite flour dough.
Whereas, the values of the tangent of the phase angle, being the ratio of G"/ G', decreased gently
while the oscillation frequency increased from 0.1 to approximately 1 Hz, while higher
frequencies caused an increase of those values.
Table (12) showed that the additions of lupine at different concentration (5, 10 and 15 %)
had a similar effect on the run of the mechanical spectra of wheat dough. Increase in the
percentage share of the additions caused a shift of curves G' and G" towards lower values. The
data indicate that the additions applied caused a decrease in tested dough elasticity (G') and
viscosity (G"), the increase in viscosity dominating over elasticity as a result of tan δ increased.
Frequency sweep experiments showed that for all tested dough formulations the elastic (or
storage) modulus, G' , was greater than the viscous (or loss) modulus, G", in the whole range of
frequencies and both moduli slightly increased with frequency which suggests a solid elastic-like
behavior of the lupine doughs. Therefore, tan δ values for all dough formulations were lower than
1. Similar observations on dynamic rheological studies have been reported previously for wheat
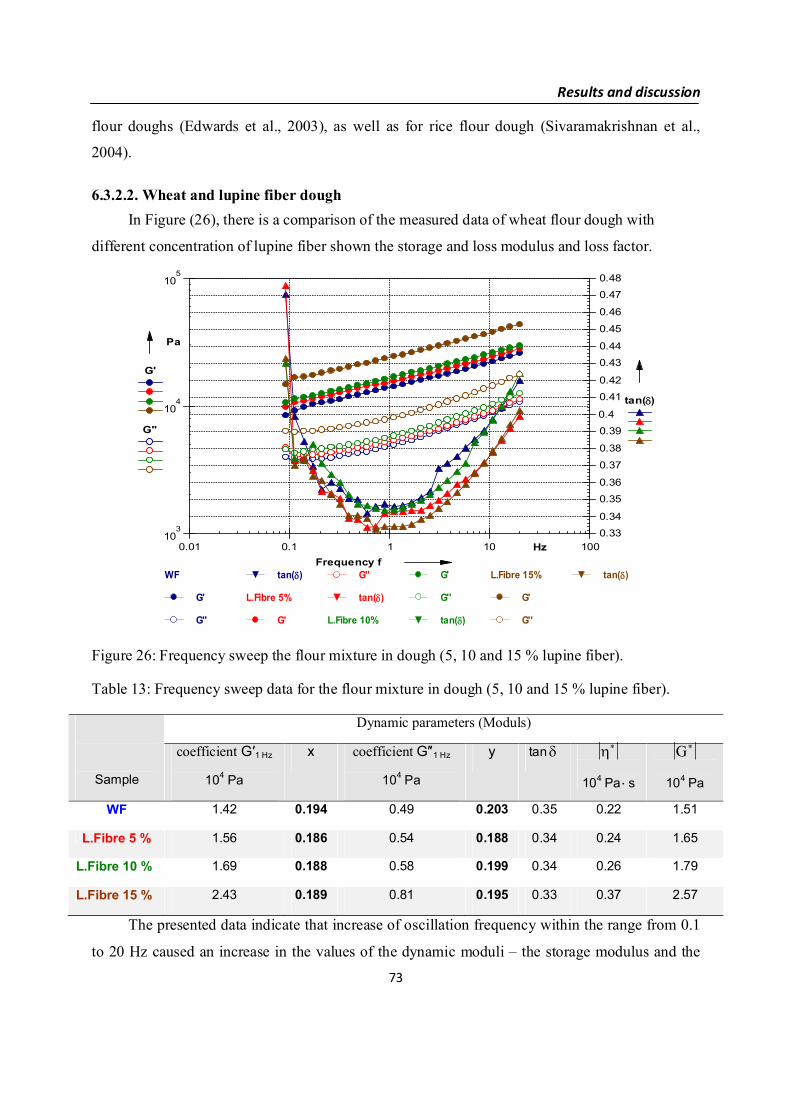
Results and discussion
73
flour doughs (Edwards et al., 2003), as well as for rice flour dough (Sivaramakrishnan et al.,
2004).
6.3.2.2. Wheat and lupine fiber doughIn Figure (26), there is a comparison of the measured data of wheat flour dough with
different concentration of lupine fiber shown the storage and loss modulus and loss factor.
103
104
105
Pa
G'
G''
0.33
0.34
0.35
0.36
0.37
0.38
0.39
0.4
0.41
0.42
0.43
0.44
0.45
0.46
0.47
0.48
tan(d)
0.01 0.1 1 10 100HzFrequency f
WF
G'
G''
tan(d)
L.Fibre 5%
G'
G''
tan(d)
L.Fibre 10%
G'
G''
tan(d)
L.Fibre 15%
G'
G''
tan(d)
Figure 26: Frequency sweep the flour mixture in dough (5, 10 and 15 % lupine fiber).
Table 13: Frequency sweep data for the flour mixture in dough (5, 10 and 15 % lupine fiber).
Sample
Dynamic parameters (Moduls)
coefficient G′1 Hz
104 Pa
x coefficient G″1 Hz
104 Pa
y tan d *h
104 Pa × s
*G
104 Pa
WF 1.42 0.194 0.49 0.203 0.35 0.22 1.51
L.Fibre 5 % 1.56 0.186 0.54 0.188 0.34 0.24 1.65
L.Fibre 10 % 1.69 0.188 0.58 0.199 0.34 0.26 1.79
L.Fibre 15 % 2.43 0.189 0.81 0.195 0.33 0.37 2.57
The presented data indicate that increase of oscillation frequency within the range from 0.1
to 20 Hz caused an increase in the values of the dynamic moduli – the storage modulus and the

Results and discussion
74
loss modulus for pure wheat- and lupine fiber dough as well as for composite flour dough.
Whereas, the values of the tangent of the phase angle, being the ratio of G"/ G', decreased gently
while the oscillation frequency increased from 0.1 to approximately 1 Hz, the higher frequencies
caused an increase of those values.
Table (13) showed that the additions of lupine fiber at different concentration (5, 10 and 15 %)
had a similar effect on the run of the mechanical spectra of wheat dough. Increase in the
percentage share of the additions caused a shift of curves G' and G" towards higher values. The
data indicate that the additions applied caused an increase in tested dough elasticity (G') and
viscosity (G"), the increase in elasticity dominating over viscosity as a result of tan δ decreased.
Frequency sweep experiments showed that for all tested dough formulations the elastic (or
storage) modulus, G', was greater than the viscous (or loss) modulus, G", in the whole range of
frequencies and both moduli slightly increased with frequency which suggests a solid elastic-like
behavior of the lupine doughs. Therefore, tan δ values for all dough formulations were lower than 1.
6.3.2.3. Wheat and lupine flour batterIn Figure (27) and Table (14), there is a comparison of the measured data of lupine and
wheat flour batter shown the storage and loss modulus and loss factor.
102
103
104
Pa
G'
G''
0.2
0.3
0.4
0.5
0.6
0.7
0.8
0.9
1
1.1
tan(d)
0.1 1 10 100HzFrequency f
WF. Cake
G'
G''
tan(d)
LF. Cake 5%
G'
G''
tan(d)
LF. Cake 10%
G'
G''
tan(d)
LF. Cake 15%
G'
G''
tan(d)
Figure 27: Frequency sweep the flour mixture in batter cake (5, 10 and 15 % lupine flour).

Results and discussion
75
Table 14: Frequency sweep data for the flour mixture in batter cake (5, 10 and 15 % lupine flour).
Sample
Dynamic parameters (Moduls)
coefficient G′1 Hz
103 Pa
x coefficient G″1 Hz
103 Pa
y tand *h
103 Pa × s
*G
103 Pa
WF. Cake 1.27 0.284 0.53 0.225 0.42 0.19 1.38
LF. 5 % 1.54 0.363 0.78 0.199 0.51 0.25 1.72
LF. 10 % 1.84 0.358 0.85 0.147 0.46 0.29 2.03
LF. 15 % 1.83 0.357 0.91 0.167 0.49 0.30 2.05
The presented data indicate that increase of oscillation frequency within the range from 0.1
to 50 Hz caused an increase in the values of the dynamic moduli – the storage modulus and the
loss modulus. Whereas, the values of the tangent of the phase angle, being the ratio of G"/ G',
decreased gently while the oscillation frequency increased from 0.1 to approximately 10 Hz ,
while higher frequencies caused an increase of those values then decrease again at 30 Hz. These
results mean that the capacity of wheat dough for dissipation (whose measure is the value of G")
and storage (whose measure is the value of G') of the energy used for its deformation increases
with increase in the oscillation frequency (f). Energy is dissipated through friction that takes
place during the slippage of one dough structural element past another, e.g., chains of gliadin
proteins which are synonymous of the viscous component of gluten. Whereas, the storage of
energy takes place through reversible rearrangements within the particular elements building the
structure of dough, as glutenin subunits which represent the elastic component of gluten (Song
and Zheng, 2007).
In the dynamic tests, increase in frequency is equivalent to increase in the shear rate of
dough sample and to a shortening of the duration of a single measurement cycle. It is a known
fact that with increase in shear rate there is an increase in friction during viscous flow of dough,
as a result of which the loss modulus (G") increases. In turn, shortening of the length of the
period in which dough is subject to deformation causes a reduction of the degree of relaxation of
stress, and that is the immediate reason for increase in the amount of stored energy (G') in the
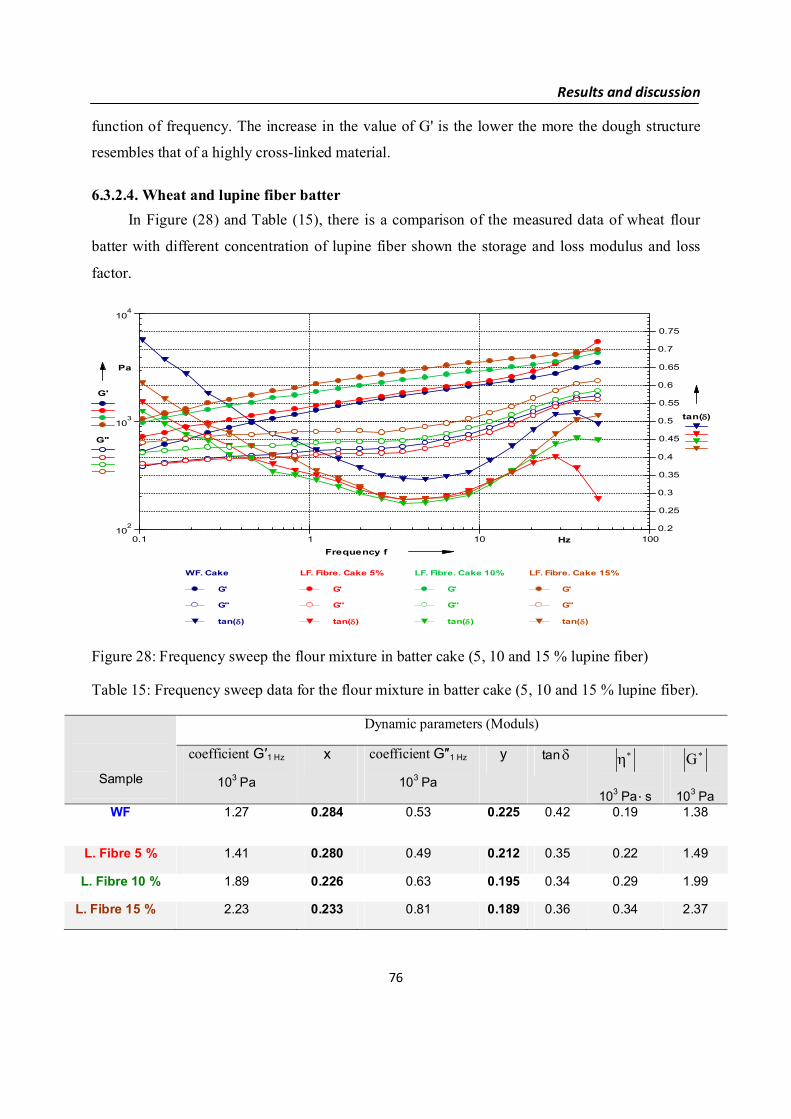
Results and discussion
76
function of frequency. The increase in the value of G' is the lower the more the dough structure
resembles that of a highly cross-linked material.
6.3.2.4. Wheat and lupine fiber batterIn Figure (28) and Table (15), there is a comparison of the measured data of wheat flour
batter with different concentration of lupine fiber shown the storage and loss modulus and loss
factor.
102
103
104
Pa
G'
G''
0.2
0.25
0.3
0.35
0.4
0.45
0.5
0.55
0.6
0.65
0.7
0.75
tan(d)
0.1 1 10 100HzFrequency f
WF. Cake
G'
G''
tan(d)
LF. Fibre. Cake 5%
G'
G''
tan(d)
LF. Fibre. Cake 10%
G'
G''
tan(d)
LF. Fibre. Cake 15%
G'
G''
tan(d)
Figure 28: Frequency sweep the flour mixture in batter cake (5, 10 and 15 % lupine fiber)
Table 15: Frequency sweep data for the flour mixture in batter cake (5, 10 and 15 % lupine fiber).
Sample
Dynamic parameters (Moduls)
coefficient G′1 Hz
103 Pa
x coefficient G″1 Hz
103 Pa
y tan d *h
103 Pa × s
*G
103 PaWF 1.27 0.284 0.53 0.225 0.42 0.19 1.38
L. Fibre 5 % 1.41 0.280 0.49 0.212 0.35 0.22 1.49
L. Fibre 10 % 1.89 0.226 0.63 0.195 0.34 0.29 1.99
L. Fibre 15 % 2.23 0.233 0.81 0.189 0.36 0.34 2.37
Results and discussion
77
The presented data indicate that increase of oscillation frequency within the range from 0.1
to 50 Hz caused an increase in the values of the dynamic moduli – the storage modulus and the
loss modulus. Whereas, the values of the tangent of the phase angle, being the ratio of G"/ G',
decreased gently while the oscillation frequency increased from 0.1 to approximately 5 Hz ,
while higher frequencies caused an increase of those values then decrease again at 30 Hz. These
results mean that the capacity of wheat dough for dissipation (whose measure is the value of G")
and storage (whose measure is the value of G') of the energy used for its deformation increases
with increase in the oscillation frequency (f).
Comparing the values of parameter a in the models of G' and G" (Figure 28) one can see
that at the lowest oscillation frequency (f = 0.1 Hz) the storage module for wheat flour dough
with no additions (0 %) were almost three fold higher than the loss module.
Such a notable domination of the storage modulus over the loss modulus indicates that
wheat dough is a highly structured material and behaves like a viscoelastic body in which the
elastic properties (G') clearly dominate over the viscous properties (G"), which is in agreement
with earlier studies (Letang et al., 1999).
6.3.3. Temperature sweep measurements (TSM)At constant amplitude of 10-3, as well as constant frequency of 1 Hz, the temperature was
heating rates of 1 K/min changed. This heating rate was chosen to free gradient in the sample and
secures processes taking place such as denaturation of proteins, pre-and gelatinization of starch
and to be able to detect the mobilization of the water clear. Should sweep through the temperature
the baking properties of wheat flour, lupine (flour or fiber) dough or batter and preparations are
comparatively simulated.
The evaluation of each TSM measurements were made using the criteria:
1. Measurement of G' and G" curves and tan δ as a function of temperature.
2. Analysis of the tan δ curve shape as a phase transition indicator.
3. Identification of the hysteresis of the tan δ curve when heated.
6.3.3.1. Wheat and lupine flour doughFigure (29) presents the changes of G' and G" with temperature for wheat flour and lupine
flour dough between 15 and 90 °C.

Results and discussion
78
103
104
105
106
Pa
G'
G''
10 15 20 25 30 35 40 45 50 55 60 65 70 75 80 85 90 95°CTemperature T
WF
G'
G''
LF 5%
G'
G''
LF 10%
G'
G''
LF 15%
G'
G''
LF
G'
G''
0.1
0.15
0.2
0.25
0.3
0.35
0.4
0.45
0.5
tan(d)
10 15 20 25 30 35 40 45 50 55 60 65 70 75 80 85 90 95°CTemperature T
WF
tan(d)
LF 5%
tan(d)
LF 10%
tan(d)
LF 15%
tan(d)
LF
tan(d)
Figure 29: Temperature sweep the flour mixture in dough (5, 10 and 15 % lupine flour).

Results and discussion
79
Table 16: Temperature sweep the flour mixture in dough (5, 10 and 15 % lupine flour).
Sample
DynamicalParameters
Temperatur °C
I II III
15 25 35 45 55 60 65 75 85 90
WF
G′ 104 Pa 2.45 1.61 1.20 0.87 1.06 2.02 4.81 14.4 9.69 7.58
G″ 104 Pa 0.94 0.57 0.40 0.32 0.37 0.65 1.38 2.23 1.09 0.76
tan d 0.38 0.35 0.36 0.37 0,35 0,32 0.29 0.16 0.11 0.10
*h 104 Pa ×s 0.42 0.27 0.19 0.15 0.18 0.34 0.79 2.32 1.55 1.21
*G 104 Pa 2.63 1.71 1.17 0.93 1.12 2.12 5.01 14.6 9.75 7.62
LF 5 %
G′ 104 Pa 2.50 1.63 1.15 0.94 1.08 1.66 3.05 12.9 9.79 7.73
G″ 104 Pa 1.01 0.59 0.42 0.34 0.36 0.52 0.91 2.26 1.21 0.88
tan d 0.40 0.37 0.37 0.37 0.34 0.32 0.30 0.18 0.12 0.11
*h 104 Pa ×s 0.43 0.28 0.19 0.16 0.18 0.28 0.51 2.09 1.57 1.24
*G 104 Pa 2.69 1.74 1.22 0.99 1.14 1.74 3.19 13.1 9.87 7.78
LF 10 %
G′ 104 Pa 1.72 1.19 0.91 0.82 0.95 1.32 2.02 11.7 10.3 8.75
G″ 104 Pa 0.76 0.49 0.37 0.32 0.34 0.43 0.63 2.23 1.26 0.93
tan d 0.45 0.41 0.40 0.39 0.35 0.33 0.31 0.19 0.12 0.11
*h 104 Pa ×s 0.29 0.21 0.16 0.14 0.16 0.22 0.34 1.90 1.66 1.40
*G 104 Pa 1.88 1.28 0.98 0.88 1.01 1.39 2.11 11.9 10.4 8.79
LF 15 %
G′ 104 Pa 1.24 0.96 0.78 0.71 0.76 0.93 1.42 9.87 8.57 7.10
G″ 104 Pa 0.57 0.41 0.32 0.28 0.28 0.32 0.44 1.88 1.03 0.75
tan d 0.46 0.43 0.42 0.40 0.36 0.34 0.31 0.19 0.12 0.10
*h 104 Pa ×s 0.22 0.17 0.13 0.12 0.13 0.16 0.23 1.60 1.37 1.13
*G 104 Pa 1.36 1.05 0.84 0.77 0.81 0.98 1.48 10.1 8.63 7.14
LF
G′ 104 Pa 5.50 5.67 4.94 4.60 4.34 4.32 4.31 4.14 3.90 3.68
G″ 104 Pa 1.84 1.62 1.27 1.11 1.01 0.96 0.94 0.79 0.67 0.61
tan d 0.33 0.29 0.26 0.24 0.23 0.22 0.22 0.19 0.17 0.17
*h 104 Pa ×s 0.92 0.94 0.81 0.75 0.71 0.71 0.70 0.67 0.63 0.59
*G 104 Pa 5.80 5.89 5.10 4.73 4.45 4.43 4.41 4.22 3.96 3.74
Results and discussion
80
The results in Figure (29) and Table (16) demonstrated that the blend-dough’s curves
showed similar tendency behaviour of wheat flour dough (return to dominant wheat flour
proportion). The reason was the great difference of lupine dough curves which exhibited another
behaviour (singularity behaviour). There were significant difference between composite flour
dough themselves, in range below 55 °C and above 75 °C the storage and loss modulus decreased
with increase lupine flour concentration. But in between, these two ranges the module increased
which was attributed to the difference in the gelatinization temperature of the starch during
heating and the variation in hydration behaviour of two proteins, wheat and lupine. The
interaction between the different compounds (protein and starch) of wheat and lupine flour play
important role in the differentiation of the level of dynamical modules.
6.3.3.2. Wheat and lupine fiber doughFigure (30) presents the changes of G' and G" depended on temperature for wheat flour and
lupine fiber dough in the range 15 and 90 °C.
The results in figure (30) and Table (17) demonstrated that the blend-dough’s curves
showed similar tendency behaviour of wheat flour dough (return to dominant wheat flour
proportion).
Despite similar behavior of the dough blends due to the dominante of the wheat flour
component, the measured curves of the dynamic module run at a higher level compared to wheat
flour dough and show clear distinct solid state properties. The curves of mixtures with 15 %
located on the highest level and have double more of G″ module than the wheat flour dough. A
comparison of material scientific parameters is given in table 17.

Results and discussion
81
103
104
105
106
Pa
G'
G''
10 15 20 25 30 35 40 45 50 55 60 65 70 75 80 85 90 95°CTemperature T
Temperatur sweep
WF
G'
G''
L.Fibre 5%
G'
G''
L.Fibre 10%
G'
G''
L.Fibre 15%
G'
G''
0.1
0.12
0.14
0.16
0.18
0.2
0.22
0.24
0.26
0.28
0.3
0.32
0.34
0.36
0.38
0.4
tan(d)
10 15 20 25 30 35 40 45 50 55 60 65 70 75 80 85 90 95°CTemperature T
WF
tan(d)
L.Fibre 5%
tan(d)
L.Fibre 10%
tan(d)
L.Fibre 15%
tan(d)
Figure 30: Temperature sweep the flour mixture in dough (5, 10 and 15 % lupine fiber).
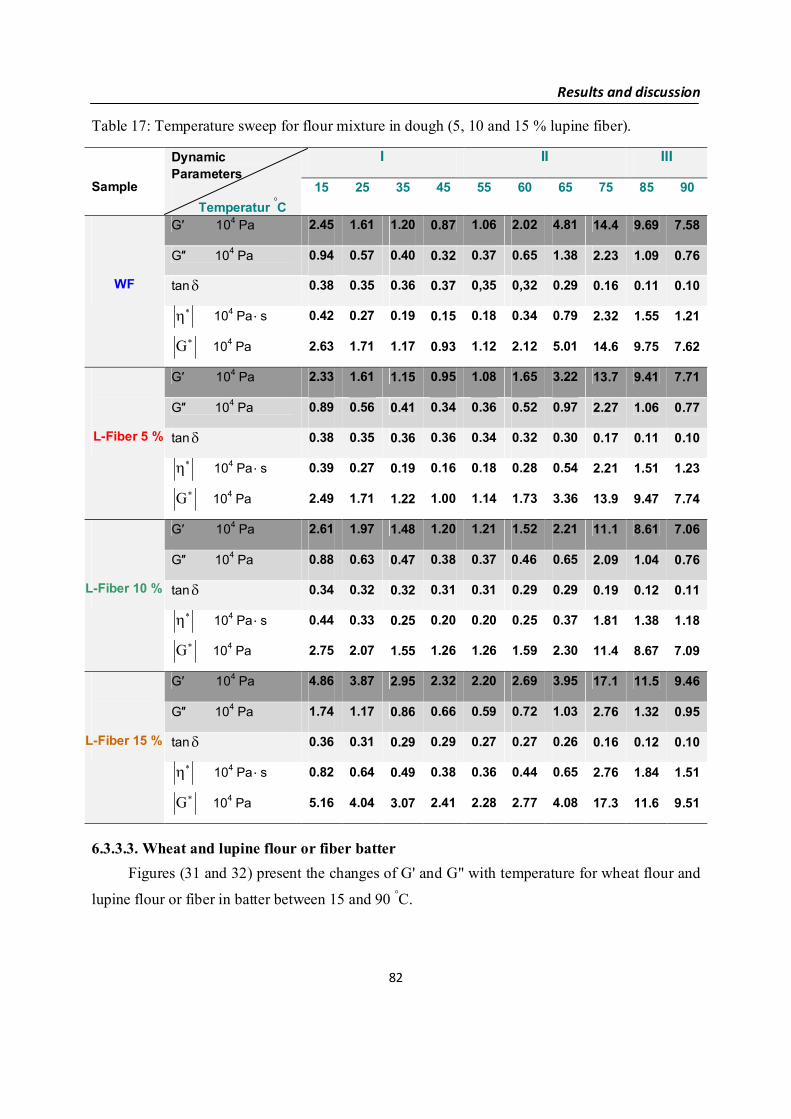
Results and discussion
82
Table 17: Temperature sweep for flour mixture in dough (5, 10 and 15 % lupine fiber).
Sample
DynamicParameters
Temperatur °C
I II III
15 25 35 45 55 60 65 75 85 90
WF
G′ 104 Pa 2.45 1.61 1.20 0.87 1.06 2.02 4.81 14.4 9.69 7.58
G″ 104 Pa 0.94 0.57 0.40 0.32 0.37 0.65 1.38 2.23 1.09 0.76
tan d 0.38 0.35 0.36 0.37 0,35 0,32 0.29 0.16 0.11 0.10
*h 104 Pa × s 0.42 0.27 0.19 0.15 0.18 0.34 0.79 2.32 1.55 1.21
*G 104 Pa 2.63 1.71 1.17 0.93 1.12 2.12 5.01 14.6 9.75 7.62
L-Fiber 5 %
G′ 104 Pa 2.33 1.61 1.15 0.95 1.08 1.65 3.22 13.7 9.41 7.71
G″ 104 Pa 0.89 0.56 0.41 0.34 0.36 0.52 0.97 2.27 1.06 0.77
tan d 0.38 0.35 0.36 0.36 0.34 0.32 0.30 0.17 0.11 0.10
*h 104 Pa × s 0.39 0.27 0.19 0.16 0.18 0.28 0.54 2.21 1.51 1.23
*G 104 Pa 2.49 1.71 1.22 1.00 1.14 1.73 3.36 13.9 9.47 7.74
L-Fiber 10 %
G′ 104 Pa 2.61 1.97 1.48 1.20 1.21 1.52 2.21 11.1 8.61 7.06
G″ 104 Pa 0.88 0.63 0.47 0.38 0.37 0.46 0.65 2.09 1.04 0.76
tan d 0.34 0.32 0.32 0.31 0.31 0.29 0.29 0.19 0.12 0.11
*h 104 Pa × s 0.44 0.33 0.25 0.20 0.20 0.25 0.37 1.81 1.38 1.18
*G 104 Pa 2.75 2.07 1.55 1.26 1.26 1.59 2.30 11.4 8.67 7.09
L-Fiber 15 %
G′ 104 Pa 4.86 3.87 2.95 2.32 2.20 2.69 3.95 17.1 11.5 9.46
G″ 104 Pa 1.74 1.17 0.86 0.66 0.59 0.72 1.03 2.76 1.32 0.95
tan d 0.36 0.31 0.29 0.29 0.27 0.27 0.26 0.16 0.12 0.10
*h 104 Pa × s 0.82 0.64 0.49 0.38 0.36 0.44 0.65 2.76 1.84 1.51
*G 104 Pa 5.16 4.04 3.07 2.41 2.28 2.77 4.08 17.3 11.6 9.51
6.3.3.3. Wheat and lupine flour or fiber batterFigures (31 and 32) present the changes of G' and G" with temperature for wheat flour and
lupine flour or fiber in batter between 15 and 90 °C.

Results and discussion
83
101
102
103
104
105
Pa
G'
G''
20 30 40 50 60 70 80 90 100°CTemperature T
WF. Cake
G'
G''
LF. Cake 5%
G'
G''
LF. Cake 10%
G'
G''
LF. Cake 15%
G'
G''
0
0.2
0.4
0.6
0.8
1
1.2
1.4
1.6
1.8
2
tan(d)
20 30 40 50 60 70 80 90 100°CTemperature T
WF. Cake
tan(d )
LF. Cake 5%
tan(d )
LF. Cake 10%
tan(d )
LF. Cake 15%
tan(d )
Figure 31: Temperature sweep for flour mixture in dough (5, 10 and 15 % lupine flour).

Results and discussion
84
101
102
103
104
105
Pa
G'
G''
100
101
20 30 40 50 60 70 80 90 100°CTemperature T
WF. Cake
G'
G''
L. Fibre. Cake 5%
G'
G''
L. Fibre. Cake 10%
G'
G''
L. Fibre. Cake 15%
G'
G''
0
0.2
0.4
0.6
0.8
1
1.2
1.4
1.6
1.8
2
tan(d)
20 30 40 50 60 70 80 90 100°CTemperature T
WF. Cake
tan(d )
L. Fibre. Cake 5%
tan(d )
L. Fibre. Cake 10%
tan(d )
L. Fibre. Cake 15%
tan(d )
Figure 32: Temperature sweep the flour mixture in dough (5, 10 and 15 % lupine fiber).
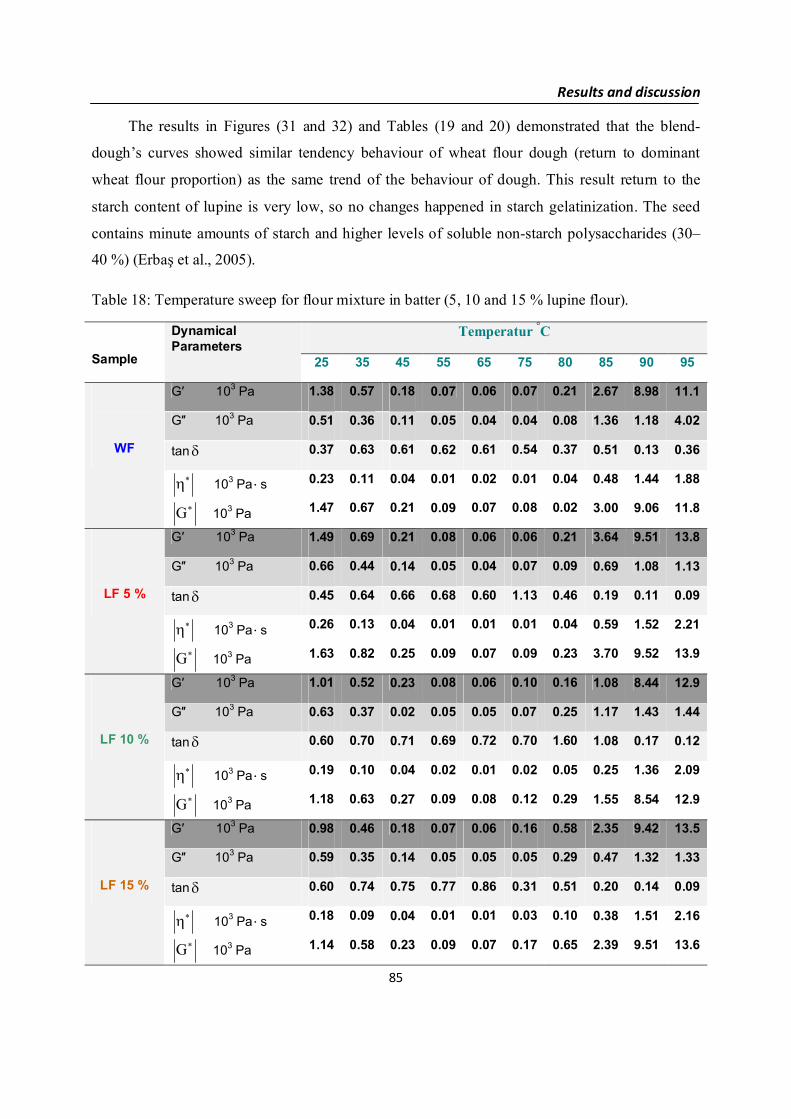
Results and discussion
85
The results in Figures (31 and 32) and Tables (19 and 20) demonstrated that the blend-
dough’s curves showed similar tendency behaviour of wheat flour dough (return to dominant
wheat flour proportion) as the same trend of the behaviour of dough. This result return to the
starch content of lupine is very low, so no changes happened in starch gelatinization. The seed
contains minute amounts of starch and higher levels of soluble non-starch polysaccharides (30–
40 %) (Erbaş et al., 2005).
Table 18: Temperature sweep for flour mixture in batter (5, 10 and 15 % lupine flour).
Sample
DynamicalParameters
Temperatur °C
25 35 45 55 65 75 80 85 90 95
WF
G′ 103 Pa 1.38 0.57 0.18 0.07 0.06 0.07 0.21 2.67 8.98 11.1
G″ 103 Pa 0.51 0.36 0.11 0.05 0.04 0.04 0.08 1.36 1.18 4.02
tan d 0.37 0.63 0.61 0.62 0.61 0.54 0.37 0.51 0.13 0.36
*h 103 Pa × s 0.23 0.11 0.04 0.01 0.02 0.01 0.04 0.48 1.44 1.88
*G 103 Pa 1.47 0.67 0.21 0.09 0.07 0.08 0.02 3.00 9.06 11.8
LF 5 %
G′ 103 Pa 1.49 0.69 0.21 0.08 0.06 0.06 0.21 3.64 9.51 13.8
G″ 103 Pa 0.66 0.44 0.14 0.05 0.04 0.07 0.09 0.69 1.08 1.13
tan d 0.45 0.64 0.66 0.68 0.60 1.13 0.46 0.19 0.11 0.09
*h 103 Pa × s 0.26 0.13 0.04 0.01 0.01 0.01 0.04 0.59 1.52 2.21
*G 103 Pa 1.63 0.82 0.25 0.09 0.07 0.09 0.23 3.70 9.52 13.9
LF 10 %
G′ 103 Pa 1.01 0.52 0.23 0.08 0.06 0.10 0.16 1.08 8.44 12.9
G″ 103 Pa 0.63 0.37 0.02 0.05 0.05 0.07 0.25 1.17 1.43 1.44
tan d 0.60 0.70 0.71 0.69 0.72 0.70 1.60 1.08 0.17 0.12
*h 103 Pa × s 0.19 0.10 0.04 0.02 0.01 0.02 0.05 0.25 1.36 2.09
*G 103 Pa 1.18 0.63 0.27 0.09 0.08 0.12 0.29 1.55 8.54 12.9
LF 15 %
G′ 103 Pa 0.98 0.46 0.18 0.07 0.06 0.16 0.58 2.35 9.42 13.5
G″ 103 Pa 0.59 0.35 0.14 0.05 0.05 0.05 0.29 0.47 1.32 1.33
tan d 0.60 0.74 0.75 0.77 0.86 0.31 0.51 0.20 0.14 0.09
*h 103 Pa × s 0.18 0.09 0.04 0.01 0.01 0.03 0.10 0.38 1.51 2.16
*G 103 Pa 1.14 0.58 0.23 0.09 0.07 0.17 0.65 2.39 9.51 13.6

Results and discussion
86
This fiber is predominantly nonstarch polysaccharide in the form of thickened cell walls ofthe lupine seed endosperm, with some residual protein. Although it is primarily insoluble innature, the nonstarch polysaccharide component has paradoxically been described as a “pectin-like” rhamnogalacturonan (Evans et al., 1993). Lupine kernel fiber has been described as apowder that is pale in color, low in odor and flavor, and suitable for use as a ‘nonintrusive’ fiberingredient in foods such as baked goods and meat products (Johnson and Gray, 1993).
Table 19: Temperature sweep an flour mixture in batter (5, 10 and 15 % lupine fiber).
Sample
DynamicalParameters
Temperatur °C
25 35 45 55 65 75 80 85 90 95
WF
G′ 103 Pa 1.38 0.57 0.18 0.07 0.06 0.07 0.21 2.67 8.98 11.1
G″ 103 Pa 0.51 0.36 0.11 0.05 0.04 0.04 0.08 1.36 1.18 4.02
tan d 0.37 0.63 0.61 0.62 0.61 0.54 0.37 0.51 0.13 0.36
*h 103 Pa × s 0.23 0.11 0.04 0.01 0.02 0.01 0.04 0.48 1.44 1.88
*G 103 Pa 1.47 0.67 0.21 0.09 0.07 0.08 0.02 3.00 9.06 11.8
L. Fibre 5 %
G′ 103 Pa 0.91 0.47 0.18 0.06 0.05 0.07 0.11 1.29 7.02 10.7
G″ 103 Pa 0.59 0.35 0.10 0.05 0.04 0.03 0.10 0.33 1.21 2.06
tan d 0.65 0.74 0.59 0.75 0.70 0.49 0.86 0.26 0.17 0.19
*h 103 Pa × s 0.17 0.09 0.03 0.01 0.01 0.01 0.02 0.21 1.13 1.73
*G 103 Pa 1.09 0.58 0.20 0.08 0.07 0.08 0.15 1.33 7.12 10.9
L. Fibre 10 %
G′ 103 Pa 1.00 0.53 0.22 0.08 0.06 0.09 0.15 1.07 8.41 12.9
G″ 103 Pa 0.61 0.37 0.02 0.05 0.05 0.07 0.24 1.16 1.42 1.48
tan d 0.61 0.70 0.71 0.69 0.72 0.70 1.60 1.08 0.17 0.12
*h 103 Pa × s 0.19 0.10 0.04 0.02 0.01 0.02 0.05 0.25 1.36 2.06
*G 103 Pa 1.17 0.64 0.27 0.09 0.08 0.12 0.29 1.58 8.53 13.0
L. Fibre15 %
G′ 103 Pa 0.97 0.52 0.21 0.08 0.06 0.11 0.23 1.73 9.42 13.4
G″ 103 Pa 0.65 0.39 0.16 0.06 0.04 0.06 0.20 0.46 2.72 1.80
tan d 0.70 0.76 0.73 0.70 0.71 0.53 0.89 0.26 0.29 0.14
*h 103 Pa × s 0.18 0.10 0.04 0.02 0.01 0.02 0.05 0.28 1.56 2.15
*G 103 Pa 1.14 0.65 0.27 0.09 0.07 0.12 0.30 1.78 9.80 13.5
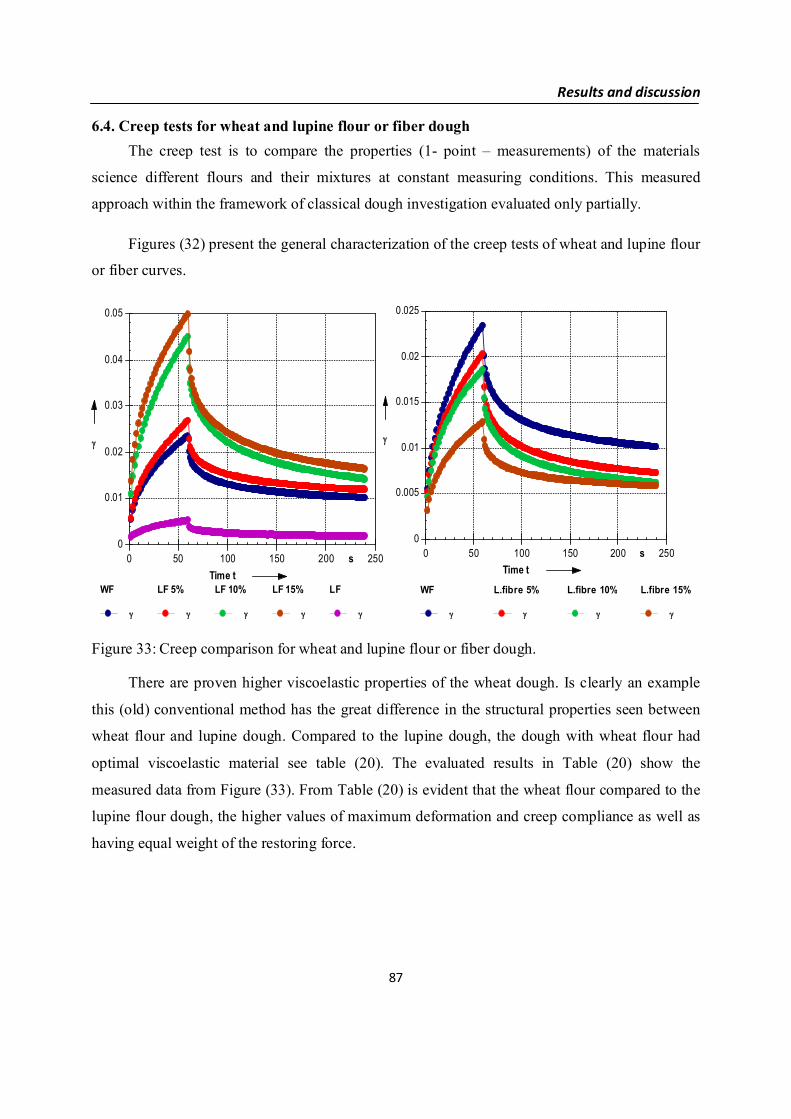
Results and discussion
87
6.4. Creep tests for wheat and lupine flour or fiber doughThe creep test is to compare the properties (1- point – measurements) of the materials
science different flours and their mixtures at constant measuring conditions. This measured
approach within the framework of classical dough investigation evaluated only partially.
Figures (32) present the general characterization of the creep tests of wheat and lupine flour
or fiber curves.
0
0.01
0.02
0.03
0.04
0.05
g
0 50 100 150 200 250sTime t
0
0.005
0.01
0.015
0.02
0.025
g
0 50 100 150 200 250sTime t
WF
g
LF 5%
g
LF 10%
g
LF 15%
g
LF
g
WF
g
L.fibre 5%
g
L.fibre 10%
g
L.fibre 15%
g
Figure 33: Creep comparison for wheat and lupine flour or fiber dough.
There are proven higher viscoelastic properties of the wheat dough. Is clearly an example
this (old) conventional method has the great difference in the structural properties seen between
wheat flour and lupine dough. Compared to the lupine dough, the dough with wheat flour had
optimal viscoelastic material see table (20). The evaluated results in Table (20) show the
measured data from Figure (33). From Table (20) is evident that the wheat flour compared to the
lupine flour dough, the higher values of maximum deformation and creep compliance as well as
having equal weight of the restoring force.

Results and discussion
88
Table 20: Creep comparison for wheat and lupine flour or fiber dough.
Probe
Rheological parameters
eJ
10-5 Pa-1
3g&
10-4 s-1
eg
10-2
vg
10-2
maxg
10-2
eg / maxg
%
0h
Pa ×s
0G
Pa
l
s
WF 2.65 2.07 2.24 1.01 3.25 68.99 242170 3779 64
LF 5 % 2.97 2.43 1.49 1.18 2.67 55.74 205540 3373 61
LF 10 % 6.19 3.81 3.08 1.42 4.49 68.46 131290 1616 81
LF 15 % 6.72 9.97 3.35 1.64 4.98 67.14 130740 1489 89
LF 0.68 1.03 0.34 0.17 0.52 66.25 141900 14140 97
L. Fibre 5 % 2.61 4.06 1.31 0.73 2.03 64.29 292880 3831 76
L. Fibre 10 % 2.47 3.71 1.24 0.62 1,85 66,83 362600 4044 89
L. Fibre 15 % 1.38 2.56 0.69 0.58 1,28 54.55 510390 7229 71
Zero shear viscosity and shear modulus show minima, which for better flow properties of the
dough suggesting. The greater of zero shear viscosity and the shear modulus, the lower of the
fluidity of the dough (tendency for stiffness) was found. The elastic deformation units of wheat
flour dough almost twice as large compared to the viscous friction. With increasing concentration
of lupine flour in the dough system (flour mixtures) increases the maximum deformation and elastic
recovery (from 1.01 to 1.64) when lupine flour was add at 15 %. While, with increasing of lupine
fiber concentration in the dough system (flour mixtures), decreases the maximum deformation
and elastic recovery (from 1.01 to 0.58) when lupine fiber was add at 15 %. Although,
deterioration of the stractural development has been demonstrated in the dough system after the
addition of lupine flour to wheat flour, showed the blends by the dominance of wheat flour
allowable processing properties.
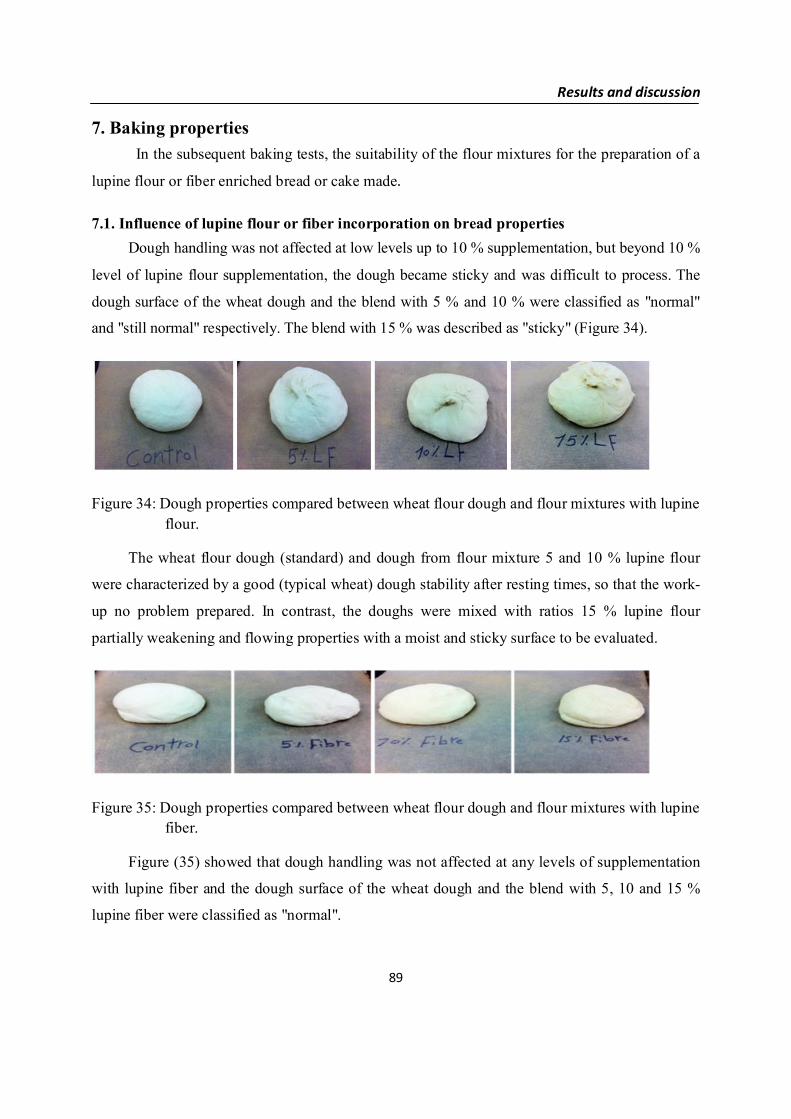
Results and discussion
89
7. Baking properties In the subsequent baking tests, the suitability of the flour mixtures for the preparation of a
lupine flour or fiber enriched bread or cake made.
7.1. Influence of lupine flour or fiber incorporation on bread propertiesDough handling was not affected at low levels up to 10 % supplementation, but beyond 10 %
level of lupine flour supplementation, the dough became sticky and was difficult to process. The
dough surface of the wheat dough and the blend with 5 % and 10 % were classified as "normal"
and "still normal" respectively. The blend with 15 % was described as "sticky" (Figure 34).
Figure 34: Dough properties compared between wheat flour dough and flour mixtures with lupineflour.
The wheat flour dough (standard) and dough from flour mixture 5 and 10 % lupine flour
were characterized by a good (typical wheat) dough stability after resting times, so that the work-
up no problem prepared. In contrast, the doughs were mixed with ratios 15 % lupine flour
partially weakening and flowing properties with a moist and sticky surface to be evaluated.
Figure 35: Dough properties compared between wheat flour dough and flour mixtures with lupinefiber.
Figure (35) showed that dough handling was not affected at any levels of supplementation
with lupine fiber and the dough surface of the wheat dough and the blend with 5, 10 and 15 %
lupine fiber were classified as "normal".

Results and discussion
90
The effect of the lupine flour or fiber incorporation on the fresh bread characteristics is
summarized in tables (22,23). The volume of the control bread sample was significantly higher
than that of samples incorporating lupine flour or fiber (p < 0.05). This effect is probably related
to the decreased visco-elasticity of dough resulting from lupine addition (Table 20). As the level
of lupine or fiber supplementation increased (5–15 %), the loaf volume of the corresponding
fortified breads gradually decreased.
Table 21: Loaf characteristics of wheat flour and lupine flour or fiber composite flours.
Sample Loaf heightcm
Loaf weightg
Loaf volumecm³
Specific volumecm³/g
WF 9.5 ± 0.73 470.8 ± 23 1900 ± 54 4.04 ± 0.4
LF 5 % 9.0 ± 0.23 486.7 ± 25 1860 ± 65 3.82 ± 0.52
LF 10 % 8.5 ± 0.13 493.9 ± 15 1800 ± 71 3.64 ± 0.32
LF 15 % 8.0 ± 0.95 496.5 ± 6 1775 ± 62 3.58 ± 0.21
L-fiber 5 % 9.3 ± 0.54 496.9 ± 12 1755 ± 26 3.53 ± 0.12
L-fiber 10 % 9.0 ± 0.56 503.6 ± 15 1700 ± 48 3.38 ± 0.13
L-fiber 15 % 8.5 ± 0.34 508.5 ± 18 1680 ± 38 3.3 ± 0.18
Mean ± standard deviation of mean.
Doxastakis et al., (2002) reported a decrease in bread volume with increasing levels of
lupine or soy flour and attributed this decrease to the dilution of the wheat gluten by the legume
protein.
It appears, therefore, that the decrease in bread volume resulting from lupine flour or fiber
addition is most likely due to the combined effects of gluten dilution and mechanical disruption
of the gluten network structure by the lupine particles. In addition, examination of the loaf
internal structure revealed that the crumb of the lupine flour or fiber containing bread contained a
small number of gas cells compared to the control (Figure 36).
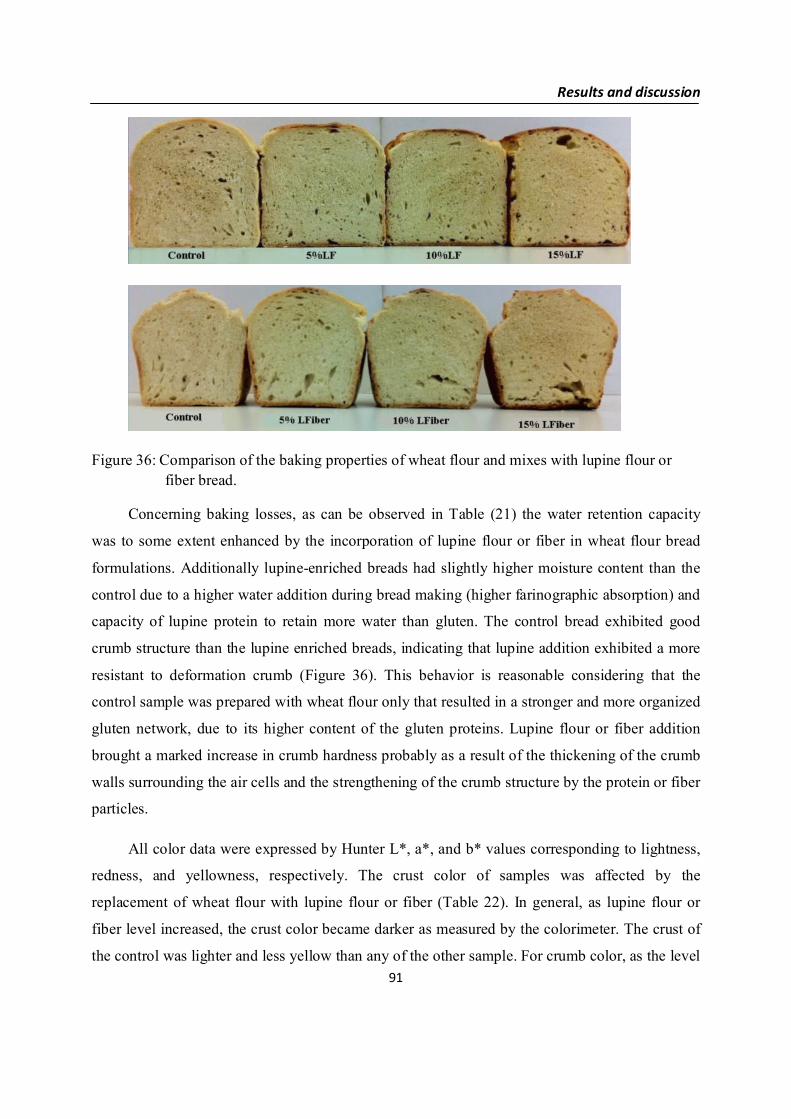
Results and discussion
91
Figure 36: Comparison of the baking properties of wheat flour and mixes with lupine flour orfiber bread.
Concerning baking losses, as can be observed in Table (21) the water retention capacity
was to some extent enhanced by the incorporation of lupine flour or fiber in wheat flour bread
formulations. Additionally lupine-enriched breads had slightly higher moisture content than the
control due to a higher water addition during bread making (higher farinographic absorption) and
capacity of lupine protein to retain more water than gluten. The control bread exhibited good
crumb structure than the lupine enriched breads, indicating that lupine addition exhibited a more
resistant to deformation crumb (Figure 36). This behavior is reasonable considering that the
control sample was prepared with wheat flour only that resulted in a stronger and more organized
gluten network, due to its higher content of the gluten proteins. Lupine flour or fiber addition
brought a marked increase in crumb hardness probably as a result of the thickening of the crumb
walls surrounding the air cells and the strengthening of the crumb structure by the protein or fiber
particles.
All color data were expressed by Hunter L*, a*, and b* values corresponding to lightness,
redness, and yellowness, respectively. The crust color of samples was affected by the
replacement of wheat flour with lupine flour or fiber (Table 22). In general, as lupine flour or
fiber level increased, the crust color became darker as measured by the colorimeter. The crust of
the control was lighter and less yellow than any of the other sample. For crumb color, as the level
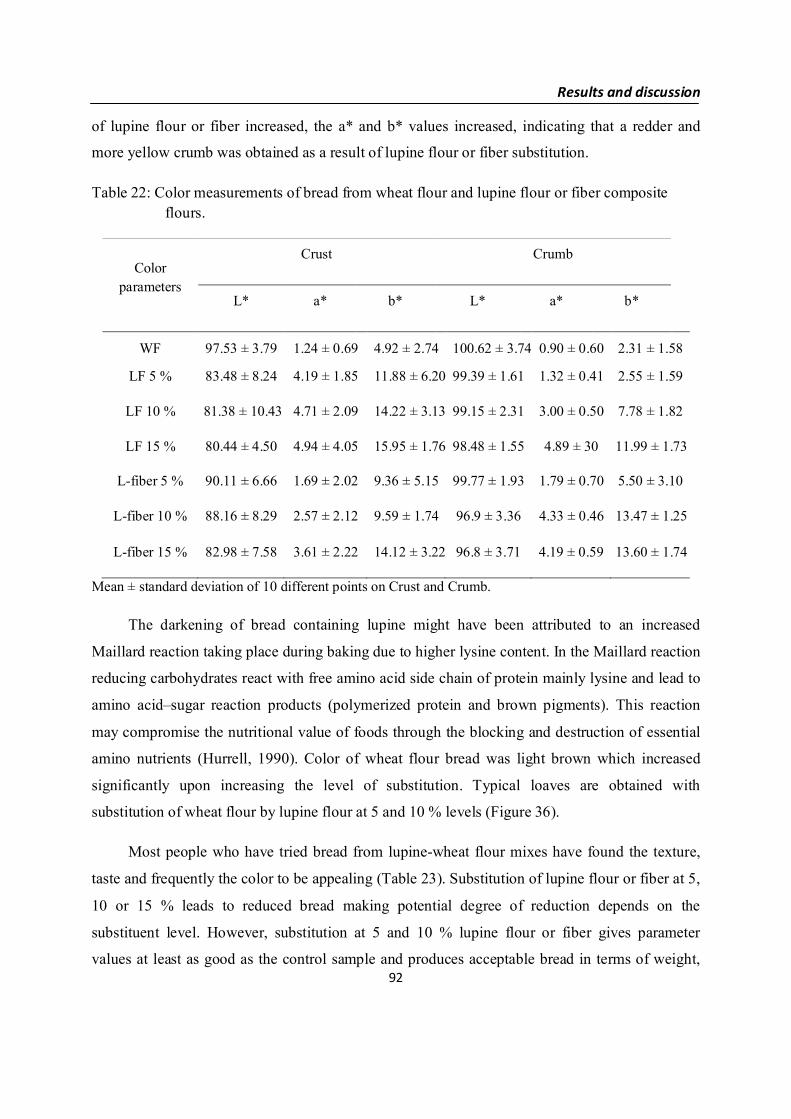
Results and discussion
92
of lupine flour or fiber increased, the a* and b* values increased, indicating that a redder and
more yellow crumb was obtained as a result of lupine flour or fiber substitution.
Table 22: Color measurements of bread from wheat flour and lupine flour or fiber compositeflours.
Colorparameters
Crust Crumb
L* a* b* L* a* b*
WF 97.53 ± 3.79 1.24 ± 0.69 4.92 ± 2.74 100.62 ± 3.74 0.90 ± 0.60 2.31 ± 1.58
LF 5 % 83.48 ± 8.24 4.19 ± 1.85 11.88 ± 6.20 99.39 ± 1.61 1.32 ± 0.41 2.55 ± 1.59
LF 10 % 81.38 ± 10.43 4.71 ± 2.09 14.22 ± 3.13 99.15 ± 2.31 3.00 ± 0.50 7.78 ± 1.82
LF 15 % 80.44 ± 4.50 4.94 ± 4.05 15.95 ± 1.76 98.48 ± 1.55 4.89 ± 30 11.99 ± 1.73
L-fiber 5 % 90.11 ± 6.66 1.69 ± 2.02 9.36 ± 5.15 99.77 ± 1.93 1.79 ± 0.70 5.50 ± 3.10
L-fiber 10 % 88.16 ± 8.29 2.57 ± 2.12 9.59 ± 1.74 96.9 ± 3.36 4.33 ± 0.46 13.47 ± 1.25
L-fiber 15 % 82.98 ± 7.58 3.61 ± 2.22 14.12 ± 3.22 96.8 ± 3.71 4.19 ± 0.59 13.60 ± 1.74
Mean ± standard deviation of 10 different points on Crust and Crumb.
The darkening of bread containing lupine might have been attributed to an increased
Maillard reaction taking place during baking due to higher lysine content. In the Maillard reaction
reducing carbohydrates react with free amino acid side chain of protein mainly lysine and lead to
amino acid–sugar reaction products (polymerized protein and brown pigments). This reaction
may compromise the nutritional value of foods through the blocking and destruction of essential
amino nutrients (Hurrell, 1990). Color of wheat flour bread was light brown which increased
significantly upon increasing the level of substitution. Typical loaves are obtained with
substitution of wheat flour by lupine flour at 5 and 10 % levels (Figure 36).
Most people who have tried bread from lupine-wheat flour mixes have found the texture,
taste and frequently the color to be appealing (Table 23). Substitution of lupine flour or fiber at 5,
10 or 15 % leads to reduced bread making potential degree of reduction depends on the
substituent level. However, substitution at 5 and 10 % lupine flour or fiber gives parameter
values at least as good as the control sample and produces acceptable bread in terms of weight,

Results and discussion
93
volume, crumb structure and color. The blend with <10 % shows a substantial decrease in all
values measured. There appears to be a potential market for lupine flour or fiber in bread making.
Table 23: Sensory evaluation of bread from wheat flour and lupine flour or fiber compositeflours.
Sample AppearanceCrumbtexture
Crumbgrain
Crustcolor
Taste OdorOverall
acceptability
WF 8.3 ± 1.42 8.4 ± 1.65 8.2 ± 1.03 8.3 ± 1.49 8.3 ± 0.95 8.7 ± 1.16 8.4 ± 1.35
LF 5 % 8.5 ± 1.08 8.7 ± 1.57 8.0 ± 1.15 8.3 ± 1.42 8.5 ± 1.18 8.7 ± 1.16 8.3 ± 1.06
LF 10 % 8.0 ± 0.94 7.6 ± 1.84 7.9 ± 1.29 8.2 ± 1.14 8.0 ± 1.15 8.6 ± 1.26 8.1 ± 1.29
LF 15 % 7.1 ± 2.08 7.2 ± 1.48 6.6 ± 2.32 7.8 ± 1.81 7.8 ± 1.48 8.2 ± 1.48 7.9 ± 1.45
L-fiber 5 % 8.2 ± 1.14 8.1 ± 1.29 7.2 ± 1.75 8.5 ± 1.51 7.7 ± 1.49 8.2 ± 0.92 7.7 ± 1.70
L-fiber 10 % 7.8 ± 1.23 7.8 ± 1.40 6.4 ± 1.84 7.9 ± 1.73 7.6 ± 1.43 7.8 ± 1.40 7.6 ± 1.17
L-fiber 15 % 7.1 ± 1.91 7.1 ± 1.97 6.0 ± 2.31 7.8 ± 1.75 7.6 ± 1.26 7.8 ± 1.03 7.1 ± 1.52
Mean ± standard deviation of ten panelists
7.2. Influence of lupine flour or fiber incorporation on cake propertiesAccording to Table (24), cake volume diminished as the lupine flour or fiber percentage
increased. During the baking process, baking powder generates gases, which should be retained
in order to guarantee good cake volume, and in that respect flour quality has an important role to
play. Another important factor is the gelatinization temperature of the flour, as Howard, (1972),
pointed out for layer cakes, whereas Mizukoshi et al., (1980) reached the same conclusion for
sponge cakes. The starch gelatinization at low temperatures would prevent the correct expansion
of doughs.

Results and discussion
94
Table 24: Cake characteristics of wheat flour and lupine flour or fiber composite flours.
Sample Cake heightcm
Cake weightg
Cake volumecm³
Specific volumecm³/g
WF 7.5 ± 0.53 265.1 ± 13 660 ± 56 2.49 ± 0.6
LF 5 % 7.0 ± 0.33 265.2 ± 38 670 ± 46 2.53 ± 0.45
LF 10 % 6.5 ± 0.23 264.5 ± 11 690 ± 68 2.61 ± 0.27
LF 15 % 6.0 ± 0.65 269.2 ± 8 700 ± 57 2.60 ± 0.30
L-fiber 5 % 7.3 ± 0.44 281.7 ± 10 665 ± 32 2.36 ± 0.16
L-fiber 10 % 7.0 ± 0.64 272.8 ± 17 700 ± 51 2.56 ± 0.19
L-fiber 15 % 6.5 ± 0.48 264.3 ± 13 740 ± 24 2.80 ± 0.14
Mean ± standard deviation of mean.
Lupine flour also presented higher protein content, and different amino acid composition
than wheat flours which could affect cake characteristics, especially volume (Mohamed and
Hamid, 1998). As far as lupine derivatives are concerned, flour and fiber gave cakes with higher
volume. Cake elaborated with lupine fiber had higher volume than those elaborated with lupine
flours. This fact can be explained by the higher fibre content of lupine fiber and its effect on
pasting behavior of starches (Sasaki et al., 2000). There is no effect of the low starch content.
The volume index is an indicator of cake volume and, as expected, followed a similar
tendency as volume. Symmetry indicates the differences in height between the central zone and the
lateral zone. Thus, a high symmetry suggests that cakes mainly rise in their central part, while a
negative symmetry indicates that cake volume falls down at the end of the baking process. Hence,
symmetry gives an idea about gas retention in the final baking phase. In both cases the
incorporation of lupine flour or fiber at different levels had no effect on cake symmetry (Figure 37).
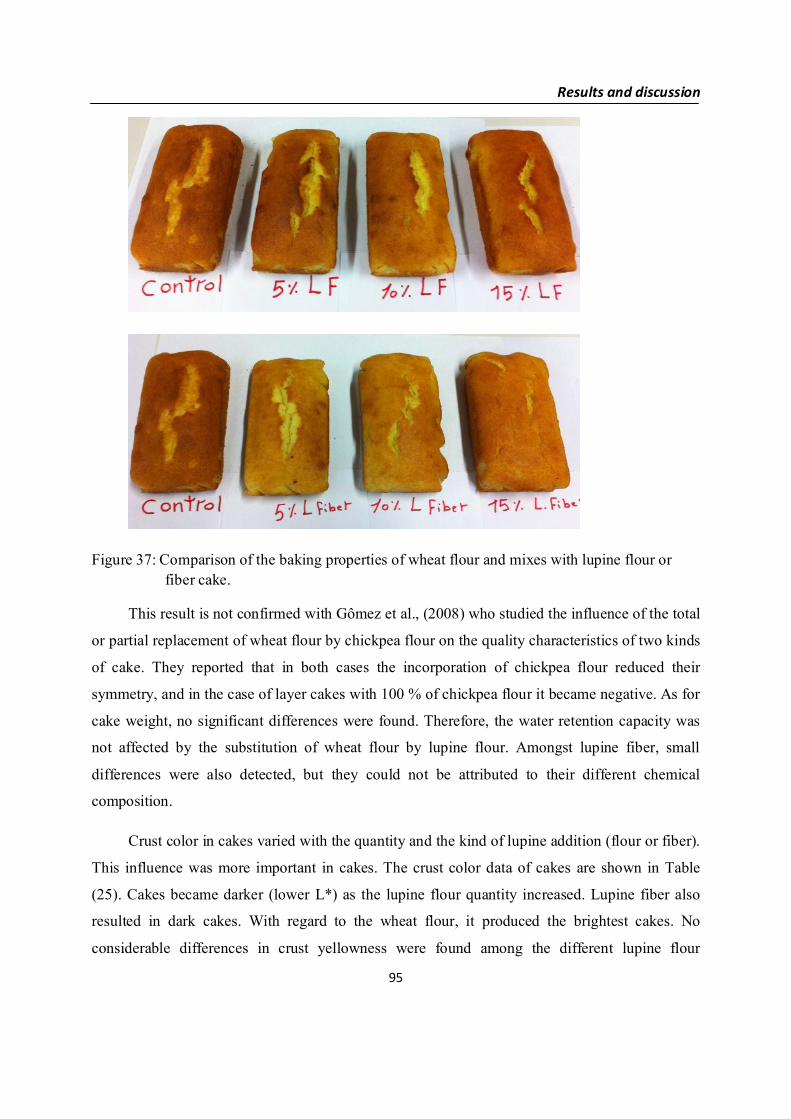
Results and discussion
95
Figure 37: Comparison of the baking properties of wheat flour and mixes with lupine flour orfiber cake.
This result is not confirmed with Gômez et al., (2008) who studied the influence of the total
or partial replacement of wheat flour by chickpea flour on the quality characteristics of two kinds
of cake. They reported that in both cases the incorporation of chickpea flour reduced their
symmetry, and in the case of layer cakes with 100 % of chickpea flour it became negative. As for
cake weight, no significant differences were found. Therefore, the water retention capacity was
not affected by the substitution of wheat flour by lupine flour. Amongst lupine fiber, small
differences were also detected, but they could not be attributed to their different chemical
composition.
Crust color in cakes varied with the quantity and the kind of lupine addition (flour or fiber).
This influence was more important in cakes. The crust color data of cakes are shown in Table
(25). Cakes became darker (lower L*) as the lupine flour quantity increased. Lupine fiber also
resulted in dark cakes. With regard to the wheat flour, it produced the brightest cakes. No
considerable differences in crust yellowness were found among the different lupine flour

Results and discussion
96
samples, while lupine fiber samples exhibited lower b values than the respective lupine flour
samples and all lupine flour or fiber gave higher b values than the control (wheat flour). The
crust color of cakes was generated in the baking process due to the Maillard reactions between
sugars and amino acids, and the caramelization process of sugars. Therefore, the differences
observed when the quantity of lupine flour increased could be attributed to the high protein
content and the different amino acid composition of the composite flours compared to the wheat
flour.
Table 25: Color measurements of cake from wheat flour and lupine flour or fiber compositeflours.
Colorparameters
Crust Crumb
L* a* b* L* a* b*
WF 97.53 ± 3.79 1.24 ± 0.69 4.92 ± 2.74 100.62 ± 3.74 0.90 ± 0.60 2.31 ± 1.58
LF 5 % 83.48 ± 8.24 4.19 ± 1.85 11.88 ± 6.20 99.39 ± 1.61 1.32 ± 0.41 2.55 ± 1.59
LF 10 % 81.38 ± 10.43 4.71 ± 2.09 14.22 ± 3.13 99.15 ± 2.31 3.00 ± 0.50 7.78 ± 1.82
LF 15 % 80.44 ± 4.50 4.94 ± 4.05 15.95 ± 1.76 98.48 ± 1.55 4.89 ± 30 11.99 ± 1.73
L-fiber 5 % 90.11 ± 6.66 1.69 ± 2.02 9.36 ± 5.15 99.77 ± 1.93 1.79 ± 0.70 5.50 ± 3.10
L-fiber 10 % 88.16 ± 8.29 2.57 ± 2.12 9.59 ± 1.74 96.9 ± 3.36 4.33 ± 0.46 13.47 ± 1.25
L-fiber 15 % 82.98 ± 7.58 3.61 ± 2.22 14.12 ± 3.22 96.8 ± 3.71 4.19 ± 0.59 13.60 ± 1.74
Mean ± standard deviation of 10 different points on Crust and Crumb.
Cake crumb does not reach temperatures above 100 ºC, so the Maillard or caramelization
reactions by sugars fail to take place. Therefore, crumb color must be the result of the raw
materials colors and their interactions. The crumb color data of cakes are shown in Table (25) and
Figure (38). Cake crumb of lupine flour samples were lightly darker than control, and the lupine
flour addition reduced its luminosity, but this effect was not significant. Differences between
lupine flour and lupine fiber were observed. This effect was expected because of the more intense
yellow color of lupine flour. These results agree with those obtained by Dodok et al., (1993), who
observed that chickpea flour triggered the change in the crumb color when they studied the
addition of chickpea flour to bread doughs.

Results and discussion
97
Figure 38: Crumb color of wheat flour and mixes with lupine flour or fiber cake.
Sensory evaluation results of fortified cake with lupine flour or fiber are presented in Table
(26). It was found that cake which was fortified with different levels of lupine flour had non
significant difference in taste, odour and overall acceptability as compared to unfortified cake
(control).
Table 26: Sensory evaluation of cake from wheat flour and lupine flour or fiber composite flours.
Sample AppearanceCrumbtexture
Crumbgrain
Crustcolor Taste Odor
Overallacceptability
WF 7.9 ± 1.5 7.9 ± 1.5 7.1 ± 1.6 7.6 ± 1.8 7.7 ± 2.1 8.1 ± 1.9 8.2 ± 1.3
LF 5 % 7.7 ± 2.0 8.1 ± 1.1 7.9 ± 0.9 8.3 ± 1.6 7.8 ± 1.8 8.2 ± 1.6 8.1 ± 1.5
LF 10 % 8.0 ± 1.4 8.0 ± 1.5 8.3 ± 0.9 8.1 ± 1.5 7.4 ± 2.2 7.9 ± 1.8 8.1 ± 1.2
LF 15 % 8.6 ± 1.3 7.7 ± 2.1 8.9 ± 1.5 8.7 ± 1.3 8.2 ± 2.0 8.2 ± 1.1 8.7 ± 1.3
L-fiber 5 % 7.6 ± 1.9 8.3 ± 0.9 7.4 ± 1.7 7.7 ± 1.8 8.0 ± 2.2 8.4 ± 0.9 8.4 ± 1.4
L-fiber 10 % 6.8 ± 2.1 8.3 ± 1.6 7.9 ± 1.4 7.7 ± 1.8 8.1 ± 2.3 8.2 ± 0.7 8.1 ± 0.9
L-fiber 15 % 6.4 ± 3.1 7.0 ± 1.5 8.3 ± 1.2 8.0 ± 2.1 7.2 ± 2.6 7.8 ± 1.6 7.7 ± 1.0
Mean ± standard deviation of ten panelists

Results and discussion
98
Lupine fiber cakes at 15 % had lower scores for appearance and crumb texture. In addition,
the quality characteristics were acceptable at 5, 10 and 15 % for lupine flour and 5, 10 % lupine
fiber. It is evident from this data, that addition of lupine fiber more than 10 % caused gradually
decreased in sensory characteristics scores. From the above results, it can be concluded that cake
can be fortified with lupine flour (5, 10 and 15 %) and lupine fiber (5 and 10 %). The present
results came in agreement with Sabanis et al., (2006) who reported that, organoleptic properties
(colour, flavour and overall acceptability) improved with a low proportion of chickpea flour,
especially for 5 % w/w substitution. Alabi and Anuonye, (2007) indicated that up to 50 % of
some legume products could be added without significant loss in palatability.
8. Biological evaluation of lupine flour (LF) and lupine fiber (L-fiber)
8.1. Body weight and Food intake As shown in Table (27) it was found that gain in body weight was 63.9 g for negative
control, while it was decreased for the positive diabetic one to be 34.3 g and the reduction in
body weight was 46.3 %. Diabetic rats fed on neither lupine flour nor fiber showed similar results
as normal control, and there were significant difference.
Abdel-Salam and Abdel-Megeid, (1998), reported that alloxan injection caused a
significant decrease in average body weight in rats and there was a decrease in body weight in
groups treated with raw and blanched lupine. These results were in agreement with the present
results. But Newairy et al., (2002) showed that diabetic rats which treated with lupine showed an
increase of their body weight as compared with the diabetic group.
Food intake\day decrease in alloxan diabetic fed on 5, 10 and 15 % lupine fiber (12.3, 11.5
and 10.4 g/day respectively, compared to negative control 13.2 g/day. Slightly decrease was
found in diabetic group fed on 15 % lupine flour and 5 % lupine fiber.
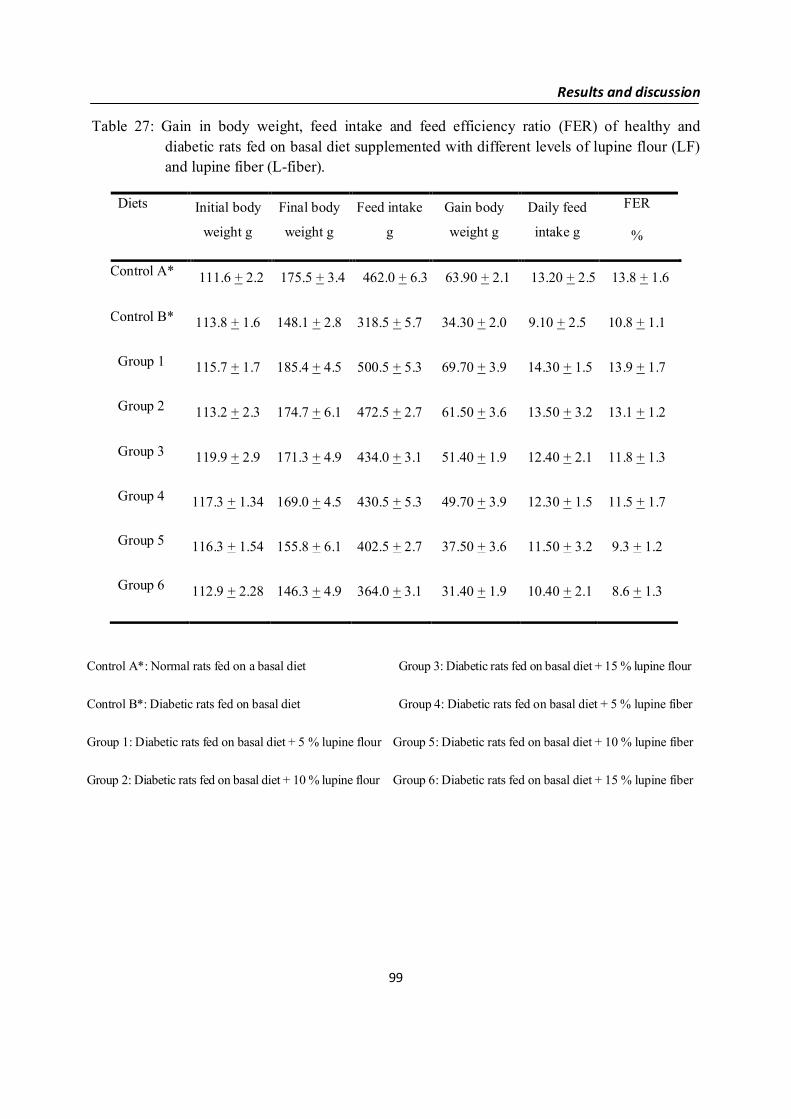
Results and discussion
99
Table 27: Gain in body weight, feed intake and feed efficiency ratio (FER) of healthy anddiabetic rats fed on basal diet supplemented with different levels of lupine flour (LF)and lupine fiber (L-fiber).
Diets Initial body
weight g
Final body
weight g
Feed intake
g
Gain body
weight g
Daily feed
intake g
FER
%
Control A* 111.6 + 2.2 175.5 + 3.4 462.0 + 6.3 63.90 + 2.1 13.20 + 2.5 13.8 + 1.6
Control B* 113.8 + 1.6 148.1 + 2.8 318.5 + 5.7 34.30 + 2.0 9.10 + 2.5 10.8 + 1.1
Group 1 115.7 + 1.7 185.4 + 4.5 500.5 + 5.3 69.70 + 3.9 14.30 + 1.5 13.9 + 1.7
Group 2 113.2 + 2.3 174.7 + 6.1 472.5 + 2.7 61.50 + 3.6 13.50 + 3.2 13.1 + 1.2
Group 3 119.9 + 2.9 171.3 + 4.9 434.0 + 3.1 51.40 + 1.9 12.40 + 2.1 11.8 + 1.3
Group 4 117.3 + 1.34 169.0 + 4.5 430.5 + 5.3 49.70 + 3.9 12.30 + 1.5 11.5 + 1.7
Group 5 116.3 + 1.54 155.8 + 6.1 402.5 + 2.7 37.50 + 3.6 11.50 + 3.2 9.3 + 1.2
Group 6 112.9 + 2.28 146.3 + 4.9 364.0 + 3.1 31.40 + 1.9 10.40 + 2.1 8.6 + 1.3
Control A*: Normal rats fed on a basal diet Group 3: Diabetic rats fed on basal diet + 15 % lupine flour
Control B*: Diabetic rats fed on basal diet Group 4: Diabetic rats fed on basal diet + 5 % lupine fiber
Group 1: Diabetic rats fed on basal diet + 5 % lupine flour Group 5: Diabetic rats fed on basal diet + 10 % lupine fiber
Group 2: Diabetic rats fed on basal diet + 10 % lupine flour Group 6: Diabetic rats fed on basal diet + 15 % lupine fiber

Results and discussion
100
8.2. Biochemical analysis
8.2.1. Glucose level
For serum glucose, the present study in Table (28) showed that the levels of serum glucoseof alloxan diabetic group was increased approximately 2 fold (225.20 ± 4.1) compared withnormal control (99.96 ± 0.9). Feeding of alloxan diabetic groups showed significantly reductionin glucose levels by: 25.59 %, 32.37 %, and 31.90 % for lupine flour at 5, 10 and 15 %respectively, 28.36 %, 38.11 % and 47.75 % for lupine fiber at 5, 10 and 15 % respectively ascompared to alloxan diabetic control.
The results were in agreement with finding of Mansour et al., (2002), who found thattreated diabetic rats with 75mg\day\100g body wt. of lupine for 4 weeks reduced the glucoselevels by 59 % as compared to diabetic alloxan rats. Abdel-Salam and Abdel-Megeid, (1998),found that raw and blanched lupine at 5 and 10 % have hypoglycemic effect and blanched lupinehave more effect than raw as compared to diabetic control The hypoglycaemic effect of lupineflour and lupine fiber may be due to the active constituents such as alkaloids, flavonoids, tannins,quinovic acid and its glycocidic derivatives, saponins and triterpenoid saponins (Pollmann et al.,1997). Other phenomenon due to saponins effect have hypoglycaemic activity, which may bedue to the inhibition of hepatic gluconogensis (Kubo et al., 2000).The effect of lupine may be dueto the increase levels of serum insulin (Eskander and Won Jun, 1995), and also may be due to theenhancement of peripheral metabolism of glucose (Skim et al., 1999). The effects of lupine fiberon the diabetic symptoms in streptozotocin induced diabetic rats showed a decreased glucoselevels in urine and lowering plasma glucose (Yamamoto et al., 2000).
8.2.2. Serum cholesterol and total lipids
In diabetes mellitus, hypercholesterolemia is a common complication, which is thought tobe secondary to accumulation of triacylglycerol rich lipoproteins due to impaired activity oflipoprotein lipase (Kingman, 1991).
Table (28) showed that serum total cholesterol and total lipids were significantlyincreased in alloxan diabetic group by 113.97 % and 78.4 % respectively. Hypocholesterolemicand hypolipidemic effect were found in groups fed on lupine flour and lupine fiber. Thesefindings are in accordance with those obtained by some investigators as Newairy et al., (2002)who reported that diabetic rats treated with terms reduced the level of cholesterol and total lipidsas compared to diabetic rats. There is strong evidence in rats to suggest that the solublepolysaccharides present in the hypoglycemic plants were fermented in the colon producing short
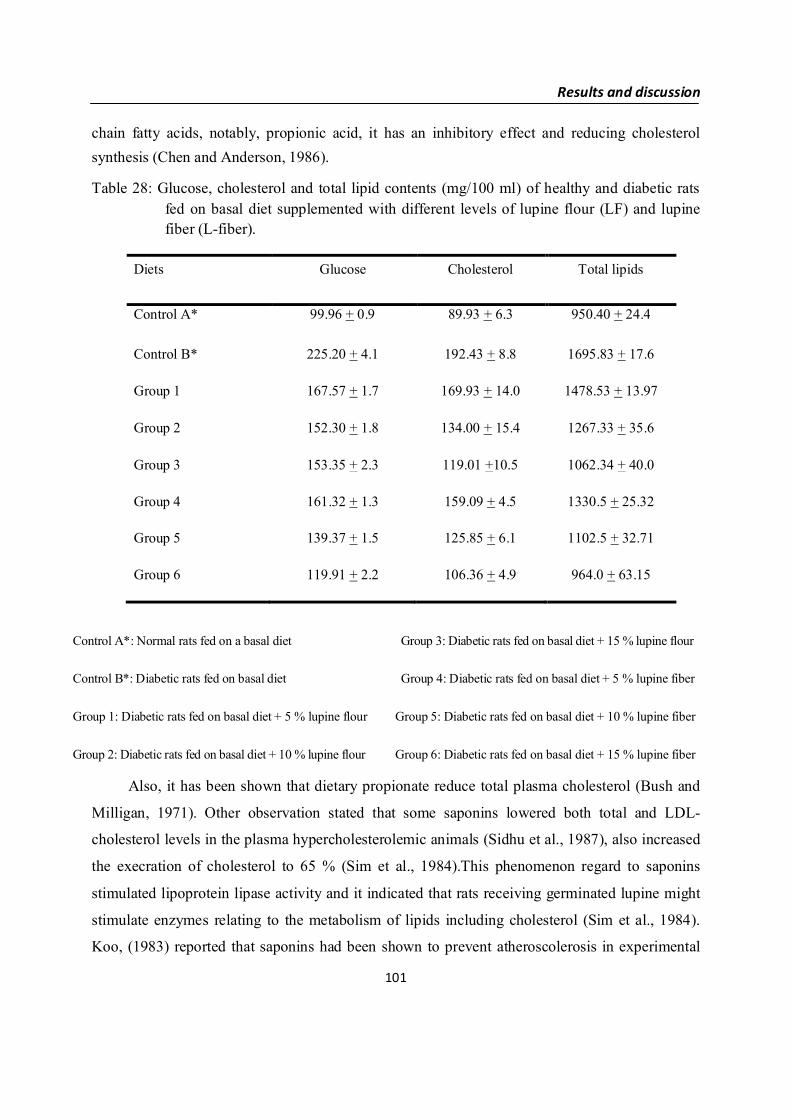
Results and discussion
101
chain fatty acids, notably, propionic acid, it has an inhibitory effect and reducing cholesterolsynthesis (Chen and Anderson, 1986).
Table 28: Glucose, cholesterol and total lipid contents (mg/100 ml) of healthy and diabetic ratsfed on basal diet supplemented with different levels of lupine flour (LF) and lupinefiber (L-fiber).
Diets Glucose Cholesterol Total lipids
Control A* 99.96 + 0.9 89.93 + 6.3 950.40 + 24.4
Control B* 225.20 + 4.1 192.43 + 8.8 1695.83 + 17.6
Group 1 167.57 + 1.7 169.93 + 14.0 1478.53 + 13.97
Group 2 152.30 + 1.8 134.00 + 15.4 1267.33 + 35.6
Group 3 153.35 + 2.3 119.01 +10.5 1062.34 + 40.0
Group 4 161.32 + 1.3 159.09 + 4.5 1330.5 + 25.32
Group 5 139.37 + 1.5 125.85 + 6.1 1102.5 + 32.71
Group 6 119.91 + 2.2 106.36 + 4.9 964.0 + 63.15
Control A*: Normal rats fed on a basal diet Group 3: Diabetic rats fed on basal diet + 15 % lupine flour
Control B*: Diabetic rats fed on basal diet Group 4: Diabetic rats fed on basal diet + 5 % lupine fiber
Group 1: Diabetic rats fed on basal diet + 5 % lupine flour Group 5: Diabetic rats fed on basal diet + 10 % lupine fiber
Group 2: Diabetic rats fed on basal diet + 10 % lupine flour Group 6: Diabetic rats fed on basal diet + 15 % lupine fiber
Also, it has been shown that dietary propionate reduce total plasma cholesterol (Bush and
Milligan, 1971). Other observation stated that some saponins lowered both total and LDL-
cholesterol levels in the plasma hypercholesterolemic animals (Sidhu et al., 1987), also increased
the execration of cholesterol to 65 % (Sim et al., 1984).This phenomenon regard to saponins
stimulated lipoprotein lipase activity and it indicated that rats receiving germinated lupine might
stimulate enzymes relating to the metabolism of lipids including cholesterol (Sim et al., 1984).
Koo, (1983) reported that saponins had been shown to prevent atheroscolerosis in experimental

Results and discussion
102
animals. El Shewey, (2000) indicated that rats receiving germinated lupine had significantly
lowering levels of total cholesterol.
Dike et al., (2001), reported that fermented carob present a significant lowering levels of
cholesterol. Haber, (2002) reported that carob pod fiber can significantly reduce cholesterol
levels especially low density lipoprotein \ cholesterol in hypercholesterolemia people. Zunft et
al., (2001), reported that patients with hypercholesterolemia (total cholesterol (232-302 mg\dl)
consuming 15 g of fiber\day as a supplement to their regular diet, after 4 weeks reduction of
7.1 % and 10 % in mean total cholesterol and LDL cholesterol and after 6 weeks showed 7.8 %
and 12.2 % in both respectively.

Conclusion
103
9. ConclusionThe objectives of this study were to investigate technological and rheological properties,
chemical composition (proteins, lipids, starch, sugars, fiber, ash, amino acids, total phenolic,
flavonoids, flavonols contents) and antioxidant capacity (DPPH and ABTS). The potential use of
different sweet lupine seed derivatives (flour and fiber) at different concentration (5, 10 and 15 %)
for baking applications (bread and cake) and the influence of lupine addition on the rheological
properties (empirical rheology and fundamental) of dough and quality of final products were also
described. Effects of different sweet lupine seed derivatives (flour and fiber) at different
concentration (5, 10 and 15 %) on diabetic rats were also studied.
The lupine flour showed higher levels of moisture, crude protein, ash, crude fat and dietary
fiber than the wheat flour. Conversely, wheat flour showed higher levels of starch. These results
confirmed by statistical analysis, which highly significant differences (P < 0.05) were observed
between the two type of flours. Mean protein and dietary fiber increased with increasing amount
of lupine flour added to be 13.73 ± 0.24, 14.75 ± 0.27, 16.28 ± 0.31 and 4.66 ± 0.27, 6.61 ± 0.43
8.57 ± 0.60 g/100 g for substituting wheat flour with lupine flour at 5, 10 and 15 %, respectively
on dry weight basis. There was no significant difference between wheat flour and supplemented
flour with different concentration of lupine for moisture, ash and fat content.
The lupine fiber showed higher levels ash, crude fat and dietary fiber than the wheat flour.
Conversely, wheat flour showed higher levels of moisture, crude protein and starch. These results
confirmed by statistical analysis, which highly significant differences (P<0.05) were observed
between wheat flour and lupine fiber. Mean dietary fiber increased with increasing amount of
lupine fiber added to be 6.82 ± 0.32, 10.95 ± 0.53 and 15.07 ± 0.75 for substituting wheat flour
with lupine flour at 5, 10 and 15 %, respectively on dry weight basis. There was no significant
difference between wheat flour and supplemented flour with different concentration of lupine
fiber for moisture, ash and fat content.
The results for the amino acid content of wheat flour (WF) and lupine flour (LF) showed
that the essential amino acids (lysine, threonine, isoleucine, phenylalanine and tryptophane) in
lupine flour were higher than those in wheat flour except methionine content which was higher in
wheat flour (1.7 g/kg). From the results we can noticed that lupine flour is rich with arginine and
histidine (36.13 and 5.89 g/kg respectively).

Conclusion
104
The lupine flour showed higher levels of total phenolic and total flavonoids than the wheat
flour. Conversely, wheat flour showed higher levels of total flavonols. These results confirmed
by statistical analysis, which highly significant differences (P < 0.05) were observed between the
two types of flours. Total phenolic and total flavonoids increased with increasing amount of
lupine flour added to be 132.17 ± 0.58,142.5 ± 7.10, 156.53 ± 3.88 (µg GAE/g DW) and 7.67 ±
1.27, 7.93 ± 0.06, 8.4 ± 0.52 (µg QE/g DW) for substituting wheat flour with lupine flour at 5, 10
and 15 %, respectively on dry weight basis. Results clearly indicate that lupine flour exhibited
higher antioxidant activity with DPPH and ABTS than the wheat flour. The antioxidant activity
increased with increasing amount of lupine flour added to be 5.1 ± 0.10, 6.04 ± 0.77, 7.16 ± 0.26
in DPPH and 29.41 ± 0.37, 31.09 ± 0.00, 32.35 ± 0.37 in ABTS respectively, for substituting
wheat flour with lupine flour at 5, 10 and 15 %, respectively on dry weight basis. The same trend
was observed with the antioxidant activity for lupine fiber in DPPH and ABTS tests. After that,
physico-chemical and material science examination were done.
Supplementation of wheat flour with lupine flour or lupine fiber increased the water
required for optimum bread making absorption (p < 0.05) (from 56.1 % for wheat flour to 57.2 %
and 68.5 % for the 30 % lupine flour or lupine fiber respectively). The time required for the
control dough to reach 500 FU consistency was also modified by lupine flour addition. During
this phase of mixing, the water hydrates the flour components and the dough is developed. Dough
development time (DDT) was significantly higher (p < 0.05) for all wheat-lupine flour or fiber
blends than control (2.5 min), also between lupine samples significant difference was observed at
different concentration (p > 0.05). Regarding dough stability, it appears that the dough sample
containing 5 % lupine exhibited higher stability and resistance to mechanical mixing values than
the control, while it decreased as the substitute level increases from 10 % to 15 %.
A rheometer Paar Physica UDS 200 (Physica®, Anton Paar GmbH, Austria Europe) using
a plate–plate system (measure system MP 31) was needed for measuring the rheological
properties of dough samples. In the double logarithmic representation of the deformation-
dependent behavior of the studied dough is pronounced with a dominant LVR solid behavior
(G' > G" or detect loss factor < 1), followed by a decrease of both moduli and an increase in the
loss factor with structural break (tan δ = 1). The overall structure and macro-structure is
experiencing a "break down", will be completely destroyed. A sub-structure is not available. The
destruction of deformation γz with G' = G" is located at wheat flour-dough at 0.6, with 0.5 lupine

Conclusion
105
flour dough. The shape of the curves shows a linear viscoelastic behavior in the area of 10-4 ≤ γ ≤ 10-3.
The results of ossillation tests showed that the moduli (G', G" and G*) with increasing lupine
flour content in the mixtures in comparison to the wheat flour with a deformation of γ = 10-3
decreased slightly. A stable dough structure in hibernation is determined based on the dominance
of the wheat flour in the blends. The addition of lupine fiber caused a shift of curves G' and G"
towards higher values, while curve tan δ moved towards lower values. The data indicate that the
additions applied caused an increase in wheat flour dough elasticity (G') and viscosity (G").
In the double logarithmic representation of the deformation-dependent behavior of the studied
batter is pronounced with a dominant LVR behavior (G' > G" or detect loss factor < 1), followed by a
decrease of both module and an increase in the loss factor with structural break (tan δ = 1). The shape
of the curves shows a linear viscoelastic behavior in the area of 10-4 ≤ γ ≤ 10-3. Made for the
implementation of the frequency sweep defining the boundary of the LVR with γ = 10-3. Compared
to the wheat flour batter should be noted that despite the higher protein content, the higher level
structure and the relatively larger particulation at lupine-batter quickly leads to a structural
instability of the batter, recognizable by the curve of tan δ. By all doughs, the curves of G' and G"
run nearly parallel in frequency sweep and G' was greater than G". This indicates the distinctive
solid state characteristics of all changes. The dough promoted dispersion and net-gel-like
structure.
Dough handling was not affected at low levels up to 10 % supplementation, but beyond 10 %
level of lupine flour supplementation, the dough became sticky and was difficult to process. The
dough surface of the wheat dough and the blend with 5 % and 10 % were classified as "normal"
and "still normal" respectively. The blend with 15 % was described as "sticky". While, the dough
surface of the wheat dough and the blend with 5, 10 and 15 % lupine fiber were classified as
"normal". Particle system, no gel-like system special relations, depended on concentration and
temperature.
The volume of the control bread sample was significantly higher than that of samples
incorporating lupine flour or fiber (p < 0.05). This effect is probably related to the decreased
elasticity of dough resulting from lupine addition.

Conclusion
106
The crust color of samples was affected by the replacement of wheat flour with lupine flour
or fiber. In general, as lupine flour or fiber level increased, the crust color became darker as
measured by the colorimeter.
Substitution of lupine flour or fiber at 5, 10 or 15 % leads to reduced bread making potential
degree of reduction depends on the substituent level. However, substitution at 5 and 10 % lupine
flour or fiber gives parameter values at least as good as the control sample and produces
acceptable bread in terms of weight, volume, crumb structure and color. Also, it was found that
cake which was fortified with different levels of lupine flour had non significant difference in
taste, odour and overall acceptability as compared to unfortified cake (control).
At last, the feeding of alloxan diabetic rats groups showed significantly reduction in
glucose levels by: 25.59 %, 32.37 %, and 31.90 % for lupine flour at 5, 10 and 15 % respectively,
28.36 %, 38.11 % and 47.75 % for lupine fiber at 5, 10 and 15 % respectively as compared to
alloxan diabetic control. Hypocholesterolemic and hypolipidemic effect were found in groups fed
on lupine flour and lupine fiber.
Finally, it can be conclude that lupine flour or fiber can be used successfully as
hypoglycemic agents in bakery products. This could be utilized for the development of composite
blends from locally produced lupine at small scale industry level as value-add products.

References
107
10. ReferencesAACC (1983). Cereal Laboratory Methods, Method 46-09. American Association of Cereal
Chemists, (Am. Assoc. Cereal Chem., St. Paul, MN), 7th Ed.
Abboud, A. M., Hoseney, R. C., and Rubenthaler, G. L. (1985). Factors affecting cookie flour
quality. Cereal Chem 62, 130-133.
Abdel-Salam, S. M. M., and Abdel-Megeid, A. A. (1998). Biological studies on some legumes as
hypoglycemic and hypercholesterolemic agents. In "Scientific Conference of Home
Economics", pp. 11-12. Helwan University, Faculty of Home Econimics.
Ablett, S., Attenburrow, G. E., and Lillford, P. J. (1985). The Significance of Water in the Baking
Process. In "Chemistry and Physics of Baking (Materials, Processes and Products)" (J. M.
V. Blanshard, P.J. Frazier and T. Galliard, ed.), pp. 30-41. Royal Society of Chemistry,
University of Nottingham, UK.
Aguilera, J. M., and Trier, A. (1978). The revival of lupin. Food Technology 32, 70-78.
AHC (2009). Australian Health Info Center. http//www.users.unimi.it/health+p/bulletin-EN.pdf.
Ahmad, I., Anjum, F. M., and Butt, M. S. (2001). Quality characteristics of wheat varieties grown
in Pakistan from 1933-1996. Pak. J. Food Sci. 11, 1-4.
Alabi, M. O., and Anuonye, J. C. (2007). Nutritional and sensory attributes of soy-supplemented
cereal meals. Nigerian Food J. 25, 100-110.
Alsmeyer, R. H., Cunningham, A. E., and Happich, M. L. (1974). Equations predict PER from
amino acid analysis. Food Technology 28, 34-40.
Amarowicz, R. (2007). Tannins: the new natural antioxidants? European Journal of Lipid
Science and Technology 109, 549-551.
Amarowicz, R., Estrella, I., Hernandez, T., and Troszynska, A. (2008). Antioxidant activity of
extract of adzuki bean and its fractions. Journal of Food Lipids 15, 119-136.
Amarowicz, R., Pisku, M., Honke, J., Rudnicka, B., Troszynska, A., and Kozowska, H. (1995).
"Extraction of phenolic compounds from lentil seeds (Lens culinaris) with various
solvents," Institute of Animal Reproduction, Olsztyn, Pologne.
Amemiyaa, J. I., and Menjivar, J. A. (1992). Comparison of small and large deformation
measurements to characterize the rheology of wheat flour doughs. Journal of Food
Engineering 16, 91-108.
Anderson, J. W., and Major, A. W. (2002). Pulses and lipaemia, short- and long-term effect:
potential in the prevention of cardiovascular disease. Br J Nutr 88 S263-71.

References
108
Anderson, S. (1994). Large Rotor High Speed Hammermills: Beyond Screen Size. Feed
Management 45, 20-22.
Angioloni, A., and Rosa, M. D. (2005). Dough thermo-mechanical properties: influence of
sodium chloride, mixing time and equipment. Journal of Cereal Science 41, 327-331.
AOAC (2002). Association of Official Analytical chemists Official Methods of Analysis. 17th
ed; Washington, USA.
Appel, L. J. (2003). The effects of protein intake on blood pressure and cardiovascular disease.
Curr Opin Lipidol 14, 55-9.
Arabshahi-Delouee, S., and Urooj, A. (2007). Antioxidant properties of various solvent extracts
of mulberry (Morus indica L.) leaves. Food Chemistry 102, 1233-1240.
Arbeeny, C. M., and Bergquist, K. E. (1991). The effect of preparation on serum cholesterol
levels in hypercholesterolemia diabetic. Biochem.Biophys.Acta 1096, 238-244.
ARC (2009). Center of Excellence for Integrative Legume Research.
Archer, B. J., Johnson, S. K., Devereux, H. M., and Baxter, A. L. (2004). Effect of fat
replacement by inulin or lupin-kernel fibre on sausage patty acceptability, post-meal
perceptions of satiety and food intake in men. Br J Nutr 91, 591-9.
Armero, E., and Collar, C. (1998). Crumb Firming Kinetics of Wheat Breads with Anti-staling
Additives. Journal of Cereal Science 28, 165-174.
Asian Productivity Organization (2003). "Processing and Utilization of Legumes," Japan.
Ballester, D., ZacarÍAs, I., GarcÍA, E., and YÁÑEz, E. (1984). Baking Studies and Nutritional
Value of Bread Supplemented with Full-Fat Sweet Lupine Flour (L. albus cv Multolupa).
Journal of Food Science 49, 14-16.
Bloksma, A. H., and Bushuk, W. (1988). Rheology and chemistry of dough. In "Wheat:
Chemistry and Technology" (Y. Pomeranz, ed.), pp. 1-7. AACC International, St. Paul.
Bornet, F. R., Billaux, M. S., and Messing, B. (1997). Glycaemic index concept and metabolic
diseases. Int J Biol Macromol 21, 207-19.
Bourne, M. (2002). Physics and Texture. In "Food Texture and Viscosity: Concept and
Measurement" (M. Bourne, ed.), Vol. 2, pp. 59-106. Academic Press, New York.
Brillouet, J. M., and Riochet, D. (1983). Cell wall polysaccharides and lignin in cotyledons and
hulls of seeds from various lupin (Lupinus L.) species. J. Sci. Food Agric. 34, 861.
Bush, R. S., and Milligan, L. P. (1971). Study of the mechanism of inhibition of kitogensis by
propionate in bovine liver. Can. J. Anim. Sci. 51, 121.

References
109
Bushuk, W. (1998). Interactions in wheat doughs. In "Interactions, the keys to cereal quality." (R.
J. Hamer and R. C. Hoseney, eds.). Am. Assn. Cereal Chem., St. Paul, Minnesota.
Capraro, J., Magni, C., Fontanesi, M., Budelli, A., and Duranti, M. (2008). Application of two-
dimensional electrophoresis to industrial process analysis of proteins in lupin-based pasta.
LWT - Food Science and Technology 41, 1011-1017.
Cauvain, S. (2003). Bread making: an overview. In "Bread making: Improving quality" (Cauvain
SP, ed.), pp. 8-26. CRC Press., Boca Raton.
Chapleau, N., and de Lamballerie-Anton, M. (2003). Improvement of emulsifying properties of
lupin proteins by high pressure induced aggregation. Food Hydrocolloids 17, 273-280.
Chen, W. L., and Anderson, J. W. (1986). Hypercholesterolemic effects of soluble fiber. In
"Dietary Fiber: Basic and Clinical Aspects" (D. Kritchevsky, Vahouny, G.V., ed.), pp.
275. Plenum Press, New York.
Cherry, J. P., Mc Watters, K. H., and Beuchat, L. R. (1979). In "Functionality and protein
structure" (A. Pour-El, ed.), pp. 1-26. ACS Symposium, Am. Chem. Soc Washington DC.
Chiang, S.-H., Chen, C.-S., and Chang, C.-Y. (2006). Effect of wheat flour protein compositions
on the quality of deep-fried gluten balls. Food Chemistry 97, 666-673.
Choung, M.-G., Choi, B.-R., An, Y.-N., Chu, Y.-H., and Cho, Y.-S. (2003). Anthocyanin Profile
of Korean Cultivated Kidney Bean (Phaseolus vulgaris L.). Journal of Agricultural and
Food Chemistry 51, 7040-7043.
Chung, O. K. (1986). Lipid–protein interactions in wheat flour, dough, gluten, and protein
fractions. Cereal Foods Worlds 31, 242-256.
Chung, O. K., Ohm, J. B., Caley, M. S., and Seabourn, B. W. (2001). Prediction of baking
characteristics of hard winter wheat flours using computeranalyzed mixograph
parameters. Cereal Chem 78, 493-497.
Ciesiołka, D., Gulewicz, P., Martinez-Villaluenga, C., Pilarski, R., Bednarczyk, M., and
Gulewicz, K. (2005). Products and biopreparations from alkaloid-rich lupin in animal
nutrition and ecological agriculture. Folia Biologica 53, 59-66.
Clark, R. L., and Johnson, S. K. (2002). Sensory Acceptability of Foods with Added Lupin
(Lupinus angustifolius) Kernel Fiber Using Pre-set Criteria. Journal of Food Science 67,
356-362.
Cornell, H. (2003). Improving Quality. In "Bread Making" (C. SP, ed.). Woodhead Publishing,
Cambridge.
References
110
Corredig, M., and Alexander, M. (2008). Food emulsions studied by DWS: recent advances.
Trends in Food Science & Technology 19, 67-75.
Cowling, W. A., Buirchell, B. J., and Tapia, M. E. (1998). Lupin. Lupinus L. Promoting the
conservation and use of underutilized and neglected crops., Institute of Plant Genetic and
Crop Plant Research, Gatersleben/International Plant Genetic Resources Institute,
Rome,Italy
Cuq, B., Yildiz, E., and Kokini, J. (2002). Influence of mixing conditions and rest time on
capillary flow behaviour of wheat flour dough. Cereal Chem 79, 129-137.
Da Porto, C., Calligaris, S., Celotti, E., and Nicoli, M. C. (2000). Antiradical properties of
commercial cognacs assessed by the DPPH(.) test. J Agric Food Chem 48, 4241-5.
Daglioglu, O., and Gundogdu, S. (1999). Use of full-fat stabilized rice bran in bread making.
Cereal Foods World 7, 74-85.
Davidek, J., Hrdlicka, J., Karvanek, M., Pokorny, J., and Velisek, J. (1981). "Laboratory
handbook for foodstuffs," CR, SNTL-Alfa, Prague.
De Cortes Sánchez, M. a., Altares, P., Pedrosa, M. M., Burbano, C., Cuadrado, C., Goyoaga, C.,
Muzquiz, M., Jiménez-Martı́nez, C., and Dávila-Ortiz, G. (2005). Alkaloid variation
during germination in different lupin species. Food Chemistry 90, 347-355.
De Escalada Pla, M. F., Ponce, N. M., Stortz, C. A., Gerschenson, L. N., and Rojas, A. M.
(2007). Composition and functional properties of enriched fiber products obtained from
pumpkin (Cucurbita moschata Duchesne ex Poiret). LWT - Food Science and Technology
40, 1176-1185.
Dervas, G., Doxastakis, G., Hadjisavva-Zinoviadi, S., and Triantafillakos, N. (1999). Lupin flour
addition to wheat flour doughs and effect on rheological properties. Food Chemistry 66,
67-73.
Diaz-Batalla, L., Widholm, J. M., Fahey, G. C., Castano-Tostado, E., and Paredes-Lopez, O.
(2006). Chemical Components with Health Implications in Wild and Cultivated Mexican
Common Bean Seeds (Phaseolus vulgaris L.). Journal of Agricultural and Food
Chemistry 54, 2045-2052.
Dike, E. N., Magbagbeola, O. A., and Odunfes, A. (2001). Comparative biochemical and
physiological elects of fermented and unfermented soybeans and African locust beans oh
rats. Discovery-and Innovation 13, 234-242.

References
111
Dobraszczyk, B. J., and Morgenstern, M. P. (2003). Rheology and the breadmaking processnext
term. Journal of Cereal Science 38, 229-245.
Dobraszczyk, B. J., and Schofield, J. D. (2002). Rapid assessment and prediction of wheat and
gluten baking quality with the 2-g direct drive mixograph using multivariate statistical
analysis. Cereal Chem 79, 607-612.
Dodok, L., Modhir, A. A., Hozova, B., Halasova, G., and Polacek, I. (1993). Importance and
utilization of chickpea in cereal technology. Acta alimentaria 22, 119-129.
Dorman, H. J. D., Koşar, M., Kahlos, K., Holm, Y., and Hiltunen, R. (2003). Antioxidant
Properties and Composition of Aqueous Extracts from Mentha Species, Hybrids,
Varieties, and Cultivars. Journal of Agricultural and Food Chemistry 51, 4563-4569.
Doxastakis, G., Zafiriadis, I., Irakli, M., and Tananaki, C. (2002). Lupin, soya and triticale
addition to wheat flour doughs and their effect on rheological properties. Food Chemistry
77, 219-227.
Drakos, A., Doxastakis, G., and Kiosseoglou, V. (2007). Functional effects of lupin proteins in
comminuted meat and emulsion gels. Food Chemistry 100, 650-655.
Drzikova, B., Dongowski, G., and Gebhardt, E. (2005). Dietary fibre-rich oat-based products
affect serum lipids, microbiota, formation of short-chain fatty acids and steroids in rats.
Br J Nutr 94, 1012-25.
Duranti, M. (2006). Grain legume proteins and nutraceutical properties. Fitoterapia 77, 67-82.
Edwards, N. M., Mulvaney, S. J., Scanlon, M. G., and Dexter, J. E. (2003). Role of Gluten and Its
Components in Determining Durum Semolina Dough Viscoelastic Properties. Cereal
Chem. 80, 755-763.
Eggum, B. O., and Beame, R. M. (1983). The nutritive value of seed proteins. In "Seed protein
biochemistry, genetics and nutritive value" (W. G. P. H. Muller, ed.), pp. 499–531. The
Hague, Junk.
El-Adawy, T. A., Rahma, E. H., El-Bedawey, A. A., and Gafar, A. F. (2001). Nutritional
potential and functional properties of sweet and bitter lupin seed protein isolates. Food
Chemistry 74, 455-462.
El Maki, H. B., AbdelRahaman, S. M., Idris, W. H., Hassan, A. B., Babiker, E. E., and El Tinay,
A. H. (2007). Content of antinutritional factors and HCl-extractability of minerals from
white bean (Phaseolus vulgaris) cultivars: Influence of soaking and/or cooking. Food
Chemistry 100, 362-368.

References
112
El Shewey, M. A. (2000). Effect of Raw and terminated Fenugreek and lupine an lipid pattern in
hyper-lipidemic albino rats. Home Econ. J 16, 1-18.
Erbaş, M., Certel, M., and Uslu, M. K. (2005). Some chemical properties of white lupin seeds
(Lupinus albus L.). Food Chemistry 89, 341-345.
Eskander, E. F., and Won Jun, H. (1995). Hypoglycaemic and hyperinsulinemic effects of some
Egyptian herbs used for the treatment of Diabetes mellitus (type II) in rats. Egy J Pharm
36, 331-342.
Evans, A. J., Cheung, P. C. K., and Cheetham, N. W. H. (1993). The carbohydrate composition
of cotyledons and hulls of cultivars of Lupinus angustifolius from Western Australia.
Journal of the Science of Food and Agriculture 61, 189-194.
FAO/WHO (2007). "Energy and protein requirements," Rep. No. 935. Nutrition Report Series
No. 935. , Geneva.
Farahnaky, A., and Hill, S. E. (2007). The effect of salt, water and temperature on wheat dough
rheology. Journal of Texture Studies 38, 499-510.
Faridi, H., and Faubion, J. M. (1990). "Dough rheology and baked product texture," Van
Norstrand Reinhold, New York.
Faubion, J. M., and Hoseney, R. C. (1989). The Viscoelastic Properties of wheat Flour Doughs.
In "Dough Rheology and Baked Product Texture" (H. A. Faridi and J. M. Faubion, eds.),
pp. 29-66. Van Nostrand Reinhold, New York, USA.
Favier, J. C., Ripert, J. I., Toque, C., and Feinberg, M. (1995). "Reportoire general des aliments
(composition tables)," 2nd/Ed. Inra Editions, Paris.
Fernandez, M. L., and Berry, J. W. (1989). Rheological properties of flour and sensory
characteristics of bread made from germinated chickpea. International Journal of Food
Science & Technology 24, 103-110.
Foegeding, E. A. (2007). Rheology and sensory texture of biopolymer gels. Current Opinion in
Colloid & Interface Science 12, 242-250.
Frias, J., Miranda, M. L., Doblado, R., and Vidal-Valverde, C. (2005). Effect of germination and
fermentation on the antioxidant vitamin content and antioxidant capacity of Lupinus albus
L. var. Multolupa. Food Chemistry 92, 211-220.
Frings, C. S., and Dunn, R. T. (1970). Colorimetric method for determination of total serum
lipids based on the salphophospho vanillin reaction. Am.J.Clin.Path. 53, 89-91.

References
113
Gômez, M., Oliete, B., Rosell, C. M., Pando, V., and Fernandez, E. (2008). Studies on cake
quality made of wheat_chickpea flour blends. LWT - Food Science and Technology 41,
1701-1709.
Goñi, I., and Martin-Carrón, N. (1998). In vitro fermentation and hydration properties of
commercial dietary fiber-rich supplements. Nutrition Research 18, 1077-1089.
Gorecka, D., Lampart-Szczapa, E., Janitz, W., and Sokolowska, B. (2000). Composition of
fractional and functional properties of dietary fiber of lupines (L. luteus and L. albus).
Nahrung 44, 229-32.
Grabowski, J. A., Truong, V. D., and Daubert, C. R. (2008). Nutritional and rheological
characterization of spray driednext term sweetpotato previous termpowdernext term. LWT
- Food Science and Technology 41, 206-216.
GrainPool (2003). Pool indicator price predictions for the 2002/2003 season – gross per tonne
basis,. The World Wide Wep.
Grigelmo-Miguel, N., Abadias-Seros, M. I., and Martin-Belloso, O. (1999). Characterisation of
low-fat high-dietary fibre frankfurters. Meat Science 52, 247-256.
Guillon, F., and Champ, M. (2000). Structural and physical properties of dietary fibres, and
consequences of processing on human physiology. Food Research International 33, 233-
245.
Guillon, F., and Champ, M. M. (2002). Carbohydrate fractions of legumes: uses in human
nutrition and potential for health. British Journal of Nutrition 88, s293-s306.
Gujral, H. S., and Rosell, C. M. (2004). Modification of pasting properties of wheat starch by
cyclodextrin glycosyltransferase. Journal of the Science of Food and Agriculture 84,
1685-1690.
Gulewicz, P., Martínez-Villaluenga, C., Frias, J., Ciesiołka, D., Gulewicz, K., and Vidal-
Valverde, C. (2008). Effect of germination on the protein fraction composition of
different lupin seeds. Food Chemistry 107, 830-844.
Haber, B. (2002). Carob fiber benefits and applications. Cereal Chem 47, 365-369.
Hall, R. S., Johnson, S. K., Baxter, A. L., and Ball, M. J. (2005). Lupin kernel fibre-enriched
foods beneficially modify serum lipids in men. Eur J Clin Nutr 59, 325-333.
Hareland, G. A. (1994). Evaluation of Flour Particle Size Distribution by Laser Diffraction, Sieve
Analysis and Near-infrared Reflectance Spectroscopy. Journal of Cereal Science 20, 183-
190.

References
114
Heiser, M. (1996). Trade and consumption of legume seeds. In "European Conference on Grain
Legumes" (AEP, ed.), pp. 14-15, Paris, France.
Hewitt, T. E., and pardue, H. L. (1973). Kinetics of the cholesterol sulphuric acid reaction. A fast
kinetic method for serum cholesterol. Clin Chern 19, 1128-1134.
Hodgson, J. M., Burke, V., Beilin, L. J., and Puddey, I. B. (2006). Partial substitution of
carbohydrate intake with protein intake from lean red meat lowers blood pressure in
hypertensive persons. Am J Clin Nutr 83, 780-7.
Hoseney, R. C. (1985). The mixing phenomenon. Cereal Foods World 30, 453-457.
Howard, N. B. (1972). The role of some essential ingredients in the formation of layer cake
structures. Bakers Digest 46, 28-37.
Hruskova, M., and Machova, D. (2002). Changes of wheat flour properties during short term
storage. Czech J. Food Sci. 20, 125-130.
Huang, D., Ou, B., and Prior, R. L. (2005). The chemistry behind antioxidant capacity assays. J
Agric Food Chem 53, 1841-56.
Hugo, L., Rooney, L., and Taylor, J. (2003). Fermented sorghum as a functional ingredient in
composite breads. Cereal Chem 80, 495-499.
Hung, T. V., Papalois, M., Nithianandan, V., Jiang, H. H., and Versteeg, K. (1990). Utilisation of
lupin seeds for human consumption. In "``Food Pacific'' Convention" (AIFST/NZIFST,
ed.). Bond University, Gold Coast.
Hurrell, R. F. (1990). Influence of the Maillard reaction on the nutritional value of foods. In "The
Maillard reaction in food processing, human nutrition and physiology" (H. U. Finot, R. F.
Aeschbacher, R. F. Hurrell and R. Liardon, eds.), pp. 365-371. Basel, Birkhëuser Verlag.
Huyghe, C. (1997). White lupin (Lupinus albus L.). Field Crops Research 53, 147-160.
ICC (2001). ICC Standard Methods. International Association for Cereal Chemistry
http://www.icc.or.at/, Access date 28/5/2011
Isserliyska, D., Karadjov, G., and Angelov, A. (2001). Mineral composition of Bulgarian wheat
bread. European Food Research and Technology 213, 244-245.
Janssen, A. M., van Vliet, T., and Vereijken, J. M. (1996). Rheological Behaviour of Wheat
Glutens at Small and Large Deformations. Comparison of Two Glutens Differing in
Bread Making Potential. Journal of Cereal Science 23, 19-31.
Jimenez-Martinez, C., Hernandez-Sanchez, H., and Davila-Ortiz, G. (2003). "Lupines: An
Alternative for De-bittering and Utilization in Foods," CRC press, LLC, Spain.

References
115
Johnson, S. K., and Gray, D. M. (1993). Ingredients derived from lupin. Strong potential for a
range of dietary fiber applications. Int Food Ingred 5, 18-23.
Joray, M. L., Rayas-Duarte, P., Mohamed, A., and Van Santen, E. (2007). Coated Lupin Bean
Snacks. Journal of Food Quality 30, 267-279.
Kähkönen, M. P., Hopia, A. I., Vuorela, H. J., Rauha, J.-P., Pihlaja, K., Kujala, T. S., and
Heinonen, M. (1999). Antioxidant Activity of Plant Extracts Containing Phenolic
Compounds. Journal of Agricultural and Food Chemistry 47, 3954-3962.
Kent, N. L., and Evers, A. D. (1994). "Technology of Cereals," 4th/Ed. Pergamon Press, Oxford.
Khatkar, B. S., Fido, R. J., Tatham, A. S., and Schofield, J. D. (2002). Functional Properties of
Wheat Gliadins. II. Effects on Dynamic Rheological Properties of Wheat Gluten. Journal
of Cereal Science 35, 307-313.
Kilborn, R. H., Black, H. C., Dexter, J. E., and Martin, D. G. (1982). Energy consumption during
flour milling : description of two measuring systems and the influence of wheat hardness
on energy requirements. Cereal Chem 59, 284-288.
Kingman, S. M. (1991). The influence of legume seeds on human plasma lipid concentrations.
Nutr Res Rev 4, 97-123.
Kirmizi, S., and Guleryuz, G. (2007). Monitoring Protein Mobilization During Seed Germination
of Broad Bean (Vicia faba L.) Asian Journal of Plant Sciences 6, 374.
Kokelaar, J. J. (1994). Physics of breadmaking, University of Wageningen, The Netherlands.
Koo, J. H. (1983). The effect of ginseng saponine on the development of experimental
atherosclerosis. Hanyang Uidae Haksulchi 3, 273.
Kosar, M., Dorman, H. J., Can Baser, K. H., and Hiltunen, R. (2004). Screening of free radical
scavenging compounds in water extracts of Mentha samples using a postcolumn
derivatization method. J Agric Food Chem 52, 5004-10.
Kubo, H., Kobayashi, J., Higashiyama, K., Kamei, J., Fujii, Y., and Ohmiya, S. (2000). The
hypoglycemic effect of (7R*,9aS*)-7-phenyl-octahydroquinolizin-2-one in mice. Biol
Pharm Bull 23, 1114-7.
Kuktaite, R. (2004). Protein quality in wheat: Changes in protein polymer composition during
grain development and dough Processing, Swedish University of Agricultural Sciences,
Alnarp.
Kulp, K. (1988). Bread industry and processes. In "Wheat Chemistry and Technology" (Y.
Pomeranz, ed.), pp. 639-682. Am. Assoc. Cereal Chem., St. Paul, MN.

References
116
Kumaran, A., and Joel Karunakaran, R. (2007). In vitro antioxidant activities of methanol
extracts of five Phyllanthus species from India. LWT - Food Science and Technology 40,
344-352.
Kunzek, H., Opel, H., and Senge, B. (1997). Rheological examination of material with cellular
structure. Zeitschrift für Lebensmittel-Untersuchung-Forschung 20, 193-203.
Kurzbaum, A., Safori, G., Monir, M., and Simsolo, C. (2008). anticholinergic syndrome in
response to lupin seed toxicity. Israeli Journal of Emergency Medicine 8, 20-22.
Kyle, A. S. W. (1994). The current and potential uses of lupins for human food. In "Proc. First
Austr. Lupin Techn" (J. P. M. Dracup, ed.), pp. 89-97. Symp, Perth.
Lacana (1999). Lupin Flour: an Ingredient for Human Food, France.
Lamacchia, C., Chillo, S., Lamparelli, S., Suriano, N., La Notte, E., and Del Nobile, M. A.
(2010). Amaranth, quinoa and oat doughs: Mechanical and rheological behaviour,
polymeric protein size distribution and extractability. Journal of Food Engineering 96,
97-106.
Lampart-Szczapa, E., Korczak, J., Nogala-Kalucka, M., and Zawirska-Wojtasiak, R. (2003a).
Antioxidant properties of lupin seed products. Food Chemistry 83, 279-285.
Lampart-Szczapa, E., Obuchowski, W., Czaczyk, K., Pastuszewska, B., and Buraczewska, L.
(1997). Effect of lupine flour on the quality and oligosaccharides of pasta and crisps.
Food / Nahrung 41, 219-223.
Lampart-Szczapa, E., Siger, A., Trojanowska, K., Nogala-Kalucka, M., Malecka, M., and
Pacholek, B. (2003b). Chemical composition and antibacterial activities of lupin seeds
extracts. Food / Nahrung 47, 286-290.
Lee, S. C., Kim, J. H., Jeong, S. M., Kim, D. R., Ha, J. U., Nam, K. C., and Ahn, D. U. (2003).
Effect of far-infrared radiation on the antioxidant activity of rice hulls. J Agric Food
Chem 51, 4400-3.
Lee, Y. P., Mori, T. A., Sipsas, S., Barden, A., Puddey, I. B., Burke, V., Hall, R. S., and
Hodgson, J. M. (2006). Lupin-enriched bread increases satiety and reduces energy intake
acutely. Am J Clin Nutr 84, 975-80.
Letang, C., Piau, M., and Verdier, C. (1999). Characterization of wheat flour_water doughs. Part
I: Rheometry and microstructure. Journal of Food Engineering 41, 121-132.
Leterme, P. (2002). Recommendations by health organizations for pulse consumption. The
British journal of nutrition 88 239-242.

References
117
Lim, H. S., and Narsimhan, G. (2006). Pasting and rheological behavior of soy protein-based
pudding. LWT - Food Science and Technology 39, 344-350.
Lorimer, N. L., Zabik, M. E., Harte, J. B., Stachiw, N. C., and Uebersax, M. A. (1991). Effect of
navy bean protein flour and navy bean globulin(s) on composite flour rheology, chemical
bonding, and microstructure. Cereal Chem 68, 213-220.
Lubowicki, R., Petkov, K., Kotlarz, A., and Jaskowska, I. (2000). Chemical composition and
nutritive value of protein of lupins seeds. Folia Universitaet Agricultura Zootechnica,
Szczecin 39, 9-104.
Lynch, E. J., Dal Bello, F., Sheehan, E. M., Cashman, K. D., and Arendt, E. K. (2009).
Fundamental studies on the reduction of salt on dough and bread characteristics. Food
Research International 42, 885-891.
Madhujith, T., Amarowicz, R., and Shahidi, F. (2004). Phenolic antioxidants in beans and their
effects on inhibition of radical-induced DNA damage. Journal of the American Oil
Chemists' Society 81, 691-696.
Madhusudhan, B., and Tharanathan, R. N. (1995). Legume and Cereal Starches — Why
Differrences in Digestibility? Part 1: Isolation and Composition of Legume (Greengram
and Bengalgram) Starches. Starch - Stärke 47, 165-171.
Maknickiene, Z., and Asakaviciute, R. (2008). Alkaloid Content Variations in Lupin (Lupinus L.)
Genotypes and Vegetation Periods. Biologija 54, 112-115.
Mani, K., Trägadh, C., Eliasson, A. C., and Lindahl, L. (1992). Water Content, Water Soluble
Fraction, and Mixing Affect Fundamental Rheological Properties of Wheat Flour Doughs.
Journal of Food Science 57, 1198-1209.
Mansour, H. A., Newairy, A. A., Yousef, M. I., and Sheweita, S. A. (2002). Biochemical study
on the effects of some Egyptian herbs in alloxan-induced diabetic rats. Toxicology 170,
221-228.
Martínez-Villaluenga, C., Frías, J., and Vidal-Valverde, C. (2006a). Functional lupin seeds
(Lupinus albus L. and Lupinus luteus L.) after extraction of α-galactosides. Food
Chemistry 98, 291-299.
Martínez-Villaluenga, C., Sironi, E., Vidal-Valverde, C., and Duranti, M. (2006b). Effects of
oligosaccharide removing procedure on the protein profiles of lupin seeds. European
Food Research and Technology 223, 691-696.

References
118
Martínez-Villaluenga, C., Zieliński, H., Frias, J., Piskuła, M. K., Kozłowska, H., and Vidal-
Valverde, C. (2009). Antioxidant capacity and polyphenolic content of high-protein lupin
products. Food Chemistry 112, 84-88.
Masi, P., Cavella, S., and Piazza, L. (2001). An interpretation of the rheological behavior of
wheat flour dough based on fundamental tests. In "Bread staling" (P. Chinachoti and Y.
Vodovotz, eds.). CRC press Boca Raton Boston, New York.
Mathers, J. C. (2002). Pulses and carcinogenesis: potential for the prevention of colon, breast and
other cancers. Br J Nutr 88 S273-9.
McWatters, K. (1990). Functional characteristics of cowpea flours in foods. Journal of the
American Oil Chemists' Society 67, 272-275.
Miller, K. A., and Hoseney, R. C. (1999). Dynamic properties of wheat starch-gluten doughs.
Cereal Chem 76, 105-109.
Mizukoshi, M., Maeda, H., and Amano, H. (1980). Model studies of cake baking, II. Expansion
and heat set of cake batter during baking. Cereal Chem 55, 352-355.
Mohamed, S., and Hamid, N. A. (1998). Effects of ingredients on the characteristics of rice
cakes. Journal of the Science of Food and Agriculture 76, 464-468.
Mohammed, I. (2011). Materialwissenschaftliche und technologische Untersuchungen von
Teigen aus Weizen- und Kichererbsenmehlmischungen, TU, Berlin, Germany.
Molvig, L., Tabe, L. M., Eggum, B. O., Moore, A. E., Craig, S., Spencer, D., and Higgins, T. J.
V. (1997). Enhanced methionine levels and increased nutritive value of seeds of
transgenic lupins (Lupinus angustifolius L.) expressing a sunflower seed albumin gene.
Proceedings of the National Academy of Sciences 94, 8393-8398.
Moore, S., Spackman, D. H., and Stein, W. H. (1958). Chromatography of amino acids on
sulphonated polystyrene resins: An improved system. . Anal. Chem. 30, 1185-1190.
Morrow, B. (1991). The rebirth of legumes. Food Technology 45, 96-121.
Mülayim, M., Tamkoç, A., and Babaoglu, M. (2002). Sweet white lupins versus local bitter
genotype: agronomic characteristics as affected by different planting densities in the
Göller region of Turkey. European Journal of Agronomy 17, 181-189.
Naczk, M., and Shahidi, F. (2006). Phenolics in cereals, fruits and vegetables: Occurrence,
extraction and analysis. Journal of Pharmaceutical and Biomedical Analysis 41, 1523-
1542.
References
119
Newairy, A. A., Mansour, H. A., yousef, M. I., and Sheweita, S. A. (2002). Alterations of lipid
profile in plasma and liver of diabetic rats: Effect of hypoglycemic herbs.
J.Environmental Sci.and Health. 1337, 475-484.
Niman, C. E. (1981). Salt in bakery products. Cereal Foods World 26, 116-118.
Noffsinger, S. L., and Van Santen, E. (2005). "Evaluation of Lupinus albus L. germplasm for the
southeastern USA," Crop Science Society of America, Madison, WI, Etats-Unis.
Nutraingredients (2005). Nutraceutical offers high polyphenol extracts.
http://www.nutraingredients.com/news/ng.asp?id=62581.
Oomah, B. D., Cardador-Martínez, A., and Loarca-Piña, G. (2005). Phenolics and antioxidative
activities in common beans (Phaseolus vulgaris L). Journal of the Science of Food and
Agriculture 85, 935-942.
Ordoñez, A. A. L., Gomez, J. D., Vattuone, M. A., and lsla, M. I. (2006). Antioxidant activities
of Sechium edule (Jacq.) Swartz extracts. Food Chemistry 97, 452-458.
Paraskevopoulou, A., Provatidou, E., Tsotsiou, D., and Kiosseoglou, V. (2010). Dough rheology
and baking performance of wheat flour–lupin protein isolate blends. Food Research
International 43, 1009-1016.
Park, Y. W. (2007). Rheological characteristics of goat and sheep milk. Small Ruminant
Research 68, 73-87.
Pastor-Cavada, E., Juan, R., Pastor, J. E., Alaiz, M., and Vioque, J. (2009). Analytical nutritional
characteristics of seed proteins in six wild Lupinus species from Southern Spain. Food
Chemistry 117, 466-469.
Peng, H. (2002). Isolation and hypoglycemic effect of pumpkin polysaccharide. Chinese J Food
Sci 23, 260-262.
Petterson, D. S. (1998). Composition and food uses of lupins. In "Lupins as crop plants : biology,
production, and utilization" (J. S. Gladstones, C. A. Atkins and J. Hamblin, eds.), pp. 353-
384. CAB International, Wallingford, Oxon, UK.
Petterson, D. S., and Mackintosh, J. B. (1997). "The chemical composition and nutritive value of
Australian grain legumes," Grains Research and Development Corporation, Canberra.
Accessed from http://nla.gov.au/nla.cat-vn180553.
Phan, H. T. T., Ellwood, S. R., Ford, R., Thomas, S., and Oliver, R. (2006). Differences in
syntenic complexity between Medicago truncatula with Lens culinaris and Lupinus albus
Functional Plant Biology 33, 775-782

References
120
Phan, H. T. T., Simon, R. E., Kedar, A., Matthew, N. N., and Richard, P. O. (2007). The First
Genetic and Comparative Map of White Lupin (Lupinus albus L.): Identification of QTLs
for Anthracnose Resistance and Flowering Time, and a Locus for Alkaloid Content. DNA
Research 14, 59-70.
Pisariková, B., Zraly, Z., Bunka, F., and Trckova, M. (2008). Nutritional value of white lupine
cultivar Butan in diets for fattening pigs. Veterinárni Medicina 53, 124-134.
Pogna, N. E., Redaelli, R., Dachkevitch, T., Curioni, A., and Dal Belin Peruffo, A. (1994).
Genetics of wheat quality and its improvement by conventional and biotechnological
breeding. In "Wheat Production, Properties and Quality" (W. Bushuk, Rasper, V.F., ed.).
Chapman Hall, London.
Pollard, N. J., Stoddard, F. L., Popineau, Y., Wrigley, C. W., and MacRitchie, F. (2002). Lupin
flours as additives: Dough mixing, breadmaking, emulsifying, and foaming. Cereal
chemistry 79, 662-669.
Pollmann, K., Gagel, S., Elgamal, M. H., Shaker, K. H., and Seifert, K. (1997). Triterpenoid
saponins from the roots of Zygophyllum species. Phytochemistry 44, 485-9.
Pomeranz, Y. (1988). "Wheat chemistry and technology II," 3rd/Ed. American Association of
Cereal Chemists, Saint Paul.
Quail, K. J. (1996). "Arabic Bread Production.," Am. Assoc. Cereal Chem., St. Paul, MN.
Rao, V. K., Mulvaney, S. J., and Dexter, J. E. (2000). Rheological Characterisation of Long- and
Short- Mixing Flours Based on Stress–Relaxation. Journal of Cereal Science 31, 159-171.
Rayas-Duarte, P., Mock, C. M., and Satterlee, L. D. (1996). Quality of spaghetti containing
buckwheat, amaranth, and lupin flours. Cereal Chemistry 73, 381-387.
Razmi-Rad, E., Ghanbarzadeh, B., Mousavi, S. M., Emam-Djomeh, Z., and Khazaei, J. (2007).
Prediction of rheological properties of Iranian bread dough from chemical composition of
wheat flour by using artificial neural networks. Journal of Food Engineering 81, 728-734.
Re, R., Pellegrini, N., Proteggente, A., Pannala, A., Yang, M., and Rice-Evans, C. (1999).
Antioxidant activity applying an improved ABTS radical cation decolorization assay.
Free Radic Biol Med 26, 1231-7.
Redondo-Cuenca, A., Villanueva-Suárez, M. J., Rodríguez-Sevilla, M. D., and Mateos-Aparicio,
I. (2007). Chemical composition and dietary fibre of yellow and green commercial
soybeans (Glycine max). Food Chemistry 101, 1216-1222.

References
121
Regier, M., Hardy, E. H., Knoerzer, K., Leeb, C. V., and Schuchmann, H. P. (2007).
Determination of structural and transport properties of cereal products by optical
scanning, magnetic resonance imaging and Monte Carlo simulations. Journal of Food
Engineering 81, 485-491.
Reinhard, H., Rupp, H., Sager, F., Streule, M., and Zoller, O. (2006). Quinolizidine alkaloids and
phomopsins in lupin seeds and lupin containing food. Journal of Chromatography A
1112, 353-360.
Ricardo-da-Silva, J., Laureano, O., and Beir˜ao da Costa, M. (1993). Total phenol and
proanthocyanidin evaluation of Lupinus species. In "Proceedings of the VIIth
International Lupin Conference," pp. 250–254, Evora, Portugal.
Rizkalla, S. W., Bellisle, F., and Slama, G. (2002). Health benefits of low glycaemic index foods,
such as pulses, in diabetic patients and healthy individuals. Br J Nutr 88 S255-62.
Roach, R. R., Lai, C. S., and Hoseney, R. C. (1992). Effect of certain salts on bread loaf volume
and on soluble nitrogen of wheat flour and nonfat dry milk slurries. Cereal Chem 69, 574-
576.
Roccia, P., Ribotta, P. D., P‚rez, G. T., and Leôn, A. E. (2009). Influence of soy protein on
rheological properties and water retention capacity of wheat gluten. LWT - Food Science
and Technology 42, 358-362.
Rochfort, S., and Panozzo, J. (2007). Phytochemicals for Health, the Role of Pulses. Journal of
Agricultural and Food Chemistry 55, 7981-7994.
Rosell, C. M., Rojas, J. A., and Benedito de Barber, C. (2001). Influence of hydrocolloids on
dough rheology and bread quality. Food Hydrocolloids 15, 75-81.
Ross, K. A., Pyrak-Nolte, L. J., and Campanella, O. H. (2004). The use of ultrasound and shear
oscillatory tests to characterize the effect of mixing time on the rheological properties of
dough. Food Research International 37, 567-577.
Ruiz, M. A., and Sotelo, A. (2001). Chemical Composition, Nutritive Value, and Toxicology
Evaluation of Mexican Wild Lupins. Journal of Agricultural and Food Chemistry 49,
5336-5339.
Sabanis, D., Makri, E., and Doxastakis, G. (2006). Effect of durum flour enrichment with
chickpea flour on the characteristics of dough and lasagne. Journal of the Science of Food
and Agriculture 86, 1938-1944.
References
122
Sacchetti, G., Maietti, S., Muzzoli, M., Scaglianti, M., Manfredini, S., Radice, M., and Bruni, R.
(2005). Comparative evaluation of 11 essential oils of different origin as functional
antioxidants, antiradicals and antimicrobials in foods. Food Chemistry 91, 621-632.
Sadowska, J., Blaszczak, W., Fornal, J., Vidal-Valverde, C., and Frias, J. (2003). Changes of
wheat dough and bread quality and structure as a result of germinated pea flour addition.
Eur Food Res Technol 216, 50.
Sadowska, J., Fornal, J., Vidal-Valverde, C., and Frias, J. (1999). Natural fermentation of lentils.
Functional properties and potential in breadmaking of fermented lentil flour. Food /
Nahrung 43, 396-401.
Safari-Ardi, M., and Phan-Thien, N. (1998). Stress Relaxation and Oscillatory Tests to
Distinguish Between Doughs Prepared from Wheat Flours of Different Varietal Origin.
Cereal Chem. 75, 80-84.
Salvador, A., Sanz, T., and Fiszman, S. (2006). Dynamic rheological characteristics of wheat
flour-water doughs. Effect of adding NaCl, sucrose and yeast. Food Hydrocolloids 20,
780-786.
Sandberg, A. S. (2002). Bioavailability of minerals in legumes. The British journal of nutrition
88 Suppl 3, S281-5.
Santana, F. M. C., Pinto, T., Fialho, A. M., Sá-Correia, I., and Empis, J. M. A. (2002). Bacterial
Removal of Quinolizidine Alkaloids and Other Carbon Sources from a Lupinus albus
Aqueous Extract. Journal of Agricultural and Food Chemistry 50, 2318-2323.
SAS (2004). SAS Online Doc_ 9.1. SAS Institute Inc., Cary, NC.
Sasaki, T., Yasui, T., and Matsuki, J. (2000). Influence of non-starch polysaccharides isolated
from wheat flour on the gelatinization and gelation of wheat starches. Food Hydrocolloids
14, 295-303.
Scanlon, M. G., Sapirstein, H. D., and Fahloul, D. (2000). Mechanical properties of bread crumb
prepared from flours of different dough strength. J. Cereal Sci. 32, 235-243.
Scarafoni, A., Ronchi, A., and Duranti, M. (2009). A real-time PCR method for the detection and
quantification of lupin flour in wheat flour-based matrices. Food Chemistry 115, 1088-
1093.
Schneider, A. V. (2002). Overview of the market and consumption of pulses. Br. J. Nutr. 88,
S243.

References
123
Sebastiá, V., Barberá, R., Farré, R., and Lagarda, M. J. (2001). Effects of legume processing on
calcium, iron and zinc contents and dialysabilities. Journal of the Science of Food and
Agriculture 81, 1180-1185.
See, E. F. (2008). Physico-Chemical And Organoleptic Evaluations Of Wheat Bread Substituted
With Different Percentage Of Pumpkin Flour (Cucurbita Moschata), Universiti Sains,
Malaysia.
Shah, M., Adams-Huet, B., and Garg, A. (2007). Effect of high-carbohydrate or high-cis-
monounsaturated fat diets on blood pressure: a meta-analysis of intervention trials. The
American Journal of Clinical Nutrition 85, 1251-1256.
Sharma, S., Bajwa, U. H., and Nagi, H. P. S. (1999). Rheological and baking properties of
cowpea and wheat flour blends. Journal of the Science of Food and Agriculture 79, 657-
662.
Shiau, S.-Y., and Yeh, A.-I. (2001). Effects of Alkali and Acid on Dough Rheological Properties
and Characteristics of Extruded Noodles. Journal of Cereal Science 33, 27-37.
Sidhu, G. S., Upson, B., and Makinow, M. R. (1987). Effect of soy saponins and tigogenin
cellobioside on intestinal uptake of cholestsrol, cholate and glucose. Nutr. Res. Int. 35,
615.
Sim, J. S., Kitts, W. D., and Bragg, D. B. (1984). Effect of dietary saponins on egg cholesterol
level and laying hen performance. Can. J. Anim. Sci. 64, 977.
Singh, H., and MacRitchie, F. (2001). Application of Polymer Science to Properties of Gluten.
Journal of Cereal Science 33, 231-243.
Sironi, E., Sessa, F., and Duranti, M. (2005). A simple procedure of lupin seed protein
fractionation for selective food applications. European Food Research and Technology
221, 145-150.
Sivaramakrishnan, H. P., Senge, B., and Chattopadhyay, P. K. (2004). Rheological properties of
rice dough for making rice bread. Journal of Food Engineering 62, 37-45.
Skim, F., Lazrek, H. B., Kaaya, A., el Amri, H., and Jana, M. (1999). Pharmacological studies of
two antidiabetic plants: Globularia alypum and Zygophyllum gaetulum. Therapie 54, 711-
5.
Sliwinski, E. L., Kolster, P., Prins, A., and Vliet, T. v. (2004a). On the relationship between
gluten protein composition of wheat flours and large-deformation properties of their
doughs. Journal of Cereal Science 39, 247-264.

References
124
Sliwinski, E. L., Kolster, P., and van Vliet, T. (2004b). On the relationship between large-
deformation properties of wheat flour dough and baking quality. Journal of Cereal
Science 39, 231-245.
Smith, S., Choy, R., Johnson, S., Hall, R., Wildeboer-Veloo, A., and Welling, G. (2006). Lupin
kernel fiber consumption modifies fecal microbiota in healthy men as determined by
rRNA gene fluorescent in situ hybridization. European Journal of Nutrition 45, 335-341.
Song, Y., and Zheng, Q. (2007). Dynamic rheological properties of wheat flour dough and
proteins. Trends in Food Science & Technology 18, 132-138.
Sosulski, F. W., and Dabrowski, K. J. (1984). Composition of free and hydrolyzable phenolic
acids in the flours and hulls of ten legume species. Journal of Agricultural and Food
Chemistry 32, 131-133.
Sosulski, F. W., and WU, K. K. (1988). High fiber breads containing field pea hulls, wheat, corn
and wild oat brans. Cereal Chem 65, 186-191.
Steffe, J. F. (1996). "Rheological Methods in Food Process Engineering," 2nd/Ed. Freeman Press,
USA.
Streppel, M. T., Arends, L. R., van 't Veer, P., Grobbee, D. E., and Geleijnse, J. M. (2005).
Dietary fiber and blood pressure: a meta-analysis of randomized placebo-controlled trials.
Arch Intern Med 165, 150-6.
Su, D., Ding, C., Li, L., Su, D., and Zheng, X. (2005). Effect of endoxylanases on dough
properties and making performance of Chinese steamed bread. European Food Research
and Technology 220, 540-545.
Sudha, M. L., Rajeswari, G., and Venkateswara Rao, G. (2011). Effect of wheat and oat brans on
the dough rheological and quality characteristics of instant vermicelli. Journal of Texture
Studies doi: 10.1111/j.1745-4603.2011.00329.x, 1-8.
Sujak, A., Kotlarz, A., and Strobel, W. (2006). Compositional and nutritional evaluation of
several lupin seeds. Food Chemistry 98, 711-719.
Swam, K. (2000). Potential and challenges in the marketing of lupins for food and feed. In
"Linking research and marketing opportunities for pulses in the 21st century. Proceedings
of third international food legumes research conference" (R. Knight, ed.), pp. 517–520.
Kluwer Academic Publishers., Dordrecht.
Tabe, L., and Higgins, T. J. V. (1998). Engineering plant protein composition for improved
nutrition. Focus in Protein Science 3, 282-285.

References
125
Tharanathan, R. N., and Mahadevamma, S. (2003). Grain legumes - a boon to human nutrition.
Trends Food Sci. Technol. 14, 507.
Trinder, P. (1969). Determination of blood glucose using oxidation peroxides system with a non
carcinogenic chromogen. Ann Clin Biochem 6, 24-31.
Tronc, E. (1999). Lupin flour: a new ingredient for human food. Grains Legumes 25, 24-29.
Tronsmo, K. M., Magnus, E. M., Baardseth, P., Schofield, J. D., Aamodt, A., and Faergestad, E.
M. (2003). "Comparison of small and large deformation rheological properties of wheat
dough and gluten," American Association of Cereal Chemists, St. Paul, MN, ETATS-
UNIS.
Turkmen, N., Sari, F., and Velioglu, Y. S. (2005). The effect of cooking methods on total
phenolics and antioxidant activity of selected green vegetables. Food Chemistry 93, 713-
718.
Uthayakumaran, S., Newberry, M., Phan-Thien, N., and Tanner, R. (2002). Small and large strain
rheology of wheat gluten. Rheologica Acta 41, 162-172.
Uzun, B., Arslan, C., Karhan, M., and Toker, C. (2007). Fat and fatty acids of white lupin
(Lupinus albus L.) in comparison to sesame (Sesamum indicum L.). Food Chemistry 102,
45-49.
Vasilakis, K., and Doxastakis, G. (1999). The rheology of lupin seed (Lupinus albus ssp. graecus)
protein isolate films at the corn oil–water interface. Colloids and Surfaces B:
Biointerfaces 12, 331-337.
Villarroel, M., Biolley, E., Larenas, G., Wittig, E., Diaz, V., and Munoz, Y. (1996). Chemical,
sensory and clinical characterization of lupin marmalades. Arch Latinoam Nutr 46, 234-7.
Wang, M., Li, J., Rangarajan, M., Shao, Y., LaVoie, E. J., Huang, T.-C., and Ho, C.-T. (1998).
Antioxidative Phenolic Compounds from Sage (Salvia officinalis). Journal of
Agricultural and Food Chemistry 46, 4869-4873.
Wasche, A., Muller, K., and Knauf, U. (2001). New processing of lupin protein isolates and
functional properties. Nahrung 45, 393-5.
Whelton, S. P., Hyre, A. D., Pedersen, B., Yi, Y., Whelton, P. K., and He, J. (2005). Effect of
dietary fiber intake on blood pressure: a meta-analysis of randomized, controlled clinical
trials. J Hypertens 23, 475-81.
WHO (2003). "Report of a WHO/FAO expert consultation 2003. Diet Nutrition and Prevention
of Chronic Diseases;." World Health Organization, Geneva.

References
126
Williams, P. C., and Sobering, D. C. (1986a). Attempts at standardization of hardness testing of
wheat. I : The grinding/sieving (particle size index) method. Cereal Food W orld 31, 361-
364.
Williams, P. C., and Sobering, D. C. (1986b). Attempts at standardization of hardness testing of
wheat. II : The Near Infrared Reflectance method. Cereal Food W orld 31, 417-420.
Wolever, T. M. S., Tsihlias, E. B., McBurney, M. I., and Le, N.-A. (2003). Long-term effect of
reduced carbohydrate or increased fiber intake on LDL particle size and HDL
composition in subjects with type 2 diabetes. Nutrition Research 23, 15-26.
Wu, Y. V., Stringfellow, A. C., and Bietz, J. A. (1990). Relation of wheat hardness to air-
classification yields and flour particle size distribution. Cereal Chem 67, 421-427.
Xu, B. J., and Chang, S. K. (2007). A comparative study on phenolic profiles and antioxidant
activities of legumes as affected by extraction solvents. J Food Sci 72, S159-66.
Yamaguchi, F., Ariga, T., Yoshimura, Y., and Nakazawa, H. (2000). Antioxidant and
antiglycation of carcinol from Garcinia indica fruit rind. J. Agric. Food Chem. 48, 180-
185.
Yamamoto, Y., Sogawa, I., Nishina, A., Saeki, S., Ichikawa, N., and Iibata, S. (2000). Improved
hypolipidemic effects of xanthan gum-galactomannan mixtures in rats. Biosci Biotechnol
Biochem 64, 2165-71.
Yanez, E., Ivanovic, D., Owen, D. F., and Ballester, D. (1983). Chemical and nutritional
evaluation of sweet lupines. Ann Nutr Metab 27, 513-20.
Zraly, Z., Pisarikova, B., Trckova, M., Herzigl, I., Uzl, M., and Simeonova, J. (2007). The Effect
of White Lupine on the Performance, Health, Carcass Characteristics and Meat Quality of
Market Pigs. Veterinarni Medicina 52, 29–41.
Zunft, H. J., Luder, W., Harde, A., Haber, B., Graubaum, H. J., and Gruenwald, J. (2001). Carob
pulp preparation for treatment of hypercholesterolemia. Adv Ther 18, 230-6.

Appendix
127
11. Appendix

Appendix
128

Appendix
129
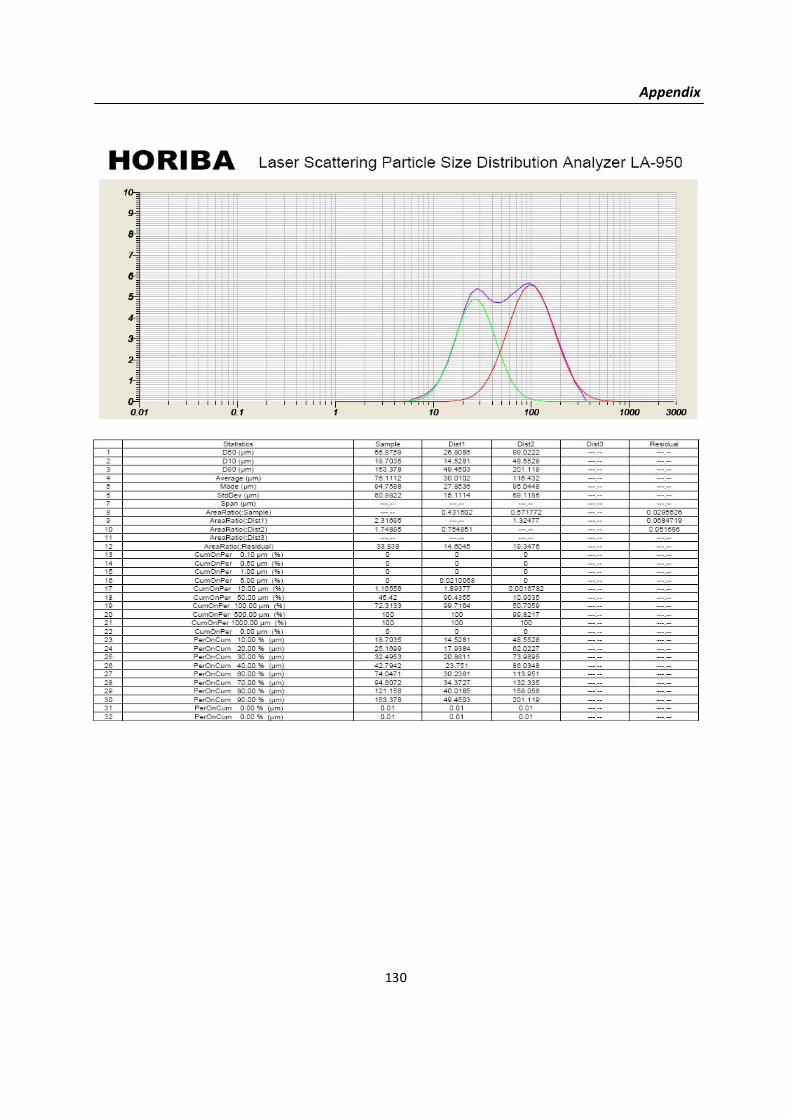
Appendix
130

Appendix
131