temperature and humidity aging of poly( -phenylene-2,6 ... · temperature and humidity aging of...
TRANSCRIPT
Polymer Degradation and Stability 92 (2007) 1234e1246www.elsevier.com/locate/polydegstab
Temperature and humidity aging of poly( p-phenylene-2,6-benzobisoxazole) fibers: Chemical and physical characterization
Joannie Chin a,*, Amanda Forster b, Cyril Clerici a,Lipiin Sung a, Mounira Oudina a, Kirk Rice b
a Polymeric Materials Group, National Institute of Standards and Technology, Gaithersburg, MD 20899, United Statesb Office of Law Enforcement Standards, National Institute of Standards and Technology, Gaithersburg, MD 20899, United States
Received 9 February 2007; received in revised form 20 March 2007; accepted 23 March 2007
Available online 19 April 2007
Abstract
In recent years, poly( p-phenylene-2,6-benzobisoxazole) (PBO) fibers have become prominent in high strength applications such as body ar-mor, ropes and cables, and recreational equipment. The objectives of this study were to expose woven PBO body armor panels to elevated tem-perature and moisture, and to analyze the chemical, morphological and mechanical changes in PBO yarns extracted from the panels. A 30%decrease in yarn tensile strength, which was correlated to changes in the infrared peak absorbance of key functional groups in the PBO structure,was observed during the 26 week elevated temperature/elevated moisture aging period. Substantial changes in chemical structure were observedvia infrared spectroscopy, as well as changes in polymer morphology using microscopy and neutron scattering. When the panels were removedto an ultra-dry environment for storage for 47 weeks, no further decreases in tensile strength degradation were observed. In a follow-on study,fibers were sealed in argon-filled glass tubes and exposed to elevated temperature; less than a 4% decrease in tensile strength was observed after30 weeks, demonstrating that moisture is a key factor in the degradation of these fibers.� 2007 Elsevier Ltd. All rights reserved.
Keywords: Body armor; Poly( p-phenylene-2,6-benzobisoxazole) (PBO); Attenuated total reflectance (ATR); Infrared (IR) spectroscopy; Fiber; Yarn
1. Introduction and objectives
In recent years, high performance fibers based on poly( p-phenylene-2,6-benzobisoxazole) (PBO) have becomeprominent in high strength applications such as body armor,ropes and cables, and recreational equipment. Problems withthe performance and durability of PBO-based body armor be-came apparent to the law enforcement community in the sum-mer of 2003, when ballistic penetration of PBO-based bodyarmor occurred in two separate incidents.
Data from the manufacturer and the published literaturehave revealed the moisture vulnerability of PBO fibers
* Corresponding author. Polymeric Materials Group, National Institute of
Standards and Technology, 100 Bureau Drive, Mail Stop 8615, Building
226, Room B340, Gaithersburg, MD 20899, United States.
Tel.: þ1 3019756815; fax: þ1 3019906891.
E-mail address: [email protected] (J. Chin).
0141-3910/$ - see front matter � 2007 Elsevier Ltd. All rights reserved.
doi:10.1016/j.polymdegradstab.2007.03.030
[1,2]. In an attempt to quantify this vulnerability, and to de-termine if correlations existed between moisture exposure,tensile strength degradation and ballistic failure, an experi-mental study was designed in which newly-manufacturedbody armor constructed from PBO was exposed to elevatedtemperature and relative humidity in an environmental cham-ber. The primary goals of the work described in this reportwere to:
- monitor tensile strength degradation in PBO yarns ex-tracted from body armor exposed to elevated temperatureand relative humidity as a function of exposure time;
- monitor chemical and physical changes in PBO yarns ex-tracted from body armor exposed to elevated temperatureand relative humidity as a function of exposure time;
- determine if any correlations exist between chemicalhydrolysis and tensile strength degradation in PBO yarns.
1235J. Chin et al. / Polymer Degradation and Stability 92 (2007) 1234e1246
2. Experimental procedures1
2.1. Materials
Commercial, non-deployed body armor manufactured forthis study consisted of a ballistic panel constructed from 20layers of woven PBO fabric stacked and diagonally stitchedtogether, inserted in a water vapor-permeable fabric liner,and placed in a cotton fabric carrier. For testing and analyses,PBO yarns were extracted from the exposed vest panels at pre-determined inspection times.
2.2. Environmental exposure
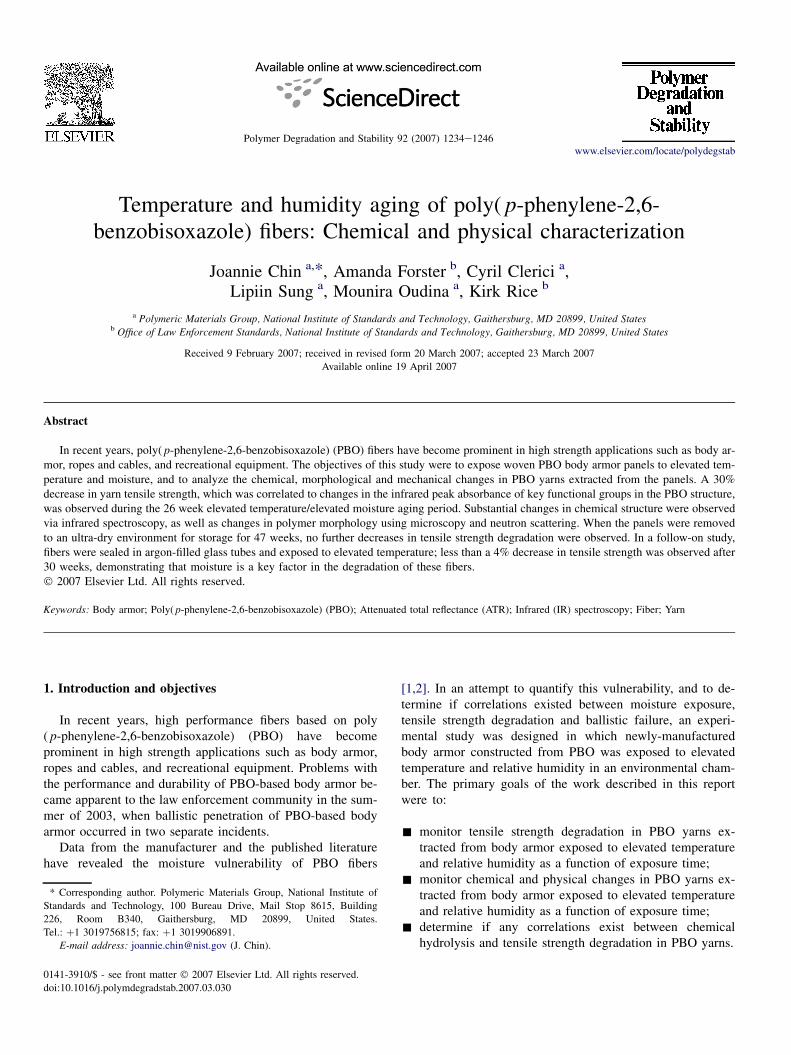
Twenty-four ballistic panels enclosed in liners and carriers(shown in Fig. 1) were aged in a Cincinnati Sub-Zero Z32 en-vironmental chamber at 50 �C and 60% relative humidity(RH) for 84 d, and then 60 �C and 37% RH for an additional73 d. The increase in temperature to 60 �C and decrease in rel-ative humidity to 37% were intended to accelerate the kineticsof fiber degradation by increasing the temperature while main-taining the same absolute water content in the environment.Following the completion of the environmental chamber ag-ing, 18 panels were removed for ballistic testing, while the re-mainder was stored in the chamber at 25 �C and 5% RH for anadditional 332 d.
To monitor temperature and relative humidity more accu-rately in the large chamber area, a number of temperaturesand RH sensors were distributed throughout the interior ofthe chamber as well as in the interior of the vest panels. Thesetemperature and RH sensor data were logged and stored viaa data acquisition system and a desktop computer.
2.3. Yarn extraction procedure
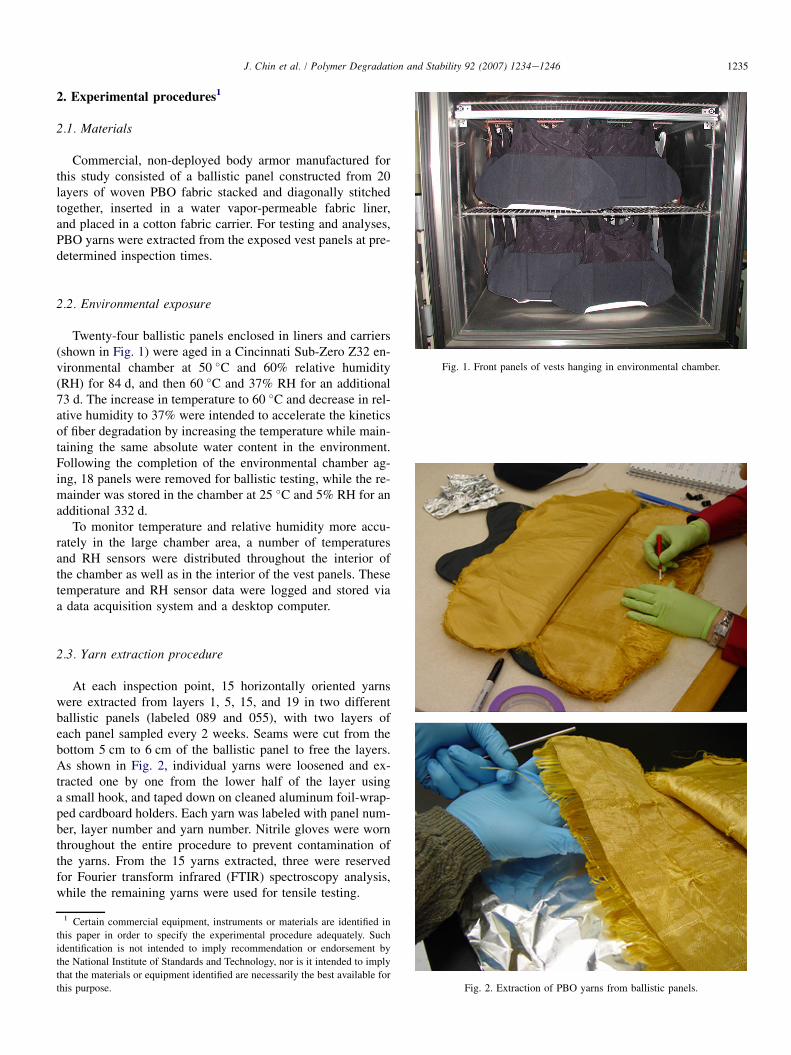
At each inspection point, 15 horizontally oriented yarnswere extracted from layers 1, 5, 15, and 19 in two differentballistic panels (labeled 089 and 055), with two layers ofeach panel sampled every 2 weeks. Seams were cut from thebottom 5 cm to 6 cm of the ballistic panel to free the layers.As shown in Fig. 2, individual yarns were loosened and ex-tracted one by one from the lower half of the layer usinga small hook, and taped down on cleaned aluminum foil-wrap-ped cardboard holders. Each yarn was labeled with panel num-ber, layer number and yarn number. Nitrile gloves were wornthroughout the entire procedure to prevent contamination ofthe yarns. From the 15 yarns extracted, three were reservedfor Fourier transform infrared (FTIR) spectroscopy analysis,while the remaining yarns were used for tensile testing.
1 Certain commercial equipment, instruments or materials are identified in
this paper in order to specify the experimental procedure adequately. Such
identification is not intended to imply recommendation or endorsement by
the National Institute of Standards and Technology, nor is it intended to imply
that the materials or equipment identified are necessarily the best available for
this purpose.
Fig. 1. Front panels of vests hanging in environmental chamber.
Fig. 2. Extraction of PBO yarns from ballistic panels.
1236 J. Chin et al. / Polymer Degradation and Stability 92 (2007) 1234e1246
2.4. Moisture sorption analysis
Moisture absorbed by the yarn specimens during the temper-ature/humidity exposure period was measured using a HidenIGAsorp Moisture Sorption Analyzer. The IGAsorp softwaremonitors the temporal changes in the mass of a specimen sub-jected to prescribed temperature and relative humidity condi-tions, and calculates equilibrium parameters via curve fitting.Specimens for sorption analysis were prepared by disassem-bling between 5 mg and 7 mg of yarn into individual filamentsto prevent capillarity effects from dominating the sorption pro-cess. Prior to beginning a sorption experiment, specimens weredried in the moisture sorption analyzer at z0% RH and the pre-scribed temperature at which the sorption experiment would becarried out. Moisture uptake was measured at 50 �C and 60%RH as well as at 60 �C and 37% RH. The water sorption iso-therm was generated using the isothermal mapper mode at40 �C within a range of 0e95% RH. Results are the averageof two specimens. The standard uncertainty of these measure-ments is typically 0.02 mass%.
2.5. Tensile testing of yarns and fibers
Tensile testing of yarns was carried out in accordance withASTM D2256-02 ‘‘Standard Test Method for Tensile Proper-ties of Yarn by the Single-Strand Method’’ using an InstronModel 4482 screw-driven universal test frame equipped witha 91 kg load cell, and pneumatic yarn and chord grips (Instronmodel 2714-006). Strain measurements were taken with anInstron non-contacting Type 3 video extensometer in conjunc-tion with black foam markers placed approximately 2.5 cmapart in the gage section of the yarn. Grip separation was7.9 cm and cross-head speed was 2.3 cm/min. In this study,yarns were nominally 38.1 cm long, and given 60 twists ona custom-designed yarn twisting device. The standard uncer-tainty of measured tensile strengths, percent strain to break,modulus, and break energy are typically �3%, �3%, �3%,and �4%, respectively.
Tensile tests were also carried out on individual single fi-bers utilizing a TA Instruments RSA III, a dynamic mechani-cal thermal analyzer (DMTA) equipped with transient testingcapability. Specimen gage length was 25 mm and specimenextension rate was 0.001 mm/s. A minimum of 10 fiberswere analyzed from one extracted yarn per sampling interval.Standard uncertainty of tensile strengths measured using thismethod is typically �9%.
2.6. Fourier transform infrared (FTIR) spectroscopy
Infrared analysis was carried out using a Nicolet NexusFTIR equipped with a mercuryecadmiumetelluride (MCT)detector and a SensIR Durascope attenuated total reflectance(ATR) accessory. Dry air was used as the purge gas. Consistentpressure on the yarns was applied using the force monitor onthe Durascope. FTIR spectra were recorded at a resolution of4 cm�1 between 4000 cm�1 and 700 cm�1 and averaged over128 scans. Three different locations on each yarn were
analyzed. Spectral analysis, including spectral subtraction,was carried out using a custom software program developedin the Polymeric Materials Group at NIST [3]. All spectrawere baseline corrected and normalized using the aromaticCeH deformation peak at 848 cm�1. Standard uncertaintiesassociated with this measurement are typically �1 cm�1 inwavenumber and �1% in peak intensity.
2.7. Small angle neutron scattering
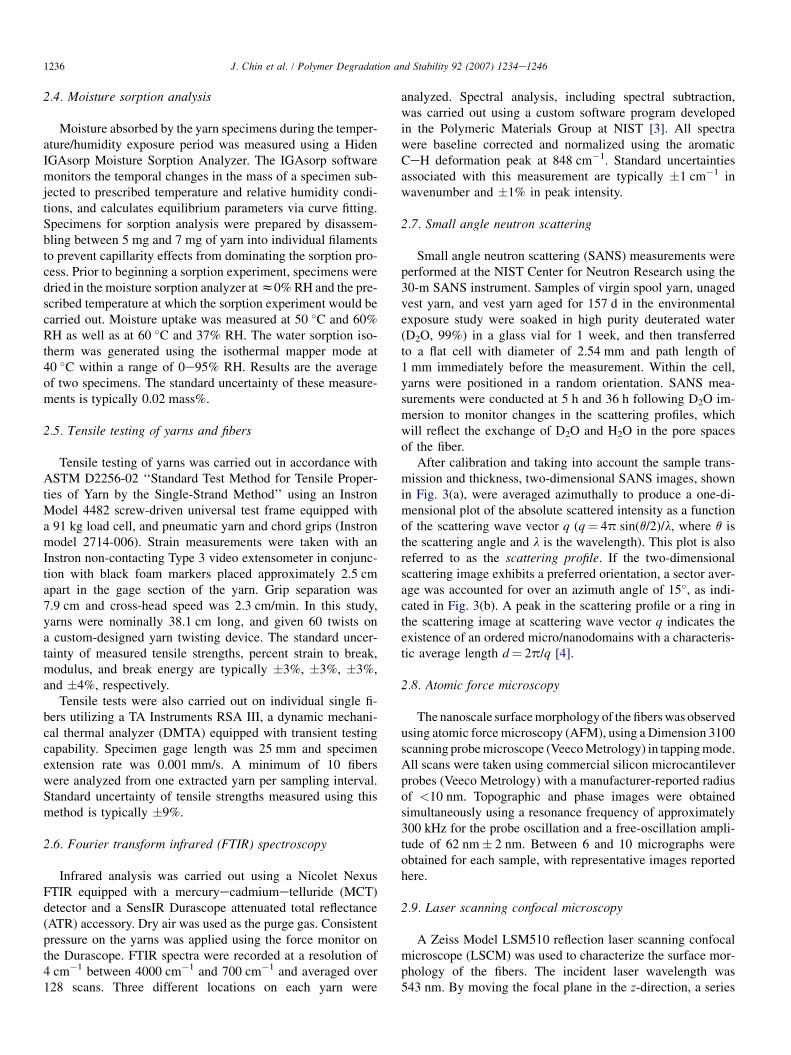
Small angle neutron scattering (SANS) measurements wereperformed at the NIST Center for Neutron Research using the30-m SANS instrument. Samples of virgin spool yarn, unagedvest yarn, and vest yarn aged for 157 d in the environmentalexposure study were soaked in high purity deuterated water(D2O, 99%) in a glass vial for 1 week, and then transferredto a flat cell with diameter of 2.54 mm and path length of1 mm immediately before the measurement. Within the cell,yarns were positioned in a random orientation. SANS mea-surements were conducted at 5 h and 36 h following D2O im-mersion to monitor changes in the scattering profiles, whichwill reflect the exchange of D2O and H2O in the pore spacesof the fiber.
After calibration and taking into account the sample trans-mission and thickness, two-dimensional SANS images, shownin Fig. 3(a), were averaged azimuthally to produce a one-di-mensional plot of the absolute scattered intensity as a functionof the scattering wave vector q (q¼ 4p sin(q/2)/l, where q isthe scattering angle and l is the wavelength). This plot is alsoreferred to as the scattering profile. If the two-dimensionalscattering image exhibits a preferred orientation, a sector aver-age was accounted for over an azimuth angle of 15�, as indi-cated in Fig. 3(b). A peak in the scattering profile or a ring inthe scattering image at scattering wave vector q indicates theexistence of an ordered micro/nanodomains with a characteris-tic average length d¼ 2p/q [4].
2.8. Atomic force microscopy
The nanoscale surface morphology of the fibers was observedusing atomic force microscopy (AFM), using a Dimension 3100scanning probe microscope (Veeco Metrology) in tapping mode.All scans were taken using commercial silicon microcantileverprobes (Veeco Metrology) with a manufacturer-reported radiusof <10 nm. Topographic and phase images were obtainedsimultaneously using a resonance frequency of approximately300 kHz for the probe oscillation and a free-oscillation ampli-tude of 62 nm� 2 nm. Between 6 and 10 micrographs wereobtained for each sample, with representative images reportedhere.
2.9. Laser scanning confocal microscopy
A Zeiss Model LSM510 reflection laser scanning confocalmicroscope (LSCM) was used to characterize the surface mor-phology of the fibers. The incident laser wavelength was543 nm. By moving the focal plane in the z-direction, a series
1237J. Chin et al. / Polymer Degradation and Stability 92 (2007) 1234e1246
of single images (optical slices) can be stacked and digitallysummed over the z-direction to obtain a 3D image. All imagespresented here are 2D projections of a stack of 3D images. Thez-direction step size was 0.1 mm using a 150� objective.
2.10. Sealed tube study
Approximately 200 specimens having a length of 51 cmwere cut from a spool of virgin PBO yarn supplied by themanufacturer. Each length of yarn was inserted into a 6-mmdiameter glass tube, which was then evacuated and back filledwith argon, after which the tube ends were heat fused. Tubeswere then placed in a 55 �C circulating air oven and removedat periodic intervals for tensile testing and FTIR analysis. Athermocouple sealed into one of the argon-purged tubes con-firmed that the temperature in the tube reached 55 �C after be-ing placed in the oven. Between 10 and 13 specimens wererandomly selected and tested at predetermined time intervals.Elapsed time between removal of the yarn from the glass tube
Fig. 3. Two-dimensional SANS images of (a) isotropic and (b) preferred ori-
entation scattering profiles. In (b) a vertical sector average region of 15� is also
illustrated.
and either tensile testing or infrared analysis was less than5 min.
3. Results and discussion
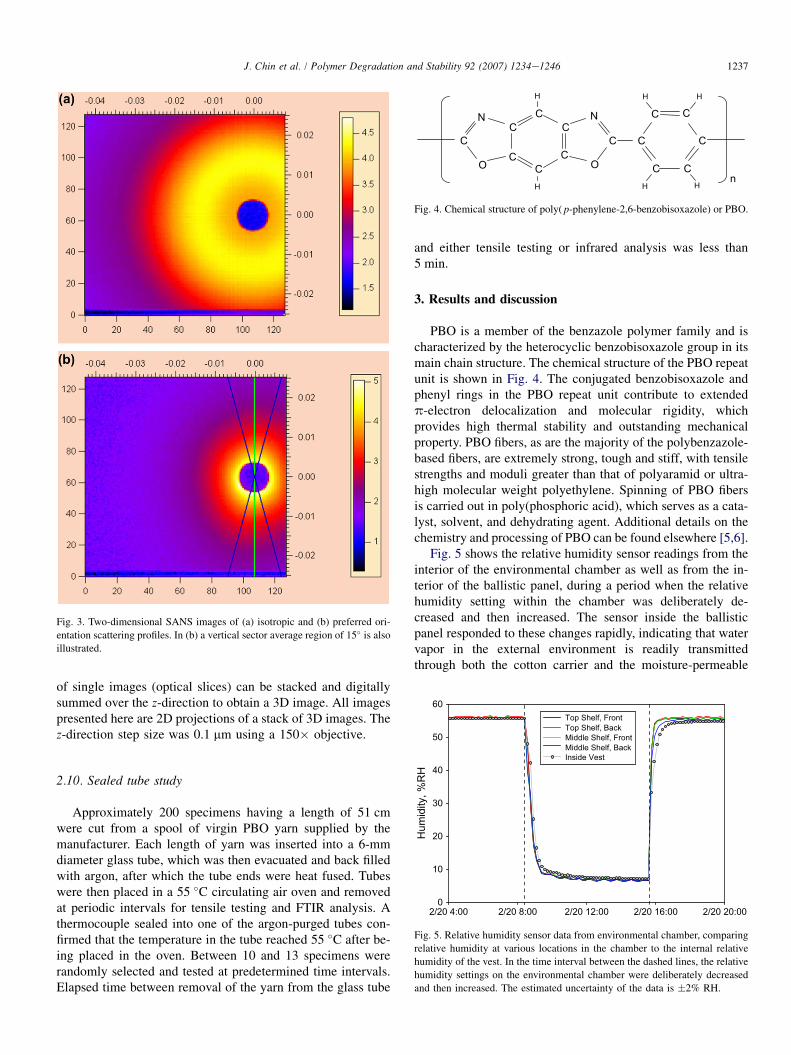
PBO is a member of the benzazole polymer family and ischaracterized by the heterocyclic benzobisoxazole group in itsmain chain structure. The chemical structure of the PBO repeatunit is shown in Fig. 4. The conjugated benzobisoxazole andphenyl rings in the PBO repeat unit contribute to extendedp-electron delocalization and molecular rigidity, whichprovides high thermal stability and outstanding mechanicalproperty. PBO fibers, as are the majority of the polybenzazole-based fibers, are extremely strong, tough and stiff, with tensilestrengths and moduli greater than that of polyaramid or ultra-high molecular weight polyethylene. Spinning of PBO fibersis carried out in poly(phosphoric acid), which serves as a cata-lyst, solvent, and dehydrating agent. Additional details on thechemistry and processing of PBO can be found elsewhere [5,6].
Fig. 5 shows the relative humidity sensor readings from theinterior of the environmental chamber as well as from the in-terior of the ballistic panel, during a period when the relativehumidity setting within the chamber was deliberately de-creased and then increased. The sensor inside the ballisticpanel responded to these changes rapidly, indicating that watervapor in the external environment is readily transmittedthrough both the cotton carrier and the moisture-permeable
CC
CC
CC
CC C
C C
C
CC
N N
O O
H H
H HH
Hn
Fig. 4. Chemical structure of poly( p-phenylene-2,6-benzobisoxazole) or PBO.
2/20 4:00 2/20 8:00 2/20 12:00 2/20 16:00 2/20 20:00
Hum
idity
, %R
H
0
10
20
30
40
50
60Top Shelf, FrontTop Shelf, BackMiddle Shelf, FrontMiddle Shelf, BackInside Vest
Fig. 5. Relative humidity sensor data from environmental chamber, comparing
relative humidity at various locations in the chamber to the internal relative
humidity of the vest. In the time interval between the dashed lines, the relative
humidity settings on the environmental chamber were deliberately decreased
and then increased. The estimated uncertainty of the data is �2% RH.
1238 J. Chin et al. / Polymer Degradation and Stability 92 (2007) 1234e1246
liner into the ballistic panel. For this particular model of bodyarmor, moisture that is present in the external environment oron the wearer’s body is readily transported into the ballisticfabric.
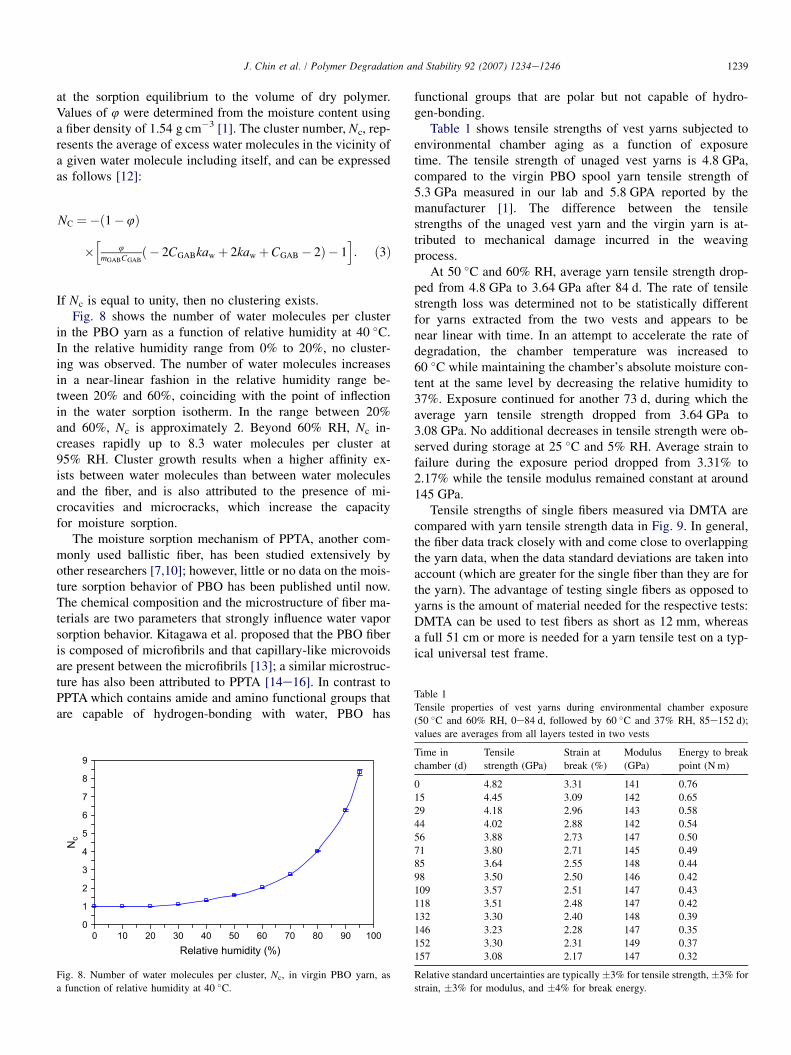
Moisture sorption measurements were carried out on virginPBO spool yarn to determine the mass uptake of water duringthe temperature/humidity exposure period. In the desorptionstage of the experiment, the moisture content of the virginPBO yarn stored under ambient conditions was approximately0.8e0.9 mass%, which compares well with mass loss at110 �C measured via thermogravimetric analysis (TGA). Asshown in Fig. 6, the equilibrium moisture content of the virginyarn at 50 �C and 60% RH and 60 �C and 37% RH is1.56� 0.02 mass% and 0.81� 0.02 mass%, respectively,with the higher temperature condition resulting in a lowermass uptake of water. Lower moisture uptake at higher tem-peratures has also previously been observed for poly( p-phe-nylene terephthalamide) (PPTA), another commonly usedballistic material [7,8], and nylon 6,6 [9].
Fig. 6 also shows the sorption behavior of the PBO yarn at50 �C and 60% RH followed by an in situ change in the exper-imental conditions to 60 �C and 37% RH. The moisture con-tent of the yarn decreases at the higher temperature, whichis consistent with previous observations, but does not com-pletely reach the moisture content of the yarn initially equili-brated at 60 �C and 37% RH. One possible explanation for thisdifference of 0.2 mass% between the two equilibrium moisturelevels is that the microvoids in the fiber trap adsorbed water,and this trapped water is not easily removed at the temperatureand relative humidity level used [10].
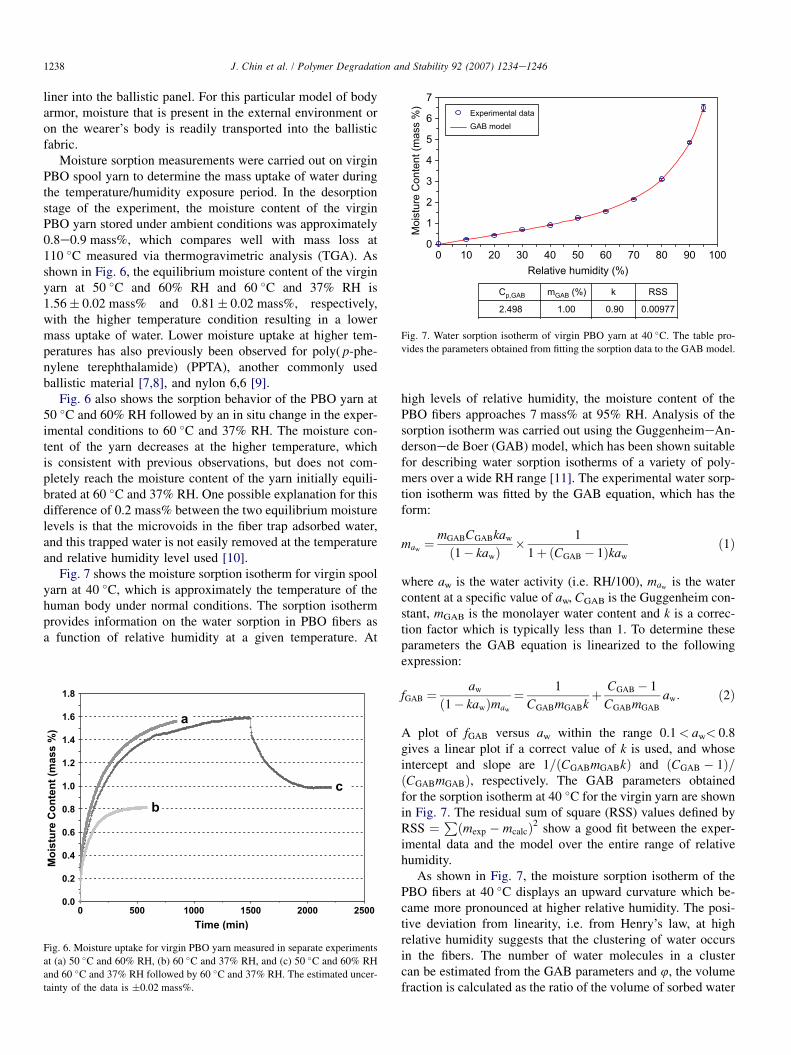
Fig. 7 shows the moisture sorption isotherm for virgin spoolyarn at 40 �C, which is approximately the temperature of thehuman body under normal conditions. The sorption isothermprovides information on the water sorption in PBO fibers asa function of relative humidity at a given temperature. At
0.0
0.2
0.4
0.6
0.8
1.0
1.2
1.4
1.6
1.8
0 500 1000 1500 2000 2500
Time (min)
Mo
istu
re C
on
ten
t (m
ass %
)
a
c
b
Fig. 6. Moisture uptake for virgin PBO yarn measured in separate experiments
at (a) 50 �C and 60% RH, (b) 60 �C and 37% RH, and (c) 50 �C and 60% RH
and 60 �C and 37% RH followed by 60 �C and 37% RH. The estimated uncer-
tainty of the data is �0.02 mass%.
high levels of relative humidity, the moisture content of thePBO fibers approaches 7 mass% at 95% RH. Analysis of thesorption isotherm was carried out using the GuggenheimeAn-dersonede Boer (GAB) model, which has been shown suitablefor describing water sorption isotherms of a variety of poly-mers over a wide RH range [11]. The experimental water sorp-tion isotherm was fitted by the GAB equation, which has theform:
maw ¼mGABCGABkaw
ð1� kawÞ� 1
1þ ðCGAB � 1Þkaw
ð1Þ
where aw is the water activity (i.e. RH/100), mawis the water
content at a specific value of aw, CGAB is the Guggenheim con-stant, mGAB is the monolayer water content and k is a correc-tion factor which is typically less than 1. To determine theseparameters the GAB equation is linearized to the followingexpression:
fGAB ¼aw
ð1� kawÞmaw
¼ 1
CGABmGABkþ CGAB � 1
CGABmGAB
aw: ð2Þ
A plot of fGAB versus aw within the range 0.1< aw< 0.8gives a linear plot if a correct value of k is used, and whoseintercept and slope are 1=ðCGABmGABkÞ and ðCGAB � 1Þ=ðCGABmGABÞ, respectively. The GAB parameters obtainedfor the sorption isotherm at 40 �C for the virgin yarn are shownin Fig. 7. The residual sum of square (RSS) values defined byRSS ¼
Pðmexp � mcalcÞ2 show a good fit between the exper-
imental data and the model over the entire range of relativehumidity.
As shown in Fig. 7, the moisture sorption isotherm of thePBO fibers at 40 �C displays an upward curvature which be-came more pronounced at higher relative humidity. The posi-tive deviation from linearity, i.e. from Henry’s law, at highrelative humidity suggests that the clustering of water occursin the fibers. The number of water molecules in a clustercan be estimated from the GAB parameters and 4, the volumefraction is calculated as the ratio of the volume of sorbed water
0
1
2
3
4
5
6
7
Relative humidity (%)0 10 20 30 40 50 60 70 80 90 100
Moi
stur
e C
onte
nt (m
ass
%)
Experimental dataGAB model
Cp,GAB mGAB (%) k RSS
2.498 1.00 0.90 0.00977
Fig. 7. Water sorption isotherm of virgin PBO yarn at 40 �C. The table pro-
vides the parameters obtained from fitting the sorption data to the GAB model.
1239J. Chin et al. / Polymer Degradation and Stability 92 (2007) 1234e1246
at the sorption equilibrium to the volume of dry polymer.Values of 4 were determined from the moisture content usinga fiber density of 1.54 g cm�3 [1]. The cluster number, Nc, rep-resents the average of excess water molecules in the vicinity ofa given water molecule including itself, and can be expressedas follows [12]:
NC ¼�ð1�4Þ
�h
4
mGABCGABð � 2CGABkaw þ 2kawþCGAB � 2Þ � 1
i: ð3Þ
If Nc is equal to unity, then no clustering exists.Fig. 8 shows the number of water molecules per cluster
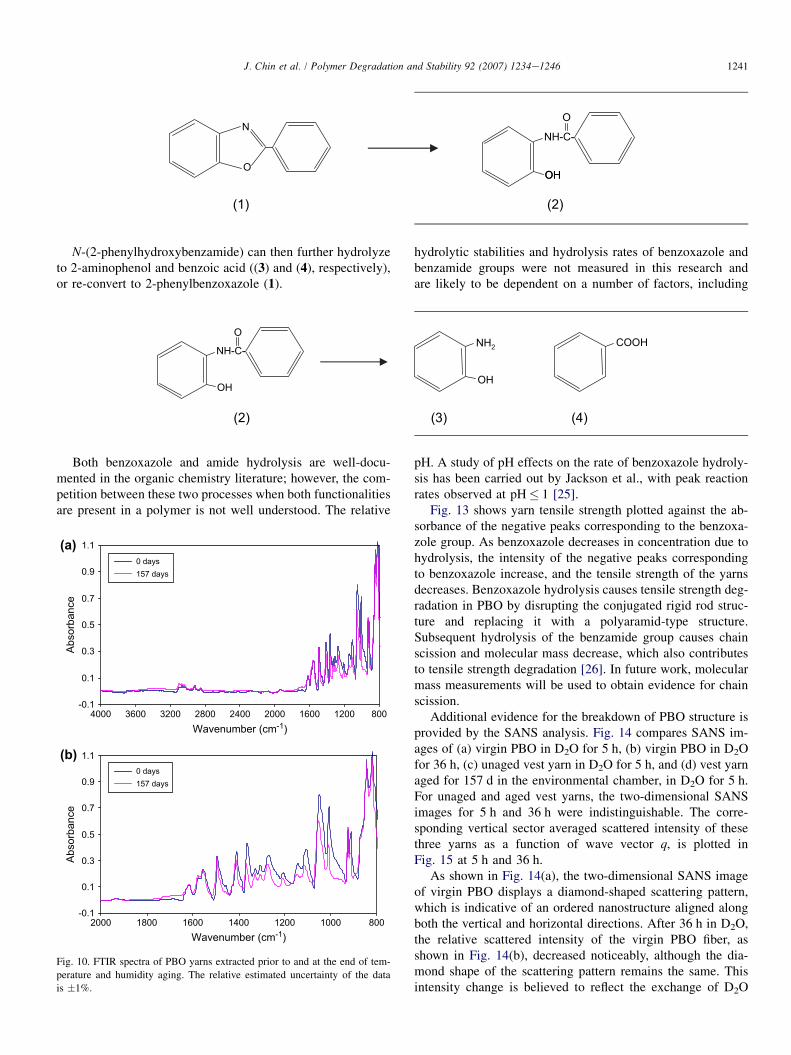
in the PBO yarn as a function of relative humidity at 40 �C.In the relative humidity range from 0% to 20%, no cluster-ing was observed. The number of water molecules increasesin a near-linear fashion in the relative humidity range be-tween 20% and 60%, coinciding with the point of inflectionin the water sorption isotherm. In the range between 20%and 60%, Nc is approximately 2. Beyond 60% RH, Nc in-creases rapidly up to 8.3 water molecules per cluster at95% RH. Cluster growth results when a higher affinity ex-ists between water molecules than between water moleculesand the fiber, and is also attributed to the presence of mi-crocavities and microcracks, which increase the capacityfor moisture sorption.
The moisture sorption mechanism of PPTA, another com-monly used ballistic fiber, has been studied extensively byother researchers [7,10]; however, little or no data on the mois-ture sorption behavior of PBO has been published until now.The chemical composition and the microstructure of fiber ma-terials are two parameters that strongly influence water vaporsorption behavior. Kitagawa et al. proposed that the PBO fiberis composed of microfibrils and that capillary-like microvoidsare present between the microfibrils [13]; a similar microstruc-ture has also been attributed to PPTA [14e16]. In contrast toPPTA which contains amide and amino functional groups thatare capable of hydrogen-bonding with water, PBO has
0
1
2
3
4
5
6
7
8
9
Nc
Relative humidity (%)0 10 20 30 40 50 60 70 80 90 100
Fig. 8. Number of water molecules per cluster, Nc, in virgin PBO yarn, as
a function of relative humidity at 40 �C.
functional groups that are polar but not capable of hydro-gen-bonding.
Table 1 shows tensile strengths of vest yarns subjected toenvironmental chamber aging as a function of exposuretime. The tensile strength of unaged vest yarns is 4.8 GPa,compared to the virgin PBO spool yarn tensile strength of5.3 GPa measured in our lab and 5.8 GPA reported by themanufacturer [1]. The difference between the tensilestrengths of the unaged vest yarn and the virgin yarn is at-tributed to mechanical damage incurred in the weavingprocess.
At 50 �C and 60% RH, average yarn tensile strength drop-ped from 4.8 GPa to 3.64 GPa after 84 d. The rate of tensilestrength loss was determined not to be statistically differentfor yarns extracted from the two vests and appears to benear linear with time. In an attempt to accelerate the rate ofdegradation, the chamber temperature was increased to60 �C while maintaining the chamber’s absolute moisture con-tent at the same level by decreasing the relative humidity to37%. Exposure continued for another 73 d, during which theaverage yarn tensile strength dropped from 3.64 GPa to3.08 GPa. No additional decreases in tensile strength were ob-served during storage at 25 �C and 5% RH. Average strain tofailure during the exposure period dropped from 3.31% to2.17% while the tensile modulus remained constant at around145 GPa.
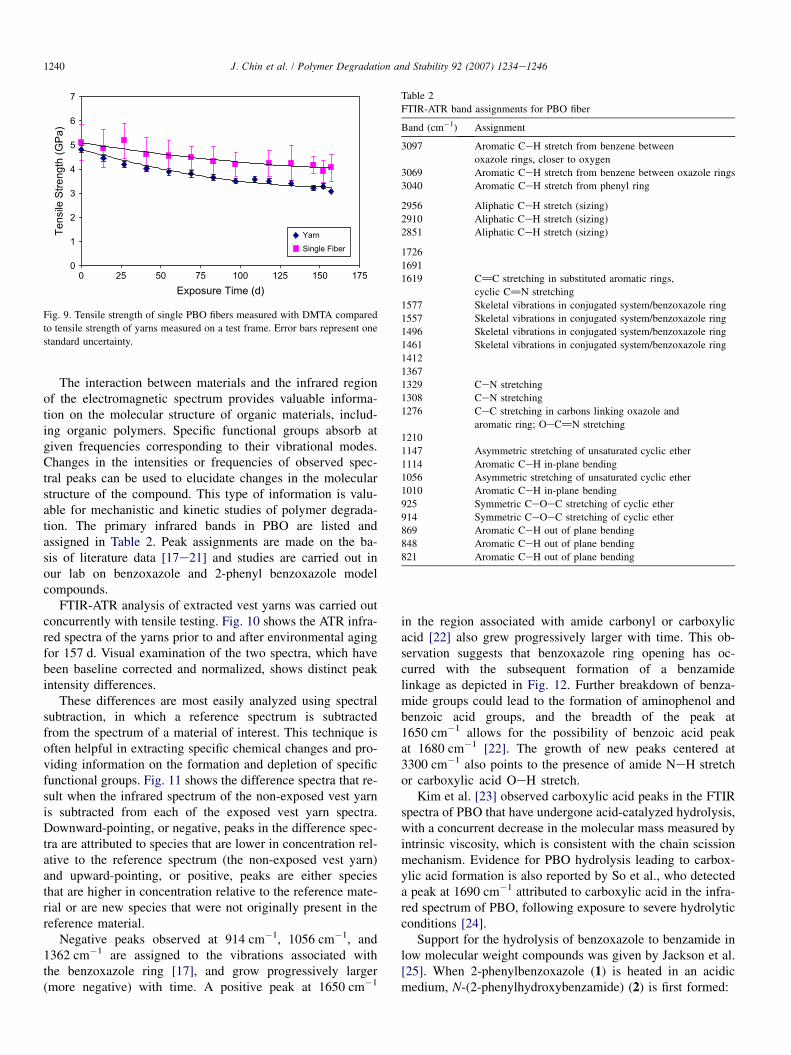
Tensile strengths of single fibers measured via DMTA arecompared with yarn tensile strength data in Fig. 9. In general,the fiber data track closely with and come close to overlappingthe yarn data, when the data standard deviations are taken intoaccount (which are greater for the single fiber than they are forthe yarn). The advantage of testing single fibers as opposed toyarns is the amount of material needed for the respective tests:DMTA can be used to test fibers as short as 12 mm, whereasa full 51 cm or more is needed for a yarn tensile test on a typ-ical universal test frame.
Table 1
Tensile properties of vest yarns during environmental chamber exposure
(50 �C and 60% RH, 0e84 d, followed by 60 �C and 37% RH, 85e152 d);
values are averages from all layers tested in two vests
Time in
chamber (d)
Tensile
strength (GPa)
Strain at
break (%)
Modulus
(GPa)
Energy to break
point (N m)
0 4.82 3.31 141 0.76
15 4.45 3.09 142 0.65
29 4.18 2.96 143 0.58
44 4.02 2.88 142 0.54
56 3.88 2.73 147 0.50
71 3.80 2.71 145 0.49
85 3.64 2.55 148 0.44
98 3.50 2.50 146 0.42
109 3.57 2.51 147 0.43
118 3.51 2.48 147 0.42
132 3.30 2.40 148 0.39
146 3.23 2.28 147 0.35
152 3.30 2.31 149 0.37
157 3.08 2.17 147 0.32
Relative standard uncertainties are typically�3% for tensile strength,�3% for
strain, �3% for modulus, and �4% for break energy.
1240 J. Chin et al. / Polymer Degradation and Stability 92 (2007) 1234e1246
The interaction between materials and the infrared regionof the electromagnetic spectrum provides valuable informa-tion on the molecular structure of organic materials, includ-ing organic polymers. Specific functional groups absorb atgiven frequencies corresponding to their vibrational modes.Changes in the intensities or frequencies of observed spec-tral peaks can be used to elucidate changes in the molecularstructure of the compound. This type of information is valu-able for mechanistic and kinetic studies of polymer degrada-tion. The primary infrared bands in PBO are listed andassigned in Table 2. Peak assignments are made on the ba-sis of literature data [17e21] and studies are carried out inour lab on benzoxazole and 2-phenyl benzoxazole modelcompounds.
FTIR-ATR analysis of extracted vest yarns was carried outconcurrently with tensile testing. Fig. 10 shows the ATR infra-red spectra of the yarns prior to and after environmental agingfor 157 d. Visual examination of the two spectra, which havebeen baseline corrected and normalized, shows distinct peakintensity differences.
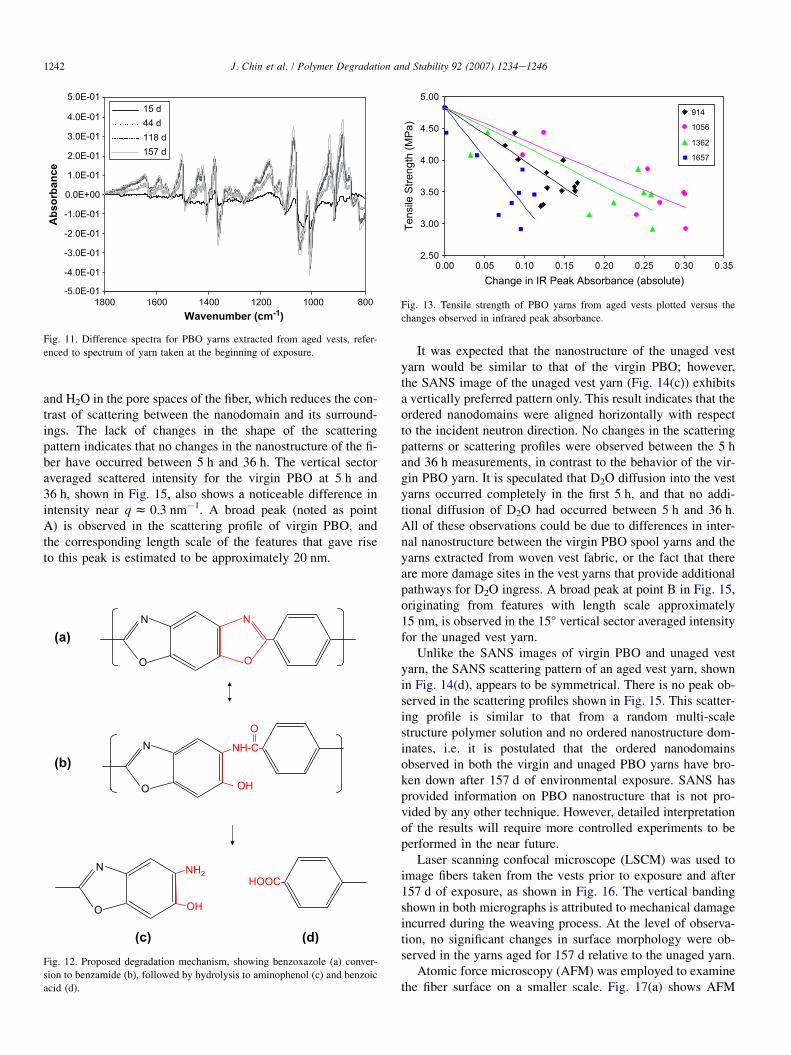
These differences are most easily analyzed using spectralsubtraction, in which a reference spectrum is subtractedfrom the spectrum of a material of interest. This technique isoften helpful in extracting specific chemical changes and pro-viding information on the formation and depletion of specificfunctional groups. Fig. 11 shows the difference spectra that re-sult when the infrared spectrum of the non-exposed vest yarnis subtracted from each of the exposed vest yarn spectra.Downward-pointing, or negative, peaks in the difference spec-tra are attributed to species that are lower in concentration rel-ative to the reference spectrum (the non-exposed vest yarn)and upward-pointing, or positive, peaks are either speciesthat are higher in concentration relative to the reference mate-rial or are new species that were not originally present in thereference material.
Negative peaks observed at 914 cm�1, 1056 cm�1, and1362 cm�1 are assigned to the vibrations associated withthe benzoxazole ring [17], and grow progressively larger(more negative) with time. A positive peak at 1650 cm�1
0
1
2
3
4
5
6
7
0 25 50 75 100 125 150 175Exposure Time (d)
Tens
ile S
treng
th (G
Pa)
Yarn
Single Fiber
Fig. 9. Tensile strength of single PBO fibers measured with DMTA compared
to tensile strength of yarns measured on a test frame. Error bars represent one
standard uncertainty.
in the region associated with amide carbonyl or carboxylicacid [22] also grew progressively larger with time. This ob-servation suggests that benzoxazole ring opening has oc-curred with the subsequent formation of a benzamidelinkage as depicted in Fig. 12. Further breakdown of benza-mide groups could lead to the formation of aminophenol andbenzoic acid groups, and the breadth of the peak at1650 cm�1 allows for the possibility of benzoic acid peakat 1680 cm�1 [22]. The growth of new peaks centered at3300 cm�1 also points to the presence of amide NeH stretchor carboxylic acid OeH stretch.
Kim et al. [23] observed carboxylic acid peaks in the FTIRspectra of PBO that have undergone acid-catalyzed hydrolysis,with a concurrent decrease in the molecular mass measured byintrinsic viscosity, which is consistent with the chain scissionmechanism. Evidence for PBO hydrolysis leading to carbox-ylic acid formation is also reported by So et al., who detecteda peak at 1690 cm�1 attributed to carboxylic acid in the infra-red spectrum of PBO, following exposure to severe hydrolyticconditions [24].
Support for the hydrolysis of benzoxazole to benzamide inlow molecular weight compounds was given by Jackson et al.[25]. When 2-phenylbenzoxazole (1) is heated in an acidicmedium, N-(2-phenylhydroxybenzamide) (2) is first formed:
Table 2
FTIR-ATR band assignments for PBO fiber
Band (cm�1) Assignment
3097 Aromatic CeH stretch from benzene between
oxazole rings, closer to oxygen
3069 Aromatic CeH stretch from benzene between oxazole rings
3040 Aromatic CeH stretch from phenyl ring
2956 Aliphatic CeH stretch (sizing)
2910 Aliphatic CeH stretch (sizing)
2851 Aliphatic CeH stretch (sizing)
1726
1691
1619 C]C stretching in substituted aromatic rings,
cyclic C]N stretching
1577 Skeletal vibrations in conjugated system/benzoxazole ring
1557 Skeletal vibrations in conjugated system/benzoxazole ring
1496 Skeletal vibrations in conjugated system/benzoxazole ring
1461 Skeletal vibrations in conjugated system/benzoxazole ring
1412
1367
1329 CeN stretching
1308 CeN stretching
1276 CeC stretching in carbons linking oxazole and
aromatic ring; OeC]N stretching
1210
1147 Asymmetric stretching of unsaturated cyclic ether
1114 Aromatic CeH in-plane bending
1056 Asymmetric stretching of unsaturated cyclic ether
1010 Aromatic CeH in-plane bending
925 Symmetric CeOeC stretching of cyclic ether
914 Symmetric CeOeC stretching of cyclic ether
869 Aromatic CeH out of plane bending
848 Aromatic CeH out of plane bending
821 Aromatic CeH out of plane bending
1241J. Chin et al. / Polymer Degradation and Stability 92 (2007) 1234e1246
(2)(1)
N
O
NH-C-
OHOH
O
N-(2-phenylhydroxybenzamide) can then further hydrolyzeto 2-aminophenol and benzoic acid ((3) and (4), respectively),or re-convert to 2-phenylbenzoxazole (1).
hydrolytic stabilities and hydrolysis rates of benzoxazole andbenzamide groups were not measured in this research andare likely to be dependent on a number of factors, including
(2) (3) (4)
NH-C-
OH
ONH2
OH
COOH
Both benzoxazole and amide hydrolysis are well-docu-mented in the organic chemistry literature; however, the com-petition between these two processes when both functionalitiesare present in a polymer is not well understood. The relative
-0.1
0.1
0.3
0.5
0.7
0.9
1.1
80012001600200024002800320036004000Wavenumber (cm-1)
Wavenumber (cm-1)
Abso
rban
ce
(a)
-0.1
0.1
0.3
0.5
0.7
0.9
1.1
800100012001400160018002000
Abso
rban
ce
0 days157 days
0 days157 days
(b)
Fig. 10. FTIR spectra of PBO yarns extracted prior to and at the end of tem-
perature and humidity aging. The relative estimated uncertainty of the data
is �1%.
pH. A study of pH effects on the rate of benzoxazole hydroly-sis has been carried out by Jackson et al., with peak reactionrates observed at pH� 1 [25].
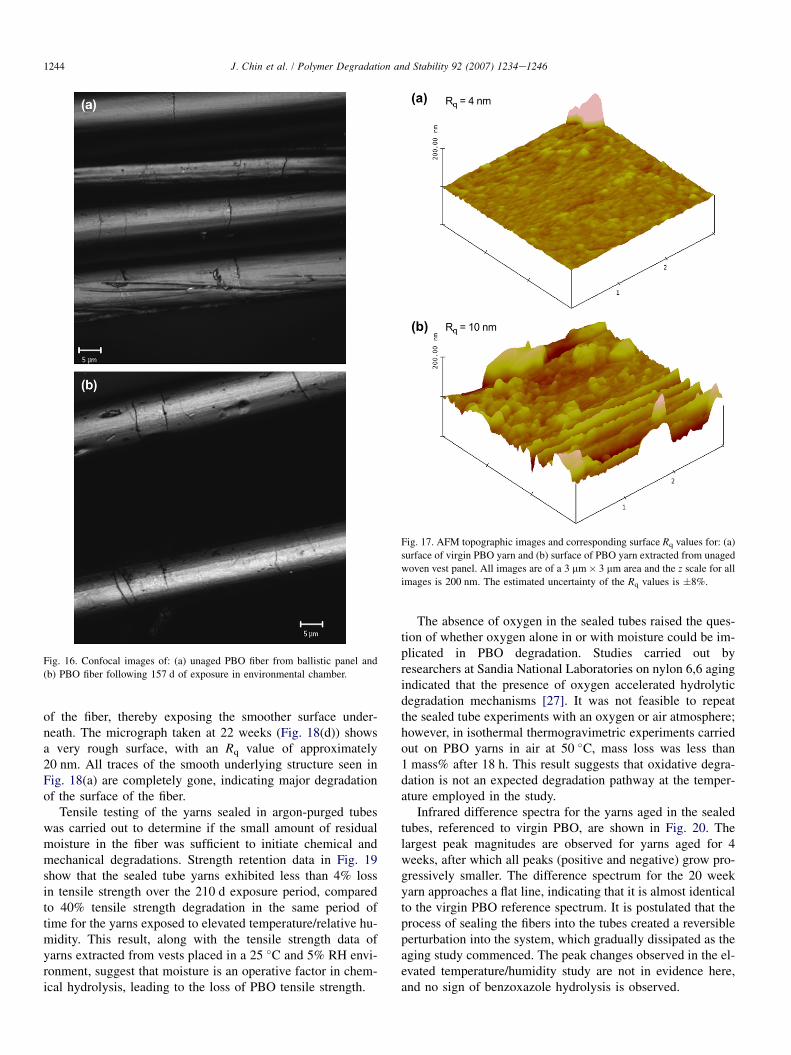
Fig. 13 shows yarn tensile strength plotted against the ab-sorbance of the negative peaks corresponding to the benzoxa-zole group. As benzoxazole decreases in concentration due tohydrolysis, the intensity of the negative peaks correspondingto benzoxazole increase, and the tensile strength of the yarnsdecreases. Benzoxazole hydrolysis causes tensile strength deg-radation in PBO by disrupting the conjugated rigid rod struc-ture and replacing it with a polyaramid-type structure.Subsequent hydrolysis of the benzamide group causes chainscission and molecular mass decrease, which also contributesto tensile strength degradation [26]. In future work, molecularmass measurements will be used to obtain evidence for chainscission.
Additional evidence for the breakdown of PBO structure isprovided by the SANS analysis. Fig. 14 compares SANS im-ages of (a) virgin PBO in D2O for 5 h, (b) virgin PBO in D2Ofor 36 h, (c) unaged vest yarn in D2O for 5 h, and (d) vest yarnaged for 157 d in the environmental chamber, in D2O for 5 h.For unaged and aged vest yarns, the two-dimensional SANSimages for 5 h and 36 h were indistinguishable. The corre-sponding vertical sector averaged scattered intensity of thesethree yarns as a function of wave vector q, is plotted inFig. 15 at 5 h and 36 h.
As shown in Fig. 14(a), the two-dimensional SANS imageof virgin PBO displays a diamond-shaped scattering pattern,which is indicative of an ordered nanostructure aligned alongboth the vertical and horizontal directions. After 36 h in D2O,the relative scattered intensity of the virgin PBO fiber, asshown in Fig. 14(b), decreased noticeably, although the dia-mond shape of the scattering pattern remains the same. Thisintensity change is believed to reflect the exchange of D2O
1242 J. Chin et al. / Polymer Degradation and Stability 92 (2007) 1234e1246
and H2O in the pore spaces of the fiber, which reduces the con-trast of scattering between the nanodomain and its surround-ings. The lack of changes in the shape of the scatteringpattern indicates that no changes in the nanostructure of the fi-ber have occurred between 5 h and 36 h. The vertical sectoraveraged scattered intensity for the virgin PBO at 5 h and36 h, shown in Fig. 15, also shows a noticeable difference inintensity near q z 0.3 nm�1. A broad peak (noted as pointA) is observed in the scattering profile of virgin PBO, andthe corresponding length scale of the features that gave riseto this peak is estimated to be approximately 20 nm.
-5.0E-01
-4.0E-01
-3.0E-01
-2.0E-01
-1.0E-01
0.0E+00
1.0E-01
2.0E-01
3.0E-01
4.0E-01
5.0E-01
80010001200140016001800Wavenumber (cm
-1)
Ab
so
rb
an
ce
15 d44 d118 d157 d
Fig. 11. Difference spectra for PBO yarns extracted from aged vests, refer-
enced to spectrum of yarn taken at the beginning of exposure.
N
O
N
O
NH-C-
OH
ON
O
HOOC-NH2
OH
N
O
(a)
(b)
(c) (d)
Fig. 12. Proposed degradation mechanism, showing benzoxazole (a) conver-
sion to benzamide (b), followed by hydrolysis to aminophenol (c) and benzoic
acid (d).
It was expected that the nanostructure of the unaged vestyarn would be similar to that of the virgin PBO; however,the SANS image of the unaged vest yarn (Fig. 14(c)) exhibitsa vertically preferred pattern only. This result indicates that theordered nanodomains were aligned horizontally with respectto the incident neutron direction. No changes in the scatteringpatterns or scattering profiles were observed between the 5 hand 36 h measurements, in contrast to the behavior of the vir-gin PBO yarn. It is speculated that D2O diffusion into the vestyarns occurred completely in the first 5 h, and that no addi-tional diffusion of D2O had occurred between 5 h and 36 h.All of these observations could be due to differences in inter-nal nanostructure between the virgin PBO spool yarns and theyarns extracted from woven vest fabric, or the fact that thereare more damage sites in the vest yarns that provide additionalpathways for D2O ingress. A broad peak at point B in Fig. 15,originating from features with length scale approximately15 nm, is observed in the 15� vertical sector averaged intensityfor the unaged vest yarn.
Unlike the SANS images of virgin PBO and unaged vestyarn, the SANS scattering pattern of an aged vest yarn, shownin Fig. 14(d), appears to be symmetrical. There is no peak ob-served in the scattering profiles shown in Fig. 15. This scatter-ing profile is similar to that from a random multi-scalestructure polymer solution and no ordered nanostructure dom-inates, i.e. it is postulated that the ordered nanodomainsobserved in both the virgin and unaged PBO yarns have bro-ken down after 157 d of environmental exposure. SANS hasprovided information on PBO nanostructure that is not pro-vided by any other technique. However, detailed interpretationof the results will require more controlled experiments to beperformed in the near future.
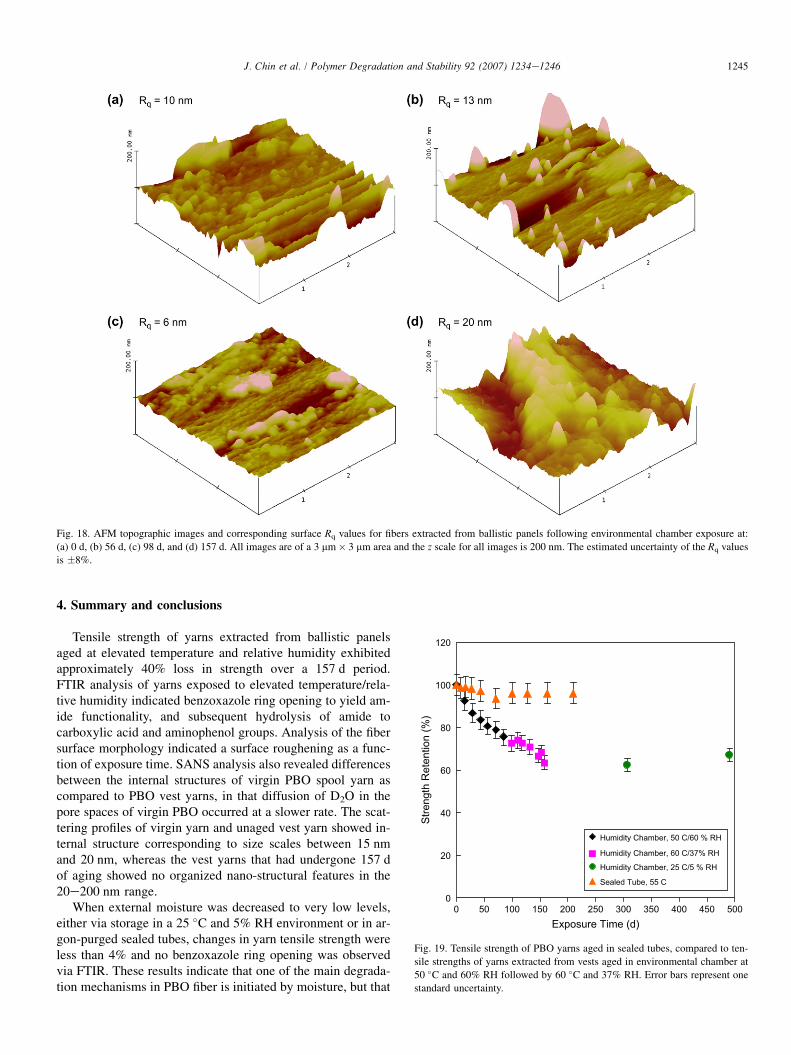
Laser scanning confocal microscope (LSCM) was used toimage fibers taken from the vests prior to exposure and after157 d of exposure, as shown in Fig. 16. The vertical bandingshown in both micrographs is attributed to mechanical damageincurred during the weaving process. At the level of observa-tion, no significant changes in surface morphology were ob-served in the yarns aged for 157 d relative to the unaged yarn.
Atomic force microscopy (AFM) was employed to examinethe fiber surface on a smaller scale. Fig. 17(a) shows AFM
2.50
3.00
3.50
4.00
4.50
5.00
0.00 0.350.300.250.200.150.100.05Change in IR Peak Absorbance (absolute)
Tens
ile S
treng
th (M
Pa)
914
1056
1362
1657
Fig. 13. Tensile strength of PBO yarns from aged vests plotted versus the
changes observed in infrared peak absorbance.

1243J. Chin et al. / Polymer Degradation and Stability 92 (2007) 1234e1246
Fig. 14. Two-dimensional (2D) SANS images of: (a) virgin PBO yarn in D2O for 5 h, (b) virgin PBO yarn in D2O for 36 h, (c) unaged vest yarn in D2O for 5 h, and
(d) vest yarn after 157 d of environmental chamber exposure, in D2O for 5 h. For unaged and aged vest yarns, the two-dimensional SANS images for 5 h and 36 h
were indistinguishable.
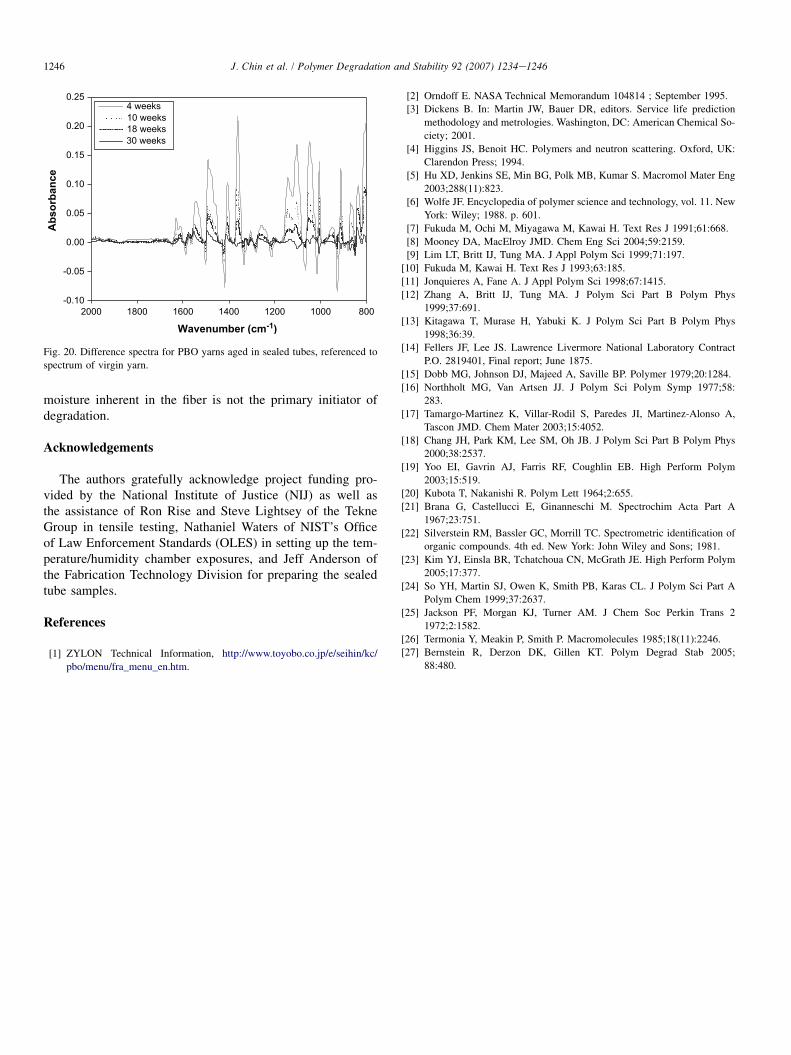
micrographs of the surface of a virgin fiber compared with thesurface of a fiber extracted from a woven vest in Fig. 17(b).The fiber after weaving, as shown in Fig. 17(b), is consider-ably rougher than the virgin fiber shown in Fig. 17(a), furthersupporting the speculation that mechanical damage is incurredduring weaving. This speculation is further reinforced by thecomparison of the root mean square roughness (Rq) valuesof approximately 4 nm for the virgin fiber and approximately10 nm for the fiber extracted from the woven fabric.
AFM micrographs of fiber surfaces as a function of ele-vated temperature and humidity exposure are shown inFig. 18. As exposure time increases, this surface roughnessalso increases. After 9 weeks of exposure (Fig. 18(b)) the sur-face roughness has increased from an Rq of approximately10 nm to an Rq of approximately 13 nm, however, the under-lying smooth surface structure is still visible in some areas.After 14 weeks of exposure (Fig. 18(c)) the fiber is somewhatsmoother, with an Rq value of 6 nm. This lower Rq could beattributed to a sloughing off of some of the larger rough areas
0.1
A, 20 nm
B, 15 nm
1
0.1
1
10
100
q(nm-1)
Virgin PBO, 5 hVirgin PBO, 36 hUnaged Vest Yarn, 5 hUnaged Vest Yarn, 36 hAged Vest Yarn, 5 hAged Vest Yarn, 36 h
Scat
tere
d In
tens
ity (a
.u.)
Fig. 15. The 15� vertical sector averaged scattered intensity obtained from
Fig. 14 as a function of wave vector q, for three different yarns in D2O, mea-
sured at 5 h and 36 h. The estimated uncertainty of the data is 1%.
1244 J. Chin et al. / Polymer Degradation and Stability 92 (2007) 1234e1246
of the fiber, thereby exposing the smoother surface under-neath. The micrograph taken at 22 weeks (Fig. 18(d)) showsa very rough surface, with an Rq value of approximately20 nm. All traces of the smooth underlying structure seen inFig. 18(a) are completely gone, indicating major degradationof the surface of the fiber.
Tensile testing of the yarns sealed in argon-purged tubeswas carried out to determine if the small amount of residualmoisture in the fiber was sufficient to initiate chemical andmechanical degradations. Strength retention data in Fig. 19show that the sealed tube yarns exhibited less than 4% lossin tensile strength over the 210 d exposure period, comparedto 40% tensile strength degradation in the same period oftime for the yarns exposed to elevated temperature/relative hu-midity. This result, along with the tensile strength data ofyarns extracted from vests placed in a 25 �C and 5% RH envi-ronment, suggest that moisture is an operative factor in chem-ical hydrolysis, leading to the loss of PBO tensile strength.
Fig. 16. Confocal images of: (a) unaged PBO fiber from ballistic panel and
(b) PBO fiber following 157 d of exposure in environmental chamber.
The absence of oxygen in the sealed tubes raised the ques-tion of whether oxygen alone in or with moisture could be im-plicated in PBO degradation. Studies carried out byresearchers at Sandia National Laboratories on nylon 6,6 agingindicated that the presence of oxygen accelerated hydrolyticdegradation mechanisms [27]. It was not feasible to repeatthe sealed tube experiments with an oxygen or air atmosphere;however, in isothermal thermogravimetric experiments carriedout on PBO yarns in air at 50 �C, mass loss was less than1 mass% after 18 h. This result suggests that oxidative degra-dation is not an expected degradation pathway at the temper-ature employed in the study.
Infrared difference spectra for the yarns aged in the sealedtubes, referenced to virgin PBO, are shown in Fig. 20. Thelargest peak magnitudes are observed for yarns aged for 4weeks, after which all peaks (positive and negative) grow pro-gressively smaller. The difference spectrum for the 20 weekyarn approaches a flat line, indicating that it is almost identicalto the virgin PBO reference spectrum. It is postulated that theprocess of sealing the fibers into the tubes created a reversibleperturbation into the system, which gradually dissipated as theaging study commenced. The peak changes observed in the el-evated temperature/humidity study are not in evidence here,and no sign of benzoxazole hydrolysis is observed.
Fig. 17. AFM topographic images and corresponding surface Rq values for: (a)
surface of virgin PBO yarn and (b) surface of PBO yarn extracted from unaged
woven vest panel. All images are of a 3 mm� 3 mm area and the z scale for all
images is 200 nm. The estimated uncertainty of the Rq values is �8%.
1245J. Chin et al. / Polymer Degradation and Stability 92 (2007) 1234e1246
Fig. 18. AFM topographic images and corresponding surface Rq values for fibers extracted from ballistic panels following environmental chamber exposure at:
(a) 0 d, (b) 56 d, (c) 98 d, and (d) 157 d. All images are of a 3 mm� 3 mm area and the z scale for all images is 200 nm. The estimated uncertainty of the Rq values
is �8%.
4. Summary and conclusions
Tensile strength of yarns extracted from ballistic panelsaged at elevated temperature and relative humidity exhibitedapproximately 40% loss in strength over a 157 d period.FTIR analysis of yarns exposed to elevated temperature/rela-tive humidity indicated benzoxazole ring opening to yield am-ide functionality, and subsequent hydrolysis of amide tocarboxylic acid and aminophenol groups. Analysis of the fibersurface morphology indicated a surface roughening as a func-tion of exposure time. SANS analysis also revealed differencesbetween the internal structures of virgin PBO spool yarn ascompared to PBO vest yarns, in that diffusion of D2O in thepore spaces of virgin PBO occurred at a slower rate. The scat-tering profiles of virgin yarn and unaged vest yarn showed in-ternal structure corresponding to size scales between 15 nmand 20 nm, whereas the vest yarns that had undergone 157 dof aging showed no organized nano-structural features in the20e200 nm range.
When external moisture was decreased to very low levels,either via storage in a 25 �C and 5% RH environment or in ar-gon-purged sealed tubes, changes in yarn tensile strength wereless than 4% and no benzoxazole ring opening was observedvia FTIR. These results indicate that one of the main degrada-tion mechanisms in PBO fiber is initiated by moisture, but that
00 50 100 150 200 250 300 350 400 450 500
20
40
60
80
100
120
Exposure Time (d)
Stre
ngth
Ret
entio
n (%
)
Humidity Chamber, 50 C/60 % RH
Humidity Chamber, 60 C/37% RH
Humidity Chamber, 25 C/5 % RH
Sealed Tube, 55 C
Fig. 19. Tensile strength of PBO yarns aged in sealed tubes, compared to ten-
sile strengths of yarns extracted from vests aged in environmental chamber at
50 �C and 60% RH followed by 60 �C and 37% RH. Error bars represent one
standard uncertainty.
1246 J. Chin et al. / Polymer Degradation and Stability 92 (2007) 1234e1246
moisture inherent in the fiber is not the primary initiator ofdegradation.
Acknowledgements
The authors gratefully acknowledge project funding pro-vided by the National Institute of Justice (NIJ) as well asthe assistance of Ron Rise and Steve Lightsey of the TekneGroup in tensile testing, Nathaniel Waters of NIST’s Officeof Law Enforcement Standards (OLES) in setting up the tem-perature/humidity chamber exposures, and Jeff Anderson ofthe Fabrication Technology Division for preparing the sealedtube samples.
References
[1] ZYLON Technical Information, http://www.toyobo.co.jp/e/seihin/kc/
pbo/menu/fra_menu_en.htm.
-0.10
-0.05
0.00
0.05
0.10
0.15
0.20
0.25
800100012001400160018002000
Wavenumber (cm-1
)
Ab
so
rb
an
ce
4 weeks10 weeks18 weeks30 weeks
Fig. 20. Difference spectra for PBO yarns aged in sealed tubes, referenced to
spectrum of virgin yarn.
[2] Orndoff E. NASA Technical Memorandum 104814 ; September 1995.
[3] Dickens B. In: Martin JW, Bauer DR, editors. Service life prediction
methodology and metrologies. Washington, DC: American Chemical So-
ciety; 2001.
[4] Higgins JS, Benoit HC. Polymers and neutron scattering. Oxford, UK:
Clarendon Press; 1994.
[5] Hu XD, Jenkins SE, Min BG, Polk MB, Kumar S. Macromol Mater Eng
2003;288(11):823.
[6] Wolfe JF. Encyclopedia of polymer science and technology, vol. 11. New
York: Wiley; 1988. p. 601.
[7] Fukuda M, Ochi M, Miyagawa M, Kawai H. Text Res J 1991;61:668.
[8] Mooney DA, MacElroy JMD. Chem Eng Sci 2004;59:2159.
[9] Lim LT, Britt IJ, Tung MA. J Appl Polym Sci 1999;71:197.
[10] Fukuda M, Kawai H. Text Res J 1993;63:185.
[11] Jonquieres A, Fane A. J Appl Polym Sci 1998;67:1415.
[12] Zhang A, Britt IJ, Tung MA. J Polym Sci Part B Polym Phys
1999;37:691.
[13] Kitagawa T, Murase H, Yabuki K. J Polym Sci Part B Polym Phys
1998;36:39.
[14] Fellers JF, Lee JS. Lawrence Livermore National Laboratory Contract
P.O. 2819401, Final report; June 1875.
[15] Dobb MG, Johnson DJ, Majeed A, Saville BP. Polymer 1979;20:1284.
[16] Northholt MG, Van Artsen JJ. J Polym Sci Polym Symp 1977;58:
283.
[17] Tamargo-Martinez K, Villar-Rodil S, Paredes JI, Martinez-Alonso A,
Tascon JMD. Chem Mater 2003;15:4052.
[18] Chang JH, Park KM, Lee SM, Oh JB. J Polym Sci Part B Polym Phys
2000;38:2537.
[19] Yoo EI, Gavrin AJ, Farris RF, Coughlin EB. High Perform Polym
2003;15:519.
[20] Kubota T, Nakanishi R. Polym Lett 1964;2:655.
[21] Brana G, Castellucci E, Ginanneschi M. Spectrochim Acta Part A
1967;23:751.
[22] Silverstein RM, Bassler GC, Morrill TC. Spectrometric identification of
organic compounds. 4th ed. New York: John Wiley and Sons; 1981.
[23] Kim YJ, Einsla BR, Tchatchoua CN, McGrath JE. High Perform Polym
2005;17:377.
[24] So YH, Martin SJ, Owen K, Smith PB, Karas CL. J Polym Sci Part A
Polym Chem 1999;37:2637.
[25] Jackson PF, Morgan KJ, Turner AM. J Chem Soc Perkin Trans 2
1972;2:1582.
[26] Termonia Y, Meakin P, Smith P. Macromolecules 1985;18(11):2246.
[27] Bernstein R, Derzon DK, Gillen KT. Polym Degrad Stab 2005;
88:480.