ten year population projections for the arkansas …
TRANSCRIPT

TEN YEAR POPULATION PROJECTIONS FOR THE ARKANSAS PAROLE AND PROBATION
POPULATIONS BRIEFING BOOK
By
Wendy Naro-Ware Roger Ocker
June 2010
JFA Associates Washington, D.C.
Conducting Justice and Corrections Research for Effective Policy Making
Denver Office: 720 Kearney St. Denver, CO 80220 303-399-3218 (ph) 303-321-0363 (fax)
West Coat Office: 2540 Cayman Rd. Malibu, CA 90265
East Coast Office: 5 Walter Houpe Ct. NE Washington, DC 20002
www.JFA-Associates.com
1
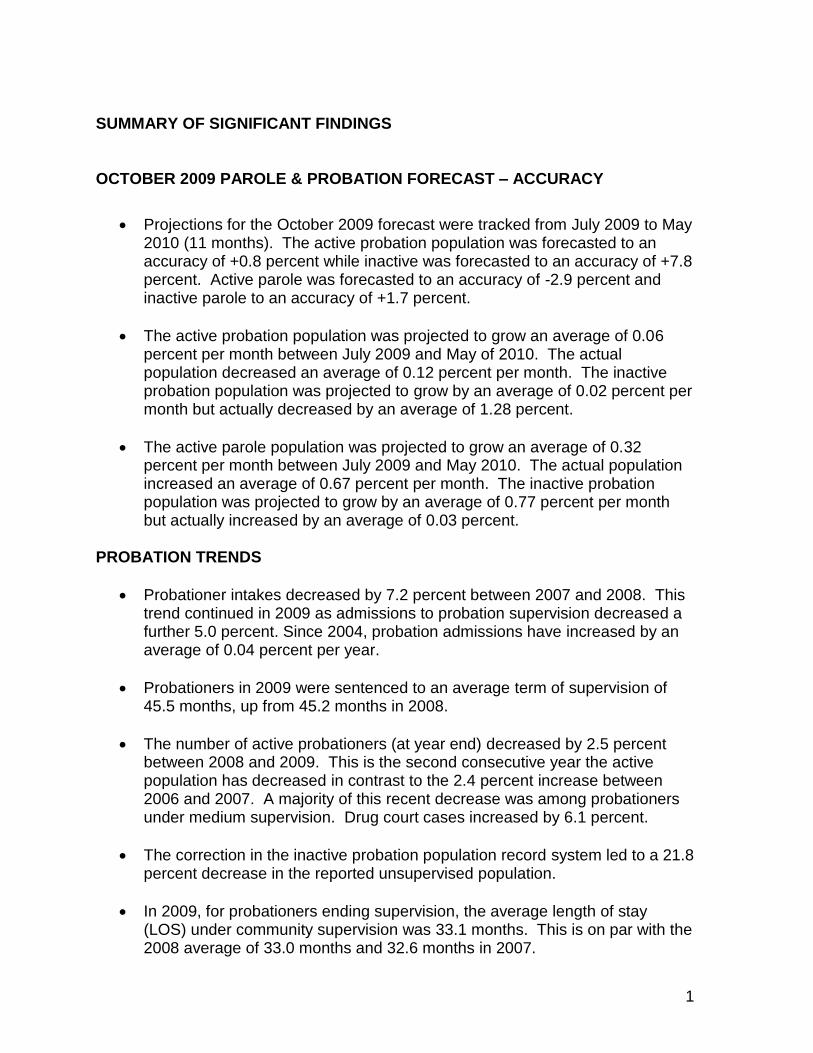
SUMMARY OF SIGNIFICANT FINDINGS
OCTOBER 2009 PAROLE & PROBATION FORECAST – ACCURACY
Projections for the October 2009 forecast were tracked from July 2009 to May 2010 (11 months). The active probation population was forecasted to an accuracy of +0.8 percent while inactive was forecasted to an accuracy of +7.8 percent. Active parole was forecasted to an accuracy of -2.9 percent and inactive parole to an accuracy of +1.7 percent.
The active probation population was projected to grow an average of 0.06 percent per month between July 2009 and May of 2010. The actual population decreased an average of 0.12 percent per month. The inactive probation population was projected to grow by an average of 0.02 percent per month but actually decreased by an average of 1.28 percent.
The active parole population was projected to grow an average of 0.32 percent per month between July 2009 and May 2010. The actual population increased an average of 0.67 percent per month. The inactive probation population was projected to grow by an average of 0.77 percent per month but actually increased by an average of 0.03 percent.
PROBATION TRENDS
Probationer intakes decreased by 7.2 percent between 2007 and 2008. This trend continued in 2009 as admissions to probation supervision decreased a further 5.0 percent. Since 2004, probation admissions have increased by an average of 0.04 percent per year.
Probationers in 2009 were sentenced to an average term of supervision of 45.5 months, up from 45.2 months in 2008.
The number of active probationers (at year end) decreased by 2.5 percent between 2008 and 2009. This is the second consecutive year the active population has decreased in contrast to the 2.4 percent increase between 2006 and 2007. A majority of this recent decrease was among probationers under medium supervision. Drug court cases increased by 6.1 percent.
The correction in the inactive probation population record system led to a 21.8 percent decrease in the reported unsupervised population.
In 2009, for probationers ending supervision, the average length of stay (LOS) under community supervision was 33.1 months. This is on par with the 2008 average of 33.0 months and 32.6 months in 2007.

2
Probation discharges averaged a LOS of 40.4 months while technical revocations and new felony revocations averaged a LOS of 18.5 and 20.7 months respectively.
Revocations (new charge and technical together) to the ADC accounted for 12.2 percent (1,067 persons) of probation releases in 2009. This is down from 12.9 percent (1,157 persons) of probation releases in 2008.
PAROLE TRENDS
Parole intakes increased by 6.7 percent in 2008. This is up from a 6.3 percent increase between 2007 and 2008. The increase in intakes was fueled by a 4.6 percent increase in ADC releases, an 8.6 percent increase in DCC transfers and a 31.8 percent increase in intakes from ISC.
Parolees in 2008 were sentenced to an average term of supervision of 56.6 months, up slightly from 54.7 months in 2008 and 54.2 months in 2007.
Active parolees increased significantly in 2009, up 9.8 percent. This is in contrast to 2008 when the number of active parolees (at year end) decreased slightly by 0.2 percent.
Parole technical revocations to the ADC accounted for 10.2 percent of parole releases in 2009 (or 836 cases)
o 8.2 percent (683) of parole releases in 2008. o 5.3 percent (411 cases) of parole releases in 2007. o This number was 276 in 2006.
Releases from parole supervision decreased by 2.5 percent between 2008 and 2009. Technical revocations increased by 13.8 percent. Discharges decreased by 14.8 percent.
In 2009, the average parolee had served 21.7 months upon release, down 6.9 percent from an average of 23.3 months for 2008.
Technical parole violators were supervised an average of 14.1 months before being revoked while new felony violators had served 16.9 months.
PROJECTIONS
At the end of December 2009, the active probation population was 20,654. The population is projected to be 20,391 at year end 2010. By December 2021, the number of persons under active parole supervision is projected to

3
be 21,037. The projected change represents average annual increases of 0.3 percent per year through the year 2021.
At the end of December 2009, the inactive probation population was 11,045. The population is projected to be 10,370 at year end 2010. By December 2021, the number of persons under inactive parole supervision is projected to be 10,705. The projected growth represents average annual increases of 0.3% per year through the year 2021.
Note: probation projections now include drug court cases.
At the end of December 2009, the active parole population was 13,679. The population is projected to increase to 14,008 in year end 2010. By December 2021, the number of persons under active parole supervision is projected to be 18,690. The projected change represents average annual increases of 2.7 percent per year through the year 2021.
At the end of December 2009, the inactive parole population was 7,766. The population is projected to increase to 7,880 in 2010. By December 2021, the number of persons under inactive parole supervision is projected to be 10,719. The projected growth represents average annual increases of 2.8 percent per year through the year 2021.

4
TREND TABLES
I. CRIME & POPULATION TRENDS
TABLE 1 ARKANSAS PROJECTED DEMOGRAPHIC TRENDS 2009-2020
Year Projected
Population Total
Growth
2009 (Actual) 2,889,450 N/A
2010 2,875,039 -0.5%
2015 2,968,913 2.8%
2020 3,060,219 5.9%
Source: www.census.gov
TABLE 2
TRENDS IN THE GROWTH OF ARKANSAS BORDER STATES 2000-2009
Border State Growth Rank
Louisiana 0.5% 49th
Mississippi 3.6% 37th
Oklahoma 6.7% 27th
Missouri 6.8% 25th
Arkansas 7.9% 21st
Tennessee 10.4% 16th
Texas 18.3% 6th Source: www.census.gov

5
TABLE 3 CHANGES IN THE NUMBER OF UCR CRIMES REPORTED TO POLICE 1990-
2008
Year Total Reported
Crime Violent Crime
Property Crime
1990 – 1995 3.6% 3.9% 4.5%
1995 – 1999 -13.8% -23.1% -12.6%
2000 – 2003 -1.0% 2.5% -1.0%
2004 – 2007 -4.3% 0.2% -4.9% Source: www.FBI.gov
TABLE 4 UCR CRIME RATES FOR ARKANSAS AND BORDER STATES - 2008
State Violent Crime
Rate
Property Crime Rate
Arkansas 503.4 3,835.1
Louisiana 656.2 3,823.1
Missouri 504.4 3,663.7
Mississippi 284.9 2,940.8
Oklahoma 526.7 3,442.4
Tennessee 722.4 4,042.6
Texas 507.9 3,985.6 Source: www.fbi.gov
TABLE 5 BORDER STATE PROBATION & PAROLE POPULATIONS
State Probation Population
1 Year Growth
Probationers per 100,000 Residents
Parole Population
1 Year Growth
Parolees per 100,000
Residents
Louisiana 40,025 2.6% 1,205 24,636 2.3% 742
Missouri 57,360 2.0% 1,272 20,683 10.9% 459
Mississippi 22,267 3.0% 1,020 2,922 45.0% 134
Oklahoma 27,940 2 1,016 3,073 4.9% 112
Tennessee 58,109 3.9% 1,219 10,578 0.9% 222
Texas 427,080 -1.7% 2,401 102,921 1.2% 579
Source: Bureau of Justice Statistics, Probation and Parole in the United States 2008 Statistical Tables

6
TABLE 6 COMPARISON BETWEEN UNITED STATES AND ARKANSAS
ON KEY POPULATION AND CRIME
United States Arkansas
POPULATION1
Total Population (7/1/09) 307,006,550 2,889,450
Change in Population
1-year change (7/1/08 – 7/1/09) 0.9% 1.2%
9-year change (7/1/00 – 7/1/09) 8.8% 7.9%
CRIME RATE2 (Rate per 100,000 inhabitants)
UCR Part I Reported Crime Rates (2008)
Total 3,212.5 4,338.5
Violent 454.5 503.4
Property 3,667.0 3,835.1
Change in Total Reported Crime Rate
1-year change (2007-2008) -1.7% -3.0%
10-year change (1998-2008) -20.6% -1.3%
PAROLE POPULATION (2009)
Total Parolees (State only) 729,540* 21,445
1-year change (2008-2009) 0.0% 7.4%
7-year change (2001-2009) 11.7% 97.7%
Average annual change (2001-2009) 1.6% 10.9%
Supervision Rate (per 100,000 inhabitants)3 315 712
PROBATION POPULATION (2009)
Total Probationers (State only) 4,211,049* 29,793
1-year change (2008-2009) 0.9% -3.9%
5-year change (2001-2009) 8.0% 5.1%
Average annual change (2001-2009) 1.1% 0.8%
Supervision Rate (per 100,000 inhabitants)4 1,835 1,055 *Most recent figures available are for year-end 2008
1 U.S. Census Bureau, Population Division. Population estimates for July 1, 2009.
2 Uniform Crime Reports, Crime in the United States – 2008, Federal Bureau of Investigation.
3 AR Rates were calculated by using U.S. Census population estimates for July 1, 2009 and parole
population for 6/30/2009. 4 AR Rates were calculated by using U.S. Census population estimates for July 1, 2009 and probation
population for 6/30/2009.

7
II. ACCURACY TABLE 7A
ACCURACY OF THE OCTOBER 2009 PROBATION PROJECTIONS
Month Projected
Active Actual Active
Numeric Diff.
% Diff. Projected Inactive
Actual Inactive
Numeric Diff.
%Diff. Projected
Total Actual Total
Numeric Diff.
%Diff.
July-09 19,308 19,162 146 0.8% 11,243 11,150 93 0.8% 30,551 30,312 239 0.8%
August-09 19,306 19,150 156 0.8% 11,241 11,169 72 0.6% 30,547 30,319 228 0.8%
September-09 19,295 19,419 -124 -0.6% 11,235 10,785 450 4.2% 30,530 30,204 326 1.1%
October-09 19,280 19,302 -22 -0.1% 11,227 10,741 486 4.5% 30,507 30,043 464 1.5%
November-09 19,287 19,316 -29 -0.1% 11,231 10,700 531 5.0% 30,518 30,016 502 1.7%
December-09 19,305 19,212 93 0.5% 11,241 10,581 660 6.2% 30,546 29,793 753 2.5%
January-10 19,348 19,193 155 0.8% 11,218 10,238 980 9.6% 30,566 29,431 1,135 3.9%
February-10 19,359 19,211 148 0.8% 11,224 9,979 1,245 12.5% 30,583 29,190 1,393 4.8%
March-10 19,376 19,048 328 1.7% 11,234 9,967 1,267 12.7% 30,610 29,015 1,595 5.5%
April-10 19,400 19,027 373 2.0% 11,247 9,787 1,460 14.9% 30,647 28,814 1,833 6.4%
May-10 19,429 18,931 498 2.6% 11,265 9,796 1,469 15.0% 30,694 28,727 1,967 6.8%
Average 157 0.8% 792 7.8% 949 3.2%
Note: Drug court cases not included in previous forecasts

8
TABLE 7B OCTOBER 2009 PAROLE POPULATION PROJECTIONS – ACCURACY
Month Projected
Active Actual Active
Numeric Diff.
% Diff. Projected Inactive
Actual Inactive
Numeric Diff.
%Diff. Projected
Total Actual Total
Numeric Diff.
%Diff.
July-09 12,674 12,775 -101 -0.8% 7,702 7,777 -75 -1.0% 20,376 20,552 -176 -0.9%
August-09 12,808 12,783 25 0.2% 7,783 7,810 -27 -0.3% 20,591 20,593 -2 0.0%
September-09 12,844 12,991 -147 -1.1% 7,806 7,786 20 0.3% 20,650 20,777 -127 -0.6%
October-09 12,892 12,980 -88 -0.7% 7,834 7,895 -61 -0.8% 20,726 20,875 -149 -0.7%
November-09 12,961 13,376 -415 -3.1% 7,877 8,144 -267 -3.3% 20,838 21,520 -682 -3.2%
December-09 13,027 13,679 -652 -4.8% 7,916 7,766 150 1.9% 20,943 21,445 -502 -2.3%
January-10 13,038 13,566 -528 -3.9% 7,994 7,836 158 2.0% 21,032 21,402 -370 -1.7%
February-10 13,063 13,624 -561 -4.1% 8,082 7,856 226 2.9% 21,145 21,480 -335 -1.6%
March-10 13,048 13,706 -658 -4.8% 8,144 7,873 271 3.4% 21,192 21,579 -387 -1.8%
April-10 13,055 13,626 -571 -4.2% 8,221 7,719 502 6.5% 21,276 21,345 -69 -0.3%
May-10 13,088 13,651 -563 -4.1% 8,315 7,742 573 7.4% 21,403 21,393 10 0.0%
Average -387 -2.9% 134 1.7% -254 -1.2%

9
III. PROBATION TRENDS
TABLE 8 HISTORICAL PROBATION ADMISSIONS
CY 2004 THRU 2009
CY
Admit Type
From ADC
From DCC
From Court
Arkansas ISC from
other state
From other ISC
states
Other Drug Court
Total
2004 61 113 7,527 111 512 15 560 8,899
2005 57 151 7,341 110 436 21 756 8,872
2006 42 113 7,481 95 474 13 889 9,107
2007 54 62 8,298 144 706 9 750 10,023
2008 35 60 7,789 156 495 10 753 9,298
2009 30 74 7,720 124 148 8 730 8,834
Numeric Change 2008-
2009 -5 14 -69 -32 -347 -2 -23 -464
Percent Change 2008-2009
-14.3% 23.3% -0.9% -20.5% -70.1% -20.0% -3.1% -5.0%
Percent Change 2004-2009
-50.8% -34.5% 2.6% 11.7% -71.1% -46.7% 30.4% -0.7%
Average Percent Change
2004-2009 -10.8% -3.3% 0.7% 5.0% -11.4% -7.6% 6.9% 0.0%
Source: DCC Monthly Count Sheet #408

10
TABLE 9 PROBATION ADMISSIONS CY 2008 & 2009 COMPARISON
Admit Type N % 2009 Avg. Sentence
(mos)
2008 Avg.
Sentence (mos)
From ADC 30 0.3% 53.2 57.7
From DCC 74 0.8% 51.5 39.1
From Court 7,720 87.4% 45.9 45.4
Arkansas ISC from other state 124 1.4% 43.8 42.2
From other ISC states 148 1.7% 41.5 43.2
Other 8 0.1% 42.5 51.3
Drug Court 730 8.3% 40.8 40.1
Total 8,834 100.0% 45.5 45.2
Source: DCC Monthly Count Sheet #408 & EOMIS data file
11
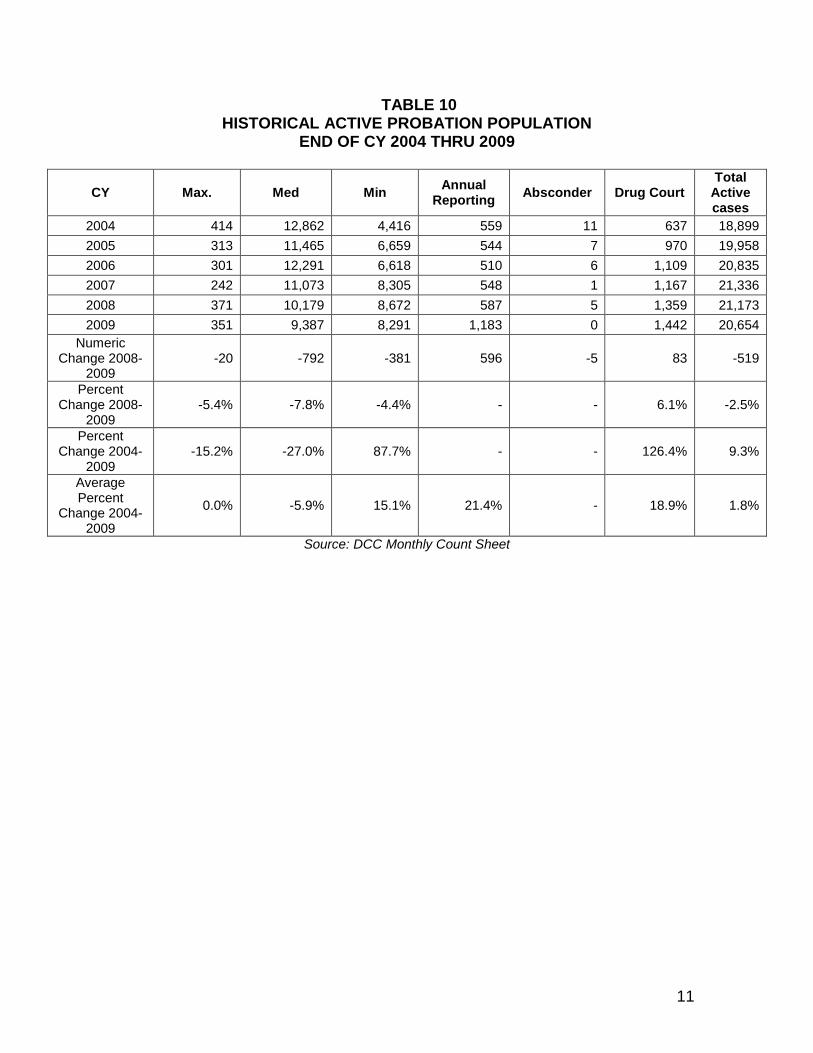
TABLE 10 HISTORICAL ACTIVE PROBATION POPULATION
END OF CY 2004 THRU 2009
CY Max. Med Min Annual
Reporting Absconder Drug Court
Total Active cases
2004 414 12,862 4,416 559 11 637 18,899
2005 313 11,465 6,659 544 7 970 19,958
2006 301 12,291 6,618 510 6 1,109 20,835
2007 242 11,073 8,305 548 1 1,167 21,336
2008 371 10,179 8,672 587 5 1,359 21,173
2009 351 9,387 8,291 1,183 0 1,442 20,654
Numeric Change 2008-
2009 -20 -792 -381 596 -5 83 -519
Percent Change 2008-
2009 -5.4% -7.8% -4.4% - - 6.1% -2.5%
Percent Change 2004-
2009 -15.2% -27.0% 87.7% - - 126.4% 9.3%
Average Percent
Change 2004-2009
0.0% -5.9% 15.1% 21.4% - 18.9% 1.8%
Source: DCC Monthly Count Sheet
12
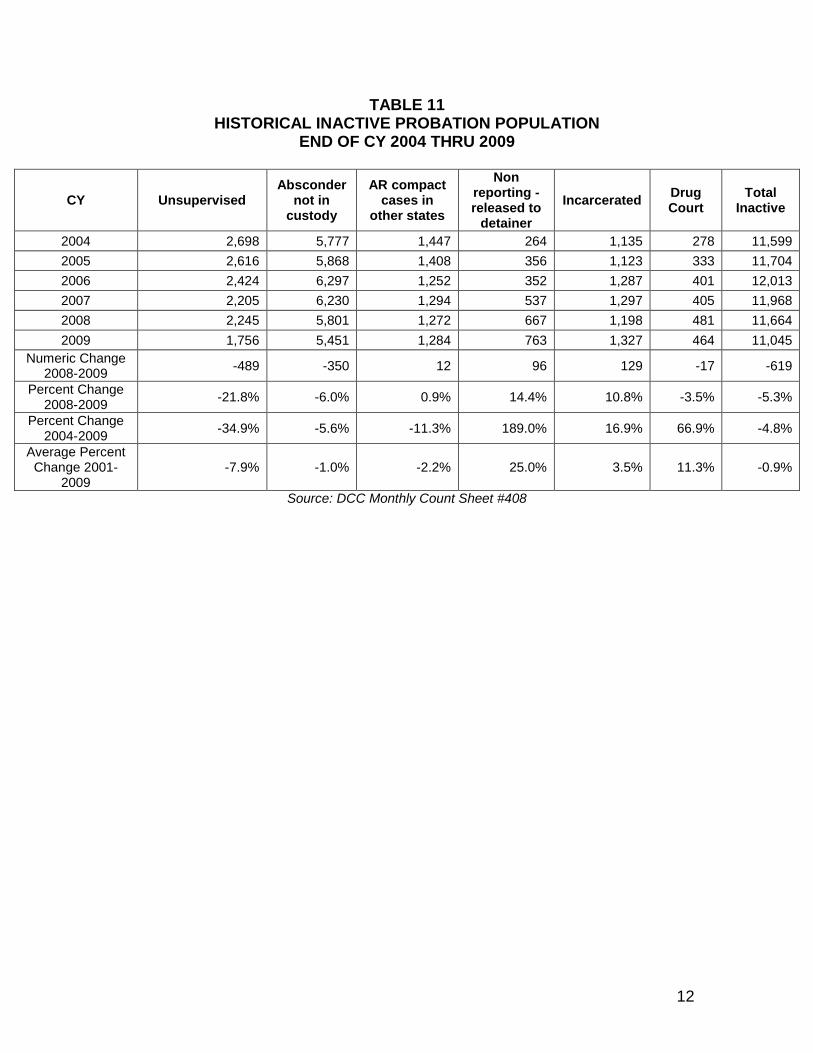
TABLE 11 HISTORICAL INACTIVE PROBATION POPULATION
END OF CY 2004 THRU 2009
CY Unsupervised Absconder
not in custody
AR compact cases in
other states
Non reporting - released to
detainer
Incarcerated Drug Court
Total Inactive
2004 2,698 5,777 1,447 264 1,135 278 11,599
2005 2,616 5,868 1,408 356 1,123 333 11,704
2006 2,424 6,297 1,252 352 1,287 401 12,013
2007 2,205 6,230 1,294 537 1,297 405 11,968
2008 2,245 5,801 1,272 667 1,198 481 11,664
2009 1,756 5,451 1,284 763 1,327 464 11,045
Numeric Change 2008-2009
-489 -350 12 96 129 -17 -619
Percent Change 2008-2009
-21.8% -6.0% 0.9% 14.4% 10.8% -3.5% -5.3%
Percent Change 2004-2009
-34.9% -5.6% -11.3% 189.0% 16.9% 66.9% -4.8%
Average Percent Change 2001-
2009 -7.9% -1.0% -2.2% 25.0% 3.5% 11.3% -0.9%
Source: DCC Monthly Count Sheet #408

13
TABLE 12 HISTORICAL PROBATION RELEASES
CY 2004 THRU 2009
FY New
Felony Technical
Other Revocation
Discharge Other Drug Court
Revoked
Drug Court Other
Total
2004 813 845 1 4,157 1,737 157 80 7,790
2005 718 922 1 4,192 1,372 190 222 7,617
2006 766 922 1 4,297 1,440 177 353 7,956
2007 867 1,252 1 4,964 1,894 204 435 9,617
2008 846 1,068 1 5,233 1,803 268 499 9,718
2009 783 1,060 0 5,318 1,570 307 570 9,608
Numeric Change 2008-2009
-63 -8 - 85 -233 39 71 -110
Percent Change 2008-2009
-7.4% -0.7% - 1.6% -12.9% 14.6% 14.2% -1.1%
Percent Change 2004-2009
-3.7% 25.4% - 27.9% -9.6% 95.5% 612.5% 23.3%
Average Percent Change 2004-2009
-0.3% 5.9% - 5.2% -0.5% 15.1% 57.7% 4.6%
Source: DCC Monthly Count Sheet #408

14
TABLE 13 PROBATION RELEASES 2009 – COLLAPSED
Release Type N % 2009 Avg. Length of Stay (mos)
2008 Avg. Length of Stay (mos)
New Felony 783 8% 20.7 19.6
Technical 1,060 11% 18.5 19.9
Discharge 5,318 55% 40.4 39.5
Other 1,570 16% 16.5 16.3
Drug Court revoked 307 3% 6.7 5.3
Drug Court other 570 6% 20.7 18.8
Total 9,608 100% 33.1 33.0
Source: DCC extract file

15
TABLE 14 HISTORICAL VERSUS PROJECTED PROBATION POPULATIONS
2004-2021
Year Historical
Active Historical Inactive
Historical Total
Projected Active
Projected Inactive
Projected Total
2004 18,899 11,599 30,498
2005 19,958 11,704 31,662
2006 20,835 12,013 32,848
2007 21,336 11,968 33,304
2008 21,173 11,664 32,837
2009 20,654 11,045 31,699
2010 20,391 10,370 30,761
2011 20,295 10,424 30,719
2012 20,515 10,448 30,963
2013 20,469 10,513 30,982
2014 20,549 10,465 31,014
2015 20,447 10,502 30,949
2016 20,523 10,451 30,974
2017 20,656 10,609 31,265
2018 20,934 10,661 31,595
2019 20,810 10,688 31,498
2020 20,846 10,616 31,462
2021 21,037 10,705 31,742
Avg. % Change
2004-2009 1.8% -0.9% 0.8%
Avg. % Change
2010-2021 0.3% 0.3% 0.3%
16
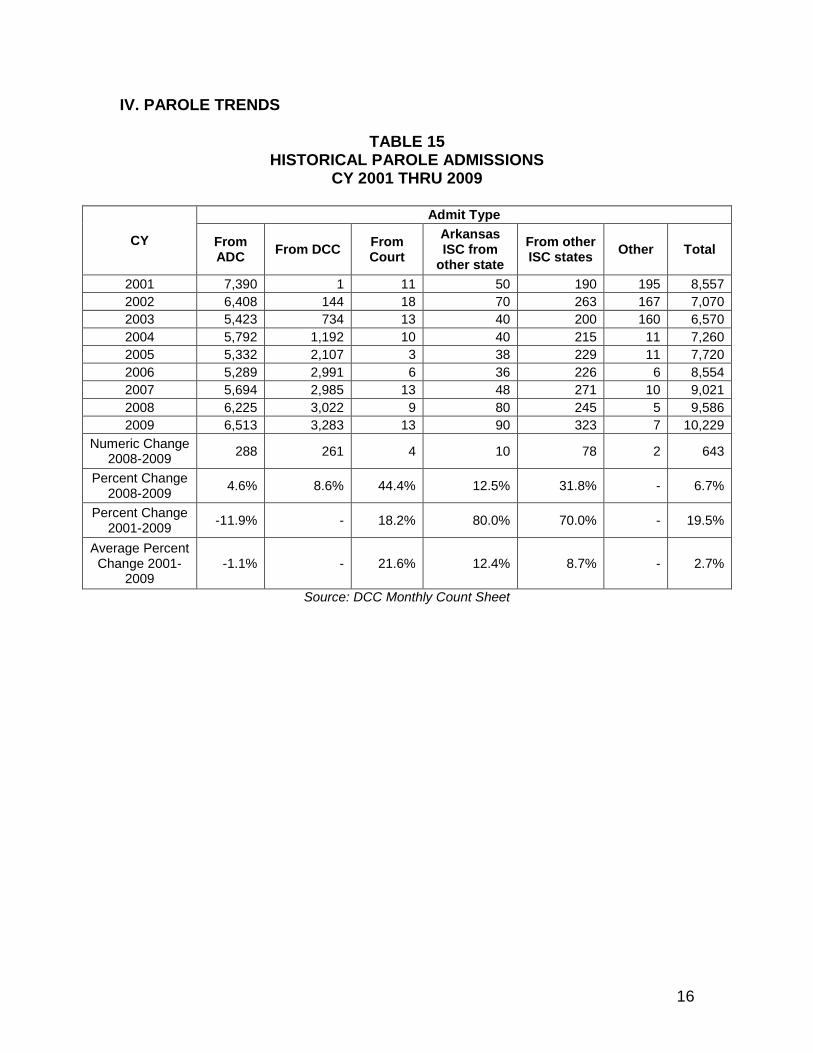
IV. PAROLE TRENDS
TABLE 15 HISTORICAL PAROLE ADMISSIONS
CY 2001 THRU 2009
CY
Admit Type
From ADC
From DCC From Court
Arkansas ISC from
other state
From other ISC states
Other Total
2001 7,390 1 11 50 190 195 8,557
2002 6,408 144 18 70 263 167 7,070
2003 5,423 734 13 40 200 160 6,570
2004 5,792 1,192 10 40 215 11 7,260
2005 5,332 2,107 3 38 229 11 7,720
2006 5,289 2,991 6 36 226 6 8,554
2007 5,694 2,985 13 48 271 10 9,021
2008 6,225 3,022 9 80 245 5 9,586
2009 6,513 3,283 13 90 323 7 10,229
Numeric Change 2008-2009
288 261 4 10 78 2 643
Percent Change 2008-2009
4.6% 8.6% 44.4% 12.5% 31.8% - 6.7%
Percent Change 2001-2009
-11.9% - 18.2% 80.0% 70.0% - 19.5%
Average Percent Change 2001-
2009 -1.1% - 21.6% 12.4% 8.7% - 2.7%
Source: DCC Monthly Count Sheet

17
TABLE 16 CY 2008 & 2009 PAROLE ADMISSIONS COMPARISON
Admit Type N %
2009 Avg. Term (mos)
2008 Avg. Term (mos)
From ADC 6,513 63.7% 65.5 64.9
From DCC 3,283 32.1% 35.0 33.3
From Court 13 0.1% 49.4 51.6
Arkansas ISC from other state 90 0.9% 59.7 46.4
From other ISC states 323 3.2% 58.1 45.7
Other 7 0.1% 60.5 97.4
Total 10,229 100.0% 56.6 54.7
Source: DCC Monthly Count Sheet & EOMIS data file

18
TABLE 17 HISTORICAL ACTIVE PAROLE POPULATION
CY 2001 THRU 2009
Year Max. Med Min Annual
Reporting Total Active
cases
2001 1,733 5,499 1,534 79 8,845
2002 711 5,121 3,029 294 9,155
2003 1,013 5,617 2,450 531 9,611
2004 1,076 6,194 2,217 576 10,063
2005 1,021 6,231 3,004 526 10,782
2006 1,018 6,959 2,908 505 11,390
2007 1,195 6,504 4,357 430 12,486
2008 900 6,753 4,226 582 12,461
2009 847 7,346 4,360 1,126 13,679
Numeric Change 2008-2009
-53 593 134 544 1,218
Percent Change 2008-2009
-5.9% 8.8% 3.2% 93.5% 9.8%
Percent Change 2001-2009
-51.1% 33.6% 184.2% 1325.3% 54.7%
Average Percent Change 2001-2009
-3.6% 3.9% 18.9% 57.8% 5.6%
Source: DCC Monthly Count Sheet
19
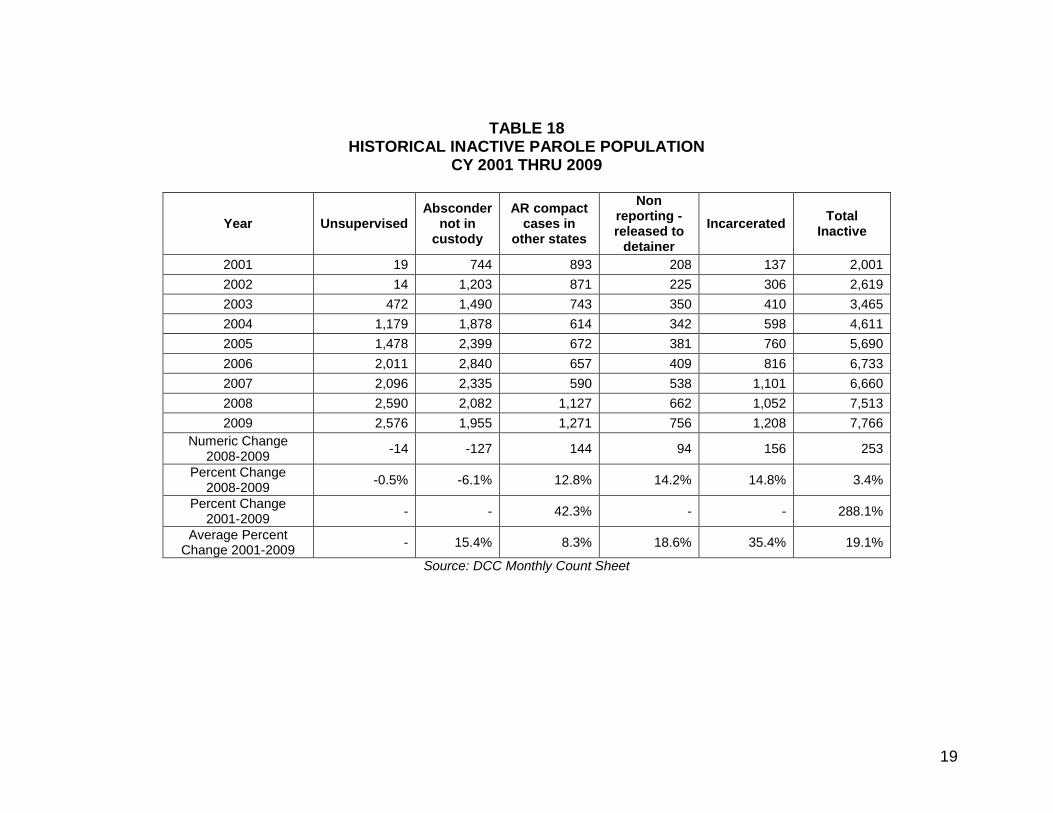
TABLE 18 HISTORICAL INACTIVE PAROLE POPULATION
CY 2001 THRU 2009
Year Unsupervised Absconder
not in custody
AR compact cases in
other states
Non reporting - released to
detainer
Incarcerated Total
Inactive
2001 19 744 893 208 137 2,001
2002 14 1,203 871 225 306 2,619
2003 472 1,490 743 350 410 3,465
2004 1,179 1,878 614 342 598 4,611
2005 1,478 2,399 672 381 760 5,690
2006 2,011 2,840 657 409 816 6,733
2007 2,096 2,335 590 538 1,101 6,660
2008 2,590 2,082 1,127 662 1,052 7,513
2009 2,576 1,955 1,271 756 1,208 7,766
Numeric Change 2008-2009
-14 -127 144 94 156 253
Percent Change 2008-2009
-0.5% -6.1% 12.8% 14.2% 14.8% 3.4%
Percent Change 2001-2009
- - 42.3% - - 288.1%
Average Percent Change 2001-2009
- 15.4% 8.3% 18.6% 35.4% 19.1%
Source: DCC Monthly Count Sheet

20
TABLE 19
HISTORICAL PAROLE RELEASES CY 2001 THRU 2009
CY New
Felony Technical
Other Revocation
Discharge Other Total
2001 557 1,958 140 2,751 1,116 6,522
2002 897 2,049 4 2,344 1,063 6,357
2003 684 1,935 0 2,118 506 5,243
2004 943 1,677 1 2,214 649 5,484
2005 961 1,182 33 2,442 666 5,284
2006 932 1,520 48 2,480 719 5,699
2007 815 1,849 62 3,741 1,349 7,816
2008 980 2,080 112 3,476 1,637 8,285
2009 982 2,366 86 2,961 1,679 8,074
Numeric Change
2008-2009 2 286 -26 -515 42 -211
Percent Change
2008-2009 0.2% 13.8% - -14.8% 2.6% -2.5%
Percent Change
2001-2009 76.3% 20.8% - 7.6% 50.4% 23.8%
Average Percent Change
2001-2009
10.2% 4.1% - 2.6% 11.7% 3.7%
Source: DCC Monthly Count Sheet

21
TABLE 20 PAROLE RELEASES 2009 - COLLAPSED
Release Type N % 2009 Avg. Length of
Parole (mos)
2008 Avg. Length of
Parole (mos)
New Felony 982 12% 16.9 17.5
Technical 2,366 29% 14.1 14.4
Discharge 2,961 37% 28.8 29.7
Other 1,765 22% 12.5 16.3
Total 8,074 100% 21.7 23.3

22
TABLE 21 HISTORICAL VERSUS PROJECTED PAROLE POPULATIONS
2001-2021
Year Historical
Active Historical Inactive
Historical Total
Projected Active
Projected Inactive
Projected Total
2001 8,845 2,001 10,846
2002 9,155 2,619 11,774
2003 9,611 3,465 13,076
2004 10,063 4,611 14,674
2005 10,782 5,690 16,472
2006 11,390 6,733 18,123
2007 12,486 6,660 19,146
2008 12,461 7,513 19,974
2009 13,679 7,766 21,445
2010 14,008 7,880 21,888
2011 14,319 8,161 22,480
2012 14,696 8,376 23,072
2013 15,253 8,693 23,946
2014 15,959 9,035 24,994
2015 16,337 9,312 25,649
2016 16,810 9,581 26,391
2017 17,274 9,845 27,119
2018 17,692 10,084 27,776
2019 17,964 10,286 28,250
2020 18,324 10,485 28,809
2021 18,690 10,719 29,409
Avg. % Change 2001-2009
5.6% 19.1% 8.9%
Avg. % Change 2010-2021
2.7% 2.8% 2.7%

23
MONTHLY PROJECTIONS TABLES
TABLE 22 ACTIVE PROBATIONER PROJECTIONS
Year Jan Feb Mar Apr May Jun Jul Aug Sep Oct Nov Dec
Actual 2010
20,625 20,624 20,456 20,446 20,363
2010 20,425 20,466 20,476 20,420 20,353 20,352 20,338 20,284 20,286 20,281 20,364 20,391
2011 20,283 20,251 20,254 20,274 20,287 20,333 20,402 20,294 20,456 20,397 20,440 20,295
2012 20,363 20,199 20,328 20,345 20,371 20,361 20,481 20,441 20,590 20,515 20,615 20,515
2013 20,519 20,409 20,479 20,410 20,533 20,546 20,586 20,477 20,616 20,562 20,606 20,469
2014 20,527 20,364 20,491 20,457 20,498 20,603 20,542 20,499 20,612 20,509 20,653 20,549
2015 20,547 20,434 20,487 20,390 20,505 20,495 20,538 20,419 20,568 20,539 20,783 20,447
2016 20,498 20,339 20,461 20,410 20,477 20,408 20,523 20,479 20,581 20,474 20,591 20,523
2017 20,519 20,436 20,515 20,449 20,574 20,612 20,692 20,578 20,749 20,734 20,803 20,656
2018 20,741 20,590 20,722 20,689 20,760 20,727 20,859 20,817 20,940 20,848 20,989 20,934
2019 20,934 20,828 20,884 20,764 20,847 20,842 20,892 20,801 20,973 20,919 20,980 20,810
2020 20,880 20,711 20,845 20,820 20,846 20,797 20,917 20,837 20,958 20,862 20,956 20,846
2021 20,853 20,767 20,866 20,777 20,888 20,904 20,976 20,891 21,065 21,049 21,021 21,037
24
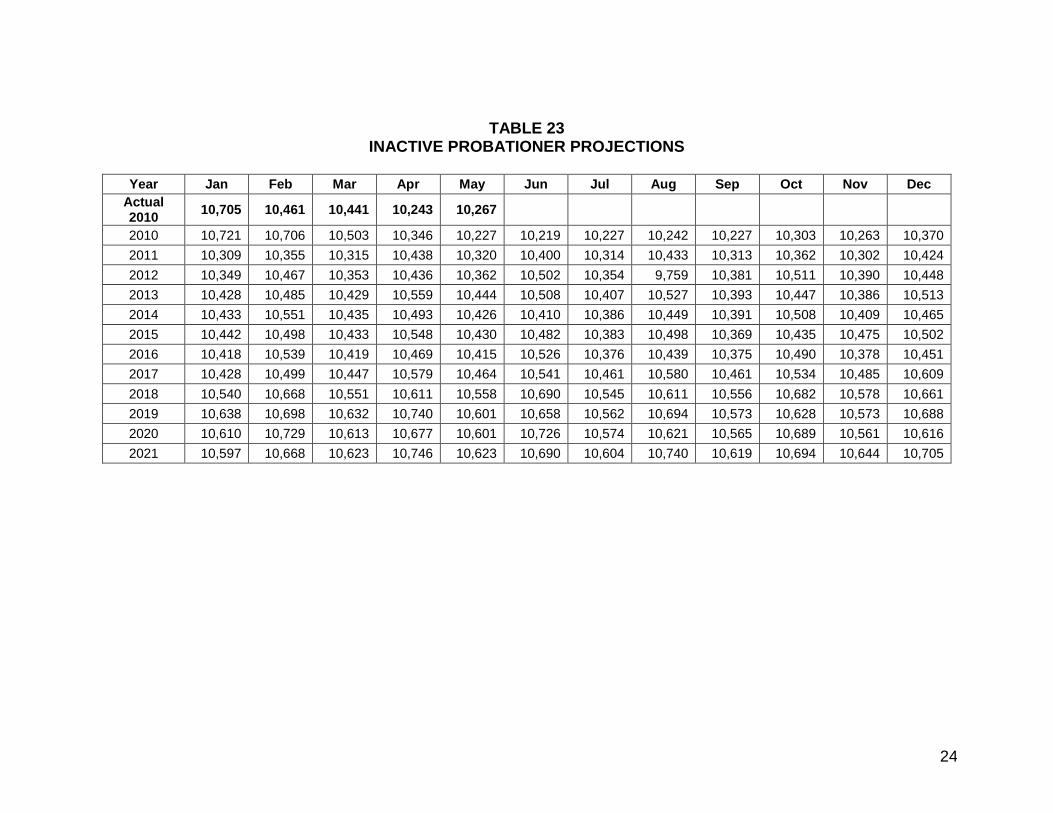
TABLE 23 INACTIVE PROBATIONER PROJECTIONS
Year Jan Feb Mar Apr May Jun Jul Aug Sep Oct Nov Dec
Actual 2010
10,705 10,461 10,441 10,243 10,267
2010 10,721 10,706 10,503 10,346 10,227 10,219 10,227 10,242 10,227 10,303 10,263 10,370
2011 10,309 10,355 10,315 10,438 10,320 10,400 10,314 10,433 10,313 10,362 10,302 10,424
2012 10,349 10,467 10,353 10,436 10,362 10,502 10,354 9,759 10,381 10,511 10,390 10,448
2013 10,428 10,485 10,429 10,559 10,444 10,508 10,407 10,527 10,393 10,447 10,386 10,513
2014 10,433 10,551 10,435 10,493 10,426 10,410 10,386 10,449 10,391 10,508 10,409 10,465
2015 10,442 10,498 10,433 10,548 10,430 10,482 10,383 10,498 10,369 10,435 10,475 10,502
2016 10,418 10,539 10,419 10,469 10,415 10,526 10,376 10,439 10,375 10,490 10,378 10,451
2017 10,428 10,499 10,447 10,579 10,464 10,541 10,461 10,580 10,461 10,534 10,485 10,609
2018 10,540 10,668 10,551 10,611 10,558 10,690 10,545 10,611 10,556 10,682 10,578 10,661
2019 10,638 10,698 10,632 10,740 10,601 10,658 10,562 10,694 10,573 10,628 10,573 10,688
2020 10,610 10,729 10,613 10,677 10,601 10,726 10,574 10,621 10,565 10,689 10,561 10,616
2021 10,597 10,668 10,623 10,746 10,623 10,690 10,604 10,740 10,619 10,694 10,644 10,705
25
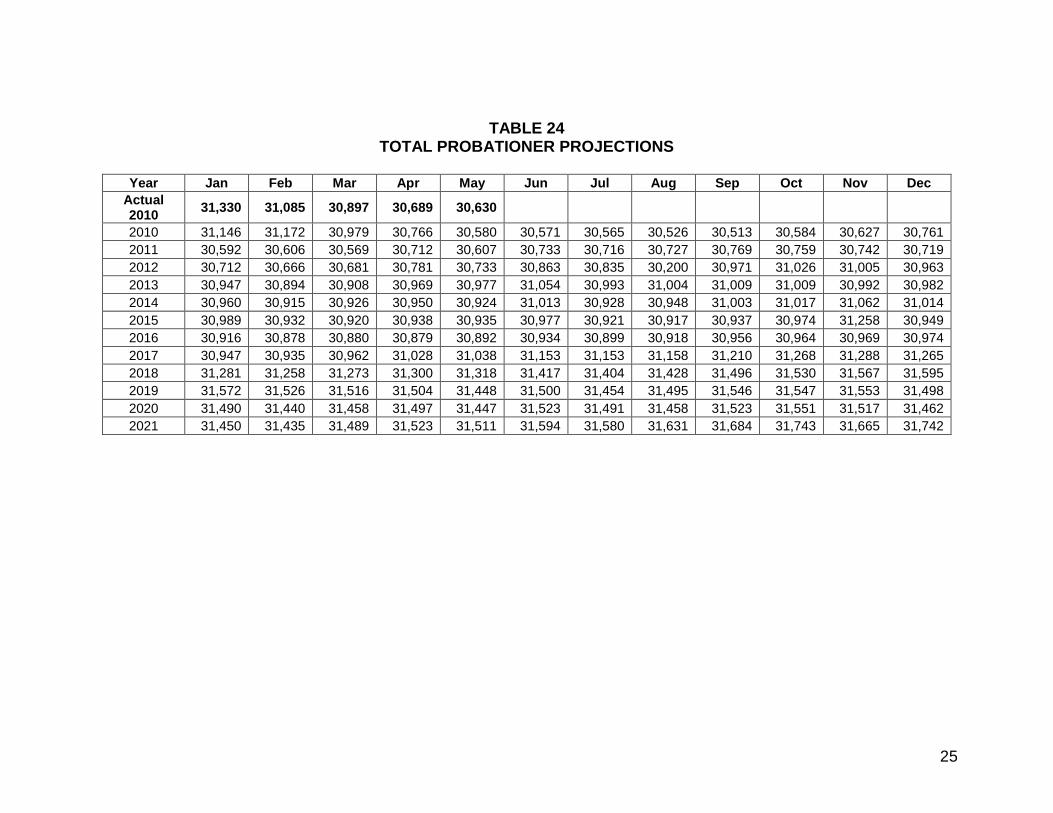
TABLE 24 TOTAL PROBATIONER PROJECTIONS
Year Jan Feb Mar Apr May Jun Jul Aug Sep Oct Nov Dec
Actual 2010
31,330 31,085 30,897 30,689 30,630
2010 31,146 31,172 30,979 30,766 30,580 30,571 30,565 30,526 30,513 30,584 30,627 30,761
2011 30,592 30,606 30,569 30,712 30,607 30,733 30,716 30,727 30,769 30,759 30,742 30,719
2012 30,712 30,666 30,681 30,781 30,733 30,863 30,835 30,200 30,971 31,026 31,005 30,963
2013 30,947 30,894 30,908 30,969 30,977 31,054 30,993 31,004 31,009 31,009 30,992 30,982
2014 30,960 30,915 30,926 30,950 30,924 31,013 30,928 30,948 31,003 31,017 31,062 31,014
2015 30,989 30,932 30,920 30,938 30,935 30,977 30,921 30,917 30,937 30,974 31,258 30,949
2016 30,916 30,878 30,880 30,879 30,892 30,934 30,899 30,918 30,956 30,964 30,969 30,974
2017 30,947 30,935 30,962 31,028 31,038 31,153 31,153 31,158 31,210 31,268 31,288 31,265
2018 31,281 31,258 31,273 31,300 31,318 31,417 31,404 31,428 31,496 31,530 31,567 31,595
2019 31,572 31,526 31,516 31,504 31,448 31,500 31,454 31,495 31,546 31,547 31,553 31,498
2020 31,490 31,440 31,458 31,497 31,447 31,523 31,491 31,458 31,523 31,551 31,517 31,462
2021 31,450 31,435 31,489 31,523 31,511 31,594 31,580 31,631 31,684 31,743 31,665 31,742
26
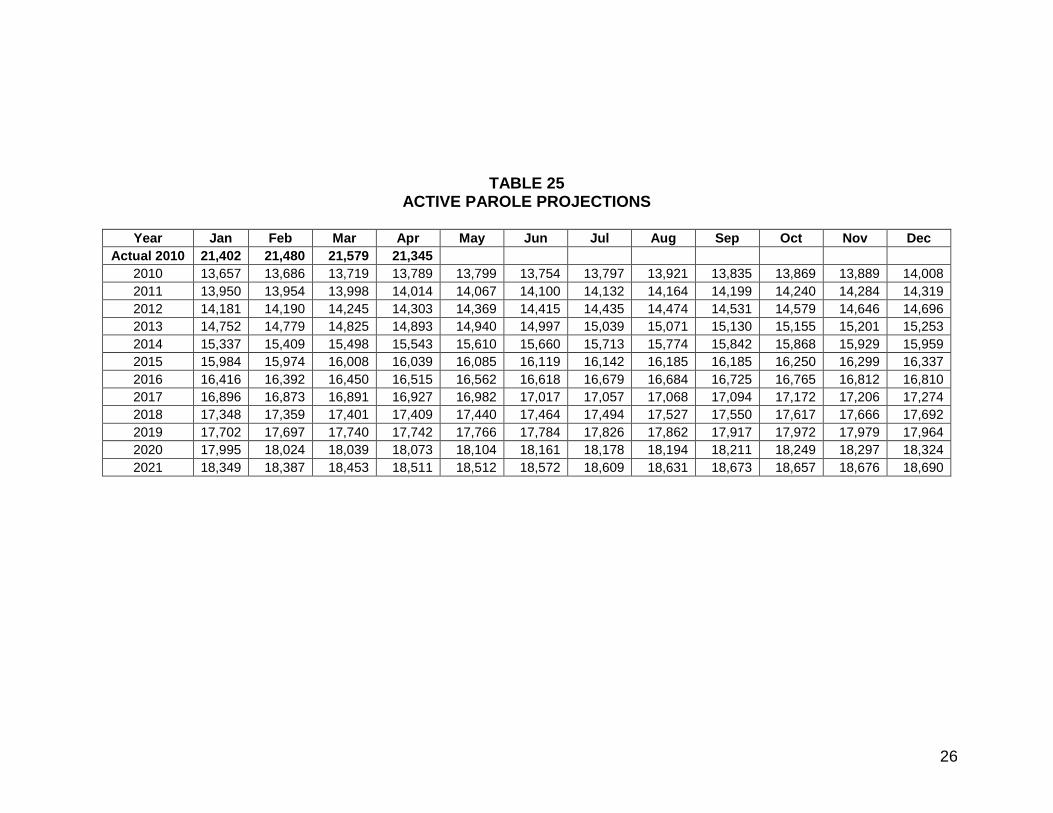
TABLE 25 ACTIVE PAROLE PROJECTIONS
Year Jan Feb Mar Apr May Jun Jul Aug Sep Oct Nov Dec
Actual 2010 21,402 21,480 21,579 21,345
2010 13,657 13,686 13,719 13,789 13,799 13,754 13,797 13,921 13,835 13,869 13,889 14,008
2011 13,950 13,954 13,998 14,014 14,067 14,100 14,132 14,164 14,199 14,240 14,284 14,319
2012 14,181 14,190 14,245 14,303 14,369 14,415 14,435 14,474 14,531 14,579 14,646 14,696
2013 14,752 14,779 14,825 14,893 14,940 14,997 15,039 15,071 15,130 15,155 15,201 15,253
2014 15,337 15,409 15,498 15,543 15,610 15,660 15,713 15,774 15,842 15,868 15,929 15,959
2015 15,984 15,974 16,008 16,039 16,085 16,119 16,142 16,185 16,185 16,250 16,299 16,337
2016 16,416 16,392 16,450 16,515 16,562 16,618 16,679 16,684 16,725 16,765 16,812 16,810
2017 16,896 16,873 16,891 16,927 16,982 17,017 17,057 17,068 17,094 17,172 17,206 17,274
2018 17,348 17,359 17,401 17,409 17,440 17,464 17,494 17,527 17,550 17,617 17,666 17,692
2019 17,702 17,697 17,740 17,742 17,766 17,784 17,826 17,862 17,917 17,972 17,979 17,964
2020 17,995 18,024 18,039 18,073 18,104 18,161 18,178 18,194 18,211 18,249 18,297 18,324
2021 18,349 18,387 18,453 18,511 18,512 18,572 18,609 18,631 18,673 18,657 18,676 18,690
27
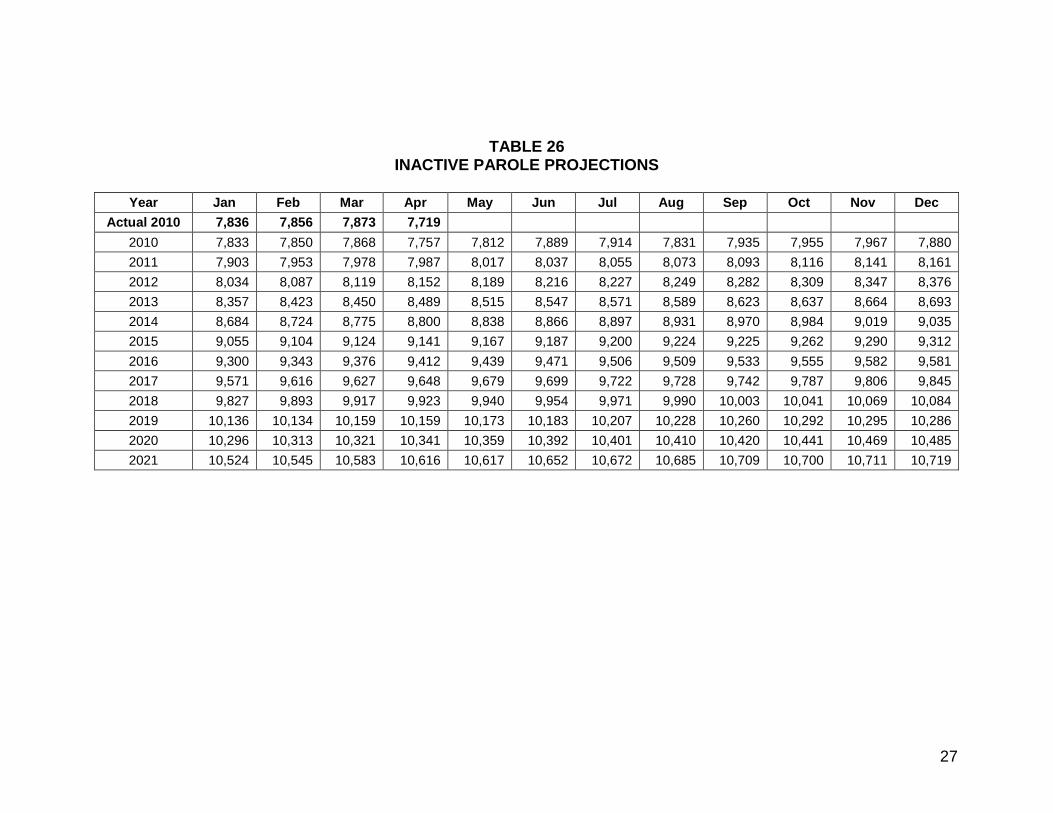
TABLE 26 INACTIVE PAROLE PROJECTIONS
Year Jan Feb Mar Apr May Jun Jul Aug Sep Oct Nov Dec
Actual 2010 7,836 7,856 7,873 7,719
2010 7,833 7,850 7,868 7,757 7,812 7,889 7,914 7,831 7,935 7,955 7,967 7,880
2011 7,903 7,953 7,978 7,987 8,017 8,037 8,055 8,073 8,093 8,116 8,141 8,161
2012 8,034 8,087 8,119 8,152 8,189 8,216 8,227 8,249 8,282 8,309 8,347 8,376
2013 8,357 8,423 8,450 8,489 8,515 8,547 8,571 8,589 8,623 8,637 8,664 8,693
2014 8,684 8,724 8,775 8,800 8,838 8,866 8,897 8,931 8,970 8,984 9,019 9,035
2015 9,055 9,104 9,124 9,141 9,167 9,187 9,200 9,224 9,225 9,262 9,290 9,312
2016 9,300 9,343 9,376 9,412 9,439 9,471 9,506 9,509 9,533 9,555 9,582 9,581
2017 9,571 9,616 9,627 9,648 9,679 9,699 9,722 9,728 9,742 9,787 9,806 9,845
2018 9,827 9,893 9,917 9,923 9,940 9,954 9,971 9,990 10,003 10,041 10,069 10,084
2019 10,136 10,134 10,159 10,159 10,173 10,183 10,207 10,228 10,260 10,292 10,295 10,286
2020 10,296 10,313 10,321 10,341 10,359 10,392 10,401 10,410 10,420 10,441 10,469 10,485
2021 10,524 10,545 10,583 10,616 10,617 10,652 10,672 10,685 10,709 10,700 10,711 10,719

28
TABLE 27 TOTAL PAROLE POPULATION PROJECTIONS
Year Jan Feb Mar Apr May Jun Jul Aug Sep Oct Nov Dec
Actual 2010 21,402 21,480 21,579 21,345
2010 21,490 21,536 21,587 21,546 21,611 21,643 21,711 21,752 21,770 21,824 21,856 21,888
2011 21,853 21,907 21,976 22,001 22,085 22,137 22,187 22,238 22,292 22,356 22,425 22,480
2012 22,215 22,277 22,364 22,455 22,558 22,631 22,662 22,723 22,813 22,888 22,993 23,072
2013 23,109 23,202 23,275 23,382 23,455 23,544 23,610 23,660 23,753 23,792 23,865 23,946
2014 24,021 24,133 24,273 24,343 24,448 24,526 24,610 24,705 24,812 24,852 24,948 24,994
2015 25,039 25,078 25,132 25,180 25,252 25,306 25,342 25,409 25,410 25,512 25,589 25,649
2016 25,716 25,735 25,826 25,927 26,001 26,089 26,185 26,193 26,258 26,320 26,394 26,391
2017 26,467 26,489 26,518 26,575 26,661 26,716 26,779 26,796 26,836 26,959 27,012 27,119
2018 27,175 27,252 27,318 27,332 27,380 27,418 27,465 27,517 27,553 27,658 27,735 27,776
2019 27,838 27,831 27,899 27,901 27,939 27,967 28,033 28,090 28,177 28,264 28,274 28,250
2020 28,291 28,337 28,360 28,414 28,463 28,553 28,579 28,604 28,631 28,690 28,766 28,809
2021 28,873 28,932 29,036 29,127 29,129 29,224 29,281 29,316 29,382 29,357 29,387 29,409

29