territorial eu
TRANSCRIPT

8/8/2019 Territorial EU
http://slidepdf.com/reader/full/territorial-eu 1/50
Territorial potentialsin the European Union
Ole Damsgaard, Maria Lindqvist,
Johanna Roto & José Sterling

8/8/2019 Territorial EU
http://slidepdf.com/reader/full/territorial-eu 2/50

8/8/2019 Territorial EU
http://slidepdf.com/reader/full/territorial-eu 3/50
Territorial potentialsin the European Union
Ole Damsgaard, Maria Lindqvist,
Johanna Roto & José Sterling
Nordregio 2009

8/8/2019 Territorial EU
http://slidepdf.com/reader/full/territorial-eu 4/50
Nordregio Working Paper 2009:6ISSN 1403-2511
NordregioP.O. Box 1658SE-111 86 Stockholm, Sweden
[email protected] www.nordregio.se www.norden.se
Nordic co-operationtakes place among the countries of Denmark, Finland, Iceland, Norway and Sweden, as well as the autonomous
territories of the Faroe Islands, Greenland and Åland.
The Nordic Councilis a forum for co-operation between the Nordic parliaments and governments. The Council consists of 87
parliamentarians form the Nordic countries. The Nordic Council takes policy initiatives and monitors Nordic co-operation. Founded in 1952.
The Nordic Council of Ministers
is a forum of co-operation between the Nordic governments. The Nordic Council of Ministers implements Nordicco-operation. The prime ministers have the overall responsibility. Its activities are co-ordinated by the Nordic ministersfor co-operation, the Nordic Committee for co-operation and portfolio ministers. Founded in 1971.
Stockholm, Sweden2009
Swedish Presidency of the EU

8/8/2019 Territorial EU
http://slidepdf.com/reader/full/territorial-eu 5/50
Contents
Summary 5
Territorial Potentials Spatial Structure in Europe 10Land as Potential 12Mineral Resources 14Renewable Energy Potentials 16Impact of Climate change 18Population dynamics - Changing & Ageing 20Population dynamics - Migration 22Unemployment as a challenge 24Labour Market Potentials 26Labour Force Qualications 28Research and Development Potentials 30High-tech & knowledge intensive labour 32Innovation and entrepreneurship 34Economic Performance and Productivity 36
Territorial cooperation Accessibility
Abbreviations References 43

8/8/2019 Territorial EU
http://slidepdf.com/reader/full/territorial-eu 6/50

8/8/2019 Territorial EU
http://slidepdf.com/reader/full/territorial-eu 7/50
7
Nordregio Working Paper 2009:6
Preface
The purpose of EU Cohesion Policy at the European level is to contribute to the Lisbon and Gothenburg objectives for
growth, jobs and sustainable development. More specically, the Cohesion Policy should promote the cohesion of theEU-territory by improving the use of all available resources in Europe’s regions. Seen against the backdrop of the deepestglobal economic slowdown in generations the identication of these regional potentials and furthermore the elaborationof strategies and policies that might enable and facilitate the European regions to fully exploit these potentials is moreimportant than ever.
While this paper aims to identify and discuss some of the most important territorial potentials it is neverthelessrestricted by access to available data at the regional level. The paper has been divided into 17 chapters. Each chapteraddresses one targeted territorial potential. We begin by focusing on natural and human potentials and follow this withchapters focused more on territorial performance, specically, on how these resources and assets are utilized in theregions.
The analysis is primarily based on the European NUTS2 regional level. Combining and comparing this heterogeneousset of regions, namely, all those between the most densely populated city regions of Paris, London and Brussels, and thesparsely populated and extended regions of Northern Sweden and Finland is challenging. One potential impact of this
variation between the densely and sparsely populated NUTS2 regions may create a visual illusion - some geographically small but densely populated and well-performing regions are almost invisible in the maps while at the same time thegeographically larger but sparsely populated regions may have too great a weight on the thematic maps, at least in relativeterms. This is important to bear in mind when interpreting the maps.
The Ministry of Enterprise, Energy and Communications in Sweden commissioned Nordregio to produce the study during the current Swedish EU presidency which runs during the second half of 2009. The paper has been specically produced for the Conference on Cohesion Policy and Territorial Development in Kiruna, Sweden, December 10-11,2009.
The report’s ndings are the views of the individual authors alone and do not necessarily reect the ofcial opinionof the Swedish Government.
The project work group at Nordregio consisted of the following members:Ole DamsgaardMaria Lindqvist
Johanna Roto José Sterling
Stockholm, November 2009

8/8/2019 Territorial EU
http://slidepdf.com/reader/full/territorial-eu 8/50
8 Nordregio Working Paper 2009:6
8/8/2019 Territorial EU
http://slidepdf.com/reader/full/territorial-eu 9/50
9
Nordregio Working Paper 2009:6
Summary
Variations in territorial potentialsfor growthIn the drive to strengthen competitiveness one of the mainchallenges facing policy-makers and other concerned actorsacross the regions of Europe is to identify and mobilisethe territorial potentials necessary for the creation of new jobs and sustainable economic growth. Understanding thenature of territorial potentials however requires a detailedknowledge of the economic base of the region involvedin addition to the prioritisation and implementation of thenecessary policy processes.
The concept of territorial potential has not beenexplicitly dened here but undoubtedly relates to numerousfactors. These factors can be divided into tangible assets,such as natural and human resources, and intangible assets,like organisation, culture, social issues and governance.
Together, these factors make up the territorial capital of a region. Un-mobilised territorial capital may be releasedthrough policies and actions at various administrativelevels.
Importance of natural resourcesLand and natural resources have historically beenimportant determinants of population distribution and
wealth. Access to farm land, water, minerals and energy sources are some of the factors that have inuenced thedistribution of major cities. Today, some 42% of Europeanland is covered by forests or other wooded areas with thehighest shares in some Finnish and Swedish regions. About41% of European land is utilized for agriculture, with thehighest shares in certain regions of Italy, the UK, Franceand Belgium.
From a historical perspective, the exploitationof minerals has been closely linked to the Europeanindustrialisation process. Lately, increasing demand fromcountries like China and India, rising world market pricesand the liberalisation of the trade in prospecting rights hassuccessfully opened the way for new investments in mining even in peripheral and regions of low population density,such as that encompassing the Fennoscandian Shield.
In order to better promote sustainable developmentit is increasingly important to reduce the greenhouse gasemissions causing climate change. This requires policies
stimulating energy efciency, clean transportation andrenewable energy production. Between 1997 and 2007more than half of the EU Member States reduced theirlevels of such emissions. Some small increases are
nevertheless still being registered mainly in the SouthernEuropean countries.
Today, bioenergy, including biomass from agricultureor forestry residue, is the most important supply source of renewable energy in Europe. The second most importantsource is hydropower. A third rapidly developing alternativeis wind power, with the highest potentials in terms of windspeeds found off Europe’s North Sea coast as well asalong the UK’s coast and islands in the North Sea. In 2007,the average share of electricity generated by renewableenergies in Europe was about 15%. The level was highest
in Norway, Iceland, Sweden and Austria, all of whomgenerated from 50% up to almost 100% of their energy in this way, mainly due to high hydropower or geothermal(Iceland potentials).
Increased focus on humanresources The size, structure and competence of the population in aspecic territory have a signicant impact on the territorialpotential. Market size and the potential to attract and keeplabour with the relevant competences are two of the most
important determinants of growth. Over the next tenyears the European population is estimated to increase by about 4 million persons (0.1%). However, the demographicdevelopment is expected to result in an older populationand in increased competition for labour all over Europe.On a regional level, large disparities will emerge and may increase the already clear polarisation between urban andrural regions. The challenge of an ageing population islikely to be highest in certain regions of Northern Italy,Eastern Germany and in Finnish and Swedish regionsoutside the major cities.
A mechanism that could be expected to offset theeffects of an ageing population is national and internationalmigration. However, migration patterns appear to furtherstrengthen the polarisation between Eastern and WesternEurope and between cities and rural areas. Almost 80% of regions with a positive in-migration also had a populationincrease. On an intra-EU level, the regions attracting the absolutely highest level of migrants were located inFrance, Germany and the UK, while the level of migration to Romania was lowest. Both Italy and Greece attractedonly a limited number of intra-EU migrants althoughboth countries received a remarkable number of migrantsfrom non-EU countries. The small states of Luxembourg,Cyprus and Ireland attracted, in relative terms, mostmigrants.
8/8/2019 Territorial EU
http://slidepdf.com/reader/full/territorial-eu 10/50
10 Nordregio Working Paper 2009:6
Despite the shortage of labour in certain sectorsunemployment still poses a signicant challenge in many European regions. The average unemployment rate acrossthe European population in 2008 was 7%. In certaingroups however the level of unemployment is muchhigher. This indicates that the challenge remains to betterexploit the labour potential by increasing employmentamong younger persons (aged 15-24 years) and the long
term unemployed (over 1 year). Youth unemploymentappears to be a problem particularly in Northern Europe, Austria and Switzerland, where overall unemployment isotherwise rather low. Long term unemployment appears tobe more of a structural problem, for example, where thesupply and demand of specic skills does not match.
Concerning the level of employment among females, workers in the older age brackets (55-64) and immigrantemployment, this appears to be related to national policiesconcerning social welfare systems and integration policies.In Finland, some regions of Northern Germany and in the
Scottish highlands, gender differences are only marginal. The level of employment is highest in the Scandinaviancountries and the highest level of employment among immigrants is found in Portugal and Sweden. This indicatesa potential for many regions to tap into an underutilisedlabour force.
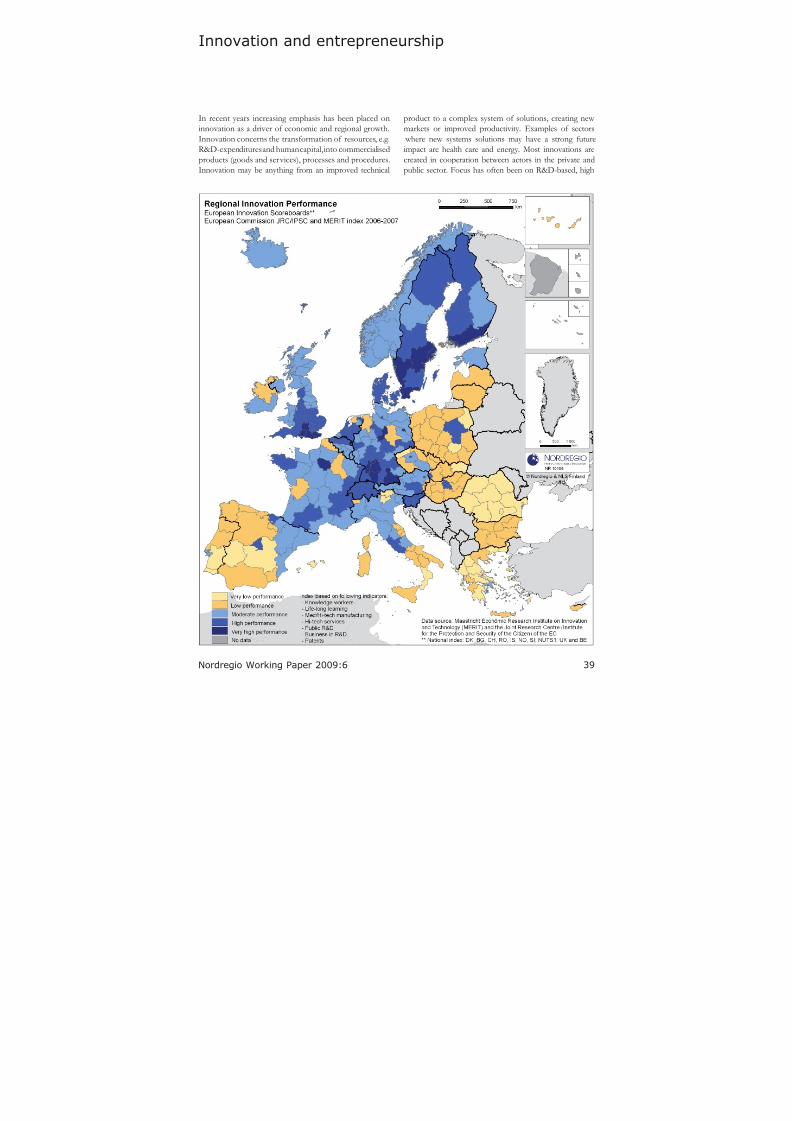
Innovation and entrepreneurshipas economic driversRecent years have seen an increasing emphasis oninnovation as a driver for economic and regional
growth. Two of the most important assets in stimulating innovation are investments in R&D and in human capital.
The European aim is to invest at least 3% of GDP onR&D by 2010. In 2006, the regions that had reachedthis goal were located in Finland, Sweden, Southern andEastern Germany, South East England and the regions of Steiermark (AT) and Stredí Cechy (CZ). At least two thirdsof these R&D investments are expected to come fromprivate investors. Countries with a high level of private, as
well as public R&D investment include Finland, Sweden,Switzerland, Austria, Germany and Denmark. Three outof ve companies among the 1000 top R&D investors in
Europe came from France, Germany and the UK.
To meet the challenge of a knowledge society andincrease labour force qualication levels, many Europeanregions have invested heavily in regional educationinstitutions. In global ranking terms, 40% of the world’stop universities were located in Europe. Almost a quarterof the European population of working age had a tertiary level education, with a concentration to city regions in, forexample, the UK, Belgium, Norway, Finland and Spain.However, a high level of education may not be enough
if a match does not exist between the personal skills of the labour force and the labour demand from the publicand private sector. Participation in life long learning is animportant instrument helping to improve or develop new
personal skills. On a national level, the highest level of students in both tertiary education and life-long learning is found in the UK, Denmark, Finland, Switzerland andSweden.
A strong entrepreneurial and cooperative cultureis another factor that may stimulate innovation andcontribute to the development of high-growth companies
and new start-ups. This, however, is difcult to measureusing quantitative data.
Integrating territoriesHistorically, local factor endowment and geographicalspecialization have been the drivers for international tradein various sectors, e.g. natural resources, manufacturing products and, increasingly so, also for services. In anincreasingly complex world, one region may not itself haveaccess to the diversied resources needed to stimulateinnovation and sustainable growth. This may relate to many
different types of resources, including natural resources,market size, labour force, competence structures or R&Dinvestments. For the future, this makes it even moreimportant for regions to cooperate, to create competitive,functional regions with a view to solving specic problems.Promoting stronger integration between European regionsis one of the objectives of the European Union.
For example, in June 2009, the European Union Strategy for the Baltic Sea region was presented. The strategy isbased on the concept of transnational cooperation withinmacro-regions. By stimulating cooperation between
countries and regions with a heterogeneous resource base,the growth potential is expected to increase. Previousstudies indicate the potential for successful cross-bordercooperation even between regions with socio-economicdifferences or geographical barriers, such as mountainsand seas. Nevertheless, cooperation could be expected tobe easier if regions have a shared language, similar cultureand a long tradition of cross-border cooperation. In thecase of Interreg III A programmes, the highest numbersof cross-border projects were found along the boarders of Spain-Portugal, Italy-Austria, Italy-Slovenia and Bavaria-
Austria.
To stimulate cooperation across regions, nationally as well as internationally, it is necessary to reduce the barriersto interaction and the movement of goods and people.One important determinant of cooperative potentialis accessibility at the regional and inter-regional scale.In general however a growing level of intra-nationalpolarisation can be observed across most Europeancountries, in particular between major metropolitan regionson the one hand, and remote rural territories on the other.
This suggests that access to large markets, extensive anddiversied labour markets and advanced services, is an
increasingly important factor in economic development. The question here is how cooperation between regionshelped by appropriate policy measures can compensate

8/8/2019 Territorial EU
http://slidepdf.com/reader/full/territorial-eu 11/50
11
Nordregio Working Paper 2009:6
for this disadvantage. In recent years for instance access toInternet communication has facilitated cooperation overlarge distances. This is something which may have had apositive effect on more peripheral regions.
Impact on territorial policies The increasing regionalization of national policy andfunding increases the need for strong regional governanceand cooperation between different types of stakeholdersat the regional level. To develop regional strategies it is
necessary to integrate a number of different policy-elds,such as the labour market, innovation, and energy- andtransportation policy.
According to the EU Green Paper on TerritorialCohesion, the territorial diversity of European regions is a
vital asset to economic development and competitiveness.However, exploring the territorial potentials of a region
requires a process of analysing access to different types of resources, but also a regional process for prioritising andcoordinating relevant stakeholders and policy-elds.

8/8/2019 Territorial EU
http://slidepdf.com/reader/full/territorial-eu 12/50
12 Nordregio Working Paper 2009:6
8/8/2019 Territorial EU
http://slidepdf.com/reader/full/territorial-eu 13/50
13
Nordregio Working Paper 2009:6
Territorial Potentials
Territorial capital and potentials The Territorial Agenda of the European Union1 states thatthe diverse territorial potentials of regions for sustainableeconomic growth and job creation must be identied andmobilised.
The Agenda does not undertake to explicitly deneterritorial potentials but instead, in the backgrounddocument for the Territorial Agenda,2 quotes the OECDreport on Territorial Economy 3 where the concept of territorial capital is dened in the following way:
A regions territorial capital is distinct from other areas and is
determined by many factors (which) may include geographical location,
size, factor of production endowment, climate, traditions, natural
resources, quality of life or the agglomeration economies provided
by its cities -- Other factors may be ‘untraced interdependencies’
such as understandings, customs and informal rules that enable
economic actors to work together under conditions of uncertainty, or
the solidarity, mutual assistance and co-opting of ideas that often
develop in small and medium-size enterprises working in the same
sector (social capital). Lastly there is an intangible factor, ‘something
in the air’, called the ‘environment’ and which is the outcome of
a combination of institutions, rules, practices, producers, researchers and policy-makers, that make a certain creativity and innovation
possible…
According to the denition above the potential foreconomic growth of a given territory depends on theexploitation of its tangible and intangible territorial capitalassets. Previously un-mobilised territorial capital may bereleased through policies and actions at various levels.
This tangible capital is composed of factors likegeographical location, access to markets and capital, natural
resources such as land, raw materials and energy resources.In addition, the size and skills of the labour force can alsobe mentioned here.
Examples of more intangible territorial capital assetsinclude culture, social issues and governance including formal and informal rules, creativity etc.
The broad OECD denition of territorial capital drawson discussions undertaken in economics and economicgeography for a time-span of more than one hundredyears. With the last notion ‘something in the air’ an indirectlink is made to the classical works of Alfred Marshall fromthe 1920s based on studies of the industrial developmentof Lancashire where he introduced the famous notionof ‘industrial atmosphere’4. On the one hand Marshallcould identify markets of perfect competition and a uiddiffusion of technological changes but on the other hecould also observe certain specicities in the economicprocesses that were linked to specic territories and which
were not directly accessible for producers outside theseterritories.
With Michael Storper it can be argued thatagglomerations and clusters arise because of knowledgespillovers understood as the advantages of ‘thick’ marketsfor specialized skills and the many direct and indirectlinkages associated with large local markets or demanding customers.
In a broader sense authors such as Paul Krugmann5 argue that concentrations form and survive because
of some form of agglomeration economies in whichspatial concentration itself creates the favorableeconomic environment that supports further continuedconcentration.
In the European Cluster Memorandum6 it is statedthat innovation is the driver that will shape the European
vision of growth, and that clusters can be a powerfulcatalyst in this process by linking regional concentrationsof specialized companies and institutions. Regions thatcombine risk capital, skills and research excellence withstrong cluster portfolios have an opportunity to become
innovation hubs.
The importance of agglomeration economies andthe implications of having or not having easy accessto important European agglomerations have beenquestioned by some researchers7 and regional policy makers representing regions outside the Pentagon. Itis often argued that even regions of low population
1 Territorial Agenda of the European Union, Towards a More Competitive
and Sustainable Europe of Diverse Regions. 2007
2 The territorial State and Perspectives of the European Union, 7 March2007
3 OECD (2001). OECD Territorial Outlook 2001
4 Storper, Michael (1997). The Territorial Development in a Global Economy.
The Regional World
5 Fujita,M., Klugmann, P. and Venables, A.J. (2001): The Spatial Economy.
Cities, regions and international trade6 See: Center for Strategy and Competitiveness (2007) http://www.
clusterobservatory.eu/upload/European_Cluster_Memorandum.pdf
7 See e.g. Gløersen, E. (2009: The NSPA are looking ahead, Journal of
Nordregio, no.3 2009
8/8/2019 Territorial EU
http://slidepdf.com/reader/full/territorial-eu 14/50
14 Nordregio Working Paper 2009:6
density without any agglomerations of European scalecan nevertheless perform economically far beyond theEuropean average and even above regions more ‘centrally’located in Europe.
Agglomerations alone are seen from that perspective,not fully sufcient in themselves to explain territorial
variations of economic performance or levels of welfare.
That gives territorial policies and other similar instrumentsa much wider potential and room for action.
Territorial policies The purpose of EU Cohesion Policy is to contributeto the Lisbon and Gothenburg objectives for growth,jobs and sustainable development. More specically, theCohesion Policy should promote the cohesion of the EU-territory by improving the use of all available resources inthe European regions.
In addition to the Cohesion Policy however a number of other policy-elds at European, national and regional levelimpact territorial development and territorial cohesion.Labour market policy, enterprise- and innovation policy,R&D policies, policies for higher education, energy- andtransport policy, maritime policy, rural developmentpolicy, urban development and planning together with theprovision of public and private services are all importantelds of policy which should be integrated into territorialdevelopment strategies.
In the EU Green Paper on Territorial Cohesion it isargued that the territorial diversity of the EU is a vitalasset. But to turn this diversity into strength it is necessary to address territorial cohesion through a focus on new themes and new sets of relationships binding EU territoriestogether at different levels while also focusing on new forms of cooperation, coordination and partnership.
The European Strategy for the Baltic Sea Regionis an example of these new forms of cooperation andcoordination in action - in this case at the macro-regionalscale.
At the regional level the increased regionalisation of national policy and funding increases the need for strong regional governance and cooperation between differenttypes of stakeholders. One of the new themes which shouldbe addressed at the regional level is the shift to renewableenergy resources and the development of eco-efcientgrowth in general because of the local and regional nature
of many of these renewable energy sources.
Exploring the territorial potentials of a region thusrequires, on the one hand, a process of analysing theaccess to different types of resources and on the other,the putting in place of a prioritization and coordinationprocess, where the relevant groups of stakeholders andelds of policy are involved.
8/8/2019 Territorial EU
http://slidepdf.com/reader/full/territorial-eu 15/50
15
Nordregio Working Paper 2009:6
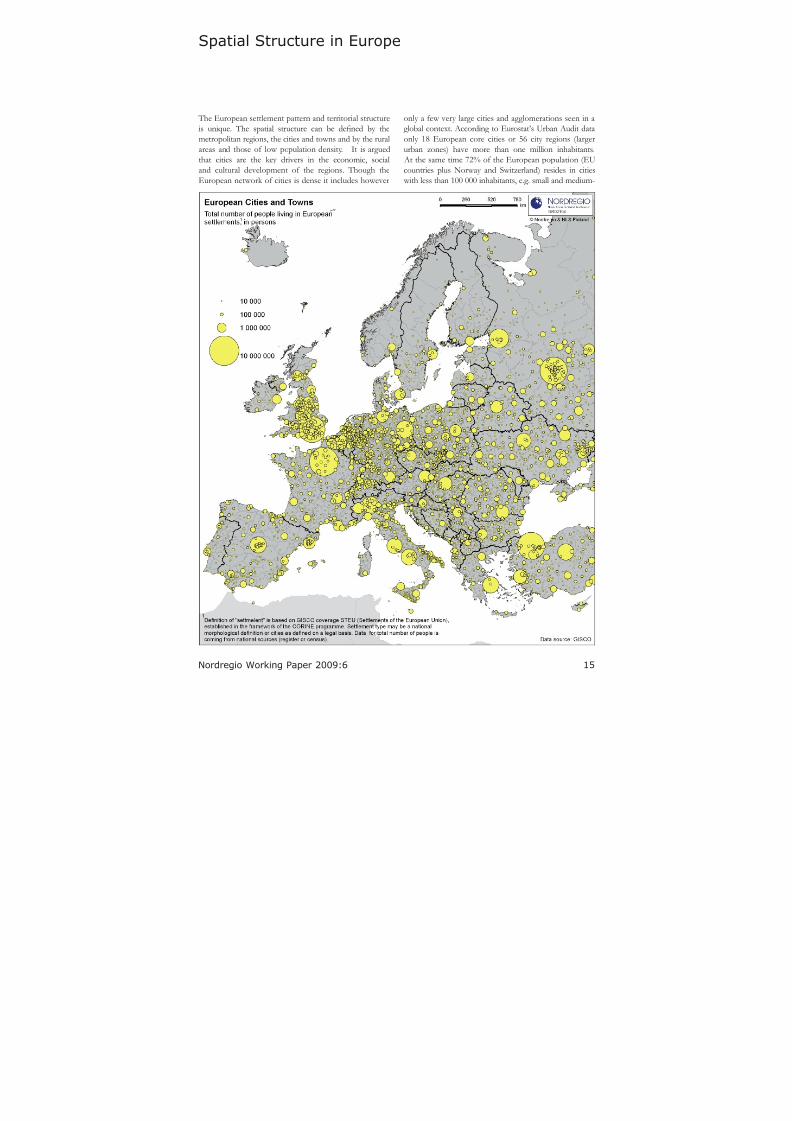
Spatial Structure in Europe
The European settlement pattern and territorial structureis unique. The spatial structure can be dened by themetropolitan regions, the cities and towns and by the ruralareas and those of low population density. It is arguedthat cities are the key drivers in the economic, socialand cultural development of the regions. Though theEuropean network of cities is dense it includes however
only a few very large cities and agglomerations seen in aglobal context. According to Eurostat’s Urban Audit dataonly 18 European core cities or 56 city regions (largerurban zones) have more than one million inhabitants.
At the same time 72% of the European population (EUcountries plus Norway and Switzerland) resides in cities
with less than 100 000 inhabitants, e.g. small and medium-
8/8/2019 Territorial EU
http://slidepdf.com/reader/full/territorial-eu 16/50
8/8/2019 Territorial EU
http://slidepdf.com/reader/full/territorial-eu 17/50
17
Nordregio Working Paper 2009:6
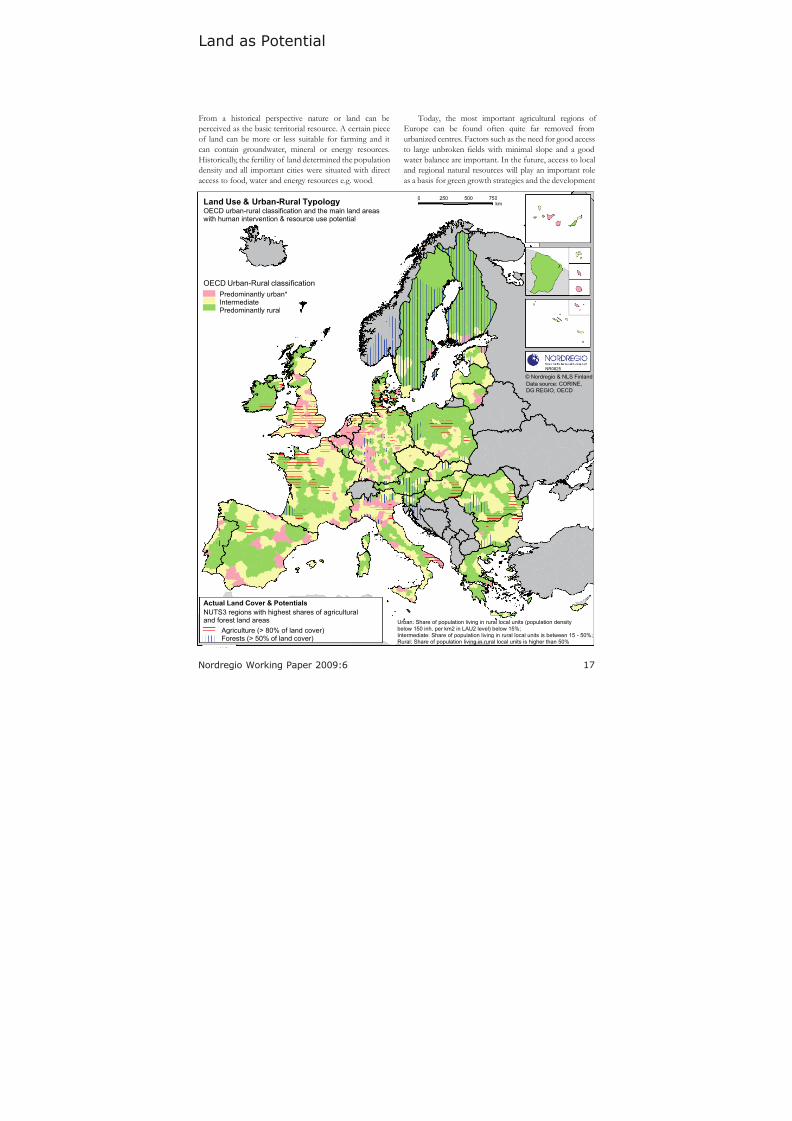
Land as Potential
From a historical perspective nature or land can beperceived as the basic territorial resource. A certain pieceof land can be more or less suitable for farming and itcan contain groundwater, mineral or energy resources.Historically, the fertility of land determined the populationdensity and all important cities were situated with directaccess to food, water and energy resources e.g. wood.
Today, the most important agricultural regions of Europe can be found often quite far removed fromurbanized centres. Factors such as the need for good accessto large unbroken elds with minimal slope and a good
water balance are important. In the future, access to localand regional natural resources will play an important roleas a basis for green growth strategies and the development
Data source: CORINE,
DG REGIO, OECD
0 250 500 750km
NR0825
© Nordregio & NLS Finland
OECD urban-rural classification and the main land areaswith human intervention & resource use potential
Europe_NUTS3_2008UR_class
<Null>
PU
IN
PR-C
PR-R
Europe_NUTS3_2008afs_typo
abb
bab
Actual Land Cover & Potentials
Agriculture (> 80% of land cover)Forests (> 50% of land cover)
NUTS3 regions with highest shares of agriculturaland forest land areas
OECD Urban-Rural classification
Urban: Share of population living in rural local units (population density
below 150 inh. per km2 in LAU2 level) below 15%;
Intermediate: Share of population living in rural local units is between 15 - 50%;
Rural: Share of population living in rural local units is higher than 50%
Land Use & Urban-Rural Typology
Predominantly urban*IntermediatePredominantly rural
*
8/8/2019 Territorial EU
http://slidepdf.com/reader/full/territorial-eu 18/50
8/8/2019 Territorial EU
http://slidepdf.com/reader/full/territorial-eu 19/50
19
Nordregio Working Paper 2009:6
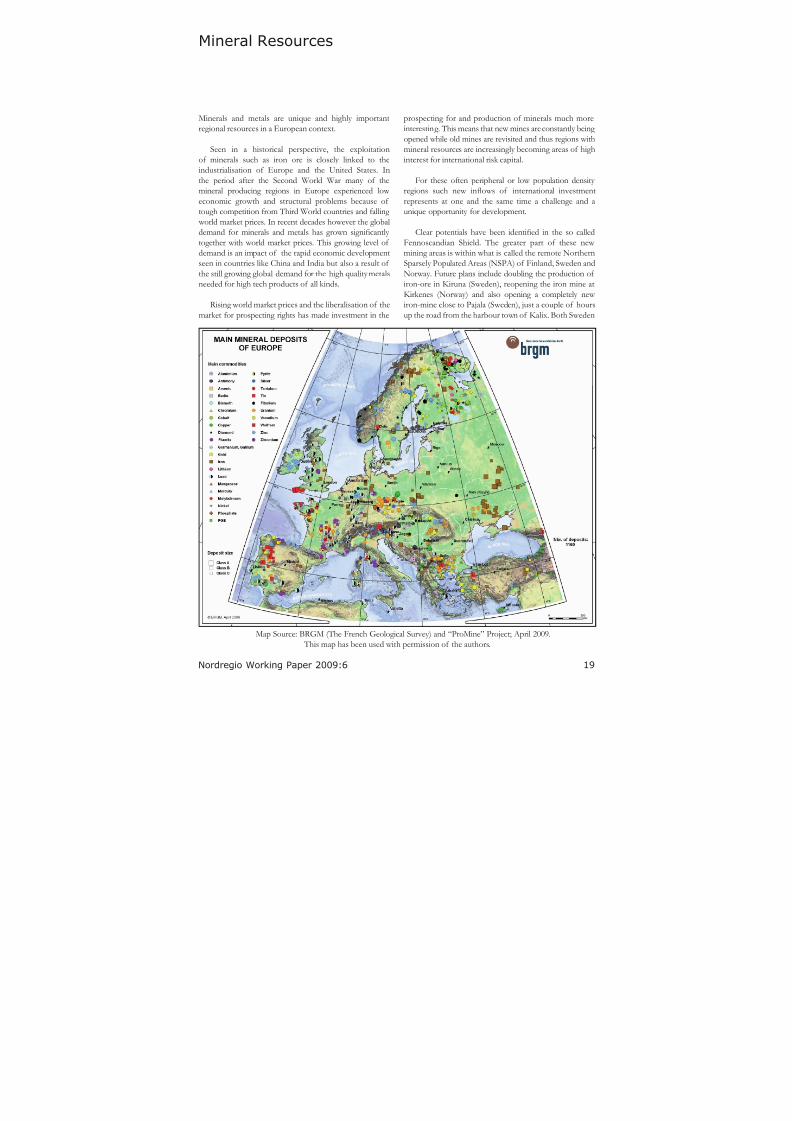
Mineral Resources
Minerals and metals are unique and highly importantregional resources in a European context.
Seen in a historical perspective, the exploitationof minerals such as iron ore is closely linked to theindustrialisation of Europe and the United States. Inthe period after the Second World War many of themineral producing regions in Europe experienced low economic growth and structural problems because of tough competition from Third World countries and falling
world market prices. In recent decades however the globaldemand for minerals and metals has grown signicantly
together with world market prices. This growing level of demand is an impact of the rapid economic developmentseen in countries like China and India but also a result of the still growing global demand for the high quality metalsneeded for high tech products of all kinds.
Rising world market prices and the liberalisation of themarket for prospecting rights has made investment in the
prospecting for and production of minerals much moreinteresting. This means that new mines are constantly being opened while old mines are revisited and thus regions withmineral resources are increasingly becoming areas of highinterest for international risk capital.
For these often peripheral or low population density regions such new inows of international investmentrepresents at one and the same time a challenge and aunique opportunity for development.
Clear potentials have been identied in the so called
Fennoscandian Shield. The greater part of these new mining areas is within what is called the remote NorthernSparsely Populated Areas (NSPA) of Finland, Sweden andNorway. Future plans include doubling the production of iron-ore in Kiruna (Sweden), reopening the iron mine atKirkenes (Norway) and also opening a completely new iron-mine close to Pajala (Sweden), just a couple of hoursup the road from the harbour town of Kalix. Both Sweden
Map Source: BRGM (The French Geological Survey) and “ProMine” Project; April 2009. This map has been used with permission of the authors.
8/8/2019 Territorial EU
http://slidepdf.com/reader/full/territorial-eu 20/50
20 Nordregio Working Paper 2009:6
and Finland are also preparing new mining ventures inrespect of gold, uranium and other minerals. Including also Northwest-Russia, there are currently 42 functioning mines in the region and within a few years there could beas many as 68.
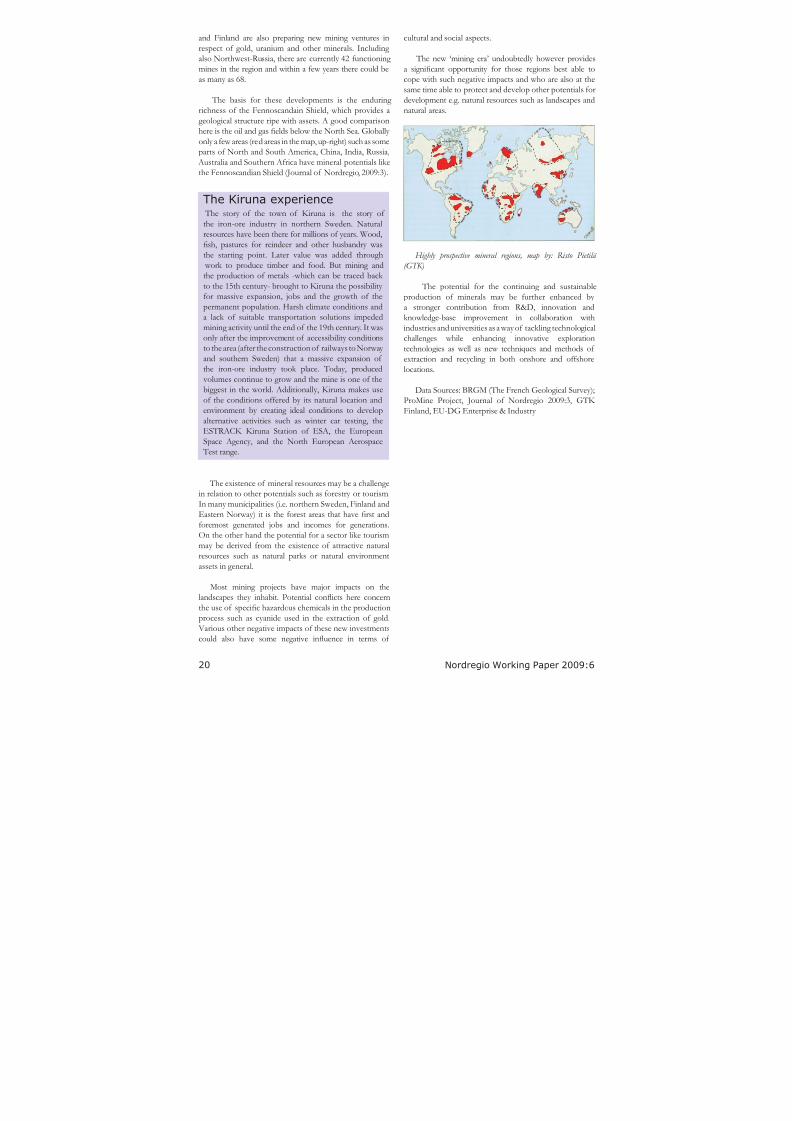
The basis for these developments is the enduring richness of the Fennoscandain Shield, which provides a
geological structure ripe with assets. A good comparisonhere is the oil and gas elds below the North Sea. Globally only a few areas (red areas in the map, up-right) such as someparts of North and South America, China, India, Russia,
Australia and Southern Africa have mineral potentials likethe Fennoscandian Shield (Journal of Nordregio, 2009:3).
The existence of mineral resources may be a challengein relation to other potentials such as forestry or tourism.In many municipalities (i.e. northern Sweden, Finland andEastern Norway) it is the forest areas that have rst andforemost generated jobs and incomes for generations.On the other hand the potential for a sector like tourismmay be derived from the existence of attractive naturalresources such as natural parks or natural environmentassets in general.
Most mining projects have major impacts on thelandscapes they inhabit. Potential conicts here concern
the use of specic hazardous chemicals in the productionprocess such as cyanide used in the extraction of gold. Various other negative impacts of these new investmentscould also have some negative inuence in terms of
The Kiruna experience The story of the town of Kiruna is the story of the iron-ore industry in northern Sweden. Naturalresources have been there for millions of years. Wood,
sh, pastures for reindeer and other husbandry wasthe starting point. Later value was added through
work to produce timber and food. But mining andthe production of metals -which can be traced back to the 15th century- brought to Kiruna the possibility for massive expansion, jobs and the growth of thepermanent population. Harsh climate conditions anda lack of suitable transportation solutions impededmining activity until the end of the 19th century. It wasonly after the improvement of accessibility conditionsto the area (after the construction of railways to Norway and southern Sweden) that a massive expansion of
the iron-ore industry took place. Today, produced volumes continue to grow and the mine is one of thebiggest in the world. Additionally, Kiruna makes useof the conditions offered by its natural location andenvironment by creating ideal conditions to developalternative activities such as winter car testing, theESTRACK Kiruna Station of ESA, the EuropeanSpace Agency, and the North European Aerospace
Test range.
cultural and social aspects.
The new ‘mining era’ undoubtedly however providesa signicant opportunity for those regions best able tocope with such negative impacts and who are also at thesame time able to protect and develop other potentials fordevelopment e.g. natural resources such as landscapes andnatural areas.
Highly prospective mineral regions, map by: Risto Pietilä
(GTK)
The potential for the continuing and sustainableproduction of minerals may be further enhanced by a stronger contribution from R&D, innovation andknowledge-base improvement in collaboration withindustries and universities as a way of tackling technologicalchallenges while enhancing innovative explorationtechnologies as well as new techniques and methods of extraction and recycling in both onshore and offshore
locations.
Data Sources: BRGM (The French Geological Survey);ProMine Project, Journal of Nordregio 2009:3, GTK Finland, EU-DG Enterprise & Industry
8/8/2019 Territorial EU
http://slidepdf.com/reader/full/territorial-eu 21/50
21
Nordregio Working Paper 2009:6
Renewable Energy Potentials
Securing both energy availability and a healthy naturalenvironment have a solid place in the discussion of global competitiveness as these factors enable economiesto operate in a more productive way by consuming lessenergy while simultaneously making an efcient andsustainable use of their own natural resources. Energy efciency and renewable energy are thus pillars of eco-
efcient growth and development. Those also constitutean important opportunity for countries which need toovercome problems of energy dependency. The levelof effectiveness has a clear potential to contribute toother themes such as climate change mitigation and thereduction of greenhouse gas (GHG) emissions. Among allof the potentially available renewable energies it is worth
8/8/2019 Territorial EU
http://slidepdf.com/reader/full/territorial-eu 22/50
22 Nordregio Working Paper 2009:6
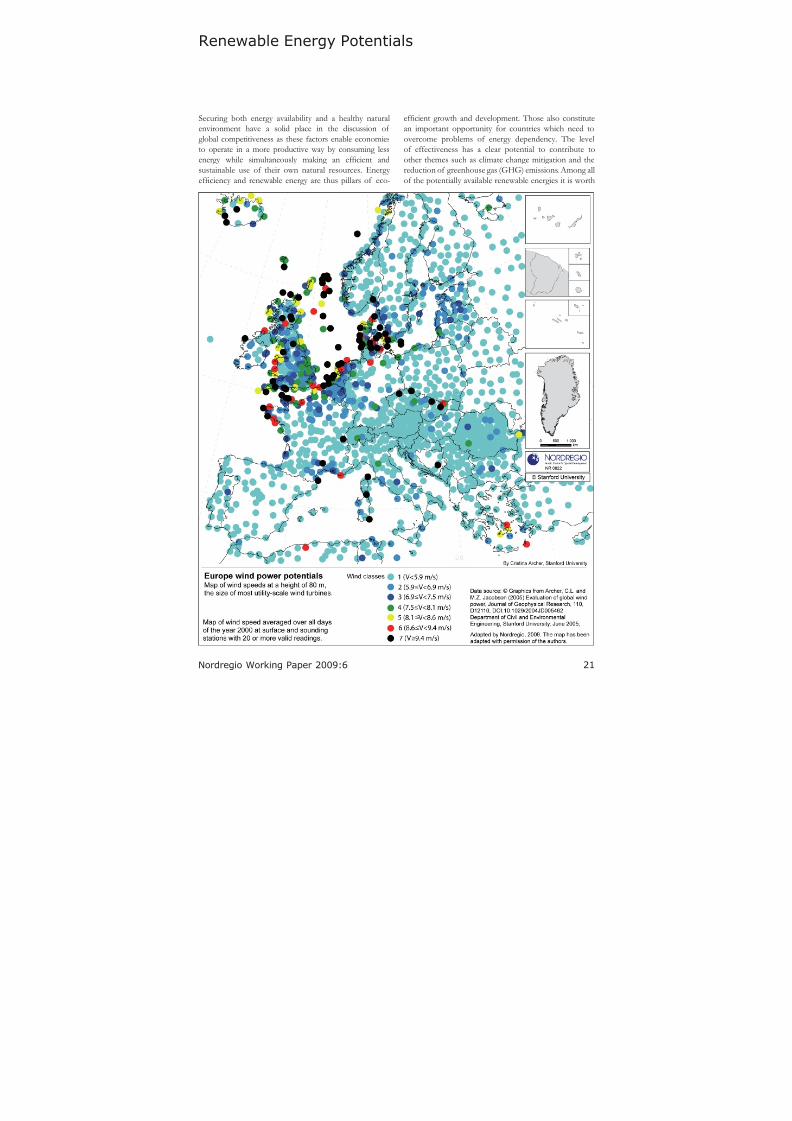
highlighting the emerging growth of wind power generationpotential in countries like Denmark and Germany.
Areas with the greatest potential for wind power inEurope (areas with wind classes 5, 6 or 7) include theNorth-Sea coast as well as the UK coast and islands inthe North Sea and even locations in Slovakia, the CzechRepublic, Greece, Sicily and Corsica.
In 2007, 40% of all new generating capacity installed inthe EU was wind power. Challenges in respect of supply security, climate change and cost competitiveness areincreasing support for wind as a mainstream generationtechnology able to meet a substantial share of Europe’selectricity demand. European countries will move atdifferent speeds to incorporate wind into their energy portfolios; however, the changing political will and theimproving performance of wind power underline itsincreasing competitiveness. In the EU, installed windpower capacity has increased by an average of 25%
annually over the past eleven years, and in terms of annualinstallations, the EU market for wind turbines has grownby 19% annually, between 1997 and 2007. (Extracted fromEWEA (2009): Wind Energy: the facts).
In respect of renewable energies more generally,bioenergy (followed by hydropower) remains the largestsource in Europe and has signicant potential in termsof making a substantial contribution to the securing energy supply and mitigating climate change as well as animportant contributor to solving conicts between energy consumption and environmental policy. Areas with higher
potentials include those with high percentages of forestsand industrial wood residues as well as farming areassuited to the appropriate cropping systems. Regions withan already high production of crops normally have thegreatest potential in respect of bioenergy. Conicts may however emerge between bioenergy and food productionin individual regions.
In recent years the production of biomass energy hasalso become an increasingly important part of the agenda.Biomass energy covers purpose-grown energy crops (poplar,
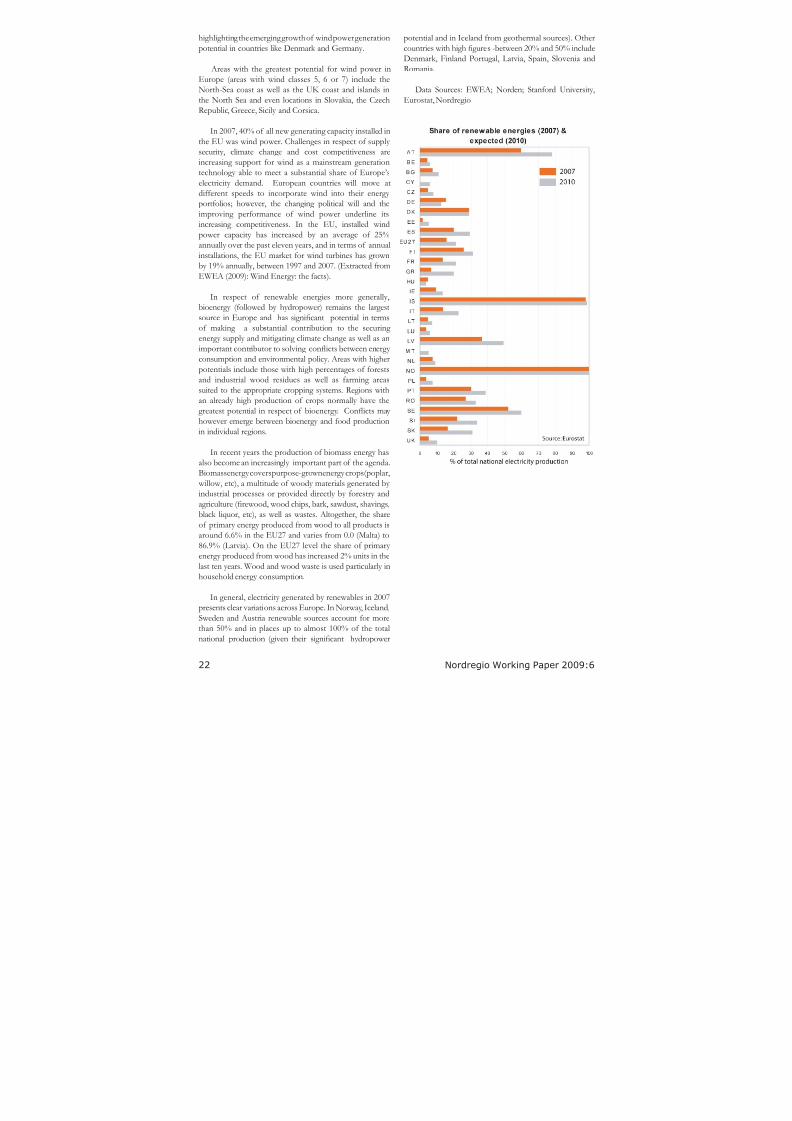
willow, etc), a multitude of woody materials generated by industrial processes or provided directly by forestry andagriculture (rewood, wood chips, bark, sawdust, shavings,black liquor, etc), as well as wastes. Altogether, the shareof primary energy produced from wood to all products isaround 6.6% in the EU27 and varies from 0.0 (Malta) to86.9% (Latvia). On the EU27 level the share of primary energy produced from wood has increased 2% units in thelast ten years. Wood and wood waste is used particularly inhousehold energy consumption.
In general, electricity generated by renewables in 2007
presents clear variations across Europe. In Norway, Iceland,Sweden and Austria renewable sources account for morethan 50% and in places up to almost 100% of the totalnational production (given their signicant hydropower
potential and in Iceland from geothermal sources). Othercountries with high gures -between 20% and 50% includeDenmark, Finland Portugal, Latvia, Spain, Slovenia andRomania.
Data Sources: EWEA; Norden; Stanford University,Eurostat, Nordregio
8/8/2019 Territorial EU
http://slidepdf.com/reader/full/territorial-eu 23/50
23
Nordregio Working Paper 2009:6
Impact of Climate change
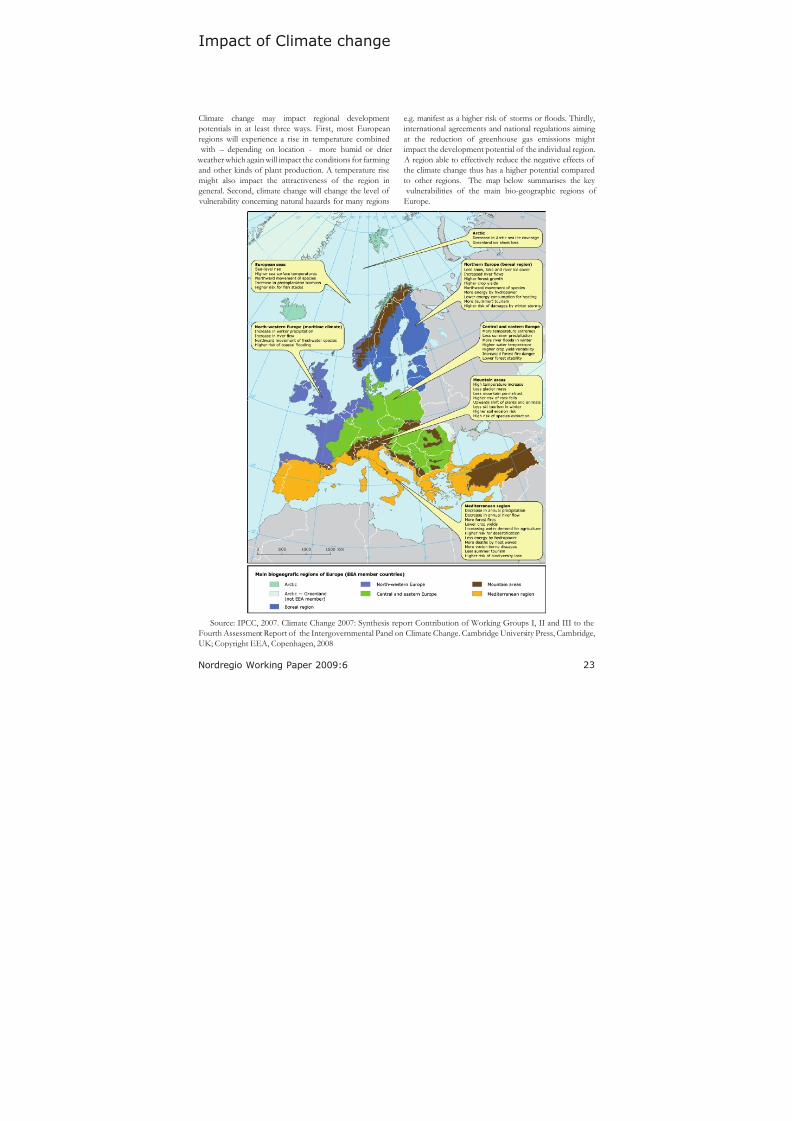
Climate change may impact regional developmentpotentials in at least three ways. First, most Europeanregions will experience a rise in temperature combined
with – depending on location - more humid or drier weather which again will impact the conditions for farming and other kinds of plant production. A temperature risemight also impact the attractiveness of the region ingeneral. Second, climate change will change the level of vulnerability concerning natural hazards for many regions
e.g. manifest as a higher risk of storms or oods. Thirdly,international agreements and national regulations aiming at the reduction of greenhouse gas emissions mightimpact the development potential of the individual region.
A region able to effectively reduce the negative effects of the climate change thus has a higher potential comparedto other regions. The map below summarises the key
vulnerabilities of the main bio-geographic regions of Europe.
Source: IPCC, 2007. Climate Change 2007: Synthesis report Contribution of Working Groups I, II and III to theFourth Assessment Report of the Intergovernmental Panel on Climate Change. Cambridge University Press, Cambridge,UK; Copyright EEA, Copenhagen, 2008
8/8/2019 Territorial EU
http://slidepdf.com/reader/full/territorial-eu 24/50
24 Nordregio Working Paper 2009:6
As changes vary geographically, the impact on differentregions will differ according to the level of vulnerability toclimate hazards (some regions being more threatened by droughts, others by oods, etc), so to strategies may vary from region to region. The higher the vulnerabilities, thegreater the challenges, efforts and costs for the region toadapt and the lower the comparative advantage in relationto other regions fullling their international targets. Climate
change scenario results from the IPCC Assessment Report(2007) project an increase between 0.1 to 0.4°C/decadefor the annual temperature in Europe during the 21stcentury as well as a widespread increase in precipitationin the north. It also shows small decreases in the southand small or ambiguous changes in central Europe pluscertain increases in the intensity and frequency of summerheat waves across Europe. Opportunities in respect of agriculture may decline because of droughts while in otherplaces the rise in temperature will create new possibilities.Regions in the south and Mediterranean regions willbe affected by decreases in hydropower production,
biodiversity loss, frequent res and desertication whileregions in central and northern Europe plus Scandinavia
will develop a potential for higher forest growth, highercrop yields and higher production of renewable energies(i.e. hydropower or wind).
An important contribution to reducing GHG emissionscomes directly from efcient clean and sustainable transportmeans, environmental measures and renewable energy production. The more a region is able to develop policiesin these elds, the higher the potential to reduce GHGsand adapt to climate change. The possible consequences
of climate change in Europe have stimulated efforts by the EU, national governments, businesses, and NGOsto develop adaptation strategies. The EU is supporting adaptation research at the pan-European level while
Other potentialsderived from climateClimate change effects per se may also bring aboutnew potentials for certain regions in Europe especially in parts of Scandinavia and the Baltic States. Softer
weather conditions could bring higher crop yieldsin Denmark and southern Sweden while the timberline will move north in Finland and Sweden. Warmertemperatures overall may develop further opportunitiesfor other industries such as tourism to benet associatedprimarily with longer summer periods, lower energy consumption for heating, and a higher potential forhydropower generation as a result of generalisedincrements in river ows in parts of central and northernScandinavia. Even though these “positive” potentialsmay sound benecial and may indeed bring some sortof development to the regions mentioned, seriousanomalies will still threaten Scandinavia and should notbe discarded. These include reductions in the snow and ice coverage, higher probabilities of ooding andhigher risks of damage from winter storms.
Denmark, Finland, Hungary, Portugal, Slovakia, Spain andthe UK are setting up national programmes for adapting to climate change.
Plans overseeing the adaptation to climate change havebeen included in the ood protection plans of the CzechRepublic as well as in the coastal protection plans of theNetherlands and Norway. (Extracted from IPCC, 2007)
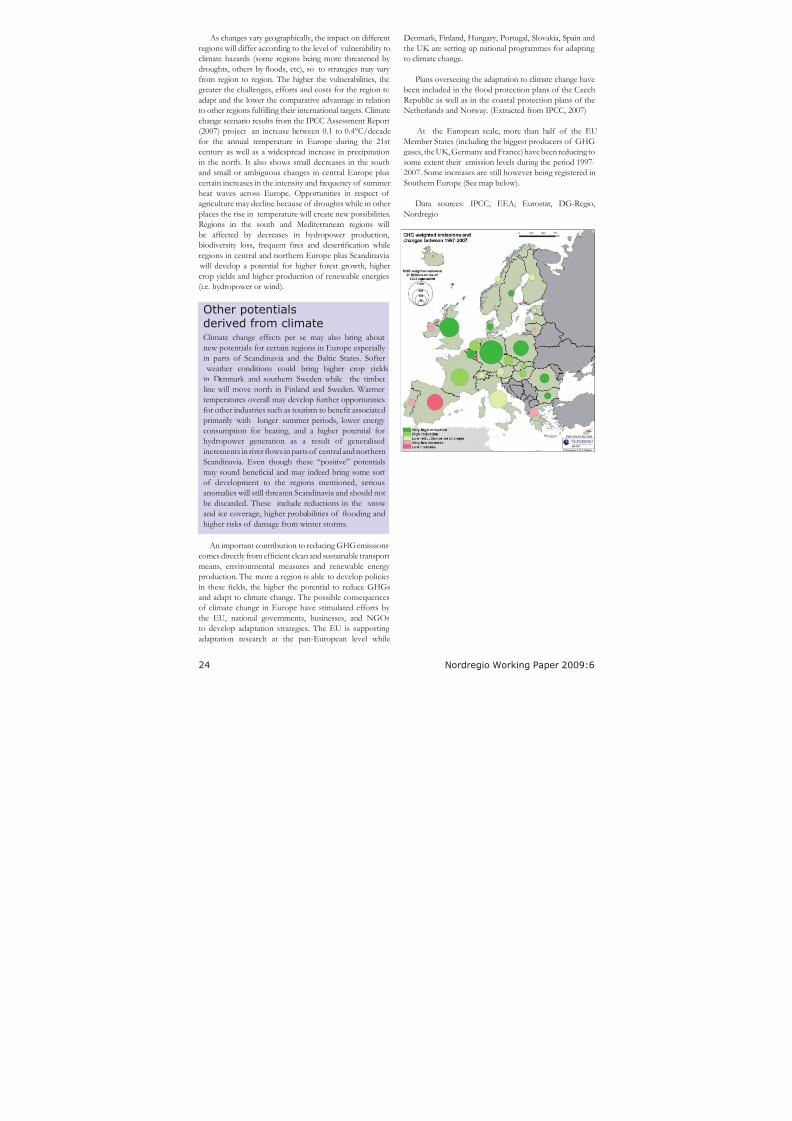
At the European scale, more than half of the EUMember States (including the biggest producers of GHGgases, the UK, Germany and France) have been reducing tosome extent their emission levels during the period 1997-2007. Some increases are still however being registered inSouthern Europe (See map below).
Data sources: IPCC, EEA; Eurostat, DG-Regio,Nordregio
8/8/2019 Territorial EU
http://slidepdf.com/reader/full/territorial-eu 25/50
25
Nordregio Working Paper 2009:6
Population dynamics - Changing & Ageing
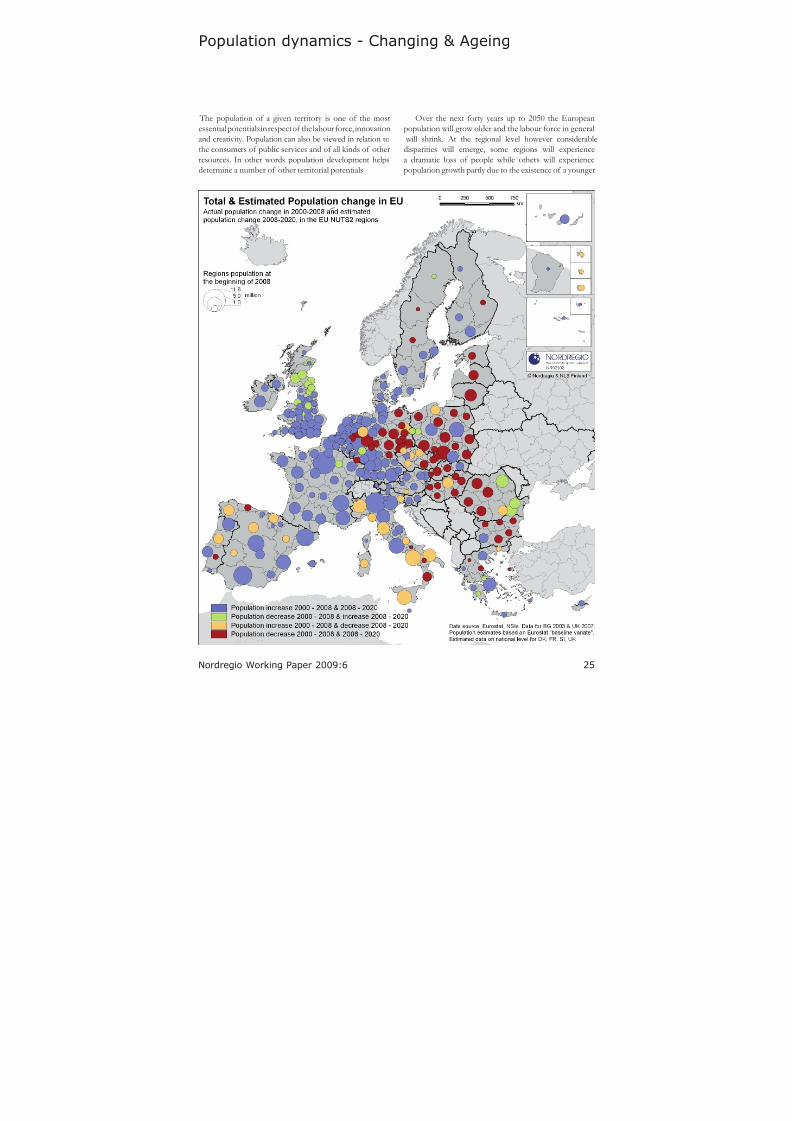
The population of a given territory is one of the mostessential potentials in respect of the labour force, innovationand creativity. Population can also be viewed in relation tothe consumers of public services and of all kinds of otherresources. In other words population development helpsdetermine a number of other territorial potentials.
Over the next forty years up to 2050 the Europeanpopulation will grow older and the labour force in general will shrink. At the regional level however considerabledisparities will emerge, some regions will experiencea dramatic loss of people while others will experiencepopulation growth partly due to the existence of a younger
8/8/2019 Territorial EU
http://slidepdf.com/reader/full/territorial-eu 26/50
26 Nordregio Working Paper 2009:6
and more fertile population and partly to immigration fromother European regions and other parts of the world.
Over the next ten years it is estimated that the Europeanpopulation increase will slightly smooth, being annually around 0.1% on average. Based on Eurostat´s baseline
variant the total population of the EU27 will be around496 million in 2020, a little over 4 million more people than
today. The main growth regions are expected to be the western Netherlands, Ireland and the small member statesof Cyprus, Luxembourg and Malta. The total populationis expected to decrease in relative terms most in the BalticStates.
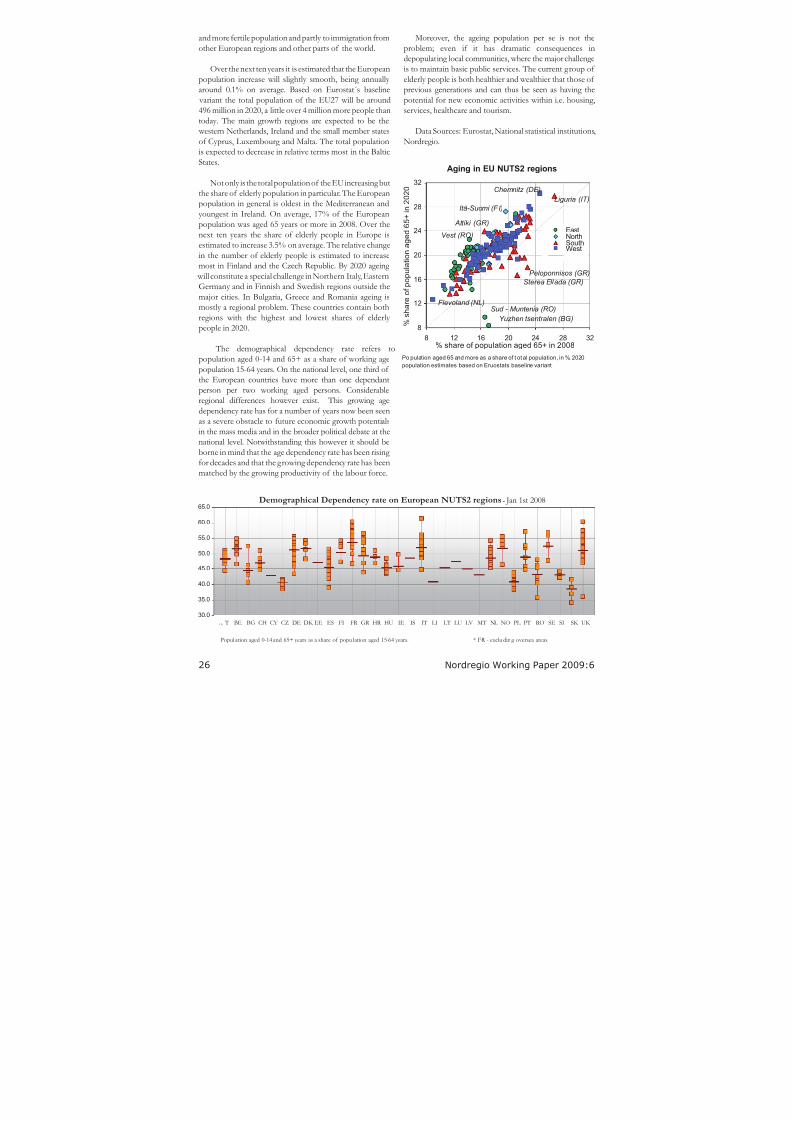
Not only is the total population of the EU increasing butthe share of elderly population in particular. The Europeanpopulation in general is oldest in the Mediterranean andyoungest in Ireland. On average, 17% of the Europeanpopulation was aged 65 years or more in 2008. Over thenext ten years the share of elderly people in Europe is
estimated to increase 3.5% on average. The relative changein the number of elderly people is estimated to increasemost in Finland and the Czech Republic. By 2020 ageing
will constitute a special challenge in Northern Italy, EasternGermany and in Finnish and Swedish regions outside themajor cities. In Bulgaria, Greece and Romania ageing ismostly a regional problem. These countries contain bothregions with the highest and lowest shares of elderly people in 2020.
The demographical dependency rate refers topopulation aged 0-14 and 65+ as a share of working age
population 15-64 years. On the national level, one third of the European countries have more than one dependantperson per two working aged persons. Considerableregional differences however exist. This growing agedependency rate has for a number of years now been seenas a severe obstacle to future economic growth potentialsin the mass media and in the broader political debate at thenational level. Notwithstanding this however it should beborne in mind that the age dependency rate has been rising for decades and that the growing dependency rate has beenmatched by the growing productivity of the labour force.
Demographical Dependency rate on European NUTS2 regions - Jan 1st 2008
30.0
35.0
40.0
45.0
50.0
55.0
60.0
65.0
0 1 2 3 4 5 6 7 8 9 1 0 1 1 1 2 1 3 1 4 1 5 1 6 1 7 1 8 1 9 2 0 2 1 2 2 2 3 2 4 2 5 2 6 2 7 2 8 2 9 3 0 3 1 3 2 3 3
A T BE BG CH CY CZ DE DK EE ES FI FR GR HR HU IE IS IT LI LT LU LV MT NL NO PL PT RO SE SI SK UK
Popul ation aged 0-14 and 65+ years as a share of popu lation aged 15-64 years. * FR - exclu ding oversea areas
Aging in EU NUTS2 regions
8
12
16
20
24
28
32
8 12 16 20 24 28 32% share of population aged 65+ in 2008
% s
h a r e o f p o p u l a t i o n a g e d 6 5 + i n 2 0 2 0
EastNorth
SouthWest
Po pulation aged 65 and more as a share of t otal population, in %. 2020
population estimates based on Eruostats baseline variant
Vest (RO)
Attiki (GR)
Liguria (IT)
Itä-Suomi (FI)
Chemnitz (DE)
Flevoland (NL)
Peloponnisos (GR)
Sterea Ellada (GR)
Sud - Muntenia (RO)
Yuzhen tsentralen (BG)
Moreover, the ageing population per se is not theproblem; even if it has dramatic consequences indepopulating local communities, where the major challengeis to maintain basic public services. The current group of elderly people is both healthier and wealthier that those of previous generations and can thus be seen as having thepotential for new economic activities within i.e. housing,services, healthcare and tourism.
Data Sources: Eurostat, National statistical institutions,Nordregio.
8/8/2019 Territorial EU
http://slidepdf.com/reader/full/territorial-eu 27/50
27
Nordregio Working Paper 2009:6
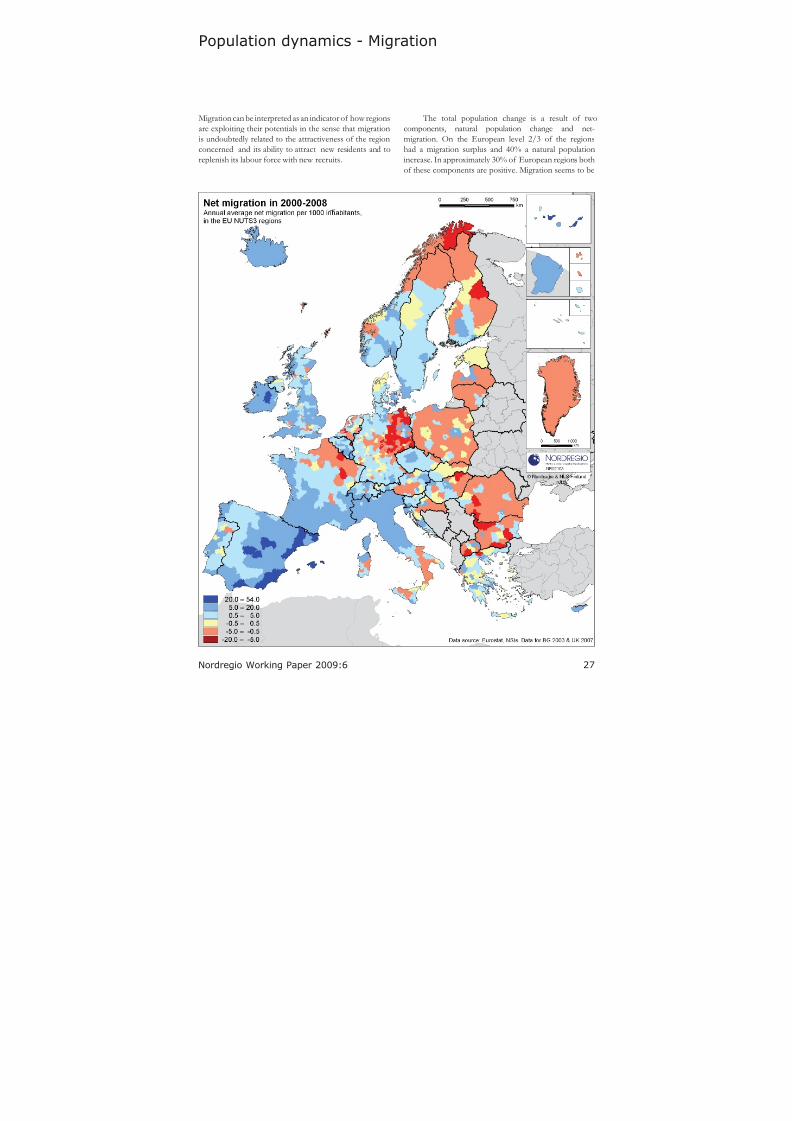
Population dynamics - Migration
Migration can be interpreted as an indicator of how regionsare exploiting their potentials in the sense that migrationis undoubtedly related to the attractiveness of the regionconcerned and its ability to attract new residents and toreplenish its labour force with new recruits.
The total population change is a result of twocomponents, natural population change and net-migration. On the European level 2/3 of the regionshad a migration surplus and 40% a natural populationincrease. In approximately 30% of European regions bothof these components are positive. Migration seems to be
8/8/2019 Territorial EU
http://slidepdf.com/reader/full/territorial-eu 28/50
28 Nordregio Working Paper 2009:6
the more dominant factor for population increase. Almost80% of the regions with positive in-migration also hada total population increase. In 200 European regions thetotal population is decreasing even though net-migrationis positive. These regions are mainly located in EasternGermany, Greece and Portugal, i.e. in regions with very low birth rates.
At a general level a spatial polarisation is visible inrelation to net-migration, both between Eastern and Western Europe and between the metropolitan and themore rural and peripheral regions. In-migration is highestin some Spanish coastal regions and around Madrid, in8 of these regions annual in-migration is over 3%. Thehighest out-migration regions are in Eastern Germany.
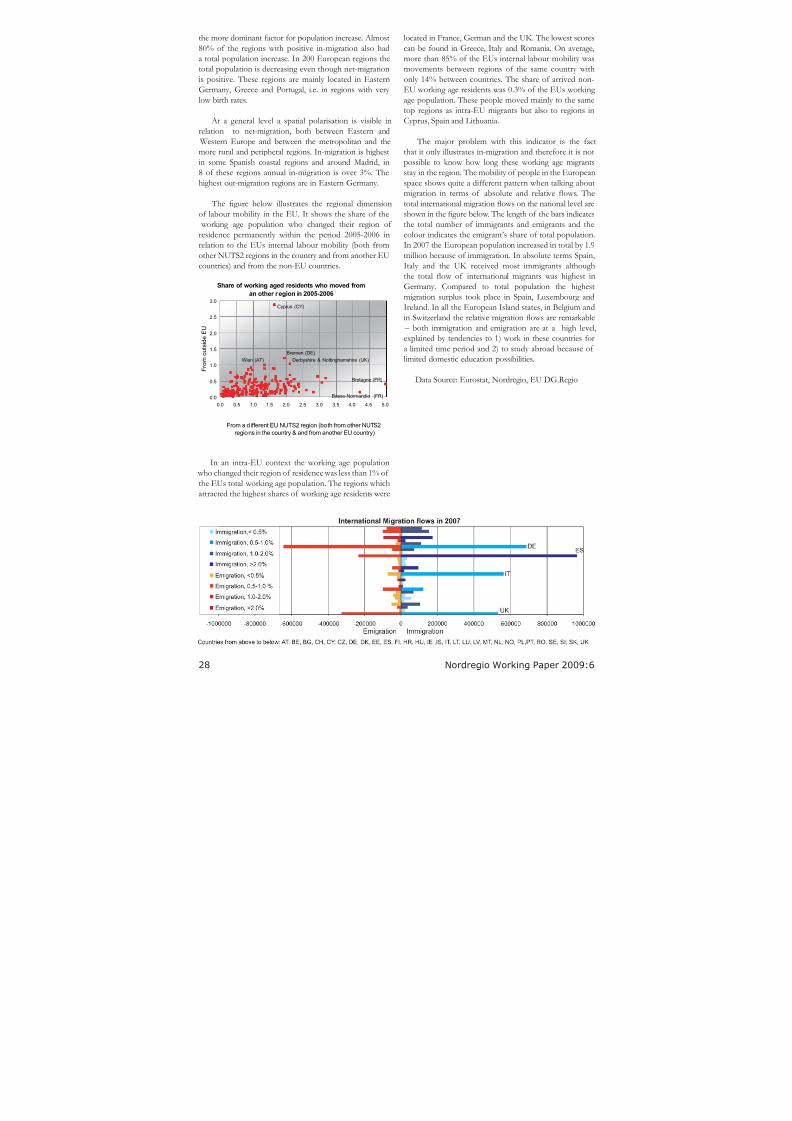
The gure below illustrates the regional dimensionof labour mobility in the EU. It shows the share of the
working age population who changed their region of residence permanently within the period 2005-2006 in
relation to the EUs internal labour mobility (both fromother NUTS2 regions in the country and from another EUcountries) and from the non-EU countries.
In an intra-EU context the working age population who changed their region of residence was less than 1% of the EUs total working age population. The regions whichattracted the highest shares of working age residents were
located in France, German and the UK. The lowest scorescan be found in Greece, Italy and Romania. On average,more than 85% of the EUs internal labour mobility wasmovements between regions of the same country withonly 14% between countries. The share of arrived non-EU working age residents was 0.3% of the EUs working age population. These people moved mainly to the sametop regions as intra-EU migrants but also to regions in
Cyprus, Spain and Lithuania.
The major problem with this indicator is the factthat it only illustrates in-migration and therefore it is notpossible to know how long these working age migrantsstay in the region. The mobility of people in the Europeanspace shows quite a different pattern when talking aboutmigration in terms of absolute and relative ows. Thetotal international migration ows on the national level areshown in the gure below. The length of the bars indicatesthe total number of immigrants and emigrants and thecolour indicates the emigrant’s share of total population.
In 2007 the European population increased in total by 1.9million because of immigration. In absolute terms Spain,Italy and the UK received most immigrants althoughthe total ow of international migrants was highest inGermany. Compared to total population the highestmigration surplus took place in Spain, Luxembourg andIreland. In all the European Island states, in Belgium andin Switzerland the relative migration ows are remarkable
– both immigration and emigration are at a high level,explained by tendencies to 1) work in these countries fora limited time period and 2) to study abroad because of limited domestic education possibilities.
Data Source: Eurostat, Nordregio, EU DG.Regio
Share of working aged residents who moved from
an other region in 2005-2006
0.0
0.5
1.0
1.5
2.0
2.5
3.0
0.0 0.5 1.0 1.5 2.0 2.5 3.0 3.5 4.0 4.5 5.0
From a different EU NUTS2 region (both from other NUTS2
regions in the country & and from another EU country)
F r o m o
u t s i d e E U
Bretagne (FR)
Wien (AT)
Cyprus (CY)
Derbyshire & Nottinghamshire (UK)
Bremen (DE)
Basse-Normandie (FR)
8/8/2019 Territorial EU
http://slidepdf.com/reader/full/territorial-eu 29/50
29
Nordregio Working Paper 2009:6
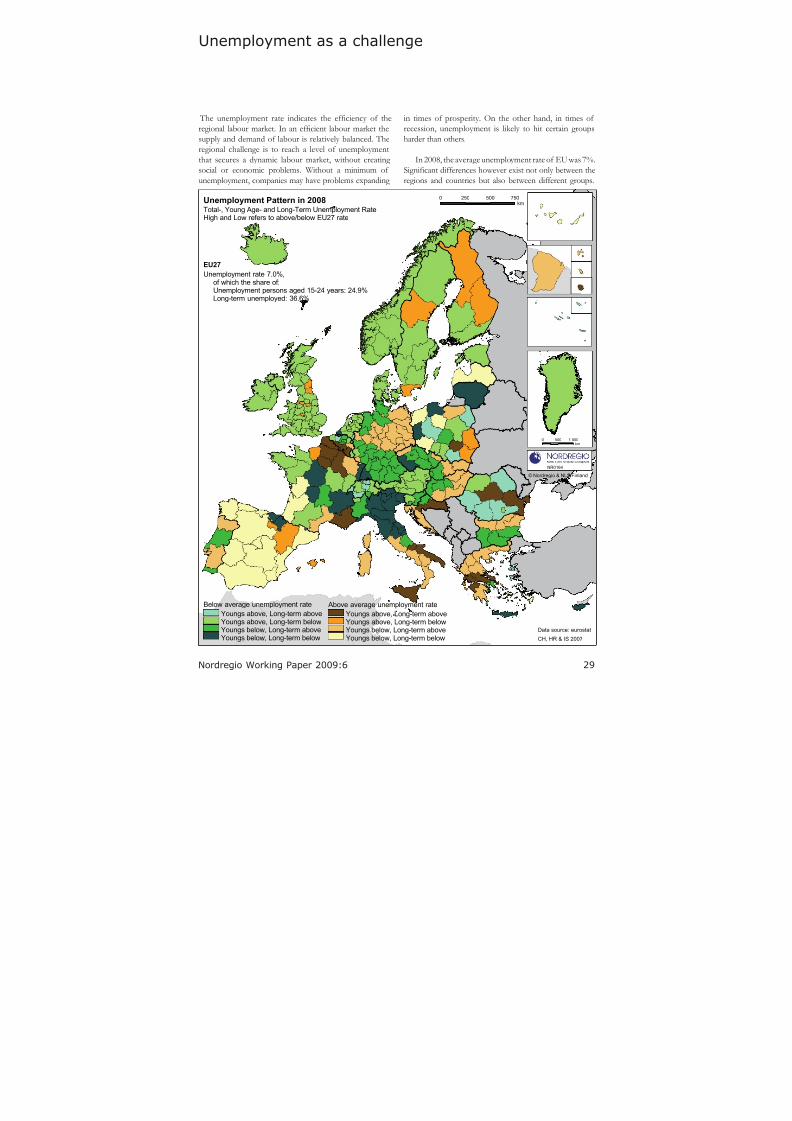
Unemployment as a challenge
The unemployment rate indicates the efciency of theregional labour market. In an efcient labour market thesupply and demand of labour is relatively balanced. Theregional challenge is to reach a level of unemploymentthat secures a dynamic labour market, without creating social or economic problems. Without a minimum of unemployment, companies may have problems expanding
in times of prosperity. On the other hand, in times of recession, unemployment is likely to hit certain groupsharder than others.
In 2008, the average unemployment rate of EU was 7%.Signicant differences however exist not only between theregions and countries but also between different groups.
Data source: eurostat
0 250 500 750km
0 500 1 000km
NR0164
© Nordregio & NLS Finland
Total-, Young Age- and Long-Term Unemployment Rate.High and Low refers to above/below EU27 rate
Unemployment Pattern in 2008
CH, HR & IS 2007
EU27
Unemployment rate 7.0%,of which the share of:Unemployment persons aged 15-24 years: 24.9%Long-term unemployed: 36.6%
Below average unemployment rate
Youngs above, Long-term aboveYoungs above, Long-term belowYoungs below, Long-term aboveYoungs below, Long-term below
Above average unemployment rate
Youngs above, Long-term aboveYoungs above, Long-term belowYoungs below, Long-term aboveYoungs below, Long-term below
8/8/2019 Territorial EU
http://slidepdf.com/reader/full/territorial-eu 30/50
30 Nordregio Working Paper 2009:6
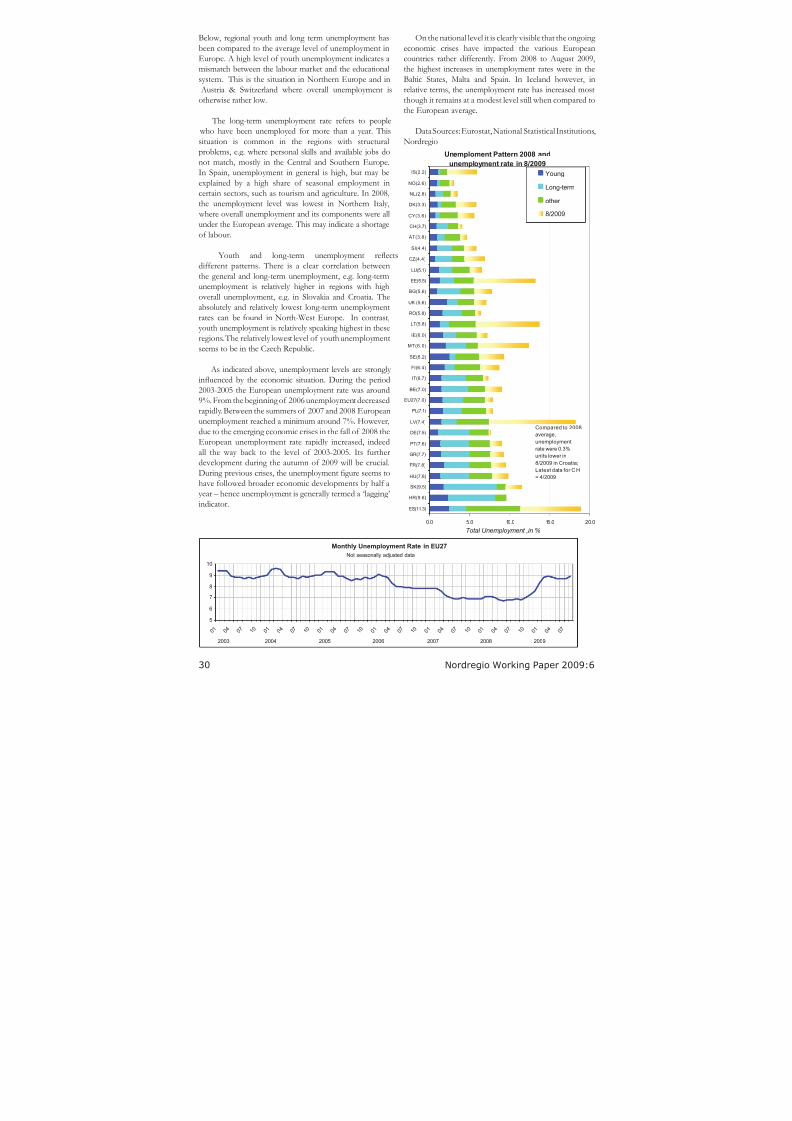
Below, regional youth and long term unemployment hasbeen compared to the average level of unemployment inEurope. A high level of youth unemployment indicates amismatch between the labour market and the educationalsystem. This is the situation in Northern Europe and in Austria & Switzerland where overall unemployment isotherwise rather low.
The long-term unemployment rate refers to people who have been unemployed for more than a year. Thissituation is common in the regions with structuralproblems, e.g. where personal skills and available jobs donot match, mostly in the Central and Southern Europe.In Spain, unemployment in general is high, but may beexplained by a high share of seasonal employment incertain sectors, such as tourism and agriculture. In 2008,the unemployment level was lowest in Northern Italy,
where overall unemployment and its components were allunder the European average. This may indicate a shortageof labour.
Youth and long-term unemployment reectsdifferent patterns. There is a clear correlation betweenthe general and long-term unemployment, e.g. long-termunemployment is relatively higher in regions with highoverall unemployment, e.g. in Slovakia and Croatia. Theabsolutely and relatively lowest long-term unemploymentrates can be found in North-West Europe. In contrast,youth unemployment is relatively speaking highest in theseregions. The relatively lowest level of youth unemploymentseems to be in the Czech Republic.
As indicated above, unemployment levels are strongly inuenced by the economic situation. During the period2003-2005 the European unemployment rate was around9%. From the beginning of 2006 unemployment decreasedrapidly. Between the summers of 2007 and 2008 Europeanunemployment reached a minimum around 7%. However,due to the emerging economic crises in the fall of 2008 theEuropean unemployment rate rapidly increased, indeedall the way back to the level of 2003-2005. Its furtherdevelopment during the autumn of 2009 will be crucial.During previous crises, the unemployment gure seems tohave followed broader economic developments by half ayear – hence unemployment is generally termed a ‘lagging’indicator.
Unemploment Pattern 2008 and
unemployment rate in 8/2009
0.0 5.0 10.0 15.0 20.0
ES(11.3)
HR(9.6)
SK(9.5)
HU(7.8)
FR(7.8)
GR(7.7)
PT(7.6)
DE(7.5)
LV(7.4)
PL(7.1)
EU27(7.0)
BE(7.0)
IT(6.7)
FI(6.4)
SE(6.2)
MT(6.0)
IE(6.0)
LT(5.8)
RO(5.8)
UK (5.6)
BG(5.6)
EE(5.5)
LU(5.1)
CZ(4.4)
SI(4.4)
AT(3.8)
CH(3.7)
CY(3.6)
DK(3.3)
NL(2.8)
NO(2.6)
IS(2.2)
Total Unemployment ,in %
Young
Long-term
other
8/2009
Compared to 2008
average,
unemployment
rate were 0.3%
units lower in
8/2009 in Croatia;
Latest data for C H
= 4/2009
Monthly Unemployment Rate in EU27
5
6
7
8
9
10
0 1 0 4 0 7 1 0 0 1 0 4 0 7 1 0 0 1 0 4 0 7 1 0 0 1 0 4 0 7 1 0 0 1 0 4 0 7 1 0 0 1 0 4 0 7 1 0 0 1 0 4 0 7
Not seasonally adjusted data
2003 200920082007200620052004
On the national level it is clearly visible that the ongoing economic crises have impacted the various Europeancountries rather differently. From 2008 to August 2009,the highest increases in unemployment rates were in theBaltic States, Malta and Spain. In Iceland however, inrelative terms, the unemployment rate has increased mostthough it remains at a modest level still when compared tothe European average.
Data Sources: Eurostat, National Statistical Institutions,Nordregio
8/8/2019 Territorial EU
http://slidepdf.com/reader/full/territorial-eu 31/50
31
Nordregio Working Paper 2009:6
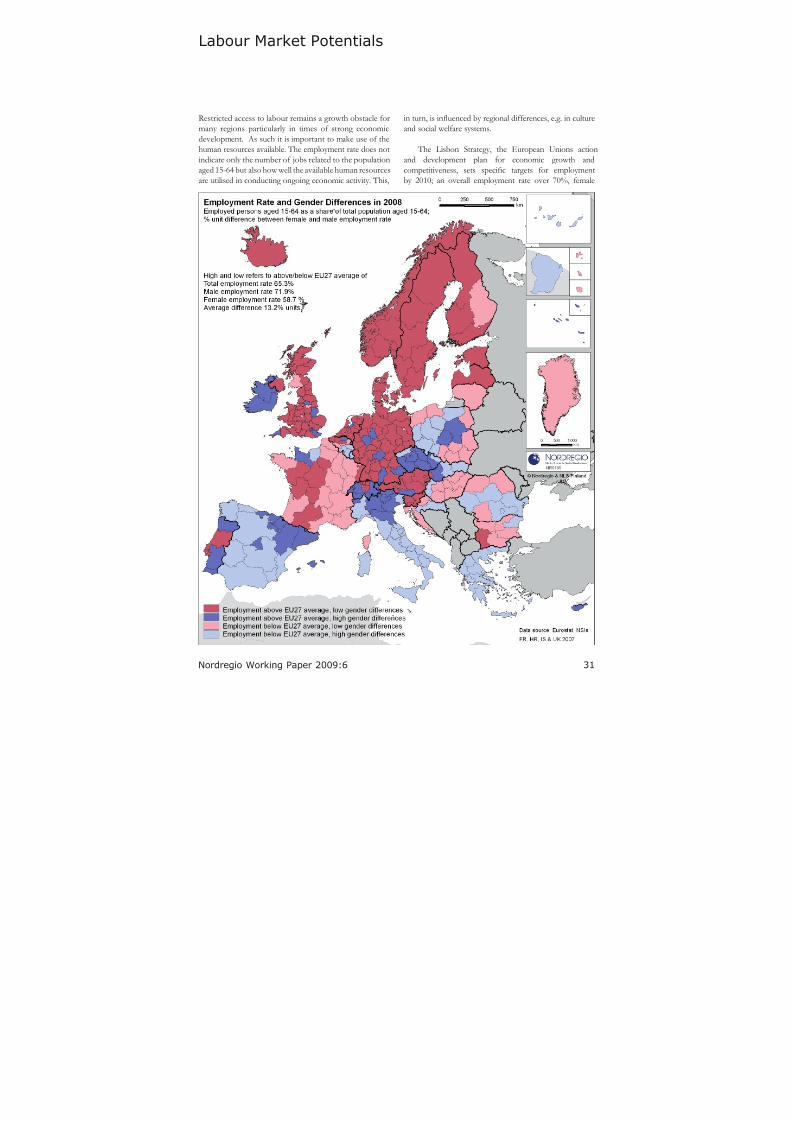
Labour Market Potentials
Restricted access to labour remains a growth obstacle formany regions particularly in times of strong economicdevelopment. As such it is important to make use of thehuman resources available. The employment rate does notindicate only the number of jobs related to the populationaged 15-64 but also how well the available human resourcesare utilised in conducting ongoing economic activity. This,
in turn, is inuenced by regional differences, e.g. in cultureand social welfare systems.
The Lisbon Strategy, the European Unions actionand development plan for economic growth andcompetitiveness, sets specic targets for employmentby 2010; an overall employment rate over 70%, female
8/8/2019 Territorial EU
http://slidepdf.com/reader/full/territorial-eu 32/50
32 Nordregio Working Paper 2009:6
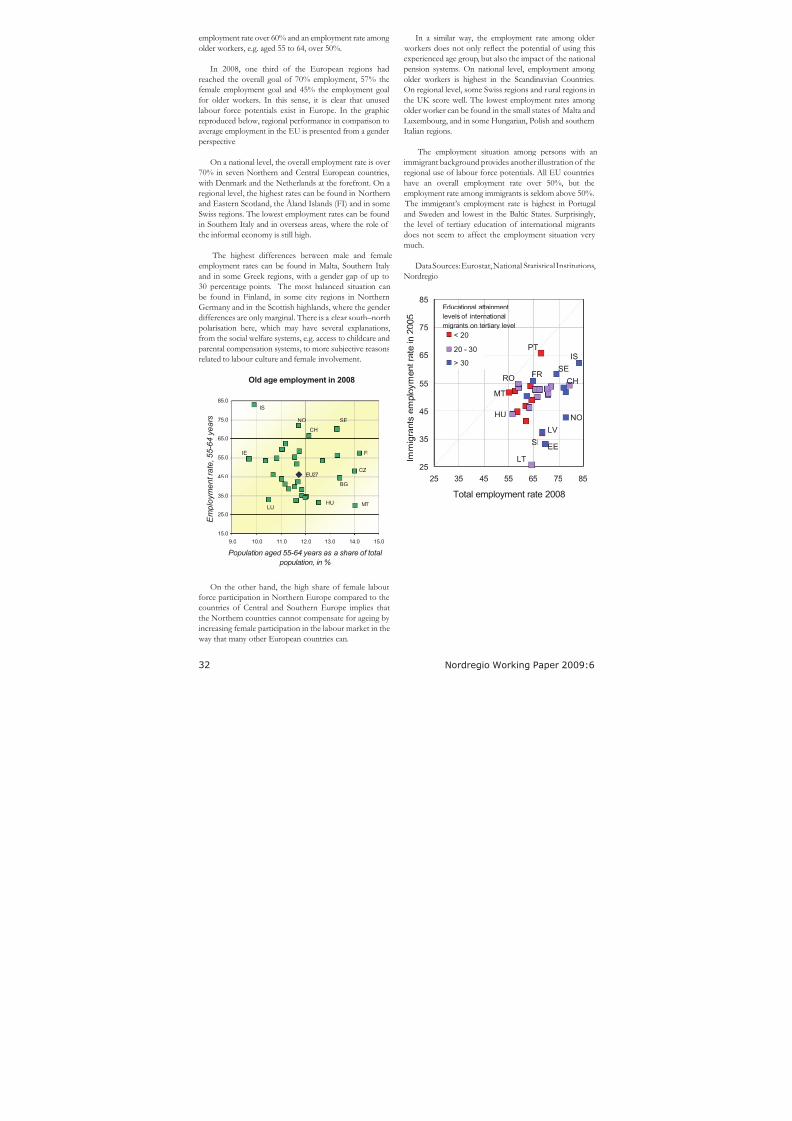
employment rate over 60% and an employment rate among older workers, e.g. aged 55 to 64, over 50%.
In 2008, one third of the European regions hadreached the overall goal of 70% employment, 57% thefemale employment goal and 45% the employment goalfor older workers. In this sense, it is clear that unusedlabour force potentials exist in Europe. In the graphic
reproduced below, regional performance in comparison toaverage employment in the EU is presented from a genderperspective.
On a national level, the overall employment rate is over70% in seven Northern and Central European countries,
with Denmark and the Netherlands at the forefront. On aregional level, the highest rates can be found in Northernand Eastern Scotland, the Åland Islands (FI) and in someSwiss regions. The lowest employment rates can be foundin Southern Italy and in overseas areas, where the role of the informal economy is still high.
The highest differences between male and femaleemployment rates can be found in Malta, Southern Italy and in some Greek regions, with a gender gap of up to30 percentage points. The most balanced situation canbe found in Finland, in some city regions in NorthernGermany and in the Scottish highlands, where the genderdifferences are only marginal. There is a clear south–northpolarisation here, which may have several explanations,from the social welfare systems, e.g. access to childcare andparental compensation systems, to more subjective reasonsrelated to labour culture and female involvement.
On the other hand, the high share of female labourforce participation in Northern Europe compared to the
countries of Central and Southern Europe implies thatthe Northern countries cannot compensate for ageing by increasing female participation in the labour market in the
way that many other European countries can.
25
35
45
55
65
75
85
25 35 45 55 65 75 85
Total employment rate 2008
I m m i g r a n t s e m p l o y m e n t r a t e i n 2 0 0 5
< 20
20 - 30
> 30
IS
EE
LT
CH
SE
PT
HU
MT
ROFR
NO
SI
LV
Educational attainment
levels of international
migrants on tertiary level
Old age employment in 2008
15.0
25.0
35.0
45.0
55.0
65.0
75.0
85.0
9.0 10.0 11.0 12.0 13.0 14.0 15.0
Population aged 55-64 years as a share of total
population, in %
E m p l o y m e
n t r a t e ,
5 5 - 6 4 y e a r s
EU27
MT
CZ
BG
SE
IS
NO
IE
CH
LU
FI
HU
In a similar way, the employment rate among older workers does not only reect the potential of using thisexperienced age group, but also the impact of the nationalpension systems. On national level, employment among older workers is highest in the Scandinavian Countries.On regional level, some Swiss regions and rural regions inthe UK score well. The lowest employment rates among older worker can be found in the small states of Malta and
Luxembourg, and in some Hungarian, Polish and southernItalian regions.
The employment situation among persons with animmigrant background provides another illustration of theregional use of labour force potentials. All EU countrieshave an overall employment rate over 50%, but theemployment rate among immigrants is seldom above 50%.
The immigrant’s employment rate is highest in Portugaland Sweden and lowest in the Baltic States. Surprisingly,the level of tertiary education of international migrantsdoes not seem to affect the employment situation very
much.
Data Sources: Eurostat, National Statistical Institutions,Nordregio
8/8/2019 Territorial EU
http://slidepdf.com/reader/full/territorial-eu 33/50
33
Nordregio Working Paper 2009:6
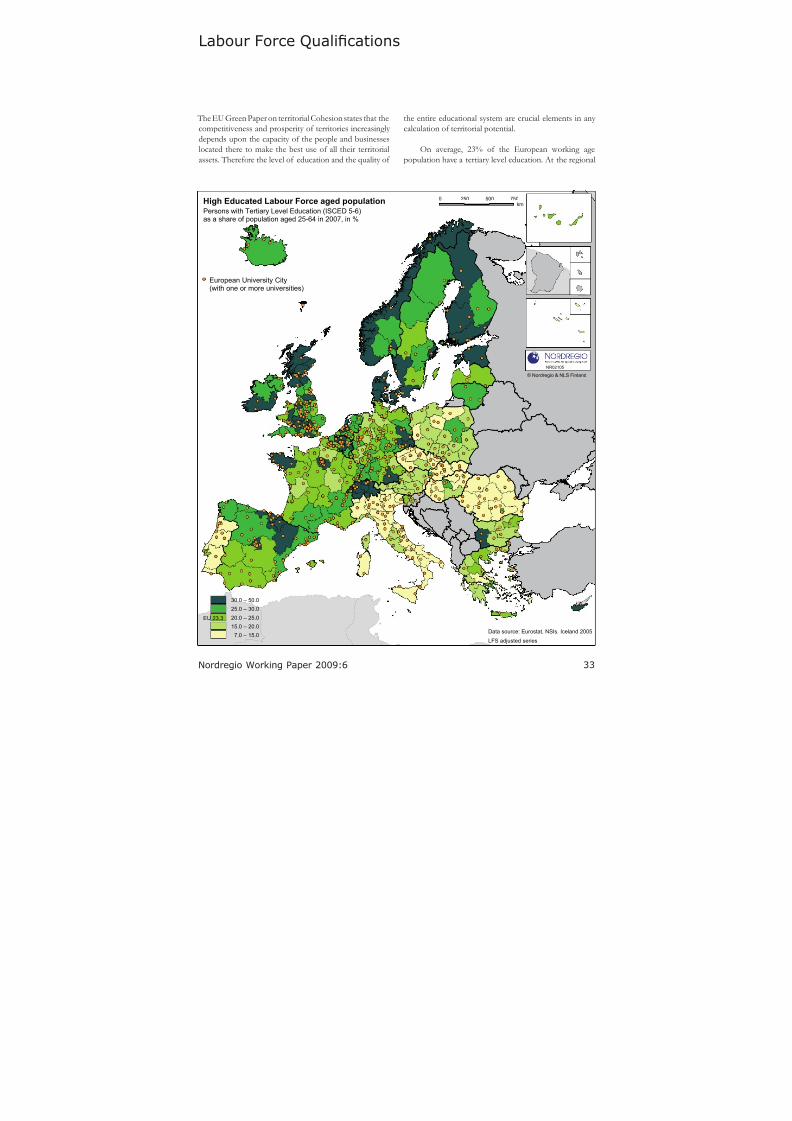
Labour Force Qualifcations
The EU Green Paper on territorial Cohesion states that thecompetitiveness and prosperity of territories increasingly depends upon the capacity of the people and businesseslocated there to make the best use of all their territorialassets. Therefore the level of education and the quality of
the entire educational system are crucial elements in any calculation of territorial potential.
On average, 23% of the European working agepopulation have a tertiary level education. At the regional
7.0 – 15.0
15.0 – 20.0
20.0 – 25.025.0 – 30.0
30.0 – 50.0
Data source: Eurostat, NSIs. Iceland 2005
0 250 500 750km
NR02105
© Nordregio & NLS Finland
LFS adjusted series
EU 23.3
Persons with Tertiary Level Education (ISCED 5-6)as a share of population aged 25-64 in 2007, in %
High Educated Labour Force aged population
European University City(with one or more universities)
8/8/2019 Territorial EU
http://slidepdf.com/reader/full/territorial-eu 34/50
34 Nordregio Working Paper 2009:6
level the tendency is that the most tertiary level educateddense regions are the main European city regions.Notwithstanding this however it is also the case thatregions with low population densities in Northern and
Western Europe also tend to have a remarkably high levelof tertiary education.
At the European level around 50% of tertiary
level educated people are female. Signicant differenceshowever exist between countries. Around the Baltic Seaand especially in the Baltic States the share of highly educated females is overrepresented (over 60%) whereas inthe Central European countries of Switzerland, Germany and Austria only around 40% of highly educated personsare female.
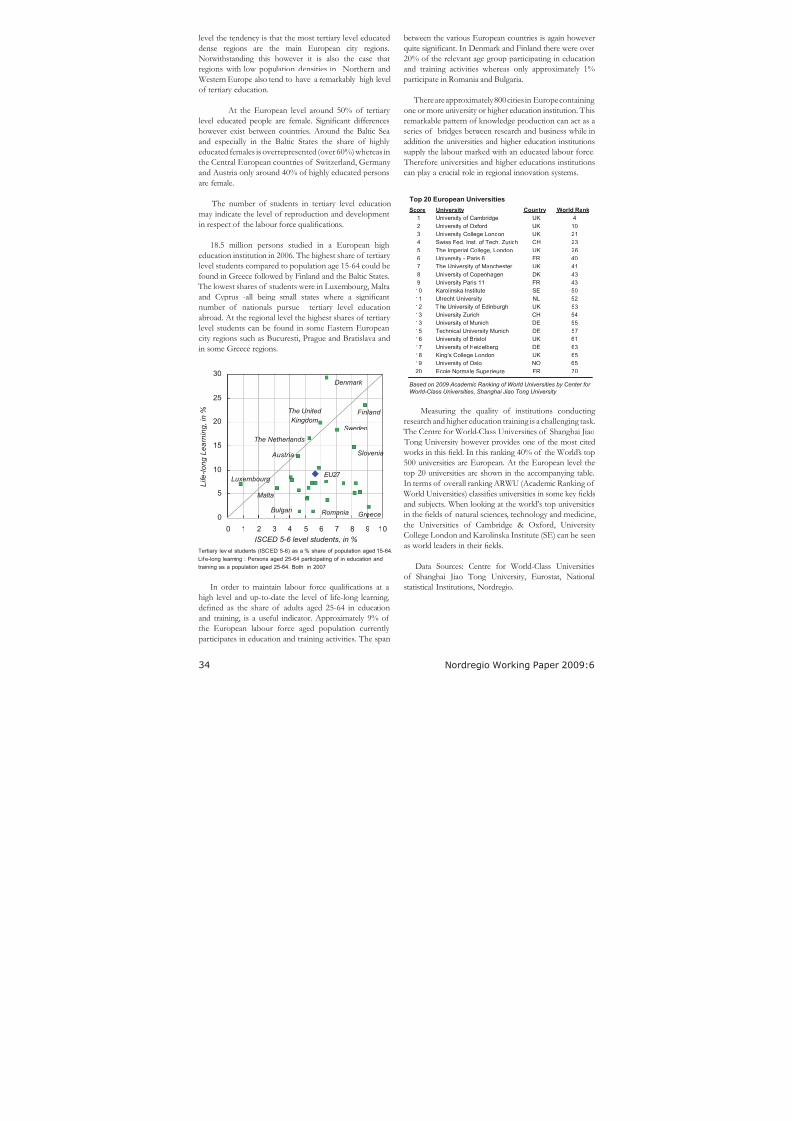
The number of students in tertiary level educationmay indicate the level of reproduction and developmentin respect of the labour force qualications.
18.5 million persons studied in a European higheducation institution in 2006. The highest share of tertiary level students compared to population age 15-64 could befound in Greece followed by Finland and the Baltic States.
The lowest shares of students were in Luxembourg, Maltaand Cyprus -all being small states where a signicantnumber of nationals pursue tertiary level educationabroad. At the regional level the highest shares of tertiary level students can be found in some Eastern Europeancity regions such as Bucuresti, Prague and Bratislava andin some Greece regions.
In order to maintain labour force qualications at ahigh level and up-to-date the level of life-long learning,
dened as the share of adults aged 25-64 in educationand training, is a useful indicator. Approximately 9% of the European labour force aged population currently participates in education and training activities. The span
0
5
10
15
20
25
30
0 1 2 3 4 5 6 7 8 9 10
ISCED 5-6 level students, in %
L i f e - l o n g L e a r n i n g ,
i n %
Malta
GreeceBulgari
The Netherlands
Romania
Luxembourg
Austria
EU27
Slovenia
Sweden
Finland The United
Kingdom
Denmark
Tertiary lev el students (ISCED 5-6) as a % share of population aged 15-64.
Lif e-long learning : Persons aged 25-64 participating of in education and
training as a population aged 25-64. Both in 2007
Top 20 European Universities
Score University Country World Rank
Based on 2009 Academic Ranking of World Universities by Center for
World-Class Universities, Shanghai Jiao Tong University
between the various European countries is again howeverquite signicant. In Denmark and Finland there were over20% of the relevant age group participating in educationand training activities whereas only approximately 1%participate in Romania and Bulgaria.
There are approximately 800 cities in Europe containing one or more university or higher education institution. This
remarkable pattern of knowledge production can act as aseries of bridges between research and business while inaddition the universities and higher education institutionssupply the labour marked with an educated labour force.
Therefore universities and higher educations institutionscan play a crucial role in regional innovation systems.
Measuring the quality of institutions conducting research and higher education training is a challenging task.
The Centre for World-Class Universities of Shanghai Jiao Tong University however provides one of the most cited works in this eld. In this ranking 40% of the World’s top500 universities are European. At the European level thetop 20 universities are shown in the accompanying table.In terms of overall ranking ARWU (Academic Ranking of World Universities) classies universities in some key eldsand subjects. When looking at the world’s top universitiesin the elds of natural sciences, technology and medicine,the Universities of Cambridge & Oxford, University College London and Karolinska Institute (SE) can be seenas world leaders in their elds.
Data Sources: Centre for World-Class Universitiesof Shanghai Jiao Tong University, Eurostat, Nationalstatistical Institutions, Nordregio.
8/8/2019 Territorial EU
http://slidepdf.com/reader/full/territorial-eu 35/50
35
Nordregio Working Paper 2009:6
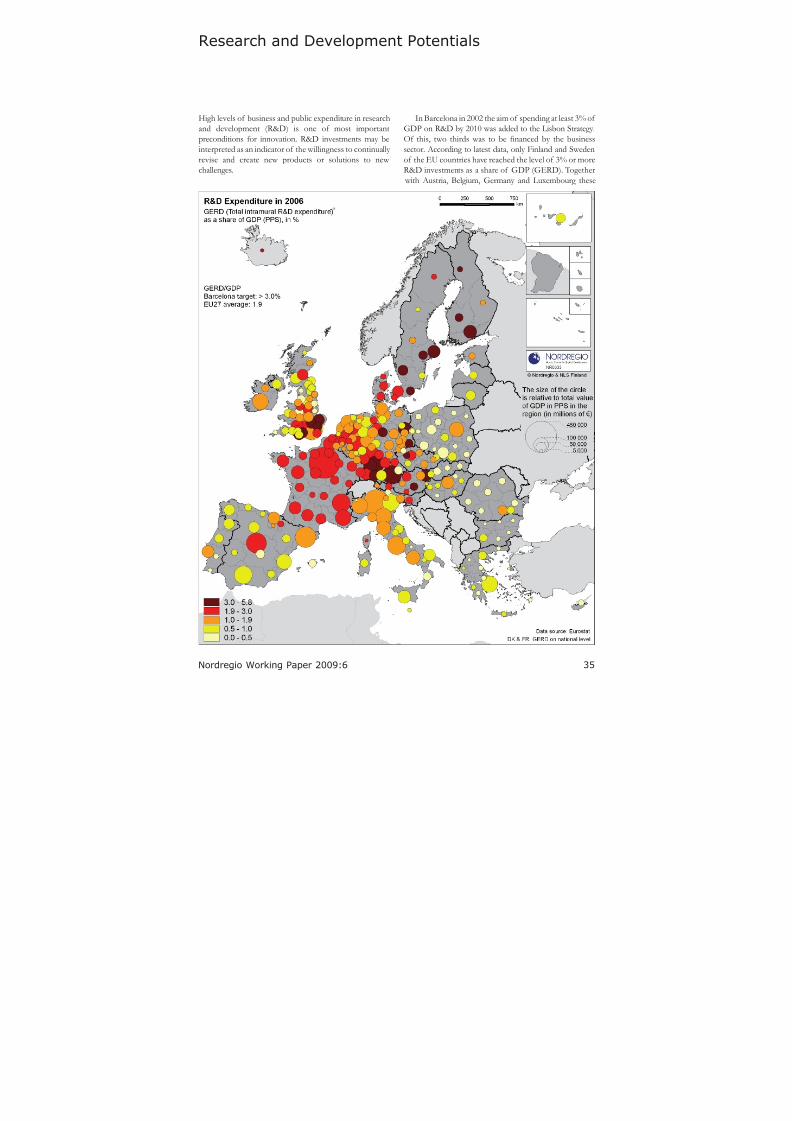
Research and Development Potentials
High levels of business and public expenditure in researchand development (R&D) is one of most importantpreconditions for innovation. R&D investments may beinterpreted as an indicator of the willingness to continually revise and create new products or solutions to new challenges.
In Barcelona in 2002 the aim of spending at least 3% of GDP on R&D by 2010 was added to the Lisbon Strategy.Of this, two thirds was to be nanced by the businesssector. According to latest data, only Finland and Swedenof the EU countries have reached the level of 3% or moreR&D investments as a share of GDP (GERD). Together
with Austria, Belgium, Germany and Luxembourg these
8/8/2019 Territorial EU
http://slidepdf.com/reader/full/territorial-eu 36/50
36 Nordregio Working Paper 2009:6
Business and R&D expenditures (in% of GDP)
0,0
0,5
1,0
1,5
2,0
2,5
3,0
0,0 0,2 0,4 0,6 0,8 1,0 1,2 1,4
Public R&D expenditure (in % of GDP)
B u s i n e s s R
& D e x p e n d i t u r e ( i n % o
f G D P )
Source: European Innovation Scoreboard Database, 2008
EU27
Iceland
Sweden
Finland
Norway
Denmark
Austria
Switzerland
Slovakia
Malta
Lithuania
Luxembourg
Germany
Bulgaria
Estonia
France
Spain
Ireland
Company ICB Sector R&D Investment
in 1000 €
Nokia (FI) Telecommunications equip. 5281.0Volkswagen (DE) Automobiles & parts 4923.0
Daimler (DE) Automobiles & parts 4888.0
Sanofi-Aventis (FR) Pharmaceuticals 4563.0
GlaxoSmithKline (UK) Pharmaceuticals 4419.4
Robert Bosch (DE) Automobiles & parts 3560.0
AstraZeneca (UK) Pharmaceuticals 3448.6
Alcatel-Lucent (FR) Telecommunications equip. 3368.0
Siemens (DE) Electrical components & equip. 3366.0
BMW (DE) Automobiles & parts 3144.0
Patents per 1 000 000 inhabitants in 2006
0
10
20
30
40
50
60
0 100 200 300 400 500 600
All patents
H i g h - t e c h p a t e n t s
EU27
DK
NL
LU
DE
FI
CH
SE
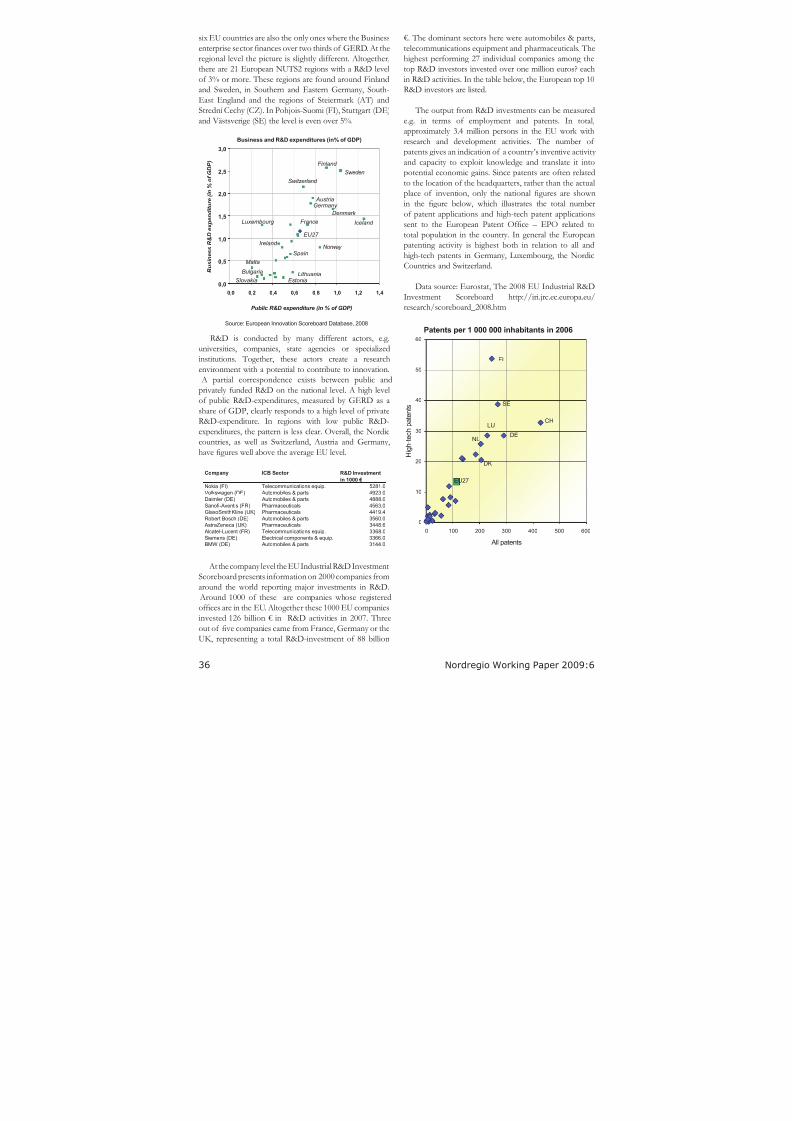
six EU countries are also the only ones where the Businessenterprise sector nances over two thirds of GERD. At theregional level the picture is slightly different. Altogether,there are 21 European NUTS2 regions with a R&D levelof 3% or more. These regions are found around Finlandand Sweden, in Southern and Eastern Germany, South-East England and the regions of Steiermark (AT) andStrední Cechy (CZ). In Pohjois-Suomi (FI), Stuttgart (DE)
and Västsverige (SE) the level is even over 5%.
R&D is conducted by many different actors, e.g.universities, companies, state agencies or specializedinstitutions. Together, these actors create a research
environment with a potential to contribute to innovation. A partial correspondence exists between public andprivately funded R&D on the national level. A high levelof public R&D-expenditures, measured by GERD as ashare of GDP, clearly responds to a high level of privateR&D-expenditure. In regions with low public R&D-expenditures, the pattern is less clear. Overall, the Nordiccountries, as well as Switzerland, Austria and Germany,have gures well above the average EU level.
At the company level the EU Industrial R&D InvestmentScoreboard presents information on 2000 companies fromaround the world reporting major investments in R&D.
Around 1000 of these are companies whose registered
ofces are in the EU. Altogether these 1000 EU companiesinvested 126 billion € in R&D activities in 2007. Threeout of ve companies came from France, Germany or theUK, representing a total R&D-investment of 88 billion
€. The dominant sectors here were automobiles & parts,telecommunications equipment and pharmaceuticals. Thehighest performing 27 individual companies among thetop R&D investors invested over one million euros? eachin R&D activities. In the table below, the European top 10R&D investors are listed.
The output from R&D investments can be measured
e.g. in terms of employment and patents. In total,approximately 3.4 million persons in the EU work withresearch and development activities. The number of patents gives an indication of a country’s inventive activity and capacity to exploit knowledge and translate it intopotential economic gains. Since patents are often relatedto the location of the headquarters, rather than the actualplace of invention, only the national gures are shownin the gure below, which illustrates the total numberof patent applications and high-tech patent applicationssent to the European Patent Ofce – EPO related tototal population in the country. In general the European
patenting activity is highest both in relation to all andhigh-tech patents in Germany, Luxembourg, the NordicCountries and Switzerland.
Data source: Eurostat, The 2008 EU Industrial R&DInvestment Scoreboard http://iri.jrc.ec.europa.eu/research/scoreboard_2008.htm
8/8/2019 Territorial EU
http://slidepdf.com/reader/full/territorial-eu 37/50
37
Nordregio Working Paper 2009:6
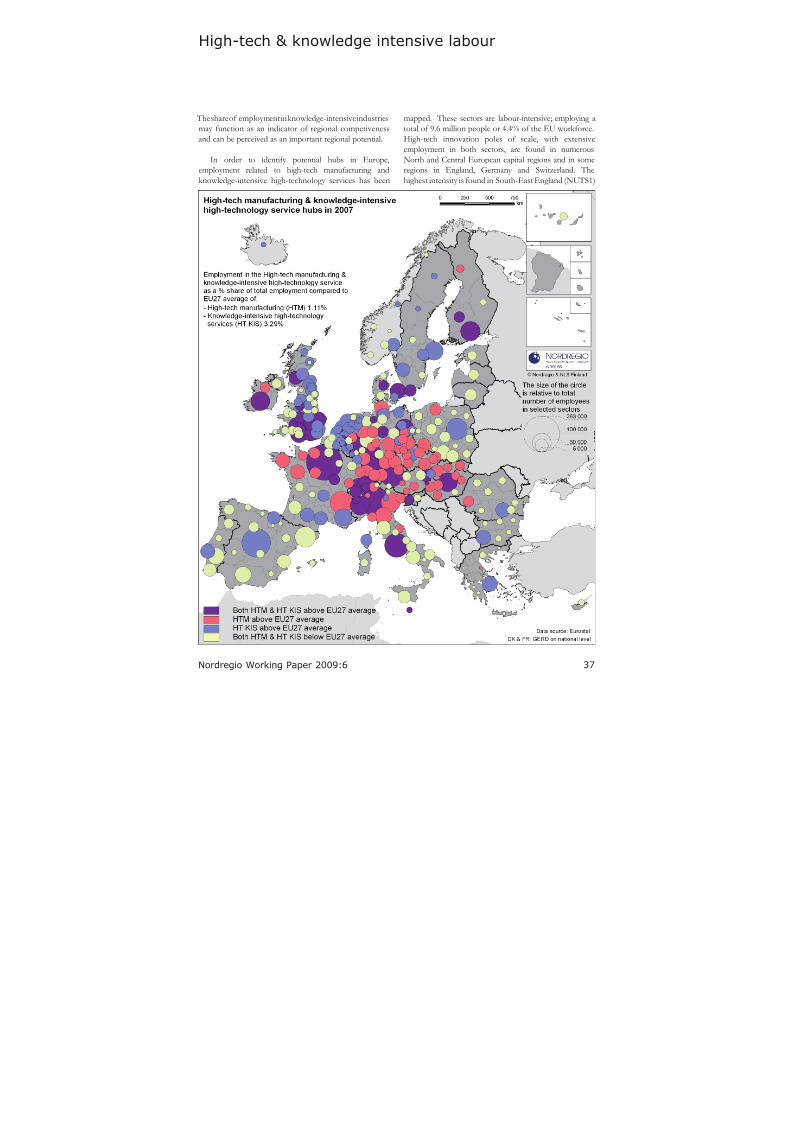
High-tech & knowledge intensive labour
The share of employment in knowledge-intensive industriesmay function as an indicator of regional competivenessand can be perceived as an important regional potential.
In order to identify potential hubs in Europe,employment related to high-tech manufacturing andknowledge-intensive high-technology services has been
mapped. These sectors are labour-intensive; employing atotal of 9.6 million people or 4.4% of the EU workforce.High-tech innovation poles of scale, with extensiveemployment in both sectors, are found in numerousNorth and Central European capital regions and in someregions in England, Germany and Switzerland. Thehighest intensity is found in South-East England (NUTS1)
8/8/2019 Territorial EU
http://slidepdf.com/reader/full/territorial-eu 38/50
38 Nordregio Working Paper 2009:6
Employment in KIS
0.0
5.0
10.0
15.0
20.0
25.0
30.0
0.0 5.0 10.0 15.0 20.0 25.0 30.0Market KIS
O t h e r K I S
Market KIS including NACE Rev 1.1. codes: 61, 62, 64-67, 70-74; Other KIS
codes: 80, 85, 92
SE
ES CY
EU27
LT
BG
RO
CH
LU
DK
NO
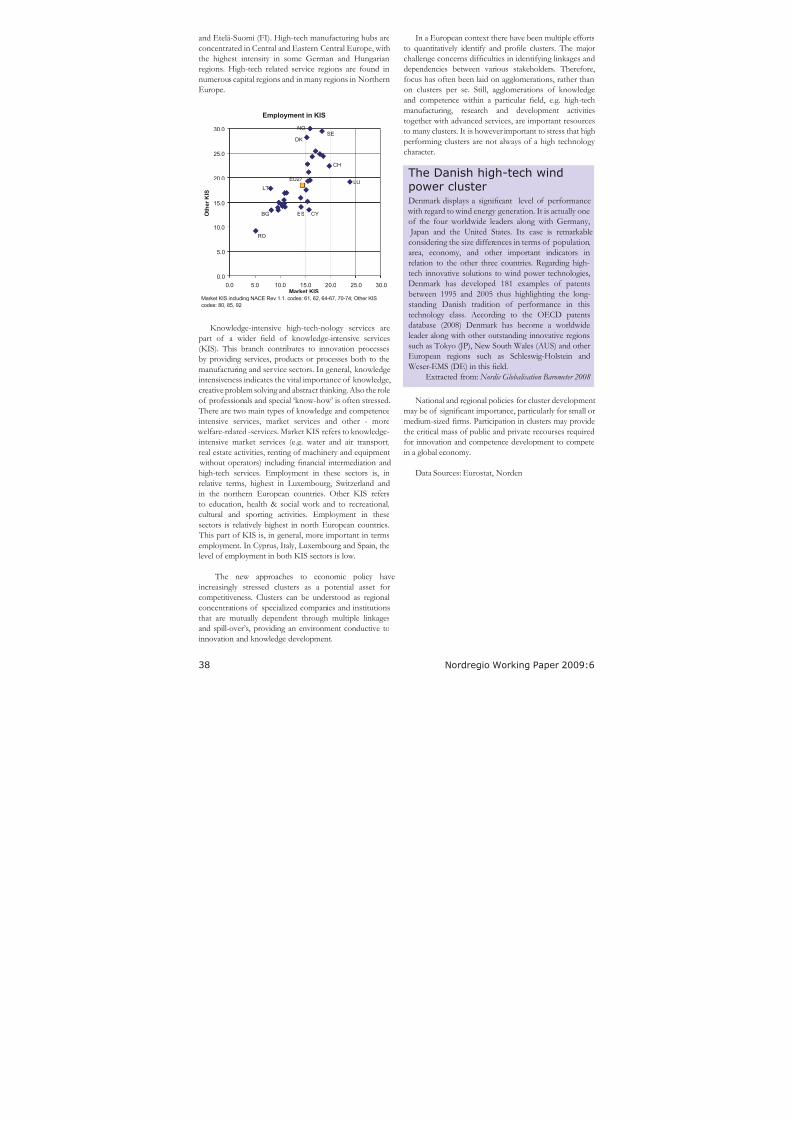
The Danish high-tech windpower clusterDenmark displays a signicant level of performance
with regard to wind energy generation. It is actually oneof the four worldwide leaders along with Germany,
Japan and the United States. Its case is remarkable
considering the size differences in terms of population,area, economy, and other important indicators inrelation to the other three countries. Regarding high-tech innovative solutions to wind power technologies,Denmark has developed 181 examples of patentsbetween 1995 and 2005 thus highlighting the long-standing Danish tradition of performance in thistechnology class. According to the OECD patentsdatabase (2008) Denmark has become a worldwideleader along with other outstanding innovative regionssuch as Tokyo (JP), New South Wales (AUS) and otherEuropean regions such as Schleswig-Holstein and
Weser-EMS (DE) in this eld.Extracted from: Nordic Globalisation Barometer 2008
and Etelä-Suomi (FI). High-tech manufacturing hubs areconcentrated in Central and Eastern Central Europe, withthe highest intensity in some German and Hungarianregions. High-tech related service regions are found innumerous capital regions and in many regions in NorthernEurope.
Knowledge-intensive high-tech-nology services arepart of a wider eld of knowledge-intensive services(KIS). This branch contributes to innovation processesby providing services, products or processes both to the
manufacturing and service sectors. In general, knowledgeintensiveness indicates the vital importance of knowledge,creative problem solving and abstract thinking. Also the roleof professionals and special ‘know-how’ is often stressed.
There are two main types of knowledge and competenceintensive services, market services and other - more
welfare-related -services. Market KIS refers to knowledge-intensive market services (e.g. water and air transport,real estate activities, renting of machinery and equipment without operators) including nancial intermediation andhigh-tech services. Employment in these sectors is, inrelative terms, highest in Luxembourg, Switzerland andin the northern European countries. Other KIS refersto education, health & social work and to recreational,cultural and sporting activities. Employment in thesesectors is relatively highest in north European countries.
This part of KIS is, in general, more important in termsemployment. In Cyprus, Italy, Luxembourg and Spain, thelevel of employment in both KIS sectors is low.
The new approaches to economic policy haveincreasingly stressed clusters as a potential asset forcompetitiveness. Clusters can be understood as regional
concentrations of specialized companies and institutionsthat are mutually dependent through multiple linkagesand spill-over’s, providing an environment conductive toinnovation and knowledge development.
In a European context there have been multiple effortsto quantitatively identify and prole clusters. The majorchallenge concerns difculties in identifying linkages anddependencies between various stakeholders. Therefore,focus has often been laid on agglomerations, rather thanon clusters per se. Still, agglomerations of knowledgeand competence within a particular eld, e.g. high-techmanufacturing, research and development activities
together with advanced services, are important resourcesto many clusters. It is however important to stress that highperforming clusters are not always of a high technology character.
National and regional policies for cluster developmentmay be of signicant importance, particularly for small ormedium-sized rms. Participation in clusters may providethe critical mass of public and private recourses requiredfor innovation and competence development to competein a global economy.
Data Sources: Eurostat, Norden
8/8/2019 Territorial EU
http://slidepdf.com/reader/full/territorial-eu 39/50
39
Nordregio Working Paper 2009:6
Innovation and entrepreneurship
In recent years increasing emphasis has been placed oninnovation as a driver of economic and regional growth.Innovation concerns the transformation of resources, e.g.R&D-expenditures and human capital, into commercialisedproducts (goods and services), processes and procedures.Innovation may be anything from an improved technical
product to a complex system of solutions, creating new markets or improved productivity. Examples of sectors where new systems solutions may have a strong futureimpact are health care and energy. Most innovations arecreated in cooperation between actors in the private andpublic sector. Focus has often been on R&D-based, high
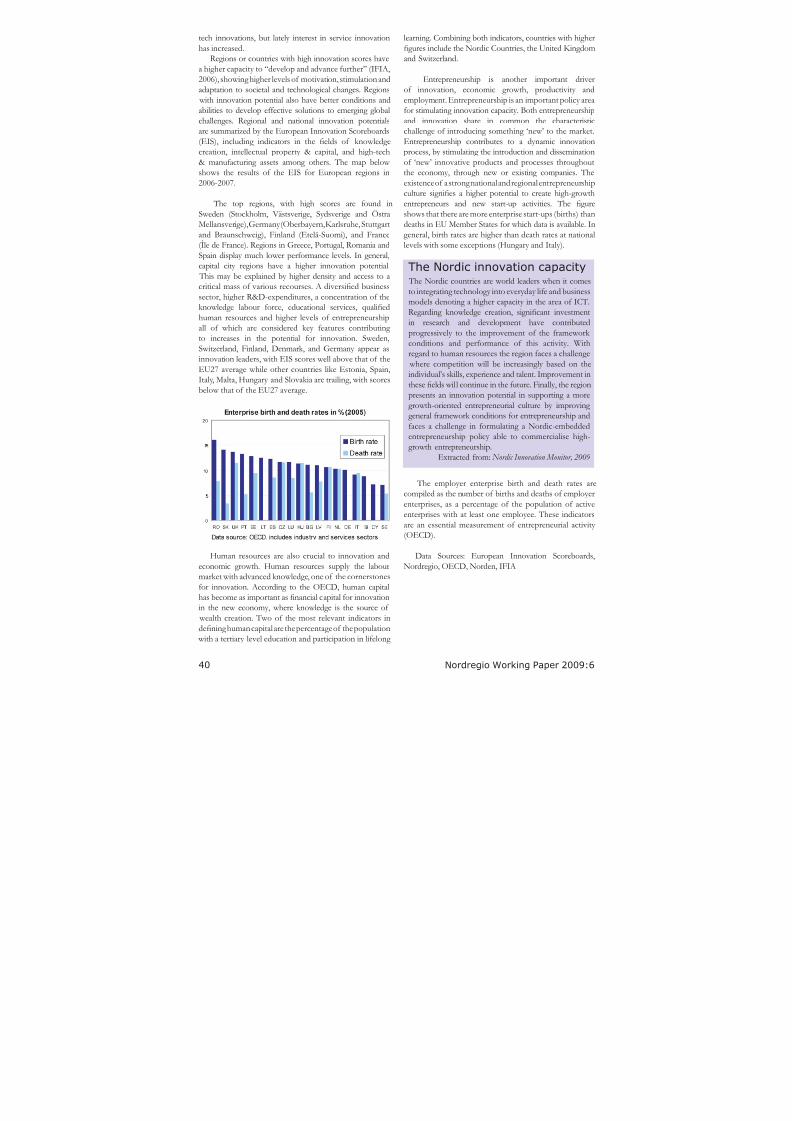
8/8/2019 Territorial EU
http://slidepdf.com/reader/full/territorial-eu 40/50
40 Nordregio Working Paper 2009:6
The Nordic innovation capacity The Nordic countries are world leaders when it comesto integrating technology into everyday life and businessmodels denoting a higher capacity in the area of ICT.Regarding knowledge creation, signicant investmentin research and development have contributedprogressively to the improvement of the framework conditions and performance of this activity. Withregard to human resources the region faces a challenge
where competition will be increasingly based on theindividual’s skills, experience and talent. Improvement inthese elds will continue in the future. Finally, the regionpresents an innovation potential in supporting a moregrowth-oriented entrepreneurial culture by improving general framework conditions for entrepreneurship andfaces a challenge in formulating a Nordic-embeddedentrepreneurship policy able to commercialise high-growth entrepreneurship.
Extracted from: Nordic Innovation Monitor, 2009
tech innovations, but lately interest in service innovationhas increased.
Regions or countries with high innovation scores havea higher capacity to “develop and advance further” (IFIA,2006), showing higher levels of motivation, stimulation andadaptation to societal and technological changes. Regions
with innovation potential also have better conditions andabilities to develop effective solutions to emerging global
challenges. Regional and national innovation potentialsare summarized by the European Innovation Scoreboards(EIS), including indicators in the elds of knowledgecreation, intellectual property & capital, and high-tech& manufacturing assets among others. The map below shows the results of the EIS for European regions in2006-2007.
The top regions, with high scores are found inSweden (Stockholm, Västsverige, Sydsverige and ÖstraMellansverige), Germany (Oberbayern, Karlsruhe, Stuttgartand Braunschweig), Finland (Etelä-Suomi), and France
(Île de France). Regions in Greece, Portugal, Romania andSpain display much lower performance levels. In general,capital city regions have a higher innovation potential.
This may be explained by higher density and access to acritical mass of various recourses. A diversied businesssector, higher R&D-expenditures, a concentration of theknowledge labour force, educational services, qualiedhuman resources and higher levels of entrepreneurshipall of which are considered key features contributing to increases in the potential for innovation. Sweden,Switzerland, Finland, Denmark, and Germany appear asinnovation leaders, with EIS scores well above that of the
EU27 average while other countries like Estonia, Spain,Italy, Malta, Hungary and Slovakia are trailing, with scoresbelow that of the EU27 average.
Human resources are also crucial to innovation andeconomic growth. Human resources supply the labourmarket with advanced knowledge, one of the cornerstonesfor innovation. According to the OECD, human capitalhas become as important as nancial capital for innovation
in the new economy, where knowledge is the source of wealth creation. Two of the most relevant indicators indening human capital are the percentage of the population
with a tertiary level education and participation in lifelong
learning. Combining both indicators, countries with highergures include the Nordic Countries, the United Kingdomand Switzerland.
Entrepreneurship is another important driverof innovation, economic growth, productivity andemployment. Entrepreneurship is an important policy areafor stimulating innovation capacity. Both entrepreneurship
and innovation share in common the characteristicchallenge of introducing something ‘new’ to the market.Entrepreneurship contributes to a dynamic innovationprocess, by stimulating the introduction and disseminationof ‘new’ innovative products and processes throughoutthe economy, through new or existing companies. Theexistence of a strong national and regional entrepreneurshipculture signies a higher potential to create high-growthentrepreneurs and new start-up activities. The gureshows that there are more enterprise start-ups (births) thandeaths in EU Member States for which data is available. Ingeneral, birth rates are higher than death rates at national
levels with some exceptions (Hungary and Italy).
The employer enterprise birth and death rates arecompiled as the number of births and deaths of employerenterprises, as a percentage of the population of activeenterprises with at least one employee. These indicatorsare an essential measurement of entrepreneurial activity (OECD).
Data Sources: European Innovation Scoreboards,Nordregio, OECD, Norden, IFIA
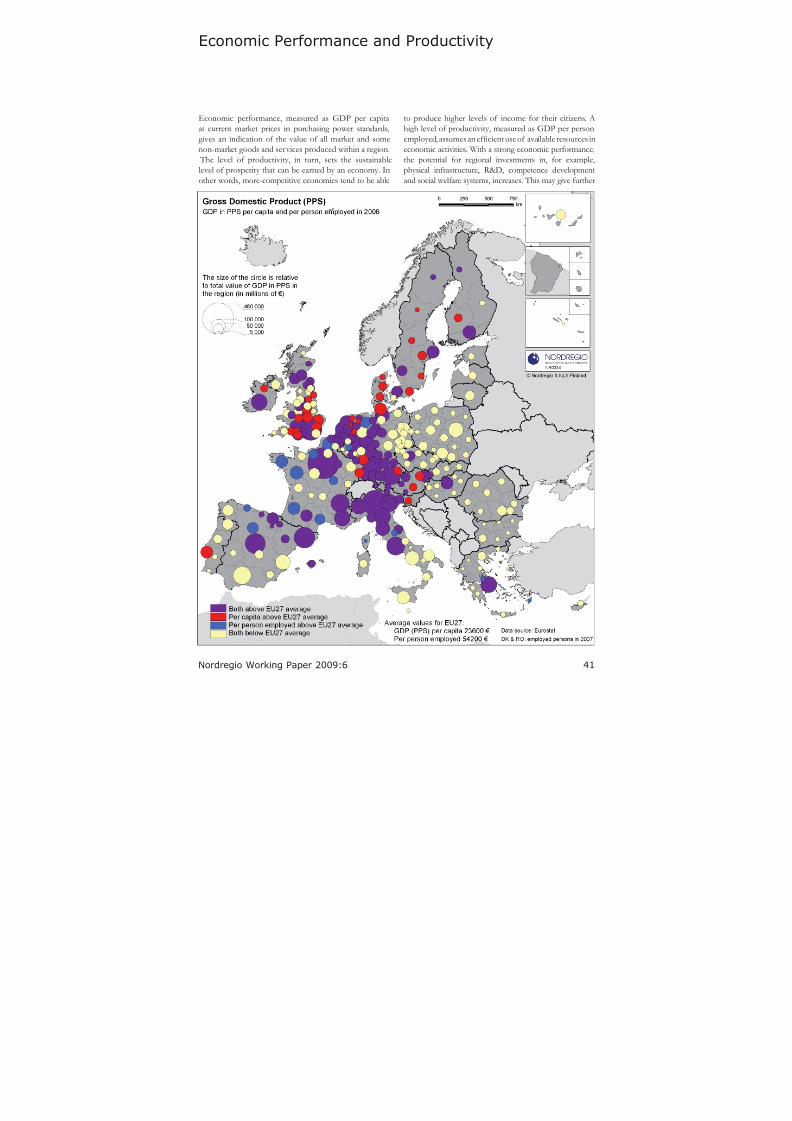
8/8/2019 Territorial EU
http://slidepdf.com/reader/full/territorial-eu 41/50
41
Nordregio Working Paper 2009:6
Economic Performance and Productivity
Economic performance, measured as GDP per capitaat current market prices in purchasing power standards,gives an indication of the value of all market and somenon-market goods and services produced within a region.
The level of productivity, in turn, sets the sustainablelevel of prosperity that can be earned by an economy. Inother words, more-competitive economies tend to be able
to produce higher levels of income for their citizens. Ahigh level of productivity, measured as GDP per personemployed, assumes an efcient use of available resources ineconomic activities. With a strong economic performance,the potential for regional investments in, for example,physical infrastructure, R&D, competence developmentand social welfare systems, increases. This may give further
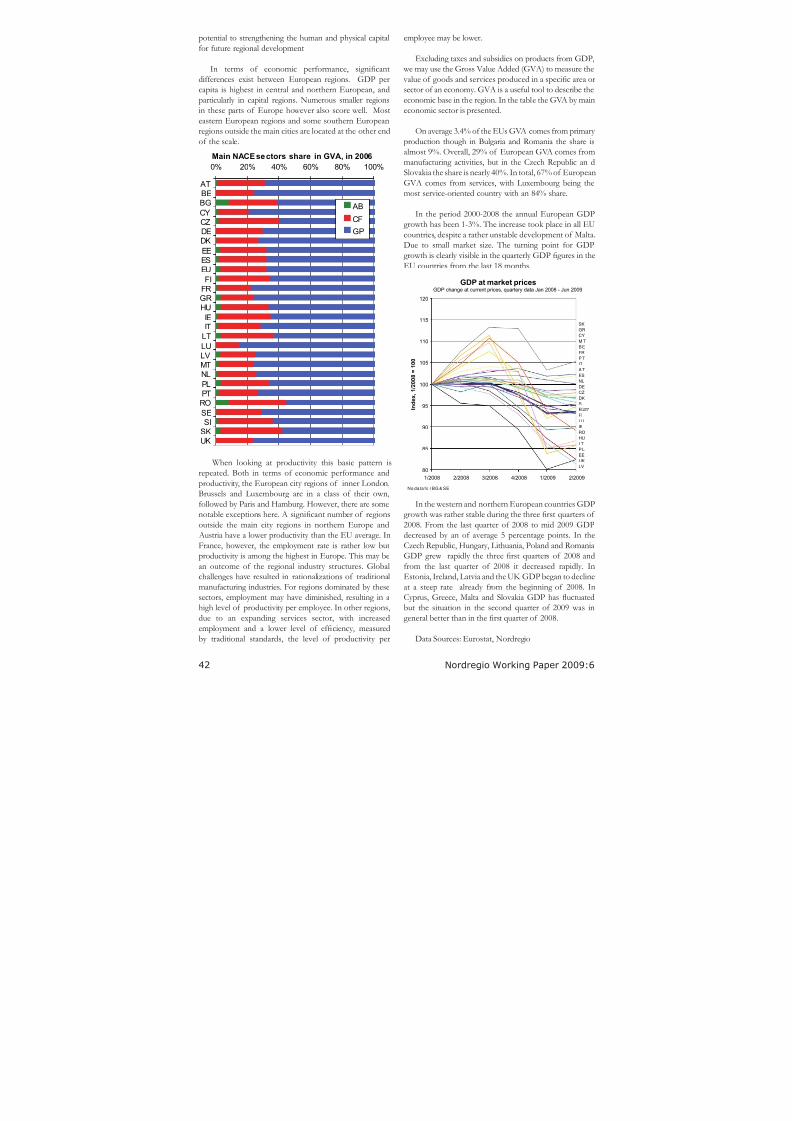
8/8/2019 Territorial EU
http://slidepdf.com/reader/full/territorial-eu 42/50
42 Nordregio Working Paper 2009:6
potential to strengthening the human and physical capitalfor future regional development
In terms of economic performance, signicantdifferences exist between European regions. GDP percapita is highest in central and northern European, andparticularly in capital regions. Numerous smaller regionsin these parts of Europe however also score well. Most
eastern European regions and some southern Europeanregions outside the main cities are located at the other endof the scale.
When looking at productivity this basic pattern isrepeated. Both in terms of economic performance andproductivity, the European city regions of inner London,Brussels and Luxembourg are in a class of their own,followed by Paris and Hamburg. However, there are somenotable exceptions here. A signicant number of regionsoutside the main city regions in northern Europe and
Austria have a lower productivity than the EU average. InFrance, however, the employment rate is rather low butproductivity is among the highest in Europe. This may bean outcome of the regional industry structures. Globalchallenges have resulted in rationalizations of traditionalmanufacturing industries. For regions dominated by thesesectors, employment may have diminished, resulting in a
high level of productivity per employee. In other regions,due to an expanding services sector, with increasedemployment and a lower level of efciency, measuredby traditional standards, the level of productivity per
employee may be lower.
Excluding taxes and subsidies on products from GDP, we may use the Gross Value Added (GVA) to measure the value of goods and services produced in a specic area orsector of an economy. GVA is a useful tool to describe theeconomic base in the region. In the table the GVA by maineconomic sector is presented.
On average 3.4% of the EUs GVA comes from primary production though in Bulgaria and Romania the share isalmost 9%. Overall, 29% of European GVA comes frommanufacturing activities, but in the Czech Republic an dSlovakia the share is nearly 40%. In total, 67% of EuropeanGVA comes from services, with Luxembourg being themost service-oriented country with an 84% share.
In the period 2000-2008 the annual European GDPgrowth has been 1-3%. The increase took place in all EUcountries, despite a rather unstable development of Malta.
Due to small market size. The turning point for GDPgrowth is clearly visible in the quarterly GDP gures in theEU countries from the last 18 months.
In the western and northern European countries GDPgrowth was rather stable during the three rst quarters of 2008. From the last quarter of 2008 to mid 2009 GDPdecreased by an of average 5 percentage points. In theCzech Republic, Hungary, Lithuania, Poland and RomaniaGDP grew rapidly the three rst quarters of 2008 andfrom the last quarter of 2008 it decreased rapidly. InEstonia, Ireland, Latvia and the UK GDP began to declineat a steep rate already from the beginning of 2008. InCyprus, Greece, Malta and Slovakia GDP has uctuated
but the situation in the second quarter of 2009 was ingeneral better than in the rst quarter of 2008.
Data Sources: Eurostat, Nordregio
0% 20% 40% 60% 80% 100%
ATBEBG
CYCZDE
DKEEESEU
FIFRGRHU
IEIT
LT
LULV
MTNL
PLPTRO
SESI
SKUK
AB
CF
GP
Main NACE sectors share in GVA, in 2006
GDP at market prices
80
85
90
95
100
105
110
115
120
1/2008 2/2008 3/2008 4/2008 1/2009 2/2009
I n d e x ,
1 / 2 0 0 8 = 1
0 0
GDP change at current prices, quartery data Jan 2008 - Jun 2009
SK
GR
CY
M T
B E
FR
P T
IT
A T
ES
NL
DE
CZ
DK
SI
EU27
FI
LU
IE
RO
HU
LT
P L
EE
UK
LV
No data fo r BG & SE
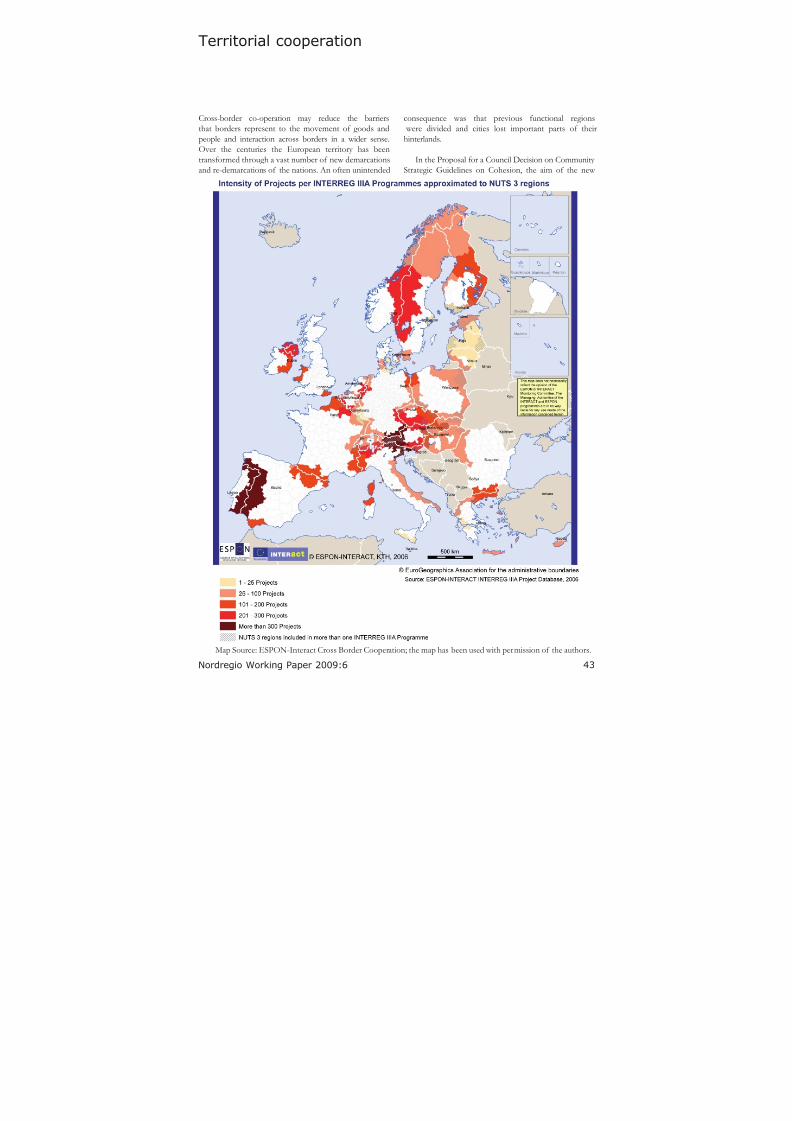
8/8/2019 Territorial EU
http://slidepdf.com/reader/full/territorial-eu 43/50
43
Nordregio Working Paper 2009:6
Territorial cooperation
Cross-border co-operation may reduce the barriersthat borders represent to the movement of goods andpeople and interaction across borders in a wider sense.Over the centuries the European territory has beentransformed through a vast number of new demarcationsand re-demarcations of the nations. An often unintended
Map Source: ESPON-Interact Cross Border Cooperation; the map has been used with permission of the authors.
consequence was that previous functional regions were divided and cities lost important parts of theirhinterlands.
In the Proposal for a Council Decision on Community Strategic Guidelines on Cohesion, the aim of the new
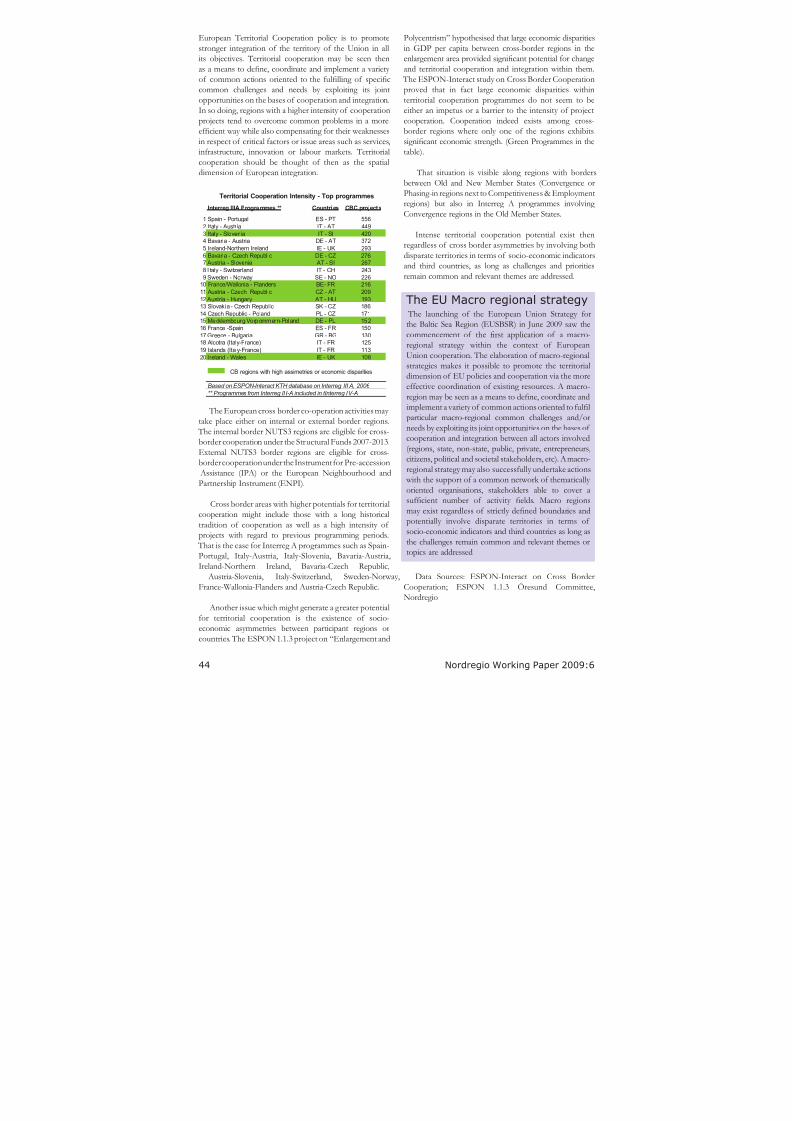
8/8/2019 Territorial EU
http://slidepdf.com/reader/full/territorial-eu 44/50
44 Nordregio Working Paper 2009:6
Interreg IIIA Programmes ** Countries CBC projects
1 Spain - Portugal ES - PT 556
2 Italy - Austria IT - AT 449
3 Italy - Slovenia IT - SI 420
4 Bavaria - Austria DE - AT 372
5 Ireland-Northern Ireland IE - UK 293
6 Bavaria - Czech Republic DE - CZ 276
7 Austria - Slovenia AT - SI 267
8 I taly - Switzerland IT - CH 243
9 Sweden - Norway SE - NO 22610 France/Wallonia - Flanders BE- FR 216
11 Austria - Czech Republic CZ - AT 209
12 Austria - Hungary AT - HU 193
13 Slovakia - Czech Republ ic SK - CZ 186
14 Czech Republic - Poland PL - CZ 171
15 Mecklembourg Vorpommern-Poland DE - PL 152
16 France -Spain ES - FR 150
17 Greece - Bulgaria GR - BG 130
18 Alcotra (Italy-France) IT - FR 125
19 Islands (Italy-France) IT - FR 113
20 Ireland - Wales IE - UK 108
CB regions with high assimetries or economic disparities
Based on ESPON-Interact KTH database on Interreg III A, 2006
Territorial Cooperation Intensity - Top programmes
** Programmes from Interreg II I-A included in tInterreg IV-A
The EU Macro regional strategy The launching of the European Union Strategy forthe Baltic Sea Region (EUSBSR) in June 2009 saw thecommencement of the rst application of a macro-regional strategy within the context of EuropeanUnion cooperation. The elaboration of macro-regional
strategies makes it possible to promote the territorialdimension of EU policies and cooperation via the moreeffective coordination of existing resources. A macro-region may be seen as a means to dene, coordinate andimplement a variety of common actions oriented to fullparticular macro-regional common challenges and/orneeds by exploiting its joint opportunities on the bases of cooperation and integration between all actors involved(regions, state, non-state, public, private, entrepreneurs,citizens, political and societal stakeholders, etc). A macro-regional strategy may also successfully undertake actions
with the support of a common network of thematically
oriented organisations, stakeholders able to cover asufcient number of activity elds. Macro regionsmay exist regardless of strictly dened boundaries andpotentially involve disparate territories in terms of socio-economic indicators and third countries as long asthe challenges remain common and relevant themes ortopics are addressed
European Territorial Cooperation policy is to promotestronger integration of the territory of the Union in allits objectives. Territorial cooperation may be seen thenas a means to dene, coordinate and implement a variety of common actions oriented to the fullling of speciccommon challenges and needs by exploiting its jointopportunities on the bases of cooperation and integration.In so doing, regions with a higher intensity of cooperation
projects tend to overcome common problems in a moreefcient way while also compensating for their weaknessesin respect of critical factors or issue areas such as services,infrastructure, innovation or labour markets. Territorialcooperation should be thought of then as the spatialdimension of European integration.
The European cross border co-operation activities may take place either on internal or external border regions.
The internal border NUTS3 regions are eligible for cross-border cooperation under the Structural Funds 2007-2013.External NUTS3 border regions are eligible for cross-border cooperation under the Instrument for Pre-accession
Assistance (IPA) or the European Neighbourhood andPartnership Instrument (ENPI).
Cross border areas with higher potentials for territorialcooperation might include those with a long historicaltradition of cooperation as well as a high intensity of projects with regard to previous programming periods.
That is the case for Interreg A programmes such as Spain-Portugal, Italy-Austria, Italy-Slovenia, Bavaria-Austria,Ireland-Northern Ireland, Bavaria-Czech Republic, Austria-Slovenia, Italy-Switzerland, Sweden-Norway,France-Wallonia-Flanders and Austria-Czech Republic.
Another issue which might generate a greater potentialfor territorial cooperation is the existence of socio-economic asymmetries between participant regions orcountries. The ESPON 1.1.3 project on “Enlargement and
Polycentrism” hypothesised that large economic disparitiesin GDP per capita between cross-border regions in theenlargement area provided signicant potential for changeand territorial cooperation and integration within them.
The ESPON-Interact study on Cross Border Cooperationproved that in fact large economic disparities withinterritorial cooperation programmes do not seem to beeither an impetus or a barrier to the intensity of project
cooperation. Cooperation indeed exists among cross-border regions where only one of the regions exhibitssignicant economic strength. (Green Programmes in thetable).
That situation is visible along regions with bordersbetween Old and New Member States (Convergence orPhasing-in regions next to Competitiveness & Employmentregions) but also in Interreg A programmes involving Convergence regions in the Old Member States.
Intense territorial cooperation potential exist then
regardless of cross border asymmetries by involving bothdisparate territories in terms of socio-economic indicatorsand third countries, as long as challenges and prioritiesremain common and relevant themes are addressed.
Data Sources: ESPON-Interact on Cross BorderCooperation; ESPON 1.1.3 Öresund Committee,Nordregio
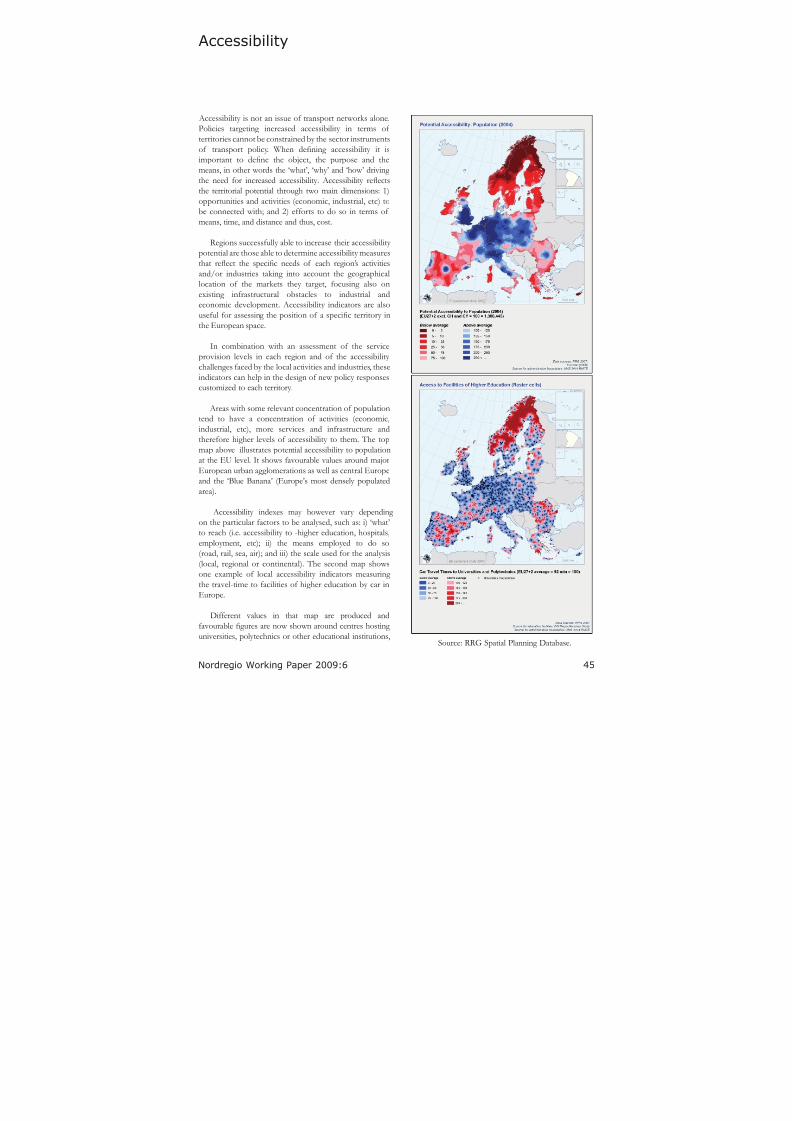
8/8/2019 Territorial EU
http://slidepdf.com/reader/full/territorial-eu 45/50
45
Nordregio Working Paper 2009:6
Accessibility
Accessibility is not an issue of transport networks alone.Policies targeting increased accessibility in terms of territories cannot be constrained by the sector instrumentsof transport policy. When dening accessibility it isimportant to dene the object, the purpose and themeans, in other words the ‘what’, ‘why’ and ‘how’ driving the need for increased accessibility. Accessibility reectsthe territorial potential through two main dimensions: 1)opportunities and activities (economic, industrial, etc) tobe connected with; and 2) efforts to do so in terms of means, time, and distance and thus, cost.
Regions successfully able to increase their accessibility potential are those able to determine accessibility measuresthat reect the specic needs of each region’s activitiesand/or industries taking into account the geographicallocation of the markets they target, focusing also onexisting infrastructural obstacles to industrial andeconomic development. Accessibility indicators are alsouseful for assessing the position of a specic territory inthe European space.
In combination with an assessment of the serviceprovision levels in each region and of the accessibility
challenges faced by the local activities and industries, theseindicators can help in the design of new policy responsescustomized to each territory.
Areas with some relevant concentration of populationtend to have a concentration of activities (economic,industrial, etc), more services and infrastructure andtherefore higher levels of accessibility to them. The topmap above illustrates potential accessibility to populationat the EU level. It shows favourable values around majorEuropean urban agglomerations as well as central Europeand the ‘Blue Banana’ (Europe’s most densely populated
area).
Accessibility indexes may however vary depending on the particular factors to be analysed, such as: i) ‘what’to reach (i.e. accessibility to -higher education, hospitals,employment, etc); ii) the means employed to do so(road, rail, sea, air); and iii) the scale used for the analysis(local, regional or continental). The second map showsone example of local accessibility indicators measuring the travel-time to facilities of higher education by car inEurope.
Different values in that map are produced andfavourable gures are now shown around centres hosting universities, polytechnics or other educational institutions,
Source: RRG Spatial Planning Database.
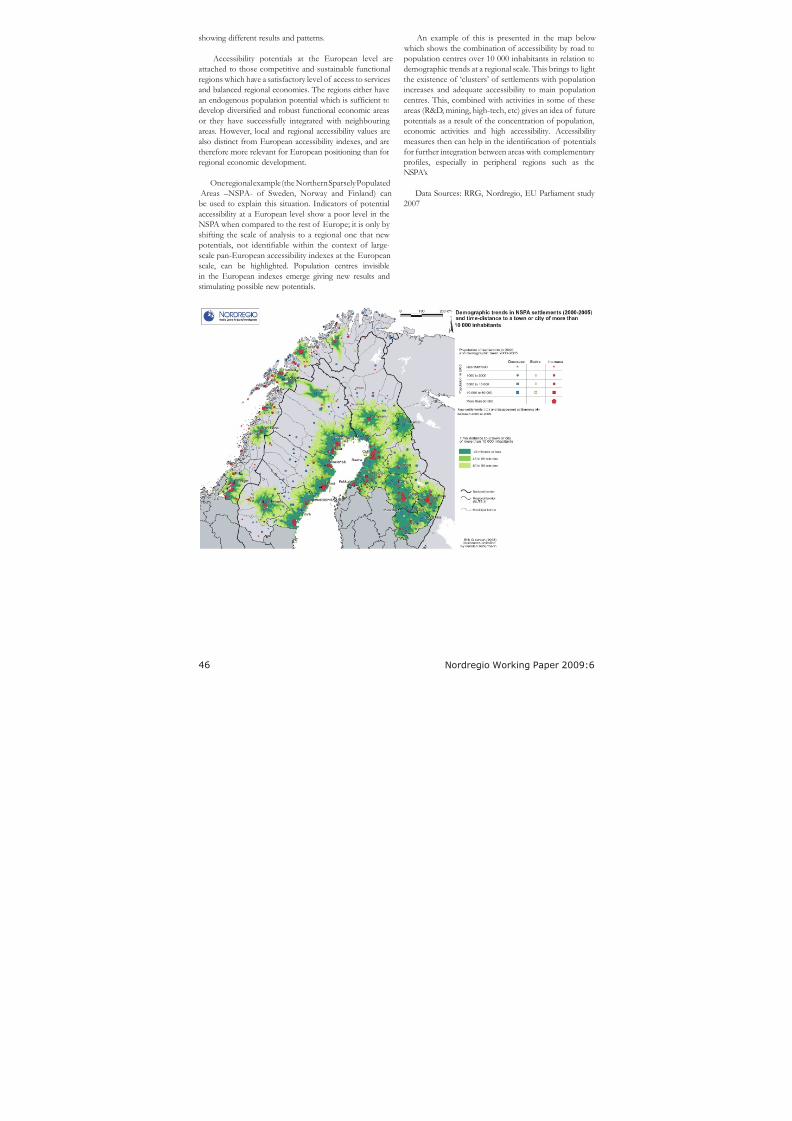
8/8/2019 Territorial EU
http://slidepdf.com/reader/full/territorial-eu 46/50
46 Nordregio Working Paper 2009:6
showing different results and patterns.
Accessibility potentials at the European level areattached to those competitive and sustainable functionalregions which have a satisfactory level of access to servicesand balanced regional economies. The regions either havean endogenous population potential which is sufcient todevelop diversied and robust functional economic areas
or they have successfully integrated with neighbouring areas. However, local and regional accessibility values arealso distinct from European accessibility indexes, and aretherefore more relevant for European positioning than forregional economic development.
One regional example (the Northern Sparsely Populated Areas –NSPA- of Sweden, Norway and Finland) canbe used to explain this situation. Indicators of potentialaccessibility at a European level show a poor level in theNSPA when compared to the rest of Europe; it is only by shifting the scale of analysis to a regional one that new
potentials, not identiable within the context of large-scale pan-European accessibility indexes at the Europeanscale, can be highlighted. Population centres invisiblein the European indexes emerge giving new results andstimulating possible new potentials.
An example of this is presented in the map below which shows the combination of accessibility by road topopulation centres over 10 000 inhabitants in relation todemographic trends at a regional scale. This brings to lightthe existence of ‘clusters’ of settlements with populationincreases and adequate accessibility to main populationcentres. This, combined with activities in some of theseareas (R&D, mining, high-tech, etc) gives an idea of future
potentials as a result of the concentration of population,economic activities and high accessibility. Accessibility measures then can help in the identication of potentialsfor further integration between areas with complementary proles, especially in peripheral regions such as theNSPA’s.
Data Sources: RRG, Nordregio, EU Parliament study 2007

8/8/2019 Territorial EU
http://slidepdf.com/reader/full/territorial-eu 47/50
47
Nordregio Working Paper 2009:6
Abbreviations
ARWU Academic Ranking of World UniversitiesEIS European Innovation ScoreboardsENPI European Neighbourhood and Partnership InstrumentESDP European Spatial Development PerspectiveESPON European Spatial Planning Observatory Network EUSBSR European Union Strategy for the Baltic Sea RegionGERD Gross Domestic Expenditure on R&DGDP Gross Domestic ProductGHG Greenhouse GasesGVA Gross Value AddedHTM High-Tech Manufacturing IPA Pre-accession Assistance
KIS Knowledge-Intensive ServicesLAU Local Administrative UnitsNACE Nomenclature Generale des Activites Economiques dans I`Union Europeenne / General
Name for Economic Activities in the EUNSPA Northern Sparsely Populated AreasNUTS Nomenclature of Territorial Units for StatisticsPPS GDP per capita in Purchasing Power StandardsR&D Research & DevelopmentSMESTO Small and Medium Sized Towns

8/8/2019 Territorial EU
http://slidepdf.com/reader/full/territorial-eu 48/50
48 Nordregio Working Paper 2009:6
8/8/2019 Territorial EU
http://slidepdf.com/reader/full/territorial-eu 49/50
49
Nordregio Working Paper 2009:6
References
Main statistical sources:- Europe: Eurostat - http://epp.eurostat.ec.europa.eu/- National Statistical Institutes (NSIs), Mostly Statistics
Norway (www.ssb.no) and – Iceland (www.hagstofa.is)
Publications and websites:
Archer, C.L., M.Z. Jacobson (2005). Evaluation of global wind power, in Journal of Geophysical Research, 110,D12110, DOI:10.1029/2004JD005462 Departmentof Civil and Environmental Engineering, Stanford
University, June 2005
EC-COM (2006). Proposal for a Council Decision onCommunity Strategic Guidelines on Cohesion, COM2006 386 Final
European Commission (2007). Growing Regions, Growing Europe: 4th Report on Economic and Social Cohesion,ISBN 92-79-05704-5, © Ofce for Ofcial Publicationsof the European Communities, Luxembourg,http://ec.europa.eu/regional_policy/sources/docofc/ofcial/reports/cohesion4/pdf/4cr_en.pdf
European Commission (2008). Green Paper on TerritorialCohesion: Turning territorial diversity into strength,SEC (2008) 2550, Brussels,http://ec.europa.eu/regional_policy/consultation/terco/paper_terco_en.pdf and annexes http://ec.europa.eu/regional_policy/consultation/terco/paper_terco_annex.pdf
EC-DG-Enterprise and Industry (2007). The EuropeanInnovation Scoreboard 2006 - A comparative analysis of innovation performance, by the Maastricht EconomicResearch Institute on Innovation and Technology (MERIT) and the EC Joint Research Centre (Institutefor the Protection and Security of the Citizen)
EC-DG-Enterprise & Industry (2008). The Raw MaterialsInitiative - Meeting Our Critical Needs for Growth and
Jobs in Europe, SEC (2008) 2741, Brussels http://ec.europa.eu/enterprise/newsroom/cf/document.cfm?action=display&doc_id=894&userservice_id=1
EC-DG-Enterprise and Industry (2008). The European
Innovation Scoreboard 2007 - A comparative analysisof innovation performance, ISBN 978-92-79-07319-9,Ofce for Ofcial Publications of the EuropeanCommunities, Luxembourg
EC-DG-Enterprise and Industry (2009). The EuropeanInnovation Scoreboard 2008 - A comparative analysisof innovation performance, ISBN 978-92-79-09675-4,Ofce for Ofcial Publications of the EuropeanCommunities, Luxembourg
EC-DG Environment (1992). Council Directive92/43/EEC of 21 May 1992 on the conservationof natural habitats and of wild fauna and ora.http://eur-lex.europa.eu/LexUriServ/LexUriServ.do?uri=CELEX:31992L0043:EN:NOT
EC-DG-REGIO (2008). Evaluation on the potential forregional policy programmes, 2007-2013, to contributeto the Lisbon and Gothenburg objectives for growth,jobs and sustainable development, by Nordregio, 2008
ESPON 1.1.3 (2005). Enlargement of the EU and itspolycentric spatial structure. Final report by KTH,2005; ISBN 2-9599669-3-7, Luxembourg
ESPON-Interact (2006). Thematic study on cross bordercooperation; Final report by KTH, 2006; ISBN-10 3-902558-06-7 ISBN-13 978-3-902558-06-0,
Luxembourg
EU (2007). Territorial Agenda of the European Union, Towards a More Competitive and Sustainable Europeof Diverse Regions. Leipzig, 2007
EU-Ofce Journal of the European Union (2006).Guidelines on national regional aid for 2007-2013 (2006/C 54/08), http://eur-lex.europa.eu/LexUriServ/LexUriServ.do?uri=OJ:C:2006:054:0013:0044:EN:PDF
EU Parliament Study - EC-DG-Internal Policies for theUnion (2007). Regional disparities and Cohesion: whatstrategies for the future, by Nordregio et al. IP/B/REGI/IC/2006-201, European Parliament, Brussels
EWEA (2009). Wind Energy: the facts; Copyright ©European Wind Energy Association 2009
Fujita, M., Klugmann, P. and Venables, A.J (2001). TheSpatial Economy. Cities, regions and international trade,
The MIT Press
Gáková, Zuzana and Lewis Dijkstra (2008). Labourmobility between the regions of the EU-27 and acomparison with the USA. Regional Focus 2/2008. DG
8/8/2019 Territorial EU
http://slidepdf.com/reader/full/territorial-eu 50/50
Regio. http://ec.europa.eu/regional_policy/sources/docgener/focus/2008_02_labour.pdf
Gloersen, E. (2009). The NSPA are looking ahead, in Journal of Nordregio, 2009/3
Haataja, Marjo Johanna (2005). Development of Competitiveness of Knowledge-Intensive Services.
http://www.tut.fi/units/tuta/tita/tip/Haataja_ ISPIM2005.pdf
Iglebaeck, O. (2009). Forging ahead into a new mining area, in Journal of Nordregio 2009/3
IPCC (2007) Climate Change 2007. Synthesis reportContribution of Working Groups I, II and III to theFourth Assessment Report of the IntergovernmentalPanel on Climate Change, Cambridge University Press,Cambridge, UK
Ketels, C. (2004). European Clusters; In Structural Changein Europe 3 – Innovative City and Business Regions,Hagbarth Publications,http://www.isc.hbs.edu/pdf/Ketels_European_ Clusters_2004.pdf
Neubauer, J. (2008). Innovations and region´s prosperity,in Journal of Nordregio, 2008/1
Nordregio (2006). The role of urban areas in regional
development – European and Nordic perspectives,Proceedings of the Nordic Working Group on Cities
and Regions, Nordregio Working Paper 2006:04, ISSN1403-2511, Stockholm
Nordregio (2007). Neubauer J. et al: Regional Developmentin the Nordic Countries 2007, Nordregio Report 2007:1,ISBN 978-91-89332-614, Stockholm
Nordregio (2008). Hedin, S. et al: Regionally differentiatedinnovation policy in the Nordic Countries-Applying the Lisbon strategy, Nordregio Working Paper 2008:02,ISSN 1403-2503, Stockholm
Nordregio (2008). Galera, P. & Raasmussen R.: Bioenergy and Regional Development in the Nordic Countries,Nordregio Working Paper 2008:05; ISSN 1403-2511,Stockholm
Nordregio (2009). Dubois A, Hedin, S, Schmitt P, Sterling J: EU macro regions and macro-regional strategies – A scoping study; Nordregio Working Paper 2009:04,ISSN 1403-2511, Stockholm
Norden (2008). Global pressure – Nordic Solutions? The Nordic Globalization Barometer 2008, by Ketels,K., ISBN 978-92-893-1679-8; © Nordic Council of Ministers, Copenhagen
Norden (2009). Nordic Innovation Monitor 2009,compiled by FOR A, ISBN 978-92-893-18342, NordicCouncil of Ministers, Copenhagen
OECD (2000). Mobilising human resources for innovation,OECD Publications, France
OECD (2001). OECD Territorial Outlook 2001, TerritorialEconomy, ISBN 92-64-18602-6
OECD (2008). Measuring entrepreneurship: A digestof Indicators OECD – Eurostat EntrepreneurshipIndicators Programme
Pietilä, R. (2009). Prices and geology will determine further
development in Fennoscandia; In Journal of Nordregio3/2009
Storper, Michael (1997). The Territorial Developmentin a Global Economy. The Regional World, ISBN:1572303158, Guilford Publications
Territorial State. 2007. The Territorial State and Perspectivesof the European Union: Towards a Stronger European
Territorial Cohesion in the Light of the Lisbon andGothenburg Ambitions – A Background Documentto the Territorial Agenda of the21 European Union.
http://www.bmvbs.de/Anlage/original_1005296/ The-Territorial-State-and-Perspectives-of-the-European-Union.pdf.
United Nations (2007). World Population Prospects: The2007 Revision and World Urbanization Prospects,Population Division of the Department of Economicand Social Affairs of the United Nations Secretariat,Database accessed November 2009, available on-line athttp://esa.un.org/unup
Vedres A. (2006). Inventions and globalization: Innovationpotential by countries; IFIA International Federationof Inventor’s Association