test plan template - rochester institute of technologyedge.rit.edu/edge/p10511/public/final test...
TRANSCRIPT
Document Revision No.: 1 Revised: 05/21/10 RIT KGCOE MSD Program
RIT KGCOE MSD Program Page 1 Revision:
P10511 Miniaturization of Xerography
Test Plans & Test Results
By: Derek Meinke, Matthew Liff, Tony Zhang, Zaw Htoo
Table of Contents
1. MSD I: WKS 8-10 PRELIMINARY TEST PLAN .......................................... 2
1.1. Introduction; Overview; Summary; Purpose; History, etc.......................................................... 2
1.2. Project Description; Sub-Systems/ Critical Components Being Tested ..................................... 2
1.3. Approval; Guide, Sponsor ............................................................................................................... 3
1.4. Test Strategy ...................................................................................................................................... 4
1.5. Definitions; Important Terminology; Key Words ........................................................................ 8
1.6. References .......................................................................................................................................... 9
2. MSD II WKS 2-3: FINAL TEST PLAN ......................................................... 10
2.1. Data Collection Plan; Sampling Plan............................................................................................ 10
2.2. Measurement Capability, Equipment........................................................................................... 10
2.3. Test Conditions, Setup Instructions .............................................................................................. 11
Document Revision No.: 1 Revised: 05/21/10 RIT KGCOE MSD Program
RIT KGCOE MSD Program Page 2 Revision:
P10511 Miniaturization of Xerography Test Plans & Test Results
1. MSD I: WKS 8-10 PRELIMINARY TEST PLAN
1.1. Introduction; Overview; Summary; Purpose; History, etc.
1.1.1. Over the past decade the cost of xerographic digital printer hardware has continued to drop while at the same time print quality, print speed, and reliability has continuously improved. Much of this cost reduction is related to what we will call "The Miniaturization of Xerography". One "figure of merit" gauge of this miniaturization is the size of the photoreceptor required to produce a given print rate, (Pr /PPM). It turns out that when tracked over an extended timeframe, the diameter of photoreceptor drum required to produce a particular print rate has fallen by about a factor of two per decade over the last three decades. The current state requires about a 24mm diameter photoreceptor drum for <40 prints per minute, (ppm), a 40mm diameter photoreceptor drum for > 40ppm, and about an 80mm diameter drum for >80ppm. This miniaturization has been vital to offering low cost digital color printing where the number of printer components is multiplied by the number of colors.
This miniaturization is the result of several innovations and advances in sub-system processes, new materials, and process controls. For example: the wear rate of new photoreceptor materials has dramatically improved, thus allowing smaller photoreceptors to be used, with small photoreceptors other sub-systems followed suit. For example the development sub-systems now use low cost high tolerance rolls and semi-conductive or conductive developers that significantly reduced the waterfront for development subsystems, and finally laser exposure requires much less space than early bulky optical systems.
The photoreceptor charging system has also undergone significant changes over this time frame. The major improvement has been the displacement of bulky high voltage corona emitting devices for compact bias charge rolls (BCR's), particularly for low end office and personal printers. While there are tradeoffs in reliability, cost, size, and footprint for corona vs. BCR devices that ultimately determine selection for any particular printer architecture there continues to be a need for reduced footprint for charging devices, particularly for high speed applications.
1.2. Project Description; Sub-Systems/ Critical Components Being Tested
1.2.1. Project Description: This initial project seeks to design a xerographic charging test fixture that can be used to evaluate these tradeoffs for new emerging and experimental high speed BCR's and compact solid state corona charging devices. The fixture will be fully automated with digital data collection and be used to explore selected experimental charging device configurations and technologies. It will be capable of measuring charging rates on simulated dielectric drums, under numerous critical parameter conditions such as photoreceptor speeds and other spacing and applied voltage set up settings. It will use the waterfront required to charge a photoreceptor to a uniform surface potential per process speed (mm/sec) as its miniaturization figure of merit.
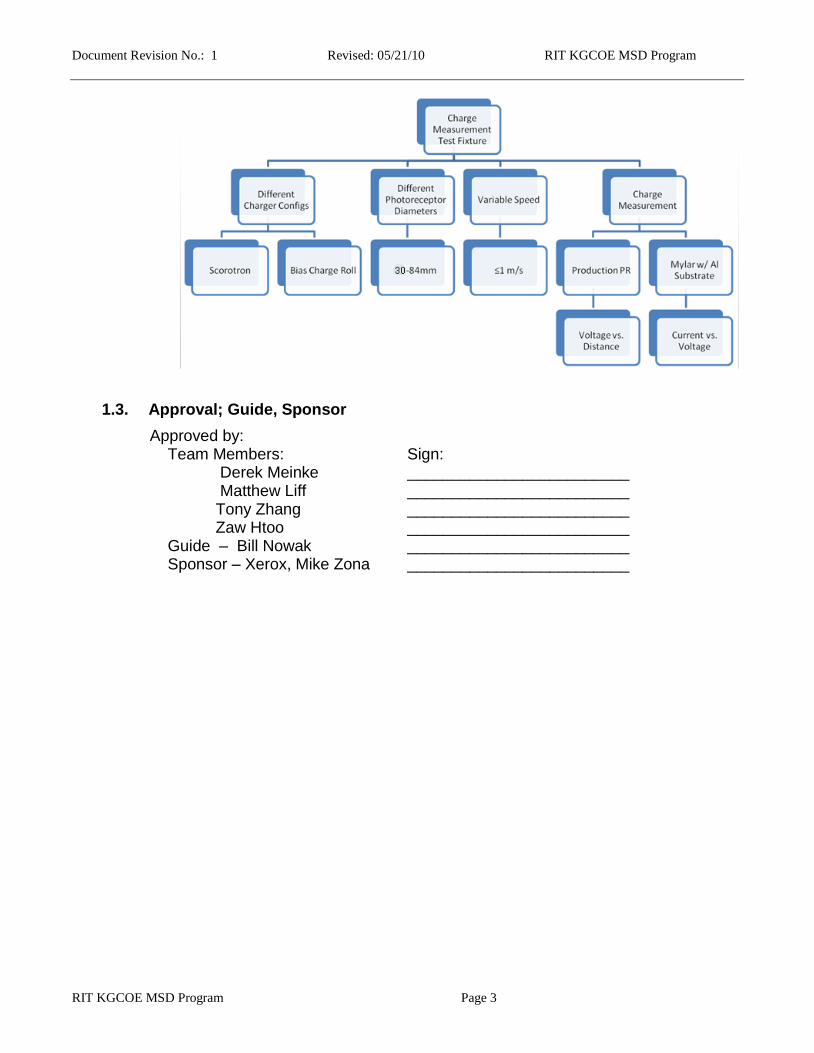
1.2.2. Objective Tree
Document Revision No.: 1 Revised: 05/21/10 RIT KGCOE MSD Program
RIT KGCOE MSD Program Page 3 Revision:
1.3. Approval; Guide, Sponsor
Approved by: Team Members: Sign:
Derek Meinke _________________________ Matthew Liff _________________________ Tony Zhang _________________________ Zaw Htoo _________________________
Guide – Bill Nowak _________________________ Sponsor – Xerox, Mike Zona _________________________
Document Revision No.: 1 Revised: 05/21/10 RIT KGCOE MSD Program
RIT KGCOE MSD Program Page 4 Revision:
1.4. Test Strategy
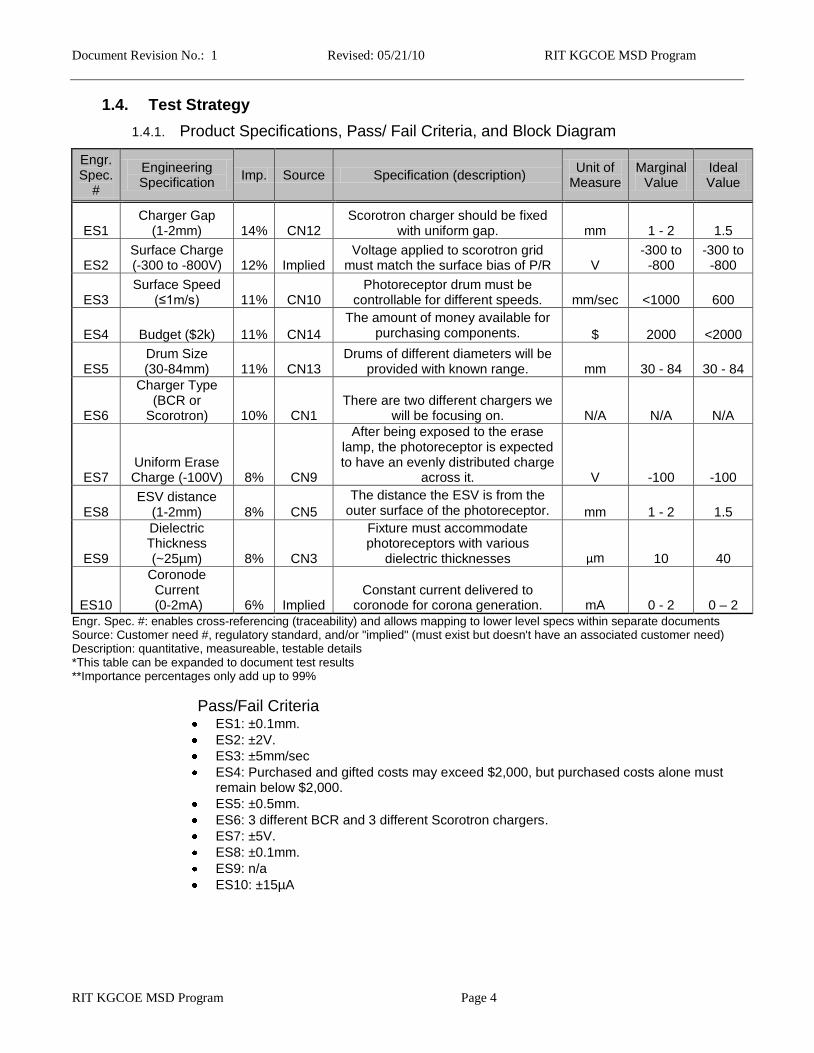
1.4.1. Product Specifications, Pass/ Fail Criteria, and Block Diagram
Engr. Spec.
#
Engineering Specification
Imp. Source Specification (description) Unit of
Measure Marginal
Value Ideal Value
ES1 Charger Gap
(1-2mm) 14% CN12 Scorotron charger should be fixed
with uniform gap. mm 1 - 2 1.5
ES2 Surface Charge (-300 to -800V) 12% Implied
Voltage applied to scorotron grid must match the surface bias of P/R V
-300 to -800
-300 to -800
ES3 Surface Speed
(≤1m/s) 11% CN10 Photoreceptor drum must be
controllable for different speeds. mm/sec <1000 600
ES4 Budget ($2k) 11% CN14
The amount of money available for purchasing components. $ 2000 <2000
ES5 Drum Size (30-84mm) 11% CN13
Drums of different diameters will be provided with known range. mm 30 - 84 30 - 84
ES6
Charger Type (BCR or
Scorotron) 10% CN1 There are two different chargers we
will be focusing on. N/A N/A N/A
ES7 Uniform Erase Charge (-100V) 8% CN9
After being exposed to the erase lamp, the photoreceptor is expected to have an evenly distributed charge
across it. V -100 -100
ES8 ESV distance
(1-2mm) 8% CN5
The distance the ESV is from the outer surface of the photoreceptor. mm 1 - 2 1.5
ES9
Dielectric Thickness (~25µm) 8% CN3
Fixture must accommodate photoreceptors with various
dielectric thicknesses µm 10 40
ES10
Coronode Current (0-2mA) 6% Implied
Constant current delivered to coronode for corona generation. mA 0 - 2 0 – 2
Engr. Spec. #: enables cross-referencing (traceability) and allows mapping to lower level specs within separate documents Source: Customer need #, regulatory standard, and/or "implied" (must exist but doesn't have an associated customer need) Description: quantitative, measureable, testable details *This table can be expanded to document test results **Importance percentages only add up to 99%
Pass/Fail Criteria ES1: ±0.1mm.
ES2: ±2V.
ES3: ±5mm/sec
ES4: Purchased and gifted costs may exceed $2,000, but purchased costs alone must remain below $2,000.
ES5: ±0.5mm.
ES6: 3 different BCR and 3 different Scorotron chargers.
ES7: ±5V.
ES8: ±0.1mm.
ES9: n/a
ES10: ±15µA
Document Revision No.: 1 Revised: 05/21/10 RIT KGCOE MSD Program
RIT KGCOE MSD Program Page 5 Revision:
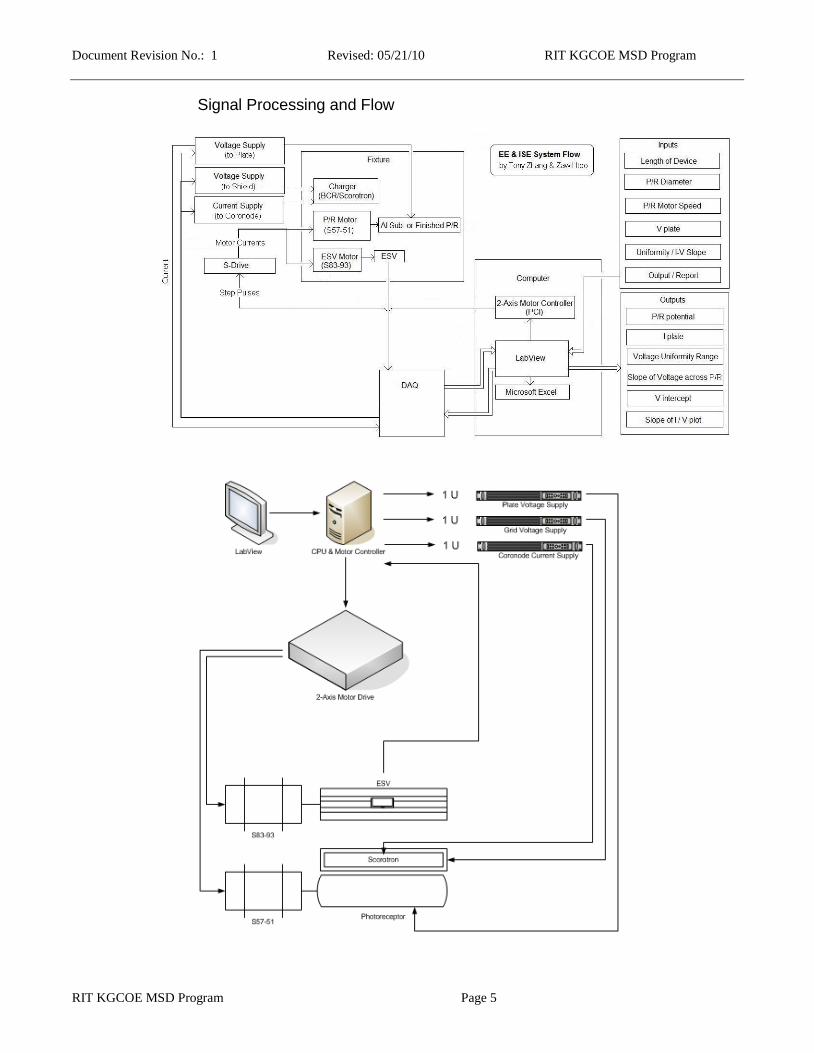
Signal Processing and Flow
Document Revision No.: 1 Revised: 05/21/10 RIT KGCOE MSD Program
RIT KGCOE MSD Program Page 6 Revision:
1.4.2. Functions (hardware) and Features (software, customer needs)
1. Erase Lamp: Light emitting device that sets the photoreceptor to a near-positive voltage (about -100V)
2. Chargers: a. Scorotron: Corona-generating apparatus normally consisting of a micron-width
wire housed by a metallic shield b. Bias-Charge Roll: A shaft enveloped in a polymeric material used to apply a
voltage onto the photoreceptor via direct contact 3. Electrostatic Voltmeter (ESV): An instrument used to measure voltage by its placement in
close proximities with the bias source 4. High-voltage sources:
a. Voltage Source: Outputs a constant voltage b. Current Source: Outputs a variable voltage in order to maintain a constant
current output 5. Stepper Motor: A machine that converts electricity into a mechanical motion 6. Motor Controller: Converts the command signals from the computer’s user interface into
electrical signals for operating the motor drive. 7. Motor Drive: Offers dynamic smoothing and antiresonance filters for smooth motion and
encoderless stall detection for motor operations 8. Data Acquisition Device (DAQ): Any combination of inputs and outputs used for acquiring
electrical measurements and presenting them for data analysis. 9. LabVIEW: A software used for graphical programming for measurement and automation 10. NI Motion: An additional software used in conjunction with LabVIEW for applications in
the domain of motor controls
1.4.3. Test Equipment available
1. Multimeter 2. Vernier calipers 3. Gauge blocks 4. Tachometer
1.4.4. Test Equipment needed but not available
1. At this current time, all testing equipment has been accounted for.
1.4.5. Phases of Testing
1.4.5.1. Component/ Device (wks 2-12)
1. Coronode Current Supply / Grid Voltage Supply 2. Motor 3. ESV 4. Erase lamp 5. Photoreceptor
1.4.5.2. Subsystem (wks 6-13)
1. Charger Subsystem a. ES1: Charger Gap - Gapping block on each end of charger should have
a just fit condition between the charger and photoreceptor
Document Revision No.: 1 Revised: 05/21/10 RIT KGCOE MSD Program
RIT KGCOE MSD Program Page 7 Revision:
i. Take feeler gauges of desired gap, and check both ends and center of charger between charger and photoreceptor
b. ES2: Surface Charge - User’s input for the grid voltage matches with the bias on a photoreceptor within ±2V.
i. Equip a test drum into the fixture ii. Input a voltage (between 0 to -800V) for the grid bias iii. Measure the voltage drop between the surface of the test drum
and ground using a voltmeter and compare measured value with input bias for grid voltage.
c. ES10: Coronode Current – The output of the current supply for the coronode is within ±15µA of the specified current input
i. Input a current value (0 to 2mA) for the coronode current supply ii. Channel the analog current output of the current supply to DAQ
and measure the actual current value iii. Compare the input value with actual output of the supply
d. ES7: Charger Type - There are two different chargers we will be focusing on. Both are provided by the customer.
2. Motor Subsystem
a. ES3: Surface Speed - User’s input for surface speed of the photoreceptor should match with the actual surface speed within 5mm/sec
i. Input a surface speed through the LabVIEW interface ii. While test drum is spinning, apply a tachometer to the surface of
the photoreceptor and record the speed
3. ESV Subsystem a. ES8: ESV Distance – The ESV’s placement is within 1-2 mm of the
photoreceptor’s surface i. Apply a Vplate to the photoreceptor through the graphite brush ii. Scan the surface charge with the ESV. Desired voltage should
be ±2V iii. Feeler gauges will be used to verify gaps if any voltage
variations exist b. Testing the ESV
i. Apply a voltage to a test drum surface ii. Scan the drum surface with the ESV iii. Compare the input voltage with ESV reading and observe the
level of noise in the signal. iv. If any noise is corrupting the signal, add an intermediate filtering
step (through LabVIEW) for the ESV signal before processing it for actual use
v. Increase bandwidth of filter as needed until noise clears
4. Erase Subsystem a. ES7: Uniform Erase Charge – Erase lamp should provide a bias near
-100V to the surface of a photoreceptor i. Equip a test drum into fixture ii. Allow the photoreceptor to spin at 1m/s and shine the erase lamp
onto the test drum iii. Measure the surface bias with ESV and compare to -100V
Auxiliary Tests (related to Photoreceptor) 5. ES5: Drum Size - Drums of different diameters will be provided with known
range. a. Use vernier calipers to measure actual outer diameter of photoreceptor.
Document Revision No.: 1 Revised: 05/21/10 RIT KGCOE MSD Program
RIT KGCOE MSD Program Page 8 Revision:
6. ES9: Dielectric Thickness - Thickness will be given from manufacturer.
a. Thickness of dielectric is so miniscule that it will not impact the fixture’s ability to fit the photoreceptors
1.4.5.3. Integration (wks 11-15)
Summation of tolerances (See Section 1.4.1. Pass/Fail Criteria)
Verification of calculations and assumptions
a. Cantilever Beam Deflection
b. Maximum force that Aluminum substrate can withstand without buckling
Noise problems (ESV signal may contain noise; the signal needs to be cleaned up prior to its analysis using digital filters on the LabVIEW)
Operation in the darkness (Address our Light Inhibiting Enclosure)
For software, combine test programs you have developed for subsystem testing to communicate between the sub modules by adding one at a time to configure overall system. • Check the signal integrity and timing • Check the logic levels and signal waveforms • On an oscilloscope
1.4.5.4. Reliability (wks 15-20)
Make sure that charger slides don’t experience wear over time.
Ensure fasteners are tightened to withstand motor vibrations
1.4.5.5. Customer Acceptance (wks 20-21)
1.5. Definitions; Important Terminology; Key Words
1.5.1. End caps: Concentric V-flange design which each end of the photoreceptor attached to.
1.5.2. Spring Retainer plate: Plate which retains the photoreceptor compression spring to force the end cap toward the photoreceptor. It is held onto the drive shaft by the c-clip.
1.5.3. C-clip: Keeps the spring retainer plate from slipping off of the drive shaft.
1.5.4. Drive Shaft: The shaft which spins the photoreceptor.
1.5.5. ESV: Electrostatic Voltmeter, which measures the surface charge on the photoreceptor.
1.5.6. Charger Slide: The part in which the charger is secured to with double-sided tape. This slides into the charger support beam.
Document Revision No.: 1 Revised: 05/21/10 RIT KGCOE MSD Program
RIT KGCOE MSD Program Page 9 Revision:
1.5.7. Charger Support Beam: The part that moves laterally in reference to the photoreceptor. There are grooves for the charger mount to slide into.
1.5.8. Erase holder: This beam holds the erase lamp.
1.5.9. Gapping Blocks: Blocks in 0.5mm increment to measure both charger and ESV distance from photoreceptor surface.
1.5.10. Mounting Blocks: Blocks in increments of photoreceptor radii that attach the ESV to the ESV guide.
1.5.11. ESV Guide: The part that holds the mounting blocks. This moves along the length of the photoreceptor by the lead screw.
1.5.12. Charger Mount: This part holds the charger support beam in place. It allows for the charger support beam to slide toward and away from the photoreceptor. There are two of these on the fixture located on both sides of the charger support beam.
1.6. References
1.6.1. Mike Zona – Xerox Corporation
1.6.2. Professor Kempski – Rochester Institute of Technology
1.6.3. Mechanics of Materials Textbook by R.C. Hibbeler (7th Edition)
Document Revision No.: 1 Revised: 05/21/10 RIT KGCOE MSD Program
RIT KGCOE MSD Program Page 10 Revision:
2. MSD II WKS 2-3: FINAL TEST PLAN
2.1. Data Collection Plan; Sampling Plan
2.1.1. Data Collection Structure
Introduction: The testing of all subsystems will be completed before interfacing the separate components. The entire testing process will be categorized into subsystem testing and final product testing.
i) Subsystem Testing: The various components of the fixture subsystems are tested before interfacing. The electrical hardware including the high voltage supplies and the motors are tested for accurate output and functionality. The various mounts will be measured again to ensure the critical gapping remains consistent to that defined in the design.
ii) Final Testing: Once the prototype is completed, the final testing of the fixture will include
data collection and analysis using the LabVIEW software. The coding will be executed for various photoreceptor sizes along with different charger configurations to ensure proper outputs consistent with the customer needs.
2.2. Measurement Capability, Equipment
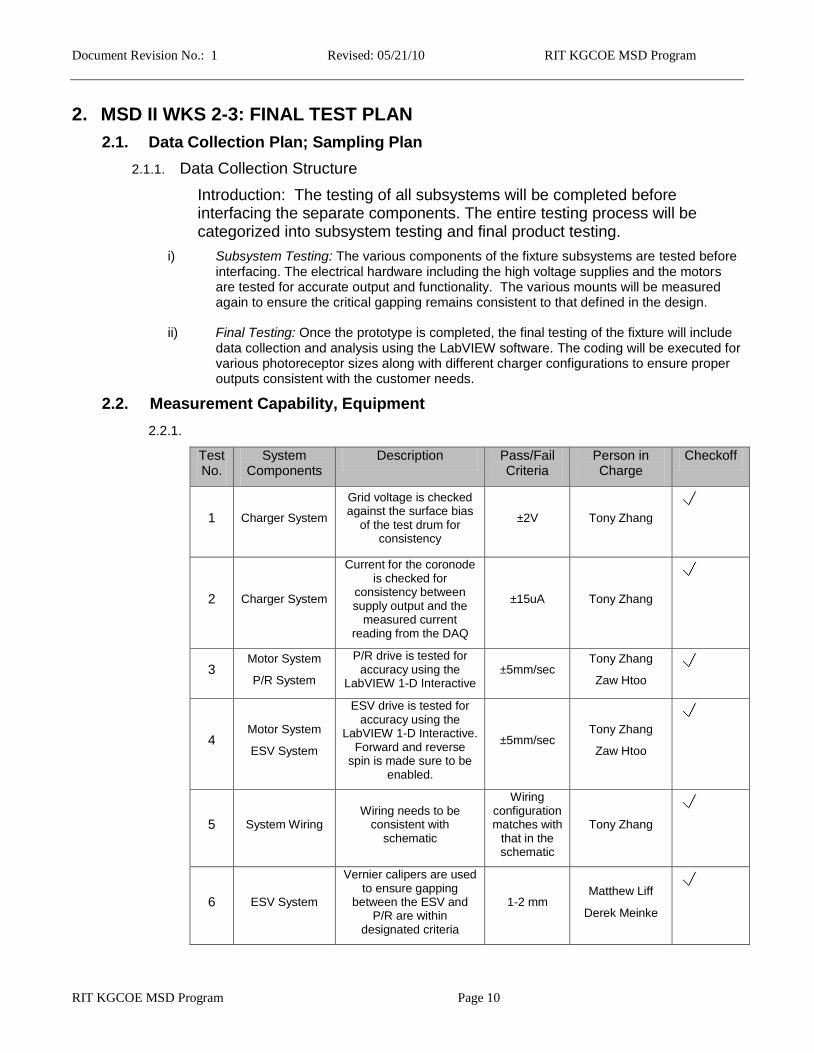
2.2.1.
Test No.
System Components
Description Pass/Fail Criteria
Person in Charge
Checkoff
1 Charger System
Grid voltage is checked against the surface bias
of the test drum for consistency
±2V Tony Zhang
2 Charger System
Current for the coronode is checked for
consistency between supply output and the
measured current reading from the DAQ
±15uA Tony Zhang
3 Motor System
P/R System
P/R drive is tested for accuracy using the
LabVIEW 1-D Interactive ±5mm/sec
Tony Zhang
Zaw Htoo
4 Motor System
ESV System
ESV drive is tested for accuracy using the
LabVIEW 1-D Interactive. Forward and reverse
spin is made sure to be enabled.
±5mm/sec Tony Zhang
Zaw Htoo
5 System Wiring Wiring needs to be
consistent with schematic
Wiring configuration matches with
that in the schematic
Tony Zhang
6 ESV System
Vernier calipers are used to ensure gapping
between the ESV and P/R are within
designated criteria
1-2 mm Matthew Liff
Derek Meinke
Document Revision No.: 1 Revised: 05/21/10 RIT KGCOE MSD Program
RIT KGCOE MSD Program Page 11 Revision:
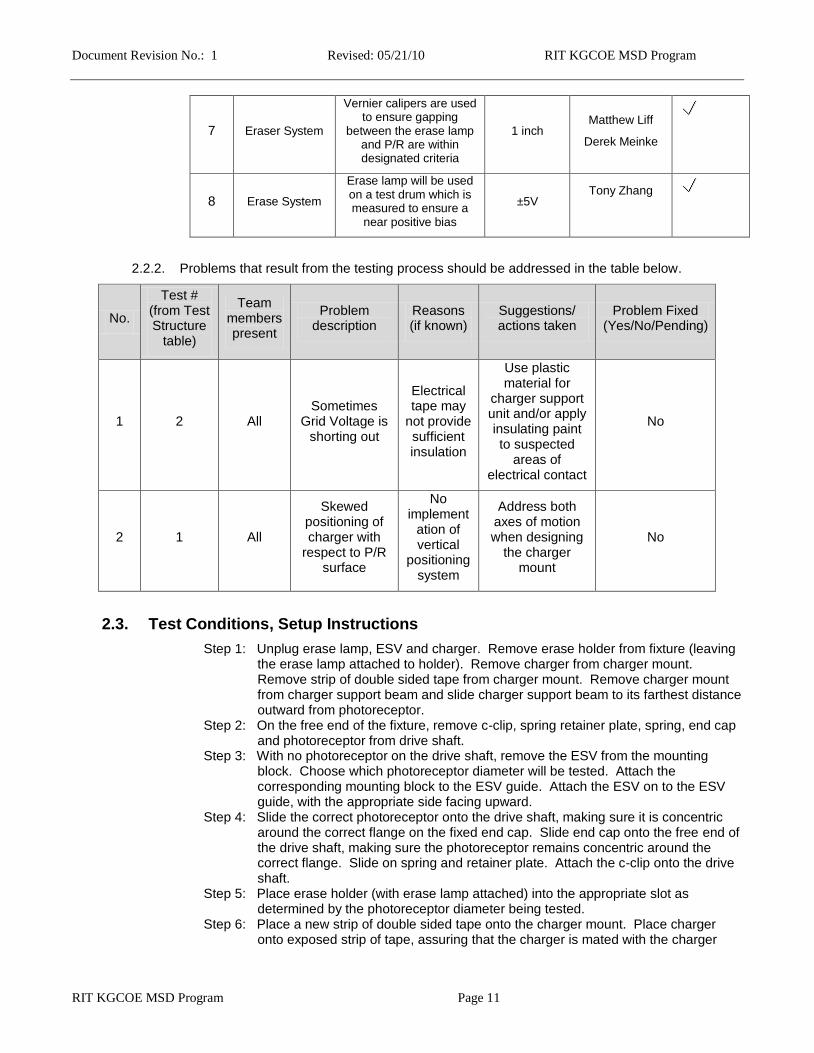
7 Eraser System
Vernier calipers are used to ensure gapping
between the erase lamp and P/R are within designated criteria
1 inch Matthew Liff
Derek Meinke
8 Erase System
Erase lamp will be used on a test drum which is measured to ensure a
near positive bias
±5V Tony Zhang
2.2.2. Problems that result from the testing process should be addressed in the table below.
No.
Test # (from Test Structure
table)
Team members present
Problem description
Reasons (if known)
Suggestions/ actions taken
Problem Fixed (Yes/No/Pending)
1 2 All Sometimes
Grid Voltage is shorting out
Electrical tape may
not provide sufficient insulation
Use plastic material for
charger support unit and/or apply insulating paint to suspected
areas of electrical contact
No
2 1 All
Skewed positioning of charger with
respect to P/R surface
No implement
ation of vertical
positioning system
Address both axes of motion when designing
the charger mount
No
2.3. Test Conditions, Setup Instructions
Step 1: Unplug erase lamp, ESV and charger. Remove erase holder from fixture (leaving the erase lamp attached to holder). Remove charger from charger mount. Remove strip of double sided tape from charger mount. Remove charger mount from charger support beam and slide charger support beam to its farthest distance outward from photoreceptor.
Step 2: On the free end of the fixture, remove c-clip, spring retainer plate, spring, end cap and photoreceptor from drive shaft.
Step 3: With no photoreceptor on the drive shaft, remove the ESV from the mounting block. Choose which photoreceptor diameter will be tested. Attach the corresponding mounting block to the ESV guide. Attach the ESV on to the ESV guide, with the appropriate side facing upward.
Step 4: Slide the correct photoreceptor onto the drive shaft, making sure it is concentric around the correct flange on the fixed end cap. Slide end cap onto the free end of the drive shaft, making sure the photoreceptor remains concentric around the correct flange. Slide on spring and retainer plate. Attach the c-clip onto the drive shaft.
Step 5: Place erase holder (with erase lamp attached) into the appropriate slot as determined by the photoreceptor diameter being tested.
Step 6: Place a new strip of double sided tape onto the charger mount. Place charger onto exposed strip of tape, assuring that the charger is mated with the charger
Document Revision No.: 1 Revised: 05/21/10 RIT KGCOE MSD Program
RIT KGCOE MSD Program Page 12 Revision:
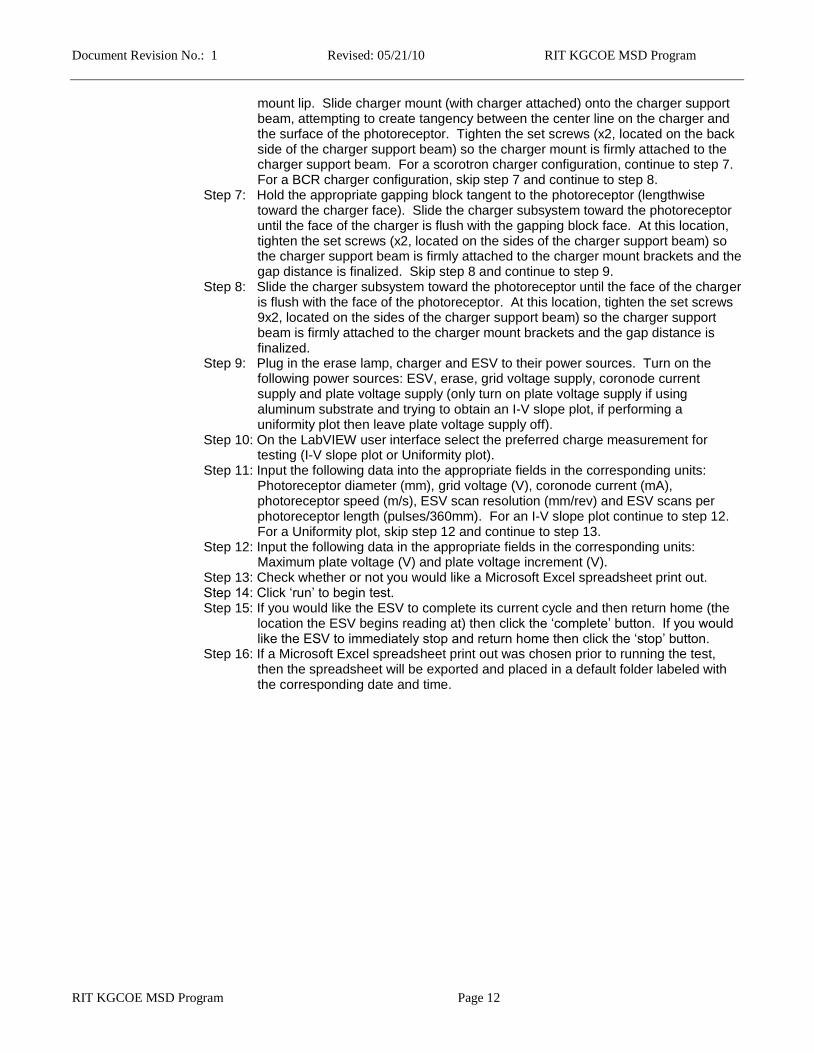
mount lip. Slide charger mount (with charger attached) onto the charger support beam, attempting to create tangency between the center line on the charger and the surface of the photoreceptor. Tighten the set screws (x2, located on the back side of the charger support beam) so the charger mount is firmly attached to the charger support beam. For a scorotron charger configuration, continue to step 7. For a BCR charger configuration, skip step 7 and continue to step 8.
Step 7: Hold the appropriate gapping block tangent to the photoreceptor (lengthwise toward the charger face). Slide the charger subsystem toward the photoreceptor until the face of the charger is flush with the gapping block face. At this location, tighten the set screws (x2, located on the sides of the charger support beam) so the charger support beam is firmly attached to the charger mount brackets and the gap distance is finalized. Skip step 8 and continue to step 9.
Step 8: Slide the charger subsystem toward the photoreceptor until the face of the charger is flush with the face of the photoreceptor. At this location, tighten the set screws 9x2, located on the sides of the charger support beam) so the charger support beam is firmly attached to the charger mount brackets and the gap distance is finalized.
Step 9: Plug in the erase lamp, charger and ESV to their power sources. Turn on the following power sources: ESV, erase, grid voltage supply, coronode current supply and plate voltage supply (only turn on plate voltage supply if using aluminum substrate and trying to obtain an I-V slope plot, if performing a uniformity plot then leave plate voltage supply off).
Step 10: On the LabVIEW user interface select the preferred charge measurement for testing (I-V slope plot or Uniformity plot).
Step 11: Input the following data into the appropriate fields in the corresponding units: Photoreceptor diameter (mm), grid voltage (V), coronode current (mA), photoreceptor speed (m/s), ESV scan resolution (mm/rev) and ESV scans per photoreceptor length (pulses/360mm). For an I-V slope plot continue to step 12. For a Uniformity plot, skip step 12 and continue to step 13.
Step 12: Input the following data in the appropriate fields in the corresponding units: Maximum plate voltage (V) and plate voltage increment (V).
Step 13: Check whether or not you would like a Microsoft Excel spreadsheet print out. Step 14: Click ‘run’ to begin test. Step 15: If you would like the ESV to complete its current cycle and then return home (the
location the ESV begins reading at) then click the ‘complete’ button. If you would like the ESV to immediately stop and return home then click the ‘stop’ button.
Step 16: If a Microsoft Excel spreadsheet print out was chosen prior to running the test, then the spreadsheet will be exported and placed in a default folder labeled with the corresponding date and time.
Document Revision No.: 1 Revised: 05/21/10 RIT KGCOE MSD Program
RIT KGCOE MSD Program Page 13 Revision:
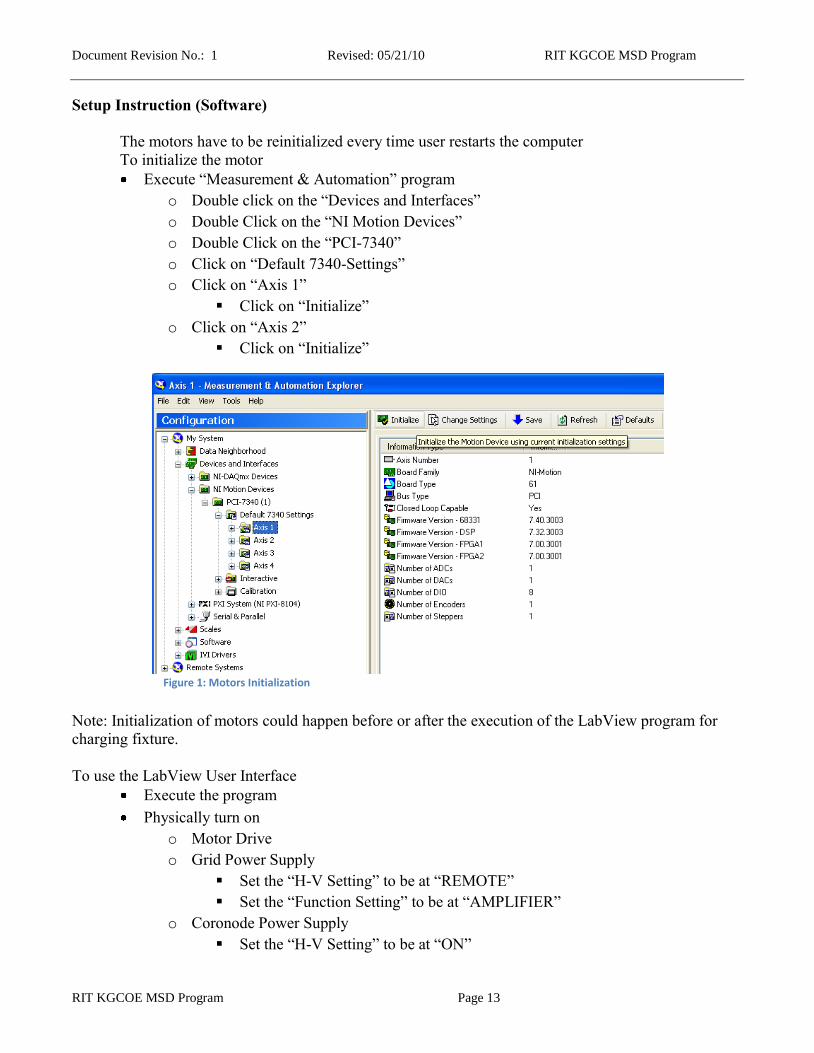
Setup Instruction (Software)
The motors have to be reinitialized every time user restarts the computer
To initialize the motor
Execute “Measurement & Automation” program
o Double click on the “Devices and Interfaces”
o Double Click on the “NI Motion Devices”
o Double Click on the “PCI-7340”
o Click on “Default 7340-Settings”
o Click on “Axis 1”
Click on “Initialize”
o Click on “Axis 2”
Click on “Initialize”
Note: Initialization of motors could happen before or after the execution of the LabView program for
charging fixture.
To use the LabView User Interface
Execute the program
Physically turn on
o Motor Drive
o Grid Power Supply
Set the “H-V Setting” to be at “REMOTE”
Set the “Function Setting” to be at “AMPLIFIER”
o Coronode Power Supply
Set the “H-V Setting” to be at “ON”
Figure 1: Motors Initialization
Document Revision No.: 1 Revised: 05/21/10 RIT KGCOE MSD Program
RIT KGCOE MSD Program Page 14 Revision:
Set the “FUNCTION” setting at be at “SUPPLY”
Manually apply the current using the dial on the supply to be at “-600 uAmp”
Set the “H-V Setting” to be at “REMOTE”
Set the “Function Setting” to be at “SUPPLY”
o V-Plate Power Supply (if I-V slope is to be tested)
Set the “H-V Setting” to be at “Remote”
Set the “Function Setting” to be at “Amplifier”
o Erase Lamp Power Supply (If Uniformity is to be tested)
o ESV Meter (If Uniformity is to be tested)
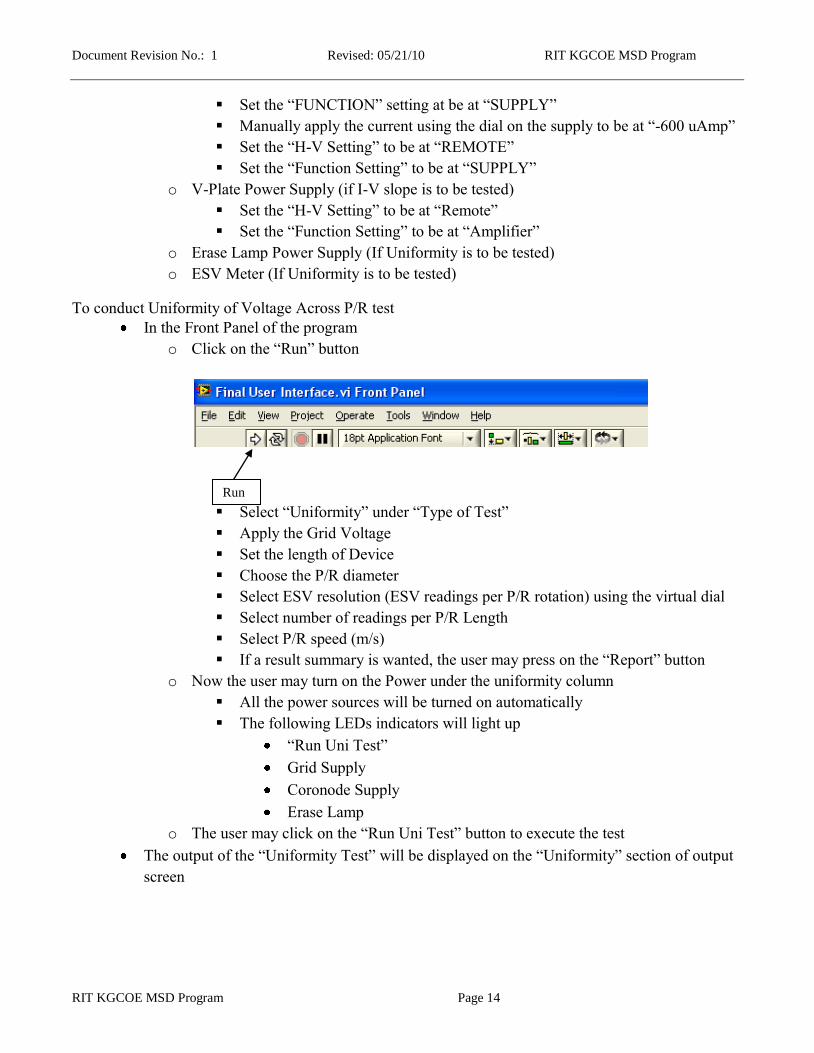
To conduct Uniformity of Voltage Across P/R test
In the Front Panel of the program
o Click on the “Run” button
Select “Uniformity” under “Type of Test”
Apply the Grid Voltage
Set the length of Device
Choose the P/R diameter
Select ESV resolution (ESV readings per P/R rotation) using the virtual dial
Select number of readings per P/R Length
Select P/R speed (m/s)
If a result summary is wanted, the user may press on the “Report” button
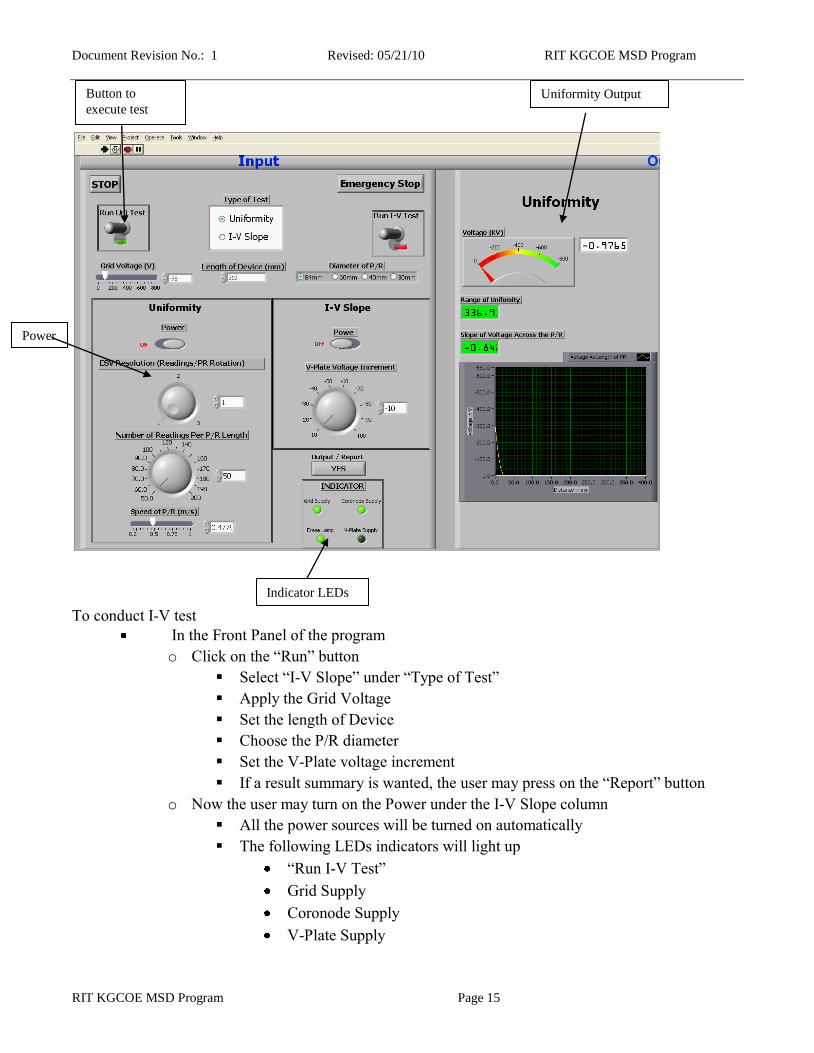
o Now the user may turn on the Power under the uniformity column
All the power sources will be turned on automatically
The following LEDs indicators will light up
“Run Uni Test”
Grid Supply
Coronode Supply
Erase Lamp
o The user may click on the “Run Uni Test” button to execute the test
The output of the “Uniformity Test” will be displayed on the “Uniformity” section of output
screen
Run
Document Revision No.: 1 Revised: 05/21/10 RIT KGCOE MSD Program
RIT KGCOE MSD Program Page 15 Revision:
To conduct I-V test
In the Front Panel of the program
o Click on the “Run” button
Select “I-V Slope” under “Type of Test”
Apply the Grid Voltage
Set the length of Device
Choose the P/R diameter
Set the V-Plate voltage increment
If a result summary is wanted, the user may press on the “Report” button
o Now the user may turn on the Power under the I-V Slope column
All the power sources will be turned on automatically
The following LEDs indicators will light up
“Run I-V Test”
Grid Supply
Coronode Supply
V-Plate Supply
Button to
execute test
Uniformity Output
Power
Indicator LEDs

Document Revision No.: 1 Revised: 05/21/10 RIT KGCOE MSD Program
RIT KGCOE MSD Program Page 16 Revision:
o The user may click on the “Run I-V Test” button to execute the test
The output of the I-V test will be displayed on the “I-V Slope” section of output screen
3. MSD II – WKS 3-10 DESIGN TEST VERIFICATION
Note to Teams: Populate the templates and test processes established in Final Test Plan.
These elements can be integrated or rearranged to match project characteristics or personal/team preferences.
3.1. Test Results
3.1.1. Component
High Voltage Supplies
Using the nominal values for the inputs, the output is tested for precision
Coronode Current (uA) Grid Voltage (V) Plate Voltage (V)
Input -604 -650 -650
Output -594 -649 -648
Difference 10 1 2
Current/m Vs Voltage Graph
Document Revision No.: 1 Revised: 05/21/10 RIT KGCOE MSD Program
RIT KGCOE MSD Program Page 17 Revision:
Pass/Fail? Pass Pass Pass
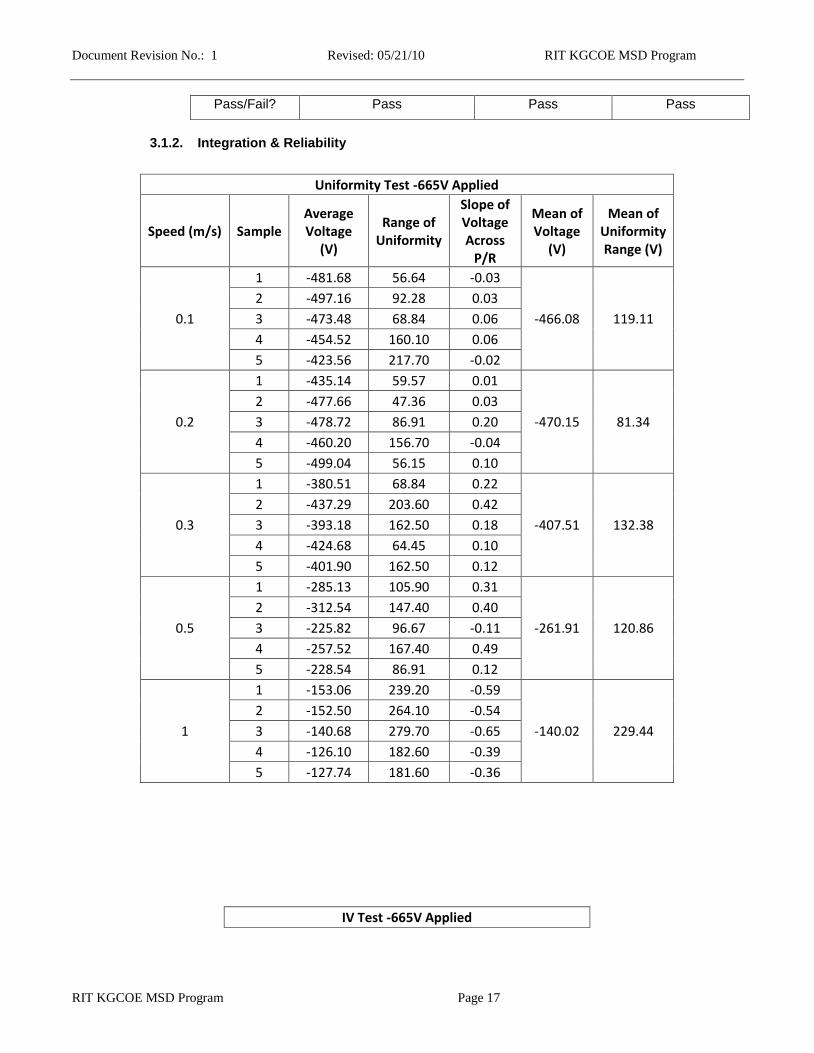
3.1.2. Integration & Reliability
Uniformity Test -665V Applied
Speed (m/s) Sample Average Voltage
(V)
Range of Uniformity
Slope of Voltage Across
P/R
Mean of Voltage
(V)
Mean of Uniformity Range (V)
0.1
1 -481.68 56.64 -0.03
-466.08 119.11
2 -497.16 92.28 0.03
3 -473.48 68.84 0.06
4 -454.52 160.10 0.06
5 -423.56 217.70 -0.02
0.2
1 -435.14 59.57 0.01
-470.15 81.34
2 -477.66 47.36 0.03
3 -478.72 86.91 0.20
4 -460.20 156.70 -0.04
5 -499.04 56.15 0.10
0.3
1 -380.51 68.84 0.22
-407.51 132.38
2 -437.29 203.60 0.42
3 -393.18 162.50 0.18
4 -424.68 64.45 0.10
5 -401.90 162.50 0.12
0.5
1 -285.13 105.90 0.31
-261.91 120.86
2 -312.54 147.40 0.40
3 -225.82 96.67 -0.11
4 -257.52 167.40 0.49
5 -228.54 86.91 0.12
1
1 -153.06 239.20 -0.59
-140.02 229.44
2 -152.50 264.10 -0.54
3 -140.68 279.70 -0.65
4 -126.10 182.60 -0.39
5 -127.74 181.60 -0.36
IV Test -665V Applied
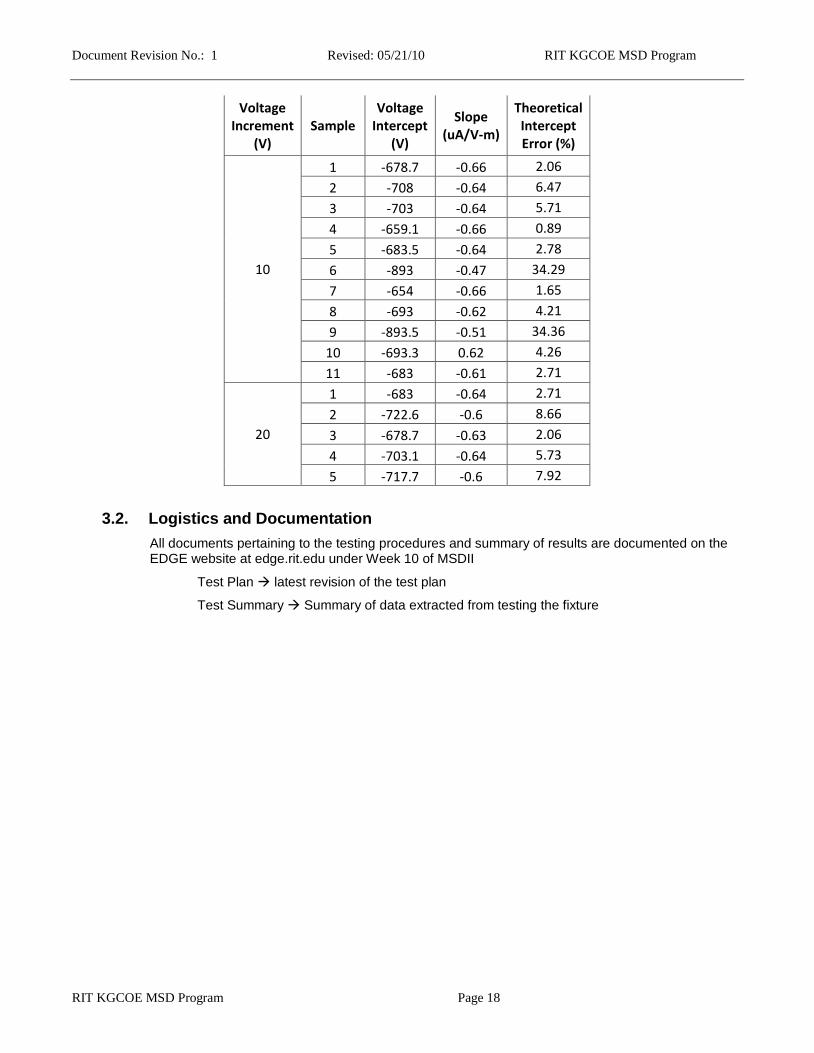
Document Revision No.: 1 Revised: 05/21/10 RIT KGCOE MSD Program
RIT KGCOE MSD Program Page 18 Revision:
Voltage Increment
(V) Sample
Voltage Intercept
(V)
Slope (uA/V-m)
Theoretical Intercept Error (%)
10
1 -678.7 -0.66 2.06
2 -708 -0.64 6.47
3 -703 -0.64 5.71
4 -659.1 -0.66 0.89
5 -683.5 -0.64 2.78
6 -893 -0.47 34.29
7 -654 -0.66 1.65
8 -693 -0.62 4.21
9 -893.5 -0.51 34.36
10 -693.3 0.62 4.26
11 -683 -0.61 2.71
20
1 -683 -0.64 2.71
2 -722.6 -0.6 8.66
3 -678.7 -0.63 2.06
4 -703.1 -0.64 5.73
5 -717.7 -0.6 7.92
3.2. Logistics and Documentation
All documents pertaining to the testing procedures and summary of results are documented on the EDGE website at edge.rit.edu under Week 10 of MSDII
Test Plan latest revision of the test plan
Test Summary Summary of data extracted from testing the fixture