texte intégral / full text (pdf, 19 mib)
TRANSCRIPT
POUR L'OBTENTION DU GRADE DE DOCTEUR ÈS SCIENCES
acceptée sur proposition du jury:
Prof. F. Golay, président du juryProf. J.-L. Scartezzini, directeur de thèse
Prof. R. Compagnon, rapporteur Prof. J. Huang, rapporteur
Prof. K. Steemers, rapporteur
Optimisation of Urban Form by the Evaluation of the Solar Potential
THÈSE NO 4657 (2010)
ÉCOLE POLYTECHNIQUE FÉDÉRALE DE LAUSANNE
PRÉSENTÉE LE 3 SEPTEmBRE 2010
À LA FACULTÉ ENVIRONNEmENT NATUREL, ARCHITECTURAL ET CONSTRUIT
LABORATOIRE D'ÉNERGIE SOLAIRE ET PHYSIQUE DU BÂTImENT
PROGRAmmE DOCTORAL EN ENVIRONNEmENT
Suisse2010
PAR
marylène mONTAVON


i
Acknowledgements
I am extremely grateful to many people who made the completion of this Ph.D. thesis possible.
In particular, I would like to address my warmest thanks to:
Professor Jean-Louis Scartezzini for accepting me as a Ph.D. Student at LESO-PB, for his excellent
guidance, scientific rigor, the independence he allowed me in granting me the freedom to pursue this
research and for having been a reliable guide throughout the entire work.
Professor Raphaël Compagnon for his constant support, his incalculable help with PPF and Radiance,
his inventiveness, his scientific rigor and for his remarkable knack in discovering precious arcane
knowlege that was so useful to me in this work.
Professor Koen Steemers for his invitation to work at The Martin Centre for Architectural and Urban
Studies at the University of Cambridge, his support, valuable criticism, scientific guidance and for his
warm welcome. I appreciate the way Professor Steemers involved me in his various research projects
which were vital in the elaboration of my thesis. It was an unforgettable and precious experience.
The jury members Professor Raphaël Compagnon, Professor Koen Steemers and Professor Jeffrey
Huang for their patience and close attention in reading this thesis and for their helpful questions,
comments and suggestions. I am especially grateful to Professor François Golay for having generously
accepted the role of President of the jury and for her charm and professionalism in carrying out these
duties.
The Doctoral School at EPFL and especially the Dean, Professor Jacques Giovanola for his support.
The Swiss Federal Office of Energy (SFOE) for funding my research activities within the projects
SOLURBAN and Quartiers Durables, and the projects‘ partners for their fruitful collaboration and
constructive discussions.
The EFPL Research Commission, the Swiss National Science Foundation (SNSF) and The Martin
Centre for Architectural and Urban Studies at the University of Cambridge for their joint support in my
one year stay at The Martin Centre as a visiting scholar. Throughout my stay I worked with some
wonderful people at what turned out to be the most crucial phase of my professional life. In particular,
I would like to thank Professor Luca Ortelli, Professor Martin Steinmann and Professor André de Herde
for their support when I was applying for a scholarship from SNSF. To the people representing those
institutions who gave their positive support in the interests of the research I am deeply grateful.
My thanks to Dr Amina Harzallah, Dr Amina Bouamrioune Hould-henia, DeLaMa Architecture Office
(Professor Bruno Marchand, Karine Bossy), the Land Register and Surveying Office of Canton Basel-
Stadt (Grundbuch and Vermessungsamt, Walther Meier), the City of Meyrin, the Urban Planning
Service of Lausanne and Geneva, the Geographical Information Systems Laboratory of EPFL (LASIG,
Gilles Gachet and Caroline Billot), the University of São Paulo (FAUUSP, Professor Denise Duarte and
Professor Joana Gonçalves), the Services Industriels of Lausanne (Clive Gloor), the Archives de la
construction moderne of EPFL (ACM, Professor Pierre Frey and Jean-Daniel Chavan) and the Martin
Centre for Architectural and Urban Studies at the University of Cambridge (Professor Koen Steemers,
Dr Vicky Cheng, Dr Fernanda Sa Oliveira) for their help and for having put precious documents at my
disposal which served to enrich this thesis.
I would also like to thank Keith Green who carefully reread all the chapters in this thesis and gave me
several useful pieces of advice until the last day of writing. Thank you so much Keith for your very
British humor!
I would also like to acknowledge my profound debt to Professor Bruno Marchand who fired my
enthusiasm for research in architecture with his own passion and generosity.

ii
I am grateful to Dr Jean-Bernard Gay and Professor Claude-Alain Roulet for their thoughtful advice and
for sharing with me their impressive knowledge. Your enthusiasm and inspiration for research have
been a model for me throughout my thesis.
My thanks go to Dr Mario Germano for his incalculable assistance, his scientific rigor and for his
friendship.
I would also like to thank Laurent Deschamps, his team (LESO-PB at EPFL) and Stan Finney
(Architecture Department at the University of Cambridge) for their kind dedication to solving
computer-related problems in a friendly and efficient manner.
Many thanks to the librarians Catherine Senéchaud (EPFL) and Robert Carter (University of
Cambridge) for their varied and invaluable help during my research at their respective libraries.
And to all members of the LESO-PB and The Martin Centre for the very friendly working environment
they have created and from which I benefited. In particular, I would like to thank Dr Jérôme Kaempf
and Dr Vicky Cheng for their rigorous scientific approach, which was a great motivating factor for me
throughout our close collaboration on this thesis. My thanks also to the secretaries of the LESO-PB,
Sylvette Renfer, Suzanne l‘Eplattenier and Barbara Smith for their generosity and skill. And a special
thank-you to Sylvette Renfer for her unwavering support. I am also grateful to the secretary (now
retired) at the Martin Centre, Christine Woodhouse, for her help in the laboratory and her humor.
Thanks also to Professor Geoffrey Caruso for those impassioned discussions in French during my stay
at the Martin Centre.
My thanks to Dr Ard Louis, Dr Chiranjib Mitra, Professor Diane Vincent, Dom Vincent and
Dr Alison Kesby for having welcomed me so warmly into the Alpha Group in Cambridge and for those
intense reflections about our origins.
« Un grand merci » also to my former employers Pont12 Architectes SA and CCHE Architecture SA for
their confidence in me and for having given me the time (between two workshops) to dedicate to my
thesis. Special thanks in particular to François Jolliet, Marco Cennini and Pierre Fragnière for their skill
and their professionalism.
Special thanks to my friends, to my dear in-laws for their friendship and support, in particular to
Francine Stoll, Nathalie Jacquemettaz, Philippe Hêche, Pierre Gilquin, Dr Bernard Paule,
Dr Marie-Cécile Pibiri, Dr Andreas Schueler, Conny Schueler, Enrico Portmann, Marie-Gabrielle
Portmann, Professor Christoph Frei, Professor Marilyne Andersen, Pascal Meylan, René Altherr,
Dr Marcelo Bidinost, Gérard Greuter, Martina Vallotton, Dr Mariacristina Munari-Probst, Pierre-Alain
Bourquard, Dr Pierre Fridez, Claire Froidevaux-Fridez, Josée Duquette, Catherine Jankowska, Valérie
Pleskanowski, Dr Nataliya Denchik, Pietro Cutruzzulà, Isabella Carpiceci, Anita Jordi, Jean-Daniel
Berset, Dominique Von der Muehll, Valeria Ceccafosso, Dr Nicolas Bassand, Dr Nadia Chow,
Dr Hanne Tine Ring Hansen, Dr Meng Liu, Dr Fernanda Sa Oliveira, Dr Antoine Guillemin,
Gilberte Montavon, Etienne Montavon, Dr Christiane Montavon and Dr Simon Watson.
Last but not least, I will never be able to express adequately my gratitude to my husband, Jean-Charles
for his unconditional support, to my parents, Laurent and Anna, to my sisters Lilli and Laurence for
lovingly taking care of Domitille while I was writing this thesis. I thank my beloved daughter Domitille
who teaches me to view the world through the eyes of a child, eager for discovery and experience.
I dedicate this little memoir to my special ―friend‖ Pudding, the beloved cat of the Martin Centre who
passed away and to my present cat, Tigane, who has found an equal place in my heart.
iii
What’s past is prologue.
William Shakespeare, The Tempest
iv
Version abrégée
Quel sera le visage de la ville de demain? Il s‘agit d‘une question cruciale car, au cours des quatre
milliards et demi d‘années de son existence, la Terre n'a jamais été aussi menacée qu‘elle l'est
aujourd'hui. Depuis 2008, la moitié de la population du globe vit en ville – plus de 70% dans les pays
riches. Or c‘est en milieu urbain que sont produits plus des trois quarts des émissions de CO2 et qu‘est
consommée 75% de l‘énergie mondiale. La bataille du climat pour la poursuite de notre espèce et de
toute autre vie se jouera donc dans les villes. Sera-t-il possible de créer une ville écologique idéale ?
L‘objectif de cette thèse est de comparer des formes urbaines existantes et théoriques pour explorer les
divers effets de la densité construite sur la lumière naturelle et sur le potentiel solaire. En effet, la
recherche d'orientations idéales relatives au solaire a été et reste une problématique persistante du 19ème
siècle et ceci jusqu‘au début du 20ème
siècle. Encore aujourd‘hui, malgré nos connaissances scientifiques
et pratiques de l‘énergie solaire, établir le bon choix n‘a pas encore franchi la frontière de l‘énigme, art
délicat dans le champ d‘une science exacte.
Dans un premier temps, six sites urbains existants, quatre en Suisse, deux au Brésil et deux projets dans
le Royaume-Uni, ainsi que quelques formes urbaines génériques et une ville utopique, ont été modélisés
et analysés. Le véritable enjeu se situe non seulement dans la construction de nouveaux quartiers
exemplaires, mais aussi dans la transformation de villes existantes. La méthode d‘analyse utilisée
permet d‘évaluer le potentiel du chauffage solaire actif et passif, la production d'électricité
photovoltaïque ainsi que l‘éclairage naturel en façade et en toiture des immeubles. Les résultats obtenus
par l‘analyse de ces différents cas ont révélé de grandes variations du potentiel solaire sur l‘enveloppe
des bâtiments. Idéalement, ces investigations pourront aider les architectes et les urbanistes à optimiser
le potentiel solaire dans la phase conceptuelle de leurs projets.
Une étude comparable a été effectuée sur la Ville contemporaine de trois millions d‘habitants imaginée
par Le Corbusier. Selon ce dernier, la Ville contemporaine aurait pu accroître la capacité urbaine tout en
améliorant, en même temps, l‘environnement bâti et le fonctionnement de la ville. Ce travail a ainsi
permis de déterminer le potentiel solaire de cette ville utopique en vue de vérifier les hypothèses de Le
Corbusier. En effet, depuis 1922, les écrits de Le Corbusier influencent les architectes et urbanistes dans
leurs choix des orientations et des formes urbaines. Il était donc important de vérifier si cette influence a
raison d‘être.
Des valeurs de rayonnement solaire et d‘éclairement par la lumière naturelle obtenus par simulations
numériques constituent le cœur de cette procédure d‘évaluation. La méthode générale, adoptée pour
l'ensemble des simulations numériques, a consisté – via le dessin assisté par ordinateur, à savoir
AutoCad – en la modélisation tridimensionnelle et spatiale de chaque bâtiment ou groupes de bâtiments
avant de les exporter vers un logiciel d'analyse de performances urbaines (logiciel PPF/RADIANCE).
Les distributions statistiques d‘irradiation et d‘éclairement des façades et des toitures ont été calculées à
l‘aide d‘une méthode de ray-tracing, en vue de déterminer les surfaces appropriées aux différentes
technologies solaires (énergie solaire passive et active, photovoltaïque et éclairage naturel). Des
indicateurs de performance ont été utilisés pour évaluer le gisement solaire disponible et exploitable
dans un contexte urbain (par exemple, les diagrammes polaires, les statistiques de facteur de vue du ciel
et de lumière naturelle) et cela, en vue de déterminer des stratégies solaires optimales en zone urbaine.
Les différents travaux et recommandations en rapport avec l‘énergie solaire, apparus surtout depuis la
fin du XIXème
siècle, de même que les divers modèles scientifiques et logiciels se rapportant à ce thème,
sont aussi présentés dans ce document.
Mots clés: Architecture, Quartiers durables, Recommandations solaires, Densité, Tissu urbain,
Simulation numérique, PPF RADIANCE, Modèle 3D, Etude de cas, Analyse énergétique, Eclairement,
Solaire actif, Solaire passif, Photovoltaïque, Le Corbusier, la Ville contemporaine de trois millions
d‘habitants.
v
Abstract
What will the cities of tomorrow look like? This is a crucial question because in the four and a half
billion years of its existence, the Earth has never been so threatened, as it is today. Since 2008 half of
the world‘s population has lived in towns – more than 70% in rich nations. Three quarters of CO2
emissions are produced in towns, 75% of the world‘s energy is consumed in towns. The battle for our
climate, for the continuation of our species and all other life, will be largely waged in cities. Will it be
possible to create the ideal ecological town?
The objective of this study is to compare actual and theoretical urban forms in order to explore the
diverse effects of daylighting and solar potential on densely built-up sites. Indeed, the search for ideal
solar orientations has been a persistent problem from the 19th century until the beginning of the 20
th.
Even today, for all our scientific knowledge and empirical experience of solar energy, making the
correct choice has still not crossed the boundary from an enigmatic, tricky art into the field of an exact
science.
As a first step, six existing urban sites in Switzerland and Brazil, as well as two projects in the United
Kingdom, a few generic models and a utopian city, were modelled and analyzed. The goal was not
merely the construction of new, exemplary districts but also the transformation of existing towns. The
findings have been used to assess the potential of façades and roofs located in urban areas for active and
passive solar heating, photovoltaic electricity generation and daylighting. The results obtained from
these different case studies revealed large variations of the potential for solar energy collection on the
buildings‘ façades and roofs. Ideally, these investigations are expected to help architects and town
planners understand how to optimise solar collection on buildings design.
In addition, a study was made of the Contemporary City of Three Million Inhabitants created by Le
Corbusier. According to the latter, the Contemporary City could increase the urban capacity and at the
same time improve the urban environment and the efficiency of the city. Therefore the present study
extracted the solar potential of this utopian city in order to assess Le Corbusier‘s propositions. Since
1922, Le Corbusier‘s studies have influenced architects and town-planners in their choice of
orientations and urban forms: it was therefore crucial to discover if this reliance on Le Corbusier was
justified.
Solar irradiation and illuminance values obtained through numerical simulations form the core part of
the method. The method adopted for the entire set of computer simulations consisted in modelling —
via a computer-aided drawing piece of software, namely AutoCAD — the digital model of each
building or group of buildings prior to exporting them to an urban performance analysis software
(PPF/RADIANCE software package). Spatial distributions of solar irradiation and daylight fluxes over
the overall building façades and roofs were calculated using ray-tracing simulation techniques to
determine the appropriate placement of different solar technologies (passive and active solar,
photovoltaic and daylighting). Performance indicators were used to assess the solar utilisation potential
of the urban sites (e.g. statistics of sky view factors and daylight factors) in order to determine the
optimal solar strategies for a given urban context.
In addition, various works and sun-related recommendations that have appeared mainly since the end of
the nineteenth century, together with the various scientific models and software tools pertaining to this
topic, are presented in this study.
Key words : Architecture design, Sustainable districts, Sun-related recommendations, Density, Urban
fabric, Numerical simulation, PPF RADIANCE, Three-dimensional model, Case study, Energy
analysis, Daylighting, Passive solar, Active solar, Building-integrated photovoltaics, Le Corbusier, The
Contemporary City of Three Million Inhabitants.

vii
Contents
Chapter 1: Introduction ..................................................................................................................... 1
1.1 Context of study ................................................................................................................ 1 1.2 Thesis objectives ............................................................................................................... 5 1.3 Statements of thesis ........................................................................................................... 6 1.4 Structure of thesis .............................................................................................................. 7
Chapter 2: Overview of recommendations related to solar radiation ............................................ 9
2.1 Introduction ....................................................................................................................... 9 2.2 Theory of façade exposures ............................................................................................... 9 2.2.1 East façades exposures .................................................................................................... 10 2.2.2 South façades exposures .................................................................................................. 11 2.3 Theory of street orientations ............................................................................................ 14 2.3.1 North-south orientation of roads (east-west exposure of façades) .................................. 17 2.3.2 East-west orientation of roads (Exposure of south façades) ............................................ 19 2.3.3 Diagonal orientation of roads .......................................................................................... 19 2.3.4 Other orientation of roads ................................................................................................ 21 2.3.5 Heliothermic axis ............................................................................................................ 23 2.4 Theory of building outlines and streets ........................................................................... 23 2.4.1 Simplified building outlines ............................................................................................ 25 2.4.2 Mathematical formulations .............................................................................................. 31 2.5 Recommendations for courtyards .................................................................................... 37 2.6 Buildings: establishment and density questions .............................................................. 39 2.7 Backward solar radiation and visibility ........................................................................... 51 2.8 Conclusion ....................................................................................................................... 55
Chapter 3: Research methodology .................................................................................................. 57
3.1 Introduction ..................................................................................................................... 57 3.2 Assessment methodology ................................................................................................ 59 3.2.1 Ray tracing technique ...................................................................................................... 59 3.2.2 Radiosity method ............................................................................................................. 61 3.2.3 PPF simulation package (PRECis project file handler) ................................................... 63 3.2.4 Description of 3D Digital models of urban sites ............................................................. 66 3.3 3D Digital model set ........................................................................................................ 70 3.3.1 Scope and limitation of assessment method .................................................................... 70 3.3.2 Improvement of the modelisation procedure ................................................................... 74
Chapter 4: Global solar performance of case studies .................................................................... 77
4.1 Introduction ..................................................................................................................... 77 4.2 Matthaeus district, Basel, 47.55 latitude (Switzerland), .................................................. 81 4.2.1 Description of case study................................................................................................. 81 4.2.2 Description of 3D digital model ...................................................................................... 82 4.2.3 Solar performance indicators ........................................................................................... 86 4.3 Bellevaux district, Lausanne, 46.51 latitude (Switzerland) ........................................... 107 4.3.1 Description of case study............................................................................................... 107 4.3.2 Description of 3D digital model .................................................................................... 109 4.3.3 Solar performance indicators ......................................................................................... 113 4.4 Meyrin site, Geneva, 46.20 latitude (Switzerland) ........................................................ 123 4.4.1 Description of case study............................................................................................... 123 4.4.2 Description of 3D digital model .................................................................................... 124 4.4.3 Solar performance indicators ......................................................................................... 127 4.5 Les Pâquis 1&2 district, Geneva, 46.20 latitude (Switzerland) ..................................... 133
viii
4.5.1 Description of case study............................................................................................... 135 4.5.2 Description of 3D digital model .................................................................................... 135 4.5.3 Solar performance indicators ......................................................................................... 139 4.6 Tower Works‘ site, Leeds, 53.79 latitude (England) ..................................................... 142 4.6.1 Description of case study............................................................................................... 143 4.6.2 Description of 3D digital model .................................................................................... 145 4.6.3 Solar performance indicators ......................................................................................... 148 4.7 Eastern Quarry development, London, 51.49 latitude (England) .................................. 152 4.7.1 Description of case study............................................................................................... 153 4.7.2 Description of 3D digital model .................................................................................... 157 4.7.3 Solar performance indicators ......................................................................................... 160 4.8 Barra Funda and Luz districts, São Paulo, -23.53 latitude (Brazil) ............................... 170 4.8.1 Description of case studies ............................................................................................ 171 4.8.2 Description of 3D digital models .................................................................................. 173 4.8.3 Solar performance indicators ......................................................................................... 175 4.9 The Contemporary City of Three Million Inhabitants, Le Corbusier (1921-1922) ....... 187 4.9.1 Description of case study............................................................................................... 187 4.9.2 Description of 3D digital model .................................................................................... 191 4.9.3 Solar performance indicators ......................................................................................... 192 4.10 Conclusion ..................................................................................................................... 203
Chapter 5: Achievements and future outlook............................................................................... 231
5.1 Achievements ................................................................................................................ 231 5.2 Future Outlook .............................................................................................................. 232
Bibliography ...................................................................................................................................... 235
Curriculum Vitae .............................................................................................................................. 243
1
Chapter 1: Introduction
1.1 Context of study
The World is a rapidly changing and transforming place, so is the City. What will be the ecological
nature of the City of the Future?
Architectural design and urban planning are becoming more and more complex, both from a
technological and conceptual point of view. They involve numerous and different procedures and
demand new qualifications. The number of specialists required is growing: in the short term and in the
long term completely new occupations will be created. This is mainly due to the growth and the
transformation of the cities in the developed countries but also concerns, on a larger scale, their
expansion in the developing countries.
According to Joel Cohen1, the World will have to build one city of one million people every week for
the next 43 years to absorb the growth of world urban population. An immense rural exodus is
transforming the face of the planet. At the turn of the 19th century only 3 percent of the World was
urbanized. Since then, more than half of the 6.7 billions of human inhabitants has been living in towns,
as opposed to a mere third in 1950. Between now and the year 2030 this proportion will be approaching
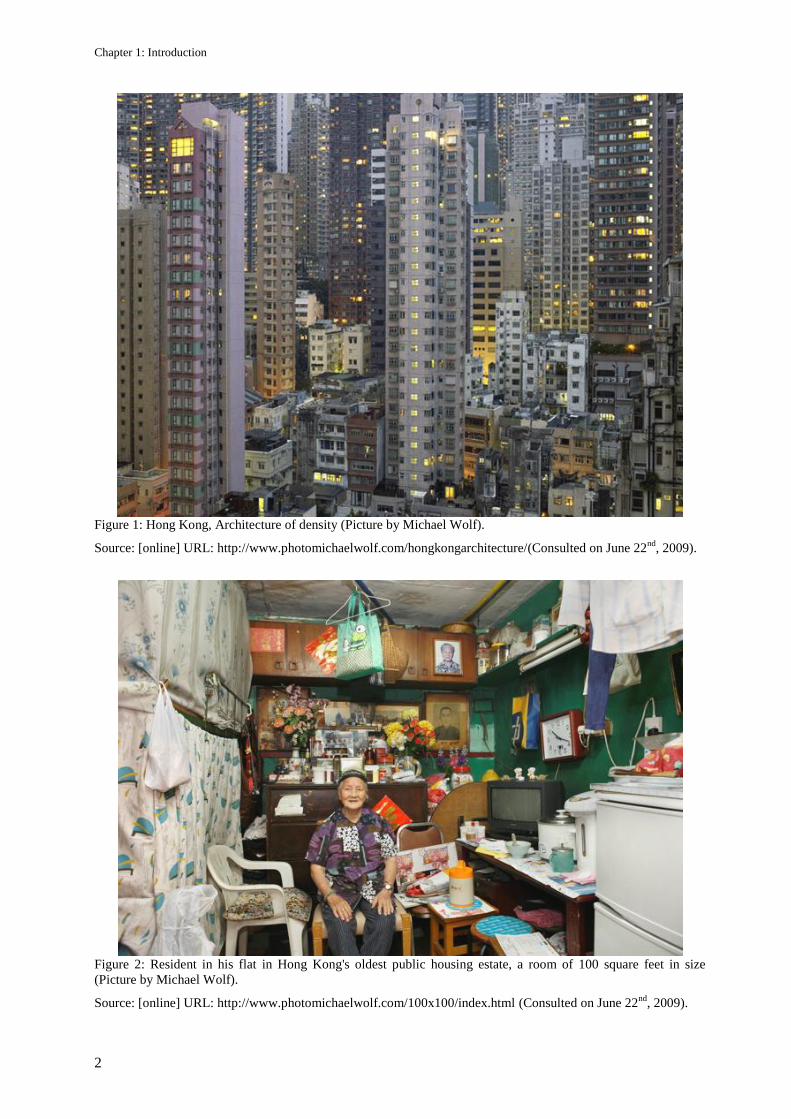
two thirds. In 2009, a total of 20 cities are hosting more than 10 million inhabitants. Today, cities like
London, Paris, Berlin, São Paulo, New York, Tokyo, Beijing and Hong Kong each have several million
inhabitants (see Figure 1 and Figure 2). How is it possible to control their energy consumption, the
movement of people, the sewage, the waste processing, and above all the phenomenon of urban sprawl?
The problem is even more exacerbated by the fact that two thirds of the World‘s urban population are
concentrated in the developing countries.
From the point of view of sustainable development, the model of the compact city is considered a
desirable goal. However, for a large part of the population, this density has a negative connotation and
has become synonymous with large, cramped, built-up areas that have produced significant numbers of
overshadowed spaces. There are also the attendant evils of noise and air pollution plus a lack of
visibility due to obstructions. The idea of the compact city is also frequently associated with the huge
blocks constructed during the 20th century which have been severely criticised for their lack of security,
their monotony and the feelings of anonymity which they provoke (Marchand, Montavon et al. 2008).
Grégoire Allix (Allix 2009) declares that in the area of climate change the cities are not the problem but
the solution. A compact city which combines housing and activities and which is served by public
transit is less polluting than secluded individual housing which relies to a large extent on the
automobile. The correlation between weak urban density and the elevated emissions of CO2 per
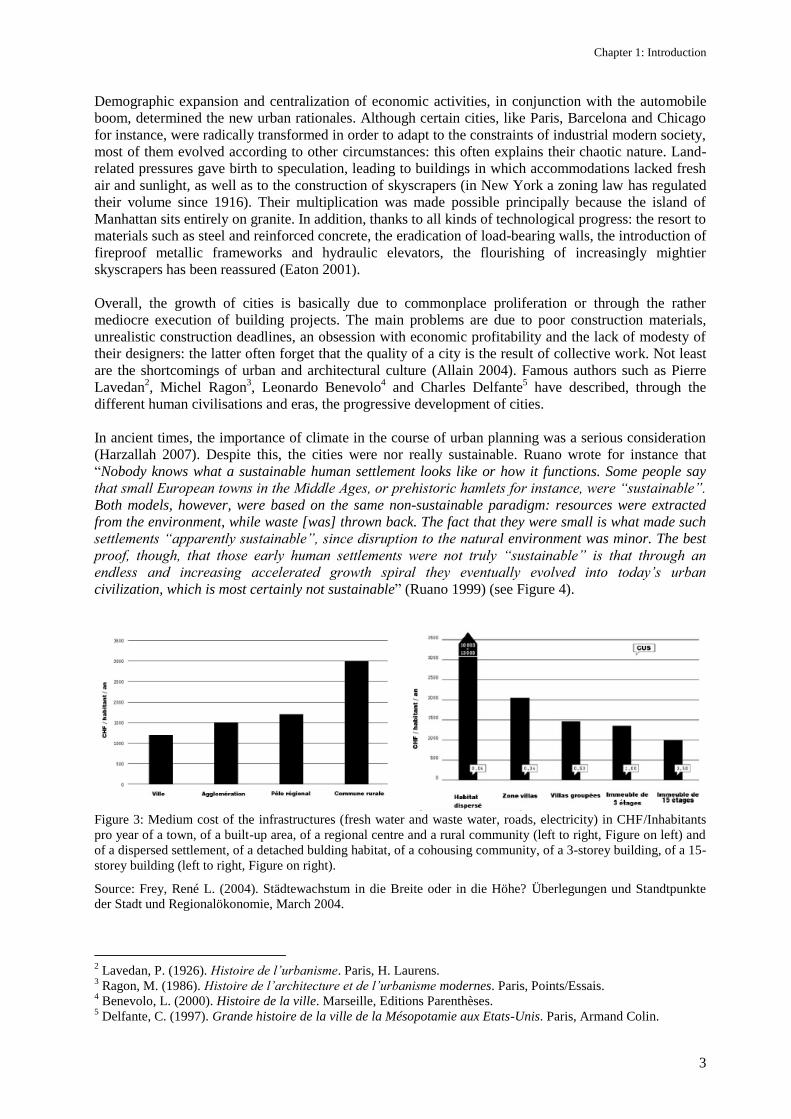
inhabitant has been demonstrated by Professor René Frey (see Figure 3). The lighting and heating of
buildings produces a quarter of the World‘s greenhouse effect gases, according to the estimates of the
World Bank, transportation counts for a third of the waste of built-up areas. Transportation is
responsible for 60% of the CO2 emissions in São Paulo as opposed to 20% in London or New York,
which are both well served by the underground rail system. In the United States, a country of residential
sprawl, the dense city remains a challenge, while the total area of the hundred largest built-up spaces in
the country has increased by 82% between 1970 and 1990.
1 Head of the Laboratory of Populations at the Rockefeller University and Columbia University.
Chapter 1: Introduction
2
Figure 1: Hong Kong, Architecture of density (Picture by Michael Wolf).
Source: [online] URL: http://www.photomichaelwolf.com/hongkongarchitecture/(Consulted on June 22nd
, 2009).
Figure 2: Resident in his flat in Hong Kong's oldest public housing estate, a room of 100 square feet in size
(Picture by Michael Wolf).
Source: [online] URL: http://www.photomichaelwolf.com/100x100/index.html (Consulted on June 22nd
, 2009).
Chapter 1: Introduction
3
Demographic expansion and centralization of economic activities, in conjunction with the automobile
boom, determined the new urban rationales. Although certain cities, like Paris, Barcelona and Chicago
for instance, were radically transformed in order to adapt to the constraints of industrial modern society,
most of them evolved according to other circumstances: this often explains their chaotic nature. Land-
related pressures gave birth to speculation, leading to buildings in which accommodations lacked fresh
air and sunlight, as well as to the construction of skyscrapers (in New York a zoning law has regulated
their volume since 1916). Their multiplication was made possible principally because the island of
Manhattan sits entirely on granite. In addition, thanks to all kinds of technological progress: the resort to
materials such as steel and reinforced concrete, the eradication of load-bearing walls, the introduction of
fireproof metallic frameworks and hydraulic elevators, the flourishing of increasingly mightier
skyscrapers has been reassured (Eaton 2001).
Overall, the growth of cities is basically due to commonplace proliferation or through the rather
mediocre execution of building projects. The main problems are due to poor construction materials,
unrealistic construction deadlines, an obsession with economic profitability and the lack of modesty of
their designers: the latter often forget that the quality of a city is the result of collective work. Not least
are the shortcomings of urban and architectural culture (Allain 2004). Famous authors such as Pierre
Lavedan2, Michel Ragon
3, Leonardo Benevolo
4 and Charles Delfante
5 have described, through the
different human civilisations and eras, the progressive development of cities.
In ancient times, the importance of climate in the course of urban planning was a serious consideration
(Harzallah 2007). Despite this, the cities were nor really sustainable. Ruano wrote for instance that
―Nobody knows what a sustainable human settlement looks like or how it functions. Some people say
that small European towns in the Middle Ages, or prehistoric hamlets for instance, were “sustainable”.
Both models, however, were based on the same non-sustainable paradigm: resources were extracted
from the environment, while waste [was] thrown back. The fact that they were small is what made such
settlements “apparently sustainable”, since disruption to the natural environment was minor. The best
proof, though, that those early human settlements were not truly “sustainable” is that through an
endless and increasing accelerated growth spiral they eventually evolved into today’s urban
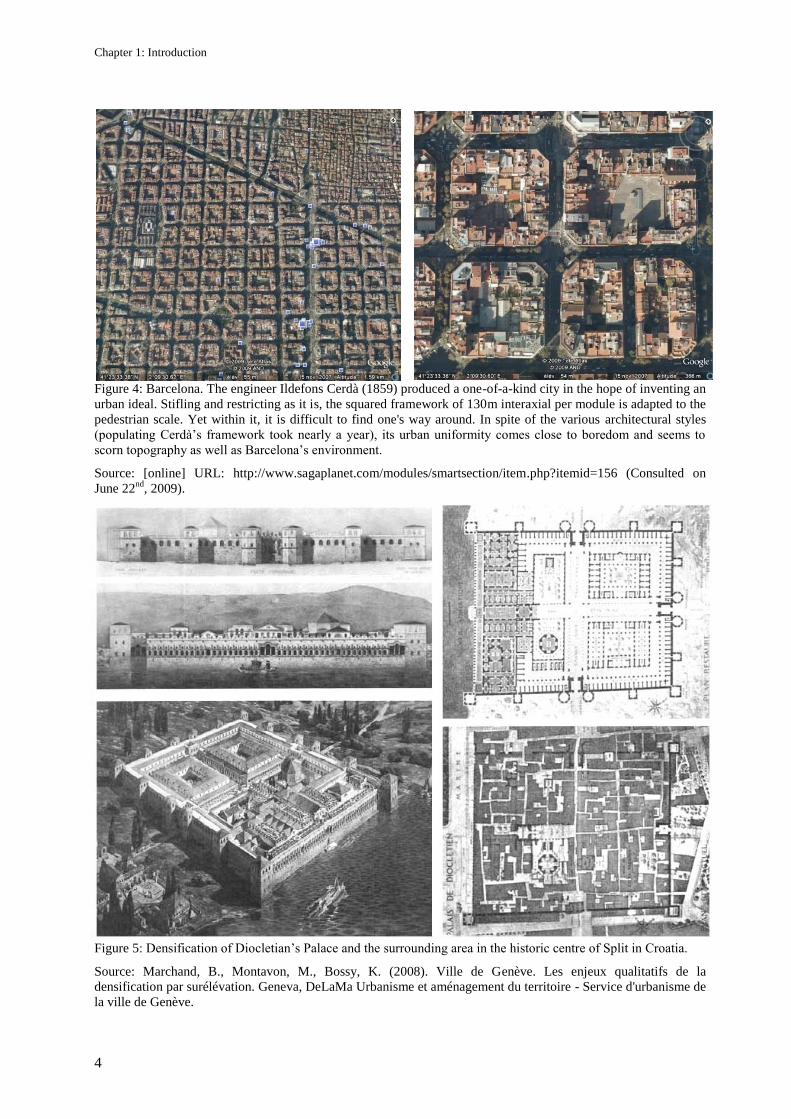
civilization, which is most certainly not sustainable‖ (Ruano 1999) (see Figure 4).
Figure 3: Medium cost of the infrastructures (fresh water and waste water, roads, electricity) in CHF/Inhabitants
pro year of a town, of a built-up area, of a regional centre and a rural community (left to right, Figure on left) and
of a dispersed settlement, of a detached bulding habitat, of a cohousing community, of a 3-storey building, of a 15-
storey building (left to right, Figure on right).
Source: Frey, René L. (2004). Städtewachstum in die Breite oder in die Höhe? Überlegungen und Standtpunkte
der Stadt und Regionalökonomie, March 2004.
2 Lavedan, P. (1926). Histoire de l’urbanisme. Paris, H. Laurens.
3 Ragon, M. (1986). Histoire de l’architecture et de l’urbanisme modernes. Paris, Points/Essais.
4 Benevolo, L. (2000). Histoire de la ville. Marseille, Editions Parenthèses.
5 Delfante, C. (1997). Grande histoire de la ville de la Mésopotamie aux Etats-Unis. Paris, Armand Colin.
Chapter 1: Introduction
4
Figure 4: Barcelona. The engineer Ildefons Cerdà (1859) produced a one-of-a-kind city in the hope of inventing an
urban ideal. Stifling and restricting as it is, the squared framework of 130m interaxial per module is adapted to the
pedestrian scale. Yet within it, it is difficult to find one's way around. In spite of the various architectural styles
(populating Cerdà‘s framework took nearly a year), its urban uniformity comes close to boredom and seems to
scorn topography as well as Barcelona‘s environment.
Source: [online] URL: http://www.sagaplanet.com/modules/smartsection/item.php?itemid=156 (Consulted on
June 22nd
, 2009).
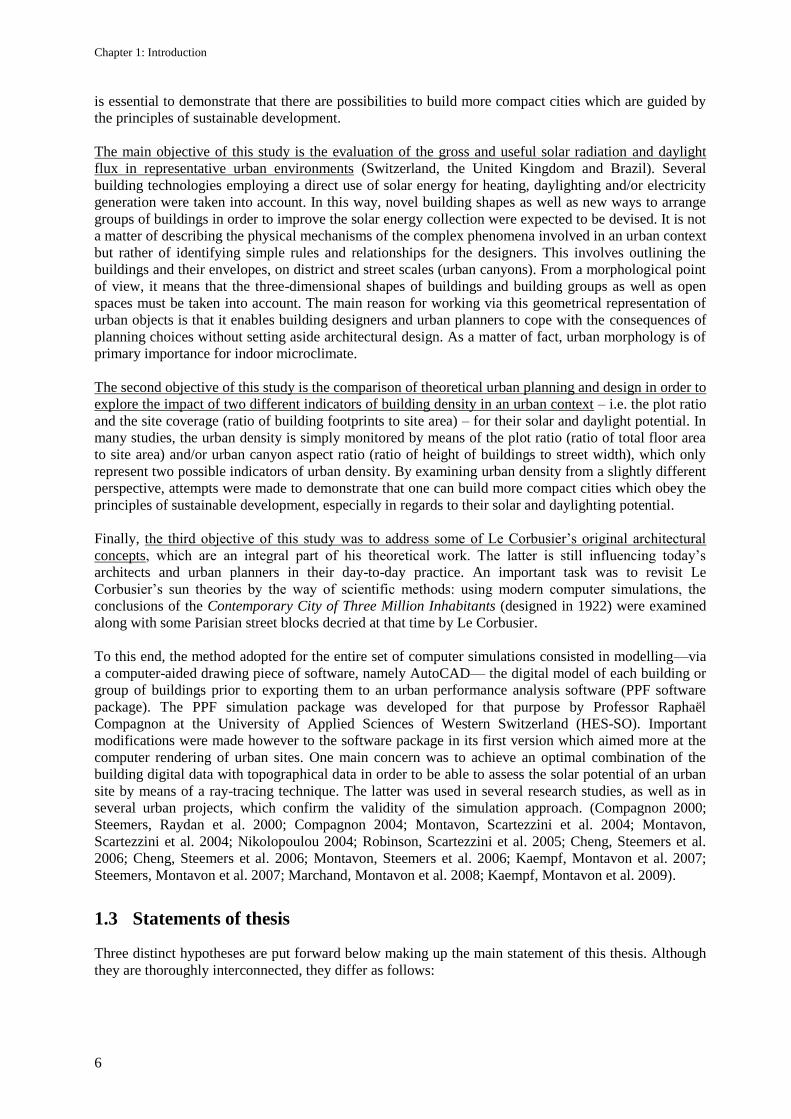
Figure 5: Densification of Diocletian‘s Palace and the surrounding area in the historic centre of Split in Croatia.
Source: Marchand, B., Montavon, M., Bossy, K. (2008). Ville de Genève. Les enjeux qualitatifs de la
densification par surélévation. Geneva, DeLaMa Urbanisme et aménagement du territoire - Service d'urbanisme de
la ville de Genève.

Chapter 1: Introduction
5
On the other hand, according to Professor Bruno Marchand (Marchand, Montavon et al. 2008), the
ancient arenas of Arles (France) as well as the town centre of Split (Croatia) are beautiful examples of
the densification of successful, existing infrastructures. The historic centre of Split is remarkable for
having been built on the inside and then around the Diocletian‘s Palace (see Figure 5). This case is an
important reference point in the histiography of urbanism and of architecture, especially during the
period of modernity in the 20th century. It has often illustrated the famous motto of the Italian architect,
Leon Battista Alberti6, that: ―One’s house is a small city, and a city has the qualities of a big house‖.
However, in Alberti‘s day, towns were very different from ours at the present time.
Before the 18th century, medieval cities suffered from the noxious atmosphere of intramural districts,
due to a ―passive attitude‖ towards the urban microclimate, but also because of military constraints. By
the Enlightenment, these constraints turned into an ―interventionist attitude‖ reflected by the
transformation of urban planning. The Enlightenment‘s philosophers and writers often viewed the city
as a sick body (urban pathology attracted illness, begging, prostitution, filth and bad air). Medieval
districts, with their narrow, twisted streets, flanked by towering edifices, were notorious for retaining
noxious air and blocking out the sunlight. The medical findings of the French chemist-biologist Louis
Pasteur and the German physician-biologist Robert Koch demonstrated the impact of the human
environment on the tuberculosis bacillus: they showed how sunlight could kill the germs. Housing thus
became part of a social prophylaxis of tuberculosis, described as the illness of darkness. In this specific
context, architects and urban planners began to take account of solar radiation in their architecture and
urban design. Therefore, an emphasis on the sun took place in these two areas (Harzallah 2007).
Solar visualisations became as a consequence the object of numerous investigations undertaken by
builders as soon as they became interested in the effect of sunlight on their buildings. Egyptian temples,
the Parthenon in Athens, the Pantheon in Rome, as well as the shadow tracings of Leonardo da Vinci
are examples of these novel attitudes. The military need for observation points from or through their
edifices was certainly another reason: medieval loopholes, lookout towers, stone curtain walls on
castles, etc. Famous architects and engineers have even designed buildings using solar ray tracings
although it is difficult to ascertain whether these tracings, found on certain technical drawings were used
before the design stage or after the completion of the project (Houpert 2006). Even in the literature of
the last century, the Techniques and Architecture journal (Massé 1943) devoted the entire double issue
7th-8
th of July-August 1943 to solar ray tracing. A description of methods known in the middle of the
twentieth century is given in the latter; the state of the art in this field was already very advanced at that
time. For that reason, a new and better adapted organisation of the city was progressively developed,
which seeks to reach a genuine symbiosis between the natural and urban environment of the future.
1.2 Thesis objectives
This thesis aims to promote sustainable urban architecture by allowing a better direct use of solar
technologies in the urban environment: this includes passive and active solar technologies, buildings
which integrate photovoltaic (BIPV) and daylighting design. The increasing development of cities and
metropolises is a key factor in the energy consumption of housing in Switzerland as well as in the rest
of the World. Recent developments in the use of energy in rational building, such as in energy
efficiency and, the use of renewable energy, cannot easily be applied in the urban context: high-density
land use, urban-related constraints (building regulations) and socio-cultural constraints (protection of
the architectural heritage) impose limits on urban-specific conditions, which tend to reduce the
possibilities for the direct use of solar energy (buildings that cast shadows, inappropriate surface
orientation, etc). Solar radiation control is related to urban geometry: it concerns the key players from
the building sector who deal with urban forms (architects, engineers, urban planners). If one wishes to
preserve the natural environment and cope at the same time with the continuing demand for housing, it
6 Leon Battista Alberti (February 18, 1404 – April 20, 1472) was an Italian author, artist, architect, poet, priest,
linguist, philosopher, and cryptographer, and general Renaissance humanist polymath.
Chapter 1: Introduction
6
is essential to demonstrate that there are possibilities to build more compact cities which are guided by
the principles of sustainable development.
The main objective of this study is the evaluation of the gross and useful solar radiation and daylight
flux in representative urban environments (Switzerland, the United Kingdom and Brazil). Several
building technologies employing a direct use of solar energy for heating, daylighting and/or electricity
generation were taken into account. In this way, novel building shapes as well as new ways to arrange
groups of buildings in order to improve the solar energy collection were expected to be devised. It is not
a matter of describing the physical mechanisms of the complex phenomena involved in an urban context
but rather of identifying simple rules and relationships for the designers. This involves outlining the
buildings and their envelopes, on district and street scales (urban canyons). From a morphological point
of view, it means that the three-dimensional shapes of buildings and building groups as well as open
spaces must be taken into account. The main reason for working via this geometrical representation of
urban objects is that it enables building designers and urban planners to cope with the consequences of
planning choices without setting aside architectural design. As a matter of fact, urban morphology is of
primary importance for indoor microclimate.
The second objective of this study is the comparison of theoretical urban planning and design in order to
explore the impact of two different indicators of building density in an urban context – i.e. the plot ratio
and the site coverage (ratio of building footprints to site area) – for their solar and daylight potential. In
many studies, the urban density is simply monitored by means of the plot ratio (ratio of total floor area
to site area) and/or urban canyon aspect ratio (ratio of height of buildings to street width), which only
represent two possible indicators of urban density. By examining urban density from a slightly different
perspective, attempts were made to demonstrate that one can build more compact cities which obey the
principles of sustainable development, especially in regards to their solar and daylighting potential.
Finally, the third objective of this study was to address some of Le Corbusier‘s original architectural
concepts, which are an integral part of his theoretical work. The latter is still influencing today‘s
architects and urban planners in their day-to-day practice. An important task was to revisit Le
Corbusier‘s sun theories by the way of scientific methods: using modern computer simulations, the
conclusions of the Contemporary City of Three Million Inhabitants (designed in 1922) were examined
along with some Parisian street blocks decried at that time by Le Corbusier.
To this end, the method adopted for the entire set of computer simulations consisted in modelling—via
a computer-aided drawing piece of software, namely AutoCAD— the digital model of each building or
group of buildings prior to exporting them to an urban performance analysis software (PPF software
package). The PPF simulation package was developed for that purpose by Professor Raphaël
Compagnon at the University of Applied Sciences of Western Switzerland (HES-SO). Important
modifications were made however to the software package in its first version which aimed more at the
computer rendering of urban sites. One main concern was to achieve an optimal combination of the
building digital data with topographical data in order to be able to assess the solar potential of an urban
site by means of a ray-tracing technique. The latter was used in several research studies, as well as in
several urban projects, which confirm the validity of the simulation approach. (Compagnon 2000;
Steemers, Raydan et al. 2000; Compagnon 2004; Montavon, Scartezzini et al. 2004; Montavon,
Scartezzini et al. 2004; Nikolopoulou 2004; Robinson, Scartezzini et al. 2005; Cheng, Steemers et al.
2006; Cheng, Steemers et al. 2006; Montavon, Steemers et al. 2006; Kaempf, Montavon et al. 2007;
Steemers, Montavon et al. 2007; Marchand, Montavon et al. 2008; Kaempf, Montavon et al. 2009).
1.3 Statements of thesis
Three distinct hypotheses are put forward below making up the main statement of this thesis. Although
they are thoroughly interconnected, they differ as follows:
Chapter 1: Introduction
7
Hypothesis 1: The shape and spatial layout of the buildings can considerably improve their solar
energy incomes.
Environmental issues tend to be increasingly taken into consideration in architectural practice.
Nevertheless, these do not necessarily provide the most suitable solutions for solar design. Institutions,
policies and other interested parties favour a rational use of energy without questioning the urban
layout.
Hypothesis 2: High density does not always reduce the utilization potential of solar energy in an
urban context.
The environmental impact is always a concern when urban densification is envisaged, because the
densification of the urban fabric is generally supposed to impair the daylighting and solar energy use
within buildings.
Hypothesis 3: The Contemporary City of Three Million Inhabitants would not offer the expected
quality of solar exposure claimed by Le Corbusier at that earlier time.
Beyond his thoughts focussed on the energy of the Sun, Le Corbusier seemingly aspired to a thorough
and global reform of the urban fabric. This implied the definition of a new urban texture, opposing the
existing one, and putting forward some hygienist concepts (or dictates), in compliance with the urban
ideas of his day, but lacking scientific rationality.
A series of case studies chosen from around the World will be used to support these hypotheses and to
demonstrate their validity.
1.4 Structure of thesis
The current thesis report is made of three main parts, at the end of which a conclusion appears.
Chapter 2 presents the main solar-based approaches that appeared in the 18th and the 19
th centuries
during the development of architectural processes. These prescriptions dealt with façade exposure, street
orientation, building outlines, building shape and devices. Moreover, relevant studies that have been
published as late as 2009 are classified. Also presented are the various models, developed in order to
integrate solar and visual constraints within the framework of architectural and urban studies.
Chapter 3 is devoted to the presentation of the research methodology. In particular, it sets out an
overview of the most frequently used techniques in computer graphics and in the simulation of urban
sites. The different approaches recently developed in order to decide the geometrical features of
architectural and urban residential projects are also explained.
Chapter 4 sets the scene for the thesis work by describing the Swiss, British and Brazilian urban sites
used within this study. Details of the computer 3D digitizing methods used for the urban sites
considered in this thesis are also provided, as well as the renderings generated and the analysis of results
carried out with the use of the PPF software package. There is a discussion of the results of the various
city models and generic forms of urban sites. In addition, for an investigation of urban design, the
Contemporary City of Three Million Inhabitants is described in order to assess Le Corbusier‘s
propositions and to question whether the Contemporary City could in fact increase the urban capacity
and at the same time improve the urban environment and the efficiency of the city. A summary of
lessons learnt from the comparison of the different urban designs is presented in conclusion.
Chapter 5 concludes the thesis by summarizing the main achievements. It suggests different
application fields and alternative directions for a further development of this study.

9
Chapter 2: Overview of recommendations related to solar radiation
2.1 Introduction
Which urban form is the healthiest and which offers the best all-season access to the sun?
Since the early19th century the answers to both of these questions have been considered as one and the
same – by many architects, by medical practitioners and above all by the hygienists. The movement
called Hygienism began in England which also witnessed the birth of the Industrial Revolution. The
workers who operated the ―dark Satanic mills‖ described by the poet William Blake7 were housed in
conditions not much healthier than the ―mills‖ themselves. The hygienists would advocate social
protection laws and also emphasize the importance of sunlight in urban planning. Guided by their
principles, architects, scientists, physicians and experts in many fields would struggle to produce urban
designs which offered the best exposure to solar radiation.
This chapter examines various architectural designs and gives concrete examples of architectural design
bases that have appeared since the nineteenth century and which were especially supported by medical
practitioners and hygienists.
The study works have been gathered into five categories presented chronologically, following the detail
below:
- Theory of façades exposure;
- Theory of orientation of streets;
- Theory of building outlines and streets;
- Recommendations for courtyards;
- Buildings: establishment and density questions.
The approach adopted is not comprehensive, it does not follow the chronological manner of the
historian, and it is not the present writer‘s own invention. For this particular approach, a debt is owed to
the Ph.D. work of Dr Amina Harzallah, who has generously allowed her own method for listing the
great contributors in this field to serve as a guide. This chapter in the present thesis contains a
drastically briefer summary than Dr Harzallah's of those authors who have developed theories about
architecture design and health from 1753 until 1954.
The great milestones have been grouped by Harzallah into the period of one century. For example, the
scientific interest in the solar exposure of buildings is at its most intense at the very beginning of the
twentieth century. The second milestone is the discovery of penicillin in 1928 and its mass production
by the late 1940‘s. There is also the era of a rapid reconstruction after the First World War. All of these
crucial events have been condensed into a period which corresponds to the hygienist movement which is
a phenomenon of the late 19th and the early 20
th centuries. History is not tidy and compartmentalized
and the writings and ideas of experts on architecture and engineering do not follow a straight line.
Moreover, the approach taken by this work makes it possible to examine and classify relevant studies
that have been published as late as 2009. The various scientific models and pieces of software
implemented in order to appraise a given urban or architectural design are included in Section 2.7.
2.2 Theory of façade exposures
The different and frequently recommended façade exposures theories varied from east to south because
of the confusion and contradictions pertaining to sun-related ideas.
7 William Blake (28 November 1757 – 12 August 1827) was an English poet, painter, and printmaker.
Chapter 2: Overview of recommendations related to solar radiation
10
2.2.1 East façades exposures
East exposure supporters referred to Vitruvius‘ ideas and to Dr Adolphe Vogt‘s works (1885). Vitruvius
feared heat waves and stated that cities ―in the Summer, in south-exposed locations, the Sun is especially
hot the minute it rises, and burning hot at noon […] so that health is highly affected by these sudden
changes from hot to cold‖ (see Figure 6). Table 1 gives a chronological list of the authors of east façade
orientation theories, together with the mentors8 who guided them in their choices.
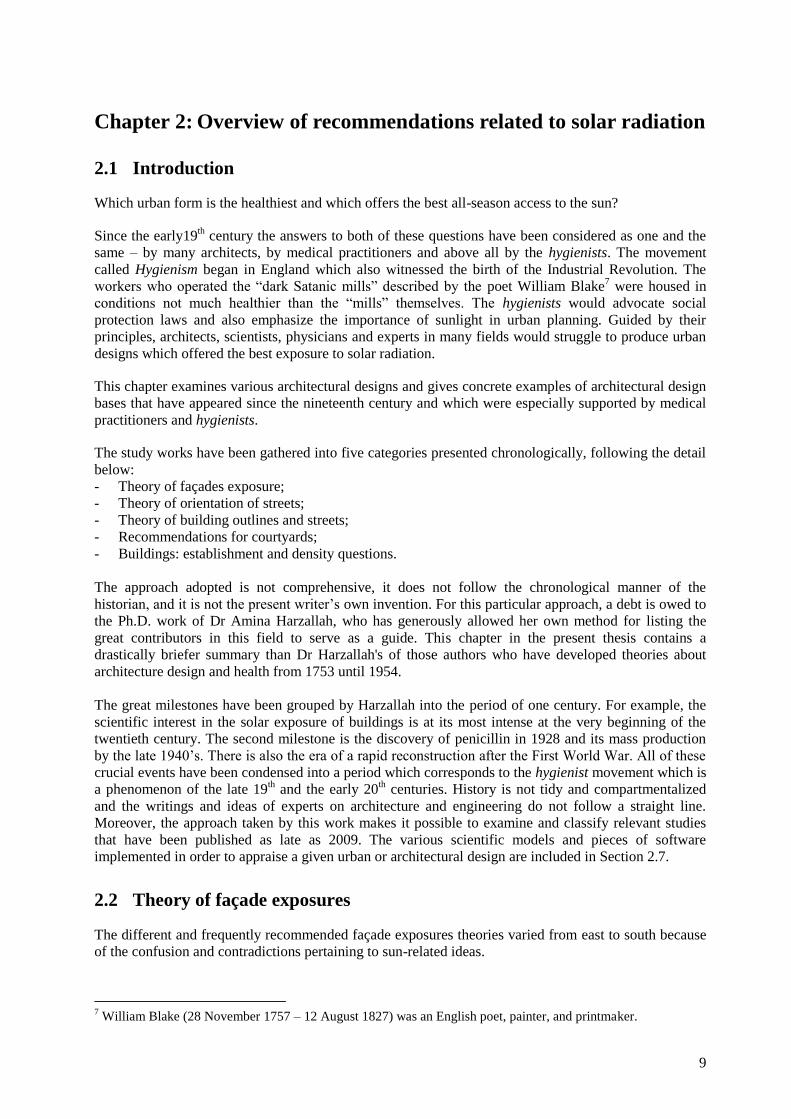
Figure 6: Fra Giocondo (attr.). Vitruvian city.
Source: Eaton, R. (2001). Cités idéales, L'utopisme et l'environnement (non) bâti. Anvers, Fonds Mercator.
Table 1: East façades exposure authors
Theories Years Authors
East Exposure mentors
4th Century B.C. – Hippocrates
1st. Century B.C. – Marcus Vitruvius Pollio
East Exposure authors
1844/1897 – Isidore Bourdon
1846 – Jean-Baptiste Monfalcon
1846 – Isidore-Augustin-Pierre de Polinière
1869 – Michel Lévy (+ west exposure)
1885 – Adolphe Vogt
1886/1887/1905/1887 – Emile Trélat (east + west both in moderate countries)
1887 – Emile Clément (+ south and west)
1838 – Pierre-Adolphe Piorry
1897 – Achille Bourbon
1911 – M. Bousquet
1913 – Cloquet & Cobbaert (+ south-east)
Piorry‘s recommendations (1831) are vague, but reflect Vitruvius‘ precepts. According to Bourdon
(1844), openings must be exposed in an eastern direction to take advantage of the first sunrays and the
cleanest air. Monfalcon and de Polinière (1846) relate this exposure to moods and healthiness. Bourbon
(1897) recommends this exposure as a trade-off between health factors, drying and heat. Bousquet
(1869) reports that Lévy (1911), after having studied the advantages and shortcomings of each
exposure, finally advised east and west exposures. Trélat (1886), who relied on Vogt‘s works (1885),
considered east and west to be the most favourable exposures for temperate climates. He also
recommends an east-west orientation for northern countries and a north-south orientation for southern
countries. Arguments put forward by Trélat announce the new concerns related to sunlight and heat,
thought of as microbicide elements. Vogt (1885) ascertains that an east-oriented façade receives more
heat than a west-oriented façade, which in turn receives more heat than a south façade. He proves that
the south façade captures sunbeams very obliquely, which hit the ground vertically. Clément (1887) is
reservedly inspired by Vogt‘s works. He explains that the results obtained by Vogt do not take seasons
into account and that in Winter he probably would have come to different conclusions. Clement deems
8 Mentor, a wise and trusted counselor or teacher.
Chapter 2: Overview of recommendations related to solar radiation
11
all orientations as suitable except north. Cloquet and Cobbaert advocate east orientation, which they
rank equal to south-east.
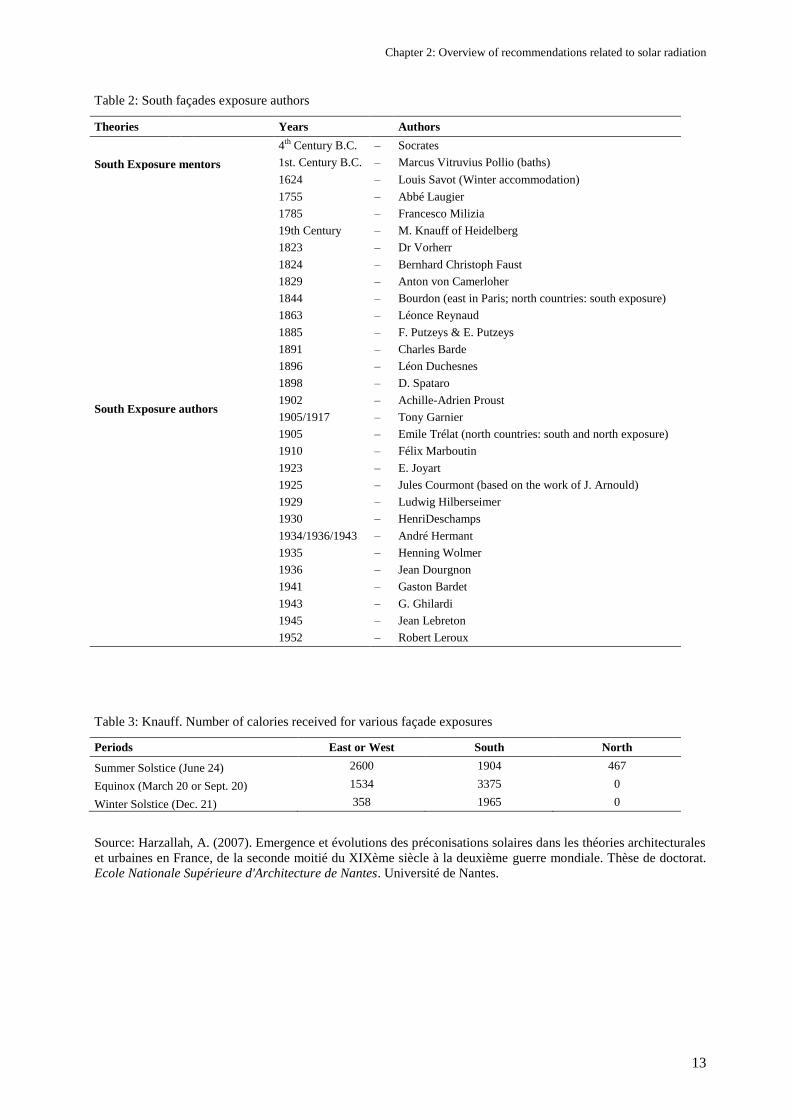
2.2.2 South façades exposures
Table 2 gives a chronological list of the authors of south façade orientation theories, together with the
mentors who guided them in their choices. Those authors who do recommend south-orientated façades
were influenced by the plan of the baths of Vitruvius, by Socrates and by the German pioneer on health
research, Dr Bernhard Faust (1824). Faust‘s9 doctrine, the origin of which von Camerloher (1829)
attributes to Socrates, advised the orientation of housings toward southern light. Various housings were
built in Germany following this principle thanks to Dr Vorherr (1823). South exposure supporters relied
on a more scientific basis, via the measurement of the quantity of heat received by a surface as a
function of its orientation by means of the use of the actinometer10
. In the 19th century, Dr Knauff of
Heidelberg was the first to reveal mathematically and physically the quantity of solar heat received by a
south façade (see Table 3). Knauff does not specify for what latitude he made the experimentation;
Harzallah (Harzallah 2007) assumes that it is for the city of Heidelberg (49°25'0" north) in Germany.
However, these planners reveal more subtlety of thought than a mere ―blanket‖ acceptance of southern
exposure. Renaud (1863) generally supports the south orientation with the qualification that room
occupancies might determine a different orientation. Garnier (1905), one of the great trailblazers of
urban planning, devises a project with an original pecked-line-building layout enabling proper
daylighting and proper ventilation. Barde (1891), a Swiss architect, shows a deeper reasoning with his
study of street orientation in an urban context, where common houses have two exposed faces. He also
recommends that only the main rooms of a housing located in Central Europe should be exposed to the
south.
More emphatically, Marboutin (1910) uses the evidence of nebulosity and radiations of the sky vault to
prove that façades facing streets, as well as main façades of isolated buildings, must face south to
provide optimal housing conditions: heat in Winter and cool in Summer. In Marboutin‘s view, the most
favourable exposure is at an angle between 60° and 75° with the meridian (see Figure 7).
In fact, Marboutin‘s name is constantly mentioned by the supporters of the south exposure, particularly
by Deschamps (1930), Dourgnon (1936), Hermant (1934/1943), Bardet (1941), Lebreton (1945) and
Leroux (1952). Leroux, in particular, gives a general overview of Marboutin‘s works in relation to the
insolation of buildings in temperate climates.
In addition to Marboutin‘s studies, Hermant (1934/1935/1943) reported other investigations carried out
in Copenhagen by Wolmer, in the United States by the A.S.H.V.E11
and by the John B. Pierce
Foundation (1936). Lebreton (1945) refines Figure 8 drawn by Hermant and indicates orientation angles
that must not be exceeded at 42° north to benefit from a proper sunshine upon bright weather.
9 Instigator of the Sonnenbau, doctrine that advocates the search for sunshine in dwellings.
10 Term of physics. Instrument invented by M. Becquerel to measure intensities of different rays of the spectrum.
11 American Society of Heating and Ventilating Engineers (now part of American Society of Heating,
Refrigerating and Air-Conditioning Engineers).
Chapter 2: Overview of recommendations related to solar radiation
12
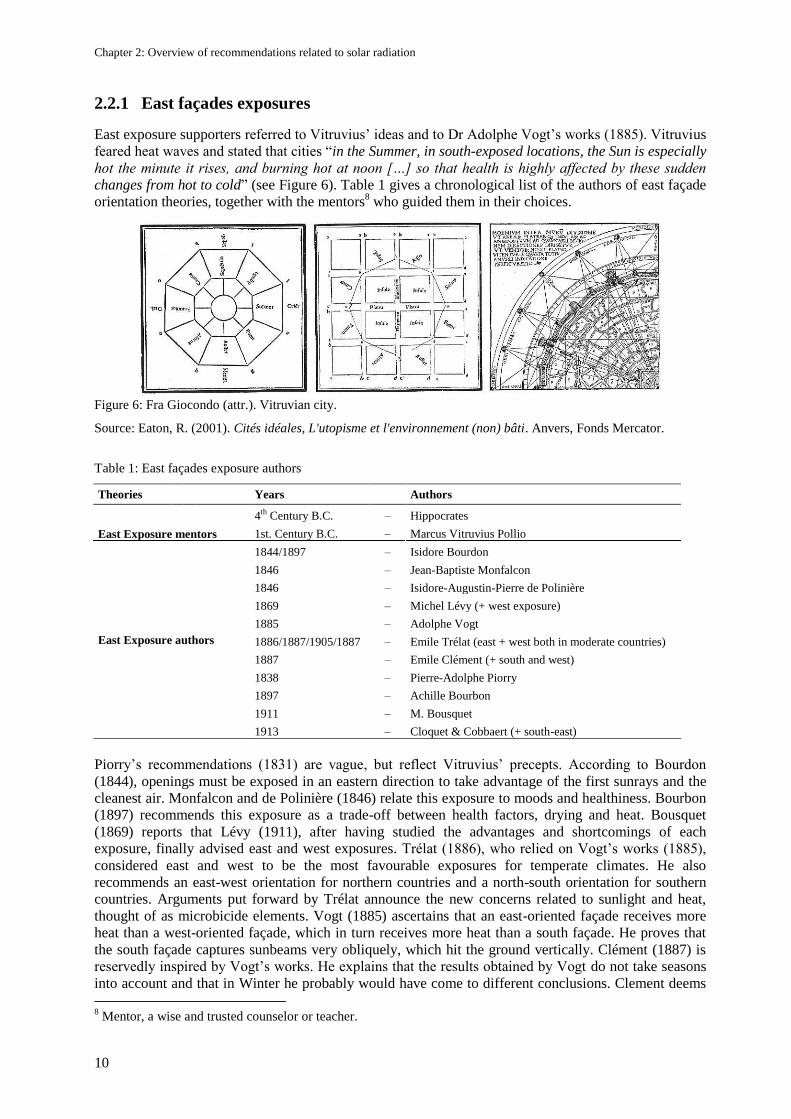
Figure 7: Félix Marboutin. Study of the influence of façade orientation on solar energy. Annual energy variations
are low for the case of the south exposure, intermediate for the south-east exposure and high for the east exposure.
Source: Harzallah, A. (2007). Emergence et évolutions des préconisations solaires dans les théories architecturales
et urbaines en France, de la seconde moitié du XIXème siècle à la deuxième guerre mondiale. Thèse de doctorat.
Ecole Nationale Supérieure d'Architecture de Nantes. Université de Nantes.
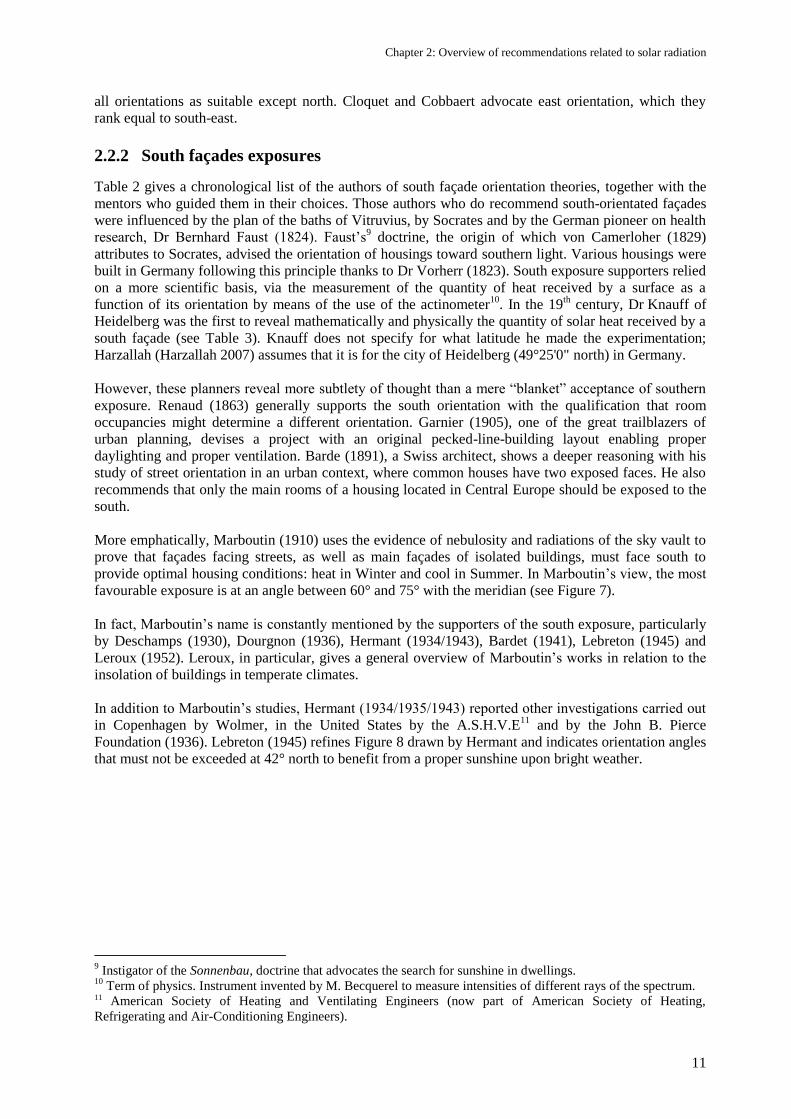
Figure 8: Jean Lebreton. Luminous intensity received by vertical walls, for all orientations, upon bright weather, at
42° north (according A.S.H.V.E and the John B. Pierce Foundation).
Source: Harzallah, A. (2007). Emergence et évolutions des préconisations solaires dans les théories architecturales
et urbaines en France, de la seconde moitié du XIXème siècle à la deuxième guerre mondiale. Thèse de doctorat.
Ecole Nationale Supérieure d'Architecture de Nantes. Université de Nantes.
Chapter 2: Overview of recommendations related to solar radiation
13
Table 2: South façades exposure authors
Theories Years Authors
South Exposure mentors
4th Century B.C. – Socrates
1st. Century B.C. – Marcus Vitruvius Pollio (baths)
South Exposure authors
1624 – Louis Savot (Winter accommodation)
1755 – Abbé Laugier
1785 – Francesco Milizia
19th Century – M. Knauff of Heidelberg
1823 – Dr Vorherr
1824 – Bernhard Christoph Faust
1829 – Anton von Camerloher
1844 – Bourdon (east in Paris; north countries: south exposure)
1863 – Léonce Reynaud
1885 – F. Putzeys & E. Putzeys
1891 – Charles Barde
1896 – Léon Duchesnes
1898 – D. Spataro
1902 – Achille-Adrien Proust
1905/1917 – Tony Garnier
1905 – Emile Trélat (north countries: south and north exposure)
1910 – Félix Marboutin
1923 – E. Joyart
1925 – Jules Courmont (based on the work of J. Arnould)
1929 – Ludwig Hilberseimer
1930 – HenriDeschamps
1934/1936/1943 – André Hermant
1935 – Henning Wolmer
1936 – Jean Dourgnon
1941 – Gaston Bardet
1943 – G. Ghilardi
1945 – Jean Lebreton
1952 – Robert Leroux
Table 3: Knauff. Number of calories received for various façade exposures
Periods East or West South North
Summer Solstice (June 24) 2600 1904 467
Equinox (March 20 or Sept. 20) 1534 3375 0
Winter Solstice (Dec. 21) 358 1965 0
Source: Harzallah, A. (2007). Emergence et évolutions des préconisations solaires dans les théories architecturales
et urbaines en France, de la seconde moitié du XIXème siècle à la deuxième guerre mondiale. Thèse de doctorat.
Ecole Nationale Supérieure d'Architecture de Nantes. Université de Nantes.
Chapter 2: Overview of recommendations related to solar radiation
14
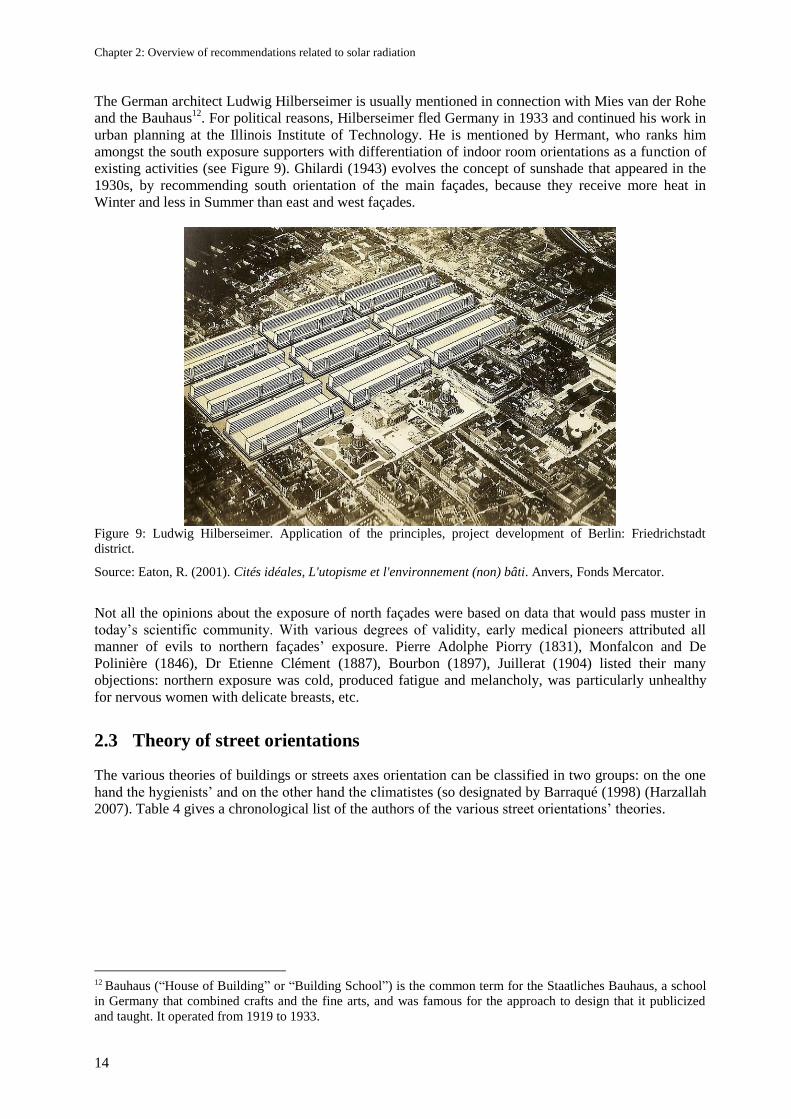
The German architect Ludwig Hilberseimer is usually mentioned in connection with Mies van der Rohe
and the Bauhaus12
. For political reasons, Hilberseimer fled Germany in 1933 and continued his work in
urban planning at the Illinois Institute of Technology. He is mentioned by Hermant, who ranks him
amongst the south exposure supporters with differentiation of indoor room orientations as a function of
existing activities (see Figure 9). Ghilardi (1943) evolves the concept of sunshade that appeared in the
1930s, by recommending south orientation of the main façades, because they receive more heat in
Winter and less in Summer than east and west façades.
Figure 9: Ludwig Hilberseimer. Application of the principles, project development of Berlin: Friedrichstadt
district.
Source: Eaton, R. (2001). Cités idéales, L'utopisme et l'environnement (non) bâti. Anvers, Fonds Mercator.
Not all the opinions about the exposure of north façades were based on data that would pass muster in
today‘s scientific community. With various degrees of validity, early medical pioneers attributed all
manner of evils to northern façades‘ exposure. Pierre Adolphe Piorry (1831), Monfalcon and De
Polinière (1846), Dr Etienne Clément (1887), Bourbon (1897), Juillerat (1904) listed their many
objections: northern exposure was cold, produced fatigue and melancholy, was particularly unhealthy
for nervous women with delicate breasts, etc.
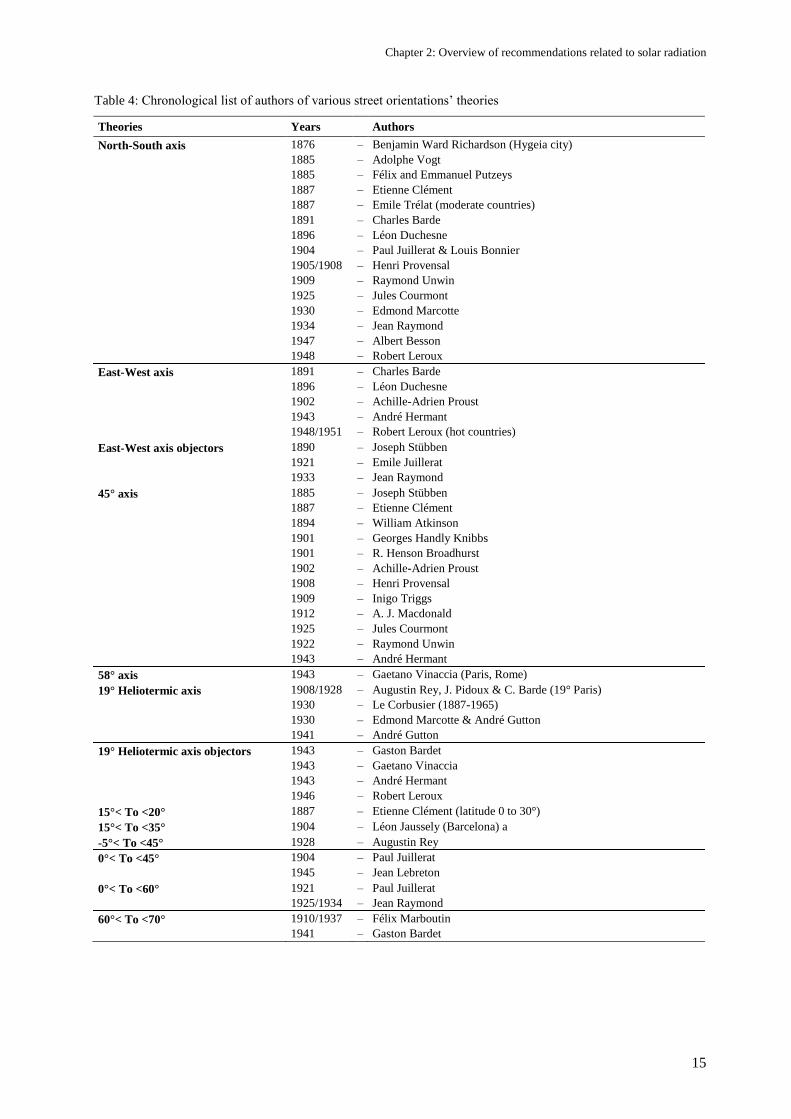
2.3 Theory of street orientations
The various theories of buildings or streets axes orientation can be classified in two groups: on the one
hand the hygienists‘ and on the other hand the climatistes (so designated by Barraqué (1998) (Harzallah
2007). Table 4 gives a chronological list of the authors of the various street orientations‘ theories.
12 Bauhaus (―House of Building‖ or ―Building School‖) is the common term for the Staatliches Bauhaus, a school
in Germany that combined crafts and the fine arts, and was famous for the approach to design that it publicized
and taught. It operated from 1919 to 1933.
Chapter 2: Overview of recommendations related to solar radiation
15
Table 4: Chronological list of authors of various street orientations‘ theories
Theories Years Authors
North-South axis 1876 – Benjamin Ward Richardson (Hygeia city)
1885 – Adolphe Vogt
1885 – Félix and Emmanuel Putzeys
1887 – Etienne Clément
1887 – Emile Trélat (moderate countries)
1891 – Charles Barde
1896 – Léon Duchesne
1904 – Paul Juillerat & Louis Bonnier
1905/1908 – Henri Provensal
1909 – Raymond Unwin
1925 – Jules Courmont
1930 – Edmond Marcotte
1934 – Jean Raymond
1947 – Albert Besson
1948 – Robert Leroux
East-West axis 1891 – Charles Barde
1896 – Léon Duchesne
1902 – Achille-Adrien Proust
1943 – André Hermant
1948/1951 – Robert Leroux (hot countries)
East-West axis objectors 1890 – Joseph Stübben
1921 – Emile Juillerat
1933 – Jean Raymond
45° axis 1885 – Joseph Stübben
1887 – Etienne Clément
1894 – William Atkinson
1901 – Georges Handly Knibbs
1901 – R. Henson Broadhurst
1902 – Achille-Adrien Proust
1908 – Henri Provensal
1909 – Inigo Triggs
1912 – A. J. Macdonald
1925 – Jules Courmont
1922 – Raymond Unwin
1943 – André Hermant
58° axis 1943 – Gaetano Vinaccia (Paris, Rome)
19° Heliotermic axis 1908/1928 – Augustin Rey, J. Pidoux & C. Barde (19° Paris)
1930 – Le Corbusier (1887-1965)
1930 – Edmond Marcotte & André Gutton
1941 – André Gutton
19° Heliotermic axis objectors 1943 – Gaston Bardet
1943 – Gaetano Vinaccia
1943 – André Hermant
1946 – Robert Leroux
15°< To <20° 1887 – Etienne Clément (latitude 0 to 30°)
15°< To <35° 1904 – Léon Jaussely (Barcelona) a
-5°< To <45° 1928 – Augustin Rey
0°< To <45° 1904 – Paul Juillerat
1945 – Jean Lebreton
0°< To <60° 1921 – Paul Juillerat
1925/1934 – Jean Raymond
60°< To <70° 1910/1937 – Félix Marboutin
1941 – Gaston Bardet
Chapter 2: Overview of recommendations related to solar radiation
16
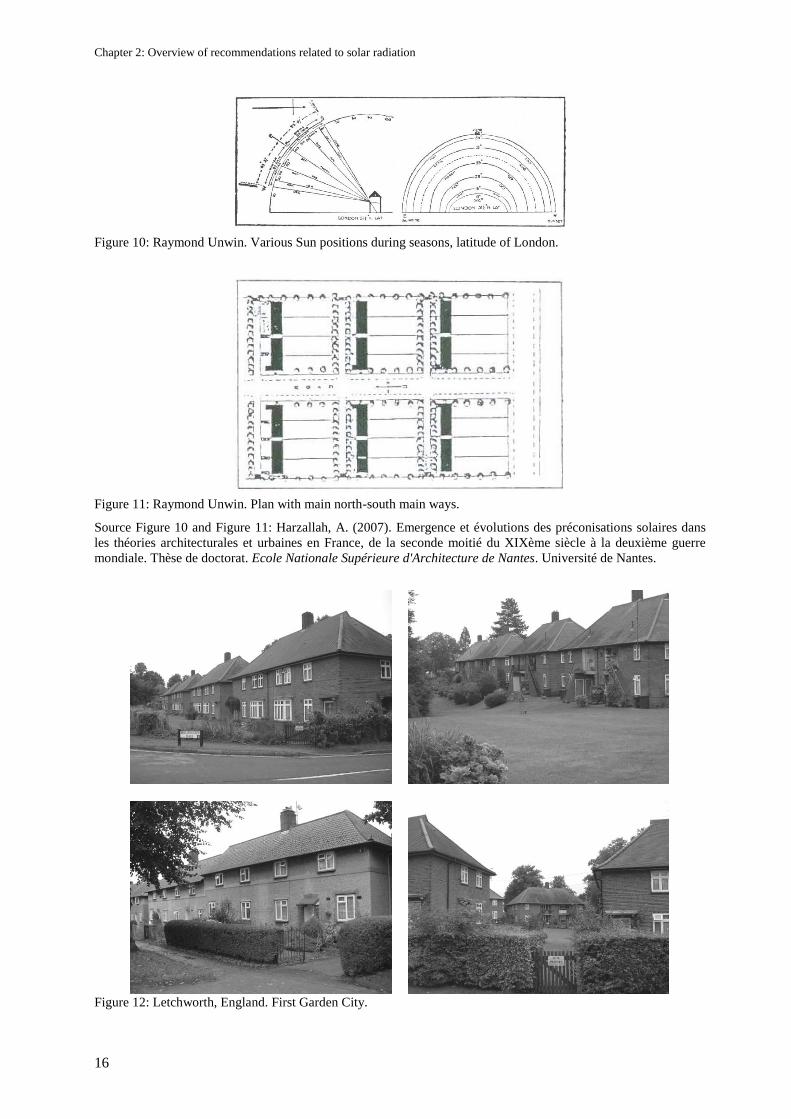
Figure 10: Raymond Unwin. Various Sun positions during seasons, latitude of London.
Figure 11: Raymond Unwin. Plan with main north-south main ways.
Source Figure 10 and Figure 11: Harzallah, A. (2007). Emergence et évolutions des préconisations solaires dans
les théories architecturales et urbaines en France, de la seconde moitié du XIXème siècle à la deuxième guerre
mondiale. Thèse de doctorat. Ecole Nationale Supérieure d'Architecture de Nantes. Université de Nantes.
Figure 12: Letchworth, England. First Garden City.
Chapter 2: Overview of recommendations related to solar radiation
17
2.3.1 North-south orientation of roads (east-west exposure of façades)
The first group to advocate the above orientation and exposure appears towards the second half of the
nineteenth century and is made up of physicians, engineers and a few architects. They espouse the ideas
of Dr Adolphe Vogt (1885) of Berne, who claimed that ―solar heat‖ would be uniformly distributed in
homes as a result of the north-south orientation of roads (east-west exposure of façades). This particular
orientation and exposure would, he insisted, provide a solar optimum with antimicrobial properties.
Vogt (1885) is cited in their research works by the Putzeys Brothers (1885), Dr Clément (1887), Trélat
(1887) and Duchesne (1896) in support of their choice of the north-south axis. Dr Richardson (1876), in
his utopia city model, Hygeia City13
, also lays out north-south-oriented streets.
Several French authors are equally enthusiastic supporters of this view, writers such as Juillerat &
Bonnier (1904) for instance. The architect Provensal (1905/1908) notes that sunbeams are almost
horizontal in Winter, oblique in Autumn and in Spring, whereas they are nearly vertical in Summer.
According to him, the almost horizontal beams are the most valuable since they are penetrating and not
very frequent in winter. Harzallah (Harzallah 2007) writes that Provensal, even though he claims to
have a scientific approach, ignores the shading of these low beams by buildings, whose height must be
studied. He also condemns the chequered American street system which would produce secondary roads
perpendicular to north-south roads and consequently lead to an inadvisable exposure to the north. To
him, buildings must be directed north-south axis in a way that allows the sun to scan destructively all
bacteria-infested zones.
Courmont (1925) considers that this axis (north-south) would provide the maximum of sunlight and
heat. The north-south axis is also favoured by Barde (1891), Juillerat & Bonnier (1904), Marcotte
(1930), Raymond (1934), Besson (1946) as well as Leroux (1948). Leroux bases his preference on the
study of the daily thermal alternation between both façades, tangible if the house is lightweight and
lessened if the house is of heavier construction. The east-west axis would induce an unpleasant thermal
imbalance all year long, whether the building is lightweight or heavy. On the other hand, Marcotte, even
though he prefers the south façade for an isolated house, deplores the disadvantages connected with the
north façade and recommends as a trade-off the north-south axis of lanes.
Vogt (1885) notes that in Berne (Switzerland) east-west streets have a lower mortality rate on the sun-
exposed side. To create new districts, he recommends drawing main roads from the north to the south,
whilst scaling their width in proportion to the height of the houses. Furthermore, transversal or
equatorial ways must be very short and very wide. Trélat (1887), Clément (1887) and Besson (1947)
agreed with Vogt‘s views.
Courmont (1925) also mentions the supporters of the north-south street orientation and those supporting
the east-west axis. The latter seek the south façade for its larger sunbeam intensity. The English urban
planner Unwin14
(1909) highlights the disadvantages of the north exposure by creating a diagram
showing London‘s latitude in order to defend his preference for east-west exposures (see Figure 10). He
also presents a diagram of French origin, which illustrates main north-south ways, perpendicularly cut
out by secondary ways (see Figure 11) and translates Howard's15
ideas into reality (see Figure 12).
13 Richardson, B. W. (2006). Hygeia: A City of Health. Paris, Editions de la Villette.
14 Unwin, R. (1909). Town Planning In Practice : An Introduction To The Art Of Designing Cities And Suburbs.
London, Unwin. 15
Sir Ebenezer Howard (1850–1928) is known for his publication Garden Cities of To-morrow (1898), which
influenced urban planning throughout the world. During his lifetime two garden cities were founded, both in
Hertfordshire: Letchworth (1903) and Welwyn Garden City (1920). They served as prototypes of the new towns
organized by the British government after World War II. ©Encyclopaedia Britannica
Chapter 2: Overview of recommendations related to solar radiation
18
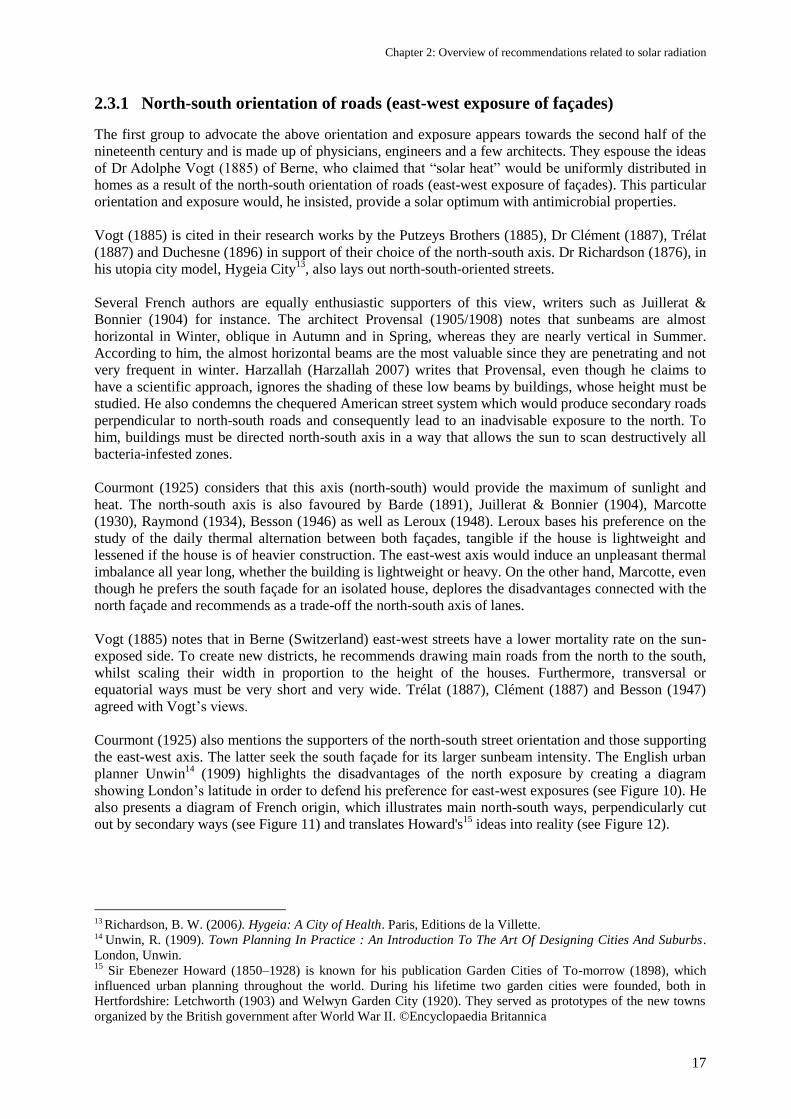
Figure 13: William Atkinson. Profile of a south-east–north-west oriented street facing north-west. The sunbeam
directions are drawn for the summer solstice, latitude 42°0‘ north.
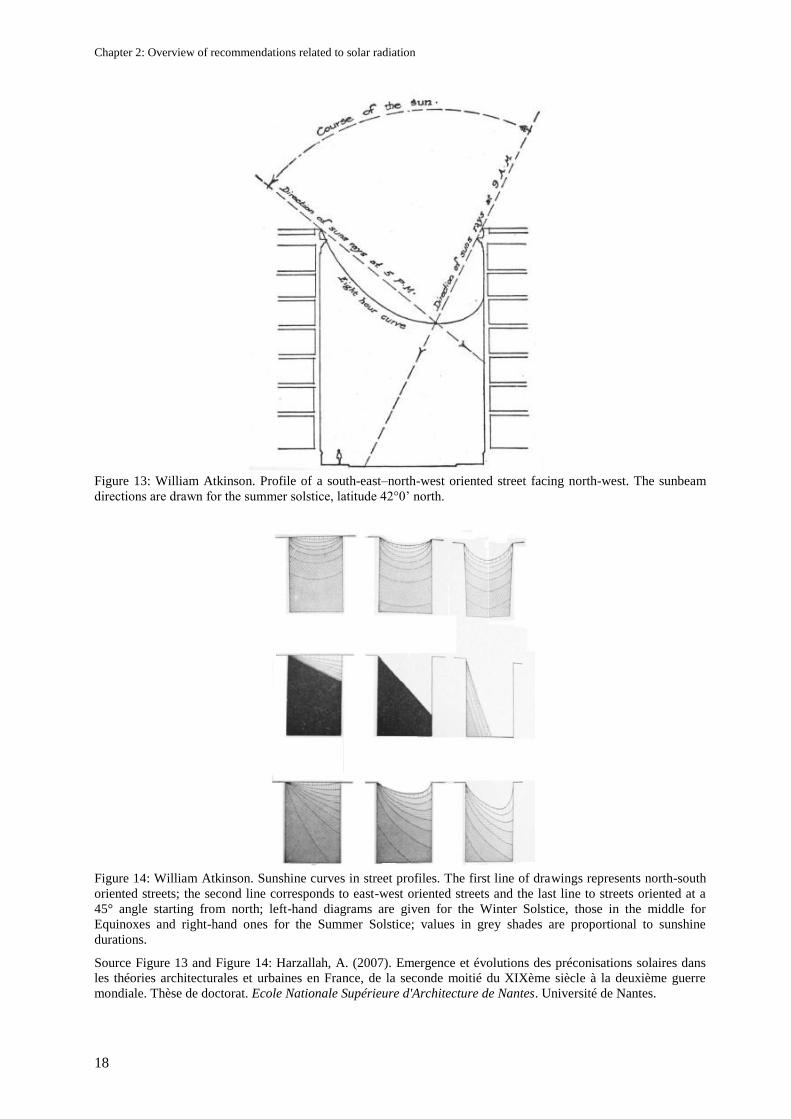
Figure 14: William Atkinson. Sunshine curves in street profiles. The first line of drawings represents north-south
oriented streets; the second line corresponds to east-west oriented streets and the last line to streets oriented at a
45° angle starting from north; left-hand diagrams are given for the Winter Solstice, those in the middle for
Equinoxes and right-hand ones for the Summer Solstice; values in grey shades are proportional to sunshine
durations.
Source Figure 13 and Figure 14: Harzallah, A. (2007). Emergence et évolutions des préconisations solaires dans
les théories architecturales et urbaines en France, de la seconde moitié du XIXème siècle à la deuxième guerre
mondiale. Thèse de doctorat. Ecole Nationale Supérieure d'Architecture de Nantes. Université de Nantes.
Chapter 2: Overview of recommendations related to solar radiation
19
2.3.2 East-west orientation of roads (Exposure of south façades)
The physicians, architects and engineers who supported the east-west orientation of roads (exposure of
south facades) tend to be active at the beginning of the 19th century. In their experimentations to
discover the benefits of north exposure, this second group finally concluded that the south exposure
offered the best advantages.
Barde (1891) recommends this axis for the most imposing of Europe‘s buildings: first-class hotels,
public buildings or high-scale Civil Service buildings. They would have a main façade (reception desks,
important offices, elegant reception rooms) and another secondary one (kitchens, staircases,
outbuildings, secondary offices). For very hot countries, Barde advocates the north exposure for the
main façade. Duchesne (1896) advises south and north-exposed façades solely in southern countries.
Proust (1902) advises this axis to avoid the inconveniences of north exposure. He also points out that
the north orientation would be preferable if direct sunlight was not desired. Hermant (1943) relied
heavily on Marboutin‘s works (1910/1937). He concludes that east-west-axed streets are the most
properly sunlit. André Hermant was also the first architect to restore the north façade. Hermant presents,
according to each space‘s function, and in order of preference, the proper orientation:
- bedrooms : south to east ;
- toilets : south to east ;
- kitchens : south, south-east, east, north-east, north ;
- dining rooms : south, west, north ;
- storerooms, pantries : north-east, north, north-west ;
- living rooms : south to south-east, alternatively south-west.
Leroux (1948) supports south and north exposures for hot climates; in cold climates of the boreal zone,
south-oriented façades. However, Leroux also notes that in temperate climates, it is humidity that makes
the rooms unhealthy, rather than the lack of sunshine. He explains that a room facing north is desirable
as long as it is dry and properly heated in winter.
Stübben (1890), Juillerat (1921) and Raymond (1933) totally reject the east-west axis because of the
disadvantages of the north façade. Raymond adds that in temperate climates, one has to avoid east-west
roads because their south sides would receive insufficient sunlight.
2.3.3 Diagonal orientation of roads
Finally, some authors put forward less radical solutions that allow for differing orientations and
compromise. They generally show a preference for an orientation of 45 degrees. However, some of
them, such as Besson (1946), have suggested the possibility of a ―turning house‖ in order to solve the
problem of the ―correct‖ façade orientation.
Clément (1887), Stübben (1890), Atkinson (1894, cited by G. H. Knibbs in 1901) or Unwin (1922)
propose an orientation of 45° to uniformly distribute direct sunlight over all façades. Whereas Proust
(1902), Provensal (1908) and Courmont (1925) recommend this direction to avoid at all costs the deep
cold that the north façade would provide and the west because of its rain and winds. For Hermant
(1943), the point is to have equivalent façades from an heat point of view.
The Boston architect, William Atkinson (1894), sets out an original method for Boston‘s latitude (42°
north) which makes it possible to estimate correctly the ratio between orientations and street outlines
through the development of sunshine duration curves in various street profiles with various orientations.
(see Figure 13 and Figure 14).
Chapter 2: Overview of recommendations related to solar radiation
20
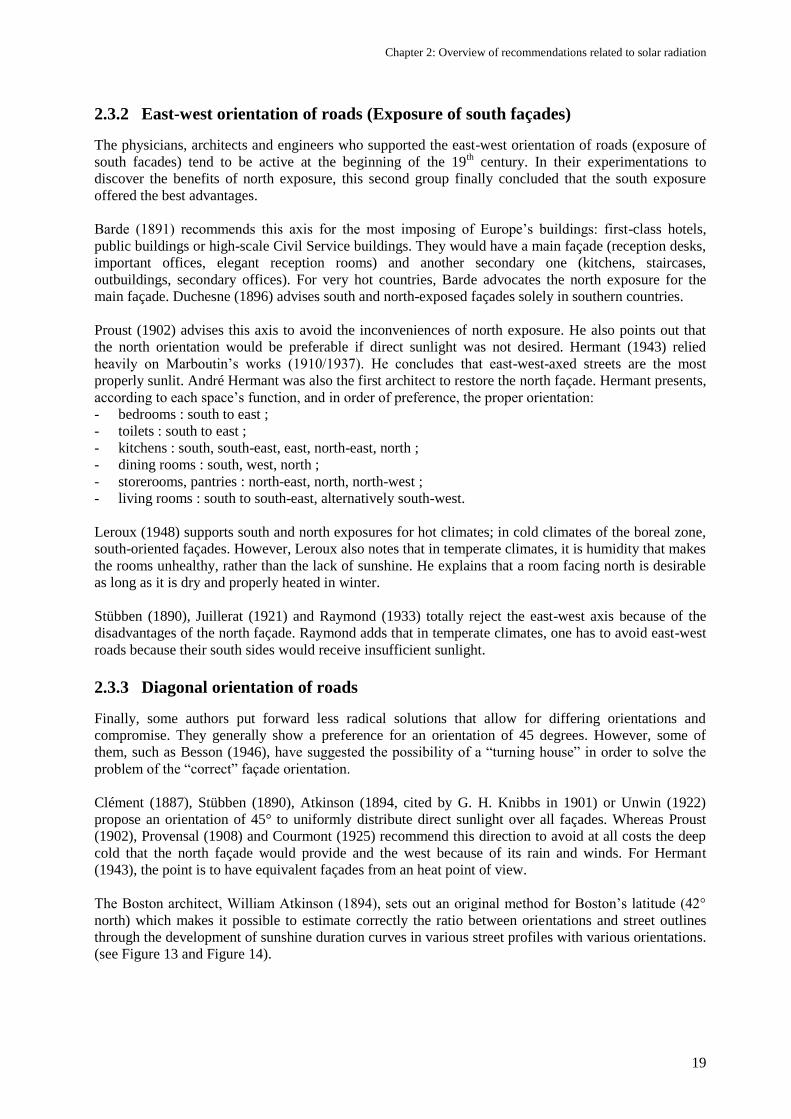
Figure 15: Félix Marboutin. Angle comprised between 60° and 70° on both sides of the north-south axis.
Source: Harzallah, A. (2007). Emergence et évolutions des préconisations solaires dans les théories architecturales
et urbaines en France, de la seconde moitié du XIXème siècle à la deuxième guerre mondiale. Thèse de doctorat.
Ecole Nationale Supérieure d'Architecture de Nantes. Université de Nantes.
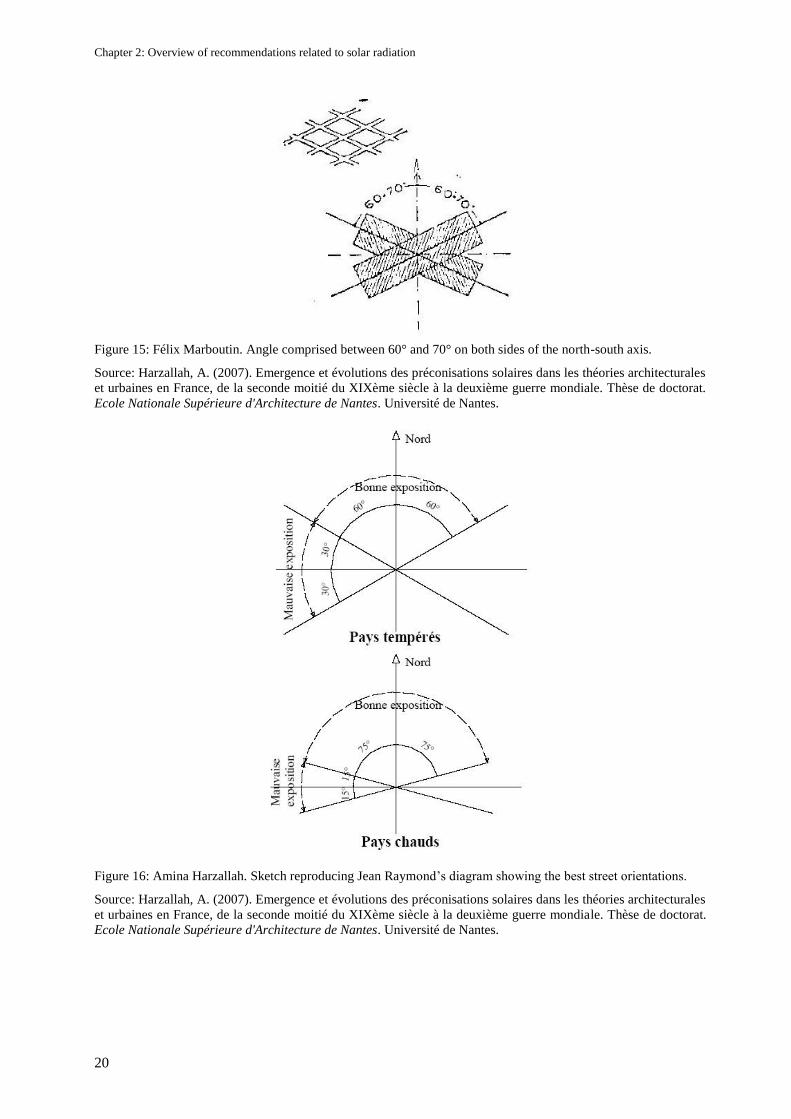
Figure 16: Amina Harzallah. Sketch reproducing Jean Raymond‘s diagram showing the best street orientations.
Source: Harzallah, A. (2007). Emergence et évolutions des préconisations solaires dans les théories architecturales
et urbaines en France, de la seconde moitié du XIXème siècle à la deuxième guerre mondiale. Thèse de doctorat.
Ecole Nationale Supérieure d'Architecture de Nantes. Université de Nantes.
Chapter 2: Overview of recommendations related to solar radiation
21
2.3.4 Other orientation of roads
Some authors suggest different street orientations angles. Clément (1887) varies them from 15° to 20°
as a function of latitudes between the Equator and 30°. His goal was to produce an insolation that was
sufficient in Winter and not too excessive in Summer. De Souza (1908) notes that Jaussely (1904), in
his extension plan of Barcelona, considered the best orientation would be north-south with a deviation
left or right of the meridian from 15° to 35°.
These angles vary as a function of latitude and location. It seems that with a 30° deviation starting from
the north-south axis, the sunlight will last at least an extra hour – an increase of 2 hours to 3 and a
quarter hours. Juillerat (1904/1921), in his search for a maximal sun penetration and to avoid the north
exposure, proposes a range of angles between 0° and 45°, later between 0° and 60°.
To Marboutin, the more beneficial exposure is at an angle between 60° and 70° of the meridian.
Consequently, his street plans form a lozenge-shaped draughtboard (see Figure 15).
Having opted for an upper limit angle of 66 grades (approximately 60°), the engineer, Jean Raymond
(1925/1934), suggests different orientation choices for temperate, hot and tropical climates. Figure 16
illustrates his views. Harzallah (Harzallah 2007) considers that Raymond‘s findings are sufficient to
guide urban planners towards the optimal orientation of the city streets.
Lebreton (1945) gives a full range of orientations from 0° to 45° as a function of space use:
- 25° max. deviation toward south–south-east: best living rooms, including kitchen;
- 45° max. deviation toward south-east: all rooms;
- 45° max. deviation toward south-west: acceptable for daytime rooms, but unfavourable for
bedrooms.
According to Lebreton, all other orientations must be avoided for daytime or nighttime residential
rooms.
To conclude, Vinaccia (Vinaccia 1943-52) recommends adhering to the orientation he designated as
Equisolare. The latter ponderates sunlight homogeneously for the four exposures (see Table 5 and
Figure 17). To validate his results, he compared surface energy obtained with the heliothermic axis16
to
the Equisolare orientation, calculated at 48° for the city of Paris.
Table 5: Surface energy (calories/m²) received by exposed façades
Heliothermic orientations Winter solstice Summer solstice
Façade parallel to the axis
Façade perpendicular to the axis
460
1200
3000
1900
Total 1660 4900
Equisolare Orientation
Façade parallel to the axis
1100
850
2000
1600
Total 1950 3600
16
See item 2.3.5
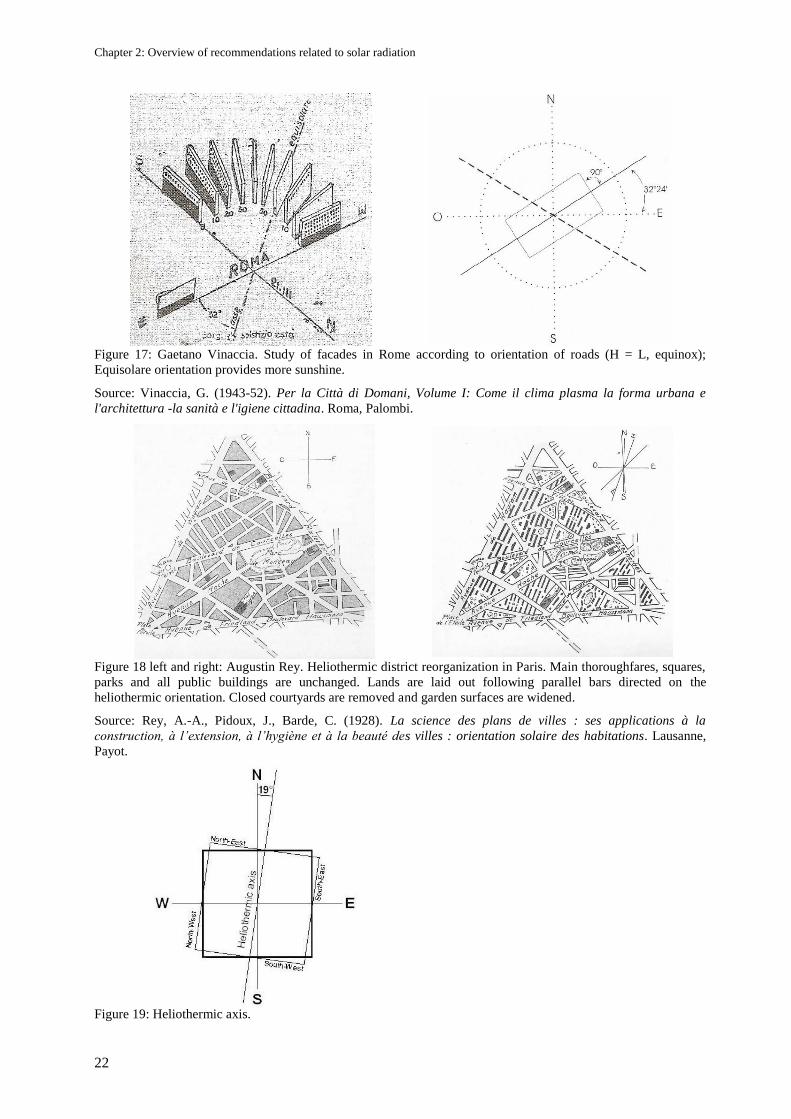
Chapter 2: Overview of recommendations related to solar radiation
22
Figure 17: Gaetano Vinaccia. Study of facades in Rome according to orientation of roads (H = L, equinox);
Equisolare orientation provides more sunshine.
Source: Vinaccia, G. (1943-52). Per la Città di Domani, Volume I: Come il clima plasma la forma urbana e
l'architettura -la sanità e l'igiene cittadina. Roma, Palombi.
Figure 18 left and right: Augustin Rey. Heliothermic district reorganization in Paris. Main thoroughfares, squares,
parks and all public buildings are unchanged. Lands are laid out following parallel bars directed on the
heliothermic orientation. Closed courtyards are removed and garden surfaces are widened.
Source: Rey, A.-A., Pidoux, J., Barde, C. (1928). La science des plans de villes : ses applications à la
construction, à l’extension, à l’hygiène et à la beauté des villes : orientation solaire des habitations. Lausanne,
Payot.
Figure 19: Heliothermic axis.
Chapter 2: Overview of recommendations related to solar radiation
23
2.3.5 Heliothermic axis
Rey, Pidoux and Barde (Rey, Pidoux et al. 1928) suggested one of the most emblematic theories of the
movement in their book La Science des plans de villes showing applications of city reorganization
according to the heliothermic axis (see Figure 18).
The heliothermic unit was defined as the product of sunshine hours with thermal degrees. Gaston Bardet
states, in the Revue Techniques et Architecture (Massé 1943), that this calculation is physically
meaningless and that a temperature can be multiplied by a mass but not by a duration. The assessment
of the heliothermic axis is made in the following way. The heat factor follows the light factor with a
given delay, the thermal wave reaching its maximum in the afternoon, from 2 to 3 p.m., according to the
season of the year. The thermal axis differs from the light axis by approximately 45° between these two
extremes. The heliothermic axis, more or less at the bisecting line, is 19° north-east for Paris and varies
moderately with the latitude and the climate of the location of interest (see Figure 19). According to its
designers, this axis would bring a maximal annual solar radiation. The heliothermic theory caused
intense controversy among urban planning theoreticians.
The engineer Marcotte (1930) as well as the architects Le Corbusier (1930) and Gutton (1941) fully
adhere to the heliothermic axis. Certainly Le Corbusier contributed the most to Rey‘s theory by defining
the heliothermic axis as ―the framework of the city plan17
‖ and by using it in some of his urban projects
until 1945. During the third C.I.A.M in Brussels in 1930, he sets out his La Ville radieuse project: plates
3 and 4 were dedicated to building insolation. For building layout purposes, the principle he adopted is
the heliothermic axis— incidentally, he never cited Rey, Pidoux or Barde. The ―assessment principle‖ is
given in plate 3. To Le Corbusier‘s mind, this plan should be the urban planner‘s first act and the first
act of the authorities. A few years later, Le Corbusier sets this theory aside, without explanation. The
first project for Marseille‘s housing unit in 1945 is directed according to the heliothermic axis, whereas
in 1947, under Dourgnon‘s recommendation, the unit was directed exactly according the north-south
axis.
Rey‘s theories were disputed by Bardet (1943), Vinaccia (1943), Hermant (1943) and Leroux (1946).
Bardet in particular describes the disastrous influence that Rey had on his contemporaries in France and
abroad, where numerous cities were directed according to the heliothermic axis appeared, and suffered
from the highest temperature variations, precisely those of the east and west façades. Vinaccia (Vinaccia
1943-52) states that some naïve urban planners have wrongfully resorted to the heliothermic axis to
justify ―scientifically‖ their own urban design projects or simply to be ―up to date‖. To conclude,
Hermant and Leroux admit the relevance of the heliothermic axis, but outline the fact that it is not a
―sine qua non‖ for urban planning.
2.4 Theory of building outlines and streets
An historic way of regulating building height is the proportion relative to street width. According to
James Howard Kunstler (Kunstler 1996) the optimal aspect ratio based on human psychology lays
between 1:1 to 3:1 (preferably closer to 1:1). With low buildings set far back from the street people feel
isolated and vulnerable. With buildings that are too tall people feel uncomfortable surrounded by
concrete, glass, and steel canyons.
Solar considerations played a crucial role in the definition of a street outline, as well as in the creation of
the built front. There are two main methods leading to these recommendations: on one hand, through
mathematical equations; on the hand, by the way of proportions derived from simplified building
outlines, correspond to the aspect ratio in-between the heights of the façades and the width of the
streets.
17
―l’armature du tracé urbain‖ in french in the text.
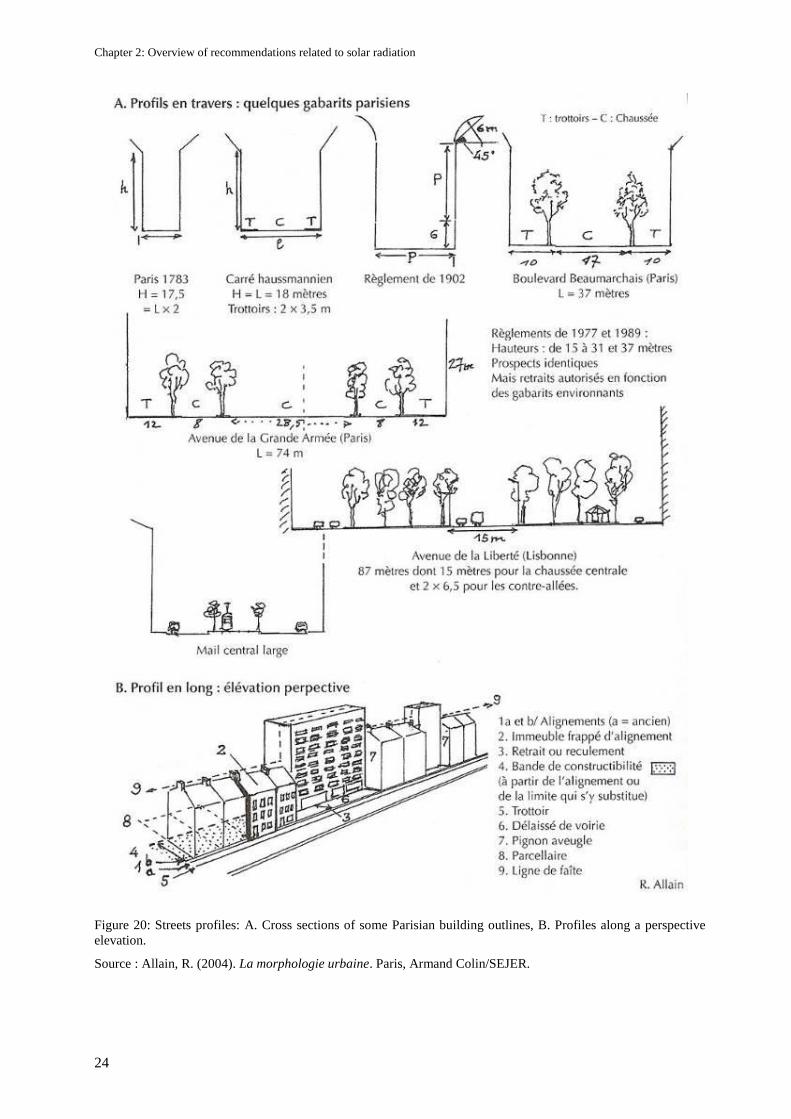
Chapter 2: Overview of recommendations related to solar radiation
24
Figure 20: Streets profiles: A. Cross sections of some Parisian building outlines, B. Profiles along a perspective
elevation.
Source : Allain, R. (2004). La morphologie urbaine. Paris, Armand Colin/SEJER.
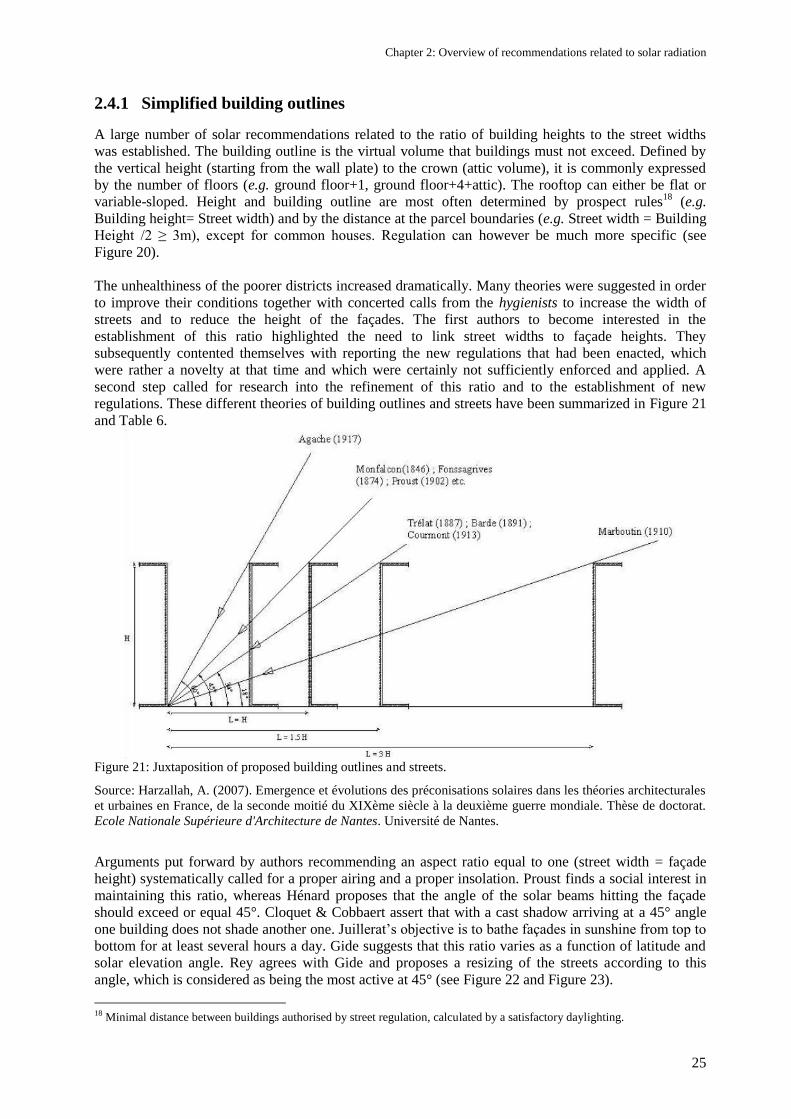
Chapter 2: Overview of recommendations related to solar radiation
25
2.4.1 Simplified building outlines
A large number of solar recommendations related to the ratio of building heights to the street widths
was established. The building outline is the virtual volume that buildings must not exceed. Defined by
the vertical height (starting from the wall plate) to the crown (attic volume), it is commonly expressed
by the number of floors (e.g. ground floor+1, ground floor+4+attic). The rooftop can either be flat or
variable-sloped. Height and building outline are most often determined by prospect rules18
(e.g.
Building height= Street width) and by the distance at the parcel boundaries (e.g. Street width = Building
Height /2 ≥ 3m), except for common houses. Regulation can however be much more specific (see
Figure 20).
The unhealthiness of the poorer districts increased dramatically. Many theories were suggested in order
to improve their conditions together with concerted calls from the hygienists to increase the width of
streets and to reduce the height of the façades. The first authors to become interested in the
establishment of this ratio highlighted the need to link street widths to façade heights. They
subsequently contented themselves with reporting the new regulations that had been enacted, which
were rather a novelty at that time and which were certainly not sufficiently enforced and applied. A
second step called for research into the refinement of this ratio and to the establishment of new
regulations. These different theories of building outlines and streets have been summarized in Figure 21
and Table 6.
Figure 21: Juxtaposition of proposed building outlines and streets.
Source: Harzallah, A. (2007). Emergence et évolutions des préconisations solaires dans les théories architecturales
et urbaines en France, de la seconde moitié du XIXème siècle à la deuxième guerre mondiale. Thèse de doctorat.
Ecole Nationale Supérieure d'Architecture de Nantes. Université de Nantes.
Arguments put forward by authors recommending an aspect ratio equal to one (street width = façade
height) systematically called for a proper airing and a proper insolation. Proust finds a social interest in
maintaining this ratio, whereas Hénard proposes that the angle of the solar beams hitting the façade
should exceed or equal 45°. Cloquet & Cobbaert assert that with a cast shadow arriving at a 45° angle
one building does not shade another one. Juillerat‘s objective is to bathe façades in sunshine from top to
bottom for at least several hours a day. Gide suggests that this ratio varies as a function of latitude and
solar elevation angle. Rey agrees with Gide and proposes a resizing of the streets according to this
angle, which is considered as being the most active at 45° (see Figure 22 and Figure 23).
18 Minimal distance between buildings authorised by street regulation, calculated by a satisfactory daylighting.
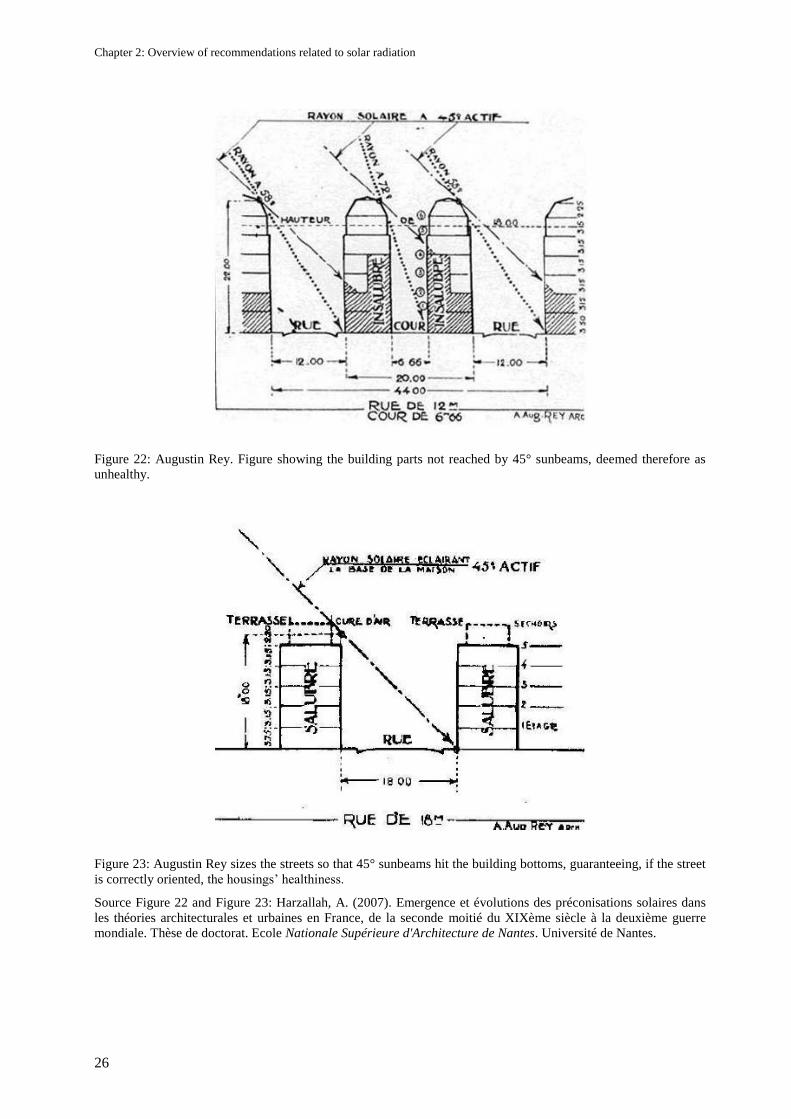
Chapter 2: Overview of recommendations related to solar radiation
26
Figure 22: Augustin Rey. Figure showing the building parts not reached by 45° sunbeams, deemed therefore as
unhealthy.
Figure 23: Augustin Rey sizes the streets so that 45° sunbeams hit the building bottoms, guaranteeing, if the street
is correctly oriented, the housings‘ healthiness.
Source Figure 22 and Figure 23: Harzallah, A. (2007). Emergence et évolutions des préconisations solaires dans
les théories architecturales et urbaines en France, de la seconde moitié du XIXème siècle à la deuxième guerre
mondiale. Thèse de doctorat. Ecole Nationale Supérieure d'Architecture de Nantes. Université de Nantes.
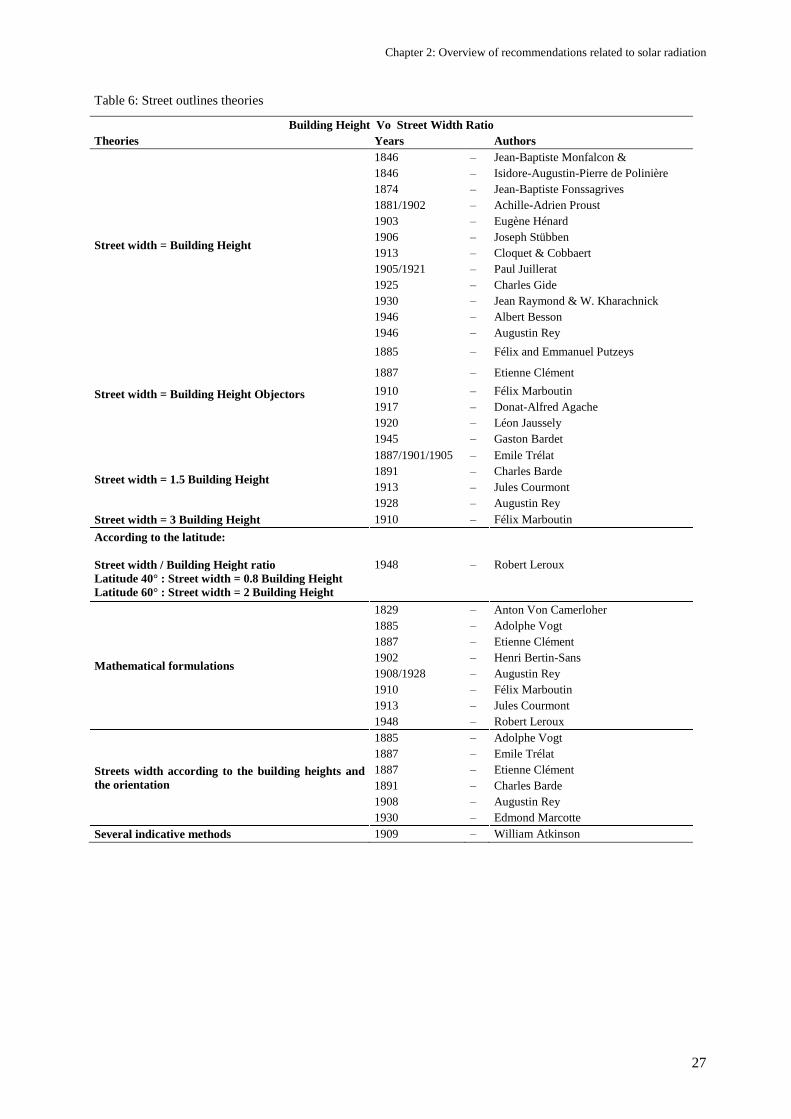
Chapter 2: Overview of recommendations related to solar radiation
27
Table 6: Street outlines theories
Building Height Vo Street Width Ratio
Theories Years Authors
Street width = Building Height
1846 – Jean-Baptiste Monfalcon &
1846 – Isidore-Augustin-Pierre de Polinière
1874 – Jean-Baptiste Fonssagrives
1881/1902 – Achille-Adrien Proust
1903 – Eugène Hénard
1906 – Joseph Stübben
1913 – Cloquet & Cobbaert
1905/1921 – Paul Juillerat
1925 – Charles Gide
1930 – Jean Raymond & W. Kharachnick
1946 – Albert Besson
1946 – Augustin Rey
Street width = Building Height Objectors
1885 – Félix and Emmanuel Putzeys
1887 – Etienne Clément
1910 – Félix Marboutin
1917 – Donat-Alfred Agache
1920 – Léon Jaussely
1945 – Gaston Bardet
Street width = 1.5 Building Height
1887/1901/1905 – Emile Trélat
1891 – Charles Barde
1913 – Jules Courmont
1928 – Augustin Rey
Street width = 3 Building Height 1910 – Félix Marboutin
According to the latitude:
Street width / Building Height ratio
Latitude 40° : Street width = 0.8 Building Height
Latitude 60° : Street width = 2 Building Height
1948 – Robert Leroux
Mathematical formulations
1829 – Anton Von Camerloher
1885 – Adolphe Vogt
1887 – Etienne Clément
1902 – Henri Bertin-Sans
1908/1928 – Augustin Rey
1910 – Félix Marboutin
1913 – Jules Courmont
1948 – Robert Leroux
Streets width according to the building heights and
the orientation
1885 – Adolphe Vogt
1887 – Emile Trélat
1887 – Etienne Clément
1891 – Charles Barde
1908 – Augustin Rey
1930 – Edmond Marcotte
Several indicative methods 1909 – William Atkinson
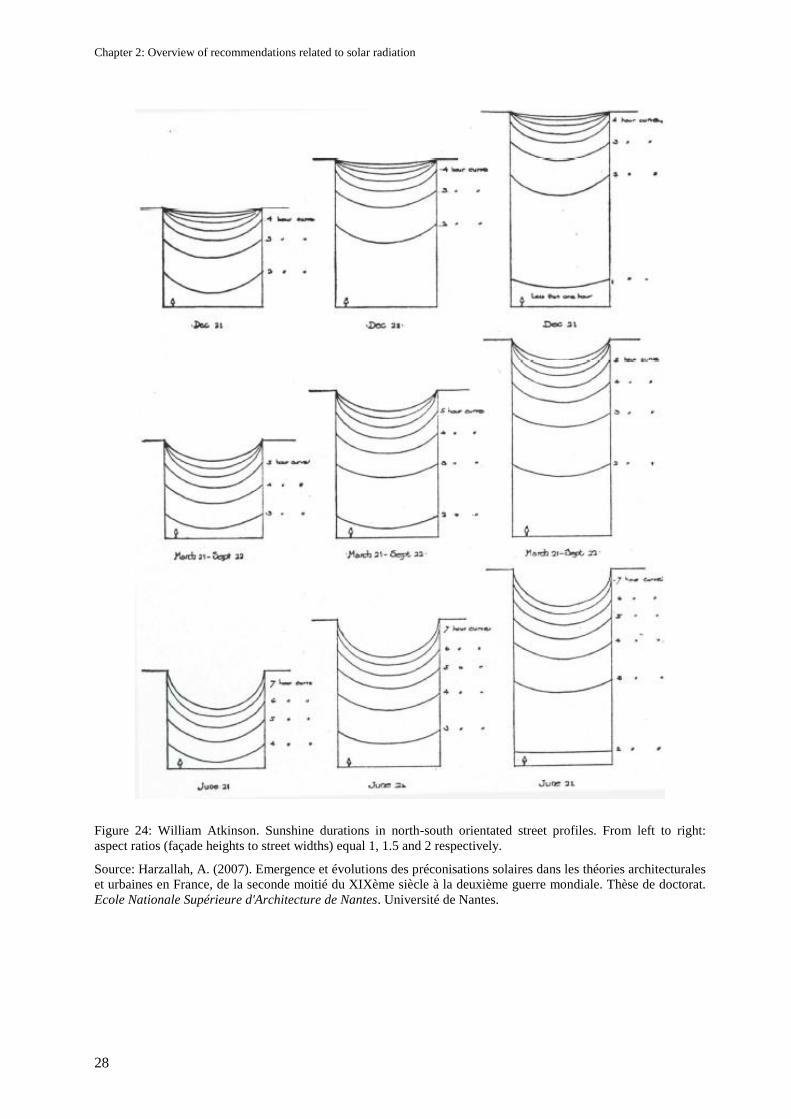
Chapter 2: Overview of recommendations related to solar radiation
28
Figure 24: William Atkinson. Sunshine durations in north-south orientated street profiles. From left to right:
aspect ratios (façade heights to street widths) equal 1, 1.5 and 2 respectively.
Source: Harzallah, A. (2007). Emergence et évolutions des préconisations solaires dans les théories architecturales
et urbaines en France, de la seconde moitié du XIXème siècle à la deuxième guerre mondiale. Thèse de doctorat.
Ecole Nationale Supérieure d'Architecture de Nantes. Université de Nantes.
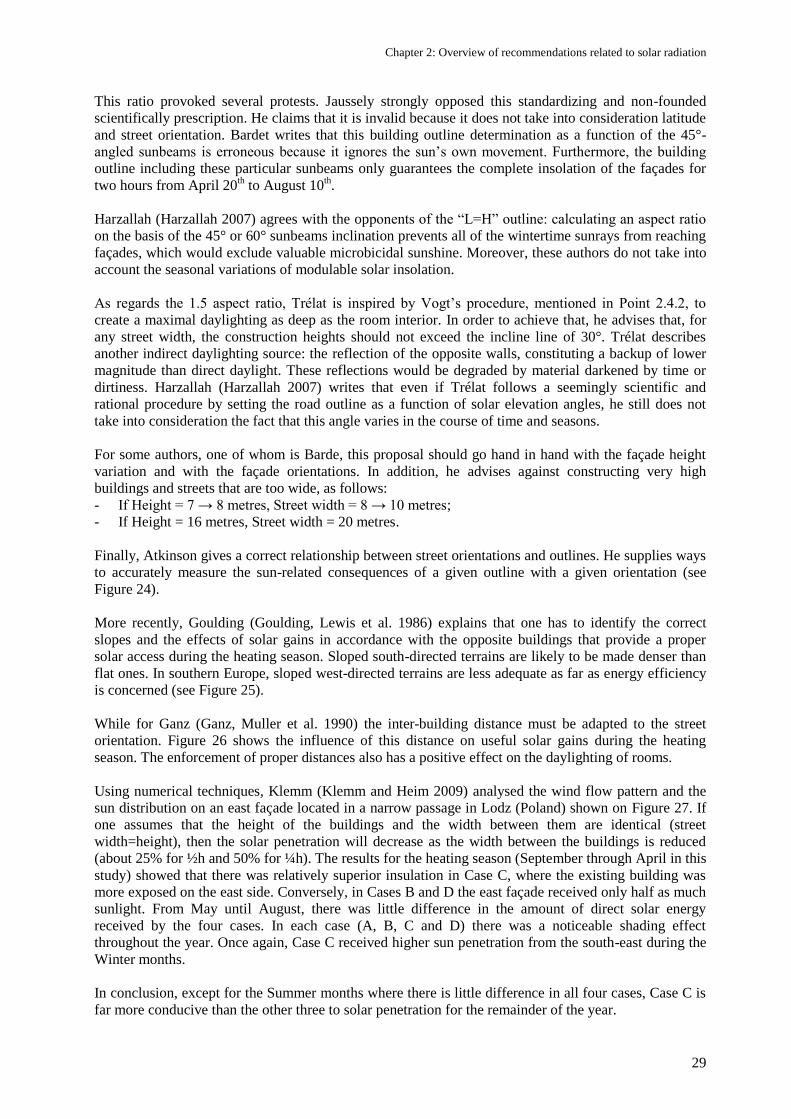
Chapter 2: Overview of recommendations related to solar radiation
29
This ratio provoked several protests. Jaussely strongly opposed this standardizing and non-founded
scientifically prescription. He claims that it is invalid because it does not take into consideration latitude
and street orientation. Bardet writes that this building outline determination as a function of the 45°-
angled sunbeams is erroneous because it ignores the sun‘s own movement. Furthermore, the building
outline including these particular sunbeams only guarantees the complete insolation of the façades for
two hours from April 20th to August 10
th.
Harzallah (Harzallah 2007) agrees with the opponents of the ―L=H‖ outline: calculating an aspect ratio
on the basis of the 45° or 60° sunbeams inclination prevents all of the wintertime sunrays from reaching
façades, which would exclude valuable microbicidal sunshine. Moreover, these authors do not take into
account the seasonal variations of modulable solar insolation.
As regards the 1.5 aspect ratio, Trélat is inspired by Vogt‘s procedure, mentioned in Point 2.4.2, to
create a maximal daylighting as deep as the room interior. In order to achieve that, he advises that, for
any street width, the construction heights should not exceed the incline line of 30°. Trélat describes
another indirect daylighting source: the reflection of the opposite walls, constituting a backup of lower
magnitude than direct daylight. These reflections would be degraded by material darkened by time or
dirtiness. Harzallah (Harzallah 2007) writes that even if Trélat follows a seemingly scientific and
rational procedure by setting the road outline as a function of solar elevation angles, he still does not
take into consideration the fact that this angle varies in the course of time and seasons.
For some authors, one of whom is Barde, this proposal should go hand in hand with the façade height
variation and with the façade orientations. In addition, he advises against constructing very high
buildings and streets that are too wide, as follows:
- If Height = 7 → 8 metres, Street width = 8 → 10 metres;
- If Height = 16 metres, Street width = 20 metres.
Finally, Atkinson gives a correct relationship between street orientations and outlines. He supplies ways
to accurately measure the sun-related consequences of a given outline with a given orientation (see
Figure 24).
More recently, Goulding (Goulding, Lewis et al. 1986) explains that one has to identify the correct
slopes and the effects of solar gains in accordance with the opposite buildings that provide a proper
solar access during the heating season. Sloped south-directed terrains are likely to be made denser than
flat ones. In southern Europe, sloped west-directed terrains are less adequate as far as energy efficiency
is concerned (see Figure 25).
While for Ganz (Ganz, Muller et al. 1990) the inter-building distance must be adapted to the street
orientation. Figure 26 shows the influence of this distance on useful solar gains during the heating
season. The enforcement of proper distances also has a positive effect on the daylighting of rooms.
Using numerical techniques, Klemm (Klemm and Heim 2009) analysed the wind flow pattern and the
sun distribution on an east façade located in a narrow passage in Lodz (Poland) shown on Figure 27. If
one assumes that the height of the buildings and the width between them are identical (street
width=height), then the solar penetration will decrease as the width between the buildings is reduced
(about 25% for ½h and 50% for ¼h). The results for the heating season (September through April in this
study) showed that there was relatively superior insulation in Case C, where the existing building was
more exposed on the east side. Conversely, in Cases B and D the east façade received only half as much
sunlight. From May until August, there was little difference in the amount of direct solar energy
received by the four cases. In each case (A, B, C and D) there was a noticeable shading effect
throughout the year. Once again, Case C received higher sun penetration from the south-east during the
Winter months.
In conclusion, except for the Summer months where there is little difference in all four cases, Case C is
far more conducive than the other three to solar penetration for the remainder of the year.
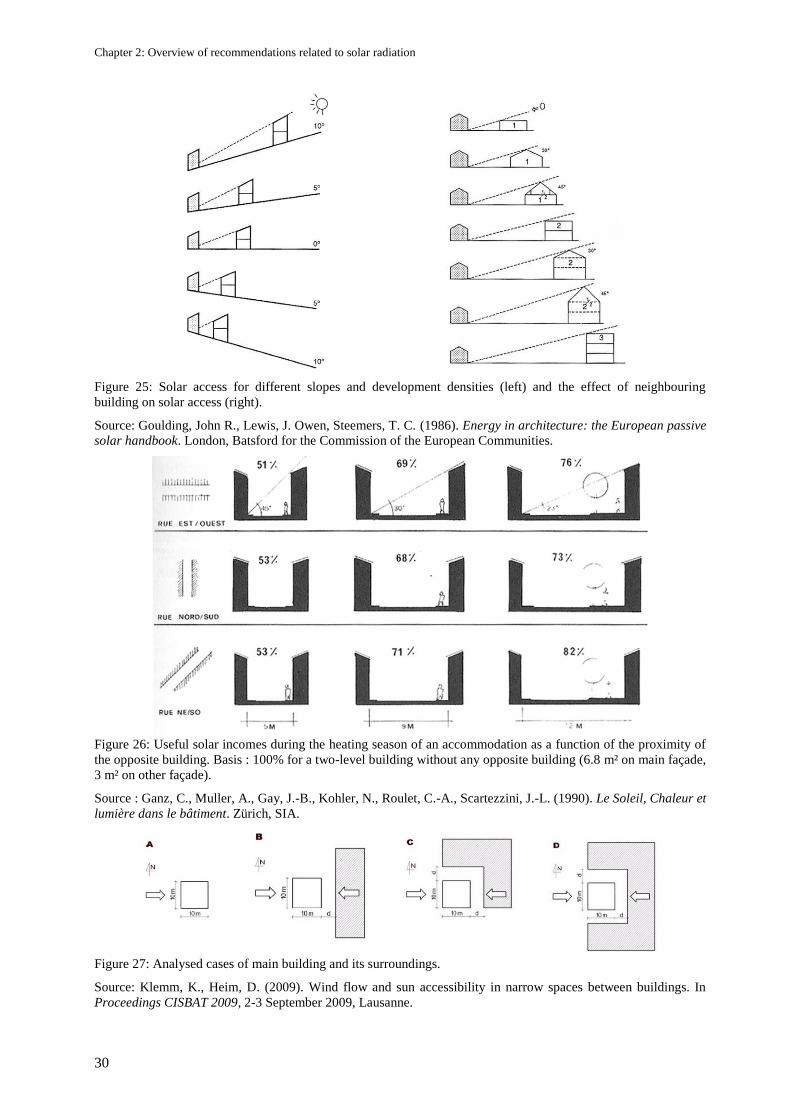
Chapter 2: Overview of recommendations related to solar radiation
30
Figure 25: Solar access for different slopes and development densities (left) and the effect of neighbouring
building on solar access (right).
Source: Goulding, John R., Lewis, J. Owen, Steemers, T. C. (1986). Energy in architecture: the European passive
solar handbook. London, Batsford for the Commission of the European Communities.
Figure 26: Useful solar incomes during the heating season of an accommodation as a function of the proximity of
the opposite building. Basis : 100% for a two-level building without any opposite building (6.8 m² on main façade,
3 m² on other façade).
Source : Ganz, C., Muller, A., Gay, J.-B., Kohler, N., Roulet, C.-A., Scartezzini, J.-L. (1990). Le Soleil, Chaleur et
lumière dans le bâtiment. Zürich, SIA.
Figure 27: Analysed cases of main building and its surroundings.
Source: Klemm, K., Heim, D. (2009). Wind flow and sun accessibility in narrow spaces between buildings. In
Proceedings CISBAT 2009, 2-3 September 2009, Lausanne.
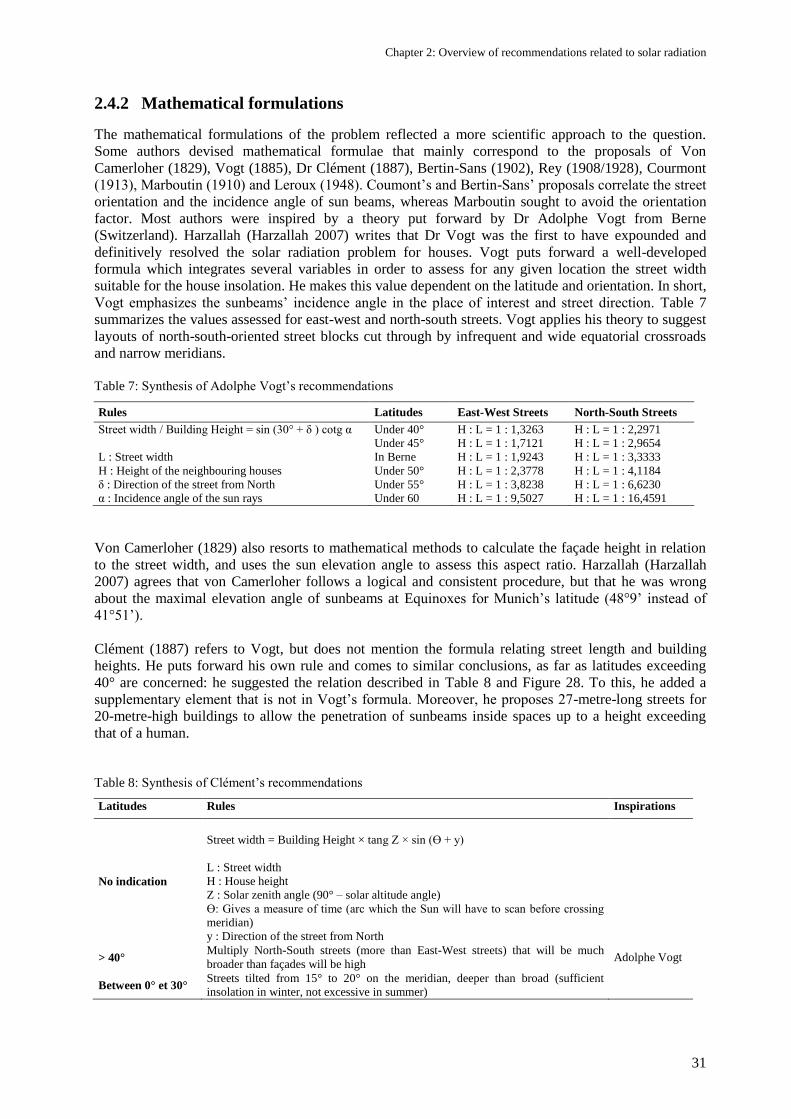
Chapter 2: Overview of recommendations related to solar radiation
31
2.4.2 Mathematical formulations
The mathematical formulations of the problem reflected a more scientific approach to the question.
Some authors devised mathematical formulae that mainly correspond to the proposals of Von
Camerloher (1829), Vogt (1885), Dr Clément (1887), Bertin-Sans (1902), Rey (1908/1928), Courmont
(1913), Marboutin (1910) and Leroux (1948). Coumont‘s and Bertin-Sans‘ proposals correlate the street
orientation and the incidence angle of sun beams, whereas Marboutin sought to avoid the orientation
factor. Most authors were inspired by a theory put forward by Dr Adolphe Vogt from Berne
(Switzerland). Harzallah (Harzallah 2007) writes that Dr Vogt was the first to have expounded and
definitively resolved the solar radiation problem for houses. Vogt puts forward a well-developed
formula which integrates several variables in order to assess for any given location the street width
suitable for the house insolation. He makes this value dependent on the latitude and orientation. In short,
Vogt emphasizes the sunbeams‘ incidence angle in the place of interest and street direction. Table 7
summarizes the values assessed for east-west and north-south streets. Vogt applies his theory to suggest
layouts of north-south-oriented street blocks cut through by infrequent and wide equatorial crossroads
and narrow meridians.
Table 7: Synthesis of Adolphe Vogt‘s recommendations
Rules Latitudes East-West Streets North-South Streets
Street width / Building Height = sin (30° + δ ) cotg α
L : Street width
H : Height of the neighbouring houses
δ : Direction of the street from North
α : Incidence angle of the sun rays
Under 40°
Under 45°
In Berne
Under 50°
Under 55°
Under 60
H : L = 1 : 1,3263
H : L = 1 : 1,7121
H : L = 1 : 1,9243
H : L = 1 : 2,3778
H : L = 1 : 3,8238
H : L = 1 : 9,5027
H : L = 1 : 2,2971
H : L = 1 : 2,9654
H : L = 1 : 3,3333
H : L = 1 : 4,1184
H : L = 1 : 6,6230
H : L = 1 : 16,4591
Von Camerloher (1829) also resorts to mathematical methods to calculate the façade height in relation
to the street width, and uses the sun elevation angle to assess this aspect ratio. Harzallah (Harzallah
2007) agrees that von Camerloher follows a logical and consistent procedure, but that he was wrong
about the maximal elevation angle of sunbeams at Equinoxes for Munich‘s latitude (48°9‘ instead of
41°51‘).
Clément (1887) refers to Vogt, but does not mention the formula relating street length and building
heights. He puts forward his own rule and comes to similar conclusions, as far as latitudes exceeding
40° are concerned: he suggested the relation described in Table 8 and Figure 28. To this, he added a
supplementary element that is not in Vogt‘s formula. Moreover, he proposes 27-metre-long streets for
20-metre-high buildings to allow the penetration of sunbeams inside spaces up to a height exceeding
that of a human.
Table 8: Synthesis of Clément‘s recommendations
Latitudes Rules Inspirations
No indication
Street width = Building Height × tang Z × sin (Ө + y)
L : Street width
H : House height
Z : Solar zenith angle (90° – solar altitude angle)
Ө: Gives a measure of time (arc which the Sun will have to scan before crossing
meridian)
y : Direction of the street from North
> 40° Multiply North-South streets (more than East-West streets) that will be much
broader than façades will be high Adolphe Vogt
Between 0° et 30° Streets tilted from 15° to 20° on the meridian, deeper than broad (sufficient
insolation in winter, not excessive in summer)
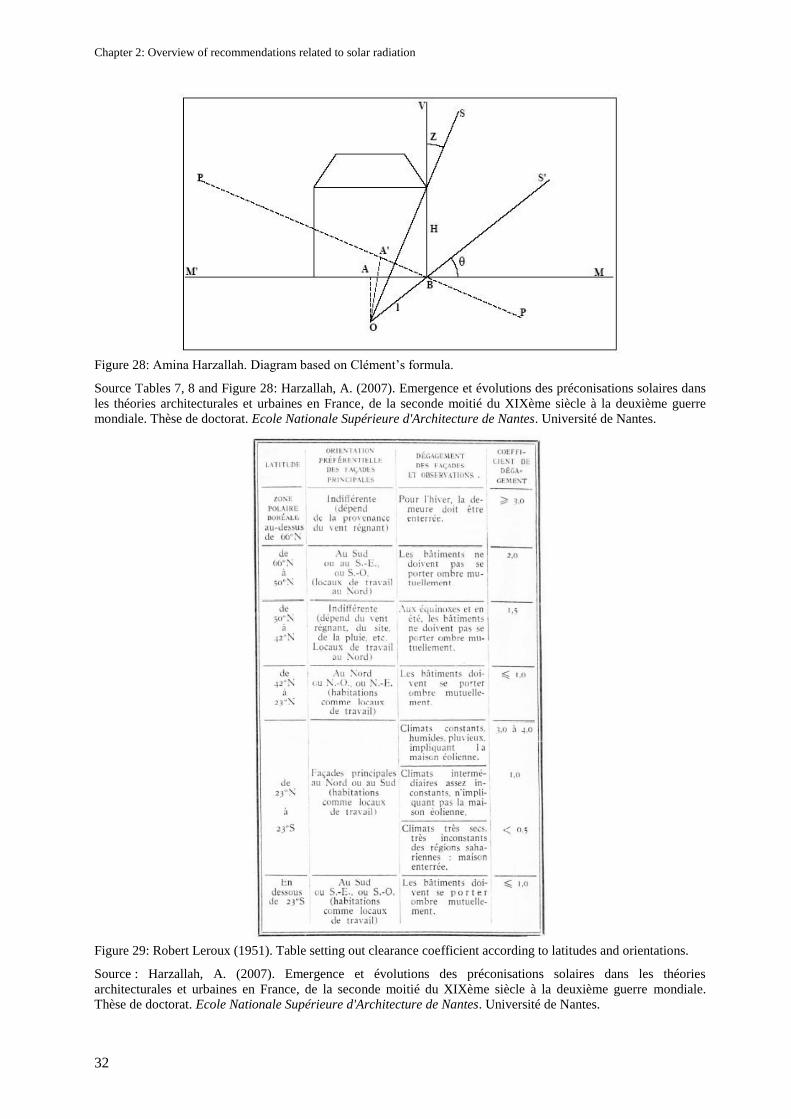
Chapter 2: Overview of recommendations related to solar radiation
32
Figure 28: Amina Harzallah. Diagram based on Clément‘s formula.
Source Tables 7, 8 and Figure 28: Harzallah, A. (2007). Emergence et évolutions des préconisations solaires dans
les théories architecturales et urbaines en France, de la seconde moitié du XIXème siècle à la deuxième guerre
mondiale. Thèse de doctorat. Ecole Nationale Supérieure d'Architecture de Nantes. Université de Nantes.
Figure 29: Robert Leroux (1951). Table setting out clearance coefficient according to latitudes and orientations.
Source : Harzallah, A. (2007). Emergence et évolutions des préconisations solaires dans les théories
architecturales et urbaines en France, de la seconde moitié du XIXème siècle à la deuxième guerre mondiale.
Thèse de doctorat. Ecole Nationale Supérieure d'Architecture de Nantes. Université de Nantes.

Chapter 2: Overview of recommendations related to solar radiation
33
To Rey (1908), façade heights, street widths and orientations are mutually dependent factors. By taking
street orientations into consideration and using his own method, he agrees with Dr Vogt. Harzallah
(Harzallah 2007) noting that Rey, through his procedure, addresses sunshine durations of the street,
rather than those of the façades. Furthermore, the aspect ratio (Street width = Building height) is
approximately identical for buildings with varying heights and orientations. In 1928, Rey sets this
aspect ratio to 1.5 and varies it as a function of the location. Deschamps in particular (1930) questions
the rule by which a façade should receive sunrays in winter for at least one hour per day, which to him,
is irrelevant.
The engineer Leroux (1948) differed from other authors by assessing the façades‘ clearances19
in a way
to guarantee three factors: the solar, daylighting and natural ventilation potentials. He recommended
that façade clearances be 1½ higher for latitudes between 42° and 50°. Switzerland fits into this range.
This ratio varies according to latitudes. Orientation factor are not considered in the ratio between street
lengths and façade heights (see Figure 29).
In 1952, Leroux puts side by side two approaches that had a significant impact: namely Rey‘s (gnomon-
like solar diagram) and Marboutin‘s theories (Street width = Height× cotg(h) × (sin (α – t))). Leroux
reports that Rey searched for the highest sunshine hours without considering its quality or the thermal
aftermath of his device.
More recently, the pioneering study of Nunez (Nunez and Oke 1976) shows, through measurements of
long-wave radiative flux divergence on calm, cloudless days, the importance of reflections occurring in
the urban canyon due to the its three-dimensional arrangement (see Figure 30).
Figure 30: Experiment lay-out, dimensions and coordinate system at the canyon cross-section.
Source: Nunez, M., Oke, T. R. (1976). Long-wave radiative flux divergence and nocturnal cooling of the urban
atmosphere. Boundary-Layer Meteorology, 10 (2): pp. 121-135.
19
Distance between façades.
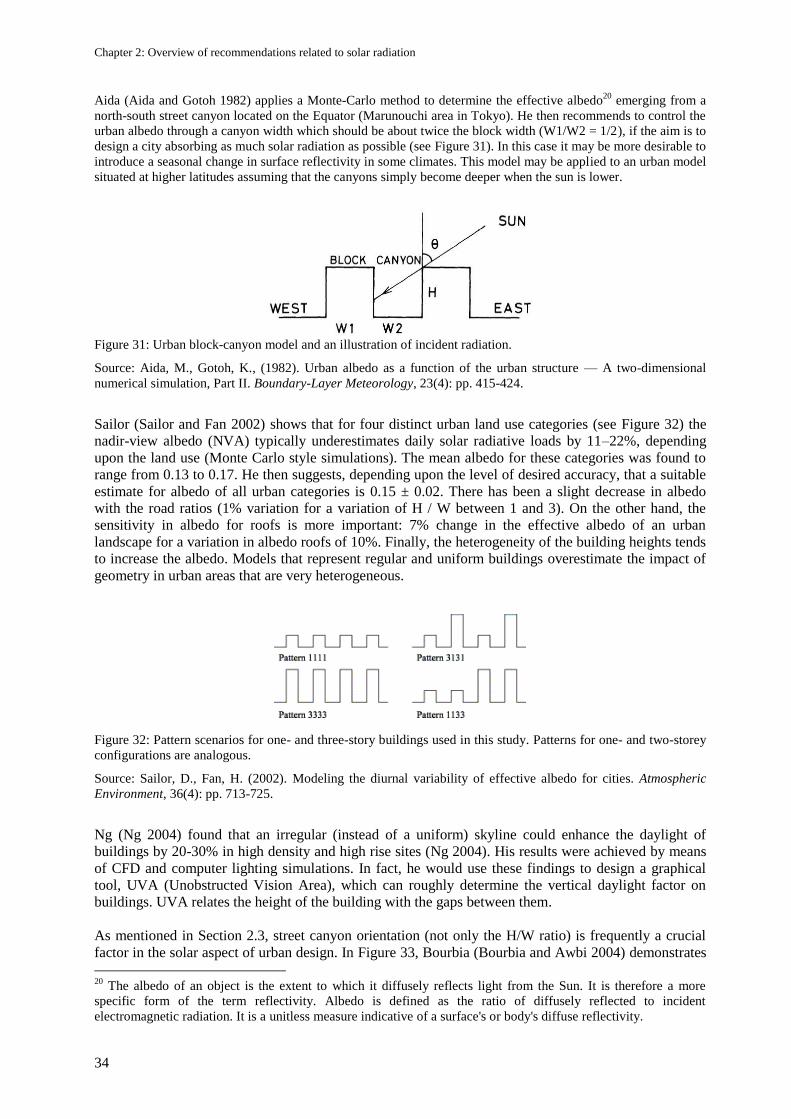
Chapter 2: Overview of recommendations related to solar radiation
34
Aida (Aida and Gotoh 1982) applies a Monte-Carlo method to determine the effective albedo20
emerging from a
north-south street canyon located on the Equator (Marunouchi area in Tokyo). He then recommends to control the
urban albedo through a canyon width which should be about twice the block width (W1/W2 = 1/2), if the aim is to
design a city absorbing as much solar radiation as possible (see Figure 31). In this case it may be more desirable to
introduce a seasonal change in surface reflectivity in some climates. This model may be applied to an urban model
situated at higher latitudes assuming that the canyons simply become deeper when the sun is lower.
Figure 31: Urban block-canyon model and an illustration of incident radiation.
Source: Aida, M., Gotoh, K., (1982). Urban albedo as a function of the urban structure — A two-dimensional
numerical simulation, Part II. Boundary-Layer Meteorology, 23(4): pp. 415-424.
Sailor (Sailor and Fan 2002) shows that for four distinct urban land use categories (see Figure 32) the
nadir-view albedo (NVA) typically underestimates daily solar radiative loads by 11–22%, depending
upon the land use (Monte Carlo style simulations). The mean albedo for these categories was found to
range from 0.13 to 0.17. He then suggests, depending upon the level of desired accuracy, that a suitable
estimate for albedo of all urban categories is 0.15 ± 0.02. There has been a slight decrease in albedo
with the road ratios (1% variation for a variation of H / W between 1 and 3). On the other hand, the
sensitivity in albedo for roofs is more important: 7% change in the effective albedo of an urban
landscape for a variation in albedo roofs of 10%. Finally, the heterogeneity of the building heights tends
to increase the albedo. Models that represent regular and uniform buildings overestimate the impact of
geometry in urban areas that are very heterogeneous.
Figure 32: Pattern scenarios for one- and three-story buildings used in this study. Patterns for one- and two-storey
configurations are analogous.
Source: Sailor, D., Fan, H. (2002). Modeling the diurnal variability of effective albedo for cities. Atmospheric
Environment, 36(4): pp. 713-725.
Ng (Ng 2004) found that an irregular (instead of a uniform) skyline could enhance the daylight of
buildings by 20-30% in high density and high rise sites (Ng 2004). His results were achieved by means
of CFD and computer lighting simulations. In fact, he would use these findings to design a graphical
tool, UVA (Unobstructed Vision Area), which can roughly determine the vertical daylight factor on
buildings. UVA relates the height of the building with the gaps between them.
As mentioned in Section 2.3, street canyon orientation (not only the H/W ratio) is frequently a crucial
factor in the solar aspect of urban design. In Figure 33, Bourbia (Bourbia and Awbi 2004) demonstrates
20
The albedo of an object is the extent to which it diffusely reflects light from the Sun. It is therefore a more
specific form of the term reflectivity. Albedo is defined as the ratio of diffusely reflected to incident
electromagnetic radiation. It is a unitless measure indicative of a surface's or body's diffuse reflectivity.
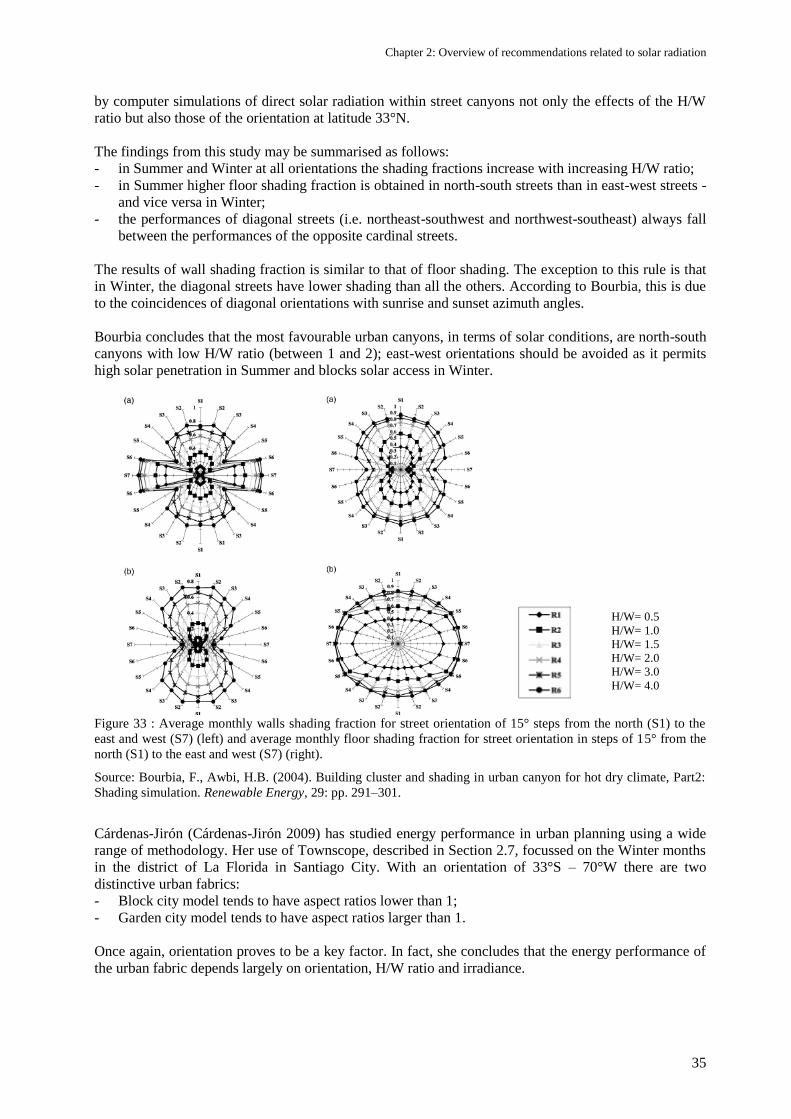
Chapter 2: Overview of recommendations related to solar radiation
35
by computer simulations of direct solar radiation within street canyons not only the effects of the H/W
ratio but also those of the orientation at latitude 33°N.
The findings from this study may be summarised as follows:
- in Summer and Winter at all orientations the shading fractions increase with increasing H/W ratio;
- in Summer higher floor shading fraction is obtained in north-south streets than in east-west streets -
and vice versa in Winter;
- the performances of diagonal streets (i.e. northeast-southwest and northwest-southeast) always fall
between the performances of the opposite cardinal streets.
The results of wall shading fraction is similar to that of floor shading. The exception to this rule is that
in Winter, the diagonal streets have lower shading than all the others. According to Bourbia, this is due
to the coincidences of diagonal orientations with sunrise and sunset azimuth angles.
Bourbia concludes that the most favourable urban canyons, in terms of solar conditions, are north-south
canyons with low H/W ratio (between 1 and 2); east-west orientations should be avoided as it permits
high solar penetration in Summer and blocks solar access in Winter.
Figure 33 : Average monthly walls shading fraction for street orientation of 15° steps from the north (S1) to the
east and west (S7) (left) and average monthly floor shading fraction for street orientation in steps of 15° from the
north (S1) to the east and west (S7) (right).
Source: Bourbia, F., Awbi, H.B. (2004). Building cluster and shading in urban canyon for hot dry climate, Part2:
Shading simulation. Renewable Energy, 29: pp. 291–301.
Cárdenas-Jirón (Cárdenas-Jirón 2009) has studied energy performance in urban planning using a wide
range of methodology. Her use of Townscope, described in Section 2.7, focussed on the Winter months
in the district of La Florida in Santiago City. With an orientation of 33°S – 70°W there are two
distinctive urban fabrics:
- Block city model tends to have aspect ratios lower than 1;
- Garden city model tends to have aspect ratios larger than 1.
Once again, orientation proves to be a key factor. In fact, she concludes that the energy performance of
the urban fabric depends largely on orientation, H/W ratio and irradiance.
H/W= 0.5
H/W= 1.0
H/W= 1.5
H/W= 2.0
H/W= 3.0
H/W= 4.0
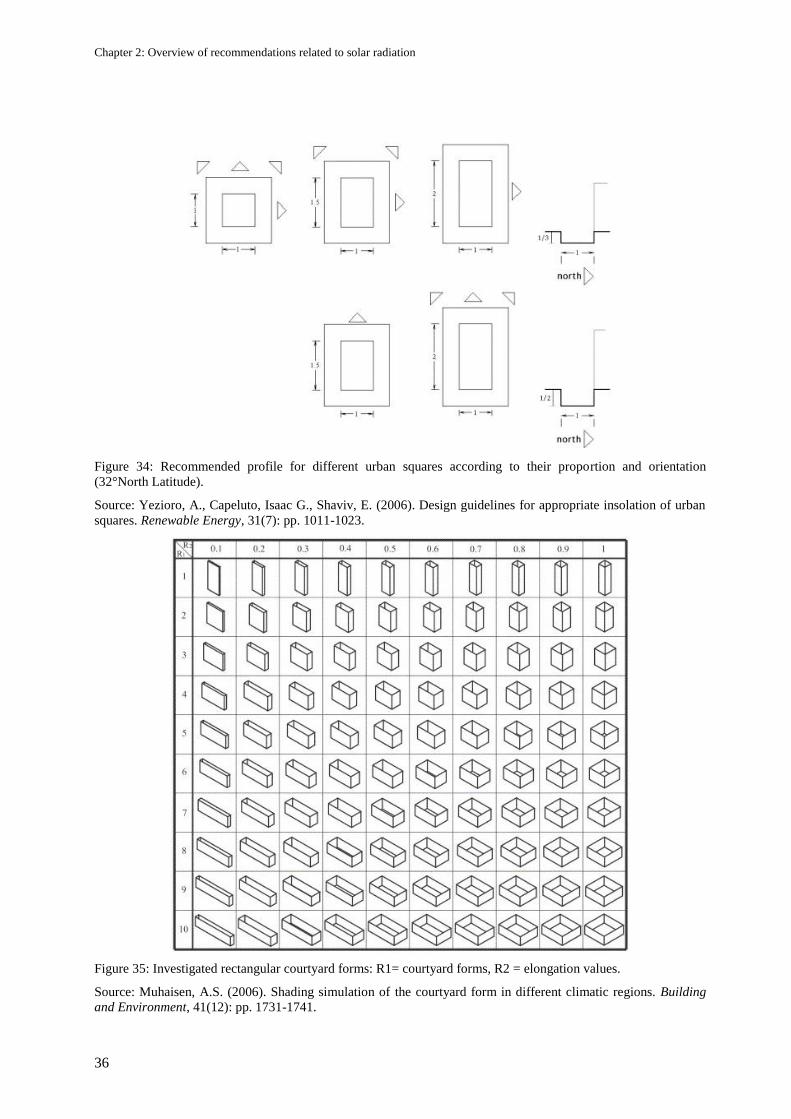
Chapter 2: Overview of recommendations related to solar radiation
36
Figure 34: Recommended profile for different urban squares according to their proportion and orientation
(32°North Latitude).
Source: Yezioro, A., Capeluto, Isaac G., Shaviv, E. (2006). Design guidelines for appropriate insolation of urban
squares. Renewable Energy, 31(7): pp. 1011-1023.
Figure 35: Investigated rectangular courtyard forms: R1= courtyard forms, R2 = elongation values.
Source: Muhaisen, A.S. (2006). Shading simulation of the courtyard form in different climatic regions. Building
and Environment, 41(12): pp. 1731-1741.
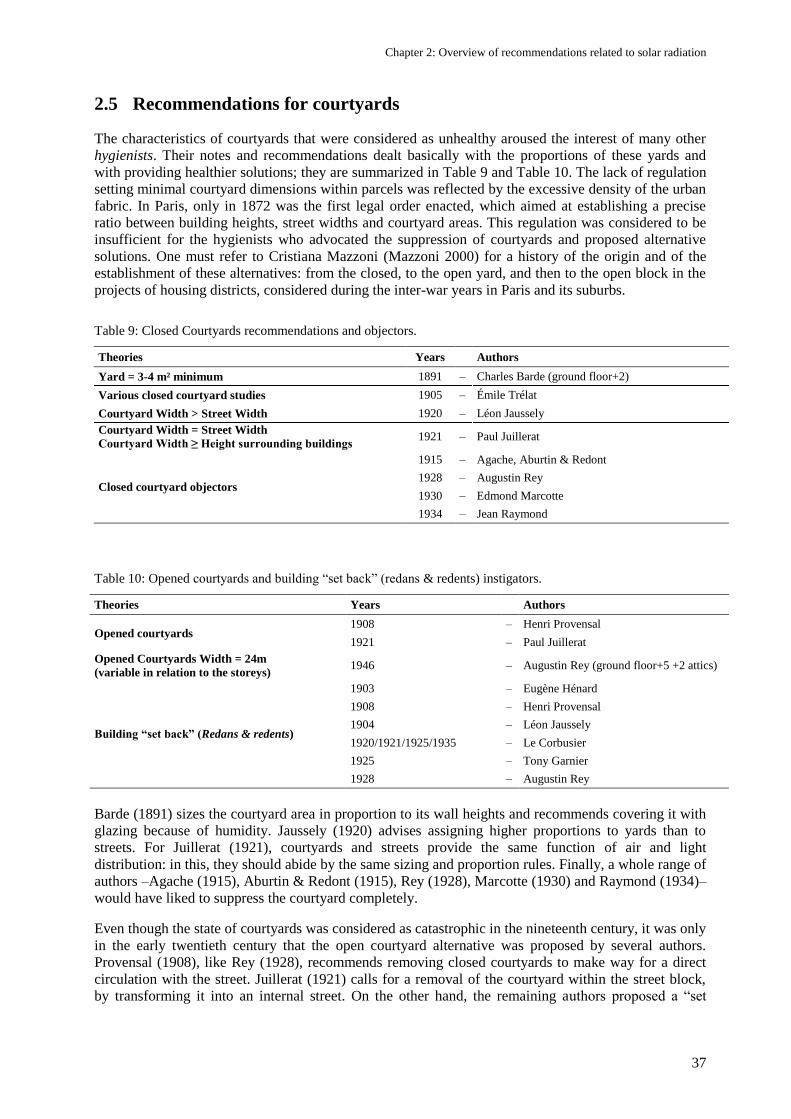
Chapter 2: Overview of recommendations related to solar radiation
37
2.5 Recommendations for courtyards
The characteristics of courtyards that were considered as unhealthy aroused the interest of many other
hygienists. Their notes and recommendations dealt basically with the proportions of these yards and
with providing healthier solutions; they are summarized in Table 9 and Table 10. The lack of regulation
setting minimal courtyard dimensions within parcels was reflected by the excessive density of the urban
fabric. In Paris, only in 1872 was the first legal order enacted, which aimed at establishing a precise
ratio between building heights, street widths and courtyard areas. This regulation was considered to be
insufficient for the hygienists who advocated the suppression of courtyards and proposed alternative
solutions. One must refer to Cristiana Mazzoni (Mazzoni 2000) for a history of the origin and of the
establishment of these alternatives: from the closed, to the open yard, and then to the open block in the
projects of housing districts, considered during the inter-war years in Paris and its suburbs.
Table 9: Closed Courtyards recommendations and objectors.
Theories Years Authors
Yard = 3-4 m² minimum 1891 – Charles Barde (ground floor+2)
Various closed courtyard studies 1905 – Émile Trélat
Courtyard Width > Street Width 1920 – Léon Jaussely
Courtyard Width = Street Width Courtyard Width ≥ Height surrounding buildings
1921 – Paul Juillerat
Closed courtyard objectors
1915 – Agache, Aburtin & Redont
1928 – Augustin Rey
1930 – Edmond Marcotte
1934 – Jean Raymond
Table 10: Opened courtyards and building ―set back‖ (redans & redents) instigators.
Theories Years Authors
Opened courtyards 1908 – Henri Provensal
1921 – Paul Juillerat
Opened Courtyards Width = 24m
(variable in relation to the storeys) 1946 – Augustin Rey (ground floor+5 +2 attics)
Building “set back” (Redans & redents)
1903 – Eugène Hénard
1908 – Henri Provensal
1904 – Léon Jaussely
1920/1921/1925/1935 – Le Corbusier
1925 – Tony Garnier
1928 – Augustin Rey
Barde (1891) sizes the courtyard area in proportion to its wall heights and recommends covering it with
glazing because of humidity. Jaussely (1920) advises assigning higher proportions to yards than to
streets. For Juillerat (1921), courtyards and streets provide the same function of air and light
distribution: in this, they should abide by the same sizing and proportion rules. Finally, a whole range of
authors –Agache (1915), Aburtin & Redont (1915), Rey (1928), Marcotte (1930) and Raymond (1934)–
would have liked to suppress the courtyard completely.
Even though the state of courtyards was considered as catastrophic in the nineteenth century, it was only
in the early twentieth century that the open courtyard alternative was proposed by several authors.
Provensal (1908), like Rey (1928), recommends removing closed courtyards to make way for a direct
circulation with the street. Juillerat (1921) calls for a removal of the courtyard within the street block,
by transforming it into an internal street. On the other hand, the remaining authors proposed a ―set
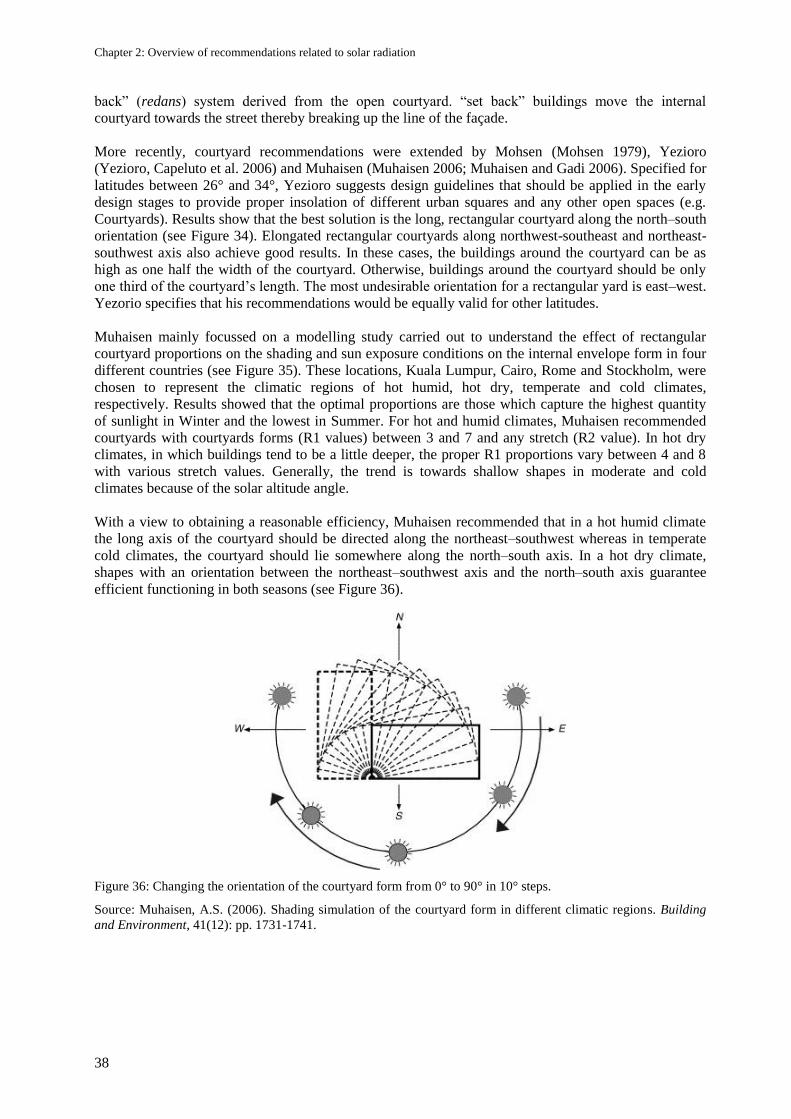
Chapter 2: Overview of recommendations related to solar radiation
38
back‖ (redans) system derived from the open courtyard. ―set back‖ buildings move the internal
courtyard towards the street thereby breaking up the line of the façade.
More recently, courtyard recommendations were extended by Mohsen (Mohsen 1979), Yezioro
(Yezioro, Capeluto et al. 2006) and Muhaisen (Muhaisen 2006; Muhaisen and Gadi 2006). Specified for
latitudes between 26° and 34°, Yezioro suggests design guidelines that should be applied in the early
design stages to provide proper insolation of different urban squares and any other open spaces (e.g.
Courtyards). Results show that the best solution is the long, rectangular courtyard along the north–south
orientation (see Figure 34). Elongated rectangular courtyards along northwest-southeast and northeast-
southwest axis also achieve good results. In these cases, the buildings around the courtyard can be as
high as one half the width of the courtyard. Otherwise, buildings around the courtyard should be only
one third of the courtyard‘s length. The most undesirable orientation for a rectangular yard is east–west.
Yezorio specifies that his recommendations would be equally valid for other latitudes.
Muhaisen mainly focussed on a modelling study carried out to understand the effect of rectangular
courtyard proportions on the shading and sun exposure conditions on the internal envelope form in four
different countries (see Figure 35). These locations, Kuala Lumpur, Cairo, Rome and Stockholm, were
chosen to represent the climatic regions of hot humid, hot dry, temperate and cold climates,
respectively. Results showed that the optimal proportions are those which capture the highest quantity
of sunlight in Winter and the lowest in Summer. For hot and humid climates, Muhaisen recommended
courtyards with courtyards forms (R1 values) between 3 and 7 and any stretch (R2 value). In hot dry
climates, in which buildings tend to be a little deeper, the proper R1 proportions vary between 4 and 8
with various stretch values. Generally, the trend is towards shallow shapes in moderate and cold
climates because of the solar altitude angle.
With a view to obtaining a reasonable efficiency, Muhaisen recommended that in a hot humid climate
the long axis of the courtyard should be directed along the northeast–southwest whereas in temperate
cold climates, the courtyard should lie somewhere along the north–south axis. In a hot dry climate,
shapes with an orientation between the northeast–southwest axis and the north–south axis guarantee
efficient functioning in both seasons (see Figure 36).
Figure 36: Changing the orientation of the courtyard form from 0° to 90° in 10° steps.
Source: Muhaisen, A.S. (2006). Shading simulation of the courtyard form in different climatic regions. Building
and Environment, 41(12): pp. 1731-1741.
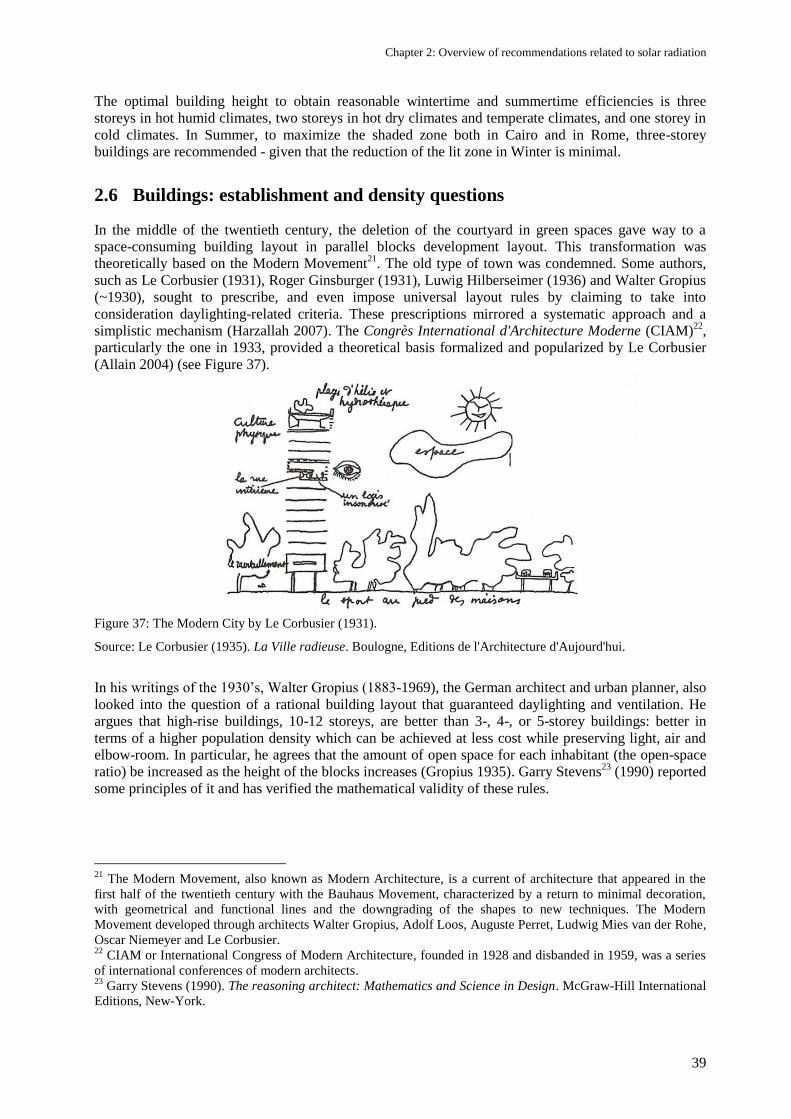
Chapter 2: Overview of recommendations related to solar radiation
39
The optimal building height to obtain reasonable wintertime and summertime efficiencies is three
storeys in hot humid climates, two storeys in hot dry climates and temperate climates, and one storey in
cold climates. In Summer, to maximize the shaded zone both in Cairo and in Rome, three-storey
buildings are recommended - given that the reduction of the lit zone in Winter is minimal.
2.6 Buildings: establishment and density questions
In the middle of the twentieth century, the deletion of the courtyard in green spaces gave way to a
space-consuming building layout in parallel blocks development layout. This transformation was
theoretically based on the Modern Movement21
. The old type of town was condemned. Some authors,
such as Le Corbusier (1931), Roger Ginsburger (1931), Luwig Hilberseimer (1936) and Walter Gropius
(~1930), sought to prescribe, and even impose universal layout rules by claiming to take into
consideration daylighting-related criteria. These prescriptions mirrored a systematic approach and a
simplistic mechanism (Harzallah 2007). The Congrès International d'Architecture Moderne (CIAM)22
,
particularly the one in 1933, provided a theoretical basis formalized and popularized by Le Corbusier
(Allain 2004) (see Figure 37).
Figure 37: The Modern City by Le Corbusier (1931).
Source: Le Corbusier (1935). La Ville radieuse. Boulogne, Editions de l'Architecture d'Aujourd'hui.
In his writings of the 1930‘s, Walter Gropius (1883-1969), the German architect and urban planner, also
looked into the question of a rational building layout that guaranteed daylighting and ventilation. He
argues that high-rise buildings, 10-12 storeys, are better than 3-, 4-, or 5-storey buildings: better in
terms of a higher population density which can be achieved at less cost while preserving light, air and
elbow-room. In particular, he agrees that the amount of open space for each inhabitant (the open-space
ratio) be increased as the height of the blocks increases (Gropius 1935). Garry Stevens23
(1990) reported
some principles of it and has verified the mathematical validity of these rules.
21
The Modern Movement, also known as Modern Architecture, is a current of architecture that appeared in the
first half of the twentieth century with the Bauhaus Movement, characterized by a return to minimal decoration,
with geometrical and functional lines and the downgrading of the shapes to new techniques. The Modern
Movement developed through architects Walter Gropius, Adolf Loos, Auguste Perret, Ludwig Mies van der Rohe,
Oscar Niemeyer and Le Corbusier. 22
CIAM or International Congress of Modern Architecture, founded in 1928 and disbanded in 1959, was a series
of international conferences of modern architects. 23
Garry Stevens (1990). The reasoning architect: Mathematics and Science in Design. McGraw-Hill International
Editions, New-York.
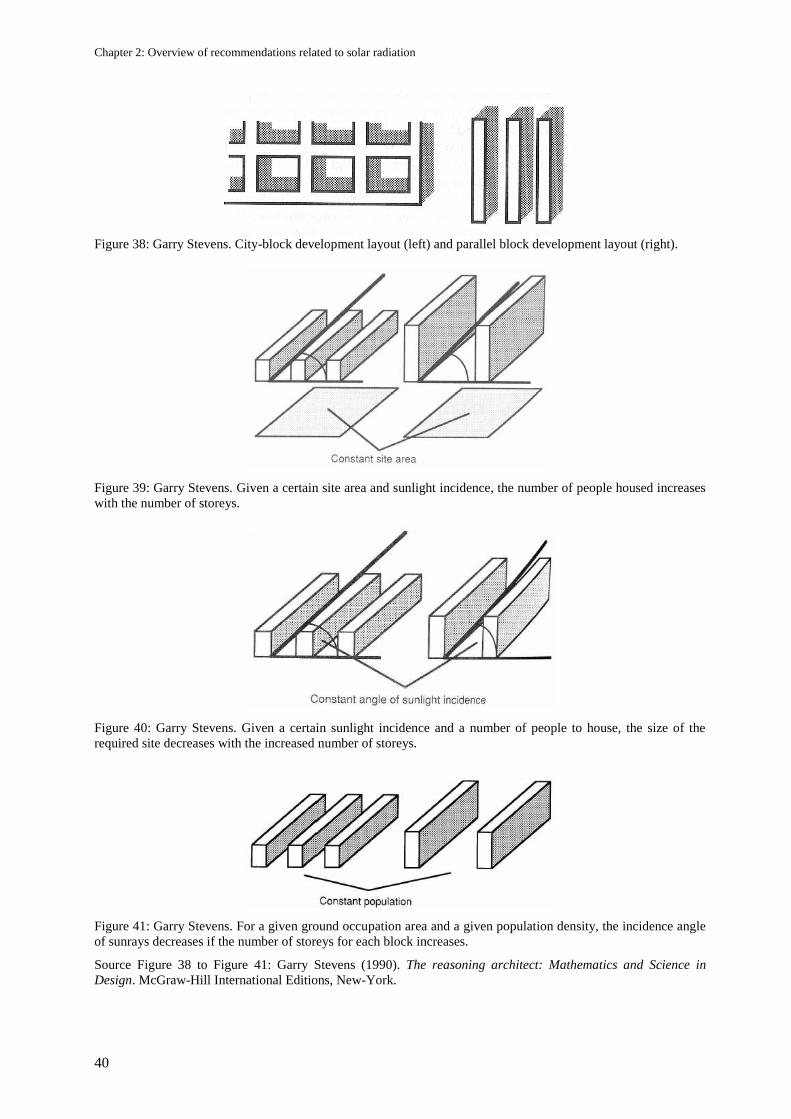
Chapter 2: Overview of recommendations related to solar radiation
40
Figure 38: Garry Stevens. City-block development layout (left) and parallel block development layout (right).
Figure 39: Garry Stevens. Given a certain site area and sunlight incidence, the number of people housed increases
with the number of storeys.
Figure 40: Garry Stevens. Given a certain sunlight incidence and a number of people to house, the size of the
required site decreases with the increased number of storeys.
Figure 41: Garry Stevens. For a given ground occupation area and a given population density, the incidence angle
of sunrays decreases if the number of storeys for each block increases.
Source Figure 38 to Figure 41: Garry Stevens (1990). The reasoning architect: Mathematics and Science in
Design. McGraw-Hill International Editions, New-York.
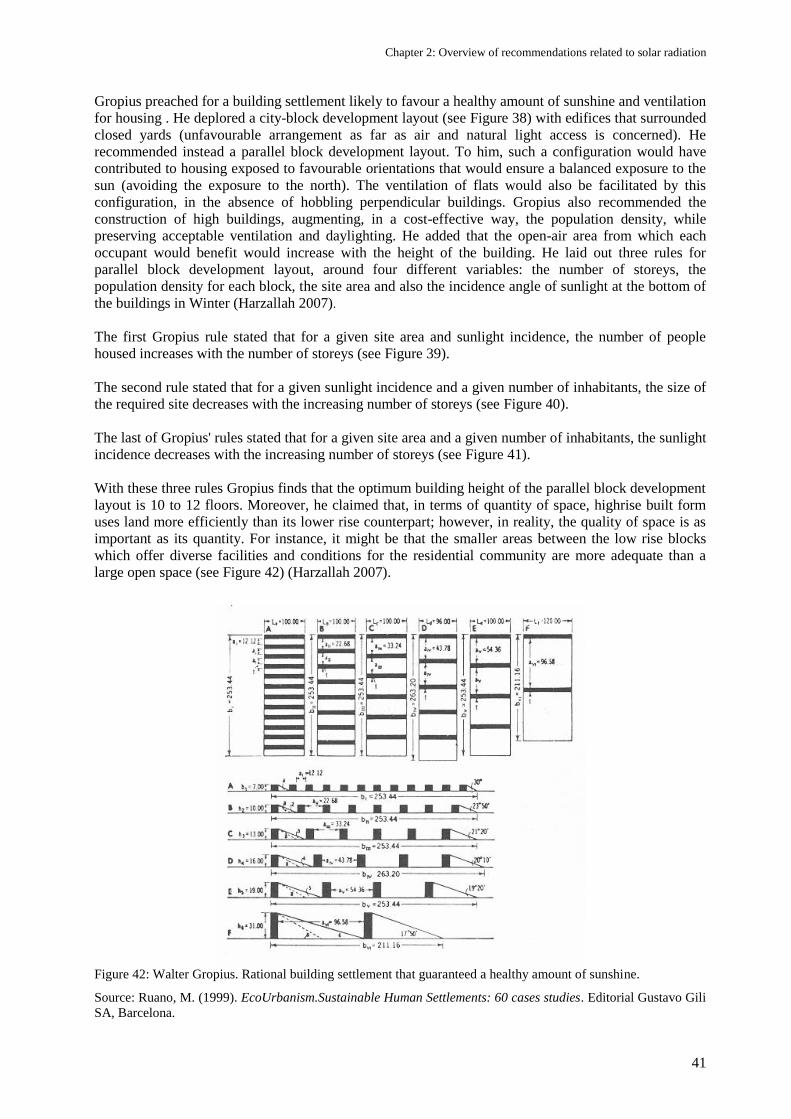
Chapter 2: Overview of recommendations related to solar radiation
41
Gropius preached for a building settlement likely to favour a healthy amount of sunshine and ventilation
for housing . He deplored a city-block development layout (see Figure 38) with edifices that surrounded
closed yards (unfavourable arrangement as far as air and natural light access is concerned). He
recommended instead a parallel block development layout. To him, such a configuration would have
contributed to housing exposed to favourable orientations that would ensure a balanced exposure to the
sun (avoiding the exposure to the north). The ventilation of flats would also be facilitated by this
configuration, in the absence of hobbling perpendicular buildings. Gropius also recommended the
construction of high buildings, augmenting, in a cost-effective way, the population density, while
preserving acceptable ventilation and daylighting. He added that the open-air area from which each
occupant would benefit would increase with the height of the building. He laid out three rules for
parallel block development layout, around four different variables: the number of storeys, the
population density for each block, the site area and also the incidence angle of sunlight at the bottom of
the buildings in Winter (Harzallah 2007).
The first Gropius rule stated that for a given site area and sunlight incidence, the number of people
housed increases with the number of storeys (see Figure 39).
The second rule stated that for a given sunlight incidence and a given number of inhabitants, the size of
the required site decreases with the increasing number of storeys (see Figure 40).
The last of Gropius' rules stated that for a given site area and a given number of inhabitants, the sunlight
incidence decreases with the increasing number of storeys (see Figure 41).
With these three rules Gropius finds that the optimum building height of the parallel block development
layout is 10 to 12 floors. Moreover, he claimed that, in terms of quantity of space, highrise built form
uses land more efficiently than its lower rise counterpart; however, in reality, the quality of space is as
important as its quantity. For instance, it might be that the smaller areas between the low rise blocks
which offer diverse facilities and conditions for the residential community are more adequate than a
large open space (see Figure 42) (Harzallah 2007).
Figure 42: Walter Gropius. Rational building settlement that guaranteed a healthy amount of sunshine.
Source: Ruano, M. (1999). EcoUrbanism.Sustainable Human Settlements: 60 cases studies. Editorial Gustavo Gili
SA, Barcelona.
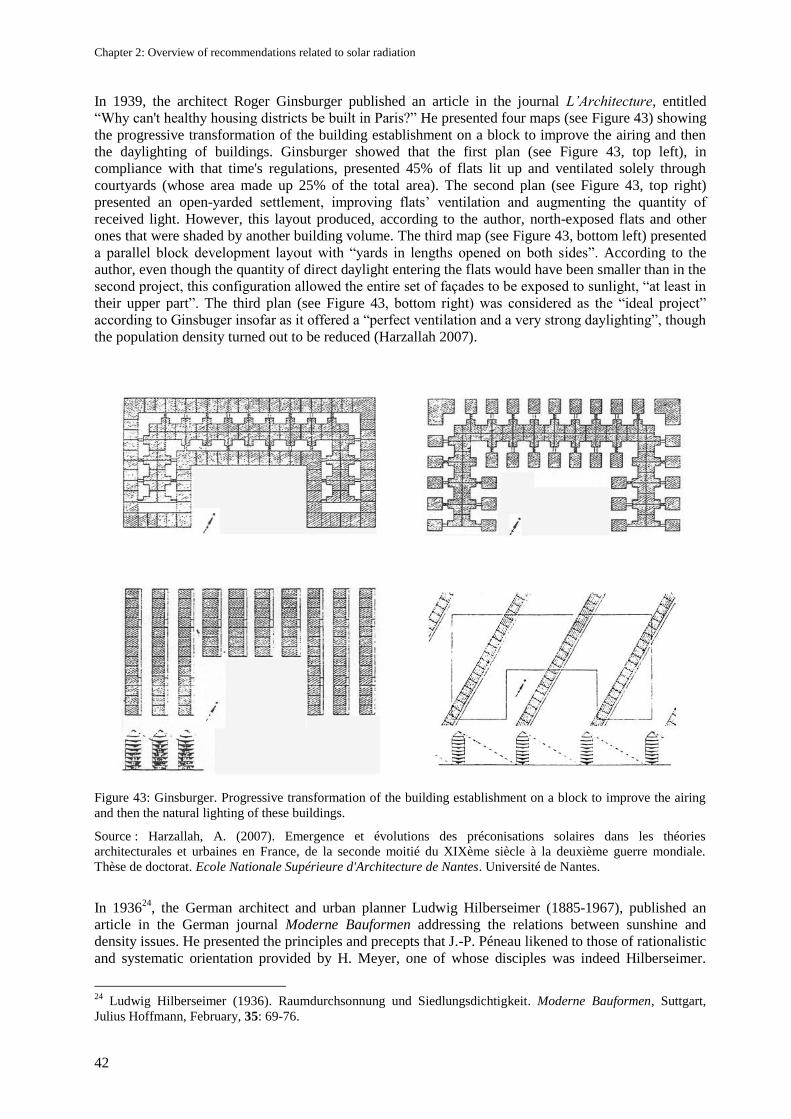
Chapter 2: Overview of recommendations related to solar radiation
42
In 1939, the architect Roger Ginsburger published an article in the journal L’Architecture, entitled
―Why can't healthy housing districts be built in Paris?‖ He presented four maps (see Figure 43) showing
the progressive transformation of the building establishment on a block to improve the airing and then
the daylighting of buildings. Ginsburger showed that the first plan (see Figure 43, top left), in
compliance with that time's regulations, presented 45% of flats lit up and ventilated solely through
courtyards (whose area made up 25% of the total area). The second plan (see Figure 43, top right)
presented an open-yarded settlement, improving flats‘ ventilation and augmenting the quantity of
received light. However, this layout produced, according to the author, north-exposed flats and other
ones that were shaded by another building volume. The third map (see Figure 43, bottom left) presented
a parallel block development layout with ―yards in lengths opened on both sides‖. According to the
author, even though the quantity of direct daylight entering the flats would have been smaller than in the
second project, this configuration allowed the entire set of façades to be exposed to sunlight, ―at least in
their upper part‖. The third plan (see Figure 43, bottom right) was considered as the ―ideal project‖
according to Ginsbuger insofar as it offered a ―perfect ventilation and a very strong daylighting‖, though
the population density turned out to be reduced (Harzallah 2007).
Figure 43: Ginsburger. Progressive transformation of the building establishment on a block to improve the airing
and then the natural lighting of these buildings.
Source : Harzallah, A. (2007). Emergence et évolutions des préconisations solaires dans les théories
architecturales et urbaines en France, de la seconde moitié du XIXème siècle à la deuxième guerre mondiale.
Thèse de doctorat. Ecole Nationale Supérieure d'Architecture de Nantes. Université de Nantes.
In 193624
, the German architect and urban planner Ludwig Hilberseimer (1885-1967), published an
article in the German journal Moderne Bauformen addressing the relations between sunshine and
density issues. He presented the principles and precepts that J.-P. Péneau likened to those of rationalistic
and systematic orientation provided by H. Meyer, one of whose disciples was indeed Hilberseimer.
24
Ludwig Hilberseimer (1936). Raumdurchsonnung und Siedlungsdichtigkeit. Moderne Bauformen, Suttgart,
Julius Hoffmann, February, 35: 69-76.
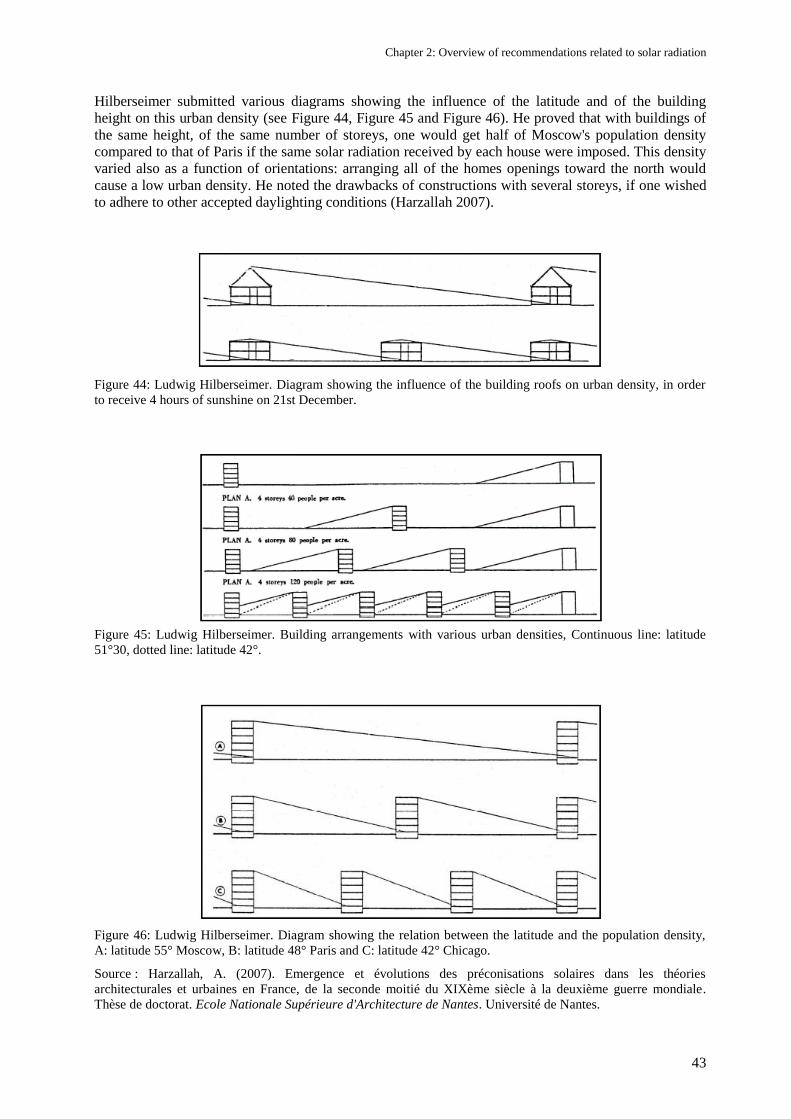
Chapter 2: Overview of recommendations related to solar radiation
43
Hilberseimer submitted various diagrams showing the influence of the latitude and of the building
height on this urban density (see Figure 44, Figure 45 and Figure 46). He proved that with buildings of
the same height, of the same number of storeys, one would get half of Moscow's population density
compared to that of Paris if the same solar radiation received by each house were imposed. This density
varied also as a function of orientations: arranging all of the homes openings toward the north would
cause a low urban density. He noted the drawbacks of constructions with several storeys, if one wished
to adhere to other accepted daylighting conditions (Harzallah 2007).
Figure 44: Ludwig Hilberseimer. Diagram showing the influence of the building roofs on urban density, in order
to receive 4 hours of sunshine on 21st December.
Figure 45: Ludwig Hilberseimer. Building arrangements with various urban densities, Continuous line: latitude
51°30, dotted line: latitude 42°.
Figure 46: Ludwig Hilberseimer. Diagram showing the relation between the latitude and the population density,
A: latitude 55° Moscow, B: latitude 48° Paris and C: latitude 42° Chicago.
Source : Harzallah, A. (2007). Emergence et évolutions des préconisations solaires dans les théories
architecturales et urbaines en France, de la seconde moitié du XIXème siècle à la deuxième guerre mondiale.
Thèse de doctorat. Ecole Nationale Supérieure d'Architecture de Nantes. Université de Nantes.
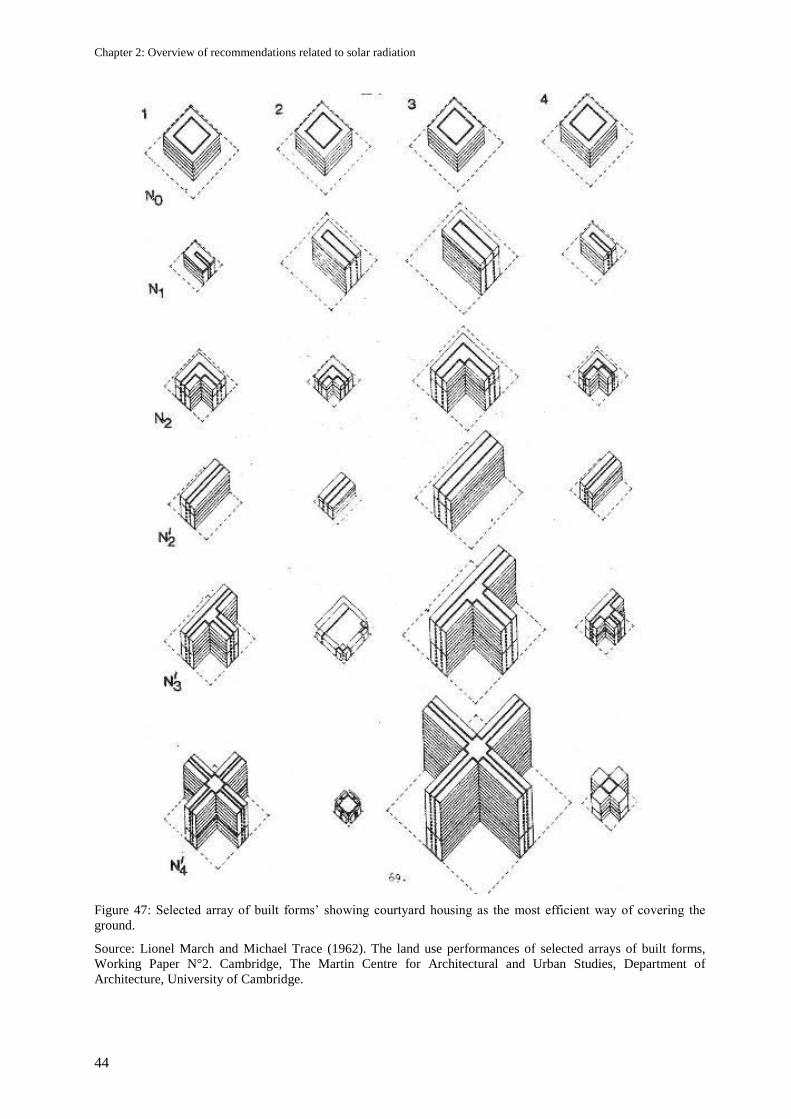
Chapter 2: Overview of recommendations related to solar radiation
44
Figure 47: Selected array of built forms‘ showing courtyard housing as the most efficient way of covering the
ground.
Source: Lionel March and Michael Trace (1962). The land use performances of selected arrays of built forms,
Working Paper N°2. Cambridge, The Martin Centre for Architectural and Urban Studies, Department of
Architecture, University of Cambridge.
Chapter 2: Overview of recommendations related to solar radiation
45
On the other hand, Lionel March of Cambridge University has reported that given a fixed obstruction
angle, the floor area ratio of an array of continuous courtyards is always greater than that of an array of
pavilions for any given number of storey (March 1972). For instance, Geoffrey Broadbent wrote that:
―It is no coincidence that in the design of Pollard’s Hill McCormack had drawn on the work of
researchers in Land Use and Built Form Studies (now The Martin Centre for Architectural and Urban
Studies) at Cambridge University. For McCormack had been a student at Cambridge University where
various permutations of Martin, March and Trace had been researching into the nature of efficient land
use. In 1968, for instance, March and Trace had published The Land Use Performance of Selected
Arrays of Built Forms. They started form Le Corbusier’s basic premises: that dwellings should be so
planned that, even on the worst day of the year, the Winter Solstice, sunlight – in the absence of clouds
– should penetrate for a minimum of two hours into each living room.
Le Corbusier, Gropius and others had used this to argue that, given the same sun-angle the slab-blocks
of the Modern Movement, wide spaced in park land were more efficient users of the land than two-
storey, three-storey, or other terrace-forms might be.
Given access to computers which the pioneers had never had, March and Trace were able to test a wide
range of building forms against the criterion of sun-penetration: terrace housing at various heights,
blocks, slabs, T-shaped and other kinds of tower, concluding that of all possible built forms, the most
efficient of all in terms of land-use would be four storey courtyards (see Figure 47).
It is hardly surprising that, working in Cambridge as they were at the time, March and Trace should be
aware of the court – or the Oxford quad – in terms of its social advantages, but their analysis of sun-
penetration was thoroughly objective and remains one of the most significant pieces of research ever to
have been undertaken on urban built form. What is extraordinary is that, with the honourable exception
of McCormack, until recently so few architects should have seized the opportunities which March and
Trace had provided for building such urban forms.
Especially since the founding father himself, Le Corbusier, had, quite intuitively, come to similar
conclusions concerning land use, which he demonstrated in the Maison Jaoul of 1955?
He built these two houses in an L-shape – obviously the corner of a courtyard – on a concrete platform
raised half a storey out of the ground. There was parking underneath and the houses themselves were
built in that assemblage of masonry – in these cases brick – with shallow vaults in concrete of the kind
which, mistakenly, Le Corbusier though to be Catalan. The houses themselves represent a thorough
recantation by the Master himself of the position he had taken up in the 1920’s. Their thick wall, thick
vault, small window construction, with its excellent thermal capacity, avoidance of solar heat gain,
admission of daylight to give sparkle where required, sound insulation properties, and so on, was a
direct, highly, personal refutation of his Five Points for a New Architecture of 1927.
Those are architectural matters but in the Jaoul Houses also, Le Corbusier attempted, very clearly, to
refute his planning ideals of the 1920’s. Here the towers and slabs have been abandoned; so have the
motorways: Instead we have a human-scale environment; the houses themselves are nowhere more than
three storeys high, on their half-storey plinth. What is more the car is stored where it should be,
underneath, thus allowing human scale to prevail at ground level” (Broadbent 1990).
March and Trace have mathematically addressed the question of which building forms make an optimal
land use. Their studies led to several postulates of which the most important is: ―It is impossible in any
arrangement of built forms to provide unobstructed floor space exceeding four times the land area‖
(March and Trace 1962).
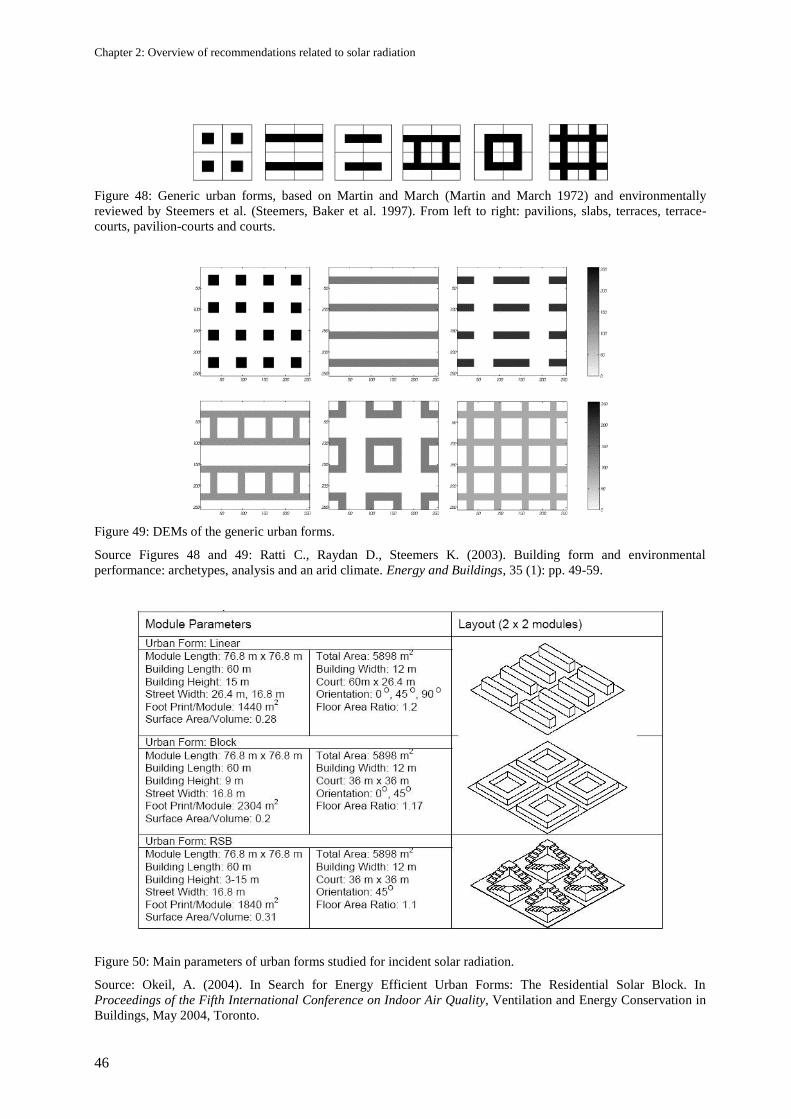
Chapter 2: Overview of recommendations related to solar radiation
46
Figure 48: Generic urban forms, based on Martin and March (Martin and March 1972) and environmentally
reviewed by Steemers et al. (Steemers, Baker et al. 1997). From left to right: pavilions, slabs, terraces, terrace-
courts, pavilion-courts and courts.
Figure 49: DEMs of the generic urban forms.
Source Figures 48 and 49: Ratti C., Raydan D., Steemers K. (2003). Building form and environmental
performance: archetypes, analysis and an arid climate. Energy and Buildings, 35 (1): pp. 49-59.
Figure 50: Main parameters of urban forms studied for incident solar radiation.
Source: Okeil, A. (2004). In Search for Energy Efficient Urban Forms: The Residential Solar Block. In
Proceedings of the Fifth International Conference on Indoor Air Quality, Ventilation and Energy Conservation in
Buildings, May 2004, Toronto.
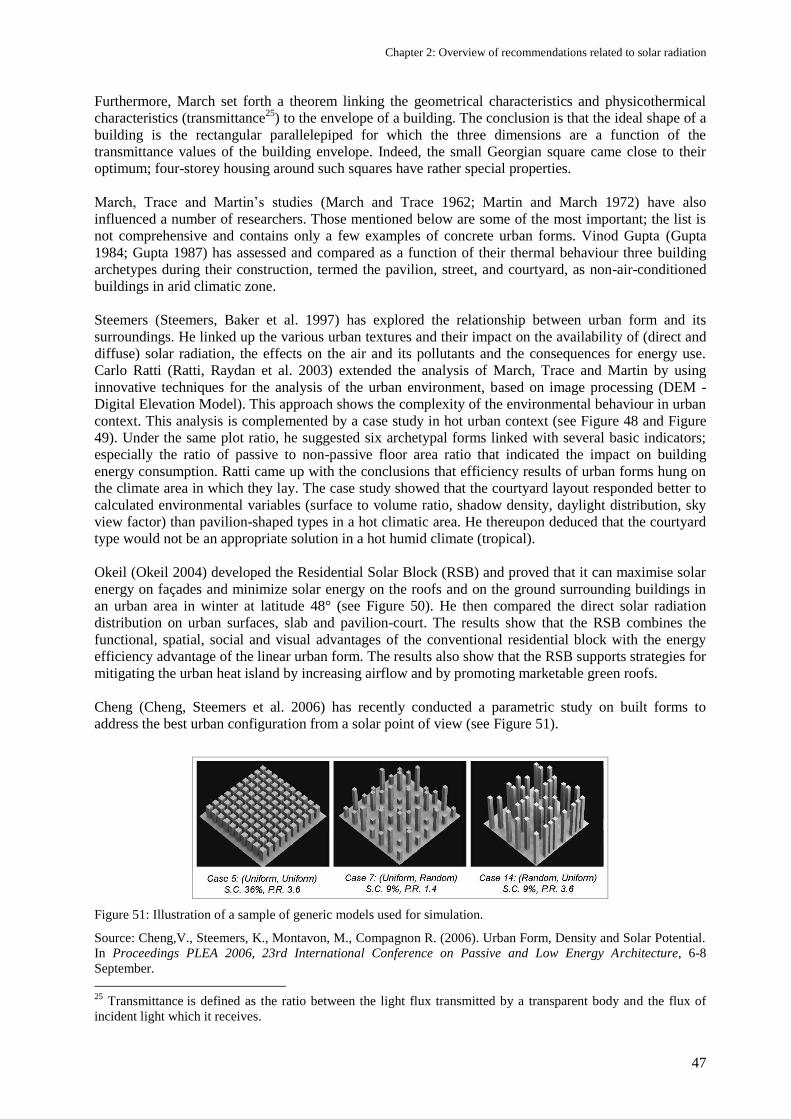
Chapter 2: Overview of recommendations related to solar radiation
47
Furthermore, March set forth a theorem linking the geometrical characteristics and physicothermical
characteristics (transmittance25
) to the envelope of a building. The conclusion is that the ideal shape of a
building is the rectangular parallelepiped for which the three dimensions are a function of the
transmittance values of the building envelope. Indeed, the small Georgian square came close to their
optimum; four-storey housing around such squares have rather special properties.
March, Trace and Martin‘s studies (March and Trace 1962; Martin and March 1972) have also
influenced a number of researchers. Those mentioned below are some of the most important; the list is
not comprehensive and contains only a few examples of concrete urban forms. Vinod Gupta (Gupta
1984; Gupta 1987) has assessed and compared as a function of their thermal behaviour three building
archetypes during their construction, termed the pavilion, street, and courtyard, as non-air-conditioned
buildings in arid climatic zone.
Steemers (Steemers, Baker et al. 1997) has explored the relationship between urban form and its
surroundings. He linked up the various urban textures and their impact on the availability of (direct and
diffuse) solar radiation, the effects on the air and its pollutants and the consequences for energy use.
Carlo Ratti (Ratti, Raydan et al. 2003) extended the analysis of March, Trace and Martin by using
innovative techniques for the analysis of the urban environment, based on image processing (DEM -
Digital Elevation Model). This approach shows the complexity of the environmental behaviour in urban
context. This analysis is complemented by a case study in hot urban context (see Figure 48 and Figure
49). Under the same plot ratio, he suggested six archetypal forms linked with several basic indicators;
especially the ratio of passive to non-passive floor area ratio that indicated the impact on building
energy consumption. Ratti came up with the conclusions that efficiency results of urban forms hung on
the climate area in which they lay. The case study showed that the courtyard layout responded better to
calculated environmental variables (surface to volume ratio, shadow density, daylight distribution, sky
view factor) than pavilion-shaped types in a hot climatic area. He thereupon deduced that the courtyard
type would not be an appropriate solution in a hot humid climate (tropical).
Okeil (Okeil 2004) developed the Residential Solar Block (RSB) and proved that it can maximise solar
energy on façades and minimize solar energy on the roofs and on the ground surrounding buildings in
an urban area in winter at latitude 48° (see Figure 50). He then compared the direct solar radiation
distribution on urban surfaces, slab and pavilion-court. The results show that the RSB combines the
functional, spatial, social and visual advantages of the conventional residential block with the energy
efficiency advantage of the linear urban form. The results also show that the RSB supports strategies for
mitigating the urban heat island by increasing airflow and by promoting marketable green roofs.
Cheng (Cheng, Steemers et al. 2006) has recently conducted a parametric study on built forms to
address the best urban configuration from a solar point of view (see Figure 51).
Figure 51: Illustration of a sample of generic models used for simulation.
Source: Cheng,V., Steemers, K., Montavon, M., Compagnon R. (2006). Urban Form, Density and Solar Potential.
In Proceedings PLEA 2006, 23rd International Conference on Passive and Low Energy Architecture, 6-8
September.
25
Transmittance is defined as the ratio between the light flux transmitted by a transparent body and the flux of
incident light which it receives.
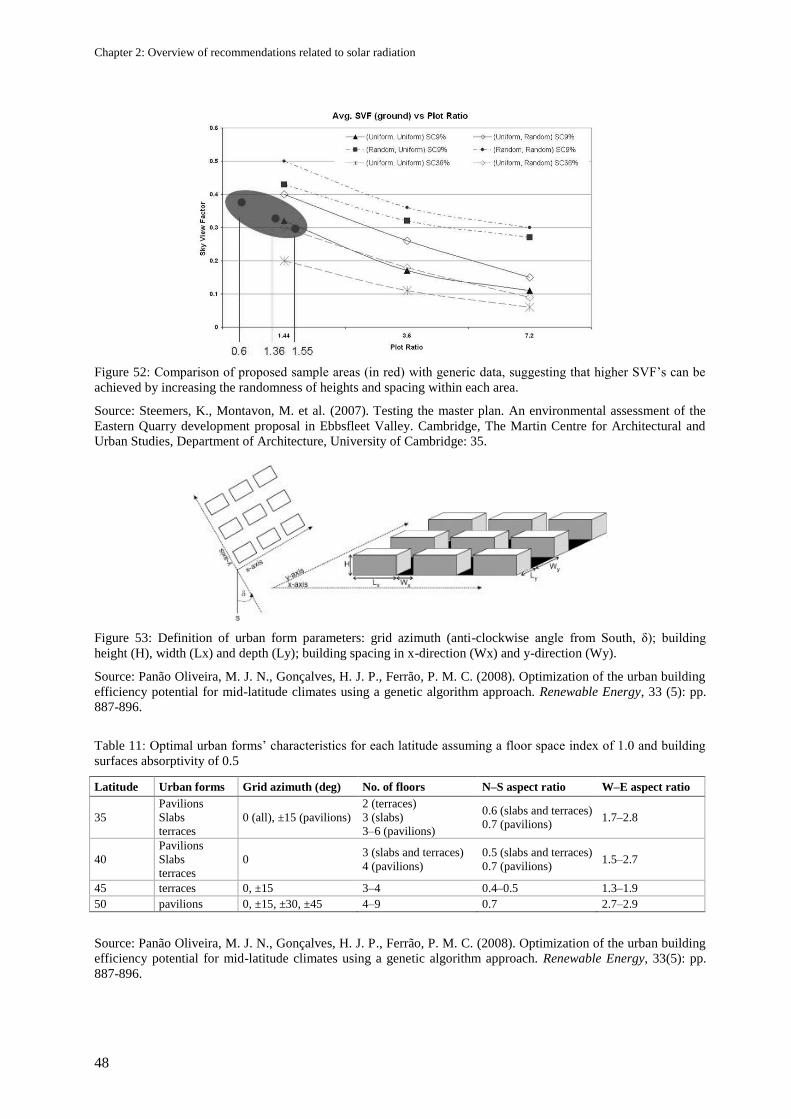
Chapter 2: Overview of recommendations related to solar radiation
48
Figure 52: Comparison of proposed sample areas (in red) with generic data, suggesting that higher SVF‘s can be
achieved by increasing the randomness of heights and spacing within each area.
Source: Steemers, K., Montavon, M. et al. (2007). Testing the master plan. An environmental assessment of the
Eastern Quarry development proposal in Ebbsfleet Valley. Cambridge, The Martin Centre for Architectural and
Urban Studies, Department of Architecture, University of Cambridge: 35.
Figure 53: Definition of urban form parameters: grid azimuth (anti-clockwise angle from South, δ); building
height (H), width (Lx) and depth (Ly); building spacing in x-direction (Wx) and y-direction (Wy).
Source: Panão Oliveira, M. J. N., Gonçalves, H. J. P., Ferrão, P. M. C. (2008). Optimization of the urban building
efficiency potential for mid-latitude climates using a genetic algorithm approach. Renewable Energy, 33 (5): pp.
887-896.
Table 11: Optimal urban forms‘ characteristics for each latitude assuming a floor space index of 1.0 and building
surfaces absorptivity of 0.5
Latitude Urban forms Grid azimuth (deg) No. of floors N–S aspect ratio W–E aspect ratio
35
Pavilions
Slabs
terraces
0 (all), ±15 (pavilions)
2 (terraces)
3 (slabs)
3–6 (pavilions)
0.6 (slabs and terraces)
0.7 (pavilions) 1.7–2.8
40
Pavilions
Slabs
terraces
0 3 (slabs and terraces)
4 (pavilions)
0.5 (slabs and terraces)
0.7 (pavilions) 1.5–2.7
45 terraces 0, ±15 3–4 0.4–0.5 1.3–1.9
50 pavilions 0, ±15, ±30, ±45 4–9 0.7 2.7–2.9
Source: Panão Oliveira, M. J. N., Gonçalves, H. J. P., Ferrão, P. M. C. (2008). Optimization of the urban building
efficiency potential for mid-latitude climates using a genetic algorithm approach. Renewable Energy, 33(5): pp.
887-896.
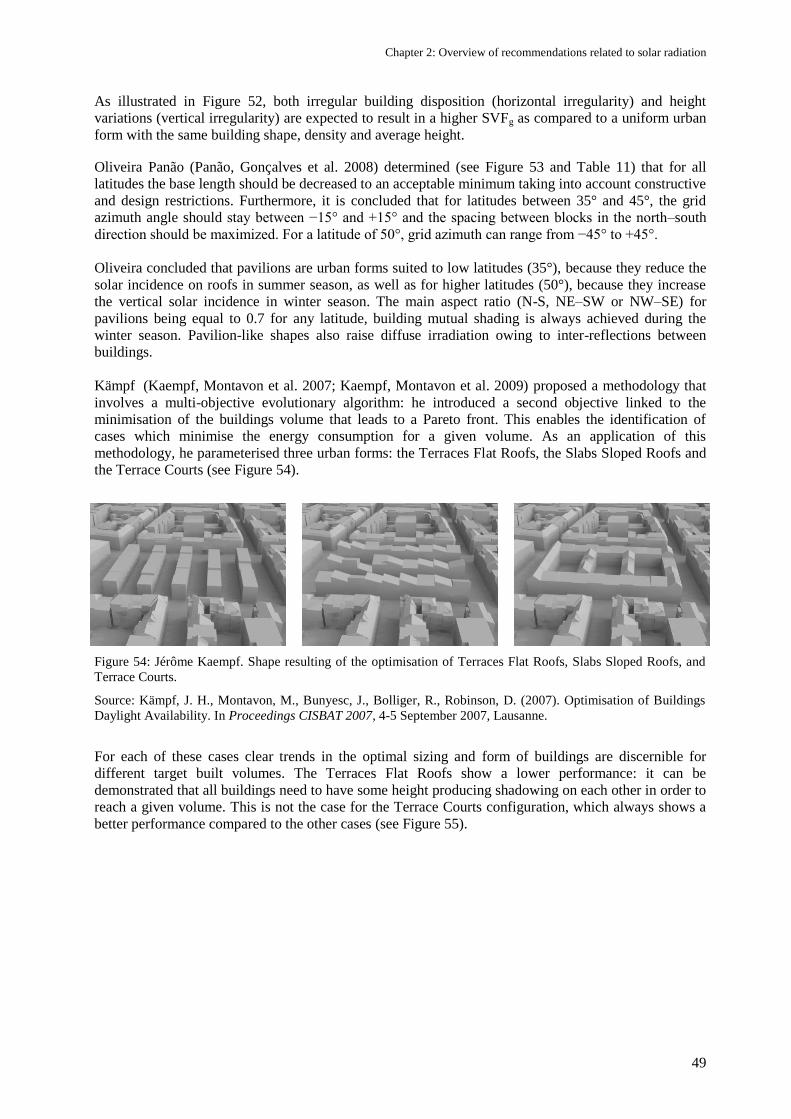
Chapter 2: Overview of recommendations related to solar radiation
49
As illustrated in Figure 52, both irregular building disposition (horizontal irregularity) and height
variations (vertical irregularity) are expected to result in a higher SVFg as compared to a uniform urban
form with the same building shape, density and average height.
Oliveira Panão (Panão, Gonçalves et al. 2008) determined (see Figure 53 and Table 11) that for all
latitudes the base length should be decreased to an acceptable minimum taking into account constructive
and design restrictions. Furthermore, it is concluded that for latitudes between 35° and 45°, the grid
azimuth angle should stay between −15° and +15° and the spacing between blocks in the north–south
direction should be maximized. For a latitude of 50°, grid azimuth can range from −45° to +45°.
Oliveira concluded that pavilions are urban forms suited to low latitudes (35°), because they reduce the
solar incidence on roofs in summer season, as well as for higher latitudes (50°), because they increase
the vertical solar incidence in winter season. The main aspect ratio (N-S, NE–SW or NW–SE) for
pavilions being equal to 0.7 for any latitude, building mutual shading is always achieved during the
winter season. Pavilion-like shapes also raise diffuse irradiation owing to inter-reflections between
buildings.
Kämpf (Kaempf, Montavon et al. 2007; Kaempf, Montavon et al. 2009) proposed a methodology that
involves a multi-objective evolutionary algorithm: he introduced a second objective linked to the
minimisation of the buildings volume that leads to a Pareto front. This enables the identification of
cases which minimise the energy consumption for a given volume. As an application of this
methodology, he parameterised three urban forms: the Terraces Flat Roofs, the Slabs Sloped Roofs and
the Terrace Courts (see Figure 54).
Figure 54: Jérôme Kaempf. Shape resulting of the optimisation of Terraces Flat Roofs, Slabs Sloped Roofs, and
Terrace Courts.
Source: Kämpf, J. H., Montavon, M., Bunyesc, J., Bolliger, R., Robinson, D. (2007). Optimisation of Buildings
Daylight Availability. In Proceedings CISBAT 2007, 4-5 September 2007, Lausanne.
For each of these cases clear trends in the optimal sizing and form of buildings are discernible for
different target built volumes. The Terraces Flat Roofs show a lower performance: it can be
demonstrated that all buildings need to have some height producing shadowing on each other in order to
reach a given volume. This is not the case for the Terrace Courts configuration, which always shows a
better performance compared to the other cases (see Figure 55).
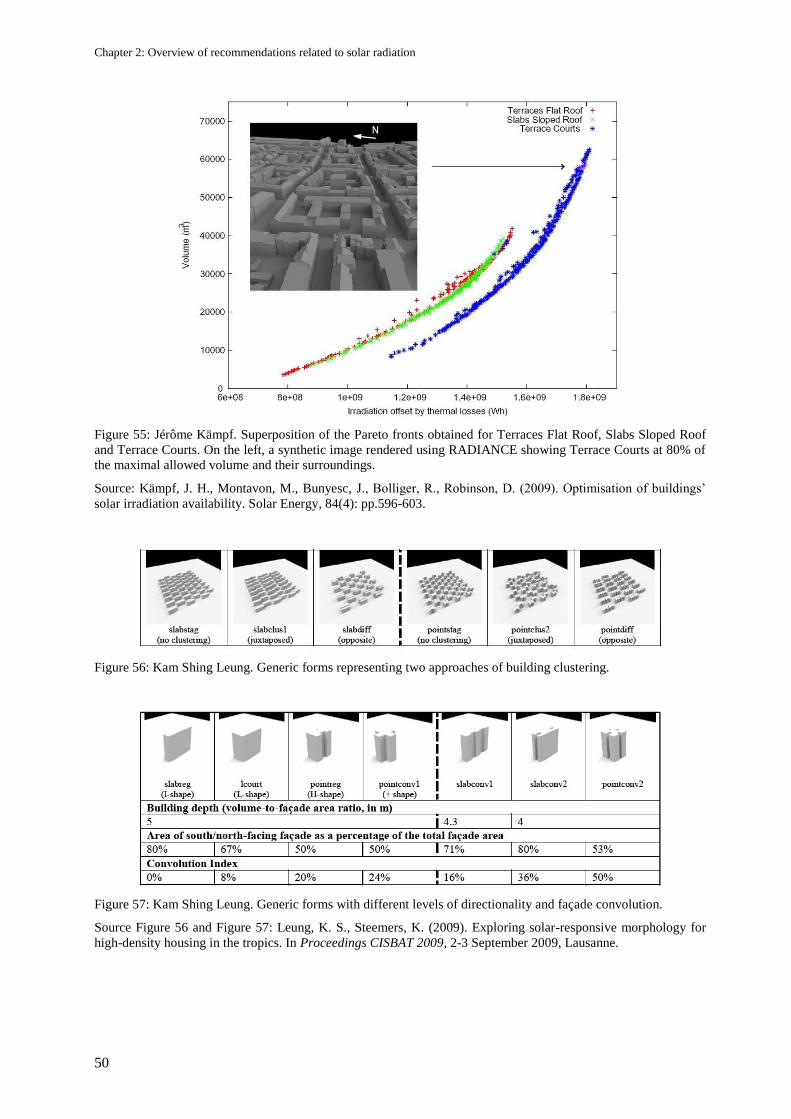
Chapter 2: Overview of recommendations related to solar radiation
50
Figure 55: Jérôme Kämpf. Superposition of the Pareto fronts obtained for Terraces Flat Roof, Slabs Sloped Roof
and Terrace Courts. On the left, a synthetic image rendered using RADIANCE showing Terrace Courts at 80% of
the maximal allowed volume and their surroundings.
Source: Kämpf, J. H., Montavon, M., Bunyesc, J., Bolliger, R., Robinson, D. (2009). Optimisation of buildings‘
solar irradiation availability. Solar Energy, 84(4): pp.596-603.
Figure 56: Kam Shing Leung. Generic forms representing two approaches of building clustering.
Figure 57: Kam Shing Leung. Generic forms with different levels of directionality and façade convolution.
Source Figure 56 and Figure 57: Leung, K. S., Steemers, K. (2009). Exploring solar-responsive morphology for
high-density housing in the tropics. In Proceedings CISBAT 2009, 2-3 September 2009, Lausanne.
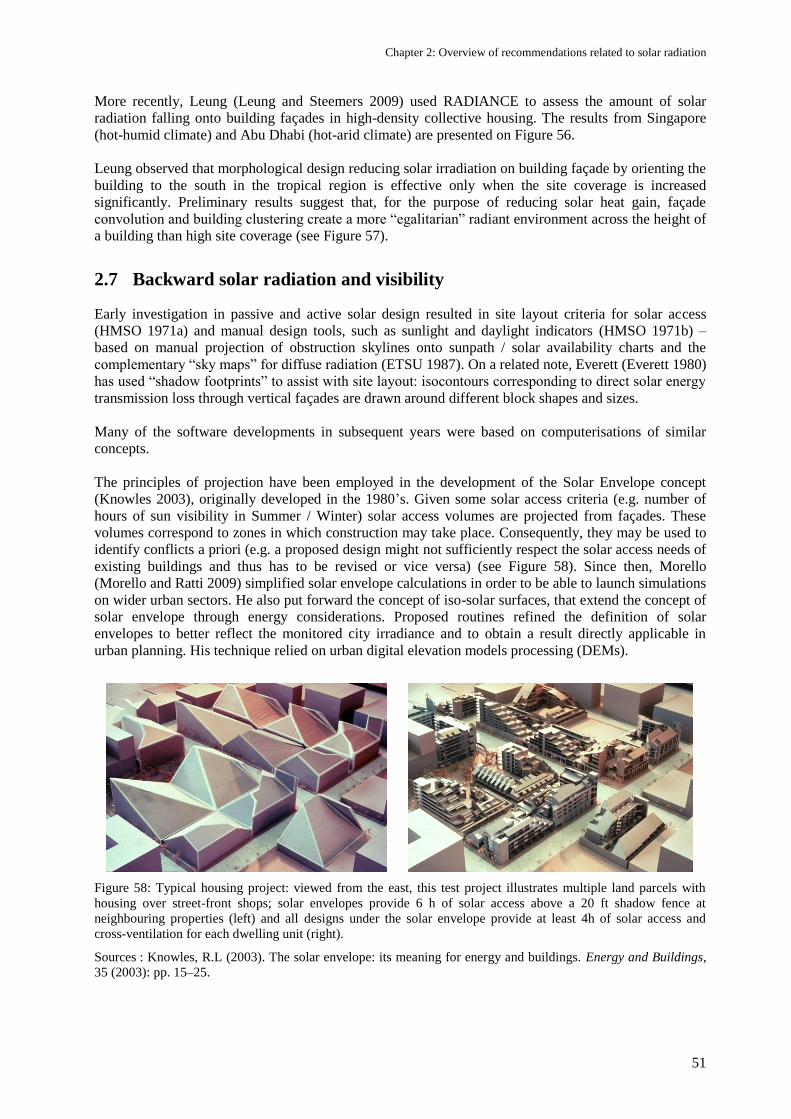
Chapter 2: Overview of recommendations related to solar radiation
51
More recently, Leung (Leung and Steemers 2009) used RADIANCE to assess the amount of solar
radiation falling onto building façades in high-density collective housing. The results from Singapore
(hot-humid climate) and Abu Dhabi (hot-arid climate) are presented on Figure 56.
Leung observed that morphological design reducing solar irradiation on building façade by orienting the
building to the south in the tropical region is effective only when the site coverage is increased
significantly. Preliminary results suggest that, for the purpose of reducing solar heat gain, façade
convolution and building clustering create a more ―egalitarian‖ radiant environment across the height of
a building than high site coverage (see Figure 57).
2.7 Backward solar radiation and visibility
Early investigation in passive and active solar design resulted in site layout criteria for solar access
(HMSO 1971a) and manual design tools, such as sunlight and daylight indicators (HMSO 1971b) –
based on manual projection of obstruction skylines onto sunpath / solar availability charts and the
complementary ―sky maps‖ for diffuse radiation (ETSU 1987). On a related note, Everett (Everett 1980)
has used ―shadow footprints‖ to assist with site layout: isocontours corresponding to direct solar energy
transmission loss through vertical façades are drawn around different block shapes and sizes.
Many of the software developments in subsequent years were based on computerisations of similar
concepts.
The principles of projection have been employed in the development of the Solar Envelope concept
(Knowles 2003), originally developed in the 1980‘s. Given some solar access criteria (e.g. number of
hours of sun visibility in Summer / Winter) solar access volumes are projected from façades. These
volumes correspond to zones in which construction may take place. Consequently, they may be used to
identify conflicts a priori (e.g. a proposed design might not sufficiently respect the solar access needs of
existing buildings and thus has to be revised or vice versa) (see Figure 58). Since then, Morello
(Morello and Ratti 2009) simplified solar envelope calculations in order to be able to launch simulations
on wider urban sectors. He also put forward the concept of iso-solar surfaces, that extend the concept of
solar envelope through energy considerations. Proposed routines refined the definition of solar
envelopes to better reflect the monitored city irradiance and to obtain a result directly applicable in
urban planning. His technique relied on urban digital elevation models processing (DEMs).
Figure 58: Typical housing project: viewed from the east, this test project illustrates multiple land parcels with
housing over street-front shops; solar envelopes provide 6 h of solar access above a 20 ft shadow fence at
neighbouring properties (left) and all designs under the solar envelope provide at least 4h of solar access and
cross-ventilation for each dwelling unit (right).
Sources : Knowles, R.L (2003). The solar envelope: its meaning for energy and buildings. Energy and Buildings,
35 (2003): pp. 15–25.
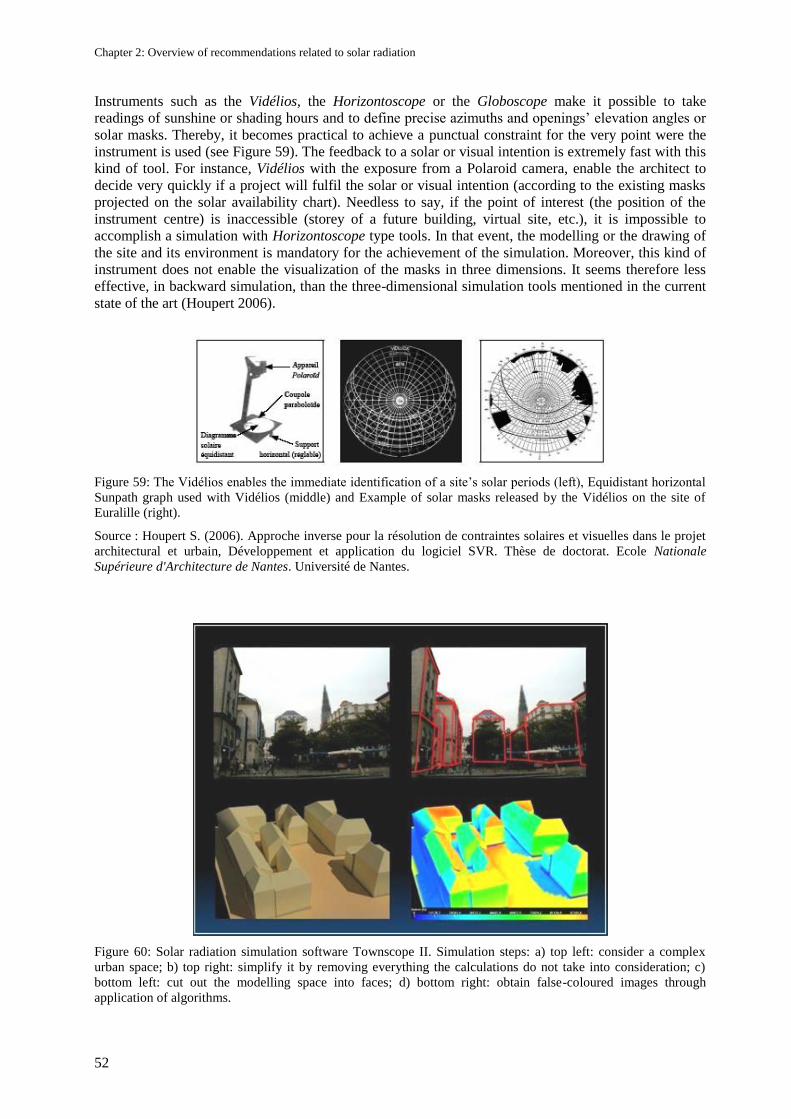
Chapter 2: Overview of recommendations related to solar radiation
52
Instruments such as the Vidélios, the Horizontoscope or the Globoscope make it possible to take
readings of sunshine or shading hours and to define precise azimuths and openings‘ elevation angles or
solar masks. Thereby, it becomes practical to achieve a punctual constraint for the very point were the
instrument is used (see Figure 59). The feedback to a solar or visual intention is extremely fast with this
kind of tool. For instance, Vidélios with the exposure from a Polaroid camera, enable the architect to
decide very quickly if a project will fulfil the solar or visual intention (according to the existing masks
projected on the solar availability chart). Needless to say, if the point of interest (the position of the
instrument centre) is inaccessible (storey of a future building, virtual site, etc.), it is impossible to
accomplish a simulation with Horizontoscope type tools. In that event, the modelling or the drawing of
the site and its environment is mandatory for the achievement of the simulation. Moreover, this kind of
instrument does not enable the visualization of the masks in three dimensions. It seems therefore less
effective, in backward simulation, than the three-dimensional simulation tools mentioned in the current
state of the art (Houpert 2006).
Figure 59: The Vidélios enables the immediate identification of a site‘s solar periods (left), Equidistant horizontal
Sunpath graph used with Vidélios (middle) and Example of solar masks released by the Vidélios on the site of
Euralille (right).
Source : Houpert S. (2006). Approche inverse pour la résolution de contraintes solaires et visuelles dans le projet
architectural et urbain, Développement et application du logiciel SVR. Thèse de doctorat. Ecole Nationale
Supérieure d'Architecture de Nantes. Université de Nantes.
Figure 60: Solar radiation simulation software Townscope II. Simulation steps: a) top left: consider a complex
urban space; b) top right: simplify it by removing everything the calculations do not take into consideration; c)
bottom left: cut out the modelling space into faces; d) bottom right: obtain false-coloured images through
application of algorithms.
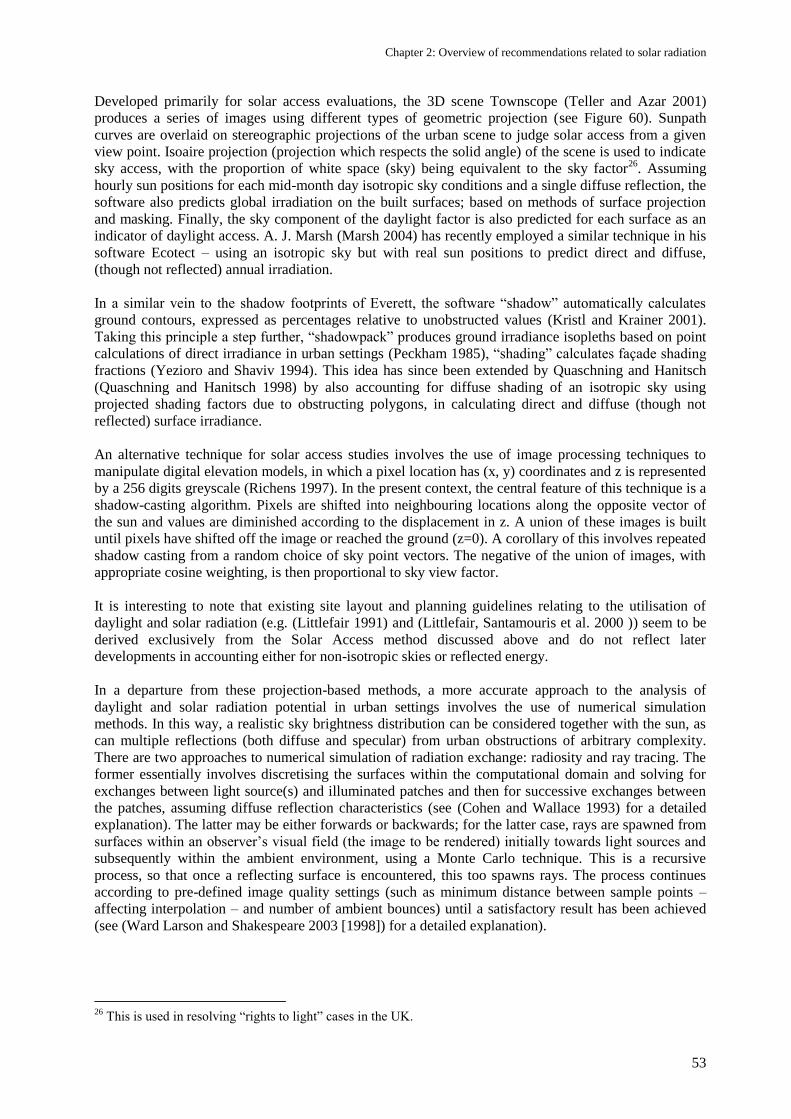
Chapter 2: Overview of recommendations related to solar radiation
53
Developed primarily for solar access evaluations, the 3D scene Townscope (Teller and Azar 2001)
produces a series of images using different types of geometric projection (see Figure 60). Sunpath
curves are overlaid on stereographic projections of the urban scene to judge solar access from a given
view point. Isoaire projection (projection which respects the solid angle) of the scene is used to indicate
sky access, with the proportion of white space (sky) being equivalent to the sky factor26
. Assuming
hourly sun positions for each mid-month day isotropic sky conditions and a single diffuse reflection, the
software also predicts global irradiation on the built surfaces; based on methods of surface projection
and masking. Finally, the sky component of the daylight factor is also predicted for each surface as an
indicator of daylight access. A. J. Marsh (Marsh 2004) has recently employed a similar technique in his
software Ecotect – using an isotropic sky but with real sun positions to predict direct and diffuse,
(though not reflected) annual irradiation.
In a similar vein to the shadow footprints of Everett, the software ―shadow‖ automatically calculates
ground contours, expressed as percentages relative to unobstructed values (Kristl and Krainer 2001).
Taking this principle a step further, ―shadowpack‖ produces ground irradiance isopleths based on point
calculations of direct irradiance in urban settings (Peckham 1985), ―shading‖ calculates façade shading
fractions (Yezioro and Shaviv 1994). This idea has since been extended by Quaschning and Hanitsch
(Quaschning and Hanitsch 1998) by also accounting for diffuse shading of an isotropic sky using
projected shading factors due to obstructing polygons, in calculating direct and diffuse (though not
reflected) surface irradiance.
An alternative technique for solar access studies involves the use of image processing techniques to
manipulate digital elevation models, in which a pixel location has (x, y) coordinates and z is represented
by a 256 digits greyscale (Richens 1997). In the present context, the central feature of this technique is a
shadow-casting algorithm. Pixels are shifted into neighbouring locations along the opposite vector of
the sun and values are diminished according to the displacement in z. A union of these images is built
until pixels have shifted off the image or reached the ground (z=0). A corollary of this involves repeated
shadow casting from a random choice of sky point vectors. The negative of the union of images, with
appropriate cosine weighting, is then proportional to sky view factor.
It is interesting to note that existing site layout and planning guidelines relating to the utilisation of
daylight and solar radiation (e.g. (Littlefair 1991) and (Littlefair, Santamouris et al. 2000 )) seem to be
derived exclusively from the Solar Access method discussed above and do not reflect later
developments in accounting either for non-isotropic skies or reflected energy.
In a departure from these projection-based methods, a more accurate approach to the analysis of
daylight and solar radiation potential in urban settings involves the use of numerical simulation
methods. In this way, a realistic sky brightness distribution can be considered together with the sun, as
can multiple reflections (both diffuse and specular) from urban obstructions of arbitrary complexity.
There are two approaches to numerical simulation of radiation exchange: radiosity and ray tracing. The
former essentially involves discretising the surfaces within the computational domain and solving for
exchanges between light source(s) and illuminated patches and then for successive exchanges between
the patches, assuming diffuse reflection characteristics (see (Cohen and Wallace 1993) for a detailed
explanation). The latter may be either forwards or backwards; for the latter case, rays are spawned from
surfaces within an observer‘s visual field (the image to be rendered) initially towards light sources and
subsequently within the ambient environment, using a Monte Carlo technique. This is a recursive
process, so that once a reflecting surface is encountered, this too spawns rays. The process continues
according to pre-defined image quality settings (such as minimum distance between sample points –
affecting interpolation – and number of ambient bounces) until a satisfactory result has been achieved
(see (Ward Larson and Shakespeare 2003 [1998]) for a detailed explanation).
26
This is used in resolving ―rights to light‖ cases in the UK.
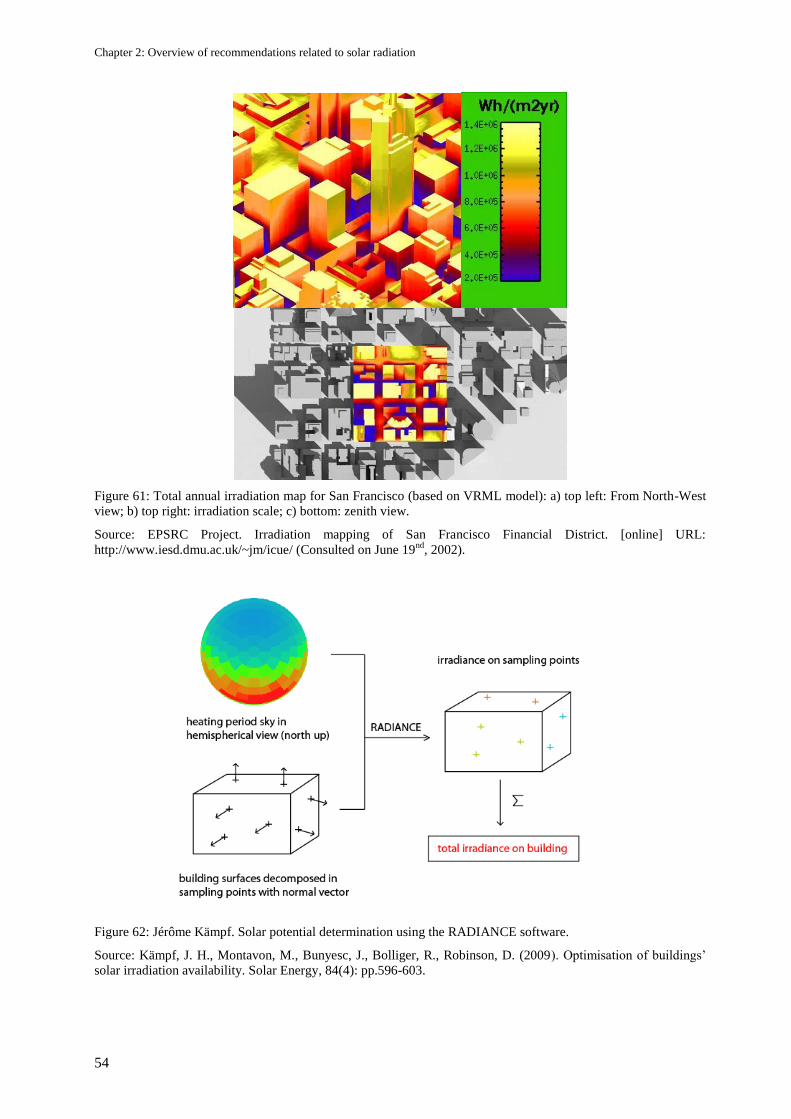
Chapter 2: Overview of recommendations related to solar radiation
54
Figure 61: Total annual irradiation map for San Francisco (based on VRML model): a) top left: From North-West
view; b) top right: irradiation scale; c) bottom: zenith view.
Source: EPSRC Project. Irradiation mapping of San Francisco Financial District. [online] URL:
http://www.iesd.dmu.ac.uk/~jm/icue/ (Consulted on June 19nd
, 2002).
Figure 62: Jérôme Kämpf. Solar potential determination using the RADIANCE software.
Source: Kämpf, J. H., Montavon, M., Bunyesc, J., Bolliger, R., Robinson, D. (2009). Optimisation of buildings‘
solar irradiation availability. Solar Energy, 84(4): pp.596-603.
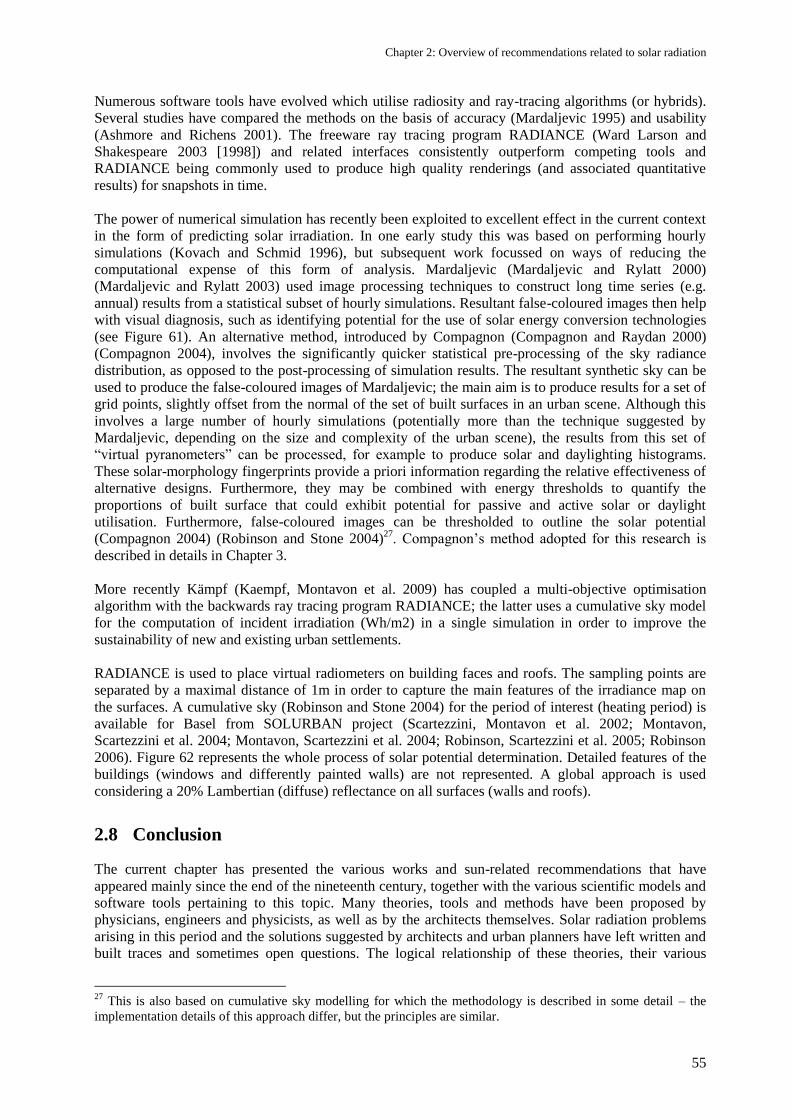
Chapter 2: Overview of recommendations related to solar radiation
55
Numerous software tools have evolved which utilise radiosity and ray-tracing algorithms (or hybrids).
Several studies have compared the methods on the basis of accuracy (Mardaljevic 1995) and usability
(Ashmore and Richens 2001). The freeware ray tracing program RADIANCE (Ward Larson and
Shakespeare 2003 [1998]) and related interfaces consistently outperform competing tools and
RADIANCE being commonly used to produce high quality renderings (and associated quantitative
results) for snapshots in time.
The power of numerical simulation has recently been exploited to excellent effect in the current context
in the form of predicting solar irradiation. In one early study this was based on performing hourly
simulations (Kovach and Schmid 1996), but subsequent work focussed on ways of reducing the
computational expense of this form of analysis. Mardaljevic (Mardaljevic and Rylatt 2000)
(Mardaljevic and Rylatt 2003) used image processing techniques to construct long time series (e.g.
annual) results from a statistical subset of hourly simulations. Resultant false-coloured images then help
with visual diagnosis, such as identifying potential for the use of solar energy conversion technologies
(see Figure 61). An alternative method, introduced by Compagnon (Compagnon and Raydan 2000)
(Compagnon 2004), involves the significantly quicker statistical pre-processing of the sky radiance
distribution, as opposed to the post-processing of simulation results. The resultant synthetic sky can be
used to produce the false-coloured images of Mardaljevic; the main aim is to produce results for a set of
grid points, slightly offset from the normal of the set of built surfaces in an urban scene. Although this
involves a large number of hourly simulations (potentially more than the technique suggested by
Mardaljevic, depending on the size and complexity of the urban scene), the results from this set of
―virtual pyranometers‖ can be processed, for example to produce solar and daylighting histograms.
These solar-morphology fingerprints provide a priori information regarding the relative effectiveness of
alternative designs. Furthermore, they may be combined with energy thresholds to quantify the
proportions of built surface that could exhibit potential for passive and active solar or daylight
utilisation. Furthermore, false-coloured images can be thresholded to outline the solar potential
(Compagnon 2004) (Robinson and Stone 2004)27
. Compagnon‘s method adopted for this research is
described in details in Chapter 3.
More recently Kämpf (Kaempf, Montavon et al. 2009) has coupled a multi-objective optimisation
algorithm with the backwards ray tracing program RADIANCE; the latter uses a cumulative sky model
for the computation of incident irradiation (Wh/m2) in a single simulation in order to improve the
sustainability of new and existing urban settlements.
RADIANCE is used to place virtual radiometers on building faces and roofs. The sampling points are
separated by a maximal distance of 1m in order to capture the main features of the irradiance map on
the surfaces. A cumulative sky (Robinson and Stone 2004) for the period of interest (heating period) is
available for Basel from SOLURBAN project (Scartezzini, Montavon et al. 2002; Montavon,
Scartezzini et al. 2004; Montavon, Scartezzini et al. 2004; Robinson, Scartezzini et al. 2005; Robinson
2006). Figure 62 represents the whole process of solar potential determination. Detailed features of the
buildings (windows and differently painted walls) are not represented. A global approach is used
considering a 20% Lambertian (diffuse) reflectance on all surfaces (walls and roofs).
2.8 Conclusion
The current chapter has presented the various works and sun-related recommendations that have
appeared mainly since the end of the nineteenth century, together with the various scientific models and
software tools pertaining to this topic. Many theories, tools and methods have been proposed by
physicians, engineers and physicists, as well as by the architects themselves. Solar radiation problems
arising in this period and the solutions suggested by architects and urban planners have left written and
built traces and sometimes open questions. The logical relationship of these theories, their various
27
This is also based on cumulative sky modelling for which the methodology is described in some detail – the
implementation details of this approach differ, but the principles are similar.
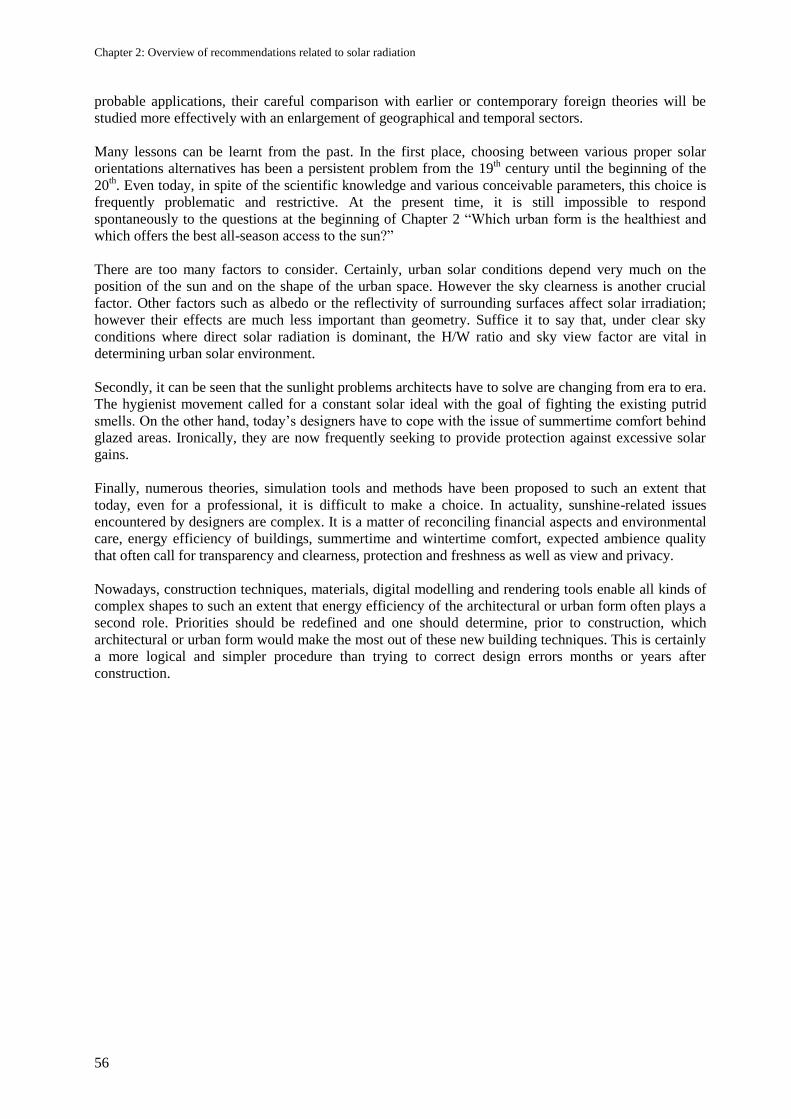
Chapter 2: Overview of recommendations related to solar radiation
56
probable applications, their careful comparison with earlier or contemporary foreign theories will be
studied more effectively with an enlargement of geographical and temporal sectors.
Many lessons can be learnt from the past. In the first place, choosing between various proper solar
orientations alternatives has been a persistent problem from the 19th century until the beginning of the
20th. Even today, in spite of the scientific knowledge and various conceivable parameters, this choice is
frequently problematic and restrictive. At the present time, it is still impossible to respond
spontaneously to the questions at the beginning of Chapter 2 ―Which urban form is the healthiest and
which offers the best all-season access to the sun?‖
There are too many factors to consider. Certainly, urban solar conditions depend very much on the
position of the sun and on the shape of the urban space. However the sky clearness is another crucial
factor. Other factors such as albedo or the reflectivity of surrounding surfaces affect solar irradiation;
however their effects are much less important than geometry. Suffice it to say that, under clear sky
conditions where direct solar radiation is dominant, the H/W ratio and sky view factor are vital in
determining urban solar environment.
Secondly, it can be seen that the sunlight problems architects have to solve are changing from era to era.
The hygienist movement called for a constant solar ideal with the goal of fighting the existing putrid
smells. On the other hand, today‘s designers have to cope with the issue of summertime comfort behind
glazed areas. Ironically, they are now frequently seeking to provide protection against excessive solar
gains.
Finally, numerous theories, simulation tools and methods have been proposed to such an extent that
today, even for a professional, it is difficult to make a choice. In actuality, sunshine-related issues
encountered by designers are complex. It is a matter of reconciling financial aspects and environmental
care, energy efficiency of buildings, summertime and wintertime comfort, expected ambience quality
that often call for transparency and clearness, protection and freshness as well as view and privacy.
Nowadays, construction techniques, materials, digital modelling and rendering tools enable all kinds of
complex shapes to such an extent that energy efficiency of the architectural or urban form often plays a
second role. Priorities should be redefined and one should determine, prior to construction, which
architectural or urban form would make the most out of these new building techniques. This is certainly
a more logical and simpler procedure than trying to correct design errors months or years after
construction.
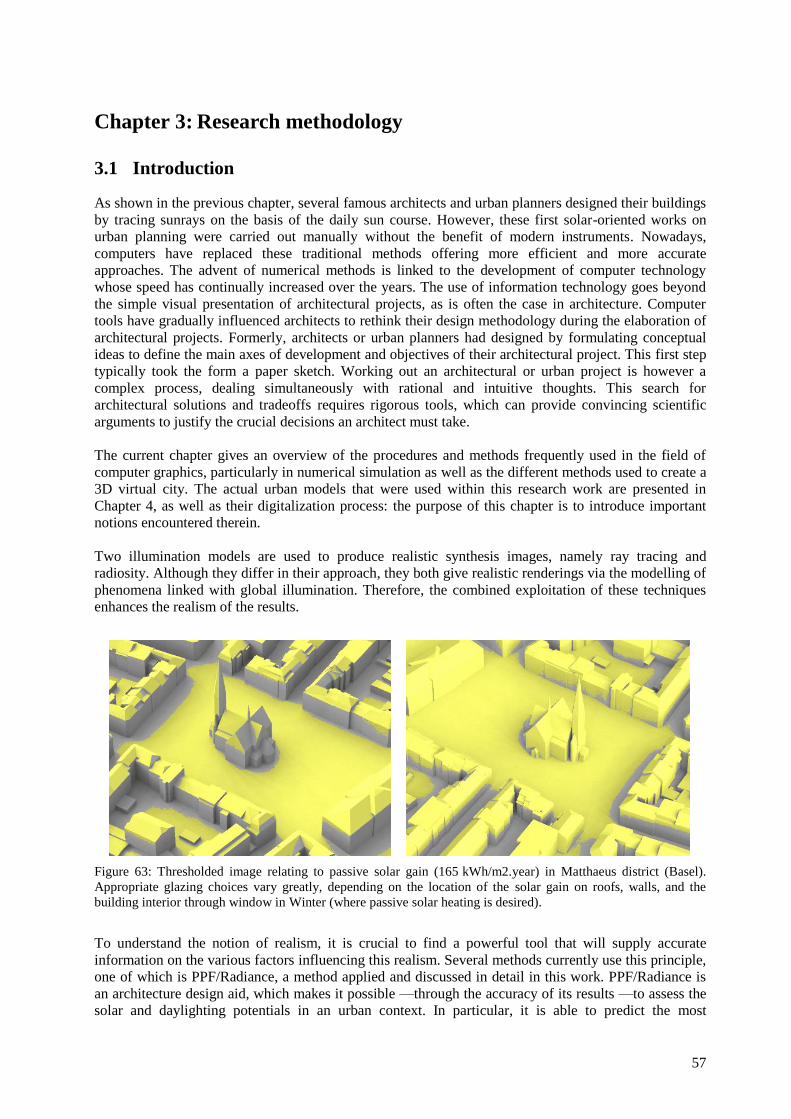
57
Chapter 3: Research methodology
3.1 Introduction
As shown in the previous chapter, several famous architects and urban planners designed their buildings
by tracing sunrays on the basis of the daily sun course. However, these first solar-oriented works on
urban planning were carried out manually without the benefit of modern instruments. Nowadays,
computers have replaced these traditional methods offering more efficient and more accurate
approaches. The advent of numerical methods is linked to the development of computer technology
whose speed has continually increased over the years. The use of information technology goes beyond
the simple visual presentation of architectural projects, as is often the case in architecture. Computer
tools have gradually influenced architects to rethink their design methodology during the elaboration of
architectural projects. Formerly, architects or urban planners had designed by formulating conceptual
ideas to define the main axes of development and objectives of their architectural project. This first step
typically took the form a paper sketch. Working out an architectural or urban project is however a
complex process, dealing simultaneously with rational and intuitive thoughts. This search for
architectural solutions and tradeoffs requires rigorous tools, which can provide convincing scientific
arguments to justify the crucial decisions an architect must take.
The current chapter gives an overview of the procedures and methods frequently used in the field of
computer graphics, particularly in numerical simulation as well as the different methods used to create a
3D virtual city. The actual urban models that were used within this research work are presented in
Chapter 4, as well as their digitalization process: the purpose of this chapter is to introduce important
notions encountered therein.
Two illumination models are used to produce realistic synthesis images, namely ray tracing and
radiosity. Although they differ in their approach, they both give realistic renderings via the modelling of
phenomena linked with global illumination. Therefore, the combined exploitation of these techniques
enhances the realism of the results.
Figure 63: Thresholded image relating to passive solar gain (165 kWh/m2.year) in Matthaeus district (Basel).
Appropriate glazing choices vary greatly, depending on the location of the solar gain on roofs, walls, and the
building interior through window in Winter (where passive solar heating is desired).
To understand the notion of realism, it is crucial to find a powerful tool that will supply accurate
information on the various factors influencing this realism. Several methods currently use this principle,
one of which is PPF/Radiance, a method applied and discussed in detail in this work. PPF/Radiance is
an architecture design aid, which makes it possible —through the accuracy of its results —to assess the
solar and daylighting potentials in an urban context. In particular, it is able to predict the most
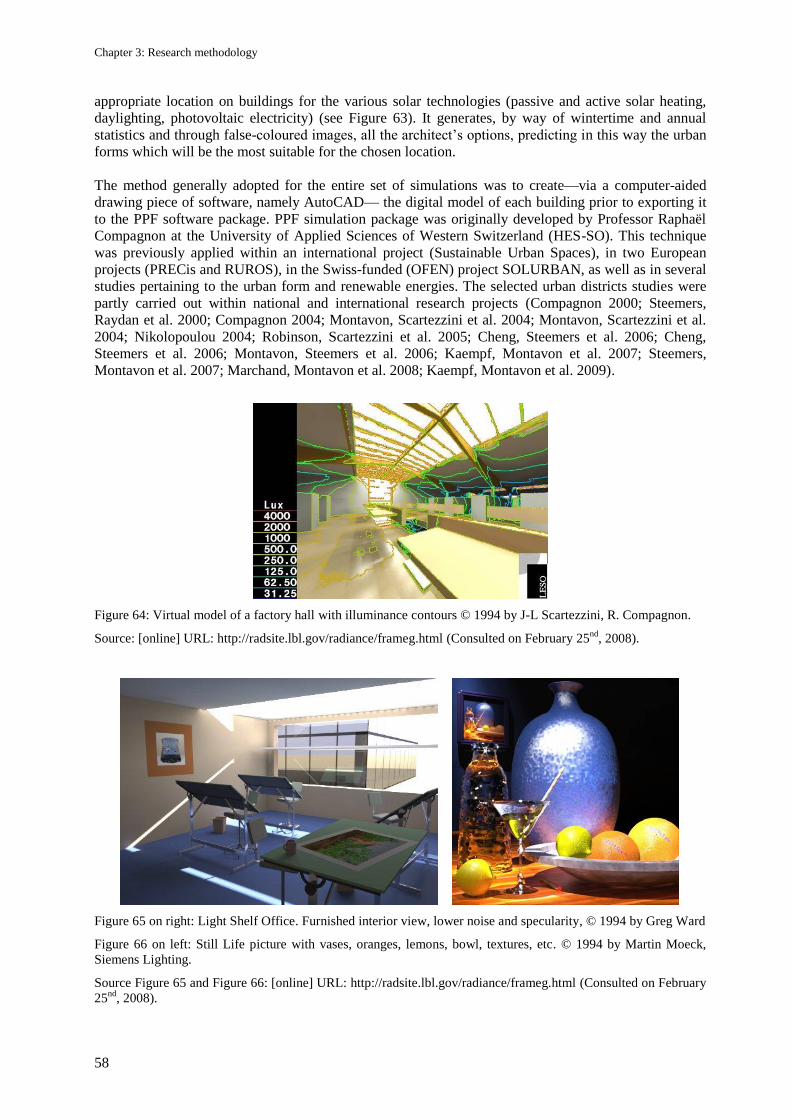
Chapter 3: Research methodology
58
appropriate location on buildings for the various solar technologies (passive and active solar heating,
daylighting, photovoltaic electricity) (see Figure 63). It generates, by way of wintertime and annual
statistics and through false-coloured images, all the architect‘s options, predicting in this way the urban
forms which will be the most suitable for the chosen location.
The method generally adopted for the entire set of simulations was to create—via a computer-aided
drawing piece of software, namely AutoCAD— the digital model of each building prior to exporting it
to the PPF software package. PPF simulation package was originally developed by Professor Raphaël
Compagnon at the University of Applied Sciences of Western Switzerland (HES-SO). This technique
was previously applied within an international project (Sustainable Urban Spaces), in two European
projects (PRECis and RUROS), in the Swiss-funded (OFEN) project SOLURBAN, as well as in several
studies pertaining to the urban form and renewable energies. The selected urban districts studies were
partly carried out within national and international research projects (Compagnon 2000; Steemers,
Raydan et al. 2000; Compagnon 2004; Montavon, Scartezzini et al. 2004; Montavon, Scartezzini et al.
2004; Nikolopoulou 2004; Robinson, Scartezzini et al. 2005; Cheng, Steemers et al. 2006; Cheng,
Steemers et al. 2006; Montavon, Steemers et al. 2006; Kaempf, Montavon et al. 2007; Steemers,
Montavon et al. 2007; Marchand, Montavon et al. 2008; Kaempf, Montavon et al. 2009).
Figure 64: Virtual model of a factory hall with illuminance contours © 1994 by J-L Scartezzini, R. Compagnon.
Source: [online] URL: http://radsite.lbl.gov/radiance/frameg.html (Consulted on February 25nd
, 2008).
Figure 65 on right: Light Shelf Office. Furnished interior view, lower noise and specularity, © 1994 by Greg Ward
Figure 66 on left: Still Life picture with vases, oranges, lemons, bowl, textures, etc. © 1994 by Martin Moeck,
Siemens Lighting.
Source Figure 65 and Figure 66: [online] URL: http://radsite.lbl.gov/radiance/frameg.html (Consulted on February
25nd
, 2008).
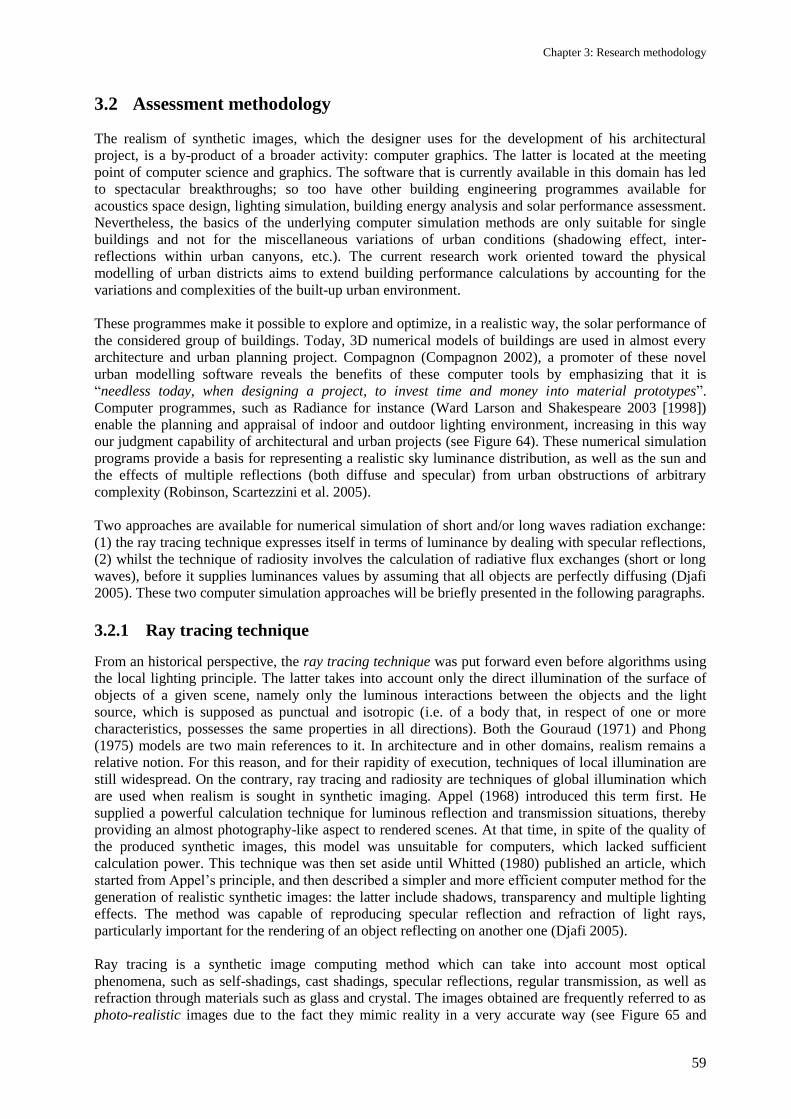
Chapter 3: Research methodology
59
3.2 Assessment methodology
The realism of synthetic images, which the designer uses for the development of his architectural
project, is a by-product of a broader activity: computer graphics. The latter is located at the meeting
point of computer science and graphics. The software that is currently available in this domain has led
to spectacular breakthroughs; so too have other building engineering programmes available for
acoustics space design, lighting simulation, building energy analysis and solar performance assessment.
Nevertheless, the basics of the underlying computer simulation methods are only suitable for single
buildings and not for the miscellaneous variations of urban conditions (shadowing effect, inter-
reflections within urban canyons, etc.). The current research work oriented toward the physical
modelling of urban districts aims to extend building performance calculations by accounting for the
variations and complexities of the built-up urban environment.
These programmes make it possible to explore and optimize, in a realistic way, the solar performance of
the considered group of buildings. Today, 3D numerical models of buildings are used in almost every
architecture and urban planning project. Compagnon (Compagnon 2002), a promoter of these novel
urban modelling software reveals the benefits of these computer tools by emphasizing that it is
―needless today, when designing a project, to invest time and money into material prototypes‖.
Computer programmes, such as Radiance for instance (Ward Larson and Shakespeare 2003 [1998])
enable the planning and appraisal of indoor and outdoor lighting environment, increasing in this way
our judgment capability of architectural and urban projects (see Figure 64). These numerical simulation
programs provide a basis for representing a realistic sky luminance distribution, as well as the sun and
the effects of multiple reflections (both diffuse and specular) from urban obstructions of arbitrary
complexity (Robinson, Scartezzini et al. 2005).
Two approaches are available for numerical simulation of short and/or long waves radiation exchange:
(1) the ray tracing technique expresses itself in terms of luminance by dealing with specular reflections,
(2) whilst the technique of radiosity involves the calculation of radiative flux exchanges (short or long
waves), before it supplies luminances values by assuming that all objects are perfectly diffusing (Djafi
2005). These two computer simulation approaches will be briefly presented in the following paragraphs.
3.2.1 Ray tracing technique
From an historical perspective, the ray tracing technique was put forward even before algorithms using
the local lighting principle. The latter takes into account only the direct illumination of the surface of
objects of a given scene, namely only the luminous interactions between the objects and the light
source, which is supposed as punctual and isotropic (i.e. of a body that, in respect of one or more
characteristics, possesses the same properties in all directions). Both the Gouraud (1971) and Phong
(1975) models are two main references to it. In architecture and in other domains, realism remains a
relative notion. For this reason, and for their rapidity of execution, techniques of local illumination are
still widespread. On the contrary, ray tracing and radiosity are techniques of global illumination which
are used when realism is sought in synthetic imaging. Appel (1968) introduced this term first. He
supplied a powerful calculation technique for luminous reflection and transmission situations, thereby
providing an almost photography-like aspect to rendered scenes. At that time, in spite of the quality of
the produced synthetic images, this model was unsuitable for computers, which lacked sufficient
calculation power. This technique was then set aside until Whitted (1980) published an article, which
started from Appel‘s principle, and then described a simpler and more efficient computer method for the
generation of realistic synthetic images: the latter include shadows, transparency and multiple lighting
effects. The method was capable of reproducing specular reflection and refraction of light rays,
particularly important for the rendering of an object reflecting on another one (Djafi 2005).
Ray tracing is a synthetic image computing method which can take into account most optical
phenomena, such as self-shadings, cast shadings, specular reflections, regular transmission, as well as
refraction through materials such as glass and crystal. The images obtained are frequently referred to as
photo-realistic images due to the fact they mimic reality in a very accurate way (see Figure 65 and
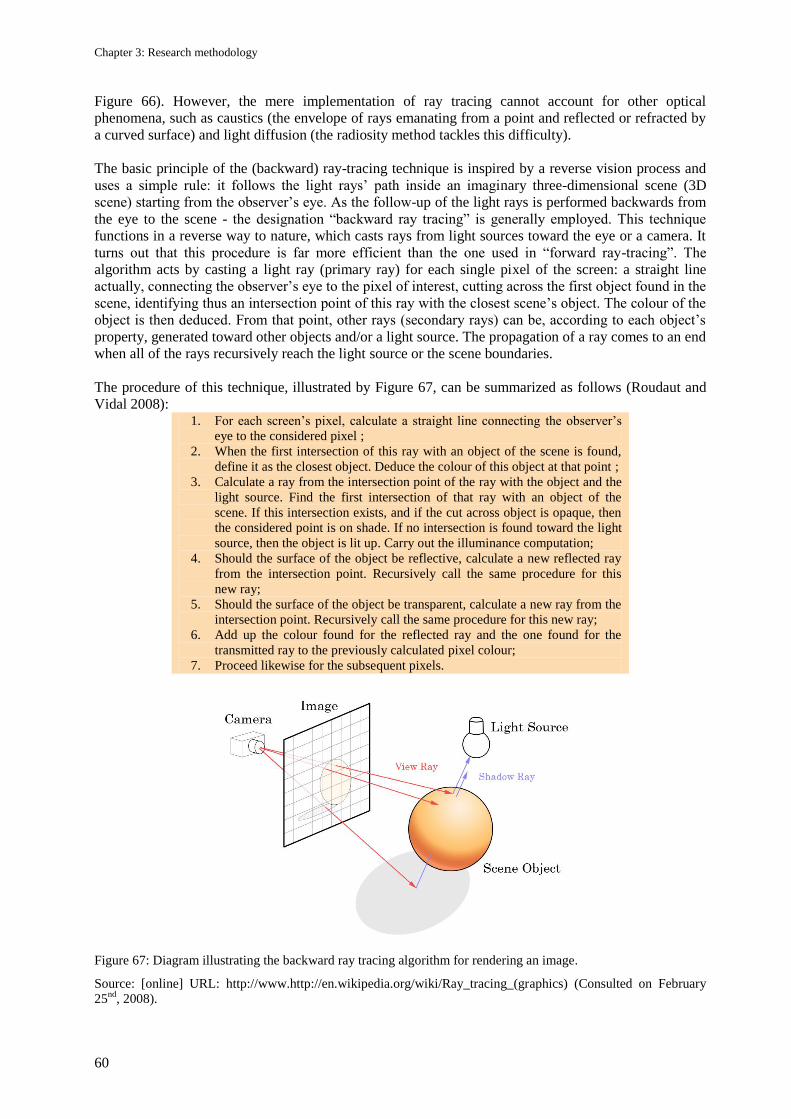
Chapter 3: Research methodology
60
Figure 66). However, the mere implementation of ray tracing cannot account for other optical
phenomena, such as caustics (the envelope of rays emanating from a point and reflected or refracted by
a curved surface) and light diffusion (the radiosity method tackles this difficulty).
The basic principle of the (backward) ray-tracing technique is inspired by a reverse vision process and
uses a simple rule: it follows the light rays‘ path inside an imaginary three-dimensional scene (3D
scene) starting from the observer‘s eye. As the follow-up of the light rays is performed backwards from
the eye to the scene - the designation ―backward ray tracing‖ is generally employed. This technique
functions in a reverse way to nature, which casts rays from light sources toward the eye or a camera. It
turns out that this procedure is far more efficient than the one used in ―forward ray-tracing‖. The
algorithm acts by casting a light ray (primary ray) for each single pixel of the screen: a straight line
actually, connecting the observer‘s eye to the pixel of interest, cutting across the first object found in the
scene, identifying thus an intersection point of this ray with the closest scene‘s object. The colour of the
object is then deduced. From that point, other rays (secondary rays) can be, according to each object‘s
property, generated toward other objects and/or a light source. The propagation of a ray comes to an end
when all of the rays recursively reach the light source or the scene boundaries.
The procedure of this technique, illustrated by Figure 67, can be summarized as follows (Roudaut and
Vidal 2008): 1. For each screen‘s pixel, calculate a straight line connecting the observer‘s
eye to the considered pixel ;
2. When the first intersection of this ray with an object of the scene is found,
define it as the closest object. Deduce the colour of this object at that point ;
3. Calculate a ray from the intersection point of the ray with the object and the
light source. Find the first intersection of that ray with an object of the
scene. If this intersection exists, and if the cut across object is opaque, then
the considered point is on shade. If no intersection is found toward the light
source, then the object is lit up. Carry out the illuminance computation;
4. Should the surface of the object be reflective, calculate a new reflected ray
from the intersection point. Recursively call the same procedure for this
new ray;
5. Should the surface of the object be transparent, calculate a new ray from the
intersection point. Recursively call the same procedure for this new ray;
6. Add up the colour found for the reflected ray and the one found for the
transmitted ray to the previously calculated pixel colour;
7. Proceed likewise for the subsequent pixels.
Figure 67: Diagram illustrating the backward ray tracing algorithm for rendering an image.
Source: [online] URL: http://www.http://en.wikipedia.org/wiki/Ray_tracing_(graphics) (Consulted on February
25nd
, 2008).
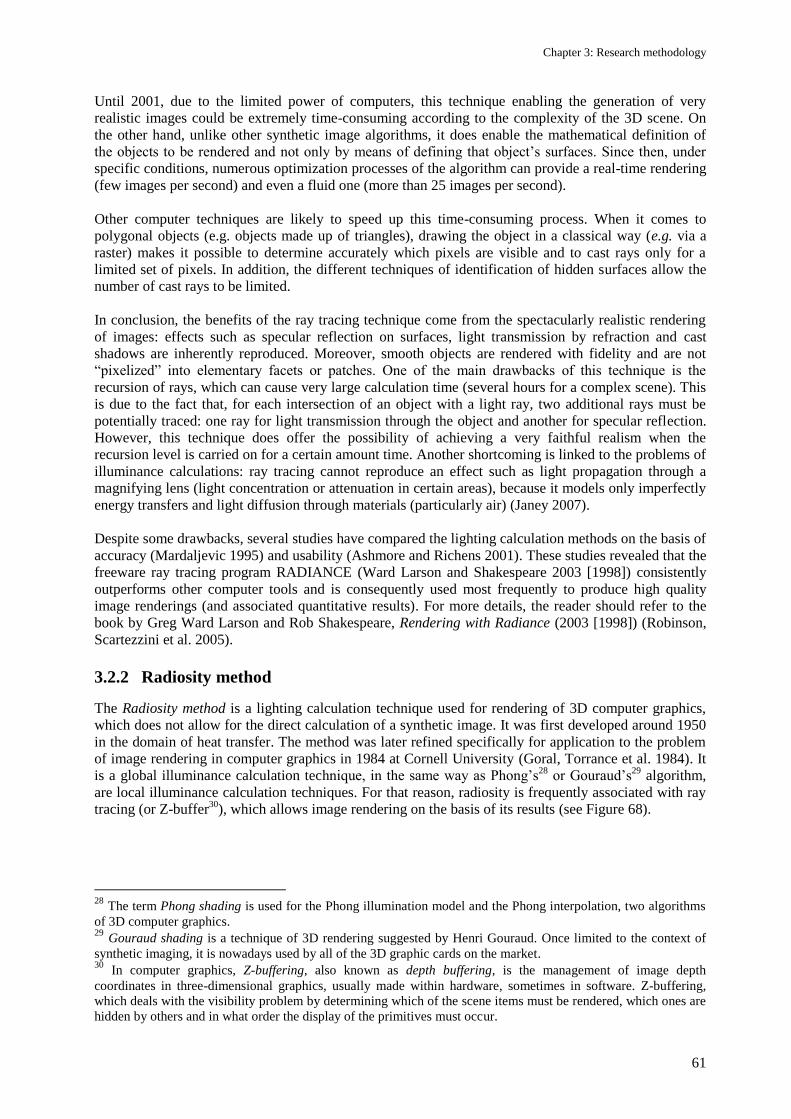
Chapter 3: Research methodology
61
Until 2001, due to the limited power of computers, this technique enabling the generation of very
realistic images could be extremely time-consuming according to the complexity of the 3D scene. On
the other hand, unlike other synthetic image algorithms, it does enable the mathematical definition of
the objects to be rendered and not only by means of defining that object‘s surfaces. Since then, under
specific conditions, numerous optimization processes of the algorithm can provide a real-time rendering
(few images per second) and even a fluid one (more than 25 images per second).
Other computer techniques are likely to speed up this time-consuming process. When it comes to
polygonal objects (e.g. objects made up of triangles), drawing the object in a classical way (e.g. via a
raster) makes it possible to determine accurately which pixels are visible and to cast rays only for a
limited set of pixels. In addition, the different techniques of identification of hidden surfaces allow the
number of cast rays to be limited.
In conclusion, the benefits of the ray tracing technique come from the spectacularly realistic rendering
of images: effects such as specular reflection on surfaces, light transmission by refraction and cast
shadows are inherently reproduced. Moreover, smooth objects are rendered with fidelity and are not
―pixelized‖ into elementary facets or patches. One of the main drawbacks of this technique is the
recursion of rays, which can cause very large calculation time (several hours for a complex scene). This
is due to the fact that, for each intersection of an object with a light ray, two additional rays must be
potentially traced: one ray for light transmission through the object and another for specular reflection.
However, this technique does offer the possibility of achieving a very faithful realism when the
recursion level is carried on for a certain amount time. Another shortcoming is linked to the problems of
illuminance calculations: ray tracing cannot reproduce an effect such as light propagation through a
magnifying lens (light concentration or attenuation in certain areas), because it models only imperfectly
energy transfers and light diffusion through materials (particularly air) (Janey 2007).
Despite some drawbacks, several studies have compared the lighting calculation methods on the basis of
accuracy (Mardaljevic 1995) and usability (Ashmore and Richens 2001). These studies revealed that the
freeware ray tracing program RADIANCE (Ward Larson and Shakespeare 2003 [1998]) consistently
outperforms other computer tools and is consequently used most frequently to produce high quality
image renderings (and associated quantitative results). For more details, the reader should refer to the
book by Greg Ward Larson and Rob Shakespeare, Rendering with Radiance (2003 [1998]) (Robinson,
Scartezzini et al. 2005).
3.2.2 Radiosity method
The Radiosity method is a lighting calculation technique used for rendering of 3D computer graphics,
which does not allow for the direct calculation of a synthetic image. It was first developed around 1950
in the domain of heat transfer. The method was later refined specifically for application to the problem
of image rendering in computer graphics in 1984 at Cornell University (Goral, Torrance et al. 1984). It
is a global illuminance calculation technique, in the same way as Phong‘s28
or Gouraud‘s29
algorithm,
are local illuminance calculation techniques. For that reason, radiosity is frequently associated with ray
tracing (or Z-buffer30
), which allows image rendering on the basis of its results (see Figure 68).
28
The term Phong shading is used for the Phong illumination model and the Phong interpolation, two algorithms
of 3D computer graphics. 29
Gouraud shading is a technique of 3D rendering suggested by Henri Gouraud. Once limited to the context of
synthetic imaging, it is nowadays used by all of the 3D graphic cards on the market. 30
In computer graphics, Z-buffering, also known as depth buffering, is the management of image depth
coordinates in three-dimensional graphics, usually made within hardware, sometimes in software. Z-buffering,
which deals with the visibility problem by determining which of the scene items must be rendered, which ones are
hidden by others and in what order the display of the primitives must occur.
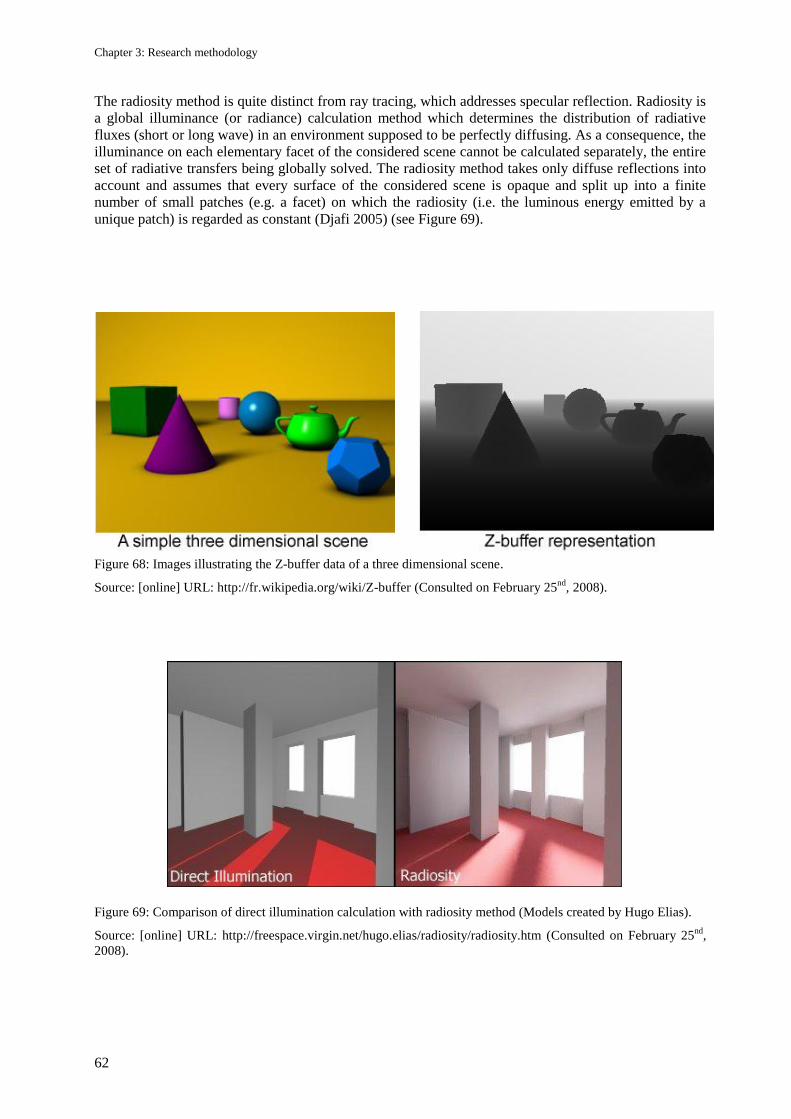
Chapter 3: Research methodology
62
The radiosity method is quite distinct from ray tracing, which addresses specular reflection. Radiosity is
a global illuminance (or radiance) calculation method which determines the distribution of radiative
fluxes (short or long wave) in an environment supposed to be perfectly diffusing. As a consequence, the
illuminance on each elementary facet of the considered scene cannot be calculated separately, the entire
set of radiative transfers being globally solved. The radiosity method takes only diffuse reflections into
account and assumes that every surface of the considered scene is opaque and split up into a finite
number of small patches (e.g. a facet) on which the radiosity (i.e. the luminous energy emitted by a
unique patch) is regarded as constant (Djafi 2005) (see Figure 69).
Figure 68: Images illustrating the Z-buffer data of a three dimensional scene.
Source: [online] URL: http://fr.wikipedia.org/wiki/Z-buffer (Consulted on February 25nd
, 2008).
Figure 69: Comparison of direct illumination calculation with radiosity method (Models created by Hugo Elias).
Source: [online] URL: http://freespace.virgin.net/hugo.elias/radiosity/radiosity.htm (Consulted on February 25nd
,
2008).
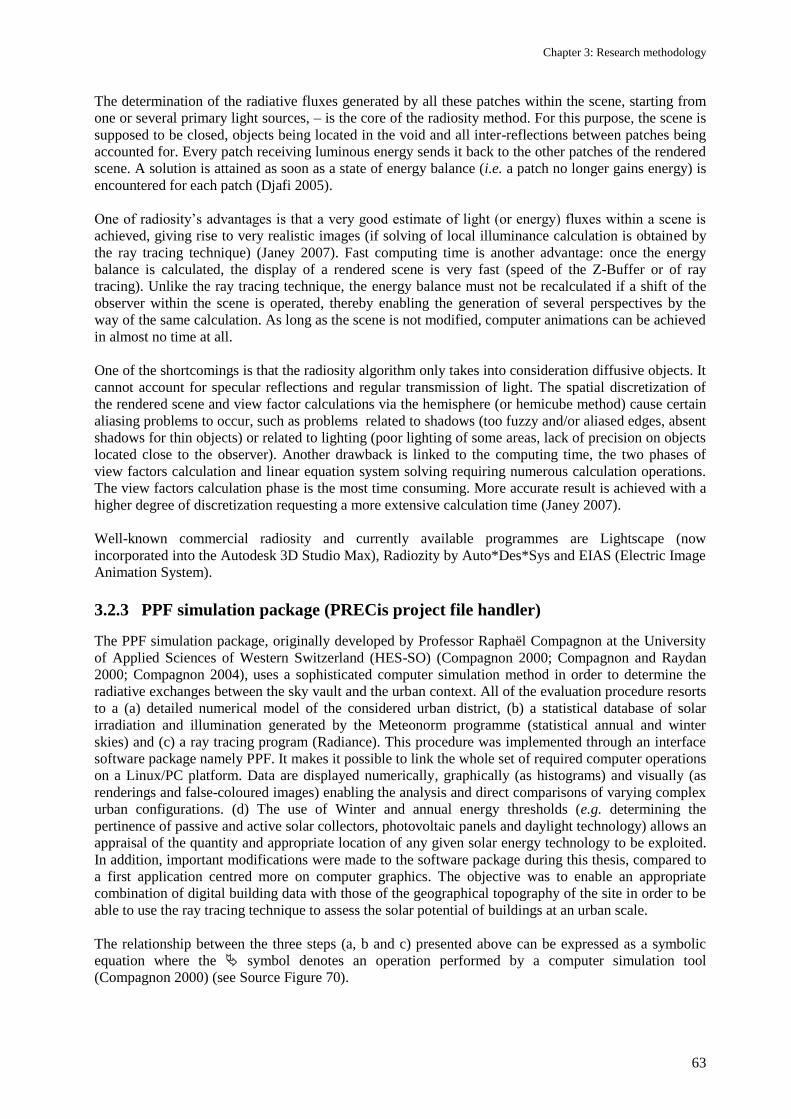
Chapter 3: Research methodology
63
The determination of the radiative fluxes generated by all these patches within the scene, starting from
one or several primary light sources, – is the core of the radiosity method. For this purpose, the scene is
supposed to be closed, objects being located in the void and all inter-reflections between patches being
accounted for. Every patch receiving luminous energy sends it back to the other patches of the rendered
scene. A solution is attained as soon as a state of energy balance (i.e. a patch no longer gains energy) is
encountered for each patch (Djafi 2005).
One of radiosity‘s advantages is that a very good estimate of light (or energy) fluxes within a scene is
achieved, giving rise to very realistic images (if solving of local illuminance calculation is obtained by
the ray tracing technique) (Janey 2007). Fast computing time is another advantage: once the energy
balance is calculated, the display of a rendered scene is very fast (speed of the Z-Buffer or of ray
tracing). Unlike the ray tracing technique, the energy balance must not be recalculated if a shift of the
observer within the scene is operated, thereby enabling the generation of several perspectives by the
way of the same calculation. As long as the scene is not modified, computer animations can be achieved
in almost no time at all.
One of the shortcomings is that the radiosity algorithm only takes into consideration diffusive objects. It
cannot account for specular reflections and regular transmission of light. The spatial discretization of
the rendered scene and view factor calculations via the hemisphere (or hemicube method) cause certain
aliasing problems to occur, such as problems related to shadows (too fuzzy and/or aliased edges, absent
shadows for thin objects) or related to lighting (poor lighting of some areas, lack of precision on objects
located close to the observer). Another drawback is linked to the computing time, the two phases of
view factors calculation and linear equation system solving requiring numerous calculation operations.
The view factors calculation phase is the most time consuming. More accurate result is achieved with a
higher degree of discretization requesting a more extensive calculation time (Janey 2007).
Well-known commercial radiosity and currently available programmes are Lightscape (now
incorporated into the Autodesk 3D Studio Max), Radiozity by Auto*Des*Sys and EIAS (Electric Image
Animation System).
3.2.3 PPF simulation package (PRECis project file handler)
The PPF simulation package, originally developed by Professor Raphaël Compagnon at the University
of Applied Sciences of Western Switzerland (HES-SO) (Compagnon 2000; Compagnon and Raydan
2000; Compagnon 2004), uses a sophisticated computer simulation method in order to determine the
radiative exchanges between the sky vault and the urban context. All of the evaluation procedure resorts
to a (a) detailed numerical model of the considered urban district, (b) a statistical database of solar
irradiation and illumination generated by the Meteonorm programme (statistical annual and winter
skies) and (c) a ray tracing program (Radiance). This procedure was implemented through an interface
software package namely PPF. It makes it possible to link the whole set of required computer operations
on a Linux/PC platform. Data are displayed numerically, graphically (as histograms) and visually (as
renderings and false-coloured images) enabling the analysis and direct comparisons of varying complex
urban configurations. (d) The use of Winter and annual energy thresholds (e.g. determining the
pertinence of passive and active solar collectors, photovoltaic panels and daylight technology) allows an
appraisal of the quantity and appropriate location of any given solar energy technology to be exploited.
In addition, important modifications were made to the software package during this thesis, compared to
a first application centred more on computer graphics. The objective was to enable an appropriate
combination of digital building data with those of the geographical topography of the site in order to be
able to use the ray tracing technique to assess the solar potential of buildings at an urban scale.
The relationship between the three steps (a, b and c) presented above can be expressed as a symbolic
equation where the symbol denotes an operation performed by a computer simulation tool
(Compagnon 2000) (see Source Figure 70).
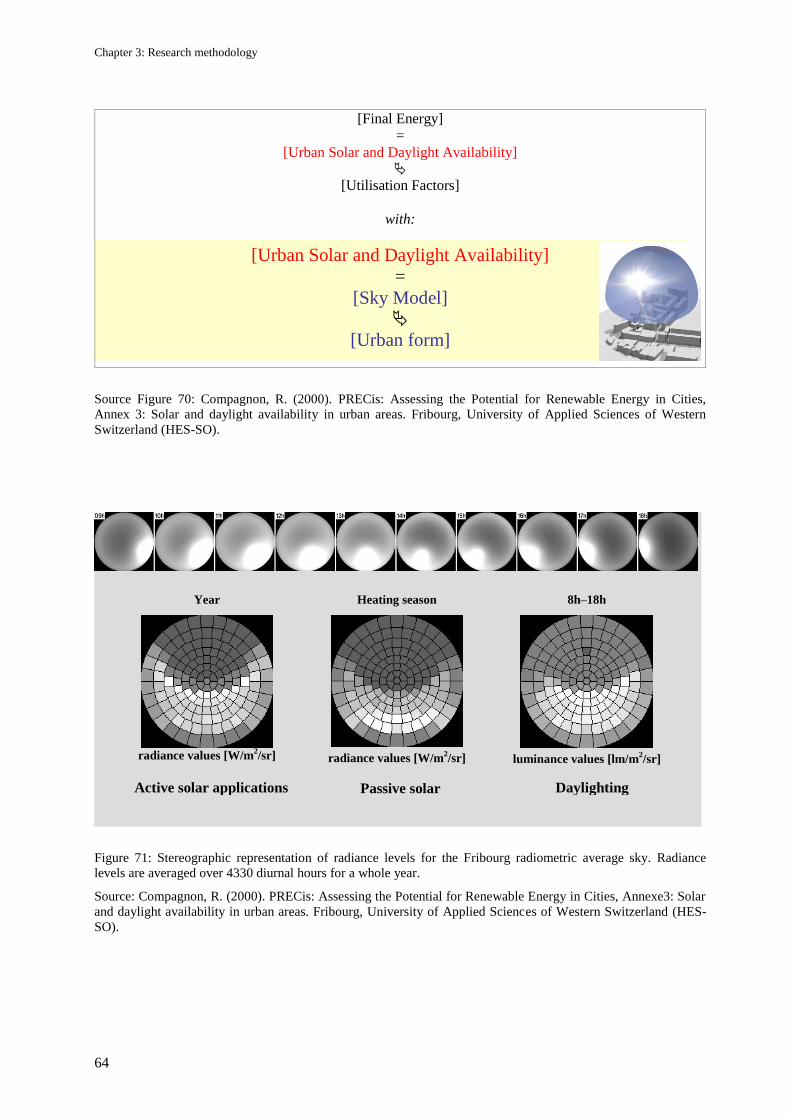
Chapter 3: Research methodology
64
[Final Energy]
=
[Urban Solar and Daylight Availability]
[Utilisation Factors]
with:
[Urban Solar and Daylight Availability]
=
[Sky Model]
[Urban form]
Source Figure 70: Compagnon, R. (2000). PRECis: Assessing the Potential for Renewable Energy in Cities,
Annex 3: Solar and daylight availability in urban areas. Fribourg, University of Applied Sciences of Western
Switzerland (HES-SO).
Figure 71: Stereographic representation of radiance levels for the Fribourg radiometric average sky. Radiance
levels are averaged over 4330 diurnal hours for a whole year.
Source: Compagnon, R. (2000). PRECis: Assessing the Potential for Renewable Energy in Cities, Annexe3: Solar
and daylight availability in urban areas. Fribourg, University of Applied Sciences of Western Switzerland (HES-
SO).
Year Heating season 8h–18h
radiance values [W/m
2/sr]
radiance values [W/m2/sr]
luminance values [lm/m2/sr]
Active solar applications Passive solar
Daylighting
Chapter 3: Research methodology
65
Essential elements31
The 3D geometry of a given neighbourhood, once defined using a 3D modelling tool such as AutoCAD,
is imported into PPF in DXF format and translated into its native ASCII format. Some basic
computations are carried out in this format, for example to deduce total built floor area (using specified
or deduced numbers of storeys). A further translation is then performed to produce a model in the
format required by the extensively validated, ray tracing program RADIANCE (Mardaljevic 1995;
Ward Larson and Shakespeare 2003 [1998]) to which the sky model is also parsed. A set of
performance-related quantities is calculated by PPF32
in order to determine the potential of urban sites to
utilise different radiation-based technologies (passive and active solar and daylighting), for which
different sky types are required.
Firstly, to assist with the interpretation of results and potentially to inform judgements regarding long
wave radiation exchange potential (e.g. for radiant cooling of buildings) a uniform overcast sky is
described. By integrating the energy received per unit sky over the hemisphere we have an irradiance I
(W.m-2
) of πR, for radiance R (W.m-2
.Sr-1
). For a unit radiance sky we can therefore calculate a sky view
factor as I/π. In contrast to this continuous treatment of sky brightness, to determine annual solar
irradiation the sky is represented as a set of 145 sky zones, each represented as a discrete but relatively
large light source (i.e. of solid angle not much less than 2π/145). The radiance of each sky zone is the
cumulative radiance over the period of interest, so that the units are Wh.m-2
.Sr-1
. When calculated over
the duration of the heating season we describe the sky required to calculate the heating season solar
irradiation. Furthermore, by multiplying the former values by a relevant luminous efficacy and by
dividing the corresponding results by the number of daylight hours, we have the sky required to
calculate annual mean illuminance (see Figure 71)
The PPF software package involves a quicker statistical pre-processing of the sky radiance distribution,
as opposed to the post-processing of simulation results used by Mardaljevic. The resulting synthetic sky
can also be used to produce false-coloured images, the principal aim being to calculate irradiance and
illuminance on a set of grid points, slightly offset from the normal of the set of built surfaces in an urban
scene. Actually, this means that measuring points (virtual radiometers) are located in the scene. Due to
Radiance‘s accuracy, they cannot be attached to façades: they have to be moved slightly. PPF includes a
parameter enabling the placement of these measuring points 5 cm away from the façade.
When used in conjunction with various thresholds, results from calculations performed using these skies
contain all of the information required by the present project. For example, results can be processed to
determine the area and proportion of built surface for which solar photovoltaic panels, solar thermal
collectors, passive solar systems and daylight responsive electric lighting will be viable (the basis upon
which these judgements is made is discussed in Section 3.3.
However, several modifications needed to be made to PPF to handle the large scale of the urban districts
under examination within this project (up to almost 1,000 ha or more – 2471 acres) as well as different
3D model formats and combinations of building and site topography models. Furthermore, a separate
easily programmable post-processor has been developed at EPFL to provide greater flexibility for
31
For the main points of this paragraph (subsections 1, 2, 4 and 5) I am indebted to Robinson, D., Scartezzini, J.-
L., Montavon, M., Compagnon, R. (2005). SOLURBAN: Solar Utilisation Potential of Urban Sites, Swiss Federal
Office for Energy (OFEN). Lausanne (Switzerland), Solar Energy and Building Physics Laboratory (LESO-PB),
Ecole Polytechnique Fédérale de Lausanne (EPFL). 32
Checking surface areas with the PPF tool was carried out during this study. A difference of 0% was recorded
between the three-dimensional models of simple geometrical shapes with AutoCAD and the surfaces produced by
PPF. Whenever the virtual model would take on serious complications, this margin of error would climb to 0.68%
for the façades and to 2.5% for the sloping roofs. In this case, the difference was minimal, thereby confirming the
validity of the PPF and the results that were presented.
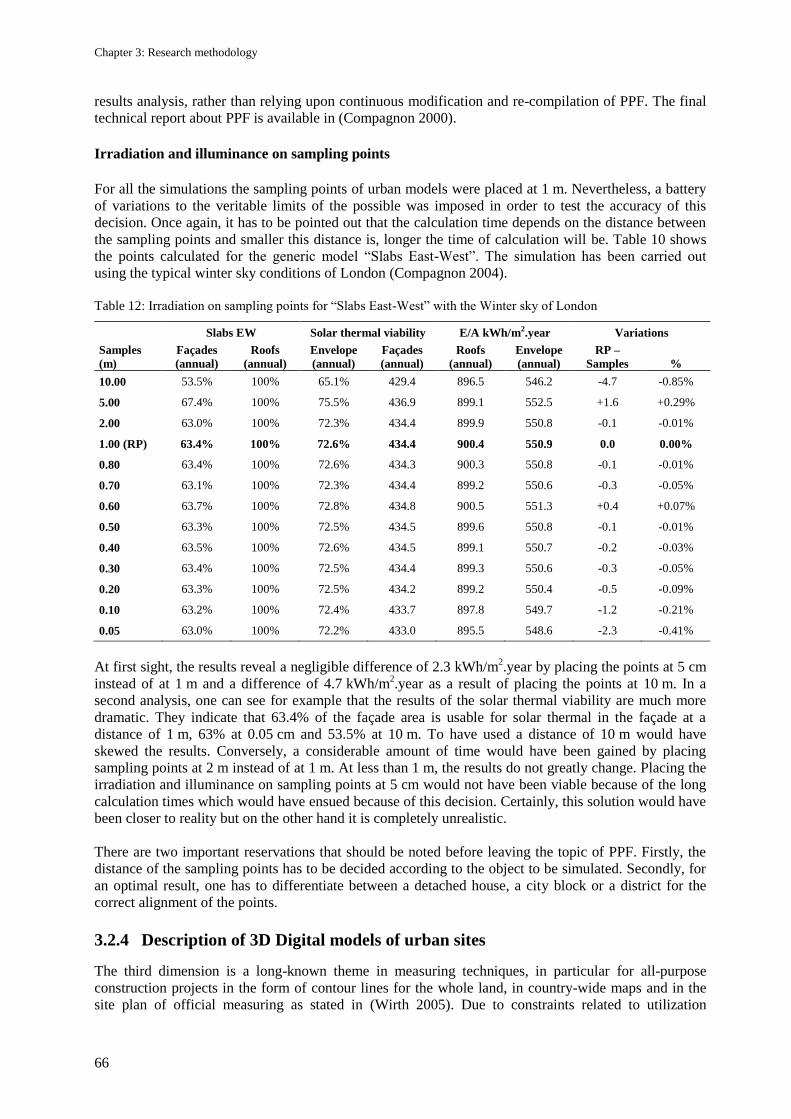
Chapter 3: Research methodology
66
results analysis, rather than relying upon continuous modification and re-compilation of PPF. The final
technical report about PPF is available in (Compagnon 2000).
Irradiation and illuminance on sampling points
For all the simulations the sampling points of urban models were placed at 1 m. Nevertheless, a battery
of variations to the veritable limits of the possible was imposed in order to test the accuracy of this
decision. Once again, it has to be pointed out that the calculation time depends on the distance between
the sampling points and smaller this distance is, longer the time of calculation will be. Table 10 shows
the points calculated for the generic model ―Slabs East-West‖. The simulation has been carried out
using the typical winter sky conditions of London (Compagnon 2004).
Table 12: Irradiation on sampling points for ―Slabs East-West‖ with the Winter sky of London
Slabs EW Solar thermal viability E/A kWh/m2.year Variations
Samples
(m)
Façades
(annual)
Roofs
(annual)
Envelope
(annual)
Façades
(annual)
Roofs
(annual)
Envelope
(annual)
RP –
Samples %
10.00 53.5% 100% 65.1% 429.4 896.5 546.2 -4.7 -0.85%
5.00 67.4% 100% 75.5% 436.9 899.1 552.5 +1.6 +0.29%
2.00 63.0% 100% 72.3% 434.4 899.9 550.8 -0.1 -0.01%
1.00 (RP) 63.4% 100% 72.6% 434.4 900.4 550.9 0.0 0.00%
0.80 63.4% 100% 72.6% 434.3 900.3 550.8 -0.1 -0.01%
0.70 63.1% 100% 72.3% 434.4 899.2 550.6 -0.3 -0.05%
0.60 63.7% 100% 72.8% 434.8 900.5 551.3 +0.4 +0.07%
0.50 63.3% 100% 72.5% 434.5 899.6 550.8 -0.1 -0.01%
0.40 63.5% 100% 72.6% 434.5 899.1 550.7 -0.2 -0.03%
0.30 63.4% 100% 72.5% 434.4 899.3 550.6 -0.3 -0.05%
0.20 63.3% 100% 72.5% 434.2 899.2 550.4 -0.5 -0.09%
0.10 63.2% 100% 72.4% 433.7 897.8 549.7 -1.2 -0.21%
0.05 63.0% 100% 72.2% 433.0 895.5 548.6 -2.3 -0.41%
At first sight, the results reveal a negligible difference of 2.3 kWh/m2.year by placing the points at 5 cm
instead of at 1 m and a difference of 4.7 kWh/m2.year as a result of placing the points at 10 m. In a
second analysis, one can see for example that the results of the solar thermal viability are much more
dramatic. They indicate that 63.4% of the façade area is usable for solar thermal in the façade at a
distance of 1 m, 63% at 0.05 cm and 53.5% at 10 m. To have used a distance of 10 m would have
skewed the results. Conversely, a considerable amount of time would have been gained by placing
sampling points at 2 m instead of at 1 m. At less than 1 m, the results do not greatly change. Placing the
irradiation and illuminance on sampling points at 5 cm would not have been viable because of the long
calculation times which would have ensued because of this decision. Certainly, this solution would have
been closer to reality but on the other hand it is completely unrealistic.
There are two important reservations that should be noted before leaving the topic of PPF. Firstly, the
distance of the sampling points has to be decided according to the object to be simulated. Secondly, for
an optimal result, one has to differentiate between a detached house, a city block or a district for the
correct alignment of the points.
3.2.4 Description of 3D Digital models of urban sites
The third dimension is a long-known theme in measuring techniques, in particular for all-purpose
construction projects in the form of contour lines for the whole land, in country-wide maps and in the
site plan of official measuring as stated in (Wirth 2005). Due to constraints related to utilization
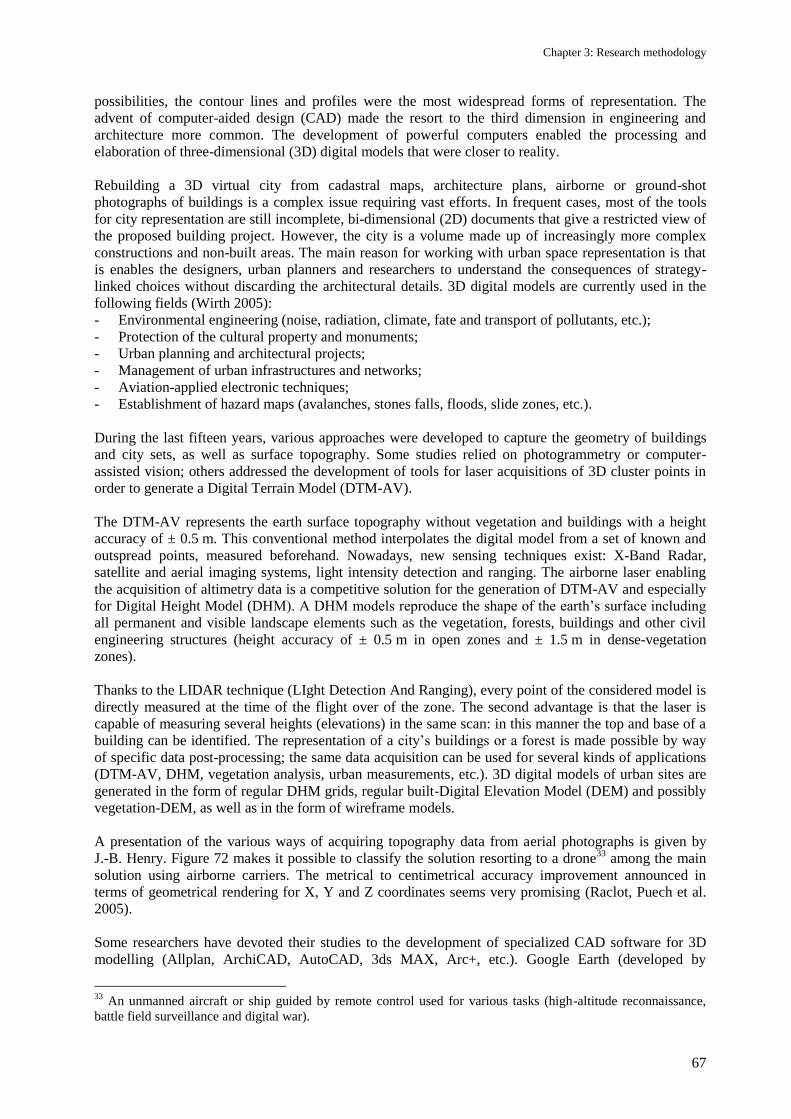
Chapter 3: Research methodology
67
possibilities, the contour lines and profiles were the most widespread forms of representation. The
advent of computer-aided design (CAD) made the resort to the third dimension in engineering and
architecture more common. The development of powerful computers enabled the processing and
elaboration of three-dimensional (3D) digital models that were closer to reality.
Rebuilding a 3D virtual city from cadastral maps, architecture plans, airborne or ground-shot
photographs of buildings is a complex issue requiring vast efforts. In frequent cases, most of the tools
for city representation are still incomplete, bi-dimensional (2D) documents that give a restricted view of
the proposed building project. However, the city is a volume made up of increasingly more complex
constructions and non-built areas. The main reason for working with urban space representation is that
is enables the designers, urban planners and researchers to understand the consequences of strategy-
linked choices without discarding the architectural details. 3D digital models are currently used in the
following fields (Wirth 2005):
- Environmental engineering (noise, radiation, climate, fate and transport of pollutants, etc.);
- Protection of the cultural property and monuments;
- Urban planning and architectural projects;
- Management of urban infrastructures and networks;
- Aviation-applied electronic techniques;
- Establishment of hazard maps (avalanches, stones falls, floods, slide zones, etc.).
During the last fifteen years, various approaches were developed to capture the geometry of buildings
and city sets, as well as surface topography. Some studies relied on photogrammetry or computer-
assisted vision; others addressed the development of tools for laser acquisitions of 3D cluster points in
order to generate a Digital Terrain Model (DTM-AV).
The DTM-AV represents the earth surface topography without vegetation and buildings with a height
accuracy of ± 0.5 m. This conventional method interpolates the digital model from a set of known and
outspread points, measured beforehand. Nowadays, new sensing techniques exist: X-Band Radar,
satellite and aerial imaging systems, light intensity detection and ranging. The airborne laser enabling
the acquisition of altimetry data is a competitive solution for the generation of DTM-AV and especially
for Digital Height Model (DHM). A DHM models reproduce the shape of the earth‘s surface including
all permanent and visible landscape elements such as the vegetation, forests, buildings and other civil
engineering structures (height accuracy of ± 0.5 m in open zones and ± 1.5 m in dense-vegetation
zones).
Thanks to the LIDAR technique (LIght Detection And Ranging), every point of the considered model is
directly measured at the time of the flight over of the zone. The second advantage is that the laser is
capable of measuring several heights (elevations) in the same scan: in this manner the top and base of a
building can be identified. The representation of a city‘s buildings or a forest is made possible by way
of specific data post-processing; the same data acquisition can be used for several kinds of applications
(DTM-AV, DHM, vegetation analysis, urban measurements, etc.). 3D digital models of urban sites are
generated in the form of regular DHM grids, regular built-Digital Elevation Model (DEM) and possibly
vegetation-DEM, as well as in the form of wireframe models.
A presentation of the various ways of acquiring topography data from aerial photographs is given by
J.-B. Henry. Figure 72 makes it possible to classify the solution resorting to a drone33
among the main
solution using airborne carriers. The metrical to centimetrical accuracy improvement announced in
terms of geometrical rendering for X, Y and Z coordinates seems very promising (Raclot, Puech et al.
2005).
Some researchers have devoted their studies to the development of specialized CAD software for 3D
modelling (Allplan, ArchiCAD, AutoCAD, 3ds MAX, Arc+, etc.). Google Earth (developed by
33
An unmanned aircraft or ship guided by remote control used for various tasks (high-altitude reconnaissance,
battle field surveillance and digital war).
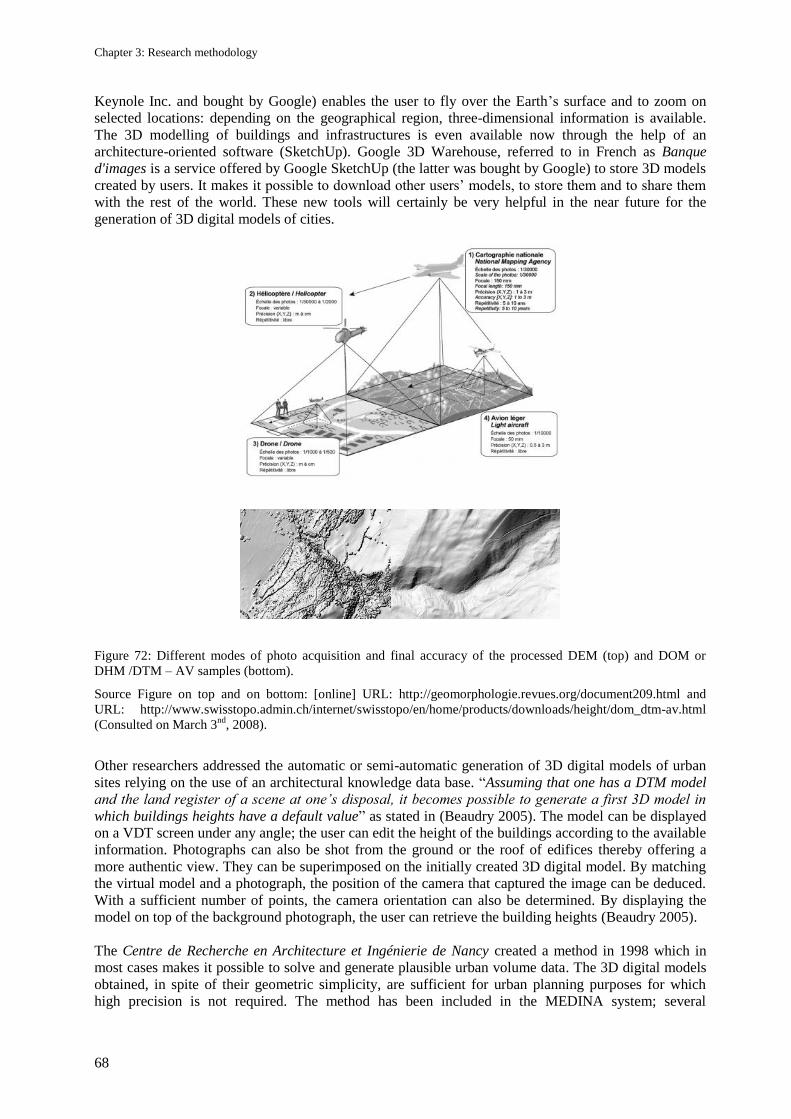
Chapter 3: Research methodology
68
Keynole Inc. and bought by Google) enables the user to fly over the Earth‘s surface and to zoom on
selected locations: depending on the geographical region, three-dimensional information is available.
The 3D modelling of buildings and infrastructures is even available now through the help of an
architecture-oriented software (SketchUp). Google 3D Warehouse, referred to in French as Banque
d'images is a service offered by Google SketchUp (the latter was bought by Google) to store 3D models
created by users. It makes it possible to download other users‘ models, to store them and to share them
with the rest of the world. These new tools will certainly be very helpful in the near future for the
generation of 3D digital models of cities.
Figure 72: Different modes of photo acquisition and final accuracy of the processed DEM (top) and DOM or
DHM /DTM – AV samples (bottom).
Source Figure on top and on bottom: [online] URL: http://geomorphologie.revues.org/document209.html and
URL: http://www.swisstopo.admin.ch/internet/swisstopo/en/home/products/downloads/height/dom_dtm-av.html
(Consulted on March 3nd
, 2008).
Other researchers addressed the automatic or semi-automatic generation of 3D digital models of urban
sites relying on the use of an architectural knowledge data base. ―Assuming that one has a DTM model
and the land register of a scene at one’s disposal, it becomes possible to generate a first 3D model in
which buildings heights have a default value‖ as stated in (Beaudry 2005). The model can be displayed
on a VDT screen under any angle; the user can edit the height of the buildings according to the available
information. Photographs can also be shot from the ground or the roof of edifices thereby offering a
more authentic view. They can be superimposed on the initially created 3D digital model. By matching
the virtual model and a photograph, the position of the camera that captured the image can be deduced.
With a sufficient number of points, the camera orientation can also be determined. By displaying the
model on top of the background photograph, the user can retrieve the building heights (Beaudry 2005).
The Centre de Recherche en Architecture et Ingénierie de Nancy created a method in 1998 which in
most cases makes it possible to solve and generate plausible urban volume data. The 3D digital models
obtained, in spite of their geometric simplicity, are sufficient for urban planning purposes for which
high precision is not required. The method has been included in the MEDINA system; several
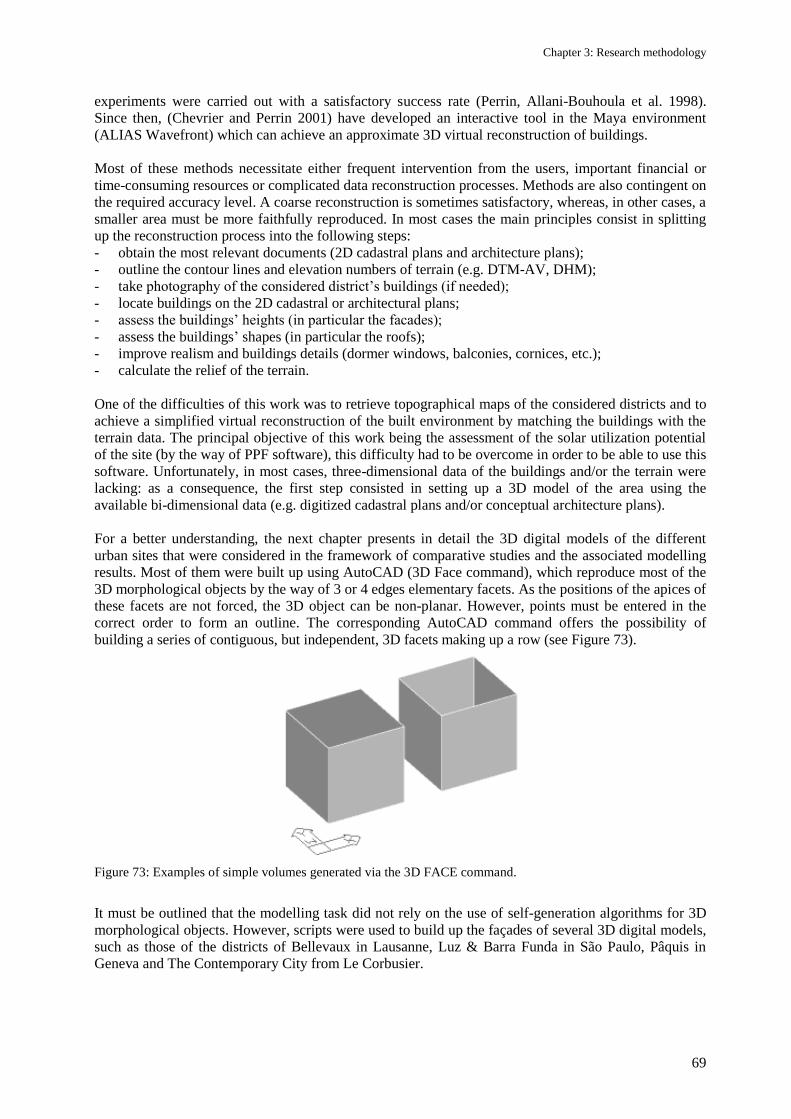
Chapter 3: Research methodology
69
experiments were carried out with a satisfactory success rate (Perrin, Allani-Bouhoula et al. 1998).
Since then, (Chevrier and Perrin 2001) have developed an interactive tool in the Maya environment
(ALIAS Wavefront) which can achieve an approximate 3D virtual reconstruction of buildings.
Most of these methods necessitate either frequent intervention from the users, important financial or
time-consuming resources or complicated data reconstruction processes. Methods are also contingent on
the required accuracy level. A coarse reconstruction is sometimes satisfactory, whereas, in other cases, a
smaller area must be more faithfully reproduced. In most cases the main principles consist in splitting
up the reconstruction process into the following steps:
- obtain the most relevant documents (2D cadastral plans and architecture plans);
- outline the contour lines and elevation numbers of terrain (e.g. DTM-AV, DHM);
- take photography of the considered district‘s buildings (if needed);
- locate buildings on the 2D cadastral or architectural plans;
- assess the buildings‘ heights (in particular the facades);
- assess the buildings‘ shapes (in particular the roofs);
- improve realism and buildings details (dormer windows, balconies, cornices, etc.);
- calculate the relief of the terrain.
One of the difficulties of this work was to retrieve topographical maps of the considered districts and to
achieve a simplified virtual reconstruction of the built environment by matching the buildings with the
terrain data. The principal objective of this work being the assessment of the solar utilization potential
of the site (by the way of PPF software), this difficulty had to be overcome in order to be able to use this
software. Unfortunately, in most cases, three-dimensional data of the buildings and/or the terrain were
lacking: as a consequence, the first step consisted in setting up a 3D model of the area using the
available bi-dimensional data (e.g. digitized cadastral plans and/or conceptual architecture plans).
For a better understanding, the next chapter presents in detail the 3D digital models of the different
urban sites that were considered in the framework of comparative studies and the associated modelling
results. Most of them were built up using AutoCAD (3D Face command), which reproduce most of the
3D morphological objects by the way of 3 or 4 edges elementary facets. As the positions of the apices of
these facets are not forced, the 3D object can be non-planar. However, points must be entered in the
correct order to form an outline. The corresponding AutoCAD command offers the possibility of
building a series of contiguous, but independent, 3D facets making up a row (see Figure 73).
Figure 73: Examples of simple volumes generated via the 3D FACE command.
It must be outlined that the modelling task did not rely on the use of self-generation algorithms for 3D
morphological objects. However, scripts were used to build up the façades of several 3D digital models,
such as those of the districts of Bellevaux in Lausanne, Luz & Barra Funda in São Paulo, Pâquis in
Geneva and The Contemporary City from Le Corbusier.
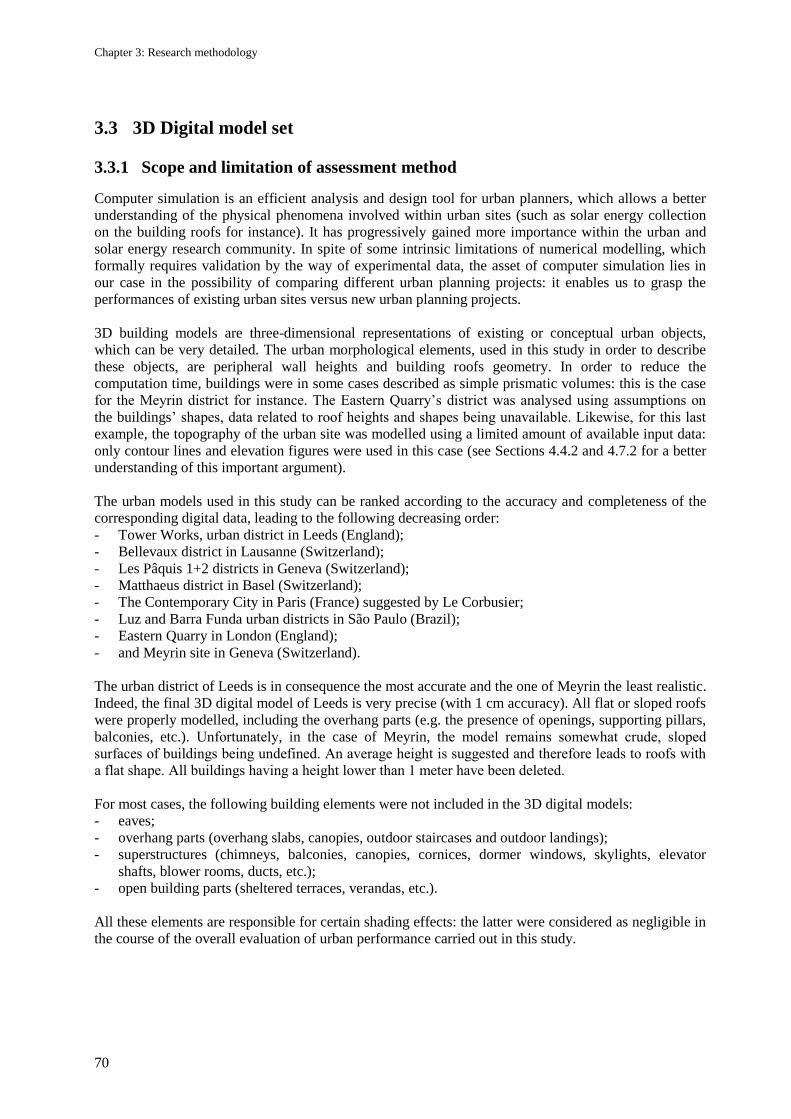
Chapter 3: Research methodology
70
3.3 3D Digital model set
3.3.1 Scope and limitation of assessment method
Computer simulation is an efficient analysis and design tool for urban planners, which allows a better
understanding of the physical phenomena involved within urban sites (such as solar energy collection
on the building roofs for instance). It has progressively gained more importance within the urban and
solar energy research community. In spite of some intrinsic limitations of numerical modelling, which
formally requires validation by the way of experimental data, the asset of computer simulation lies in
our case in the possibility of comparing different urban planning projects: it enables us to grasp the
performances of existing urban sites versus new urban planning projects.
3D building models are three-dimensional representations of existing or conceptual urban objects,
which can be very detailed. The urban morphological elements, used in this study in order to describe
these objects, are peripheral wall heights and building roofs geometry. In order to reduce the
computation time, buildings were in some cases described as simple prismatic volumes: this is the case
for the Meyrin district for instance. The Eastern Quarry‘s district was analysed using assumptions on
the buildings‘ shapes, data related to roof heights and shapes being unavailable. Likewise, for this last
example, the topography of the urban site was modelled using a limited amount of available input data:
only contour lines and elevation figures were used in this case (see Sections 4.4.2 and 4.7.2 for a better
understanding of this important argument).
The urban models used in this study can be ranked according to the accuracy and completeness of the
corresponding digital data, leading to the following decreasing order:
- Tower Works, urban district in Leeds (England);
- Bellevaux district in Lausanne (Switzerland);
- Les Pâquis 1+2 districts in Geneva (Switzerland);
- Matthaeus district in Basel (Switzerland);
- The Contemporary City in Paris (France) suggested by Le Corbusier;
- Luz and Barra Funda urban districts in São Paulo (Brazil);
- Eastern Quarry in London (England);
- and Meyrin site in Geneva (Switzerland).
The urban district of Leeds is in consequence the most accurate and the one of Meyrin the least realistic.
Indeed, the final 3D digital model of Leeds is very precise (with 1 cm accuracy). All flat or sloped roofs
were properly modelled, including the overhang parts (e.g. the presence of openings, supporting pillars,
balconies, etc.). Unfortunately, in the case of Meyrin, the model remains somewhat crude, sloped
surfaces of buildings being undefined. An average height is suggested and therefore leads to roofs with
a flat shape. All buildings having a height lower than 1 meter have been deleted.
For most cases, the following building elements were not included in the 3D digital models:
- eaves;
- overhang parts (overhang slabs, canopies, outdoor staircases and outdoor landings);
- superstructures (chimneys, balconies, canopies, cornices, dormer windows, skylights, elevator
shafts, blower rooms, ducts, etc.);
- open building parts (sheltered terraces, verandas, etc.).
All these elements are responsible for certain shading effects: the latter were considered as negligible in
the course of the overall evaluation of urban performance carried out in this study.
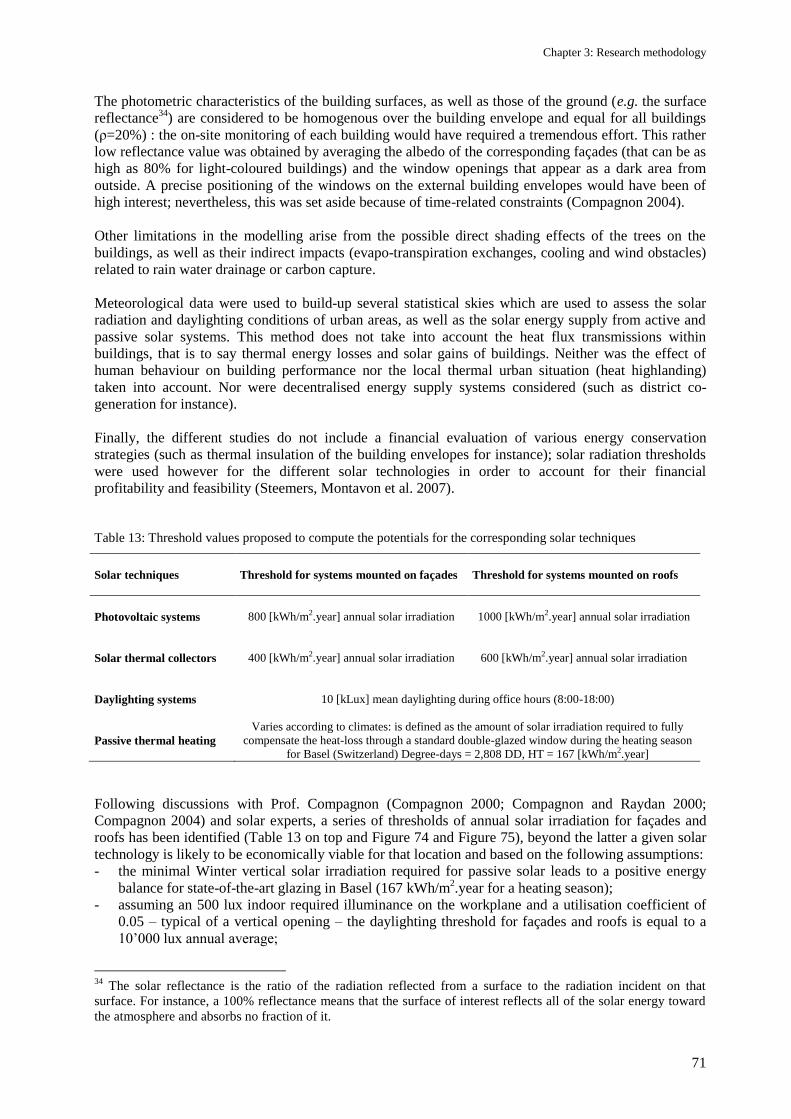
Chapter 3: Research methodology
71
The photometric characteristics of the building surfaces, as well as those of the ground (e.g. the surface
reflectance34
) are considered to be homogenous over the building envelope and equal for all buildings
(ρ=20%) : the on-site monitoring of each building would have required a tremendous effort. This rather
low reflectance value was obtained by averaging the albedo of the corresponding façades (that can be as
high as 80% for light-coloured buildings) and the window openings that appear as a dark area from
outside. A precise positioning of the windows on the external building envelopes would have been of
high interest; nevertheless, this was set aside because of time-related constraints (Compagnon 2004).
Other limitations in the modelling arise from the possible direct shading effects of the trees on the
buildings, as well as their indirect impacts (evapo-transpiration exchanges, cooling and wind obstacles)
related to rain water drainage or carbon capture.
Meteorological data were used to build-up several statistical skies which are used to assess the solar
radiation and daylighting conditions of urban areas, as well as the solar energy supply from active and
passive solar systems. This method does not take into account the heat flux transmissions within
buildings, that is to say thermal energy losses and solar gains of buildings. Neither was the effect of
human behaviour on building performance nor the local thermal urban situation (heat highlanding)
taken into account. Nor were decentralised energy supply systems considered (such as district co-
generation for instance).
Finally, the different studies do not include a financial evaluation of various energy conservation
strategies (such as thermal insulation of the building envelopes for instance); solar radiation thresholds
were used however for the different solar technologies in order to account for their financial
profitability and feasibility (Steemers, Montavon et al. 2007).
Table 13: Threshold values proposed to compute the potentials for the corresponding solar techniques
Solar techniques Threshold for systems mounted on façades Threshold for systems mounted on roofs
Photovoltaic systems 800 [kWh/m2.year] annual solar irradiation 1000 [kWh/m2.year] annual solar irradiation
Solar thermal collectors 400 [kWh/m2.year] annual solar irradiation 600 [kWh/m2.year] annual solar irradiation
Daylighting systems 10 [kLux] mean daylighting during office hours (8:00-18:00)
Passive thermal heating
Varies according to climates: is defined as the amount of solar irradiation required to fully
compensate the heat-loss through a standard double-glazed window during the heating season
for Basel (Switzerland) Degree-days = 2,808 DD, HT = 167 [kWh/m2.year]
Following discussions with Prof. Compagnon (Compagnon 2000; Compagnon and Raydan 2000;
Compagnon 2004) and solar experts, a series of thresholds of annual solar irradiation for façades and
roofs has been identified (Table 13 on top and Figure 74 and Figure 75), beyond the latter a given solar
technology is likely to be economically viable for that location and based on the following assumptions:
- the minimal Winter vertical solar irradiation required for passive solar leads to a positive energy
balance for state-of-the-art glazing in Basel (167 kWh/m2.year for a heating season);
- assuming an 500 lux indoor required illuminance on the workplane and a utilisation coefficient of
0.05 – typical of a vertical opening – the daylighting threshold for façades and roofs is equal to a
10‘000 lux annual average;
34
The solar reflectance is the ratio of the radiation reflected from a surface to the radiation incident on that
surface. For instance, a 100% reflectance means that the surface of interest reflects all of the solar energy toward
the atmosphere and absorbs no fraction of it.
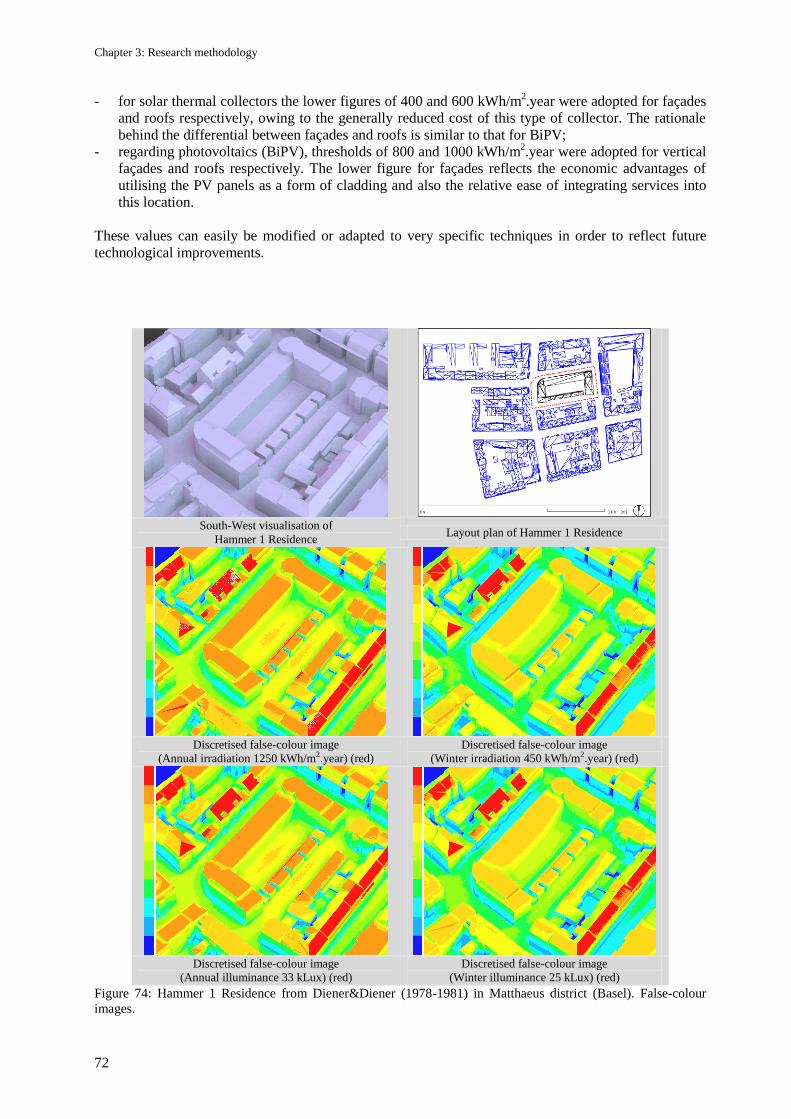
Chapter 3: Research methodology
72
- for solar thermal collectors the lower figures of 400 and 600 kWh/m2.year were adopted for façades
and roofs respectively, owing to the generally reduced cost of this type of collector. The rationale
behind the differential between façades and roofs is similar to that for BiPV;
- regarding photovoltaics (BiPV), thresholds of 800 and 1000 kWh/m2.year were adopted for vertical
façades and roofs respectively. The lower figure for façades reflects the economic advantages of
utilising the PV panels as a form of cladding and also the relative ease of integrating services into
this location.
These values can easily be modified or adapted to very specific techniques in order to reflect future
technological improvements.
South-West visualisation of
Hammer 1 Residence Layout plan of Hammer 1 Residence
Discretised false-colour image
(Annual irradiation 1250 kWh/m2.year) (red)
Discretised false-colour image
(Winter irradiation 450 kWh/m2.year) (red)
Discretised false-colour image
(Annual illuminance 33 kLux) (red)
Discretised false-colour image
(Winter illuminance 25 kLux) (red)
Figure 74: Hammer 1 Residence from Diener&Diener (1978-1981) in Matthaeus district (Basel). False-colour
images.
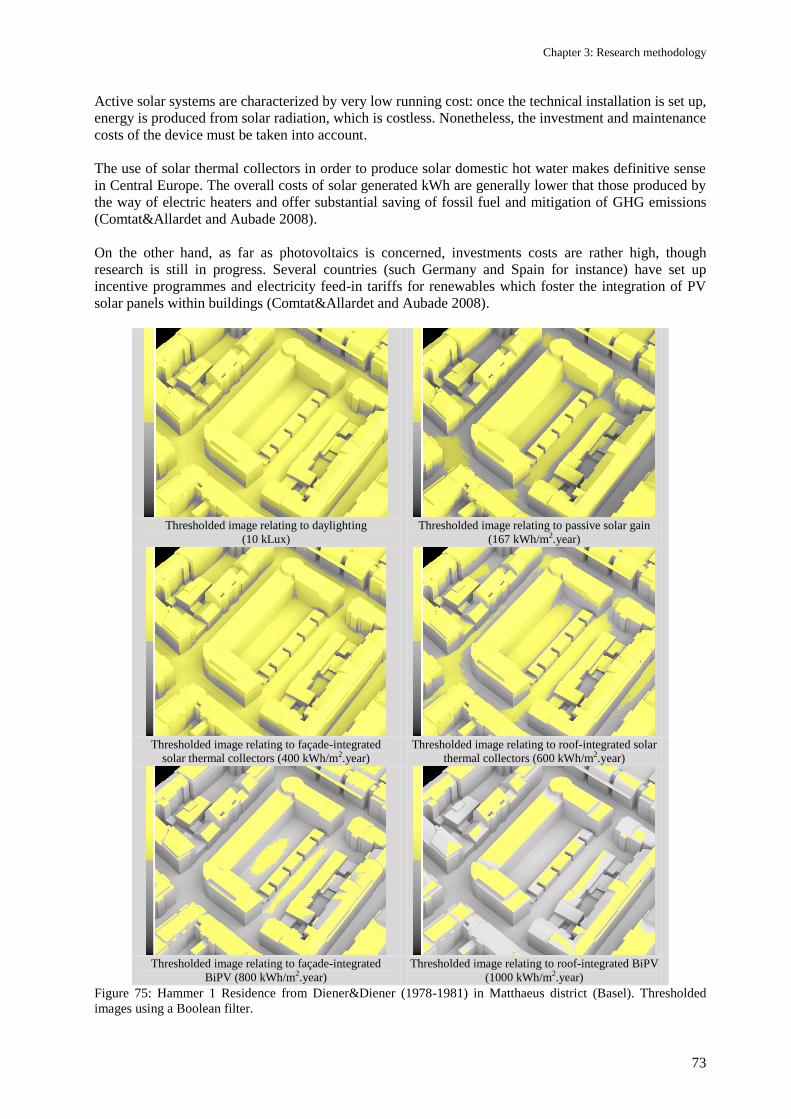
Chapter 3: Research methodology
73
Active solar systems are characterized by very low running cost: once the technical installation is set up,
energy is produced from solar radiation, which is costless. Nonetheless, the investment and maintenance
costs of the device must be taken into account.
The use of solar thermal collectors in order to produce solar domestic hot water makes definitive sense
in Central Europe. The overall costs of solar generated kWh are generally lower that those produced by
the way of electric heaters and offer substantial saving of fossil fuel and mitigation of GHG emissions
(Comtat&Allardet and Aubade 2008).
On the other hand, as far as photovoltaics is concerned, investments costs are rather high, though
research is still in progress. Several countries (such Germany and Spain for instance) have set up
incentive programmes and electricity feed-in tariffs for renewables which foster the integration of PV
solar panels within buildings (Comtat&Allardet and Aubade 2008).
Thresholded image relating to daylighting
(10 kLux)
Thresholded image relating to passive solar gain
(167 kWh/m2.year)
Thresholded image relating to façade-integrated
solar thermal collectors (400 kWh/m2.year)
Thresholded image relating to roof-integrated solar
thermal collectors (600 kWh/m2.year)
Thresholded image relating to façade-integrated
BiPV (800 kWh/m2.year)
Thresholded image relating to roof-integrated BiPV
(1000 kWh/m2.year)
Figure 75: Hammer 1 Residence from Diener&Diener (1978-1981) in Matthaeus district (Basel). Thresholded
images using a Boolean filter.
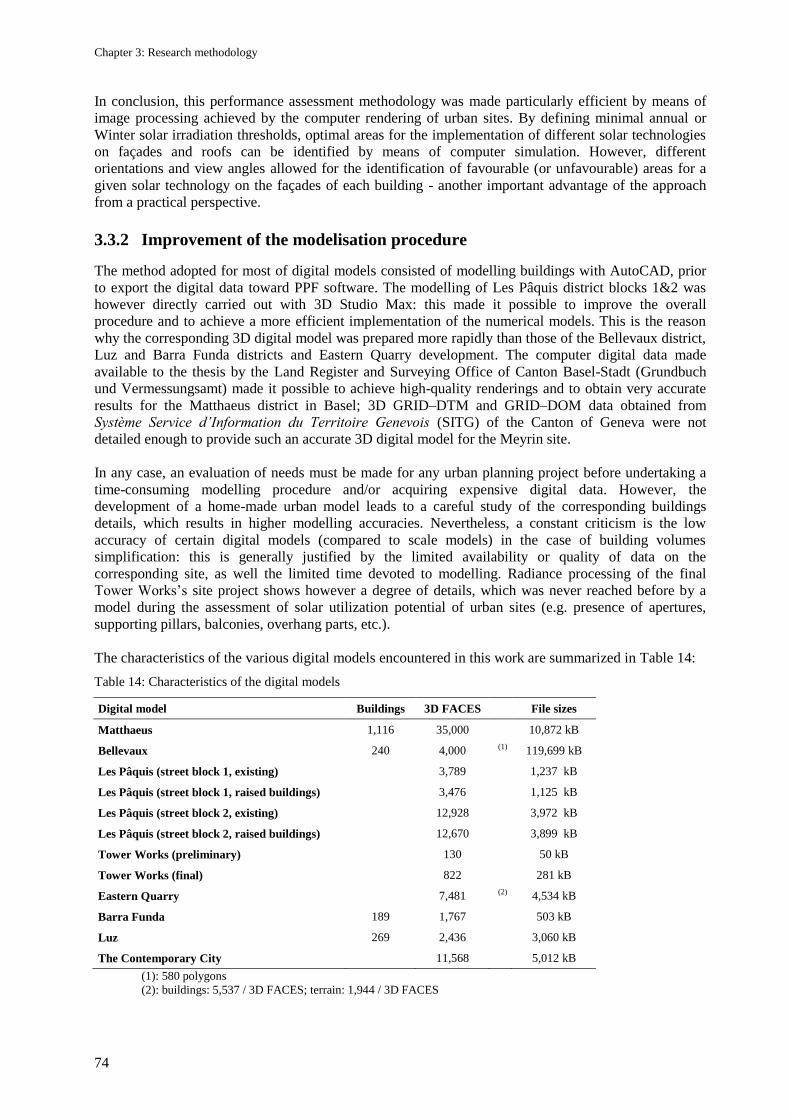
Chapter 3: Research methodology
74
In conclusion, this performance assessment methodology was made particularly efficient by means of
image processing achieved by the computer rendering of urban sites. By defining minimal annual or
Winter solar irradiation thresholds, optimal areas for the implementation of different solar technologies
on façades and roofs can be identified by means of computer simulation. However, different
orientations and view angles allowed for the identification of favourable (or unfavourable) areas for a
given solar technology on the façades of each building - another important advantage of the approach
from a practical perspective.
3.3.2 Improvement of the modelisation procedure
The method adopted for most of digital models consisted of modelling buildings with AutoCAD, prior
to export the digital data toward PPF software. The modelling of Les Pâquis district blocks 1&2 was
however directly carried out with 3D Studio Max: this made it possible to improve the overall
procedure and to achieve a more efficient implementation of the numerical models. This is the reason
why the corresponding 3D digital model was prepared more rapidly than those of the Bellevaux district,
Luz and Barra Funda districts and Eastern Quarry development. The computer digital data made
available to the thesis by the Land Register and Surveying Office of Canton Basel-Stadt (Grundbuch
und Vermessungsamt) made it possible to achieve high-quality renderings and to obtain very accurate
results for the Matthaeus district in Basel; 3D GRID–DTM and GRID–DOM data obtained from
Système Service d’Information du Territoire Genevois (SITG) of the Canton of Geneva were not
detailed enough to provide such an accurate 3D digital model for the Meyrin site.
In any case, an evaluation of needs must be made for any urban planning project before undertaking a
time-consuming modelling procedure and/or acquiring expensive digital data. However, the
development of a home-made urban model leads to a careful study of the corresponding buildings
details, which results in higher modelling accuracies. Nevertheless, a constant criticism is the low
accuracy of certain digital models (compared to scale models) in the case of building volumes
simplification: this is generally justified by the limited availability or quality of data on the
corresponding site, as well the limited time devoted to modelling. Radiance processing of the final
Tower Works‘s site project shows however a degree of details, which was never reached before by a
model during the assessment of solar utilization potential of urban sites (e.g. presence of apertures,
supporting pillars, balconies, overhang parts, etc.).
The characteristics of the various digital models encountered in this work are summarized in Table 14:
Table 14: Characteristics of the digital models
Digital model Buildings 3D FACES File sizes
Matthaeus 1,116 35,000 10,872 kB
Bellevaux 240 4,000 0(1) 119,699 kB
Les Pâquis (street block 1, existing) 3,789 1,237 kB
Les Pâquis (street block 1, raised buildings) 3,476 1,125 kB
Les Pâquis (street block 2, existing) 12,928 3,972 kB
Les Pâquis (street block 2, raised buildings) 12,670 3,899 kB
Tower Works (preliminary) 130 50 kB
Tower Works (final) 822 281 kB
Eastern Quarry 7,481 0(2) 4,534 kB
Barra Funda 189 1,767 503 kB
Luz 269 2,436 3,060 kB
The Contemporary City 11,568 5,012 kB
(1): 580 polygons
(2): buildings: 5,537 / 3D FACES; terrain: 1,944 / 3D FACES
Chapter 3: Research methodology
75
Usually, the file size is variable and depends upon the model type desired as far as accuracy, number of
buildings and number of generated 3D Faces are concerned. Table 14 shows the ratio between file sizes
(kB) and number of faces which varies between 0.8 and 3.5: it goes from 50 kB for Leeds 1 to
119,699 kB for Bellevaux. It depends on the 2D cadastral plan used to virtually ―raise‖ the buildings‘
façades (DXF, DWG, JPEG, TIFF formats, etc.) and thereafter if it were finally removed or not.
The estimated duration requested for setting up these models (excluding the conception time for the
Leeds and Eastern Quarry projects strictly speaking) is as follows:
- Matthaeus : unavailable data;
- Bellevaux: 550 hours (including document retrieval time);
- Meyrin : unavailable data;
- Les Pâquis 1 : 30 hours (without document retrieval time);
- Les Pâquis 2 : 25 hours (without document retrieval time);
- Tower Works 1 (preliminary design project): 8 hours (without design project);
- Tower Works 2 (final project): 50 hours (without design project);
- Eastern Quarry: 135 hours to transform the SOLID 3D model into a 3DFACE formatted file
(without design project);
- Barra Funda : 50 hours to transform the SOLID 3D model into a 3DFACE formatted file (without
document retrieval time and the creation of the existing model used as a basis);
- Luz: 70 hours to transform the SOLID 3D digital model into a corresponding 3DFACE formatted
file (without document retrieval time and the creation of the existing model used as a basis);
- The Contemporary City: 180 hours (without document retrieval time).
The estimated time for setting up these models will however vary from one person to another according
to his or her knowledge in modelling.
Unfortunately, data involving computer processing time for most of the models were not kept or
calculated. Furthermore, this largely depends upon the computer type and the number of tasks launched
simultaneously. These simulations were carried out on a ―cluster‖ of PC/Pentium 4, set up in 2002. For
a district of 1,116 dwellings such as Matthaeus, without outer reaches, approximately 165 hours were
necessary (real time: 165 hours, user time: 63 hours, calculation efficiency: 38%).
The use of 3D digital models in architecture, urban planning and environmental studies is about to
become a necessity. One of its immediate applications for the interested parties is the visualisation of a
given or alternative project within a certain area. Reading of 2D architectural plans is very difficult for
non-trained people, such as inhabitants or clients of the project. They do not have the ―sharp-eyed
views‖ of professionals who can identify building shapes and spaces at a glance; new ways of
representing architectural objects in three dimensions makes their understanding and interpretation far
easier. These new rendering techniques require new skills from building designers and scientists,
including a deep knowledge of Computed-Aided Design (CAD), 3D digital modelling, synthetic image
rendering, video editing, image animation and computed simulation. Numerous softwares have been
developed over the past few years and can be chosen for any objective, computer environment or
budget: their diversity can be applied to a whole range of projects.
However, each object must be described in a faithful way if one wants to build up an appropriate 3D
digital model: this encompasses the buildings‘ façades and roofs, as well as the terrain. Assembling
numerical information, which is often diffusely located, is a difficult task requiring the use of different
complex software. Collecting data and building up the different digital models used within this thesis,
have proved highly time-consuming. Nevertheless, it is an investment of time that might be rewarded if
the various models created for that purpose are used in the future for other urban planning design and/or
research projects.

77
Chapter 4: Global solar performance of case studies
4.1 Introduction
This study focuses on the relatively large scale of the urban district. It differs from past studies that have
tended to focus either on elementary building typologies or on local urban neighbourhoods (of the order
of 1 Ha, i.e. 2,471 acres). The latter is interesting in that by simplifying the building geometry it reduces
the impact on the results of the urban complexity and thus can deepen the understanding in terms of
relationships between building typologies and solar energy potential (Steemers, Baker et al. 1997;
Compagnon 2000; Compagnon and Raydan 2000; Compagnon 2004). However, generally most studies
suffer from ignoring direct and diffuse shadings due to buildings located beyond the boundary of the
case study. Partly to blame is the small size of the group of buildings considered within the city, for
which relatively little effort has been invested to derive insights from the real building forms, in
particular to identify whether and to what extent vernacular design has responded to climate35
.
The present chapter begins by reviewing the context in which the selected districts were chosen and by
introducing the diverse research institutions as well as the key people who participated in these research
projects. It is followed by a site description of each case study and a description of the 3D modelling
techniques which were chosen to represent the different urban sites. The related modelling results and
associated solar performance indicators are also presented in order to account for the overall solar
potential of façades located in the various urban areas for passive and active solar technologies,
daylighting and photovoltaic electricity generation (BiPV).
Selection of case studies
Three Swiss urban sites - the district of Matthaeus in Basel, Bellevaux in Lausanne and the Meyrin
Estate in Geneva - were chosen in collaboration with the Swiss Federal Office of Energy (SFOE). They
were the main objects of study of the SOLURBAN research project (Solar Energy Utilisation Potential
of Urban Sites) initiated at EPFL (Prof. J-L Scartezzini) in collaboration with the EIAF/University of
Applied Sciences Western Switzerland (Prof. R. Compagnon) (Scartezzini, Montavon et al. 2002;
Montavon, Scartezzini et al. 2004; Montavon, Scartezzini et al. 2004; Robinson, Scartezzini et al. 2005;
Robinson 2006; Montavon, Robinson et al. 2007).
The SOLURBAN project aimed to promote an urban architecture, that adheres to the principles of
sustainable development, by assessing the solar energy utilisation potential (passive and active solar
systems, daylighting and building integration of photovoltaics) of three urban sites representative of
Swiss cities; the latter are expected moreover to cover the range of latitudes of the country, as well as
the variety of buildings and morphological typologies of different urban sites in Switzerland. The
following features predominantly characterized the three urban sites:
- pre-war residential buildings for Matthaeus;
- post-war tenement social housing for Bellevaux;
- a relatively new multiuse district for Meyrin.
The desire to examine urban sites with the potential for successful refurbishment justifies the selection
of the districts of Matthaeus located in the north of Basel, Bellevaux in the centre of Lausanne and the
Meyrin Estate in the southern part of Geneva.
Moreover, four different types of representative urban forms in Basel or in the other European cities
were used to compare theoretical building shapes leading to higher urban density on the daylighting
availability, as well as on the solar utilisation potential of the site.
35
Although some clear results were obtained from comparisons of different hypothetical new building design
proposals within part of an existing neighbourhood.
Chapter 4: Global solar performance of case studies
78
A collaboration with Prof. B. Marchand, from the Laboratoire de Théorie et d’Histoire (LTH2) of
EPFL, allowed for the evaluation of the solar performance of the street block Pâquis 1 & 2 in Geneva
(Marchand, Montavon et al. 2008).
This architectural project corresponded to the second phase of specifications drawn up by the Service
d’Urbanisme de la Ville de Genève for an ―expertise related to the potential for densification of the city
of Geneva‖. It has the two following objectives:
- to clarify the notion of qualitative density, particularly in the context of Geneva;
- to assess the conditions needed for the improvement of the current urban fabric.
The work was supervised by the Service d’Urbanisme de la Ville de Genève (G. Doessegger and J.
Urfer). The urban plan was drawn up by K. Bossy of the DeLaMa architecture office in Geneva
(Devanthéry-Lamunière-Marchand Urbanisme, EPFL FAS SIA FSU architects).
Other urban sites were selected during an academic sojourn at the Martin Centre for Architectural and
Urban Studies at the University of Cambridge (Prof. K. Steemers) thanks to the support of the Swiss
National Science Foundation. Two South American districts - Barra Funda and the Luz districts in São
Paulo (Brazil) - were also chosen in the course of the international project Sustainable Urban Spaces: a
case study in São Paulo, Brazil. In addition, a remote collaboration with the Martin Centre enabled the
candidate to cooperate on various urban planning projects, primarily Tower Works Project and Testing
the Masterplan, as well as An environmental assessment of the Eastern Quarry development proposal in
Ebbsfleet Valley sponsored by Land Securities. Generic models (Cheng, Steemers et al. 2006), plus a
conceptual urban plan conceived by Le Corbusier in 1921 -1922, The Contemporary City of Three
Million Inhabitants (Montavon, Steemers et al. 2006), were also considered.
The project Sustainable Urban Spaces: a case study in São Paulo, Brazil, funded by The British
Academy, gathered teams of environmental designers and researchers from The Martin Centre (Prof. K.
Steemers and V. Cheng, Ph.D. Student), the Universities of São Paulo (Prof. D. Duarte and J.
Goncalves), The School of Architecture and Visual Arts, the University of East London (Dr S. Hagan),
the University of Applied Sciences of Western Switzerland (Prof. R. Compagnon) and the EPFL (M.
Montavon, Ph.D. Student). This made it possible to develop and assess sustainable urban design
projects for São Paulo (Cheng, Steemers et al. 2006; Cheng, Steemers et al. 2006; Duarte and
Gonçalves 2006).
The research work carried out in this framework makes it possible to compare the daylighting
availability and solar potential of Barra Funda and Luz districts. In a second step, the features of a set of
urban blocks located in Barra Funda and Luz, two town centre districts of São Paulo, were analysed in
order to establish urban planning design rules.
Testing the methodology used in this thesis through current urban design projects was also considered
an important goal. The general procedure, adopted for the Tower Works Project in Leeds (England),
consisted of evaluating its solar utilisation potential (solar radiation and daylight flux) starting from the
preliminary urban design phase to the final planning. Several technologies for direct use of solar energy
(passive and active solar energy, daylighting and photovoltaics) that can supply heat, light and/or
electricity to the buildings, were taken into account as a function of the orientation of the buildings main
façades (Wilson 2006).
The overall project team was composed of the following private companies: Carey Jones Architects (J.
Wilson), Town Centre Securities PLC (J. Sutcliffe, Glyn Akesson and R. Dunn), Yorkshire Housing (J.
Morgan), EDC Architects (M. Elton), Gillespies (M. Sharp), ARUP (M. Mayfield), AYH plc (R.
Morris). The following academic institutions were also involved in the project: the University of Leeds,
the Academy for Sustainable Communities, the University of Cambridge (Prof. K. Steemers, V. Cheng
and M. Ramos, Ph.D. students) and the EPFL (M. Montavon at the invitation of Prof. K. Steemers).
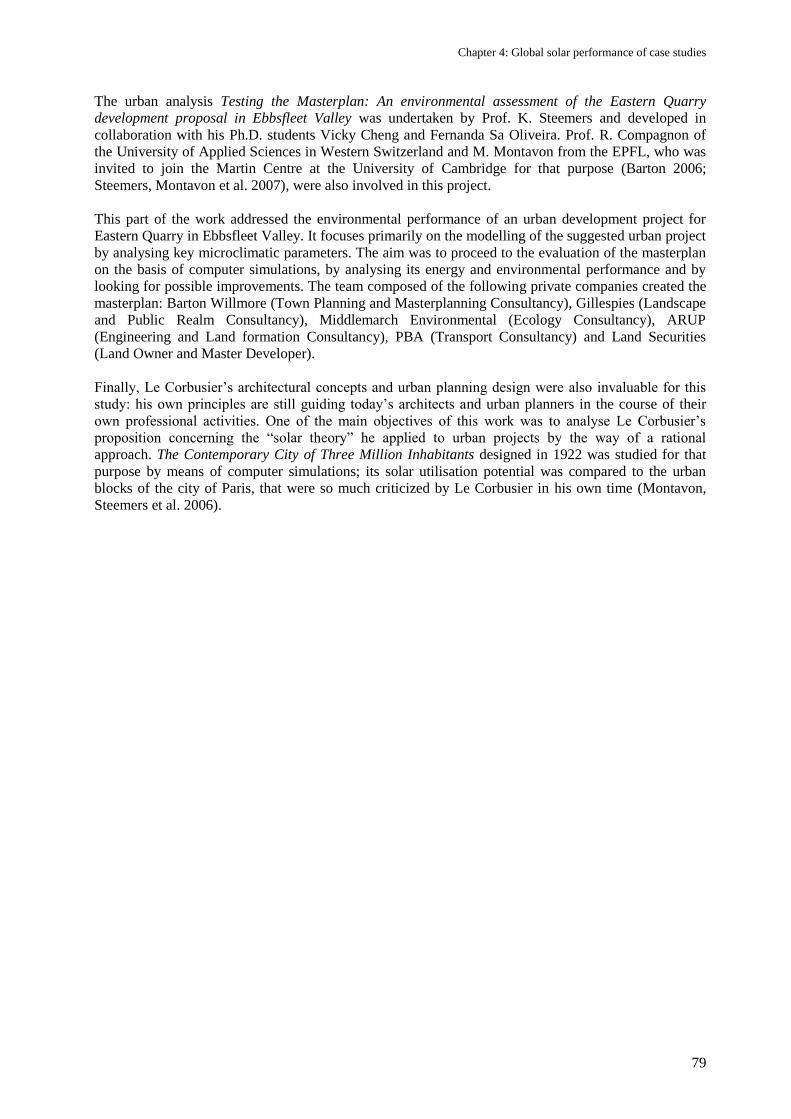
Chapter 4: Global solar performance of case studies
79
The urban analysis Testing the Masterplan: An environmental assessment of the Eastern Quarry
development proposal in Ebbsfleet Valley was undertaken by Prof. K. Steemers and developed in
collaboration with his Ph.D. students Vicky Cheng and Fernanda Sa Oliveira. Prof. R. Compagnon of
the University of Applied Sciences in Western Switzerland and M. Montavon from the EPFL, who was
invited to join the Martin Centre at the University of Cambridge for that purpose (Barton 2006;
Steemers, Montavon et al. 2007), were also involved in this project.
This part of the work addressed the environmental performance of an urban development project for
Eastern Quarry in Ebbsfleet Valley. It focuses primarily on the modelling of the suggested urban project
by analysing key microclimatic parameters. The aim was to proceed to the evaluation of the masterplan
on the basis of computer simulations, by analysing its energy and environmental performance and by
looking for possible improvements. The team composed of the following private companies created the
masterplan: Barton Willmore (Town Planning and Masterplanning Consultancy), Gillespies (Landscape
and Public Realm Consultancy), Middlemarch Environmental (Ecology Consultancy), ARUP
(Engineering and Land formation Consultancy), PBA (Transport Consultancy) and Land Securities
(Land Owner and Master Developer).
Finally, Le Corbusier‘s architectural concepts and urban planning design were also invaluable for this
study: his own principles are still guiding today‘s architects and urban planners in the course of their
own professional activities. One of the main objectives of this work was to analyse Le Corbusier‘s
proposition concerning the ―solar theory‖ he applied to urban projects by the way of a rational
approach. The Contemporary City of Three Million Inhabitants designed in 1922 was studied for that
purpose by means of computer simulations; its solar utilisation potential was compared to the urban
blocks of the city of Paris, that were so much criticized by Le Corbusier in his own time (Montavon,
Steemers et al. 2006).
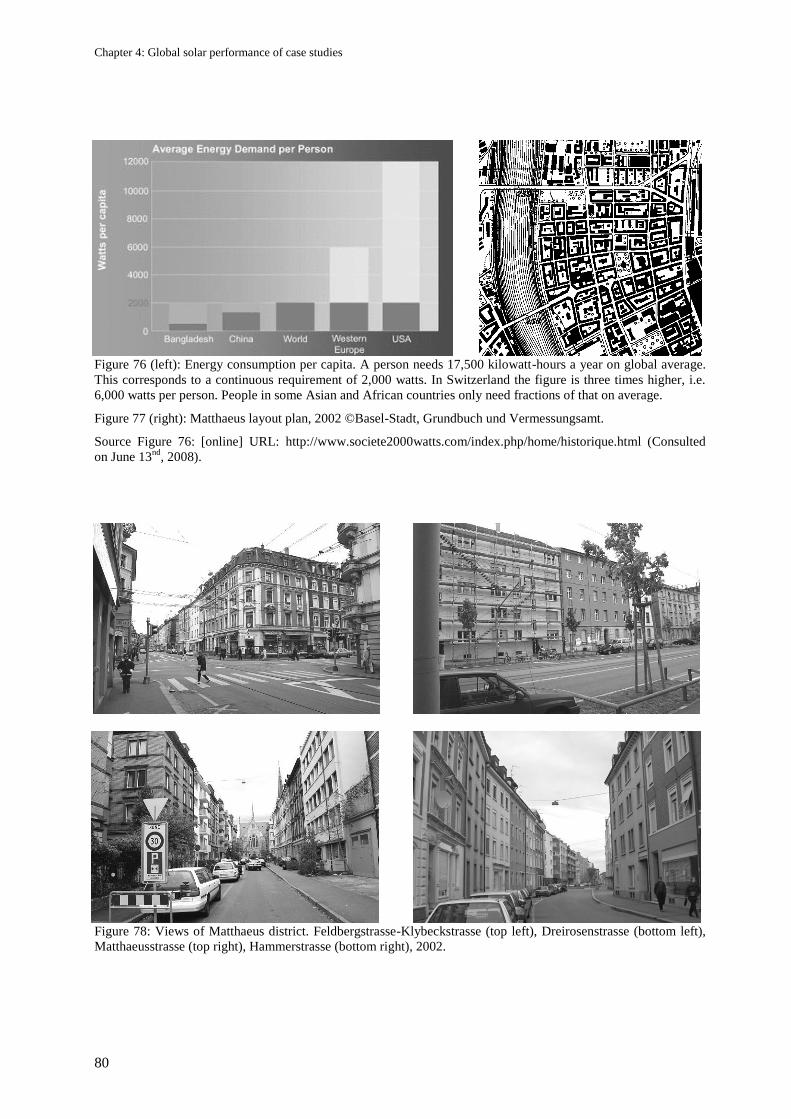
Chapter 4: Global solar performance of case studies
80
Figure 76 (left): Energy consumption per capita. A person needs 17,500 kilowatt-hours a year on global average.
This corresponds to a continuous requirement of 2,000 watts. In Switzerland the figure is three times higher, i.e.
6,000 watts per person. People in some Asian and African countries only need fractions of that on average.
Figure 77 (right): Matthaeus layout plan, 2002 ©Basel-Stadt, Grundbuch und Vermessungsamt.
Source Figure 76: [online] URL: http://www.societe2000watts.com/index.php/home/historique.html (Consulted
on June 13nd
, 2008).
Figure 78: Views of Matthaeus district. Feldbergstrasse-Klybeckstrasse (top left), Dreirosenstrasse (bottom left),
Matthaeusstrasse (top right), Hammerstrasse (bottom right), 2002.
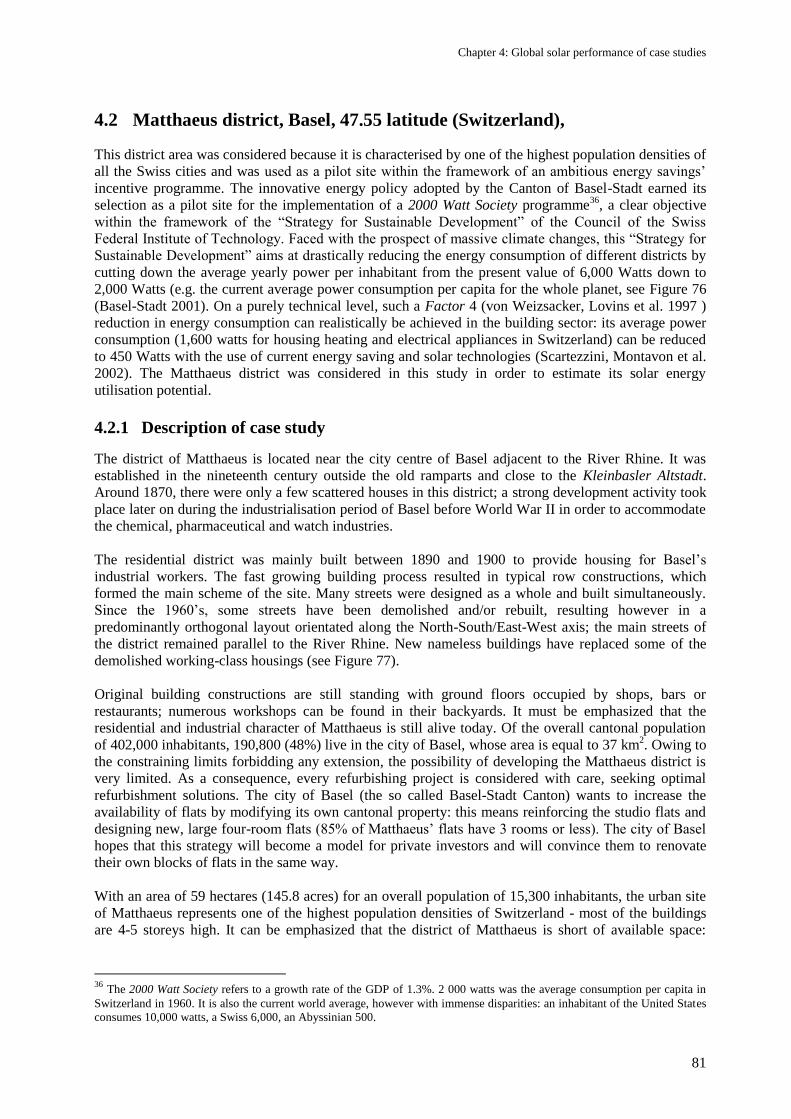
Chapter 4: Global solar performance of case studies
81
4.2 Matthaeus district, Basel, 47.55 latitude (Switzerland),
This district area was considered because it is characterised by one of the highest population densities of
all the Swiss cities and was used as a pilot site within the framework of an ambitious energy savings‘
incentive programme. The innovative energy policy adopted by the Canton of Basel-Stadt earned its
selection as a pilot site for the implementation of a 2000 Watt Society programme36
, a clear objective
within the framework of the ―Strategy for Sustainable Development‖ of the Council of the Swiss
Federal Institute of Technology. Faced with the prospect of massive climate changes, this ―Strategy for
Sustainable Development‖ aims at drastically reducing the energy consumption of different districts by
cutting down the average yearly power per inhabitant from the present value of 6,000 Watts down to
2,000 Watts (e.g. the current average power consumption per capita for the whole planet, see Figure 76
(Basel-Stadt 2001). On a purely technical level, such a Factor 4 (von Weizsacker, Lovins et al. 1997 )
reduction in energy consumption can realistically be achieved in the building sector: its average power
consumption (1,600 watts for housing heating and electrical appliances in Switzerland) can be reduced
to 450 Watts with the use of current energy saving and solar technologies (Scartezzini, Montavon et al.
2002). The Matthaeus district was considered in this study in order to estimate its solar energy
utilisation potential.
4.2.1 Description of case study
The district of Matthaeus is located near the city centre of Basel adjacent to the River Rhine. It was
established in the nineteenth century outside the old ramparts and close to the Kleinbasler Altstadt.
Around 1870, there were only a few scattered houses in this district; a strong development activity took
place later on during the industrialisation period of Basel before World War II in order to accommodate
the chemical, pharmaceutical and watch industries.
The residential district was mainly built between 1890 and 1900 to provide housing for Basel‘s
industrial workers. The fast growing building process resulted in typical row constructions, which
formed the main scheme of the site. Many streets were designed as a whole and built simultaneously.
Since the 1960‘s, some streets have been demolished and/or rebuilt, resulting however in a
predominantly orthogonal layout orientated along the North-South/East-West axis; the main streets of
the district remained parallel to the River Rhine. New nameless buildings have replaced some of the
demolished working-class housings (see Figure 77).
Original building constructions are still standing with ground floors occupied by shops, bars or
restaurants; numerous workshops can be found in their backyards. It must be emphasized that the
residential and industrial character of Matthaeus is still alive today. Of the overall cantonal population
of 402,000 inhabitants, 190,800 (48%) live in the city of Basel, whose area is equal to 37 km2. Owing to
the constraining limits forbidding any extension, the possibility of developing the Matthaeus district is
very limited. As a consequence, every refurbishing project is considered with care, seeking optimal
refurbishment solutions. The city of Basel (the so called Basel-Stadt Canton) wants to increase the
availability of flats by modifying its own cantonal property: this means reinforcing the studio flats and
designing new, large four-room flats (85% of Matthaeus‘ flats have 3 rooms or less). The city of Basel
hopes that this strategy will become a model for private investors and will convince them to renovate
their own blocks of flats in the same way.
With an area of 59 hectares (145.8 acres) for an overall population of 15,300 inhabitants, the urban site
of Matthaeus represents one of the highest population densities of Switzerland - most of the buildings
are 4-5 storeys high. It can be emphasized that the district of Matthaeus is short of available space:
36
The 2000 Watt Society refers to a growth rate of the GDP of 1.3%. 2 000 watts was the average consumption per capita in
Switzerland in 1960. It is also the current world average, however with immense disparities: an inhabitant of the United States
consumes 10,000 watts, a Swiss 6,000, an Abyssinian 500.
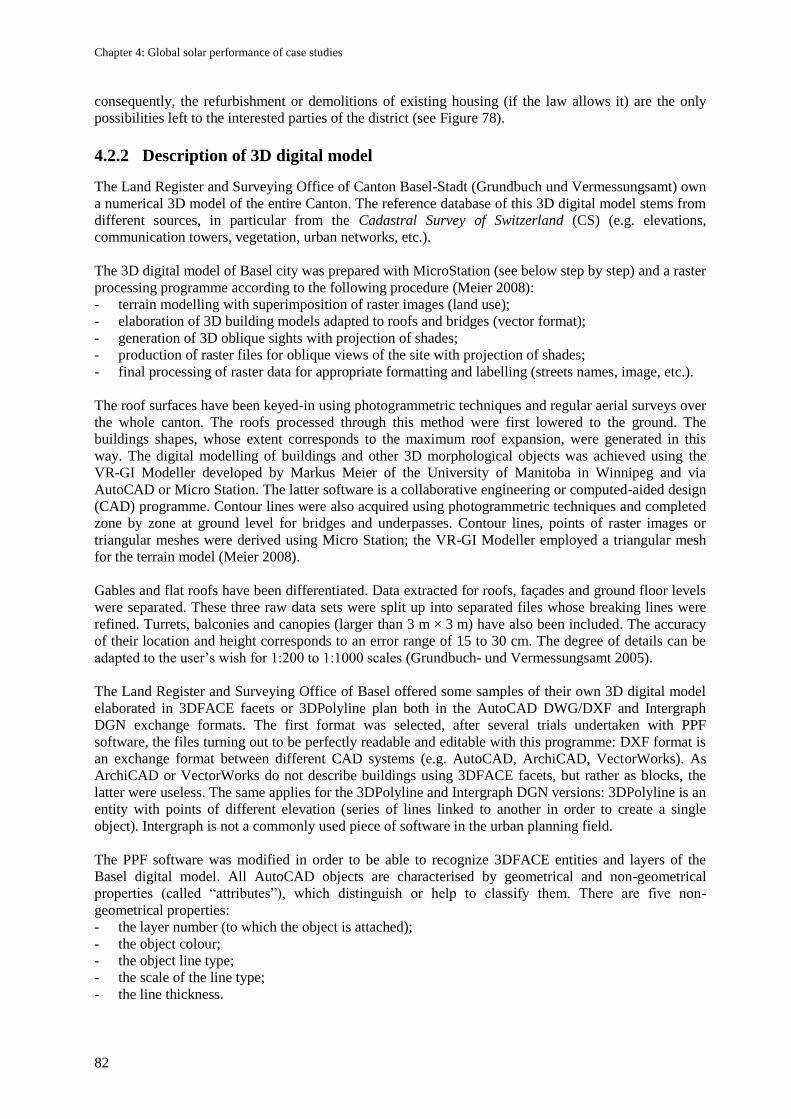
Chapter 4: Global solar performance of case studies
82
consequently, the refurbishment or demolitions of existing housing (if the law allows it) are the only
possibilities left to the interested parties of the district (see Figure 78).
4.2.2 Description of 3D digital model
The Land Register and Surveying Office of Canton Basel-Stadt (Grundbuch und Vermessungsamt) own
a numerical 3D model of the entire Canton. The reference database of this 3D digital model stems from
different sources, in particular from the Cadastral Survey of Switzerland (CS) (e.g. elevations,
communication towers, vegetation, urban networks, etc.).
The 3D digital model of Basel city was prepared with MicroStation (see below step by step) and a raster
processing programme according to the following procedure (Meier 2008):
- terrain modelling with superimposition of raster images (land use);
- elaboration of 3D building models adapted to roofs and bridges (vector format);
- generation of 3D oblique sights with projection of shades;
- production of raster files for oblique views of the site with projection of shades;
- final processing of raster data for appropriate formatting and labelling (streets names, image, etc.).
The roof surfaces have been keyed-in using photogrammetric techniques and regular aerial surveys over
the whole canton. The roofs processed through this method were first lowered to the ground. The
buildings shapes, whose extent corresponds to the maximum roof expansion, were generated in this
way. The digital modelling of buildings and other 3D morphological objects was achieved using the
VR-GI Modeller developed by Markus Meier of the University of Manitoba in Winnipeg and via
AutoCAD or Micro Station. The latter software is a collaborative engineering or computed-aided design
(CAD) programme. Contour lines were also acquired using photogrammetric techniques and completed
zone by zone at ground level for bridges and underpasses. Contour lines, points of raster images or
triangular meshes were derived using Micro Station; the VR-GI Modeller employed a triangular mesh
for the terrain model (Meier 2008).
Gables and flat roofs have been differentiated. Data extracted for roofs, façades and ground floor levels
were separated. These three raw data sets were split up into separated files whose breaking lines were
refined. Turrets, balconies and canopies (larger than 3 m × 3 m) have also been included. The accuracy
of their location and height corresponds to an error range of 15 to 30 cm. The degree of details can be
adapted to the user‘s wish for 1:200 to 1:1000 scales (Grundbuch- und Vermessungsamt 2005).
The Land Register and Surveying Office of Basel offered some samples of their own 3D digital model
elaborated in 3DFACE facets or 3DPolyline plan both in the AutoCAD DWG/DXF and Intergraph
DGN exchange formats. The first format was selected, after several trials undertaken with PPF
software, the files turning out to be perfectly readable and editable with this programme: DXF format is
an exchange format between different CAD systems (e.g. AutoCAD, ArchiCAD, VectorWorks). As
ArchiCAD or VectorWorks do not describe buildings using 3DFACE facets, but rather as blocks, the
latter were useless. The same applies for the 3DPolyline and Intergraph DGN versions: 3DPolyline is an
entity with points of different elevation (series of lines linked to another in order to create a single
object). Intergraph is not a commonly used piece of software in the urban planning field.
The PPF software was modified in order to be able to recognize 3DFACE entities and layers of the
Basel digital model. All AutoCAD objects are characterised by geometrical and non-geometrical
properties (called ―attributes‖), which distinguish or help to classify them. There are five non-
geometrical properties:
- the layer number (to which the object is attached);
- the object colour;
- the object line type;
- the scale of the line type;
- the line thickness.
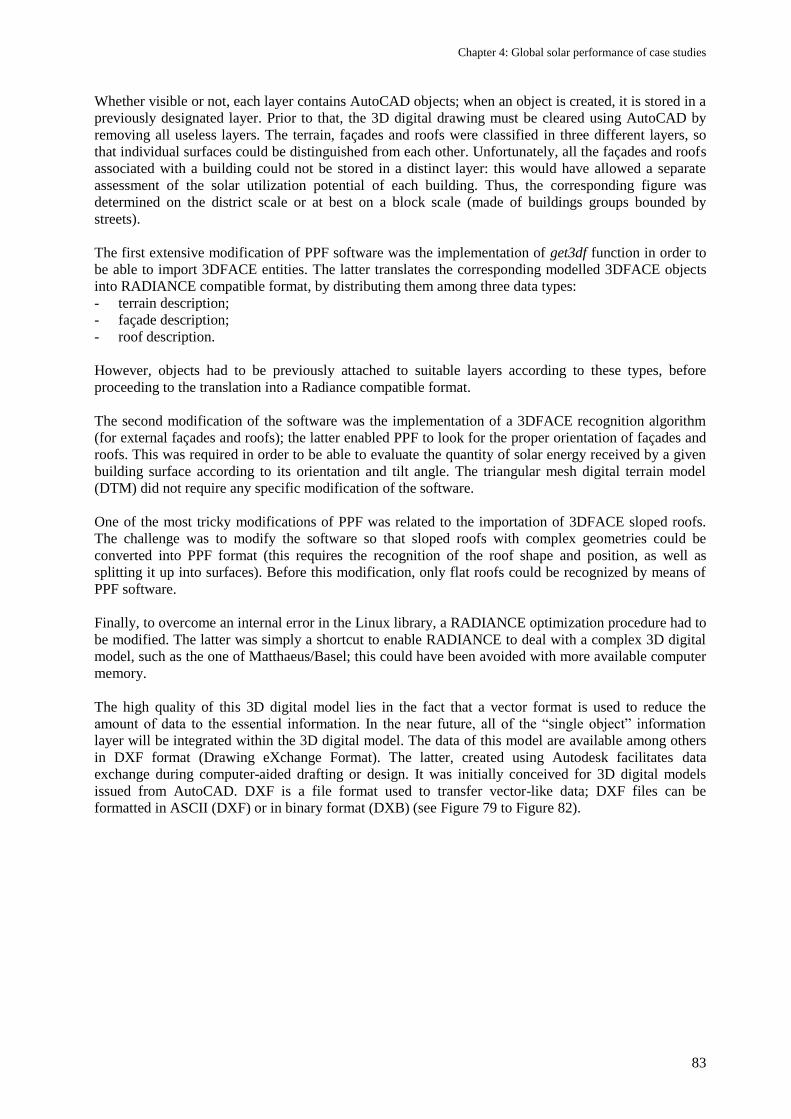
Chapter 4: Global solar performance of case studies
83
Whether visible or not, each layer contains AutoCAD objects; when an object is created, it is stored in a
previously designated layer. Prior to that, the 3D digital drawing must be cleared using AutoCAD by
removing all useless layers. The terrain, façades and roofs were classified in three different layers, so
that individual surfaces could be distinguished from each other. Unfortunately, all the façades and roofs
associated with a building could not be stored in a distinct layer: this would have allowed a separate
assessment of the solar utilization potential of each building. Thus, the corresponding figure was
determined on the district scale or at best on a block scale (made of buildings groups bounded by
streets).
The first extensive modification of PPF software was the implementation of get3df function in order to
be able to import 3DFACE entities. The latter translates the corresponding modelled 3DFACE objects
into RADIANCE compatible format, by distributing them among three data types:
- terrain description;
- façade description;
- roof description.
However, objects had to be previously attached to suitable layers according to these types, before
proceeding to the translation into a Radiance compatible format.
The second modification of the software was the implementation of a 3DFACE recognition algorithm
(for external façades and roofs); the latter enabled PPF to look for the proper orientation of façades and
roofs. This was required in order to be able to evaluate the quantity of solar energy received by a given
building surface according to its orientation and tilt angle. The triangular mesh digital terrain model
(DTM) did not require any specific modification of the software.
One of the most tricky modifications of PPF was related to the importation of 3DFACE sloped roofs.
The challenge was to modify the software so that sloped roofs with complex geometries could be
converted into PPF format (this requires the recognition of the roof shape and position, as well as
splitting it up into surfaces). Before this modification, only flat roofs could be recognized by means of
PPF software.
Finally, to overcome an internal error in the Linux library, a RADIANCE optimization procedure had to
be modified. The latter was simply a shortcut to enable RADIANCE to deal with a complex 3D digital
model, such as the one of Matthaeus/Basel; this could have been avoided with more available computer
memory.
The high quality of this 3D digital model lies in the fact that a vector format is used to reduce the
amount of data to the essential information. In the near future, all of the ―single object‖ information
layer will be integrated within the 3D digital model. The data of this model are available among others
in DXF format (Drawing eXchange Format). The latter, created using Autodesk facilitates data
exchange during computer-aided drafting or design. It was initially conceived for 3D digital models
issued from AutoCAD. DXF is a file format used to transfer vector-like data; DXF files can be
formatted in ASCII (DXF) or in binary format (DXB) (see Figure 79 to Figure 82).
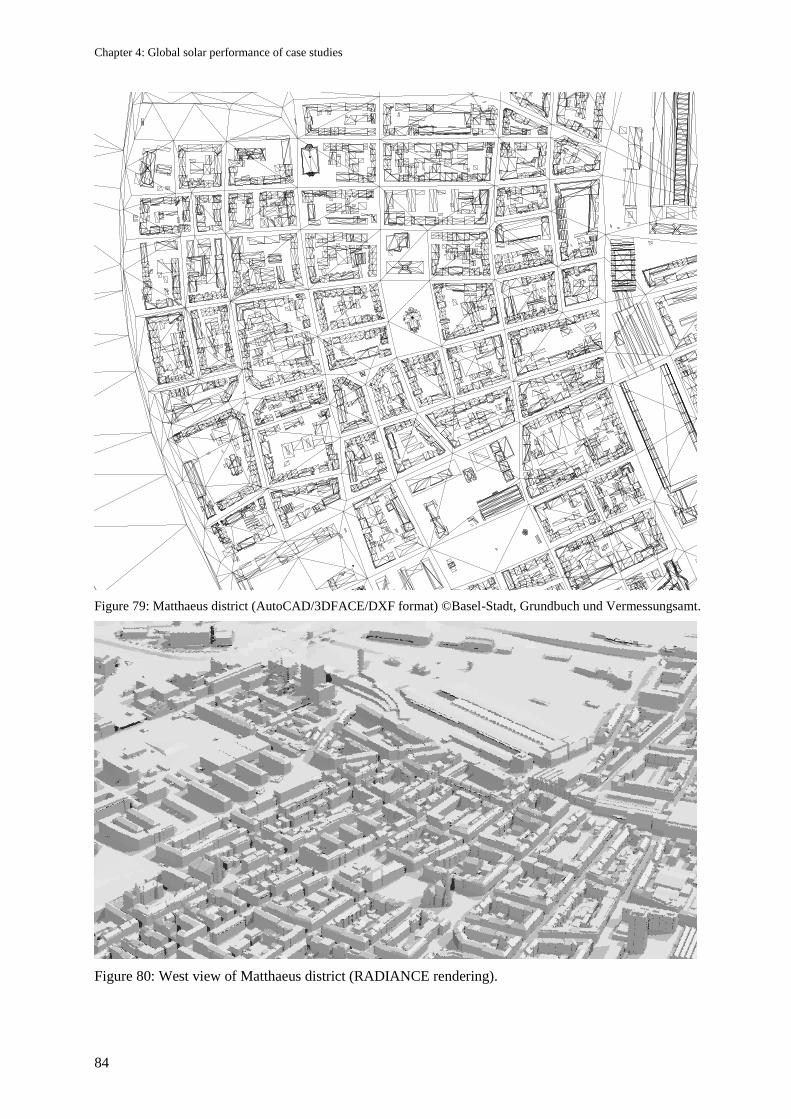
Chapter 4: Global solar performance of case studies
84
Figure 79: Matthaeus district (AutoCAD/3DFACE/DXF format) ©Basel-Stadt, Grundbuch und Vermessungsamt.
Figure 80: West view of Matthaeus district (RADIANCE rendering).
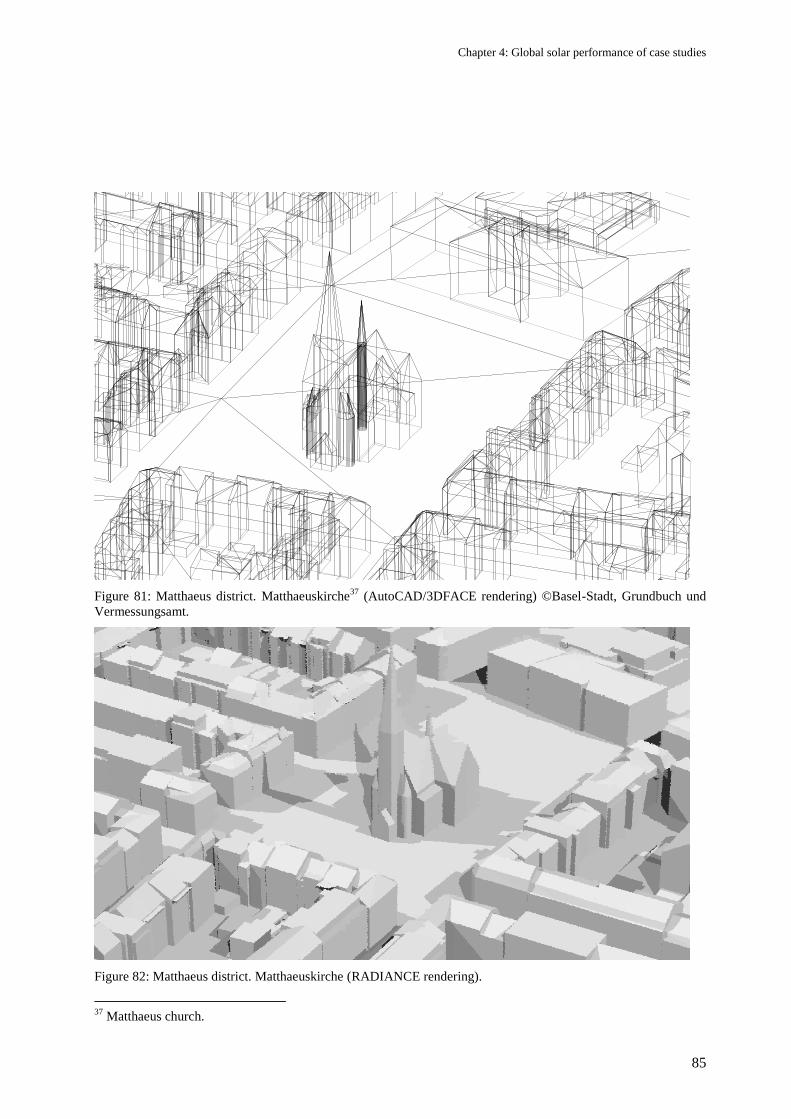
Chapter 4: Global solar performance of case studies
85
Figure 81: Matthaeus district. Matthaeuskirche37
(AutoCAD/3DFACE rendering) ©Basel-Stadt, Grundbuch und
Vermessungsamt.
Figure 82: Matthaeus district. Matthaeuskirche (RADIANCE rendering).
37
Matthaeus church.
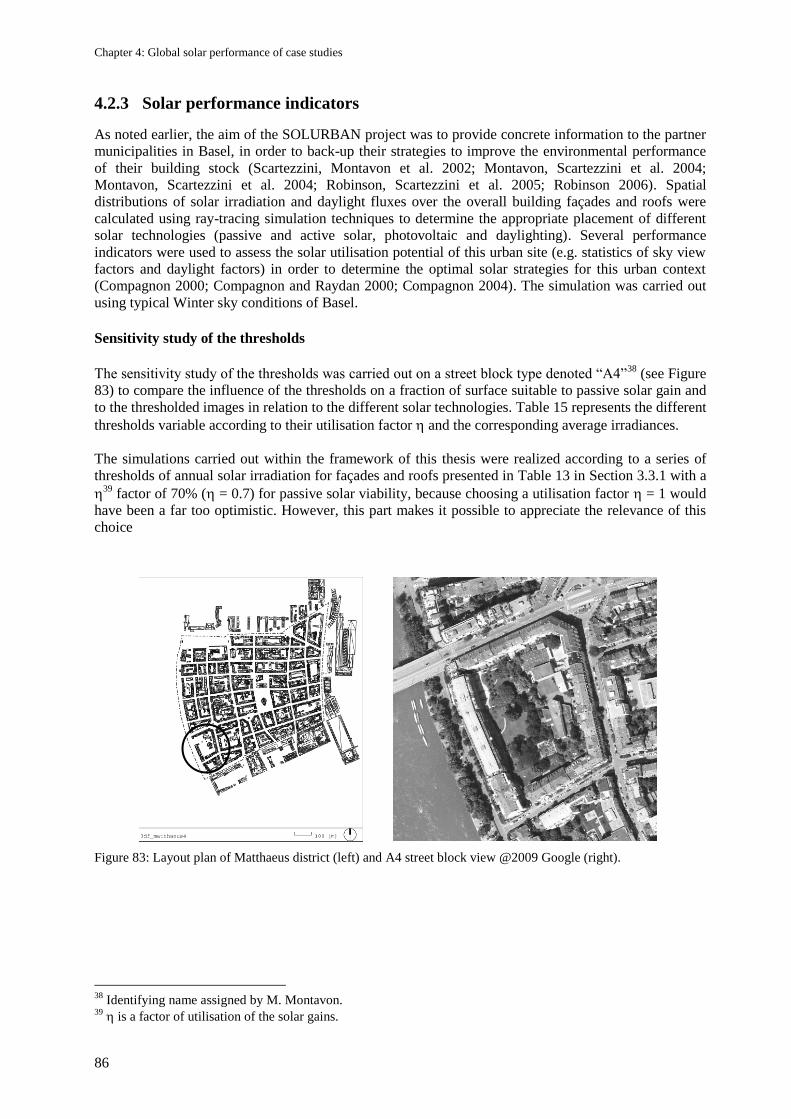
Chapter 4: Global solar performance of case studies
86
4.2.3 Solar performance indicators
As noted earlier, the aim of the SOLURBAN project was to provide concrete information to the partner
municipalities in Basel, in order to back-up their strategies to improve the environmental performance
of their building stock (Scartezzini, Montavon et al. 2002; Montavon, Scartezzini et al. 2004;
Montavon, Scartezzini et al. 2004; Robinson, Scartezzini et al. 2005; Robinson 2006). Spatial
distributions of solar irradiation and daylight fluxes over the overall building façades and roofs were
calculated using ray-tracing simulation techniques to determine the appropriate placement of different
solar technologies (passive and active solar, photovoltaic and daylighting). Several performance
indicators were used to assess the solar utilisation potential of this urban site (e.g. statistics of sky view
factors and daylight factors) in order to determine the optimal solar strategies for this urban context
(Compagnon 2000; Compagnon and Raydan 2000; Compagnon 2004). The simulation was carried out
using typical Winter sky conditions of Basel.
Sensitivity study of the thresholds
The sensitivity study of the thresholds was carried out on a street block type denoted ―A4‖38
(see Figure
83) to compare the influence of the thresholds on a fraction of surface suitable to passive solar gain and
to the thresholded images in relation to the different solar technologies. Table 15 represents the different
thresholds variable according to their utilisation factor and the corresponding average irradiances.
The simulations carried out within the framework of this thesis were realized according to a series of
thresholds of annual solar irradiation for façades and roofs presented in Table 13 in Section 3.3.1 with a
39
factor of 70% ( = 0.7) for passive solar viability, because choosing a utilisation factor = 1 would
have been a far too optimistic. However, this part makes it possible to appreciate the relevance of this
choice
Figure 83: Layout plan of Matthaeus district (left) and A4 street block view @2009 Google (right).
38
Identifying name assigned by M. Montavon. 39
is a factor of utilisation of the solar gains.
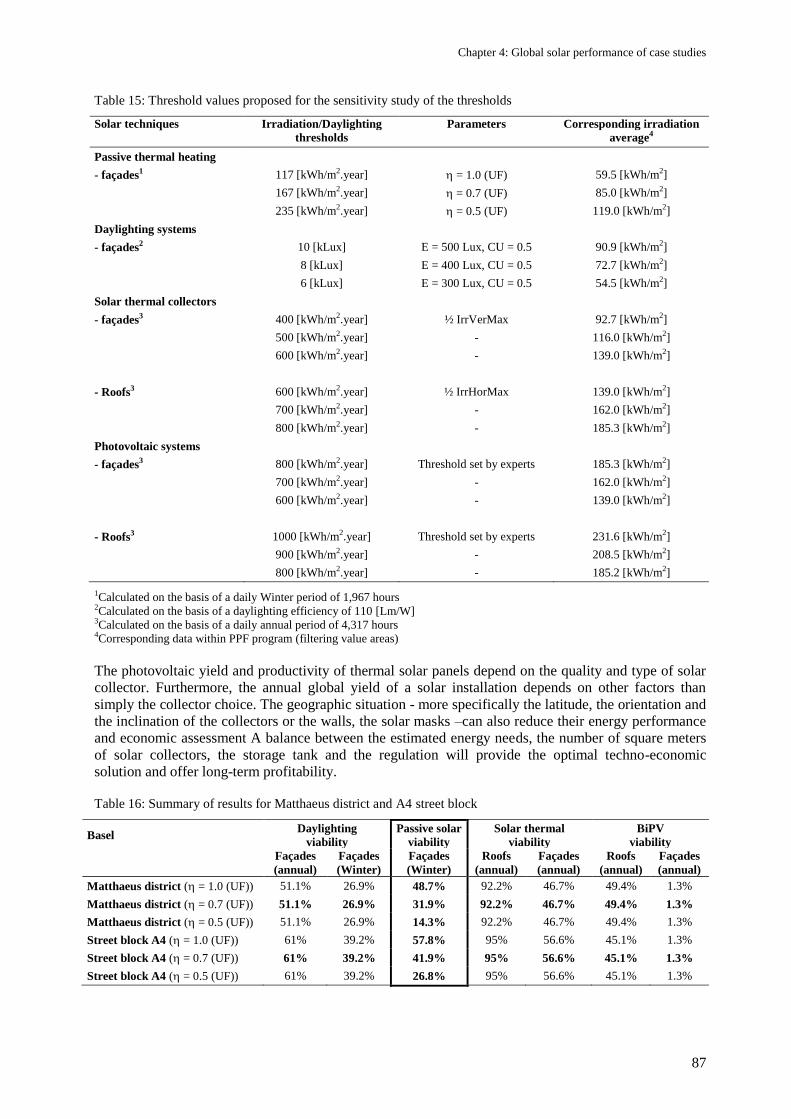
Chapter 4: Global solar performance of case studies
87
Table 15: Threshold values proposed for the sensitivity study of the thresholds
Solar techniques Irradiation/Daylighting
thresholds
Parameters Corresponding irradiation
average4
Passive thermal heating
- façades1 117 [kWh/m2.year] = 1.0 (UF) 59.5 [kWh/m2]
167 [kWh/m2.year] = 0.7 (UF) 85.0 [kWh/m2]
235 [kWh/m2.year] = 0.5 (UF) 119.0 [kWh/m2]
Daylighting systems
- façades2 10 [kLux] E = 500 Lux, CU = 0.5 90.9 [kWh/m2]
8 [kLux] E = 400 Lux, CU = 0.5 72.7 [kWh/m2]
6 [kLux] E = 300 Lux, CU = 0.5 54.5 [kWh/m2]
Solar thermal collectors
- façades3 400 [kWh/m2.year] ½ IrrVerMax 92.7 [kWh/m2]
500 [kWh/m2.year] - 116.0 [kWh/m2]
600 [kWh/m2.year] - 139.0 [kWh/m2]
- Roofs3 600 [kWh/m2.year] ½ IrrHorMax 139.0 [kWh/m2]
700 [kWh/m2.year] - 162.0 [kWh/m2]
800 [kWh/m2.year] - 185.3 [kWh/m2]
Photovoltaic systems
- façades3 800 [kWh/m2.year] Threshold set by experts 185.3 [kWh/m2]
700 [kWh/m2.year] - 162.0 [kWh/m2]
600 [kWh/m2.year] - 139.0 [kWh/m2]
- Roofs3 1000 [kWh/m2.year] Threshold set by experts 231.6 [kWh/m2]
900 [kWh/m2.year] - 208.5 [kWh/m2]
800 [kWh/m2.year] - 185.2 [kWh/m2]
1Calculated on the basis of a daily Winter period of 1,967 hours 2Calculated on the basis of a daylighting efficiency of 110 [Lm/W] 3Calculated on the basis of a daily annual period of 4,317 hours 4Corresponding data within PPF program (filtering value areas)
The photovoltaic yield and productivity of thermal solar panels depend on the quality and type of solar
collector. Furthermore, the annual global yield of a solar installation depends on other factors than
simply the collector choice. The geographic situation - more specifically the latitude, the orientation and
the inclination of the collectors or the walls, the solar masks –can also reduce their energy performance
and economic assessment A balance between the estimated energy needs, the number of square meters
of solar collectors, the storage tank and the regulation will provide the optimal techno-economic
solution and offer long-term profitability.
Table 16: Summary of results for Matthaeus district and A4 street block
Basel Daylighting
viability
Passive solar
viability
Solar thermal
viability
BiPV
viability
Façades
(annual)
Façades
(Winter)
Façades
(Winter)
Roofs
(annual)
Façades
(annual)
Roofs
(annual)
Façades
(annual)
Matthaeus district ( = 1.0 (UF)) 51.1% 26.9% 48.7% 92.2% 46.7% 49.4% 1.3%
Matthaeus district ( = 0.7 (UF)) 51.1% 26.9% 31.9% 92.2% 46.7% 49.4% 1.3%
Matthaeus district ( = 0.5 (UF)) 51.1% 26.9% 14.3% 92.2% 46.7% 49.4% 1.3%
Street block A4 ( = 1.0 (UF)) 61% 39.2% 57.8% 95% 56.6% 45.1% 1.3%
Street block A4 ( = 0.7 (UF)) 61% 39.2% 41.9% 95% 56.6% 45.1% 1.3%
Street block A4 ( = 0.5 (UF)) 61% 39.2% 26.8% 95% 56.6% 45.1% 1.3%
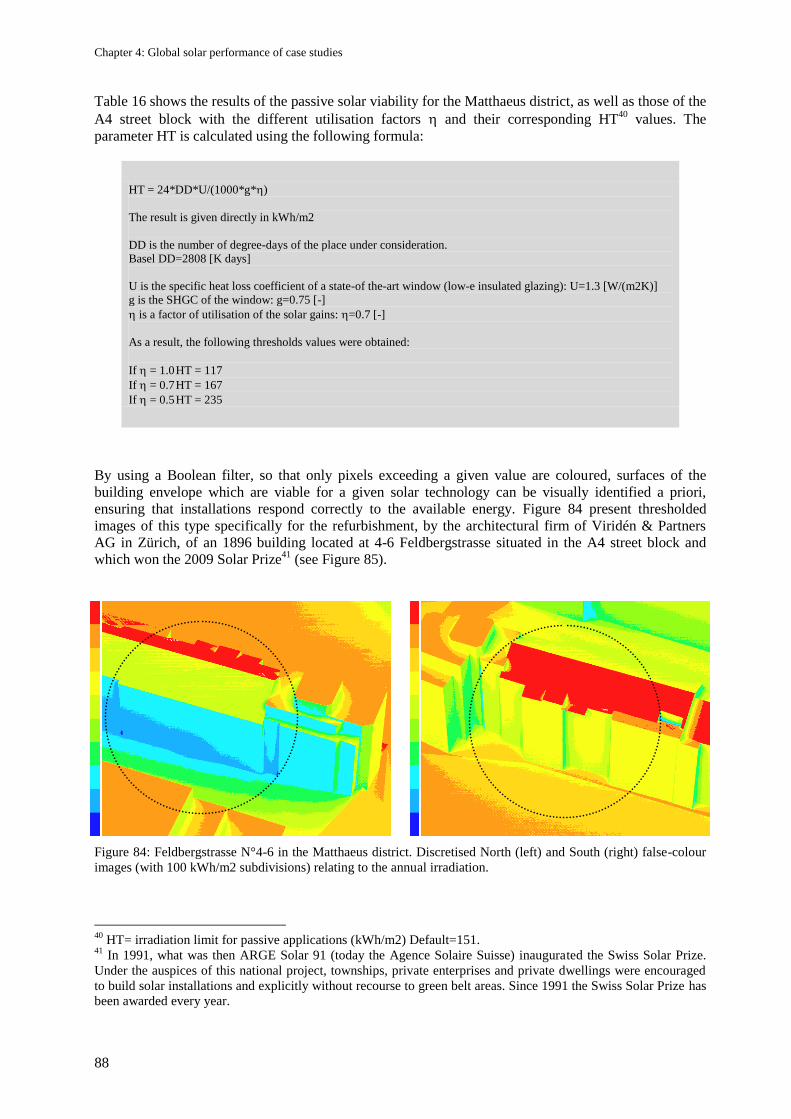
Chapter 4: Global solar performance of case studies
88
Table 16 shows the results of the passive solar viability for the Matthaeus district, as well as those of the
A4 street block with the different utilisation factors and their corresponding HT40
values. The
parameter HT is calculated using the following formula:
HT = 24*DD*U/(1000*g*)
The result is given directly in kWh/m2
DD is the number of degree-days of the place under consideration.
Basel DD=2808 [K days]
U is the specific heat loss coefficient of a state-of the-art window (low-e insulated glazing): U=1.3 [W/(m2K)]
g is the SHGC of the window: g=0.75 [-]
is a factor of utilisation of the solar gains: =0.7 [-]
As a result, the following thresholds values were obtained:
If = 1.0 HT = 117
If = 0.7 HT = 167
If = 0.5 HT = 235
By using a Boolean filter, so that only pixels exceeding a given value are coloured, surfaces of the
building envelope which are viable for a given solar technology can be visually identified a priori,
ensuring that installations respond correctly to the available energy. Figure 84 present thresholded
images of this type specifically for the refurbishment, by the architectural firm of Viridén & Partners
AG in Zürich, of an 1896 building located at 4-6 Feldbergstrasse situated in the A4 street block and
which won the 2009 Solar Prize41
(see Figure 85).
Figure 84: Feldbergstrasse N°4-6 in the Matthaeus district. Discretised North (left) and South (right) false-colour
images (with 100 kWh/m2 subdivisions) relating to the annual irradiation.
40
HT= irradiation limit for passive applications (kWh/m2) Default=151. 41
In 1991, what was then ARGE Solar 91 (today the Agence Solaire Suisse) inaugurated the Swiss Solar Prize.
Under the auspices of this national project, townships, private enterprises and private dwellings were encouraged
to build solar installations and explicitly without recourse to green belt areas. Since 1991 the Swiss Solar Prize has
been awarded every year.
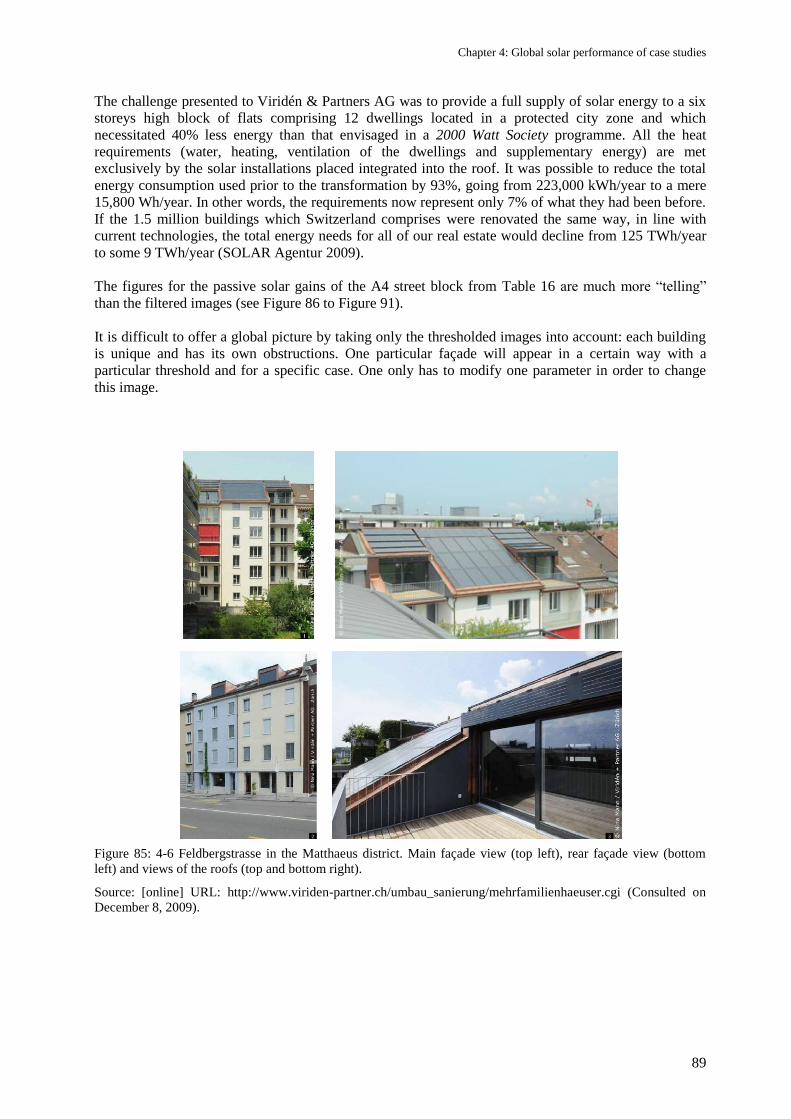
Chapter 4: Global solar performance of case studies
89
The challenge presented to Viridén & Partners AG was to provide a full supply of solar energy to a six
storeys high block of flats comprising 12 dwellings located in a protected city zone and which
necessitated 40% less energy than that envisaged in a 2000 Watt Society programme. All the heat
requirements (water, heating, ventilation of the dwellings and supplementary energy) are met
exclusively by the solar installations placed integrated into the roof. It was possible to reduce the total
energy consumption used prior to the transformation by 93%, going from 223,000 kWh/year to a mere
15,800 Wh/year. In other words, the requirements now represent only 7% of what they had been before.
If the 1.5 million buildings which Switzerland comprises were renovated the same way, in line with
current technologies, the total energy needs for all of our real estate would decline from 125 TWh/year
to some 9 TWh/year (SOLAR Agentur 2009).
The figures for the passive solar gains of the A4 street block from Table 16 are much more ―telling‖
than the filtered images (see Figure 86 to Figure 91).
It is difficult to offer a global picture by taking only the thresholded images into account: each building
is unique and has its own obstructions. One particular façade will appear in a certain way with a
particular threshold and for a specific case. One only has to modify one parameter in order to change
this image.
Figure 85: 4-6 Feldbergstrasse in the Matthaeus district. Main façade view (top left), rear façade view (bottom
left) and views of the roofs (top and bottom right).
Source: [online] URL: http://www.viriden-partner.ch/umbau_sanierung/mehrfamilienhaeuser.cgi (Consulted on
December 8, 2009).
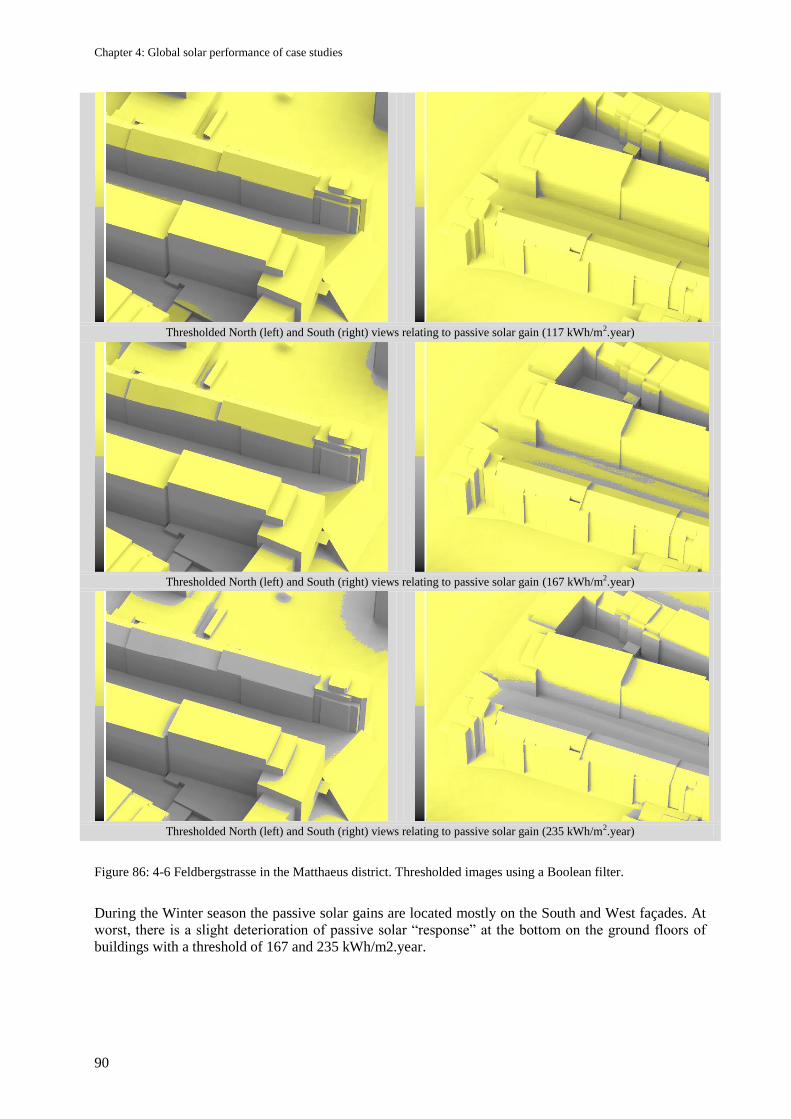
Chapter 4: Global solar performance of case studies
90
Thresholded North (left) and South (right) views relating to passive solar gain (117 kWh/m2.year)
Thresholded North (left) and South (right) views relating to passive solar gain (167 kWh/m2.year)
Thresholded North (left) and South (right) views relating to passive solar gain (235 kWh/m2.year)
Figure 86: 4-6 Feldbergstrasse in the Matthaeus district. Thresholded images using a Boolean filter.
During the Winter season the passive solar gains are located mostly on the South and West façades. At
worst, there is a slight deterioration of passive solar ―response‖ at the bottom on the ground floors of
buildings with a threshold of 167 and 235 kWh/m2.year.
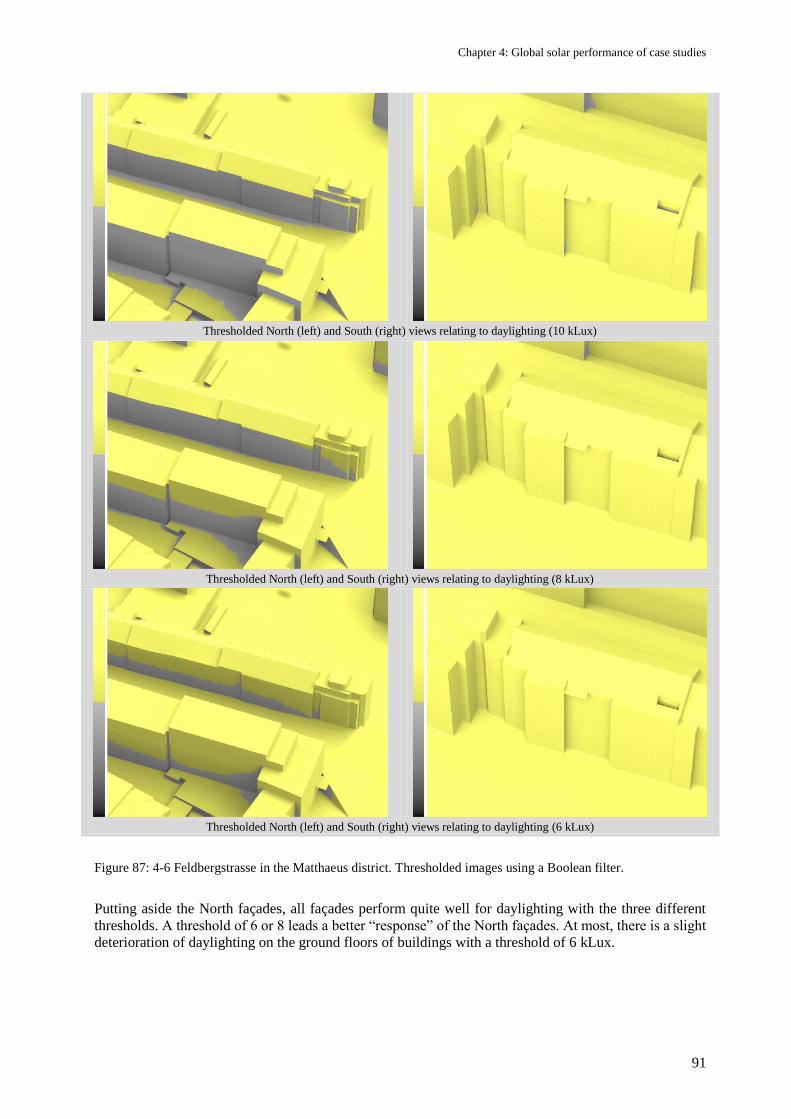
Chapter 4: Global solar performance of case studies
91
Thresholded North (left) and South (right) views relating to daylighting (10 kLux)
Thresholded North (left) and South (right) views relating to daylighting (8 kLux)
Thresholded North (left) and South (right) views relating to daylighting (6 kLux)
Figure 87: 4-6 Feldbergstrasse in the Matthaeus district. Thresholded images using a Boolean filter.
Putting aside the North façades, all façades perform quite well for daylighting with the three different
thresholds. A threshold of 6 or 8 leads a better ―response‖ of the North façades. At most, there is a slight
deterioration of daylighting on the ground floors of buildings with a threshold of 6 kLux.
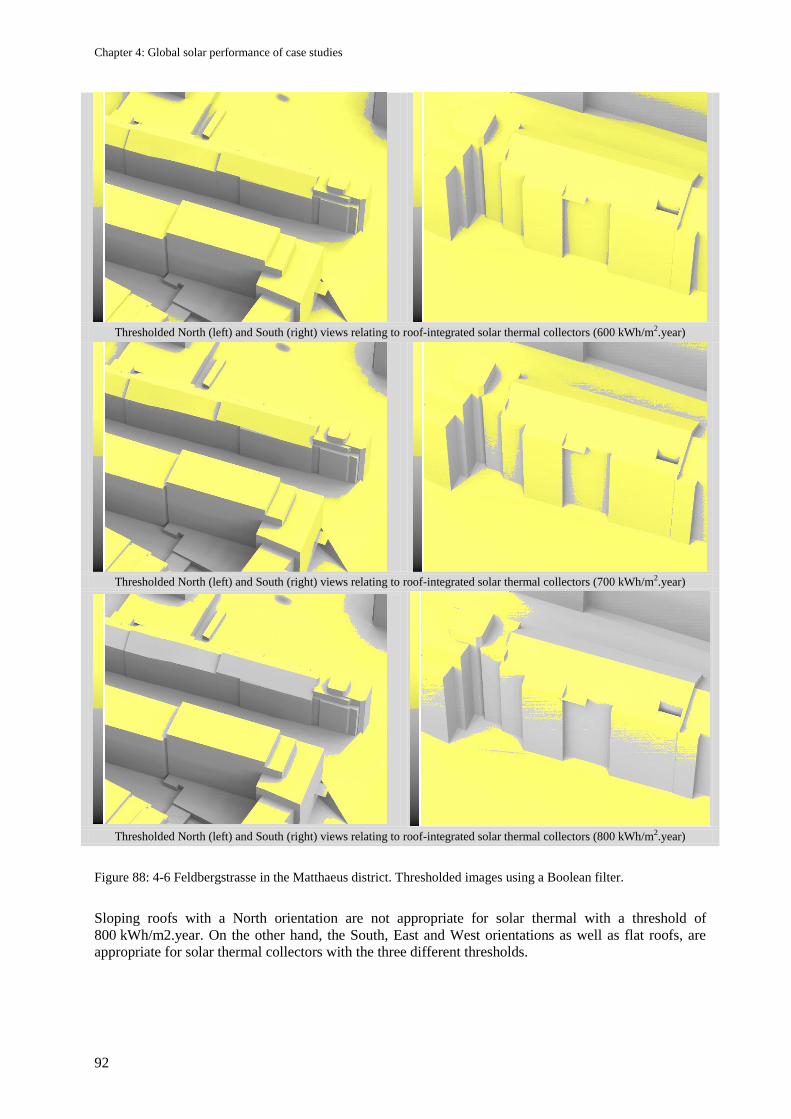
Chapter 4: Global solar performance of case studies
92
Thresholded North (left) and South (right) views relating to roof-integrated solar thermal collectors (600 kWh/m2.year)
Thresholded North (left) and South (right) views relating to roof-integrated solar thermal collectors (700 kWh/m2.year)
Thresholded North (left) and South (right) views relating to roof-integrated solar thermal collectors (800 kWh/m2.year)
Figure 88: 4-6 Feldbergstrasse in the Matthaeus district. Thresholded images using a Boolean filter.
Sloping roofs with a North orientation are not appropriate for solar thermal with a threshold of
800 kWh/m2.year. On the other hand, the South, East and West orientations as well as flat roofs, are
appropriate for solar thermal collectors with the three different thresholds.
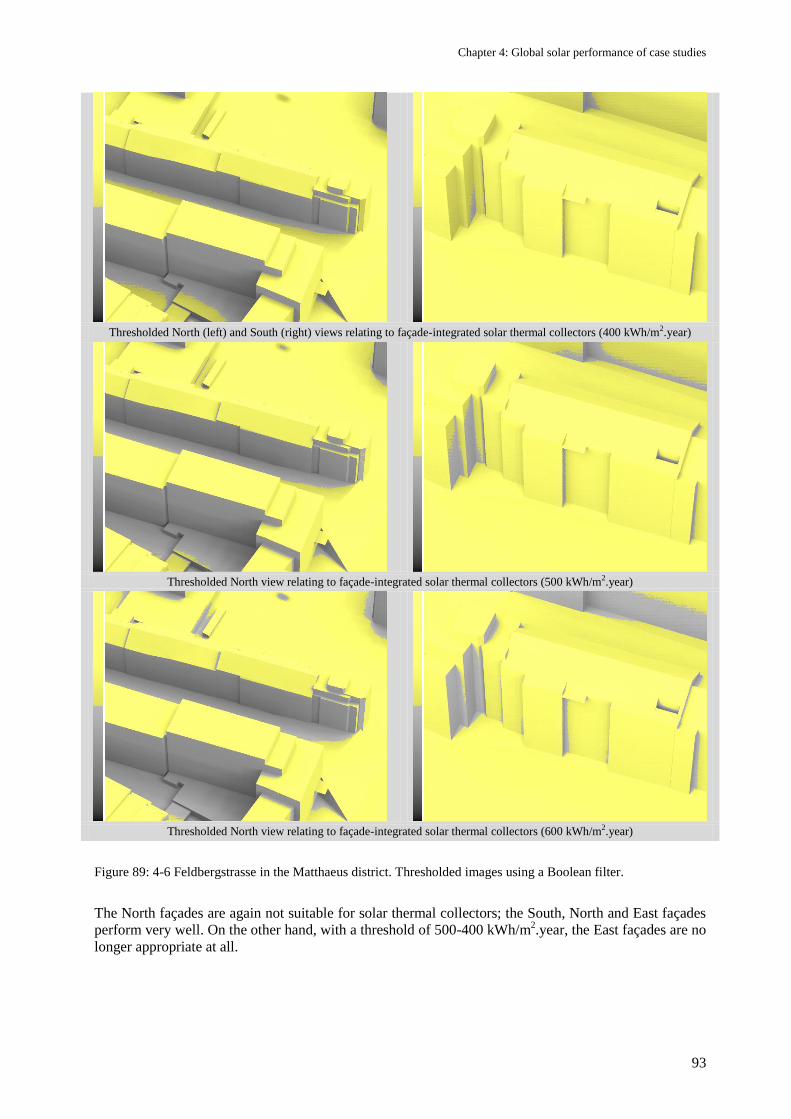
Chapter 4: Global solar performance of case studies
93
Thresholded North (left) and South (right) views relating to façade-integrated solar thermal collectors (400 kWh/m2.year)
Thresholded North view relating to façade-integrated solar thermal collectors (500 kWh/m2.year)
Thresholded North view relating to façade-integrated solar thermal collectors (600 kWh/m2.year)
Figure 89: 4-6 Feldbergstrasse in the Matthaeus district. Thresholded images using a Boolean filter.
The North façades are again not suitable for solar thermal collectors; the South, North and East façades
perform very well. On the other hand, with a threshold of 500-400 kWh/m2.year, the East façades are no
longer appropriate at all.
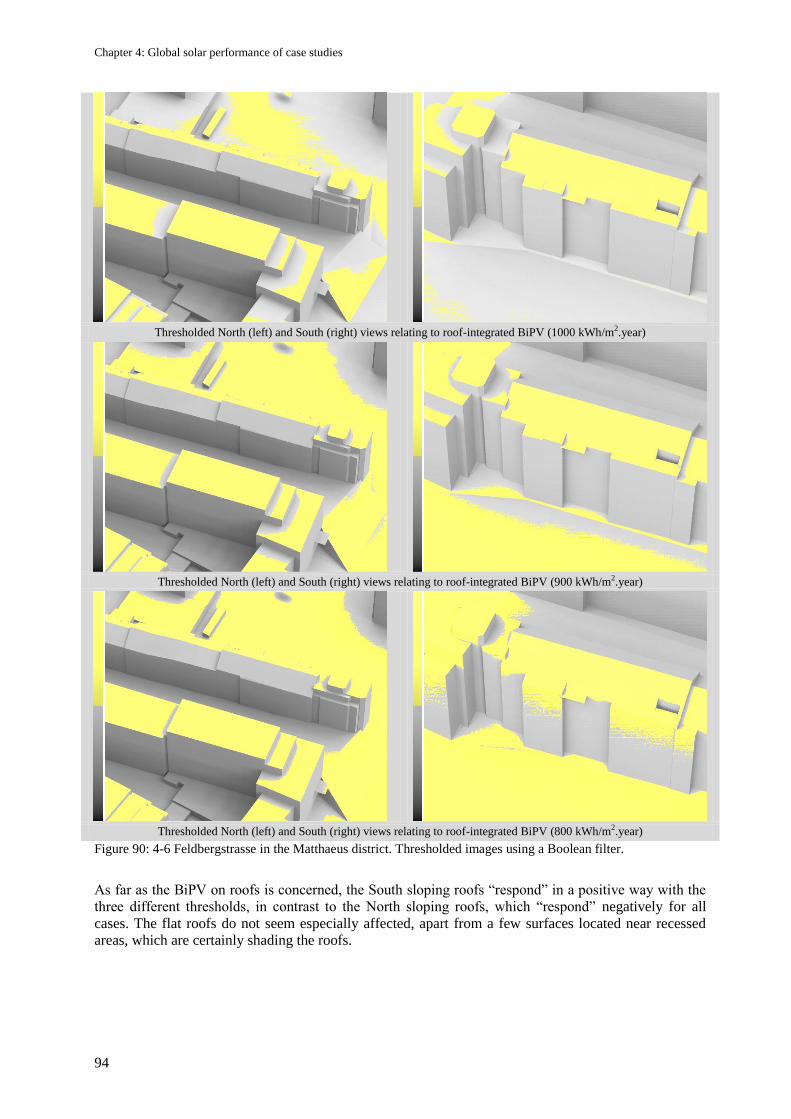
Chapter 4: Global solar performance of case studies
94
Thresholded North (left) and South (right) views relating to roof-integrated BiPV (1000 kWh/m2.year)
Thresholded North (left) and South (right) views relating to roof-integrated BiPV (900 kWh/m2.year)
Thresholded North (left) and South (right) views relating to roof-integrated BiPV (800 kWh/m2.year)
Figure 90: 4-6 Feldbergstrasse in the Matthaeus district. Thresholded images using a Boolean filter.
As far as the BiPV on roofs is concerned, the South sloping roofs ―respond‖ in a positive way with the
three different thresholds, in contrast to the North sloping roofs, which ―respond‖ negatively for all
cases. The flat roofs do not seem especially affected, apart from a few surfaces located near recessed
areas, which are certainly shading the roofs.
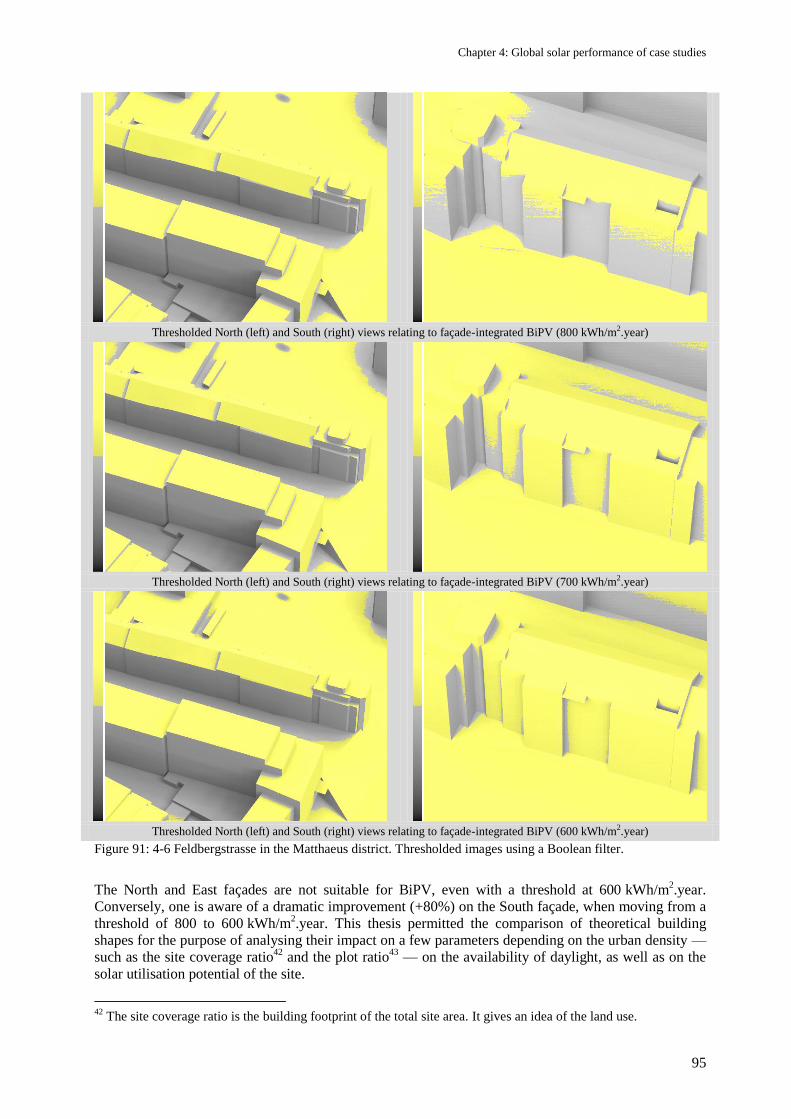
Chapter 4: Global solar performance of case studies
95
Thresholded North (left) and South (right) views relating to façade-integrated BiPV (800 kWh/m2.year)
Thresholded North (left) and South (right) views relating to façade-integrated BiPV (700 kWh/m2.year)
Thresholded North (left) and South (right) views relating to façade-integrated BiPV (600 kWh/m2.year)
Figure 91: 4-6 Feldbergstrasse in the Matthaeus district. Thresholded images using a Boolean filter.
The North and East façades are not suitable for BiPV, even with a threshold at 600 kWh/m2.year.
Conversely, one is aware of a dramatic improvement (+80%) on the South façade, when moving from a
threshold of 800 to 600 kWh/m2.year. This thesis permitted the comparison of theoretical building
shapes for the purpose of analysing their impact on a few parameters depending on the urban density —
such as the site coverage ratio42
and the plot ratio43
— on the availability of daylight, as well as on the
solar utilisation potential of the site.
42
The site coverage ratio is the building footprint of the total site area. It gives an idea of the land use.
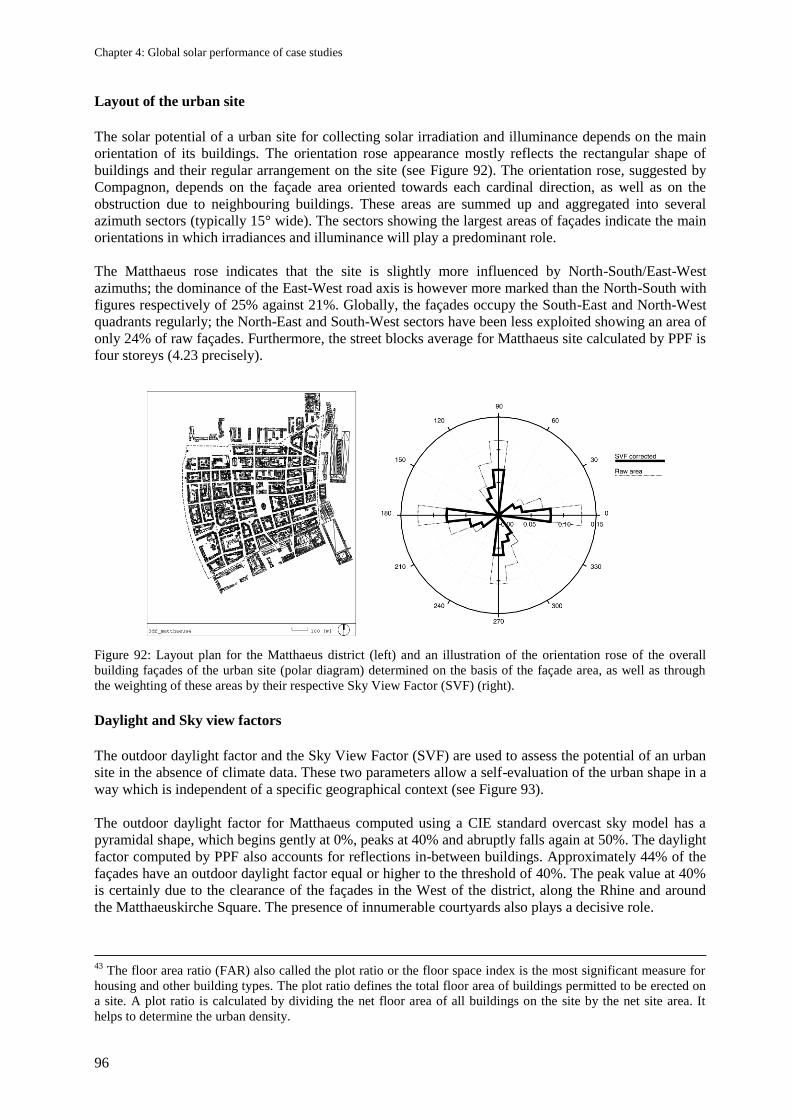
Chapter 4: Global solar performance of case studies
96
Layout of the urban site
The solar potential of a urban site for collecting solar irradiation and illuminance depends on the main
orientation of its buildings. The orientation rose appearance mostly reflects the rectangular shape of
buildings and their regular arrangement on the site (see Figure 92). The orientation rose, suggested by
Compagnon, depends on the façade area oriented towards each cardinal direction, as well as on the
obstruction due to neighbouring buildings. These areas are summed up and aggregated into several
azimuth sectors (typically 15° wide). The sectors showing the largest areas of façades indicate the main
orientations in which irradiances and illuminance will play a predominant role.
The Matthaeus rose indicates that the site is slightly more influenced by North-South/East-West
azimuths; the dominance of the East-West road axis is however more marked than the North-South with
figures respectively of 25% against 21%. Globally, the façades occupy the South-East and North-West
quadrants regularly; the North-East and South-West sectors have been less exploited showing an area of
only 24% of raw façades. Furthermore, the street blocks average for Matthaeus site calculated by PPF is
four storeys (4.23 precisely).
Figure 92: Layout plan for the Matthaeus district (left) and an illustration of the orientation rose of the overall
building façades of the urban site (polar diagram) determined on the basis of the façade area, as well as through
the weighting of these areas by their respective Sky View Factor (SVF) (right).
Daylight and Sky view factors
The outdoor daylight factor and the Sky View Factor (SVF) are used to assess the potential of an urban
site in the absence of climate data. These two parameters allow a self-evaluation of the urban shape in a
way which is independent of a specific geographical context (see Figure 93).
The outdoor daylight factor for Matthaeus computed using a CIE standard overcast sky model has a
pyramidal shape, which begins gently at 0%, peaks at 40% and abruptly falls again at 50%. The daylight
factor computed by PPF also accounts for reflections in-between buildings. Approximately 44% of the
façades have an outdoor daylight factor equal or higher to the threshold of 40%. The peak value at 40%
is certainly due to the clearance of the façades in the West of the district, along the Rhine and around
the Matthaeuskirche Square. The presence of innumerable courtyards also plays a decisive role.
43
The floor area ratio (FAR) also called the plot ratio or the floor space index is the most significant measure for
housing and other building types. The plot ratio defines the total floor area of buildings permitted to be erected on
a site. A plot ratio is calculated by dividing the net floor area of all buildings on the site by the net site area. It
helps to determine the urban density.
Chapter 4: Global solar performance of case studies
97
As indicated earlier, the site is rather intensely occupied, with a population density of 260 inhab./ha and
a plot ratio of 2.44. The density of urban areas has a considerable impact on the Sky View Factor
(SVF): this is confirmed by the orientation rose, on which their cooling and daylighting potential
depend. The urban feature of Matthaeus is responsible for a significant reduction of the sky fraction
viewed by the buildings‘ façades; most of the building façades (and roofs) are subject to rather
unfavourable conditions. The façades are heavily obstructed at the rate of 40%: consequently, SVF
values lie between 0.2-0.5 for the façades and 0.8-1 for the roofs of Matthaeus with an important peak
between 0.85 and 1. The most obstructed façades are located in the South-East and North-West sectors.
One should observe on the orientation rose a large difference in obstruction between West and East
given the fact that the entire West side of the Matthaeus district is built in the vicinity of the Rhine, and
consequently free of obstruction. Nevertheless, the difference between these two orientations is only
1%.
Obstruction Illuminance Multiplier
Obstruction Illuminance Multiplier (OIM) distributions computed for all surface orientations (see
Figure 94) are an alternative method to assess the effect of urban form on daylight access. These graphs
show that the Matthaeus district is affected by obstructions. All façade surfaces have an OIM lower than
1 with a peak in the ranges of 0.9 and 1 for roofs. During the heating season, when the sun elevation
angle is low and on high surface reflectance, the OIM increases from 0.4 up to 1 for some façades. This
indicates that their surrounding obstructions act poorly as effective reflectors for façades in contrast to
the roofs whose peak increases considerably in Winter. However, the number of façades areas showing
an OIM value larger than 1 is higher during the heating season compared with the annual calculation.
This is also an indication of a positive effect of the inter-reflections over surrounding buildings.
Irradiation and illuminance distributions
A key results from PPF is the calculation of the solar irradiation and illuminance histograms shown in
Figure 95, with black areas relating to façades and grey to roofs. PPF determines, by accounting for
inter-reflections and for each part of the envelopes, the irradiation (measured in kWh/m2) and the
illuminance (measured in lx) impinging the buildings envelope. All these values, averaged over an
appropriate time period are grouped within histograms, which give the areas of the envelope elements in
different classes of irradiation or illuminance. The histograms of solar irradiance allow the assessment
of photovoltaic systems and solar thermal collectors; the histograms of solar irradiance assessed during
the heating season allow the assessment of passive thermal heating.
Annual façade irradiation is fairly normally distributed around 400 kWh/m2.year with a weak peak in
the ranges of 100-200 kWh/m2.year. The average global irradiation for the façades is equal to
390 kWh/m2.year, which is rather low. In contrast to the façades, the roofs of Matthaeus are relatively
unobstructed, with the highest fraction of surfaces receiving 1,100 kWh/m2.year and an average
irradiation of 925 kWh/m2.year. However, the histogram has a long tail towards the end of the
irradiation scale, suggesting that some low roofs are heavily obstructed. The trend is similar for the
annual illuminance distribution for façades and roofs, with peaks in the ranges 6-8 kLux and 28-
30 kLux.
In Winter, the irradiation distribution has a sharp peak located between 0-100 kWh/m2.year; it ends with
a long tail towards the low end of the irradiation scale at 400 kWh/m2.year with a Winter average of
136.4 kWh/m2.year. On the other hand, the roofs see a little more sun with an average of
289.2 kWh/m2.year. In both cases, the Winter average is weak. The pattern of Winter illuminance is less
―squeezed‖ than the Winter irradiation. It shows two peaks between 4-6 kLux and 18-20 kLux and
reaches up to 22 kLux for the façades.
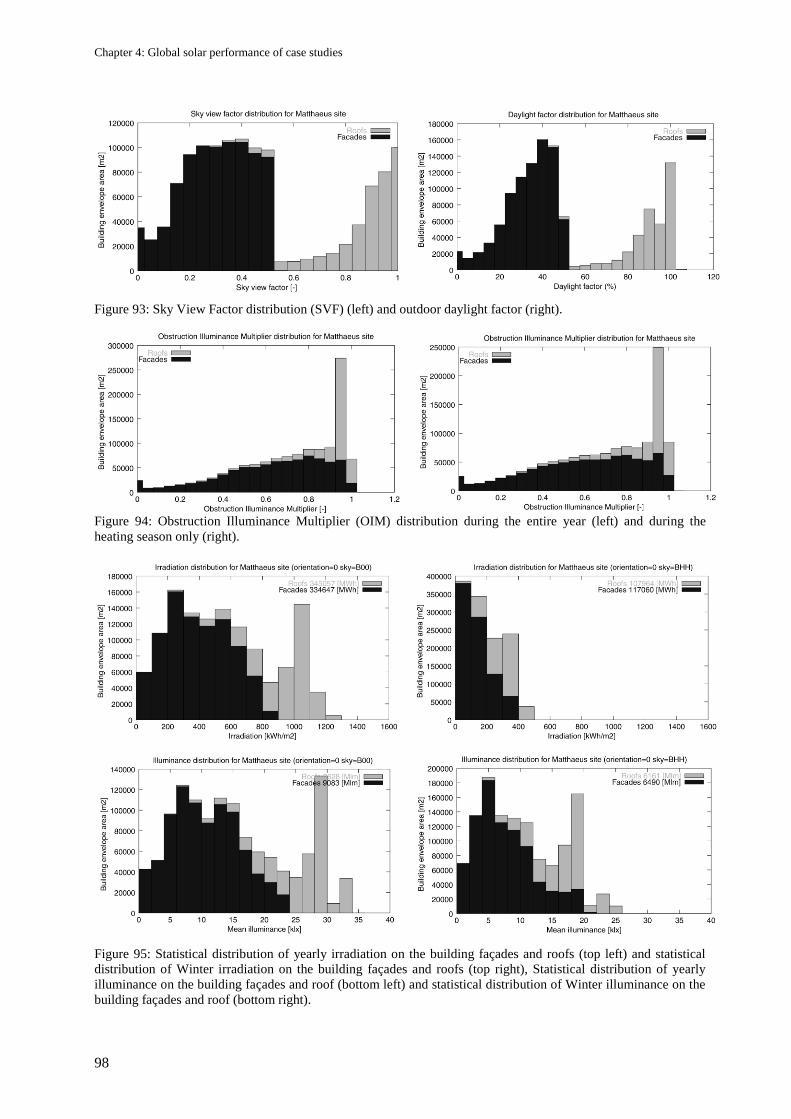
Chapter 4: Global solar performance of case studies
98
Figure 93: Sky View Factor distribution (SVF) (left) and outdoor daylight factor (right).
Figure 94: Obstruction Illuminance Multiplier (OIM) distribution during the entire year (left) and during the
heating season only (right).
Figure 95: Statistical distribution of yearly irradiation on the building façades and roofs (top left) and statistical
distribution of Winter irradiation on the building façades and roofs (top right), Statistical distribution of yearly
illuminance on the building façades and roof (bottom left) and statistical distribution of Winter illuminance on the
building façades and roof (bottom right).
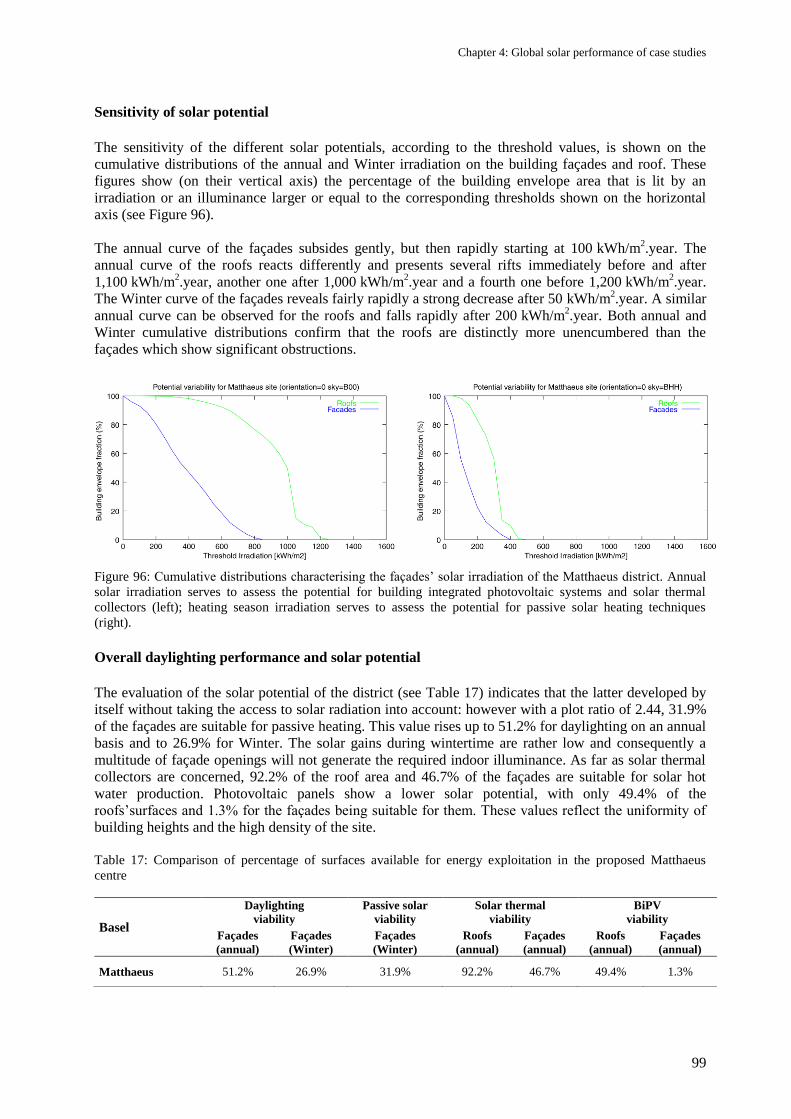
Chapter 4: Global solar performance of case studies
99
Sensitivity of solar potential
The sensitivity of the different solar potentials, according to the threshold values, is shown on the
cumulative distributions of the annual and Winter irradiation on the building façades and roof. These
figures show (on their vertical axis) the percentage of the building envelope area that is lit by an
irradiation or an illuminance larger or equal to the corresponding thresholds shown on the horizontal
axis (see Figure 96).
The annual curve of the façades subsides gently, but then rapidly starting at 100 kWh/m2.year. The
annual curve of the roofs reacts differently and presents several rifts immediately before and after
1,100 kWh/m2.year, another one after 1,000 kWh/m
2.year and a fourth one before 1,200 kWh/m
2.year.
The Winter curve of the façades reveals fairly rapidly a strong decrease after 50 kWh/m2.year. A similar
annual curve can be observed for the roofs and falls rapidly after 200 kWh/m2.year. Both annual and
Winter cumulative distributions confirm that the roofs are distinctly more unencumbered than the
façades which show significant obstructions.
Figure 96: Cumulative distributions characterising the façades‘ solar irradiation of the Matthaeus district. Annual
solar irradiation serves to assess the potential for building integrated photovoltaic systems and solar thermal
collectors (left); heating season irradiation serves to assess the potential for passive solar heating techniques
(right).
Overall daylighting performance and solar potential
The evaluation of the solar potential of the district (see Table 17) indicates that the latter developed by
itself without taking the access to solar radiation into account: however with a plot ratio of 2.44, 31.9%
of the façades are suitable for passive heating. This value rises up to 51.2% for daylighting on an annual
basis and to 26.9% for Winter. The solar gains during wintertime are rather low and consequently a
multitude of façade openings will not generate the required indoor illuminance. As far as solar thermal
collectors are concerned, 92.2% of the roof area and 46.7% of the façades are suitable for solar hot
water production. Photovoltaic panels show a lower solar potential, with only 49.4% of the
roofs‘surfaces and 1.3% for the façades being suitable for them. These values reflect the uniformity of
building heights and the high density of the site.
Table 17: Comparison of percentage of surfaces available for energy exploitation in the proposed Matthaeus
centre
Basel
Daylighting
viability
Passive solar
viability
Solar thermal
viability
BiPV
viability
Façades
(annual)
Façades
(Winter)
Façades
(Winter)
Roofs
(annual)
Façades
(annual)
Roofs
(annual)
Façades
(annual)
Matthaeus 51.2% 26.9% 31.9% 92.2% 46.7% 49.4% 1.3%
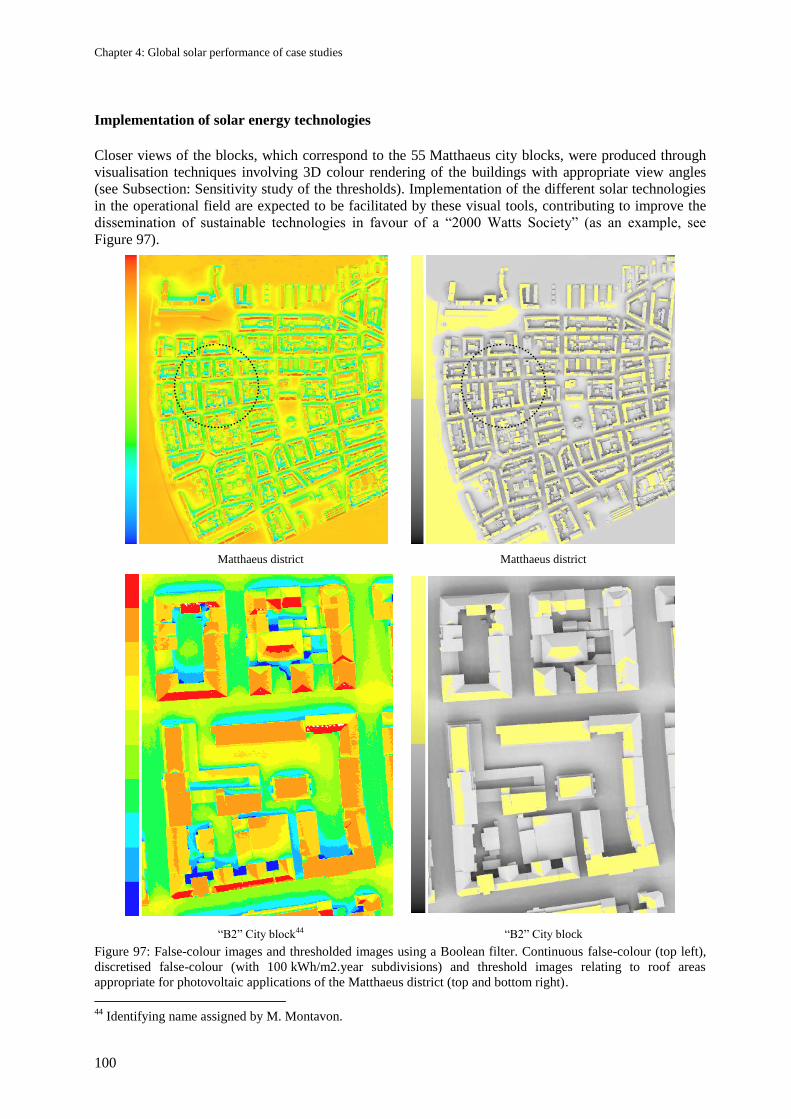
Chapter 4: Global solar performance of case studies
100
Implementation of solar energy technologies
Closer views of the blocks, which correspond to the 55 Matthaeus city blocks, were produced through
visualisation techniques involving 3D colour rendering of the buildings with appropriate view angles
(see Subsection: Sensitivity study of the thresholds). Implementation of the different solar technologies
in the operational field are expected to be facilitated by these visual tools, contributing to improve the
dissemination of sustainable technologies in favour of a ―2000 Watts Society‖ (as an example, see
Figure 97).
Matthaeus district Matthaeus district
―B2‖ City block44 ―B2‖ City block
Figure 97: False-colour images and thresholded images using a Boolean filter. Continuous false-colour (top left),
discretised false-colour (with 100 kWh/m2.year subdivisions) and threshold images relating to roof areas
appropriate for photovoltaic applications of the Matthaeus district (top and bottom right).
44
Identifying name assigned by M. Montavon.
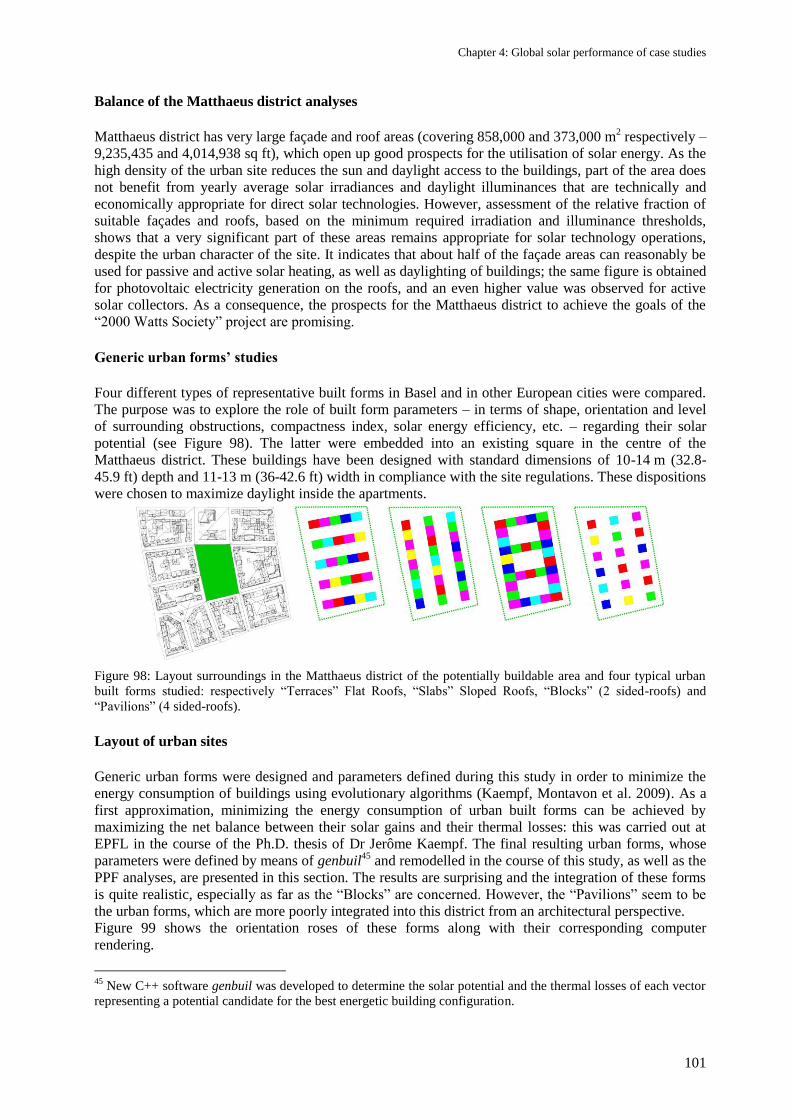
Chapter 4: Global solar performance of case studies
101
Balance of the Matthaeus district analyses
Matthaeus district has very large façade and roof areas (covering 858,000 and 373,000 m2 respectively –
9,235,435 and 4,014,938 sq ft), which open up good prospects for the utilisation of solar energy. As the
high density of the urban site reduces the sun and daylight access to the buildings, part of the area does
not benefit from yearly average solar irradiances and daylight illuminances that are technically and
economically appropriate for direct solar technologies. However, assessment of the relative fraction of
suitable façades and roofs, based on the minimum required irradiation and illuminance thresholds,
shows that a very significant part of these areas remains appropriate for solar technology operations,
despite the urban character of the site. It indicates that about half of the façade areas can reasonably be
used for passive and active solar heating, as well as daylighting of buildings; the same figure is obtained
for photovoltaic electricity generation on the roofs, and an even higher value was observed for active
solar collectors. As a consequence, the prospects for the Matthaeus district to achieve the goals of the
―2000 Watts Society‖ project are promising.
Generic urban forms’ studies
Four different types of representative built forms in Basel and in other European cities were compared.
The purpose was to explore the role of built form parameters – in terms of shape, orientation and level
of surrounding obstructions, compactness index, solar energy efficiency, etc. – regarding their solar
potential (see Figure 98). The latter were embedded into an existing square in the centre of the
Matthaeus district. These buildings have been designed with standard dimensions of 10-14 m (32.8-
45.9 ft) depth and 11-13 m (36-42.6 ft) width in compliance with the site regulations. These dispositions
were chosen to maximize daylight inside the apartments.
Figure 98: Layout surroundings in the Matthaeus district of the potentially buildable area and four typical urban
built forms studied: respectively ―Terraces‖ Flat Roofs, ―Slabs‖ Sloped Roofs, ―Blocks‖ (2 sided-roofs) and
―Pavilions‖ (4 sided-roofs).
Layout of urban sites
Generic urban forms were designed and parameters defined during this study in order to minimize the
energy consumption of buildings using evolutionary algorithms (Kaempf, Montavon et al. 2009). As a
first approximation, minimizing the energy consumption of urban built forms can be achieved by
maximizing the net balance between their solar gains and their thermal losses: this was carried out at
EPFL in the course of the Ph.D. thesis of Dr Jerôme Kaempf. The final resulting urban forms, whose
parameters were defined by means of genbuil45
and remodelled in the course of this study, as well as the
PPF analyses, are presented in this section. The results are surprising and the integration of these forms
is quite realistic, especially as far as the ―Blocks‖ are concerned. However, the ―Pavilions‖ seem to be
the urban forms, which are more poorly integrated into this district from an architectural perspective.
Figure 99 shows the orientation roses of these forms along with their corresponding computer
rendering.
45
New C++ software genbuil was developed to determine the solar potential and the thermal losses of each vector
representing a potential candidate for the best energetic building configuration.
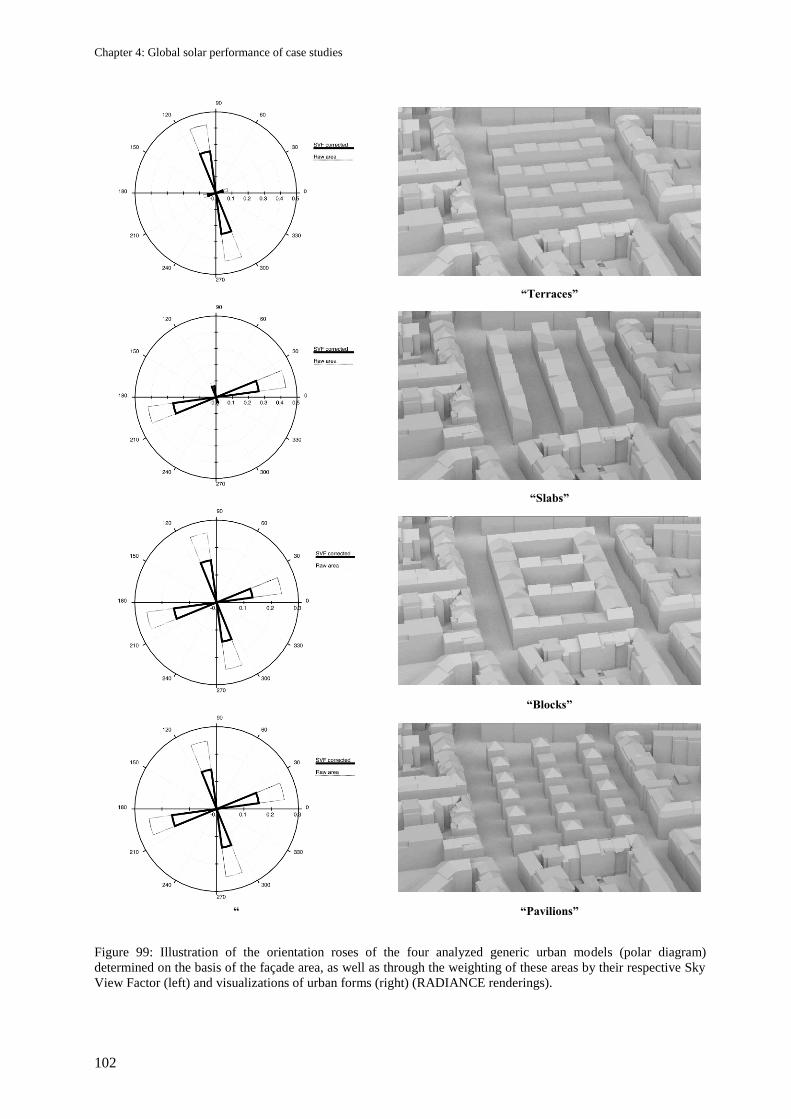
Chapter 4: Global solar performance of case studies
102
Figure 99: Illustration of the orientation roses of the four analyzed generic urban models (polar diagram)
determined on the basis of the façade area, as well as through the weighting of these areas by their respective Sky
View Factor (left) and visualizations of urban forms (right) (RADIANCE renderings).
“Terraces”
“Slabs”
“Blocks”
“ “Pavilions”
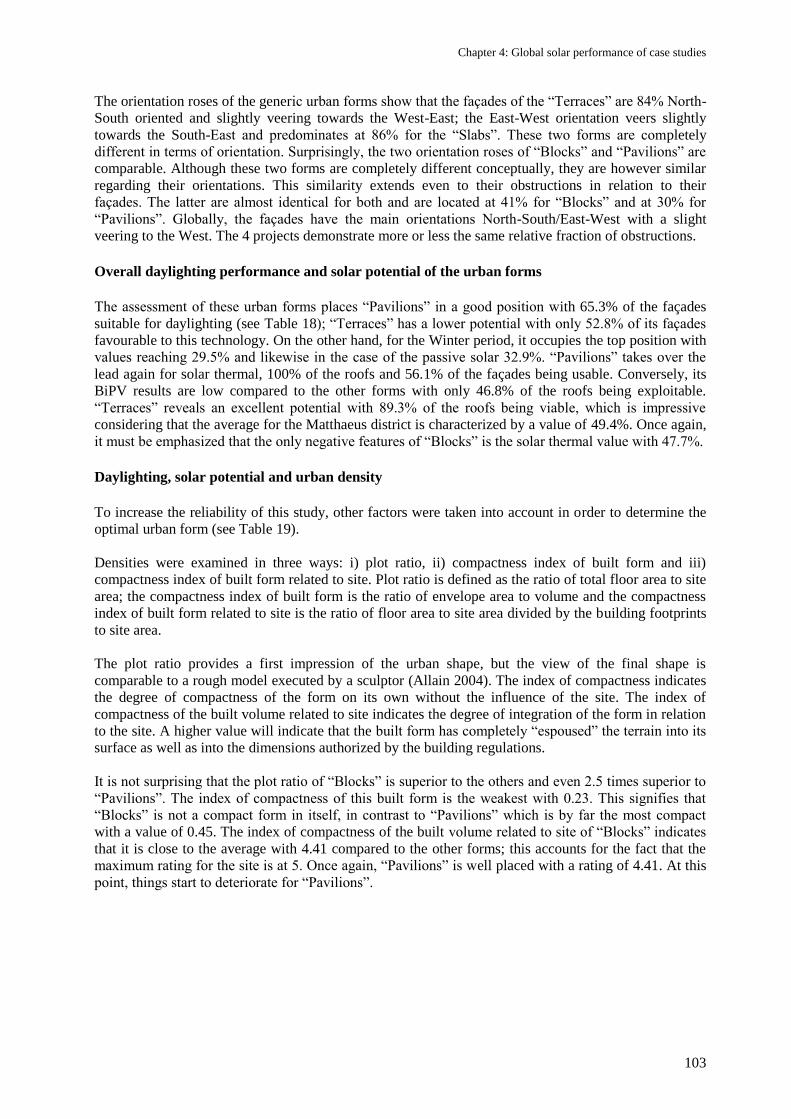
Chapter 4: Global solar performance of case studies
103
The orientation roses of the generic urban forms show that the façades of the ―Terraces‖ are 84% North-
South oriented and slightly veering towards the West-East; the East-West orientation veers slightly
towards the South-East and predominates at 86% for the ―Slabs‖. These two forms are completely
different in terms of orientation. Surprisingly, the two orientation roses of ―Blocks‖ and ―Pavilions‖ are
comparable. Although these two forms are completely different conceptually, they are however similar
regarding their orientations. This similarity extends even to their obstructions in relation to their
façades. The latter are almost identical for both and are located at 41% for ―Blocks‖ and at 30% for
―Pavilions‖. Globally, the façades have the main orientations North-South/East-West with a slight
veering to the West. The 4 projects demonstrate more or less the same relative fraction of obstructions.
Overall daylighting performance and solar potential of the urban forms
The assessment of these urban forms places ―Pavilions‖ in a good position with 65.3% of the façades
suitable for daylighting (see Table 18); ―Terraces‖ has a lower potential with only 52.8% of its façades
favourable to this technology. On the other hand, for the Winter period, it occupies the top position with
values reaching 29.5% and likewise in the case of the passive solar 32.9%. ―Pavilions‖ takes over the
lead again for solar thermal, 100% of the roofs and 56.1% of the façades being usable. Conversely, its
BiPV results are low compared to the other forms with only 46.8% of the roofs being exploitable.
―Terraces‖ reveals an excellent potential with 89.3% of the roofs being viable, which is impressive
considering that the average for the Matthaeus district is characterized by a value of 49.4%. Once again,
it must be emphasized that the only negative features of ―Blocks‖ is the solar thermal value with 47.7%.
Daylighting, solar potential and urban density
To increase the reliability of this study, other factors were taken into account in order to determine the
optimal urban form (see Table 19).
Densities were examined in three ways: i) plot ratio, ii) compactness index of built form and iii)
compactness index of built form related to site. Plot ratio is defined as the ratio of total floor area to site
area; the compactness index of built form is the ratio of envelope area to volume and the compactness
index of built form related to site is the ratio of floor area to site area divided by the building footprints
to site area.
The plot ratio provides a first impression of the urban shape, but the view of the final shape is
comparable to a rough model executed by a sculptor (Allain 2004). The index of compactness indicates
the degree of compactness of the form on its own without the influence of the site. The index of
compactness of the built volume related to site indicates the degree of integration of the form in relation
to the site. A higher value will indicate that the built form has completely ―espoused‖ the terrain into its
surface as well as into the dimensions authorized by the building regulations.
It is not surprising that the plot ratio of ―Blocks‖ is superior to the others and even 2.5 times superior to
―Pavilions‖. The index of compactness of this built form is the weakest with 0.23. This signifies that
―Blocks‖ is not a compact form in itself, in contrast to ―Pavilions‖ which is by far the most compact
with a value of 0.45. The index of compactness of the built volume related to site of ―Blocks‖ indicates
that it is close to the average with 4.41 compared to the other forms; this accounts for the fact that the
maximum rating for the site is at 5. Once again, ―Pavilions‖ is well placed with a rating of 4.41. At this
point, things start to deteriorate for ―Pavilions‖.
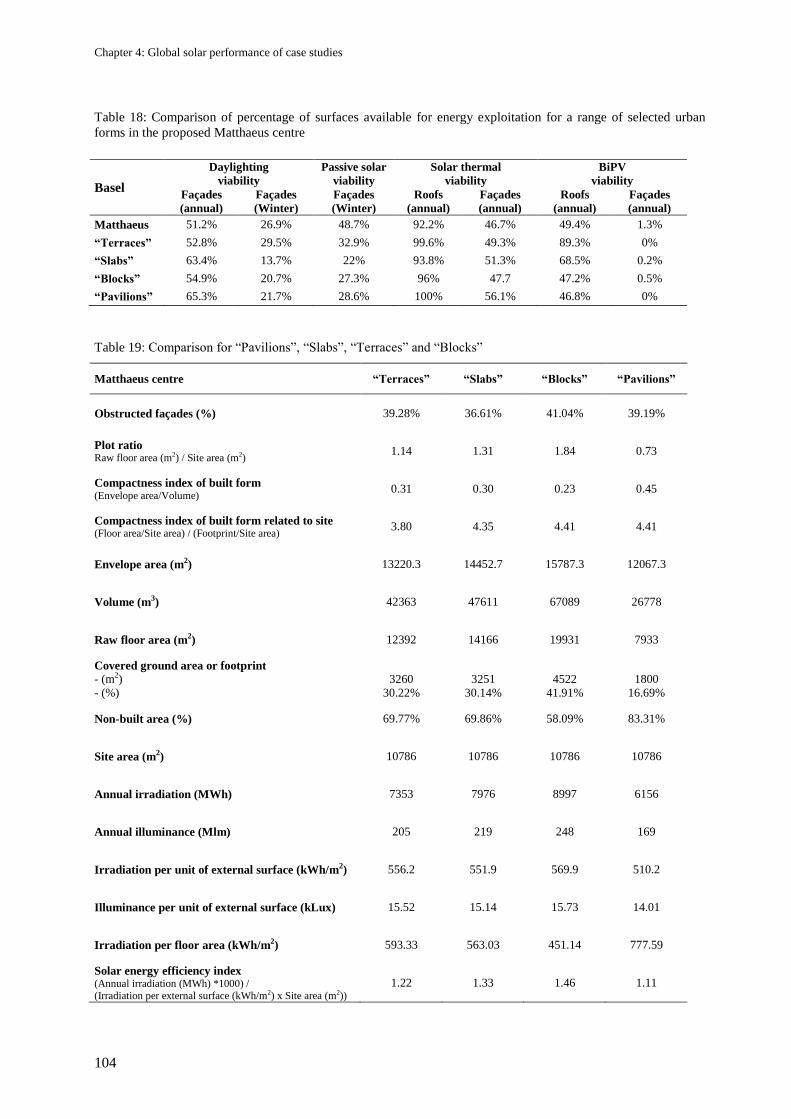
Chapter 4: Global solar performance of case studies
104
Table 18: Comparison of percentage of surfaces available for energy exploitation for a range of selected urban
forms in the proposed Matthaeus centre
Table 19: Comparison for ―Pavilions‖, ―Slabs‖, ―Terraces‖ and ―Blocks‖
Matthaeus centre “Terraces” “Slabs” “Blocks” “Pavilions”
Obstructed façades (%) 39.28% 36.61% 41.04% 39.19%
Plot ratio Raw floor area (m2) / Site area (m2)
1.14 1.31 1.84 0.73
Compactness index of built form (Envelope area/Volume)
0.31 0.30 0.23 0.45
Compactness index of built form related to site (Floor area/Site area) / (Footprint/Site area)
3.80 4.35 4.41 4.41
Envelope area (m2) 13220.3 14452.7 15787.3 12067.3
Volume (m3) 42363 47611 67089 26778
Raw floor area (m2) 12392 14166 19931 7933
Covered ground area or footprint
- (m2)
- (%)
3260
30.22%
3251
30.14%
4522
41.91%
1800
16.69%
Non-built area (%) 69.77% 69.86% 58.09% 83.31%
Site area (m2) 10786 10786 10786 10786
Annual irradiation (MWh) 7353 7976 8997 6156
Annual illuminance (Mlm) 205 219 248 169
Irradiation per unit of external surface (kWh/m2) 556.2 551.9 569.9 510.2
Illuminance per unit of external surface (kLux) 15.52 15.14 15.73 14.01
Irradiation per floor area (kWh/m2) 593.33 563.03 451.14 777.59
Solar energy efficiency index (Annual irradiation (MWh) *1000) / (Irradiation per external surface (kWh/m2) x Site area (m2))
1.22 1.33 1.46 1.11
Basel
Daylighting
viability
Passive solar
viability
Solar thermal
viability
BiPV
viability
Façades
(annual)
Façades
(Winter)
Façades
(Winter)
Roofs
(annual)
Façades
(annual)
Roofs
(annual)
Façades
(annual)
Matthaeus 51.2% 26.9% 48.7% 92.2% 46.7% 49.4% 1.3%
“Terraces” 52.8% 29.5% 32.9% 99.6% 49.3% 89.3% 0%
“Slabs” 63.4% 13.7% 22% 93.8% 51.3% 68.5% 0.2%
“Blocks” 54.9% 20.7% 27.3% 96% 47.7 47.2% 0.5%
“Pavilions” 65.3% 21.7% 28.6% 100% 56.1% 46.8% 0%
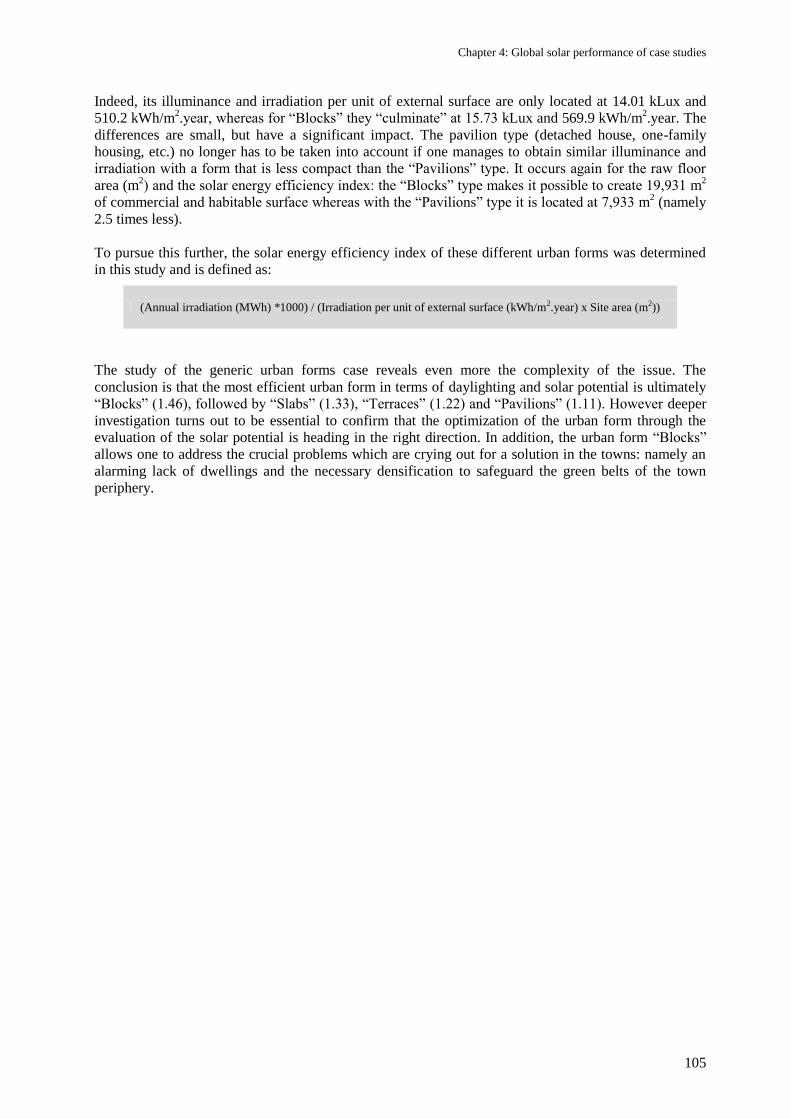
Chapter 4: Global solar performance of case studies
105
Indeed, its illuminance and irradiation per unit of external surface are only located at 14.01 kLux and
510.2 kWh/m2.year, whereas for ―Blocks‖ they ―culminate‖ at 15.73 kLux and 569.9 kWh/m
2.year. The
differences are small, but have a significant impact. The pavilion type (detached house, one-family
housing, etc.) no longer has to be taken into account if one manages to obtain similar illuminance and
irradiation with a form that is less compact than the ―Pavilions‖ type. It occurs again for the raw floor
area (m2) and the solar energy efficiency index: the ―Blocks‖ type makes it possible to create 19,931 m
2
of commercial and habitable surface whereas with the ―Pavilions‖ type it is located at 7,933 m2 (namely
2.5 times less).
To pursue this further, the solar energy efficiency index of these different urban forms was determined
in this study and is defined as:
(Annual irradiation (MWh) *1000) / (Irradiation per unit of external surface (kWh/m2.year) x Site area (m2))
The study of the generic urban forms case reveals even more the complexity of the issue. The
conclusion is that the most efficient urban form in terms of daylighting and solar potential is ultimately
―Blocks‖ (1.46), followed by ―Slabs‖ (1.33), ―Terraces‖ (1.22) and ―Pavilions‖ (1.11). However deeper
investigation turns out to be essential to confirm that the optimization of the urban form through the
evaluation of the solar potential is heading in the right direction. In addition, the urban form ―Blocks‖
allows one to address the crucial problems which are crying out for a solution in the towns: namely an
alarming lack of dwellings and the necessary densification to safeguard the green belts of the town
periphery.
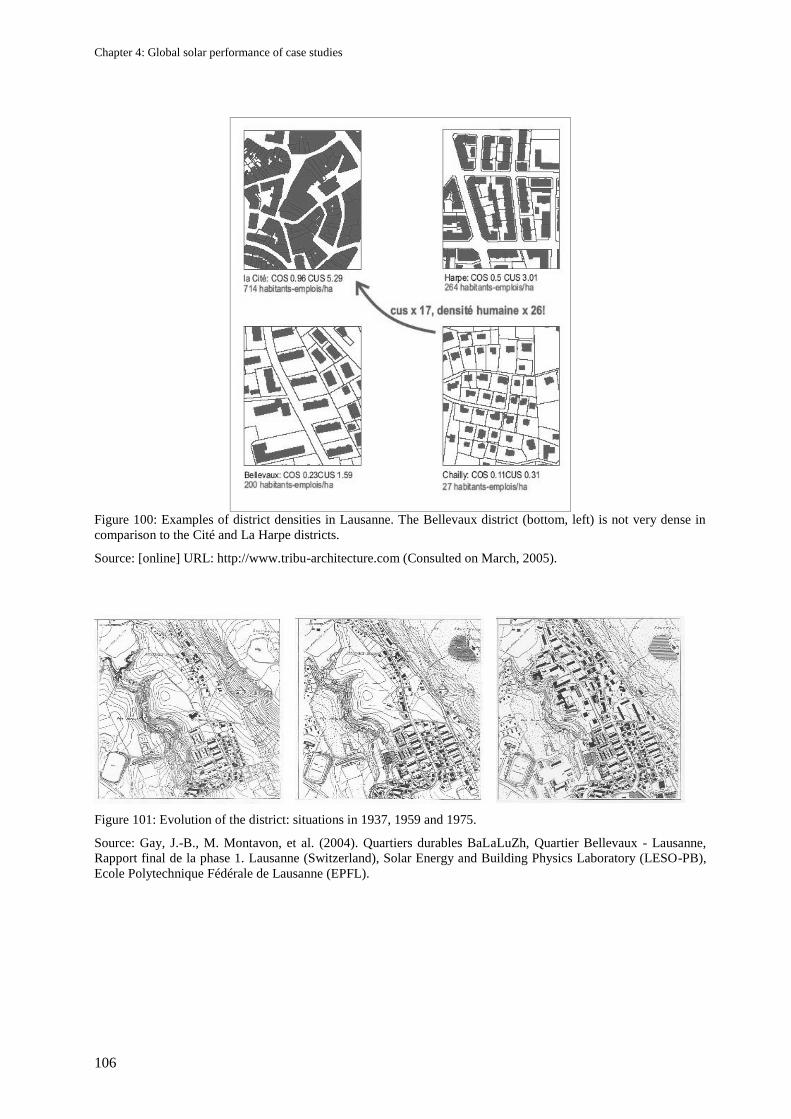
Chapter 4: Global solar performance of case studies
106
Figure 100: Examples of district densities in Lausanne. The Bellevaux district (bottom, left) is not very dense in
comparison to the Cité and La Harpe districts.
Source: [online] URL: http://www.tribu-architecture.com (Consulted on March, 2005).
Figure 101: Evolution of the district: situations in 1937, 1959 and 1975.
Source: Gay, J.-B., M. Montavon, et al. (2004). Quartiers durables BaLaLuZh, Quartier Bellevaux - Lausanne,
Rapport final de la phase 1. Lausanne (Switzerland), Solar Energy and Building Physics Laboratory (LESO-PB),
Ecole Polytechnique Fédérale de Lausanne (EPFL).
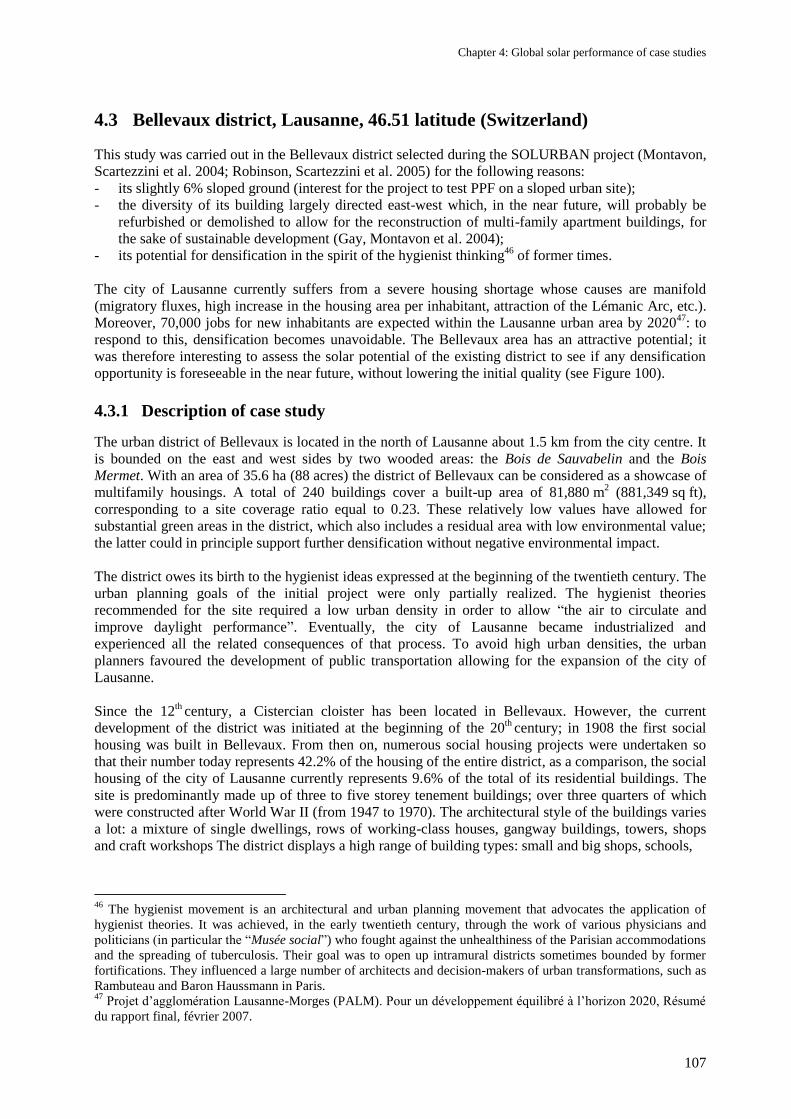
Chapter 4: Global solar performance of case studies
107
4.3 Bellevaux district, Lausanne, 46.51 latitude (Switzerland)
This study was carried out in the Bellevaux district selected during the SOLURBAN project (Montavon,
Scartezzini et al. 2004; Robinson, Scartezzini et al. 2005) for the following reasons:
- its slightly 6% sloped ground (interest for the project to test PPF on a sloped urban site);
- the diversity of its building largely directed east-west which, in the near future, will probably be
refurbished or demolished to allow for the reconstruction of multi-family apartment buildings, for
the sake of sustainable development (Gay, Montavon et al. 2004);
- its potential for densification in the spirit of the hygienist thinking46
of former times.
The city of Lausanne currently suffers from a severe housing shortage whose causes are manifold
(migratory fluxes, high increase in the housing area per inhabitant, attraction of the Lémanic Arc, etc.).
Moreover, 70,000 jobs for new inhabitants are expected within the Lausanne urban area by 202047
: to
respond to this, densification becomes unavoidable. The Bellevaux area has an attractive potential; it
was therefore interesting to assess the solar potential of the existing district to see if any densification
opportunity is foreseeable in the near future, without lowering the initial quality (see Figure 100).
4.3.1 Description of case study
The urban district of Bellevaux is located in the north of Lausanne about 1.5 km from the city centre. It
is bounded on the east and west sides by two wooded areas: the Bois de Sauvabelin and the Bois
Mermet. With an area of 35.6 ha (88 acres) the district of Bellevaux can be considered as a showcase of
multifamily housings. A total of 240 buildings cover a built-up area of 81,880 m2 (881,349 sq ft),
corresponding to a site coverage ratio equal to 0.23. These relatively low values have allowed for
substantial green areas in the district, which also includes a residual area with low environmental value;
the latter could in principle support further densification without negative environmental impact.
The district owes its birth to the hygienist ideas expressed at the beginning of the twentieth century. The
urban planning goals of the initial project were only partially realized. The hygienist theories
recommended for the site required a low urban density in order to allow ―the air to circulate and
improve daylight performance‖. Eventually, the city of Lausanne became industrialized and
experienced all the related consequences of that process. To avoid high urban densities, the urban
planners favoured the development of public transportation allowing for the expansion of the city of
Lausanne.
Since the 12th
century, a Cistercian cloister has been located in Bellevaux. However, the current
development of the district was initiated at the beginning of the 20th
century; in 1908 the first social
housing was built in Bellevaux. From then on, numerous social housing projects were undertaken so
that their number today represents 42.2% of the housing of the entire district, as a comparison, the social
housing of the city of Lausanne currently represents 9.6% of the total of its residential buildings. The
site is predominantly made up of three to five storey tenement buildings; over three quarters of which
were constructed after World War II (from 1947 to 1970). The architectural style of the buildings varies
a lot: a mixture of single dwellings, rows of working-class houses, gangway buildings, towers, shops
and craft workshops The district displays a high range of building types: small and big shops, schools,
46
The hygienist movement is an architectural and urban planning movement that advocates the application of
hygienist theories. It was achieved, in the early twentieth century, through the work of various physicians and
politicians (in particular the ―Musée social‖) who fought against the unhealthiness of the Parisian accommodations
and the spreading of tuberculosis. Their goal was to open up intramural districts sometimes bounded by former
fortifications. They influenced a large number of architects and decision-makers of urban transformations, such as
Rambuteau and Baron Haussmann in Paris. 47
Projet d‘agglomération Lausanne-Morges (PALM). Pour un développement équilibré à l‘horizon 2020, Résumé
du rapport final, février 2007.
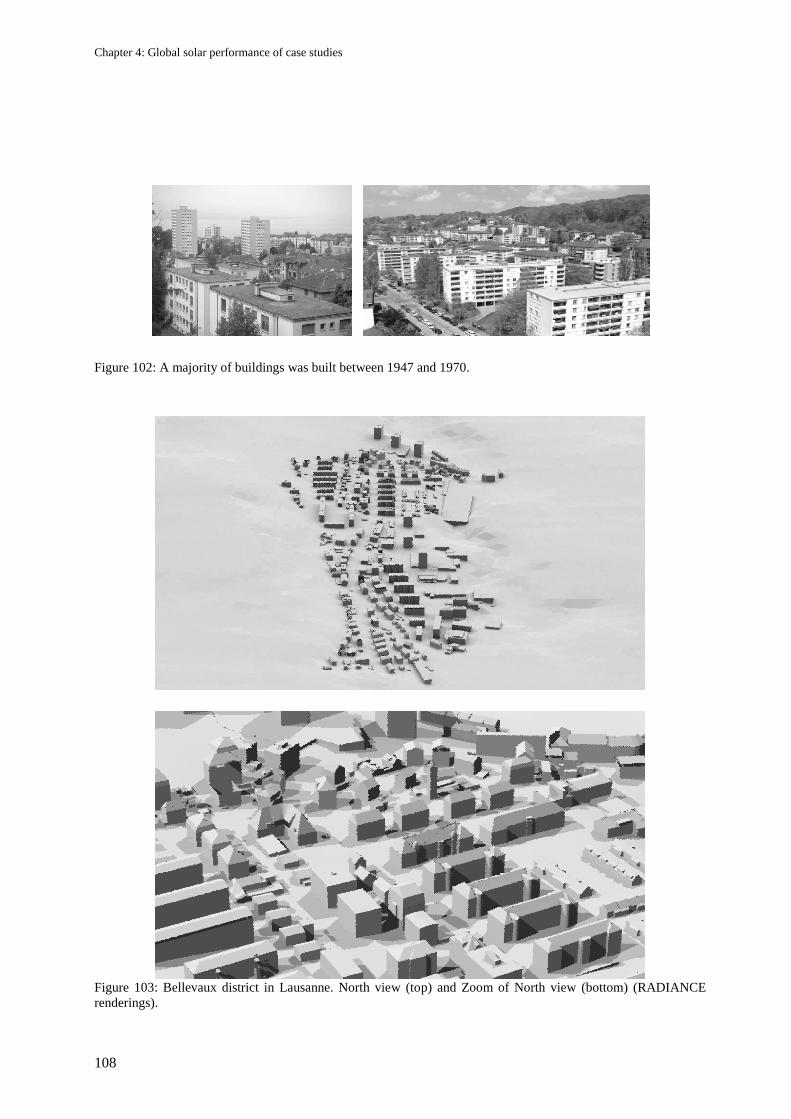
Chapter 4: Global solar performance of case studies
108
Figure 102: A majority of buildings was built between 1947 and 1970.
Figure 103: Bellevaux district in Lausanne. North view (top) and Zoom of North view (bottom) (RADIANCE
renderings).
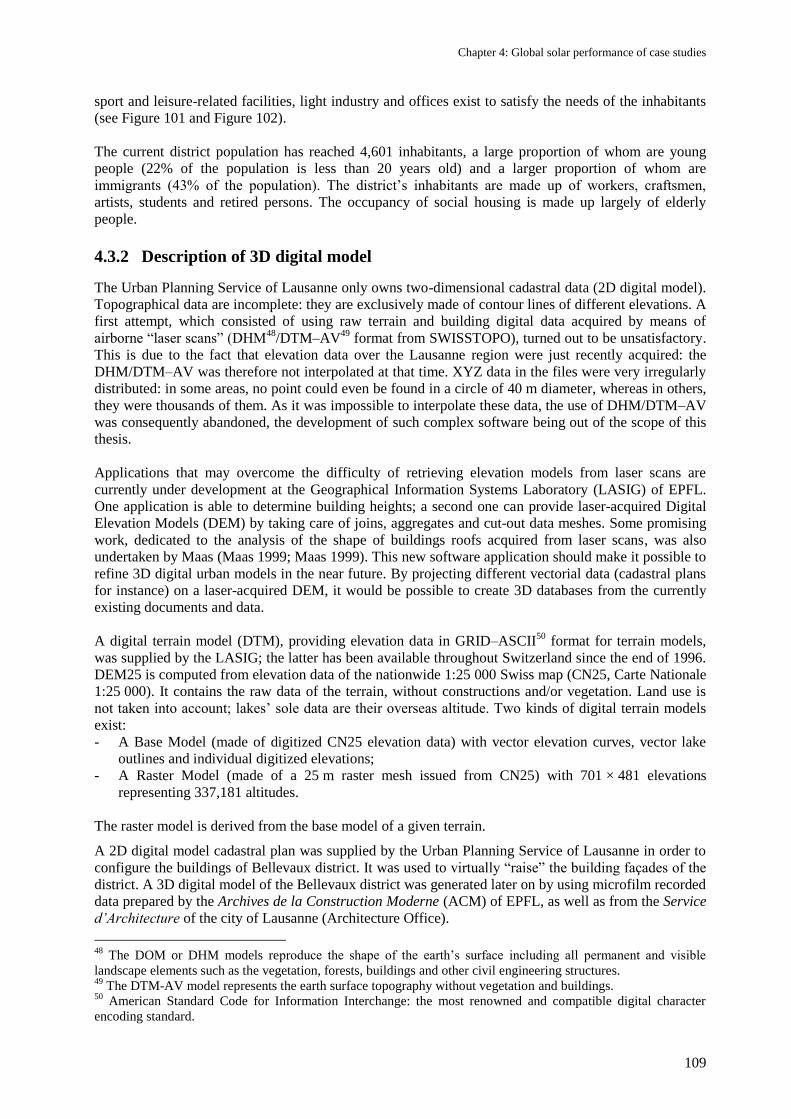
Chapter 4: Global solar performance of case studies
109
sport and leisure-related facilities, light industry and offices exist to satisfy the needs of the inhabitants
(see Figure 101 and Figure 102).
The current district population has reached 4,601 inhabitants, a large proportion of whom are young
people (22% of the population is less than 20 years old) and a larger proportion of whom are
immigrants (43% of the population). The district‘s inhabitants are made up of workers, craftsmen,
artists, students and retired persons. The occupancy of social housing is made up largely of elderly
people.
4.3.2 Description of 3D digital model
The Urban Planning Service of Lausanne only owns two-dimensional cadastral data (2D digital model).
Topographical data are incomplete: they are exclusively made of contour lines of different elevations. A
first attempt, which consisted of using raw terrain and building digital data acquired by means of
airborne ―laser scans‖ (DHM48
/DTM–AV49
format from SWISSTOPO), turned out to be unsatisfactory.
This is due to the fact that elevation data over the Lausanne region were just recently acquired: the
DHM/DTM–AV was therefore not interpolated at that time. XYZ data in the files were very irregularly
distributed: in some areas, no point could even be found in a circle of 40 m diameter, whereas in others,
they were thousands of them. As it was impossible to interpolate these data, the use of DHM/DTM–AV
was consequently abandoned, the development of such complex software being out of the scope of this
thesis.
Applications that may overcome the difficulty of retrieving elevation models from laser scans are
currently under development at the Geographical Information Systems Laboratory (LASIG) of EPFL.
One application is able to determine building heights; a second one can provide laser-acquired Digital
Elevation Models (DEM) by taking care of joins, aggregates and cut-out data meshes. Some promising
work, dedicated to the analysis of the shape of buildings roofs acquired from laser scans, was also
undertaken by Maas (Maas 1999; Maas 1999). This new software application should make it possible to
refine 3D digital urban models in the near future. By projecting different vectorial data (cadastral plans
for instance) on a laser-acquired DEM, it would be possible to create 3D databases from the currently
existing documents and data.
A digital terrain model (DTM), providing elevation data in GRID–ASCII50
format for terrain models,
was supplied by the LASIG; the latter has been available throughout Switzerland since the end of 1996.
DEM25 is computed from elevation data of the nationwide 1:25 000 Swiss map (CN25, Carte Nationale
1:25 000). It contains the raw data of the terrain, without constructions and/or vegetation. Land use is
not taken into account; lakes‘ sole data are their overseas altitude. Two kinds of digital terrain models
exist:
- A Base Model (made of digitized CN25 elevation data) with vector elevation curves, vector lake
outlines and individual digitized elevations;
- A Raster Model (made of a 25 m raster mesh issued from CN25) with 701 × 481 elevations
representing 337,181 altitudes.
The raster model is derived from the base model of a given terrain.
A 2D digital model cadastral plan was supplied by the Urban Planning Service of Lausanne in order to
configure the buildings of Bellevaux district. It was used to virtually ―raise‖ the building façades of the
district. A 3D digital model of the Bellevaux district was generated later on by using microfilm recorded
data prepared by the Archives de la Construction Moderne (ACM) of EPFL, as well as from the Service
d’Architecture of the city of Lausanne (Architecture Office).
48
The DOM or DHM models reproduce the shape of the earth‘s surface including all permanent and visible
landscape elements such as the vegetation, forests, buildings and other civil engineering structures. 49
The DTM-AV model represents the earth surface topography without vegetation and buildings. 50
American Standard Code for Information Interchange: the most renowned and compatible digital character
encoding standard.
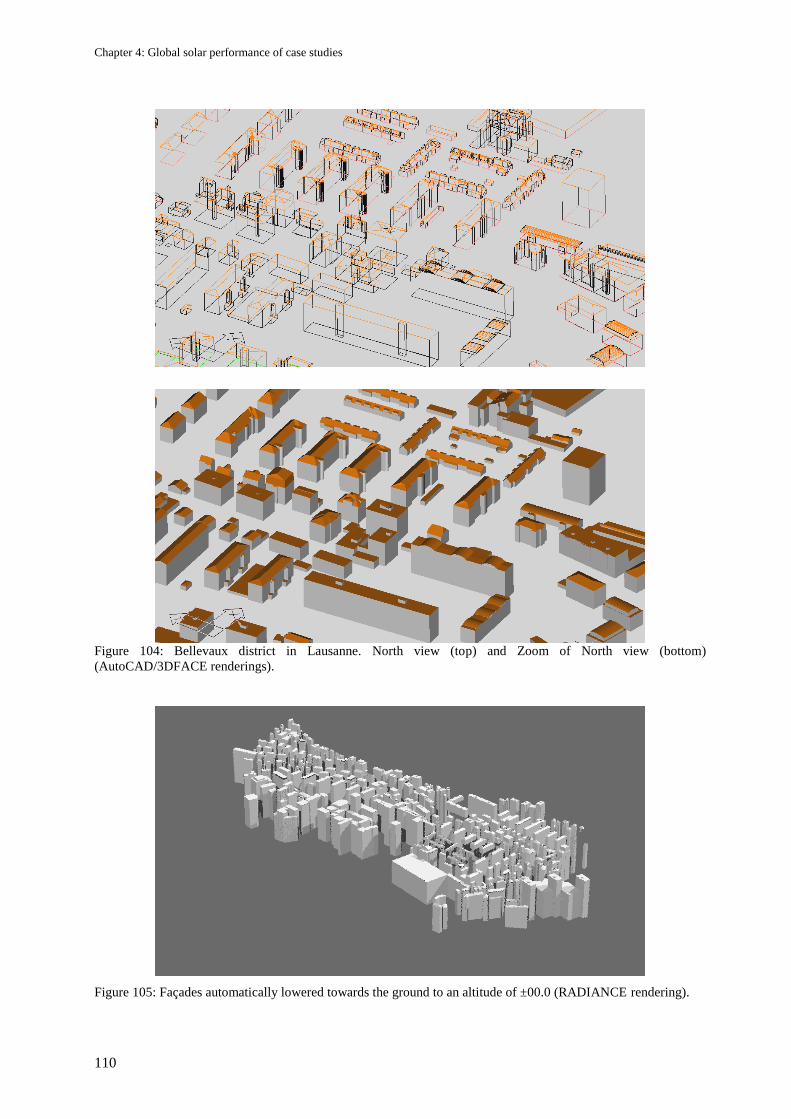
Chapter 4: Global solar performance of case studies
110
Figure 104: Bellevaux district in Lausanne. North view (top) and Zoom of North view (bottom)
(AutoCAD/3DFACE renderings).
Figure 105: Façades automatically lowered towards the ground to an altitude of ±00.0 (RADIANCE rendering).
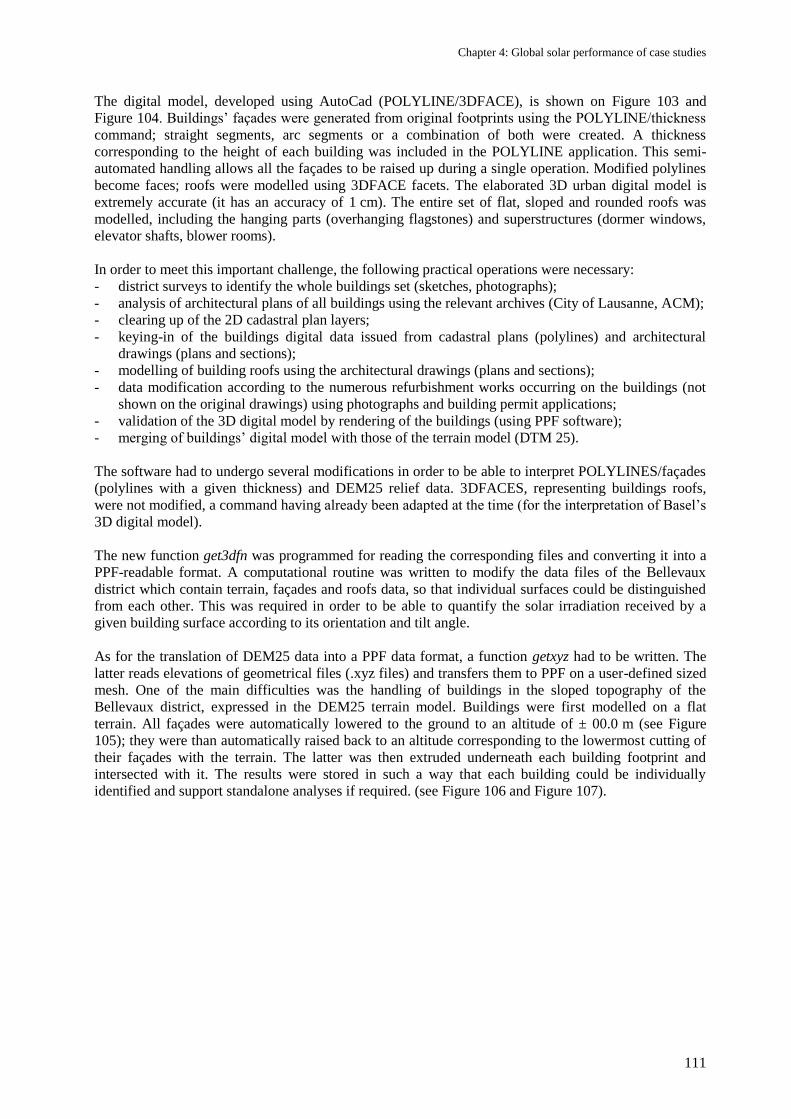
Chapter 4: Global solar performance of case studies
111
The digital model, developed using AutoCad (POLYLINE/3DFACE), is shown on Figure 103 and
Figure 104. Buildings‘ façades were generated from original footprints using the POLYLINE/thickness
command; straight segments, arc segments or a combination of both were created. A thickness
corresponding to the height of each building was included in the POLYLINE application. This semi-
automated handling allows all the façades to be raised up during a single operation. Modified polylines
become faces; roofs were modelled using 3DFACE facets. The elaborated 3D urban digital model is
extremely accurate (it has an accuracy of 1 cm). The entire set of flat, sloped and rounded roofs was
modelled, including the hanging parts (overhanging flagstones) and superstructures (dormer windows,
elevator shafts, blower rooms).
In order to meet this important challenge, the following practical operations were necessary:
- district surveys to identify the whole buildings set (sketches, photographs);
- analysis of architectural plans of all buildings using the relevant archives (City of Lausanne, ACM);
- clearing up of the 2D cadastral plan layers;
- keying-in of the buildings digital data issued from cadastral plans (polylines) and architectural
drawings (plans and sections);
- modelling of building roofs using the architectural drawings (plans and sections);
- data modification according to the numerous refurbishment works occurring on the buildings (not
shown on the original drawings) using photographs and building permit applications;
- validation of the 3D digital model by rendering of the buildings (using PPF software);
- merging of buildings‘ digital model with those of the terrain model (DTM 25).
The software had to undergo several modifications in order to be able to interpret POLYLINES/façades
(polylines with a given thickness) and DEM25 relief data. 3DFACES, representing buildings roofs,
were not modified, a command having already been adapted at the time (for the interpretation of Basel‘s
3D digital model).
The new function get3dfn was programmed for reading the corresponding files and converting it into a
PPF-readable format. A computational routine was written to modify the data files of the Bellevaux
district which contain terrain, façades and roofs data, so that individual surfaces could be distinguished
from each other. This was required in order to be able to quantify the solar irradiation received by a
given building surface according to its orientation and tilt angle.
As for the translation of DEM25 data into a PPF data format, a function getxyz had to be written. The
latter reads elevations of geometrical files (.xyz files) and transfers them to PPF on a user-defined sized
mesh. One of the main difficulties was the handling of buildings in the sloped topography of the
Bellevaux district, expressed in the DEM25 terrain model. Buildings were first modelled on a flat
terrain. All façades were automatically lowered to the ground to an altitude of ± 00.0 m (see Figure
105); they were than automatically raised back to an altitude corresponding to the lowermost cutting of
their façades with the terrain. The latter was then extruded underneath each building footprint and
intersected with it. The results were stored in such a way that each building could be individually
identified and support standalone analyses if required. (see Figure 106 and Figure 107).
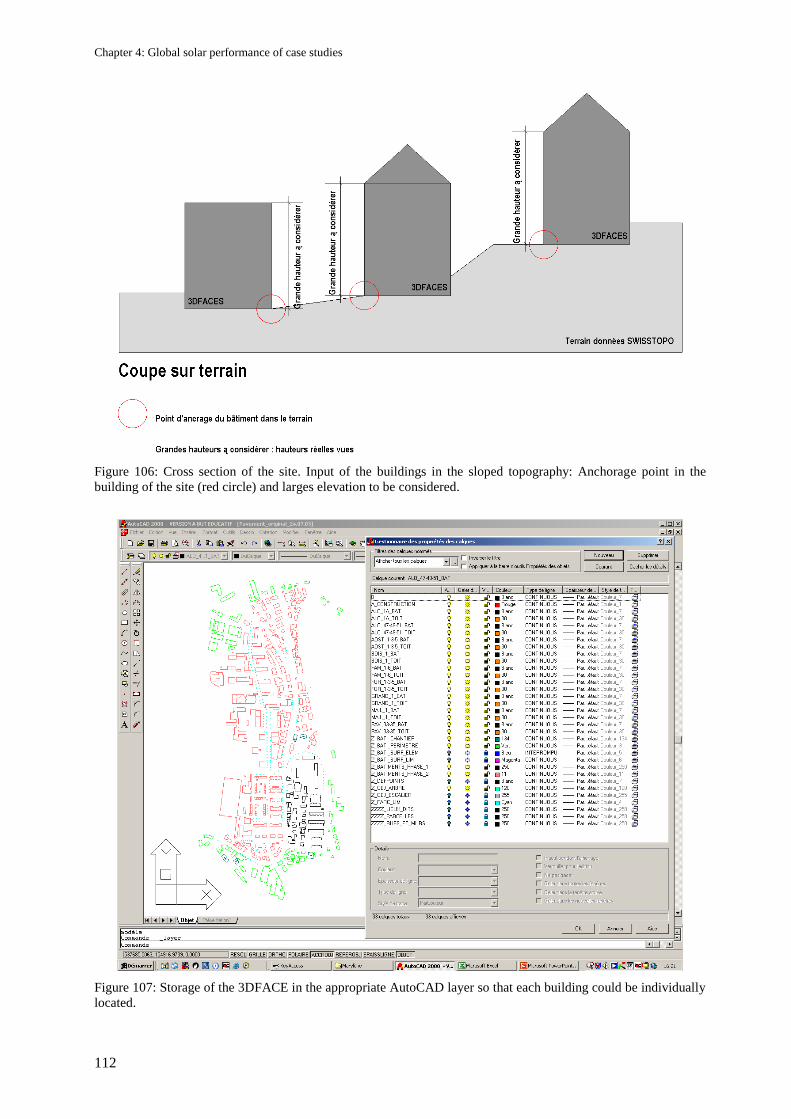
Chapter 4: Global solar performance of case studies
112
Figure 106: Cross section of the site. Input of the buildings in the sloped topography: Anchorage point in the
building of the site (red circle) and larges elevation to be considered.
Figure 107: Storage of the 3DFACE in the appropriate AutoCAD layer so that each building could be individually
located.
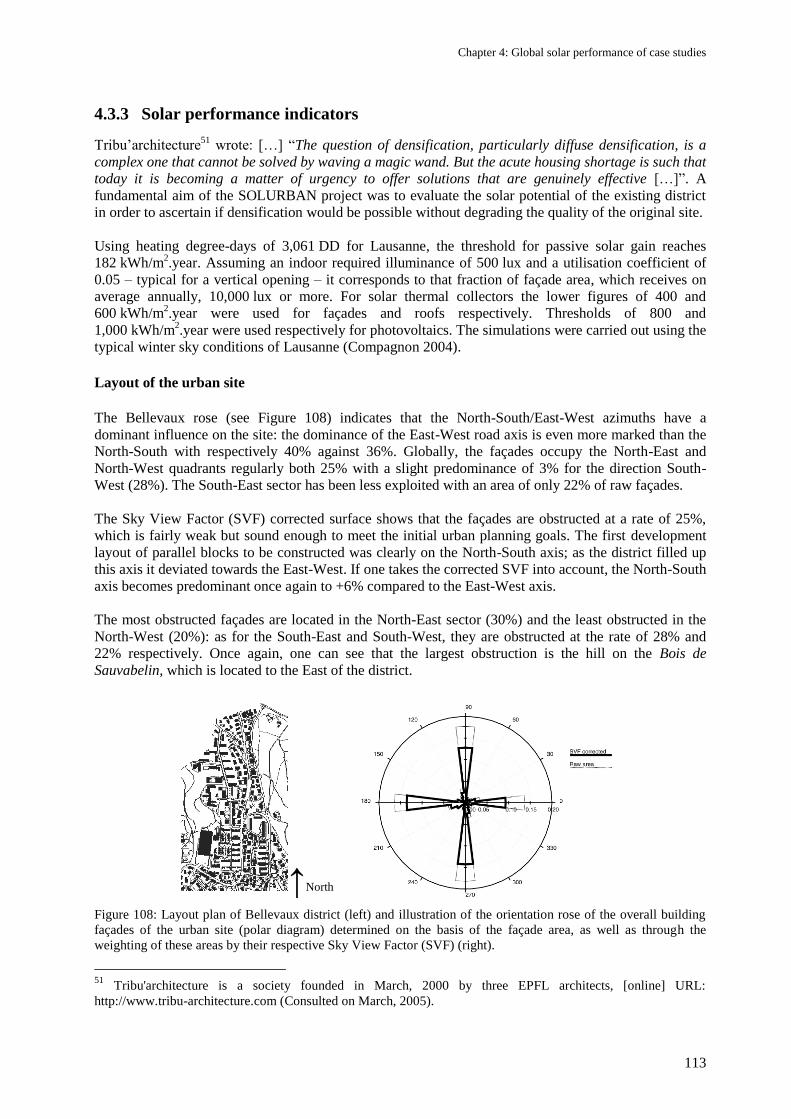
Chapter 4: Global solar performance of case studies
113
4.3.3 Solar performance indicators
Tribu‘architecture51
wrote: […] ―The question of densification, particularly diffuse densification, is a
complex one that cannot be solved by waving a magic wand. But the acute housing shortage is such that
today it is becoming a matter of urgency to offer solutions that are genuinely effective […]‖. A
fundamental aim of the SOLURBAN project was to evaluate the solar potential of the existing district
in order to ascertain if densification would be possible without degrading the quality of the original site.
Using heating degree-days of 3,061 DD for Lausanne, the threshold for passive solar gain reaches
182 kWh/m2.year. Assuming an indoor required illuminance of 500 lux and a utilisation coefficient of
0.05 – typical for a vertical opening – it corresponds to that fraction of façade area, which receives on
average annually, 10,000 lux or more. For solar thermal collectors the lower figures of 400 and
600 kWh/m2.year were used for façades and roofs respectively. Thresholds of 800 and
1,000 kWh/m2.year were used respectively for photovoltaics. The simulations were carried out using the
typical winter sky conditions of Lausanne (Compagnon 2004).
Layout of the urban site
The Bellevaux rose (see Figure 108) indicates that the North-South/East-West azimuths have a
dominant influence on the site: the dominance of the East-West road axis is even more marked than the
North-South with respectively 40% against 36%. Globally, the façades occupy the North-East and
North-West quadrants regularly both 25% with a slight predominance of 3% for the direction South-
West (28%). The South-East sector has been less exploited with an area of only 22% of raw façades.
The Sky View Factor (SVF) corrected surface shows that the façades are obstructed at a rate of 25%,
which is fairly weak but sound enough to meet the initial urban planning goals. The first development
layout of parallel blocks to be constructed was clearly on the North-South axis; as the district filled up
this axis it deviated towards the East-West. If one takes the corrected SVF into account, the North-South
axis becomes predominant once again to +6% compared to the East-West axis.
The most obstructed façades are located in the North-East sector (30%) and the least obstructed in the
North-West (20%): as for the South-East and South-West, they are obstructed at the rate of 28% and
22% respectively. Once again, one can see that the largest obstruction is the hill on the Bois de
Sauvabelin, which is located to the East of the district.
↑North
Figure 108: Layout plan of Bellevaux district (left) and illustration of the orientation rose of the overall building
façades of the urban site (polar diagram) determined on the basis of the façade area, as well as through the
weighting of these areas by their respective Sky View Factor (SVF) (right).
51
Tribu'architecture is a society founded in March, 2000 by three EPFL architects, [online] URL:
http://www.tribu-architecture.com (Consulted on March, 2005).
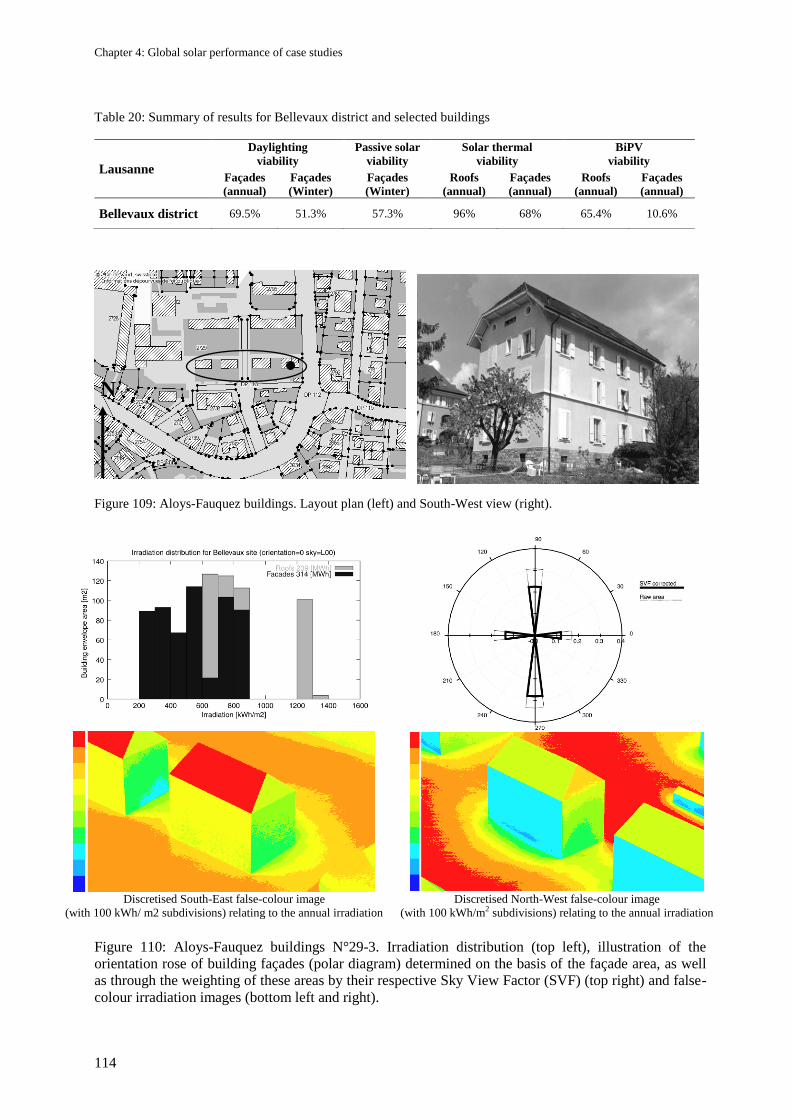
Chapter 4: Global solar performance of case studies
114
Table 20: Summary of results for Bellevaux district and selected buildings
Figure 109: Aloys-Fauquez buildings. Layout plan (left) and South-West view (right).
Discretised South-East false-colour image
(with 100 kWh/ m2 subdivisions) relating to the annual irradiation
Discretised North-West false-colour image
(with 100 kWh/m2 subdivisions) relating to the annual irradiation
Figure 110: Aloys-Fauquez buildings N°29-3. Irradiation distribution (top left), illustration of the
orientation rose of building façades (polar diagram) determined on the basis of the façade area, as well
as through the weighting of these areas by their respective Sky View Factor (SVF) (top right) and false-
colour irradiation images (bottom left and right).
Lausanne
Daylighting
viability
Passive solar
viability
Solar thermal
viability
BiPV
viability
Façades
(annual)
Façades
(Winter)
Façades
(Winter)
Roofs
(annual)
Façades
(annual)
Roofs
(annual)
Façades
(annual)
Bellevaux district 69.5% 51.3% 57.3% 96% 68% 65.4% 10.6%
N
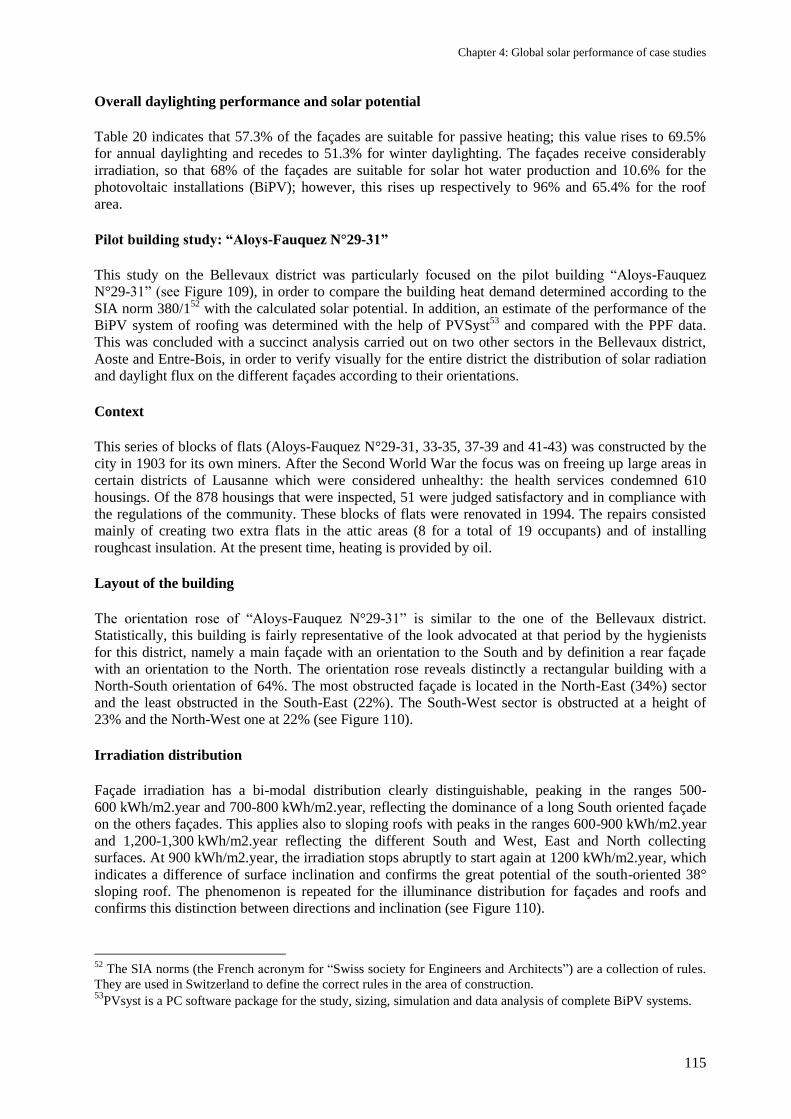
Chapter 4: Global solar performance of case studies
115
Overall daylighting performance and solar potential
Table 20 indicates that 57.3% of the façades are suitable for passive heating; this value rises to 69.5%
for annual daylighting and recedes to 51.3% for winter daylighting. The façades receive considerably
irradiation, so that 68% of the façades are suitable for solar hot water production and 10.6% for the
photovoltaic installations (BiPV); however, this rises up respectively to 96% and 65.4% for the roof
area.
Pilot building study: “Aloys-Fauquez N°29-31”
This study on the Bellevaux district was particularly focused on the pilot building ―Aloys-Fauquez
N°29-31‖ (see Figure 109), in order to compare the building heat demand determined according to the
SIA norm 380/152
with the calculated solar potential. In addition, an estimate of the performance of the
BiPV system of roofing was determined with the help of PVSyst53
and compared with the PPF data.
This was concluded with a succinct analysis carried out on two other sectors in the Bellevaux district,
Aoste and Entre-Bois, in order to verify visually for the entire district the distribution of solar radiation
and daylight flux on the different façades according to their orientations.
Context
This series of blocks of flats (Aloys-Fauquez N°29-31, 33-35, 37-39 and 41-43) was constructed by the
city in 1903 for its own miners. After the Second World War the focus was on freeing up large areas in
certain districts of Lausanne which were considered unhealthy: the health services condemned 610
housings. Of the 878 housings that were inspected, 51 were judged satisfactory and in compliance with
the regulations of the community. These blocks of flats were renovated in 1994. The repairs consisted
mainly of creating two extra flats in the attic areas (8 for a total of 19 occupants) and of installing
roughcast insulation. At the present time, heating is provided by oil.
Layout of the building
The orientation rose of ―Aloys-Fauquez N°29-31‖ is similar to the one of the Bellevaux district.
Statistically, this building is fairly representative of the look advocated at that period by the hygienists
for this district, namely a main façade with an orientation to the South and by definition a rear façade
with an orientation to the North. The orientation rose reveals distinctly a rectangular building with a
North-South orientation of 64%. The most obstructed façade is located in the North-East (34%) sector
and the least obstructed in the South-East (22%). The South-West sector is obstructed at a height of
23% and the North-West one at 22% (see Figure 110).
Irradiation distribution
Façade irradiation has a bi-modal distribution clearly distinguishable, peaking in the ranges 500-
600 kWh/m2.year and 700-800 kWh/m2.year, reflecting the dominance of a long South oriented façade
on the others façades. This applies also to sloping roofs with peaks in the ranges 600-900 kWh/m2.year
and 1,200-1,300 kWh/m2.year reflecting the different South and West, East and North collecting
surfaces. At 900 kWh/m2.year, the irradiation stops abruptly to start again at 1200 kWh/m2.year, which
indicates a difference of surface inclination and confirms the great potential of the south-oriented 38°
sloping roof. The phenomenon is repeated for the illuminance distribution for façades and roofs and
confirms this distinction between directions and inclination (see Figure 110).
52
The SIA norms (the French acronym for ―Swiss society for Engineers and Architects‖) are a collection of rules.
They are used in Switzerland to define the correct rules in the area of construction. 53
PVsyst is a PC software package for the study, sizing, simulation and data analysis of complete BiPV systems.
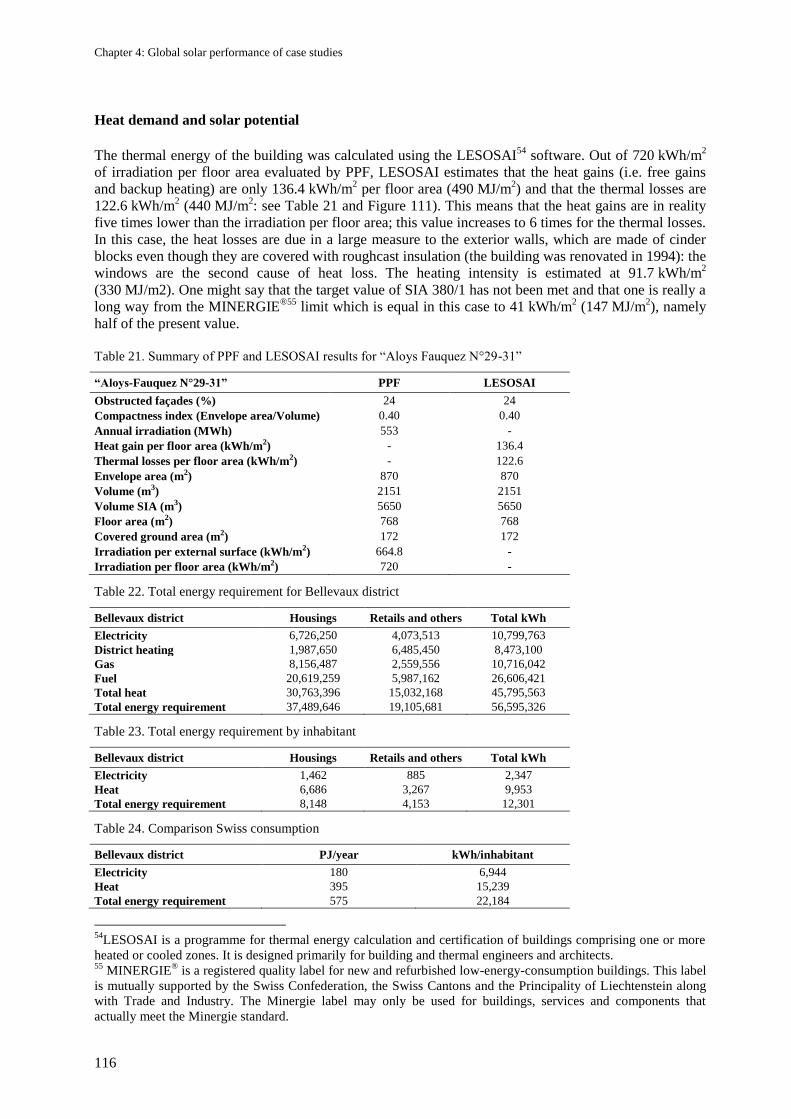
Chapter 4: Global solar performance of case studies
116
Heat demand and solar potential
The thermal energy of the building was calculated using the LESOSAI54
software. Out of 720 kWh/m2
of irradiation per floor area evaluated by PPF, LESOSAI estimates that the heat gains (i.e. free gains
and backup heating) are only 136.4 kWh/m2 per floor area (490 MJ/m
2) and that the thermal losses are
122.6 kWh/m2 (440 MJ/m
2: see Table 21 and Figure 111). This means that the heat gains are in reality
five times lower than the irradiation per floor area; this value increases to 6 times for the thermal losses.
In this case, the heat losses are due in a large measure to the exterior walls, which are made of cinder
blocks even though they are covered with roughcast insulation (the building was renovated in 1994): the
windows are the second cause of heat loss. The heating intensity is estimated at 91.7 kWh/m2
(330 MJ/m2). One might say that the target value of SIA 380/1 has not been met and that one is really a
long way from the MINERGIE®55
limit which is equal in this case to 41 kWh/m2 (147 MJ/m
2), namely
half of the present value.
Table 21. Summary of PPF and LESOSAI results for ―Aloys Fauquez N°29-31‖
“Aloys-Fauquez N°29-31” PPF LESOSAI
Obstructed façades (%) 24 24
Compactness index (Envelope area/Volume) 0.40 0.40
Annual irradiation (MWh) 553 -
Heat gain per floor area (kWh/m2) - 136.4
Thermal losses per floor area (kWh/m2) - 122.6
Envelope area (m2) 870 870
Volume (m3) 2151 2151
Volume SIA (m3) 5650 5650
Floor area (m2) 768 768
Covered ground area (m2) 172 172
Irradiation per external surface (kWh/m2) 664.8 -
Irradiation per floor area (kWh/m2) 720 -
Table 22. Total energy requirement for Bellevaux district
Bellevaux district Housings Retails and others Total kWh
Electricity 6,726,250 4,073,513 10,799,763
District heating 1,987,650 6,485,450 8,473,100
Gas 8,156,487 2,559,556 10,716,042
Fuel 20,619,259 5,987,162 26,606,421
Total heat 30,763,396 15,032,168 45,795,563
Total energy requirement 37,489,646 19,105,681 56,595,326
Table 23. Total energy requirement by inhabitant
Bellevaux district Housings Retails and others Total kWh
Electricity 1,462 885 2,347
Heat 6,686 3,267 9,953
Total energy requirement 8,148 4,153 12,301
Table 24. Comparison Swiss consumption
Bellevaux district PJ/year kWh/inhabitant
Electricity 180 6,944
Heat 395 15,239
Total energy requirement 575 22,184
54
LESOSAI is a programme for thermal energy calculation and certification of buildings comprising one or more
heated or cooled zones. It is designed primarily for building and thermal engineers and architects. 55
MINERGIE® is a registered quality label for new and refurbished low-energy-consumption buildings. This label
is mutually supported by the Swiss Confederation, the Swiss Cantons and the Principality of Liechtenstein along
with Trade and Industry. The Minergie label may only be used for buildings, services and components that
actually meet the Minergie standard.
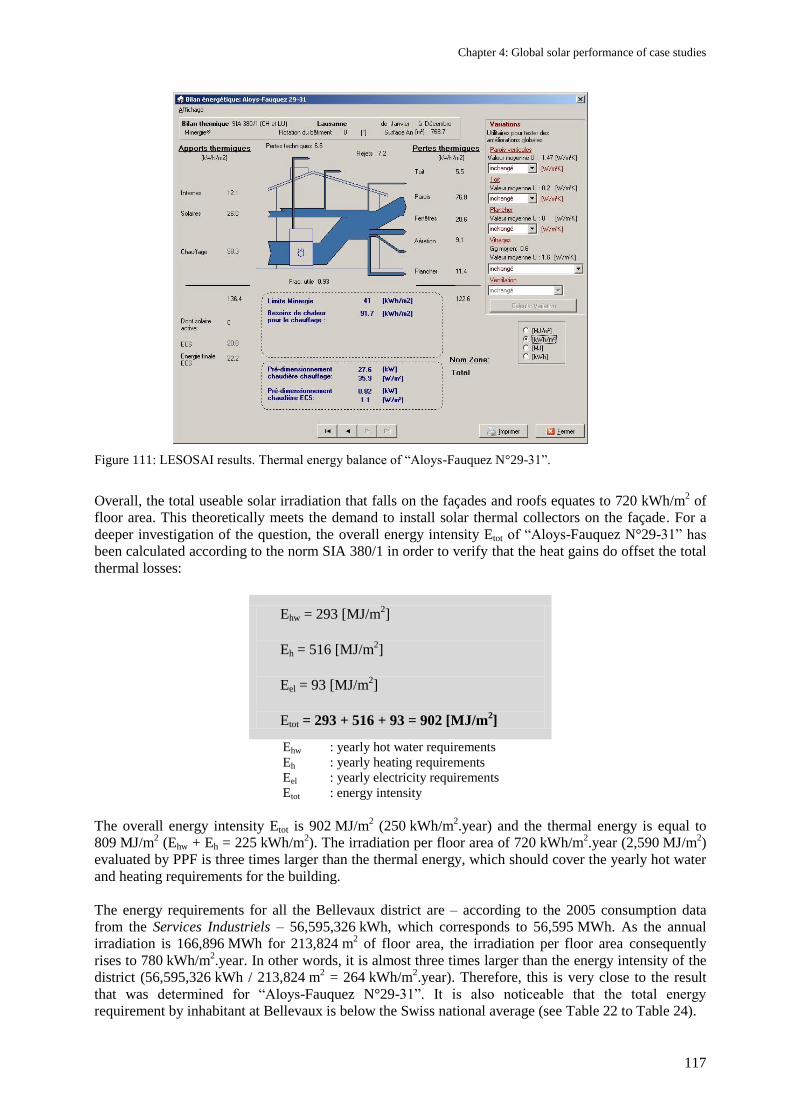
Chapter 4: Global solar performance of case studies
117
Figure 111: LESOSAI results. Thermal energy balance of ―Aloys-Fauquez N°29-31‖.
Overall, the total useable solar irradiation that falls on the façades and roofs equates to 720 kWh/m2 of
floor area. This theoretically meets the demand to install solar thermal collectors on the façade. For a
deeper investigation of the question, the overall energy intensity Etot of ―Aloys-Fauquez N°29-31‖ has
been calculated according to the norm SIA 380/1 in order to verify that the heat gains do offset the total
thermal losses:
Ehw = 293 [MJ/m2]
Eh = 516 [MJ/m2]
Eel = 93 [MJ/m2]
Etot = 293 + 516 + 93 = 902 [MJ/m2]
Ehw : yearly hot water requirements
Eh : yearly heating requirements
Eel : yearly electricity requirements
Etot : energy intensity
The overall energy intensity Etot is 902 MJ/m2 (250 kWh/m
2.year) and the thermal energy is equal to
809 MJ/m2 (Ehw + Eh = 225 kWh/m
2). The irradiation per floor area of 720 kWh/m
2.year (2,590 MJ/m
2)
evaluated by PPF is three times larger than the thermal energy, which should cover the yearly hot water
and heating requirements for the building.
The energy requirements for all the Bellevaux district are – according to the 2005 consumption data
from the Services Industriels – 56,595,326 kWh, which corresponds to 56,595 MWh. As the annual
irradiation is 166,896 MWh for 213,824 m2 of floor area, the irradiation per floor area consequently
rises to 780 kWh/m2.year. In other words, it is almost three times larger than the energy intensity of the
district (56,595,326 kWh / 213,824 m2 = 264 kWh/m
2.year). Therefore, this is very close to the result
that was determined for ―Aloys-Fauquez N°29-31‖. It is also noticeable that the total energy
requirement by inhabitant at Bellevaux is below the Swiss national average (see Table 22 to Table 24).
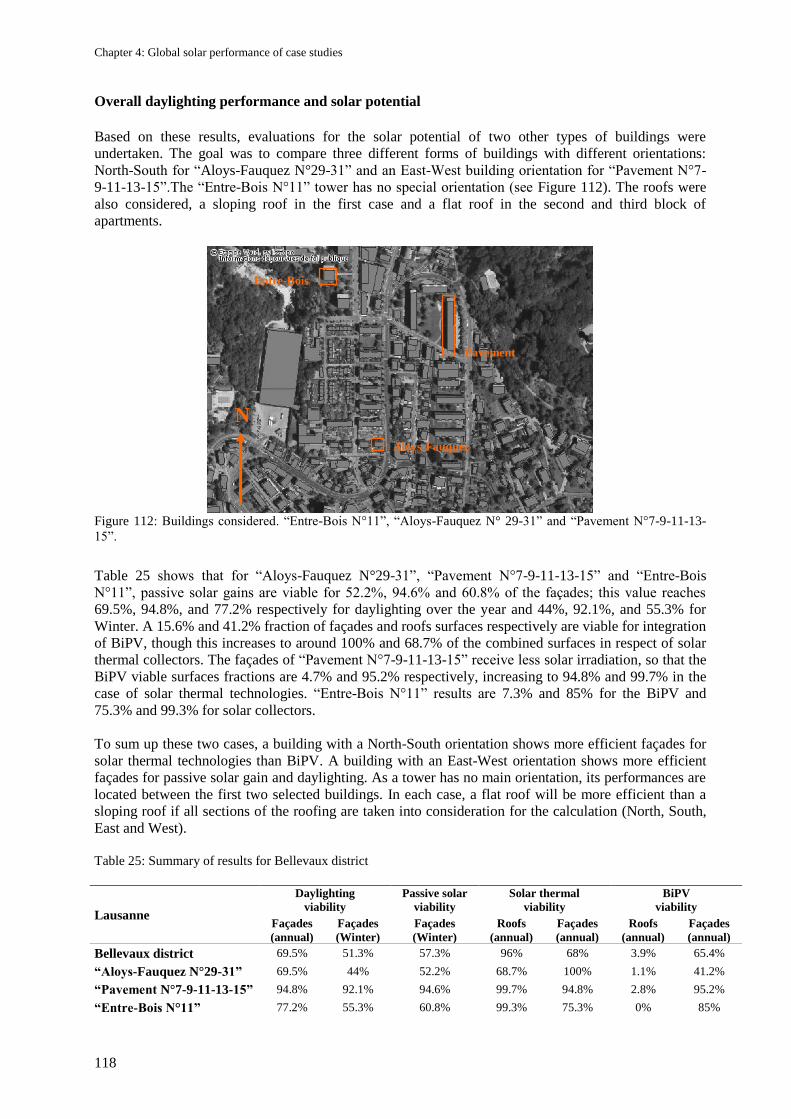
Chapter 4: Global solar performance of case studies
118
Overall daylighting performance and solar potential
Based on these results, evaluations for the solar potential of two other types of buildings were
undertaken. The goal was to compare three different forms of buildings with different orientations:
North-South for ―Aloys-Fauquez N°29-31‖ and an East-West building orientation for ―Pavement N°7-
9-11-13-15‖.The ―Entre-Bois N°11‖ tower has no special orientation (see Figure 112). The roofs were
also considered, a sloping roof in the first case and a flat roof in the second and third block of
apartments.
Figure 112: Buildings considered. ―Entre-Bois N°11‖, ―Aloys-Fauquez N° 29-31‖ and ―Pavement N°7-9-11-13-
15‖.
Table 25 shows that for ―Aloys-Fauquez N°29-31‖, ―Pavement N°7-9-11-13-15‖ and ―Entre-Bois
N°11‖, passive solar gains are viable for 52.2%, 94.6% and 60.8% of the façades; this value reaches
69.5%, 94.8%, and 77.2% respectively for daylighting over the year and 44%, 92.1%, and 55.3% for
Winter. A 15.6% and 41.2% fraction of façades and roofs surfaces respectively are viable for integration
of BiPV, though this increases to around 100% and 68.7% of the combined surfaces in respect of solar
thermal collectors. The façades of ―Pavement N°7-9-11-13-15‖ receive less solar irradiation, so that the
BiPV viable surfaces fractions are 4.7% and 95.2% respectively, increasing to 94.8% and 99.7% in the
case of solar thermal technologies. ―Entre-Bois N°11‖ results are 7.3% and 85% for the BiPV and
75.3% and 99.3% for solar collectors.
To sum up these two cases, a building with a North-South orientation shows more efficient façades for
solar thermal technologies than BiPV. A building with an East-West orientation shows more efficient
façades for passive solar gain and daylighting. As a tower has no main orientation, its performances are
located between the first two selected buildings. In each case, a flat roof will be more efficient than a
sloping roof if all sections of the roofing are taken into consideration for the calculation (North, South,
East and West).
Table 25: Summary of results for Bellevaux district
Lausanne
Daylighting
viability
Passive solar
viability
Solar thermal
viability
BiPV
viability
Façades
(annual)
Façades
(Winter)
Façades
(Winter)
Roofs
(annual)
Façades
(annual)
Roofs
(annual)
Façades
(annual)
Bellevaux district 69.5% 51.3% 57.3% 96% 68% 3.9% 65.4%
“Aloys-Fauquez N°29-31” 69.5% 44% 52.2% 68.7% 100% 1.1% 41.2%
“Pavement N°7-9-11-13-15” 94.8% 92.1% 94.6% 99.7% 94.8% 2.8% 95.2%
“Entre-Bois N°11” 77.2% 55.3% 60.8% 99.3% 75.3% 0% 85%
Aloys-Fauquez
N
Pavement
Entre-Bois
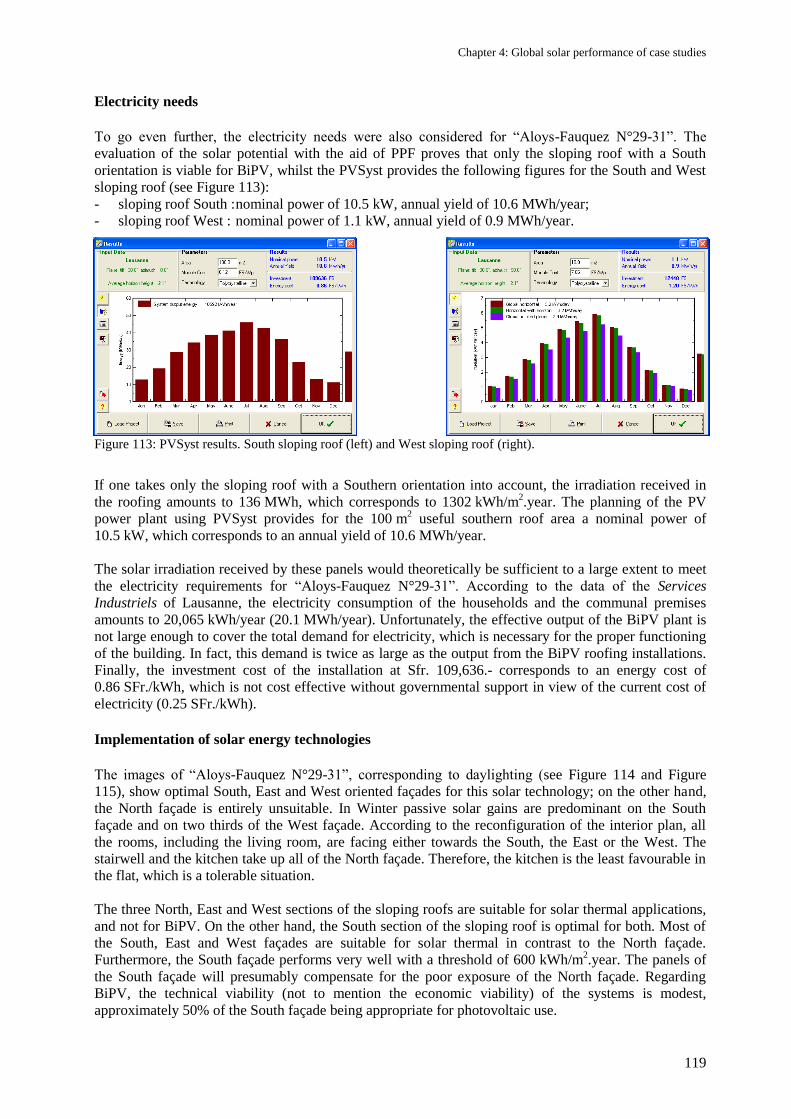
Chapter 4: Global solar performance of case studies
119
Electricity needs
To go even further, the electricity needs were also considered for ―Aloys-Fauquez N°29-31‖. The
evaluation of the solar potential with the aid of PPF proves that only the sloping roof with a South
orientation is viable for BiPV, whilst the PVSyst provides the following figures for the South and West
sloping roof (see Figure 113):
- sloping roof South : nominal power of 10.5 kW, annual yield of 10.6 MWh/year;
- sloping roof West : nominal power of 1.1 kW, annual yield of 0.9 MWh/year.
Figure 113: PVSyst results. South sloping roof (left) and West sloping roof (right).
If one takes only the sloping roof with a Southern orientation into account, the irradiation received in
the roofing amounts to 136 MWh, which corresponds to 1302 kWh/m2.year. The planning of the PV
power plant using PVSyst provides for the 100 m2 useful southern roof area a nominal power of
10.5 kW, which corresponds to an annual yield of 10.6 MWh/year.
The solar irradiation received by these panels would theoretically be sufficient to a large extent to meet
the electricity requirements for ―Aloys-Fauquez N°29-31‖. According to the data of the Services
Industriels of Lausanne, the electricity consumption of the households and the communal premises
amounts to 20,065 kWh/year (20.1 MWh/year). Unfortunately, the effective output of the BiPV plant is
not large enough to cover the total demand for electricity, which is necessary for the proper functioning
of the building. In fact, this demand is twice as large as the output from the BiPV roofing installations.
Finally, the investment cost of the installation at Sfr. 109,636.- corresponds to an energy cost of
0.86 SFr./kWh, which is not cost effective without governmental support in view of the current cost of
electricity (0.25 SFr./kWh).
Implementation of solar energy technologies
The images of ―Aloys-Fauquez N°29-31‖, corresponding to daylighting (see Figure 114 and Figure
115), show optimal South, East and West oriented façades for this solar technology; on the other hand,
the North façade is entirely unsuitable. In Winter passive solar gains are predominant on the South
façade and on two thirds of the West façade. According to the reconfiguration of the interior plan, all
the rooms, including the living room, are facing either towards the South, the East or the West. The
stairwell and the kitchen take up all of the North façade. Therefore, the kitchen is the least favourable in
the flat, which is a tolerable situation.
The three North, East and West sections of the sloping roofs are suitable for solar thermal applications,
and not for BiPV. On the other hand, the South section of the sloping roof is optimal for both. Most of
the South, East and West façades are suitable for solar thermal in contrast to the North façade.
Furthermore, the South façade performs very well with a threshold of 600 kWh/m2.year. The panels of
the South façade will presumably compensate for the poor exposure of the North façade. Regarding
BiPV, the technical viability (not to mention the economic viability) of the systems is modest,
approximately 50% of the South façade being appropriate for photovoltaic use.
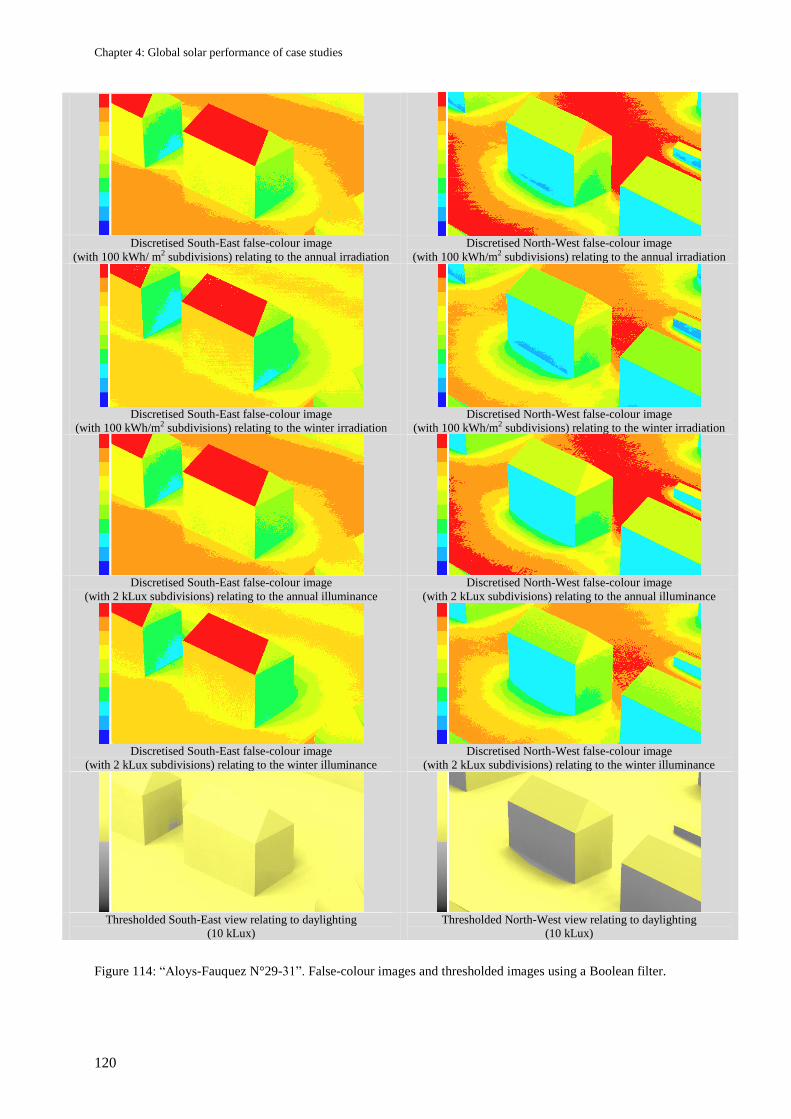
Chapter 4: Global solar performance of case studies
120
Discretised South-East false-colour image
(with 100 kWh/ m2 subdivisions) relating to the annual irradiation
Discretised North-West false-colour image
(with 100 kWh/m2 subdivisions) relating to the annual irradiation
Discretised South-East false-colour image
(with 100 kWh/m2 subdivisions) relating to the winter irradiation
Discretised North-West false-colour image
(with 100 kWh/m2 subdivisions) relating to the winter irradiation
Discretised South-East false-colour image
(with 2 kLux subdivisions) relating to the annual illuminance
Discretised North-West false-colour image
(with 2 kLux subdivisions) relating to the annual illuminance
Discretised South-East false-colour image
(with 2 kLux subdivisions) relating to the winter illuminance
Discretised North-West false-colour image
(with 2 kLux subdivisions) relating to the winter illuminance
Thresholded South-East view relating to daylighting
(10 kLux)
Thresholded North-West view relating to daylighting
(10 kLux)
Figure 114: ―Aloys-Fauquez N°29-31‖. False-colour images and thresholded images using a Boolean filter.
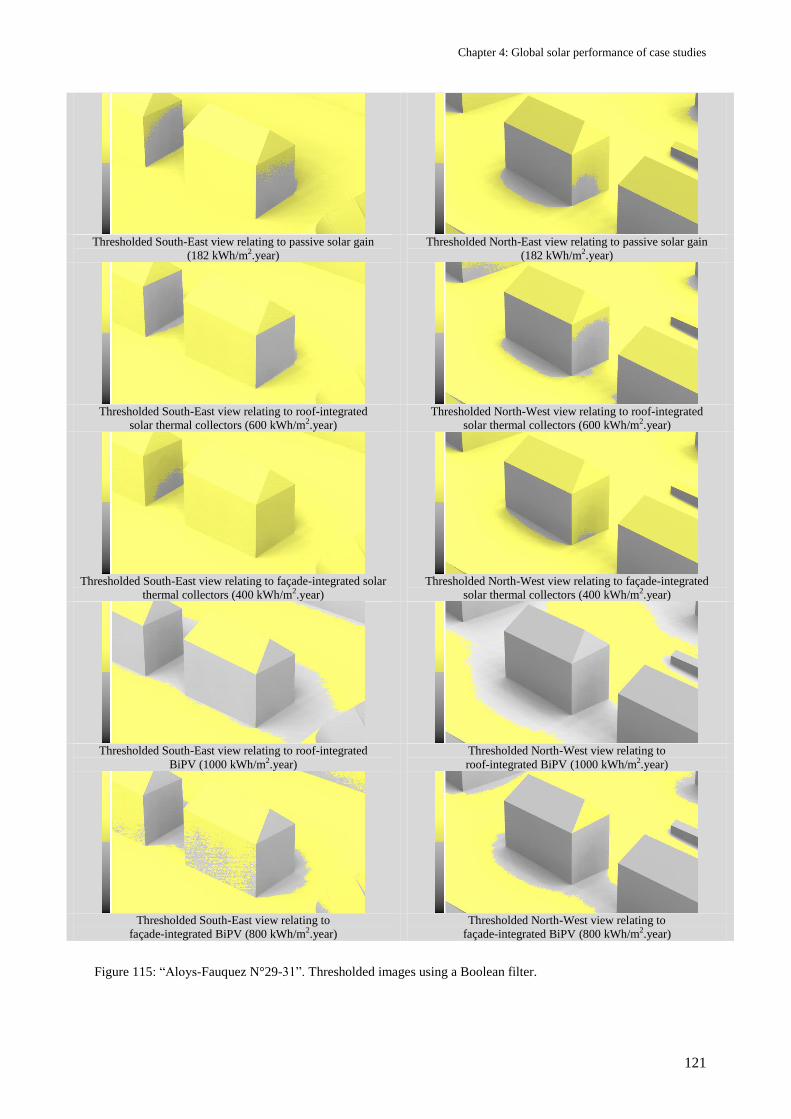
Chapter 4: Global solar performance of case studies
121
Thresholded South-East view relating to passive solar gain
(182 kWh/m2.year)
Thresholded North-East view relating to passive solar gain
(182 kWh/m2.year)
Thresholded South-East view relating to roof-integrated
solar thermal collectors (600 kWh/m2.year)
Thresholded North-West view relating to roof-integrated
solar thermal collectors (600 kWh/m2.year)
Thresholded South-East view relating to façade-integrated solar
thermal collectors (400 kWh/m2.year)
Thresholded North-West view relating to façade-integrated
solar thermal collectors (400 kWh/m2.year)
Thresholded South-East view relating to roof-integrated
BiPV (1000 kWh/m2.year)
Thresholded North-West view relating to
roof-integrated BiPV (1000 kWh/m2.year)
Thresholded South-East view relating to
façade-integrated BiPV (800 kWh/m2.year)
Thresholded North-West view relating to
façade-integrated BiPV (800 kWh/m2.year)
Figure 115: ―Aloys-Fauquez N°29-31‖. Thresholded images using a Boolean filter.
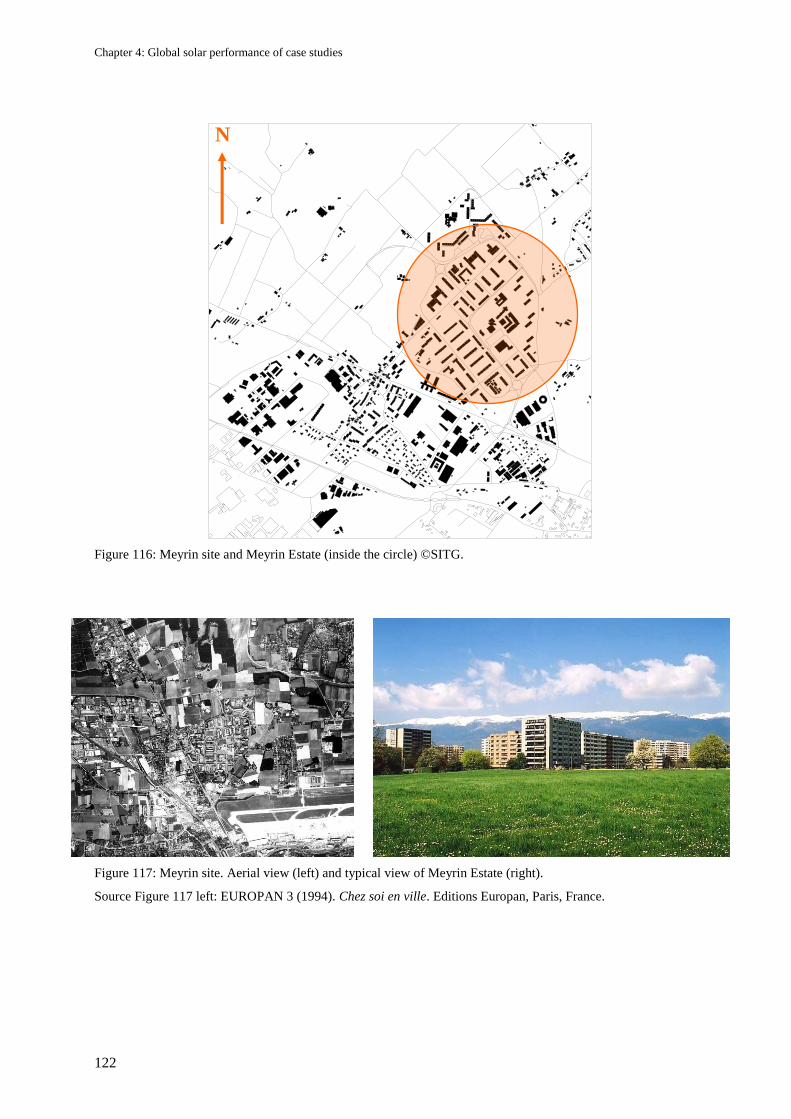
Chapter 4: Global solar performance of case studies
122
Figure 116: Meyrin site and Meyrin Estate (inside the circle) ©SITG.
Figure 117: Meyrin site. Aerial view (left) and typical view of Meyrin Estate (right).
Source Figure 117 left: EUROPAN 3 (1994). Chez soi en ville. Editions Europan, Paris, France.
N
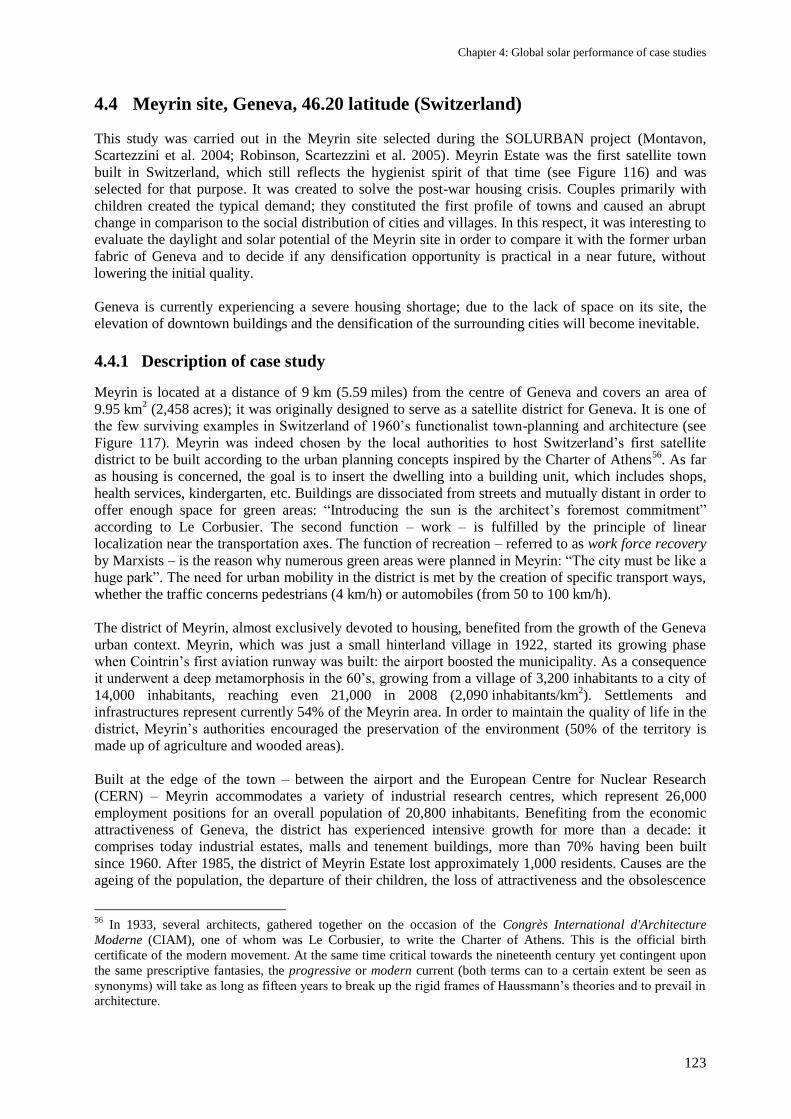
Chapter 4: Global solar performance of case studies
123
4.4 Meyrin site, Geneva, 46.20 latitude (Switzerland)
This study was carried out in the Meyrin site selected during the SOLURBAN project (Montavon,
Scartezzini et al. 2004; Robinson, Scartezzini et al. 2005). Meyrin Estate was the first satellite town
built in Switzerland, which still reflects the hygienist spirit of that time (see Figure 116) and was
selected for that purpose. It was created to solve the post-war housing crisis. Couples primarily with
children created the typical demand; they constituted the first profile of towns and caused an abrupt
change in comparison to the social distribution of cities and villages. In this respect, it was interesting to
evaluate the daylight and solar potential of the Meyrin site in order to compare it with the former urban
fabric of Geneva and to decide if any densification opportunity is practical in a near future, without
lowering the initial quality.
Geneva is currently experiencing a severe housing shortage; due to the lack of space on its site, the
elevation of downtown buildings and the densification of the surrounding cities will become inevitable.
4.4.1 Description of case study
Meyrin is located at a distance of 9 km (5.59 miles) from the centre of Geneva and covers an area of
9.95 km2 (2,458 acres); it was originally designed to serve as a satellite district for Geneva. It is one of
the few surviving examples in Switzerland of 1960‘s functionalist town-planning and architecture (see
Figure 117). Meyrin was indeed chosen by the local authorities to host Switzerland‘s first satellite
district to be built according to the urban planning concepts inspired by the Charter of Athens56
. As far
as housing is concerned, the goal is to insert the dwelling into a building unit, which includes shops,
health services, kindergarten, etc. Buildings are dissociated from streets and mutually distant in order to
offer enough space for green areas: ―Introducing the sun is the architect‘s foremost commitment‖
according to Le Corbusier. The second function – work – is fulfilled by the principle of linear
localization near the transportation axes. The function of recreation – referred to as work force recovery
by Marxists – is the reason why numerous green areas were planned in Meyrin: ―The city must be like a
huge park‖. The need for urban mobility in the district is met by the creation of specific transport ways,
whether the traffic concerns pedestrians (4 km/h) or automobiles (from 50 to 100 km/h).
The district of Meyrin, almost exclusively devoted to housing, benefited from the growth of the Geneva
urban context. Meyrin, which was just a small hinterland village in 1922, started its growing phase
when Cointrin‘s first aviation runway was built: the airport boosted the municipality. As a consequence
it underwent a deep metamorphosis in the 60‘s, growing from a village of 3,200 inhabitants to a city of
14,000 inhabitants, reaching even 21,000 in 2008 (2,090 inhabitants/km2). Settlements and
infrastructures represent currently 54% of the Meyrin area. In order to maintain the quality of life in the
district, Meyrin‘s authorities encouraged the preservation of the environment (50% of the territory is
made up of agriculture and wooded areas).
Built at the edge of the town – between the airport and the European Centre for Nuclear Research
(CERN) – Meyrin accommodates a variety of industrial research centres, which represent 26,000
employment positions for an overall population of 20,800 inhabitants. Benefiting from the economic
attractiveness of Geneva, the district has experienced intensive growth for more than a decade: it
comprises today industrial estates, malls and tenement buildings, more than 70% having been built
since 1960. After 1985, the district of Meyrin Estate lost approximately 1,000 residents. Causes are the
ageing of the population, the departure of their children, the loss of attractiveness and the obsolescence
56
In 1933, several architects, gathered together on the occasion of the Congrès International d'Architecture
Moderne (CIAM), one of whom was Le Corbusier, to write the Charter of Athens. This is the official birth
certificate of the modern movement. At the same time critical towards the nineteenth century yet contingent upon
the same prescriptive fantasies, the progressive or modern current (both terms can to a certain extent be seen as
synonyms) will take as long as fifteen years to break up the rigid frames of Haussmann‘s theories and to prevail in
architecture.
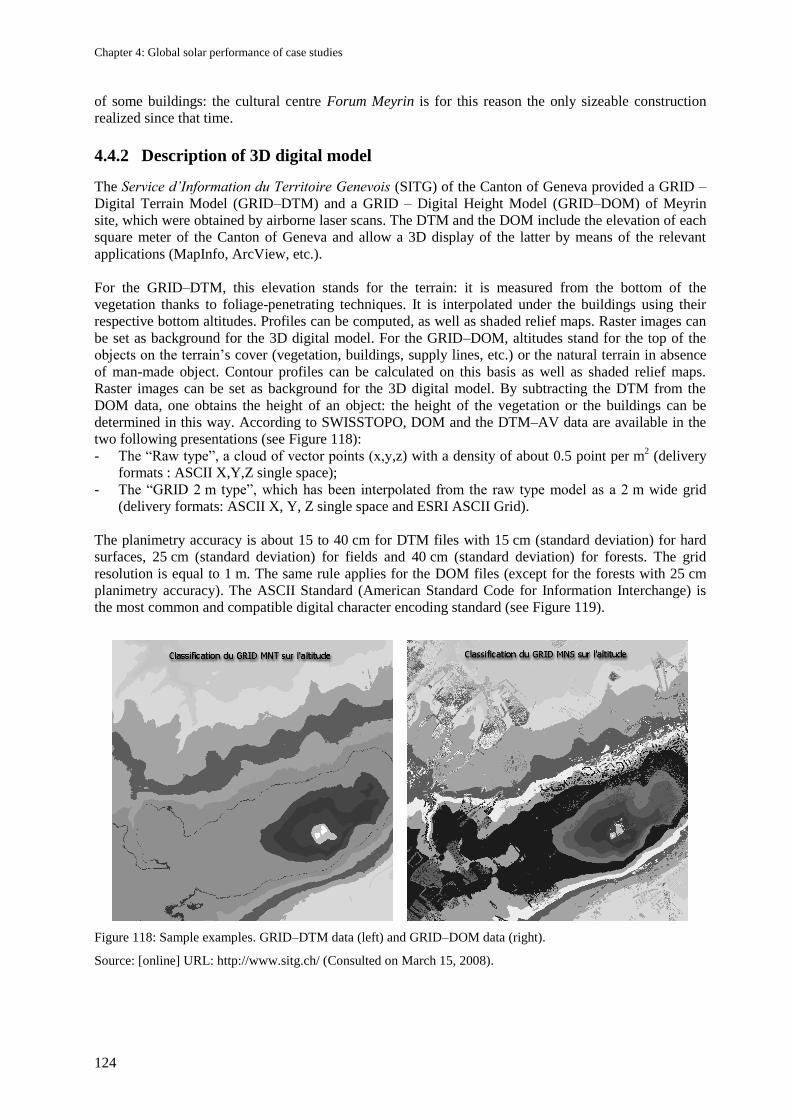
Chapter 4: Global solar performance of case studies
124
of some buildings: the cultural centre Forum Meyrin is for this reason the only sizeable construction
realized since that time.
4.4.2 Description of 3D digital model
The Service d’Information du Territoire Genevois (SITG) of the Canton of Geneva provided a GRID –
Digital Terrain Model (GRID–DTM) and a GRID – Digital Height Model (GRID–DOM) of Meyrin
site, which were obtained by airborne laser scans. The DTM and the DOM include the elevation of each
square meter of the Canton of Geneva and allow a 3D display of the latter by means of the relevant
applications (MapInfo, ArcView, etc.).
For the GRID–DTM, this elevation stands for the terrain: it is measured from the bottom of the
vegetation thanks to foliage-penetrating techniques. It is interpolated under the buildings using their
respective bottom altitudes. Profiles can be computed, as well as shaded relief maps. Raster images can
be set as background for the 3D digital model. For the GRID–DOM, altitudes stand for the top of the
objects on the terrain‘s cover (vegetation, buildings, supply lines, etc.) or the natural terrain in absence
of man-made object. Contour profiles can be calculated on this basis as well as shaded relief maps.
Raster images can be set as background for the 3D digital model. By subtracting the DTM from the
DOM data, one obtains the height of an object: the height of the vegetation or the buildings can be
determined in this way. According to SWISSTOPO, DOM and the DTM–AV data are available in the
two following presentations (see Figure 118):
- The ―Raw type‖, a cloud of vector points (x,y,z) with a density of about 0.5 point per m2 (delivery
formats : ASCII X,Y,Z single space);
- The ―GRID 2 m type‖, which has been interpolated from the raw type model as a 2 m wide grid
(delivery formats: ASCII X, Y, Z single space and ESRI ASCII Grid).
The planimetry accuracy is about 15 to 40 cm for DTM files with 15 cm (standard deviation) for hard
surfaces, 25 cm (standard deviation) for fields and 40 cm (standard deviation) for forests. The grid
resolution is equal to 1 m. The same rule applies for the DOM files (except for the forests with 25 cm
planimetry accuracy). The ASCII Standard (American Standard Code for Information Interchange) is
the most common and compatible digital character encoding standard (see Figure 119).
Figure 118: Sample examples. GRID–DTM data (left) and GRID–DOM data (right).
Source: [online] URL: http://www.sitg.ch/ (Consulted on March 15, 2008).
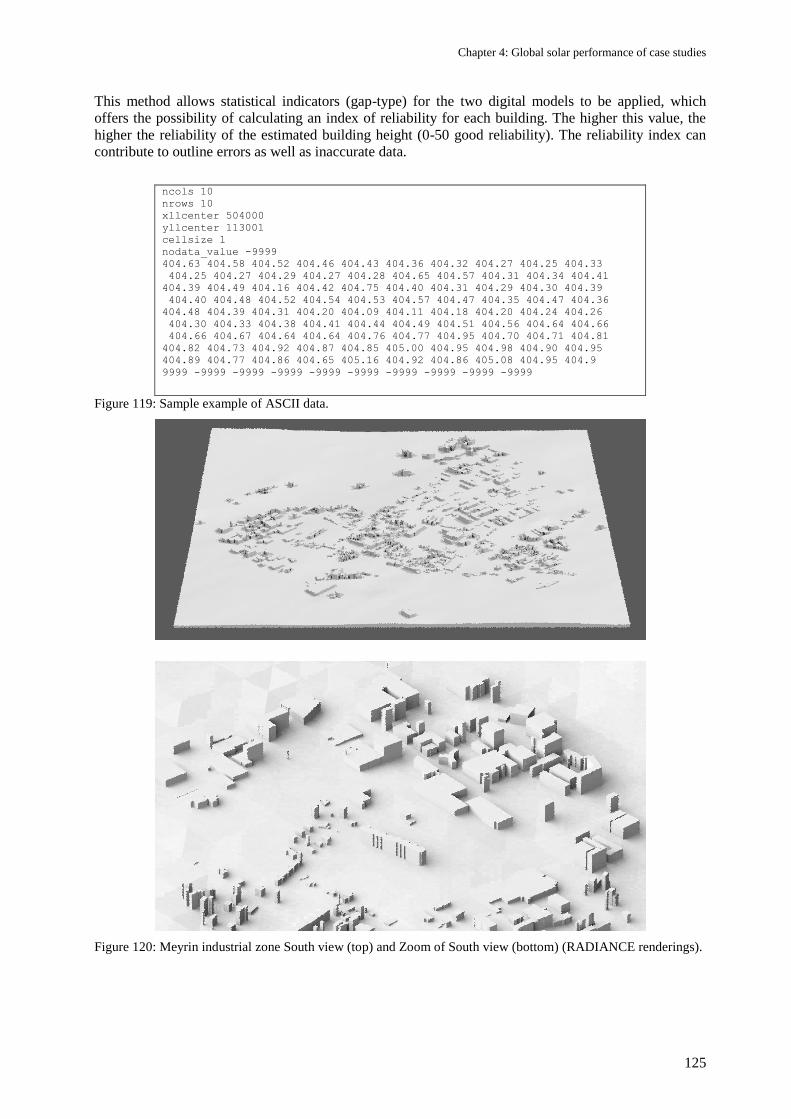
Chapter 4: Global solar performance of case studies
125
This method allows statistical indicators (gap-type) for the two digital models to be applied, which
offers the possibility of calculating an index of reliability for each building. The higher this value, the
higher the reliability of the estimated building height (0-50 good reliability). The reliability index can
contribute to outline errors as well as inaccurate data.
ncols 10
nrows 10
xllcenter 504000
yllcenter 113001
cellsize 1
nodata_value -9999
404.63 404.58 404.52 404.46 404.43 404.36 404.32 404.27 404.25 404.33
404.25 404.27 404.29 404.27 404.28 404.65 404.57 404.31 404.34 404.41
404.39 404.49 404.16 404.42 404.75 404.40 404.31 404.29 404.30 404.39
404.40 404.48 404.52 404.54 404.53 404.57 404.47 404.35 404.47 404.36
404.48 404.39 404.31 404.20 404.09 404.11 404.18 404.20 404.24 404.26
404.30 404.33 404.38 404.41 404.44 404.49 404.51 404.56 404.64 404.66
404.66 404.67 404.64 404.64 404.76 404.77 404.95 404.70 404.71 404.81
404.82 404.73 404.92 404.87 404.85 405.00 404.95 404.98 404.90 404.95
404.89 404.77 404.86 404.65 405.16 404.92 404.86 405.08 404.95 404.9
9999 -9999 -9999 -9999 -9999 -9999 -9999 -9999 -9999 -9999
Figure 119: Sample example of ASCII data.
Figure 120: Meyrin industrial zone South view (top) and Zoom of South view (bottom) (RADIANCE renderings).
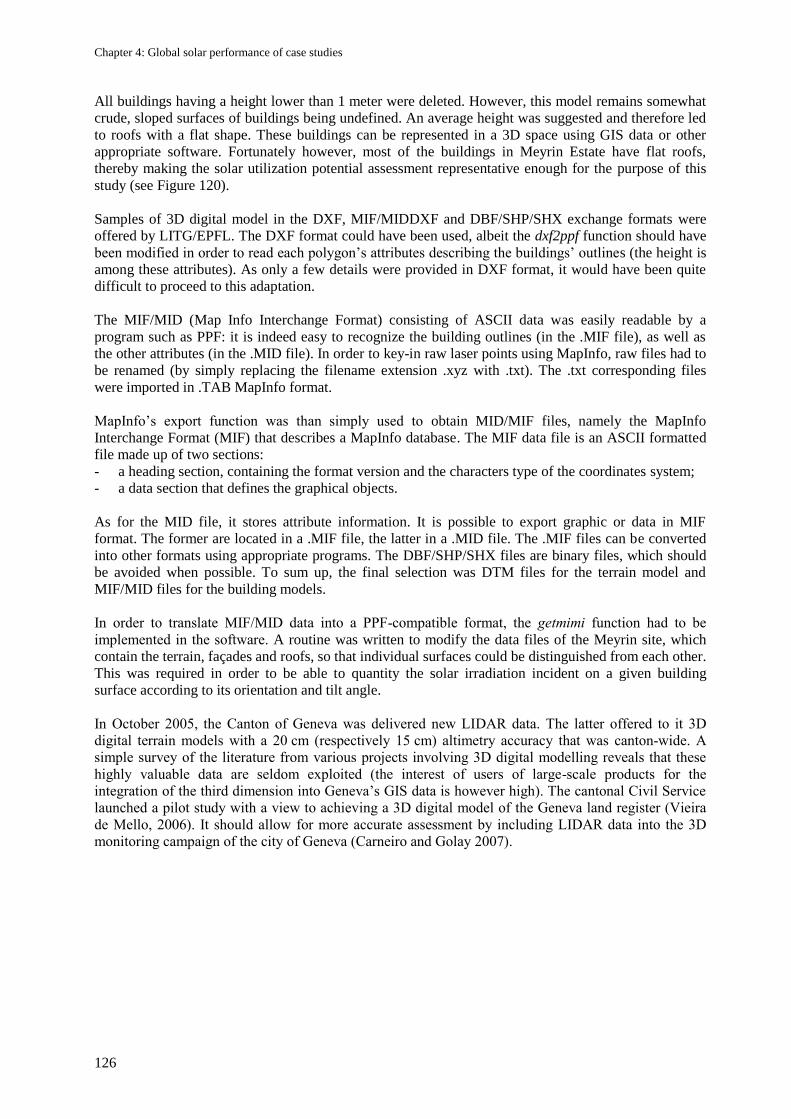
Chapter 4: Global solar performance of case studies
126
All buildings having a height lower than 1 meter were deleted. However, this model remains somewhat
crude, sloped surfaces of buildings being undefined. An average height was suggested and therefore led
to roofs with a flat shape. These buildings can be represented in a 3D space using GIS data or other
appropriate software. Fortunately however, most of the buildings in Meyrin Estate have flat roofs,
thereby making the solar utilization potential assessment representative enough for the purpose of this
study (see Figure 120).
Samples of 3D digital model in the DXF, MIF/MIDDXF and DBF/SHP/SHX exchange formats were
offered by LITG/EPFL. The DXF format could have been used, albeit the dxf2ppf function should have
been modified in order to read each polygon‘s attributes describing the buildings‘ outlines (the height is
among these attributes). As only a few details were provided in DXF format, it would have been quite
difficult to proceed to this adaptation.
The MIF/MID (Map Info Interchange Format) consisting of ASCII data was easily readable by a
program such as PPF: it is indeed easy to recognize the building outlines (in the .MIF file), as well as
the other attributes (in the .MID file). In order to key-in raw laser points using MapInfo, raw files had to
be renamed (by simply replacing the filename extension .xyz with .txt). The .txt corresponding files
were imported in .TAB MapInfo format.
MapInfo‘s export function was than simply used to obtain MID/MIF files, namely the MapInfo
Interchange Format (MIF) that describes a MapInfo database. The MIF data file is an ASCII formatted
file made up of two sections:
- a heading section, containing the format version and the characters type of the coordinates system;
- a data section that defines the graphical objects.
As for the MID file, it stores attribute information. It is possible to export graphic or data in MIF
format. The former are located in a .MIF file, the latter in a .MID file. The .MIF files can be converted
into other formats using appropriate programs. The DBF/SHP/SHX files are binary files, which should
be avoided when possible. To sum up, the final selection was DTM files for the terrain model and
MIF/MID files for the building models.
In order to translate MIF/MID data into a PPF-compatible format, the getmimi function had to be
implemented in the software. A routine was written to modify the data files of the Meyrin site, which
contain the terrain, façades and roofs, so that individual surfaces could be distinguished from each other.
This was required in order to be able to quantity the solar irradiation incident on a given building
surface according to its orientation and tilt angle.
In October 2005, the Canton of Geneva was delivered new LIDAR data. The latter offered to it 3D
digital terrain models with a 20 cm (respectively 15 cm) altimetry accuracy that was canton-wide. A
simple survey of the literature from various projects involving 3D digital modelling reveals that these
highly valuable data are seldom exploited (the interest of users of large-scale products for the
integration of the third dimension into Geneva’s GIS data is however high). The cantonal Civil Service
launched a pilot study with a view to achieving a 3D digital model of the Geneva land register (Vieira
de Mello, 2006). It should allow for more accurate assessment by including LIDAR data into the 3D
monitoring campaign of the city of Geneva (Carneiro and Golay 2007).
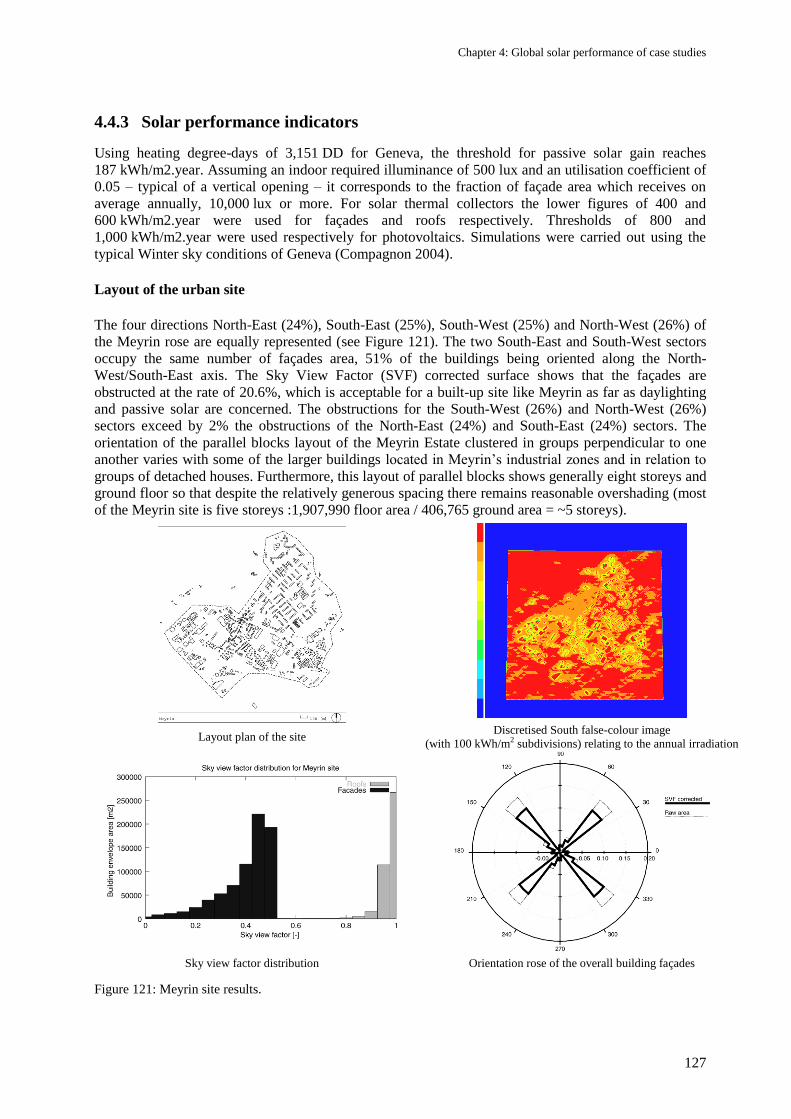
Chapter 4: Global solar performance of case studies
127
4.4.3 Solar performance indicators
Using heating degree-days of 3,151 DD for Geneva, the threshold for passive solar gain reaches
187 kWh/m2.year. Assuming an indoor required illuminance of 500 lux and an utilisation coefficient of
0.05 – typical of a vertical opening – it corresponds to the fraction of façade area which receives on
average annually, 10,000 lux or more. For solar thermal collectors the lower figures of 400 and
600 kWh/m2.year were used for façades and roofs respectively. Thresholds of 800 and
1,000 kWh/m2.year were used respectively for photovoltaics. Simulations were carried out using the
typical Winter sky conditions of Geneva (Compagnon 2004).
Layout of the urban site
The four directions North-East (24%), South-East (25%), South-West (25%) and North-West (26%) of
the Meyrin rose are equally represented (see Figure 121). The two South-East and South-West sectors
occupy the same number of façades area, 51% of the buildings being oriented along the North-
West/South-East axis. The Sky View Factor (SVF) corrected surface shows that the façades are
obstructed at the rate of 20.6%, which is acceptable for a built-up site like Meyrin as far as daylighting
and passive solar are concerned. The obstructions for the South-West (26%) and North-West (26%)
sectors exceed by 2% the obstructions of the North-East (24%) and South-East (24%) sectors. The
orientation of the parallel blocks layout of the Meyrin Estate clustered in groups perpendicular to one
another varies with some of the larger buildings located in Meyrin‘s industrial zones and in relation to
groups of detached houses. Furthermore, this layout of parallel blocks shows generally eight storeys and
ground floor so that despite the relatively generous spacing there remains reasonable overshading (most
of the Meyrin site is five storeys :1,907,990 floor area / 406,765 ground area = ~5 storeys).
Layout plan of the site Discretised South false-colour image
(with 100 kWh/m2 subdivisions) relating to the annual irradiation
Sky view factor distribution Orientation rose of the overall building façades
Figure 121: Meyrin site results.
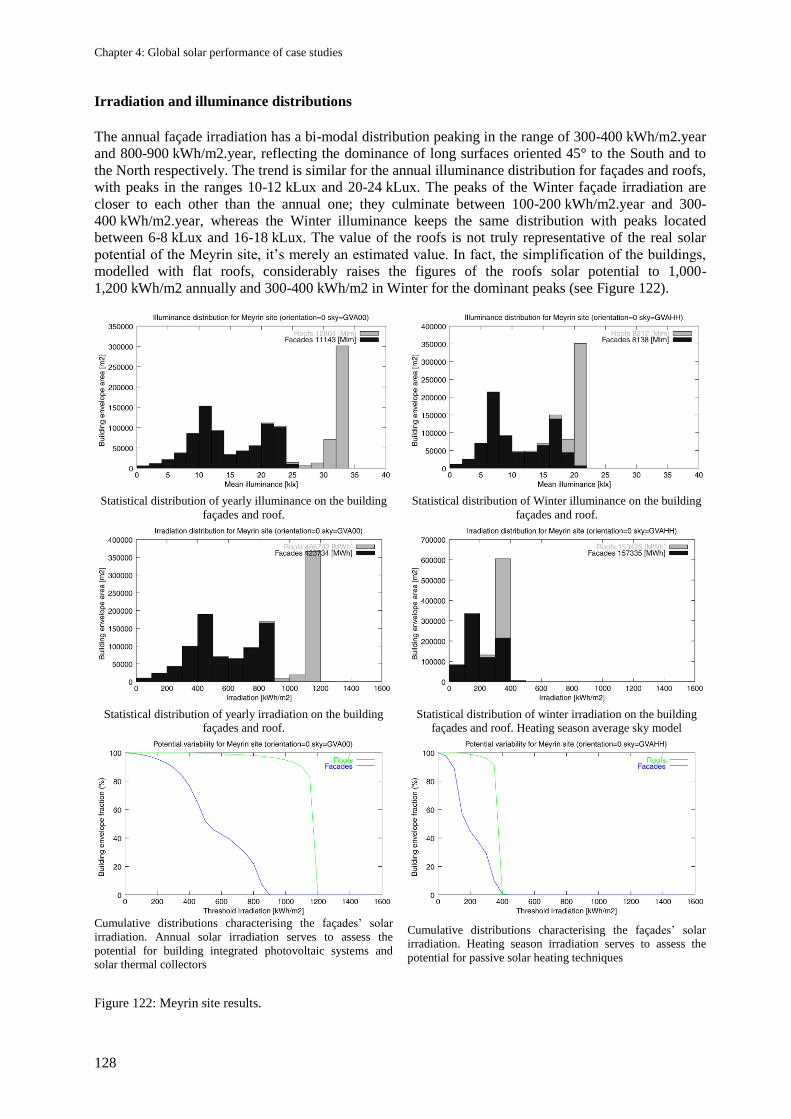
Chapter 4: Global solar performance of case studies
128
Irradiation and illuminance distributions
The annual façade irradiation has a bi-modal distribution peaking in the range of 300-400 kWh/m2.year
and 800-900 kWh/m2.year, reflecting the dominance of long surfaces oriented 45° to the South and to
the North respectively. The trend is similar for the annual illuminance distribution for façades and roofs,
with peaks in the ranges 10-12 kLux and 20-24 kLux. The peaks of the Winter façade irradiation are
closer to each other than the annual one; they culminate between 100-200 kWh/m2.year and 300-
400 kWh/m2.year, whereas the Winter illuminance keeps the same distribution with peaks located
between 6-8 kLux and 16-18 kLux. The value of the roofs is not truly representative of the real solar
potential of the Meyrin site, it‘s merely an estimated value. In fact, the simplification of the buildings,
modelled with flat roofs, considerably raises the figures of the roofs solar potential to 1,000-
1,200 kWh/m2 annually and 300-400 kWh/m2 in Winter for the dominant peaks (see Figure 122).
Statistical distribution of yearly illuminance on the building
façades and roof.
Statistical distribution of Winter illuminance on the building
façades and roof.
Statistical distribution of yearly irradiation on the building
façades and roof.
Statistical distribution of winter irradiation on the building
façades and roof. Heating season average sky model
Cumulative distributions characterising the façades‘ solar
irradiation. Annual solar irradiation serves to assess the
potential for building integrated photovoltaic systems and
solar thermal collectors
Cumulative distributions characterising the façades‘ solar
irradiation. Heating season irradiation serves to assess the
potential for passive solar heating techniques
Figure 122: Meyrin site results.
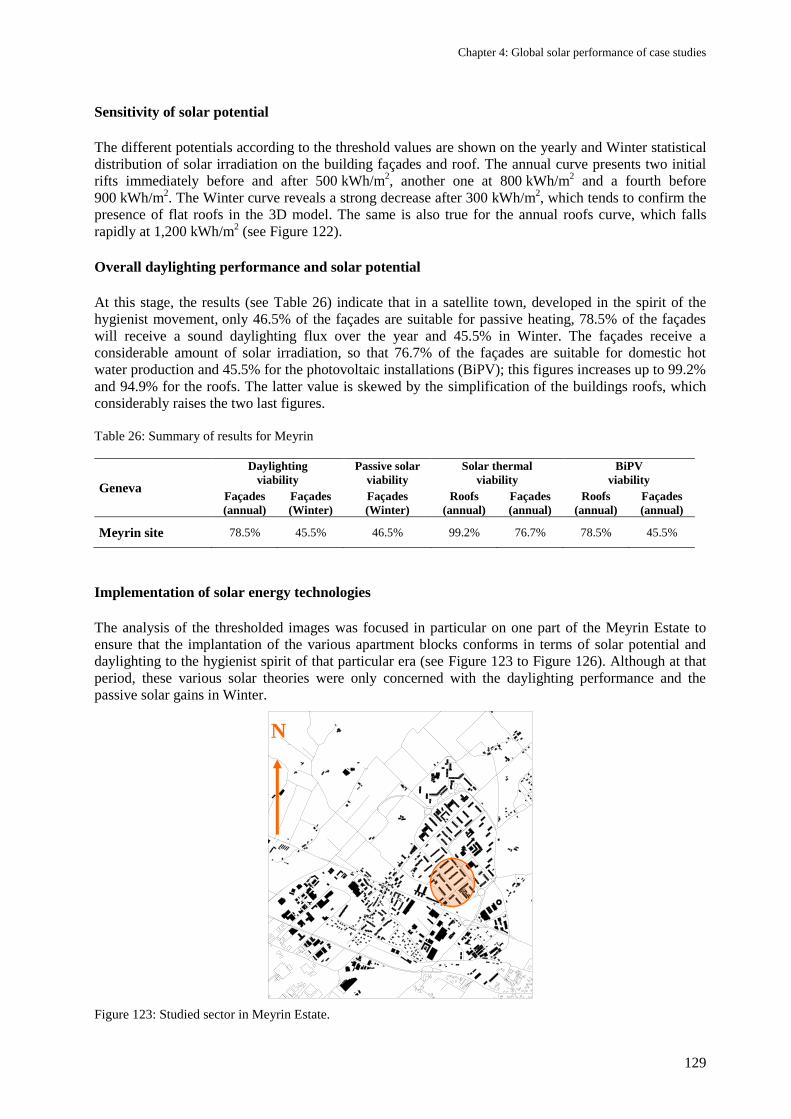
Chapter 4: Global solar performance of case studies
129
Sensitivity of solar potential
The different potentials according to the threshold values are shown on the yearly and Winter statistical
distribution of solar irradiation on the building façades and roof. The annual curve presents two initial
rifts immediately before and after 500 kWh/m2, another one at 800 kWh/m
2 and a fourth before
900 kWh/m2. The Winter curve reveals a strong decrease after 300 kWh/m
2, which tends to confirm the
presence of flat roofs in the 3D model. The same is also true for the annual roofs curve, which falls
rapidly at 1,200 kWh/m2 (see Figure 122).
Overall daylighting performance and solar potential
At this stage, the results (see Table 26) indicate that in a satellite town, developed in the spirit of the
hygienist movement, only 46.5% of the façades are suitable for passive heating, 78.5% of the façades
will receive a sound daylighting flux over the year and 45.5% in Winter. The façades receive a
considerable amount of solar irradiation, so that 76.7% of the façades are suitable for domestic hot
water production and 45.5% for the photovoltaic installations (BiPV); this figures increases up to 99.2%
and 94.9% for the roofs. The latter value is skewed by the simplification of the buildings roofs, which
considerably raises the two last figures.
Table 26: Summary of results for Meyrin
Implementation of solar energy technologies
The analysis of the thresholded images was focused in particular on one part of the Meyrin Estate to
ensure that the implantation of the various apartment blocks conforms in terms of solar potential and
daylighting to the hygienist spirit of that particular era (see Figure 123 to Figure 126). Although at that
period, these various solar theories were only concerned with the daylighting performance and the
passive solar gains in Winter.
Figure 123: Studied sector in Meyrin Estate.
Geneva
Daylighting
viability
Passive solar
viability
Solar thermal
viability
BiPV
viability
Façades
(annual)
Façades
(Winter)
Façades
(Winter)
Roofs
(annual)
Façades
(annual)
Roofs
(annual)
Façades
(annual)
Meyrin site 78.5% 45.5% 46.5% 99.2% 76.7% 78.5% 45.5%
N
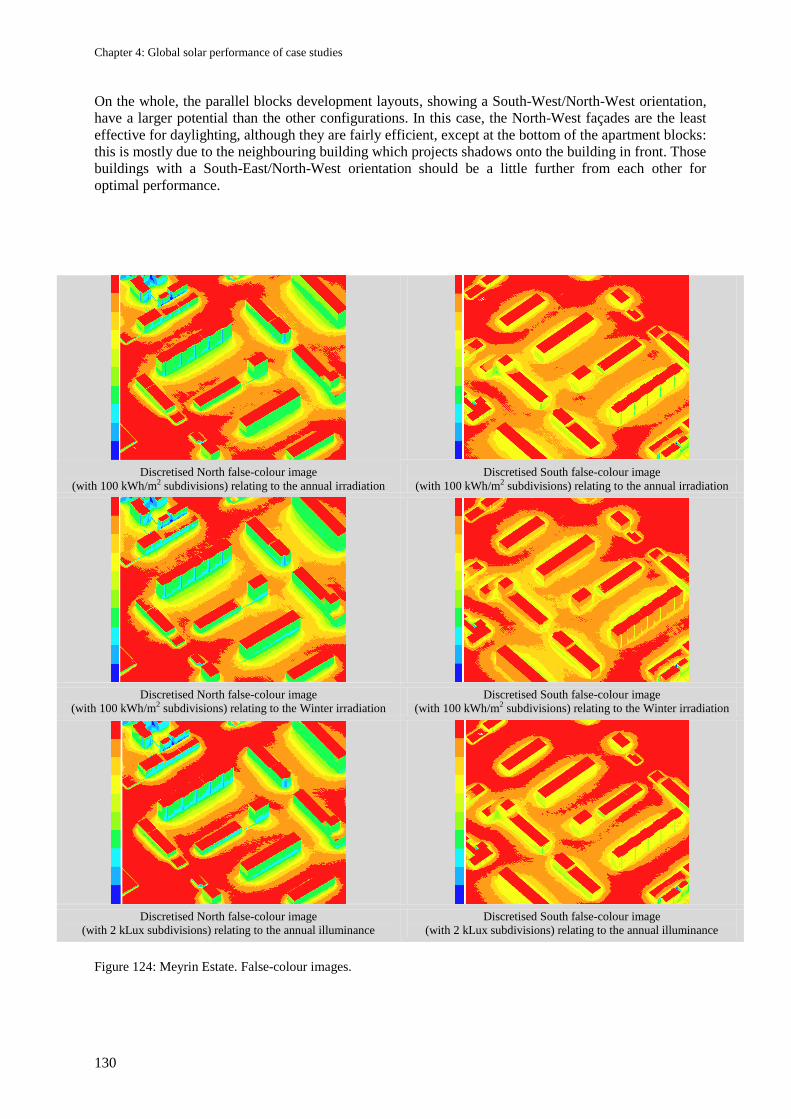
Chapter 4: Global solar performance of case studies
130
On the whole, the parallel blocks development layouts, showing a South-West/North-West orientation,
have a larger potential than the other configurations. In this case, the North-West façades are the least
effective for daylighting, although they are fairly efficient, except at the bottom of the apartment blocks:
this is mostly due to the neighbouring building which projects shadows onto the building in front. Those
buildings with a South-East/North-West orientation should be a little further from each other for
optimal performance.
Figure 124: Meyrin Estate. False-colour images.
Discretised North false-colour image
(with 100 kWh/m2 subdivisions) relating to the annual irradiation
Discretised South false-colour image
(with 100 kWh/m2 subdivisions) relating to the annual irradiation
Discretised North false-colour image
(with 100 kWh/m2 subdivisions) relating to the Winter irradiation
Discretised South false-colour image
(with 100 kWh/m2 subdivisions) relating to the Winter irradiation
Discretised North false-colour image
(with 2 kLux subdivisions) relating to the annual illuminance
Discretised South false-colour image
(with 2 kLux subdivisions) relating to the annual illuminance
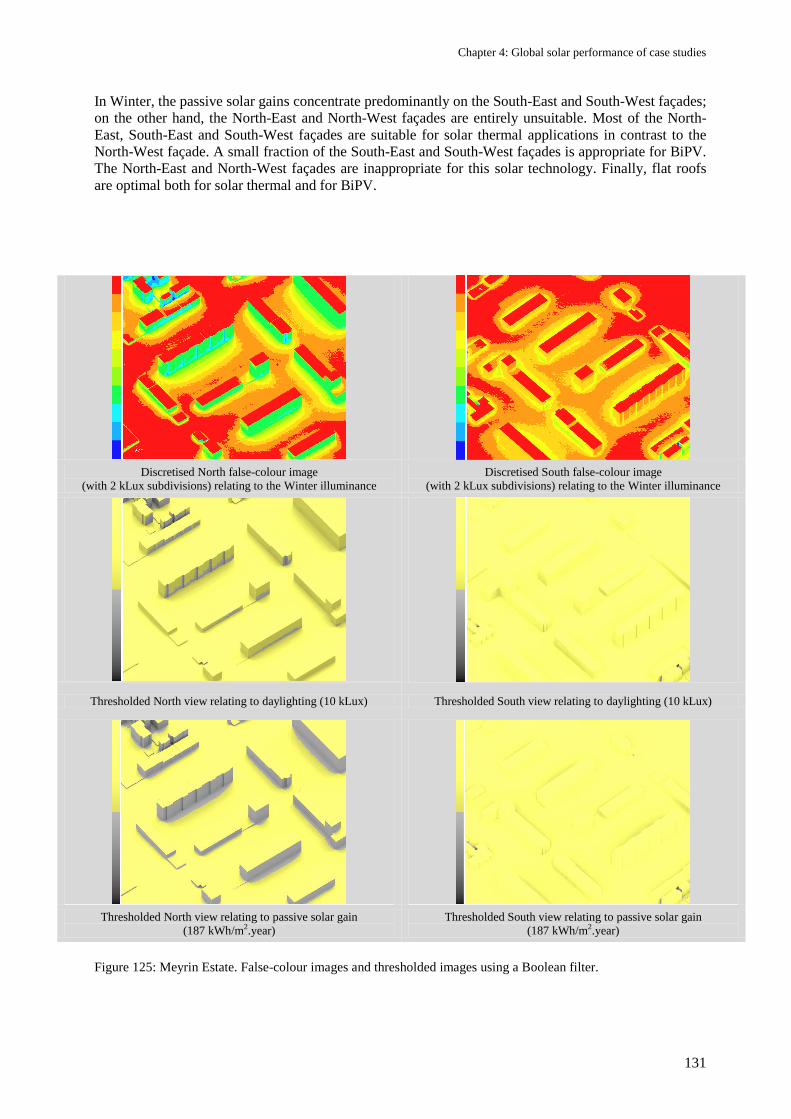
Chapter 4: Global solar performance of case studies
131
In Winter, the passive solar gains concentrate predominantly on the South-East and South-West façades;
on the other hand, the North-East and North-West façades are entirely unsuitable. Most of the North-
East, South-East and South-West façades are suitable for solar thermal applications in contrast to the
North-West façade. A small fraction of the South-East and South-West façades is appropriate for BiPV.
The North-East and North-West façades are inappropriate for this solar technology. Finally, flat roofs
are optimal both for solar thermal and for BiPV.
Figure 125: Meyrin Estate. False-colour images and thresholded images using a Boolean filter.
Discretised North false-colour image
(with 2 kLux subdivisions) relating to the Winter illuminance
Discretised South false-colour image
(with 2 kLux subdivisions) relating to the Winter illuminance
Thresholded North view relating to daylighting (10 kLux) Thresholded South view relating to daylighting (10 kLux)
Thresholded North view relating to passive solar gain
(187 kWh/m2.year)
Thresholded South view relating to passive solar gain
(187 kWh/m2.year)
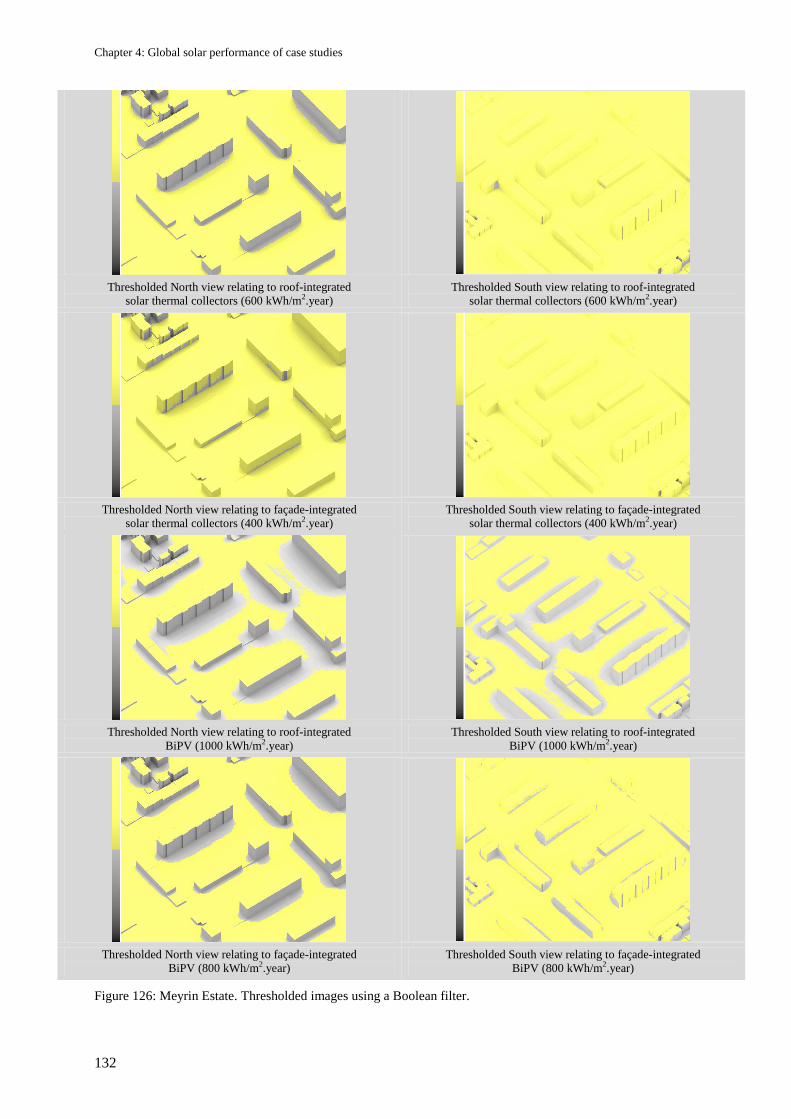
Chapter 4: Global solar performance of case studies
132
Figure 126: Meyrin Estate. Thresholded images using a Boolean filter.
Thresholded North view relating to roof-integrated
solar thermal collectors (600 kWh/m2.year)
Thresholded South view relating to roof-integrated
solar thermal collectors (600 kWh/m2.year)
Thresholded North view relating to façade-integrated
solar thermal collectors (400 kWh/m2.year)
Thresholded South view relating to façade-integrated
solar thermal collectors (400 kWh/m2.year)
Thresholded North view relating to roof-integrated
BiPV (1000 kWh/m2.year)
Thresholded South view relating to roof-integrated
BiPV (1000 kWh/m2.year)
Thresholded North view relating to façade-integrated
BiPV (800 kWh/m2.year)
Thresholded South view relating to façade-integrated
BiPV (800 kWh/m2.year)
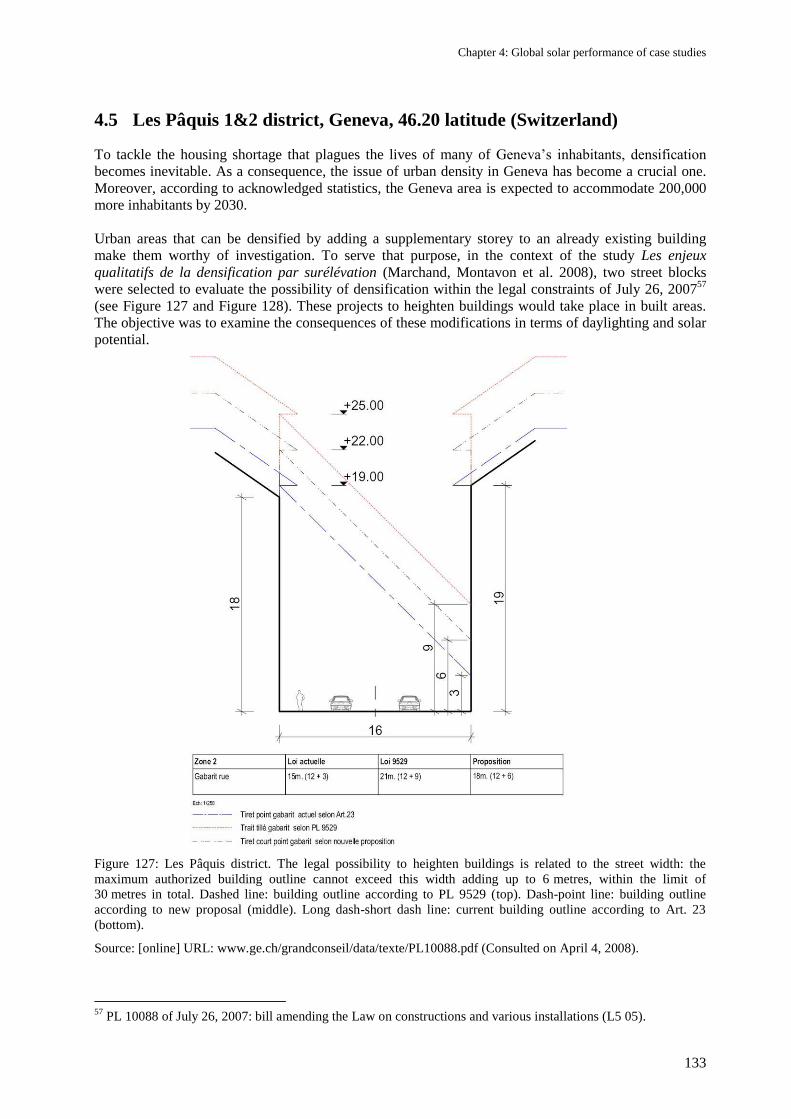
Chapter 4: Global solar performance of case studies
133
4.5 Les Pâquis 1&2 district, Geneva, 46.20 latitude (Switzerland)
To tackle the housing shortage that plagues the lives of many of Geneva‘s inhabitants, densification
becomes inevitable. As a consequence, the issue of urban density in Geneva has become a crucial one.
Moreover, according to acknowledged statistics, the Geneva area is expected to accommodate 200,000
more inhabitants by 2030.
Urban areas that can be densified by adding a supplementary storey to an already existing building
make them worthy of investigation. To serve that purpose, in the context of the study Les enjeux
qualitatifs de la densification par surélévation (Marchand, Montavon et al. 2008), two street blocks
were selected to evaluate the possibility of densification within the legal constraints of July 26, 200757
(see Figure 127 and Figure 128). These projects to heighten buildings would take place in built areas.
The objective was to examine the consequences of these modifications in terms of daylighting and solar
potential.
Figure 127: Les Pâquis district. The legal possibility to heighten buildings is related to the street width: the
maximum authorized building outline cannot exceed this width adding up to 6 metres, within the limit of
30 metres in total. Dashed line: building outline according to PL 9529 (top). Dash-point line: building outline
according to new proposal (middle). Long dash-short dash line: current building outline according to Art. 23
(bottom).
Source: [online] URL: www.ge.ch/grandconseil/data/texte/PL10088.pdf (Consulted on April 4, 2008).
57
PL 10088 of July 26, 2007: bill amending the Law on constructions and various installations (L5 05).
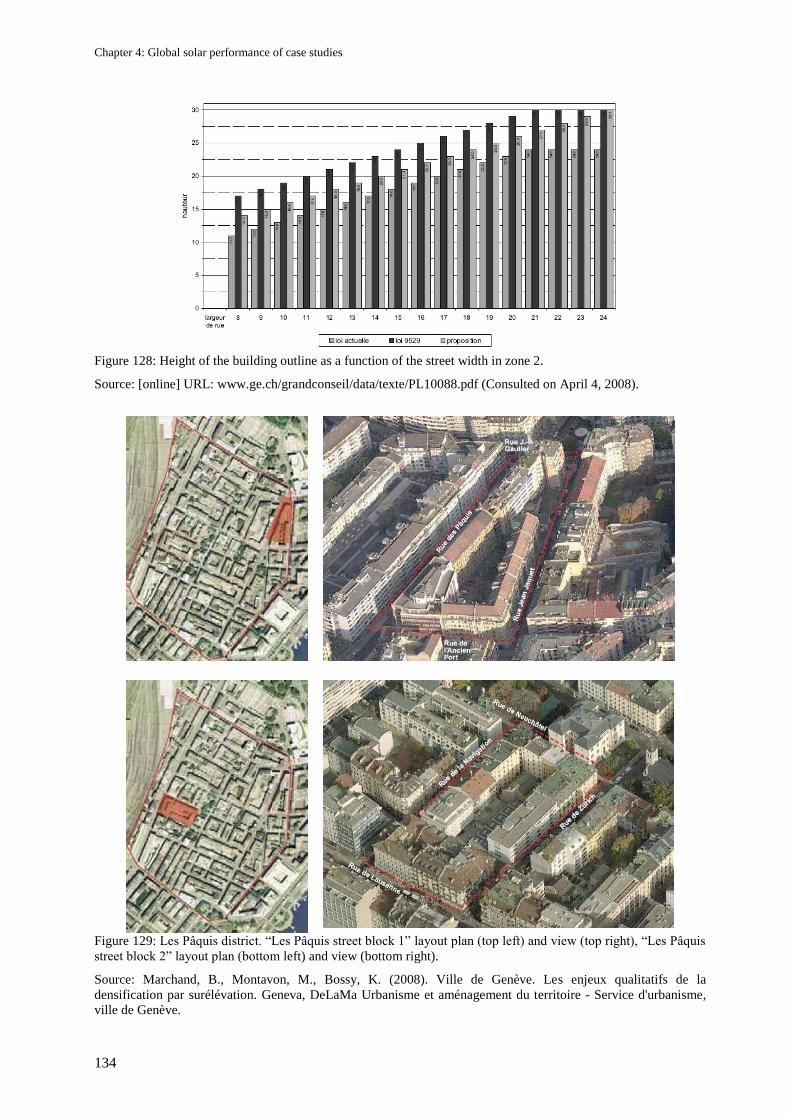
Chapter 4: Global solar performance of case studies
134
Figure 128: Height of the building outline as a function of the street width in zone 2.
Source: [online] URL: www.ge.ch/grandconseil/data/texte/PL10088.pdf (Consulted on April 4, 2008).
Figure 129: Les Pâquis district. ―Les Pâquis street block 1‖ layout plan (top left) and view (top right), ―Les Pâquis
street block 2‖ layout plan (bottom left) and view (bottom right).
Source: Marchand, B., Montavon, M., Bossy, K. (2008). Ville de Genève. Les enjeux qualitatifs de la
densification par surélévation. Geneva, DeLaMa Urbanisme et aménagement du territoire - Service d'urbanisme,
ville de Genève.
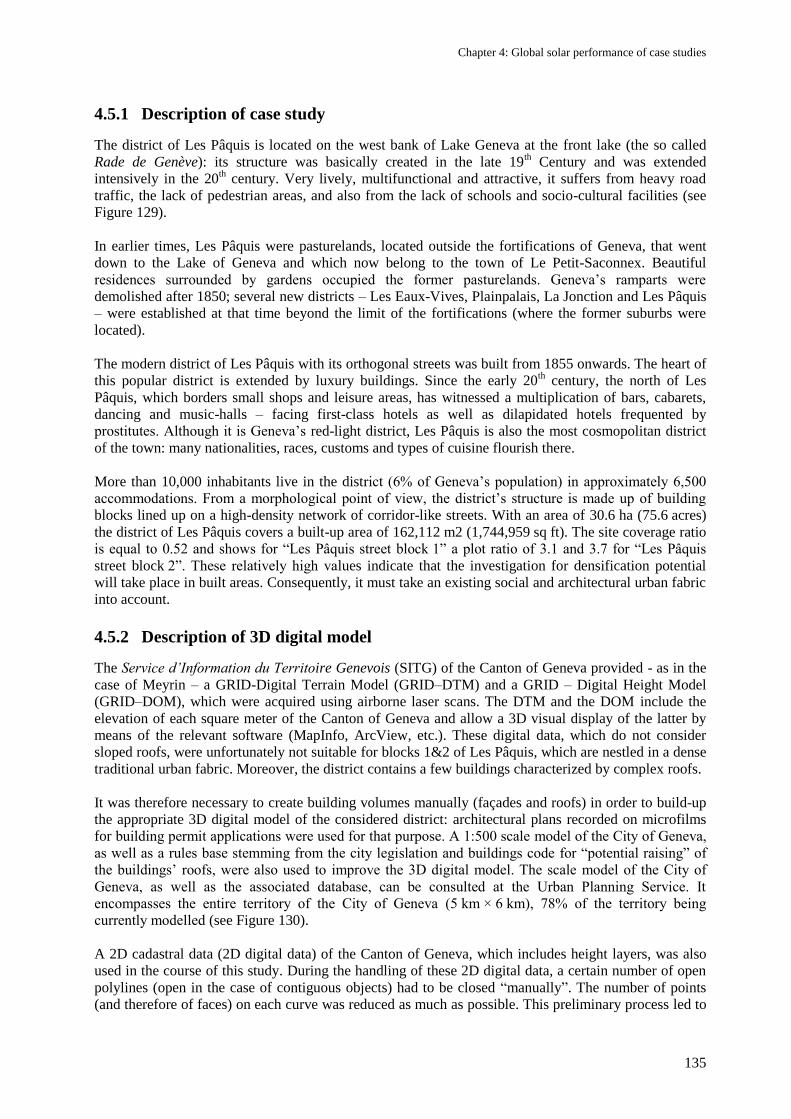
Chapter 4: Global solar performance of case studies
135
4.5.1 Description of case study
The district of Les Pâquis is located on the west bank of Lake Geneva at the front lake (the so called
Rade de Genève): its structure was basically created in the late 19th Century and was extended
intensively in the 20th century. Very lively, multifunctional and attractive, it suffers from heavy road
traffic, the lack of pedestrian areas, and also from the lack of schools and socio-cultural facilities (see
Figure 129).
In earlier times, Les Pâquis were pasturelands, located outside the fortifications of Geneva, that went
down to the Lake of Geneva and which now belong to the town of Le Petit-Saconnex. Beautiful
residences surrounded by gardens occupied the former pasturelands. Geneva‘s ramparts were
demolished after 1850; several new districts – Les Eaux-Vives, Plainpalais, La Jonction and Les Pâquis
– were established at that time beyond the limit of the fortifications (where the former suburbs were
located).
The modern district of Les Pâquis with its orthogonal streets was built from 1855 onwards. The heart of
this popular district is extended by luxury buildings. Since the early 20th century, the north of Les
Pâquis, which borders small shops and leisure areas, has witnessed a multiplication of bars, cabarets,
dancing and music-halls – facing first-class hotels as well as dilapidated hotels frequented by
prostitutes. Although it is Geneva‘s red-light district, Les Pâquis is also the most cosmopolitan district
of the town: many nationalities, races, customs and types of cuisine flourish there.
More than 10,000 inhabitants live in the district (6% of Geneva‘s population) in approximately 6,500
accommodations. From a morphological point of view, the district‘s structure is made up of building
blocks lined up on a high-density network of corridor-like streets. With an area of 30.6 ha (75.6 acres)
the district of Les Pâquis covers a built-up area of 162,112 m2 (1,744,959 sq ft). The site coverage ratio
is equal to 0.52 and shows for ―Les Pâquis street block 1‖ a plot ratio of 3.1 and 3.7 for ―Les Pâquis
street block 2‖. These relatively high values indicate that the investigation for densification potential
will take place in built areas. Consequently, it must take an existing social and architectural urban fabric
into account.
4.5.2 Description of 3D digital model
The Service d’Information du Territoire Genevois (SITG) of the Canton of Geneva provided - as in the
case of Meyrin – a GRID-Digital Terrain Model (GRID–DTM) and a GRID – Digital Height Model
(GRID–DOM), which were acquired using airborne laser scans. The DTM and the DOM include the
elevation of each square meter of the Canton of Geneva and allow a 3D visual display of the latter by
means of the relevant software (MapInfo, ArcView, etc.). These digital data, which do not consider
sloped roofs, were unfortunately not suitable for blocks 1&2 of Les Pâquis, which are nestled in a dense
traditional urban fabric. Moreover, the district contains a few buildings characterized by complex roofs.
It was therefore necessary to create building volumes manually (façades and roofs) in order to build-up
the appropriate 3D digital model of the considered district: architectural plans recorded on microfilms
for building permit applications were used for that purpose. A 1:500 scale model of the City of Geneva,
as well as a rules base stemming from the city legislation and buildings code for “potential raising” of
the buildings’ roofs, were also used to improve the 3D digital model. The scale model of the City of
Geneva, as well as the associated database, can be consulted at the Urban Planning Service. It
encompasses the entire territory of the City of Geneva (5 km × 6 km), 78% of the territory being
currently modelled (see Figure 130).
A 2D cadastral data (2D digital data) of the Canton of Geneva, which includes height layers, was also
used in the course of this study. During the handling of these 2D digital data, a certain number of open
polylines (open in the case of contiguous objects) had to be closed ―manually‖. The number of points
(and therefore of faces) on each curve was reduced as much as possible. This preliminary process led to
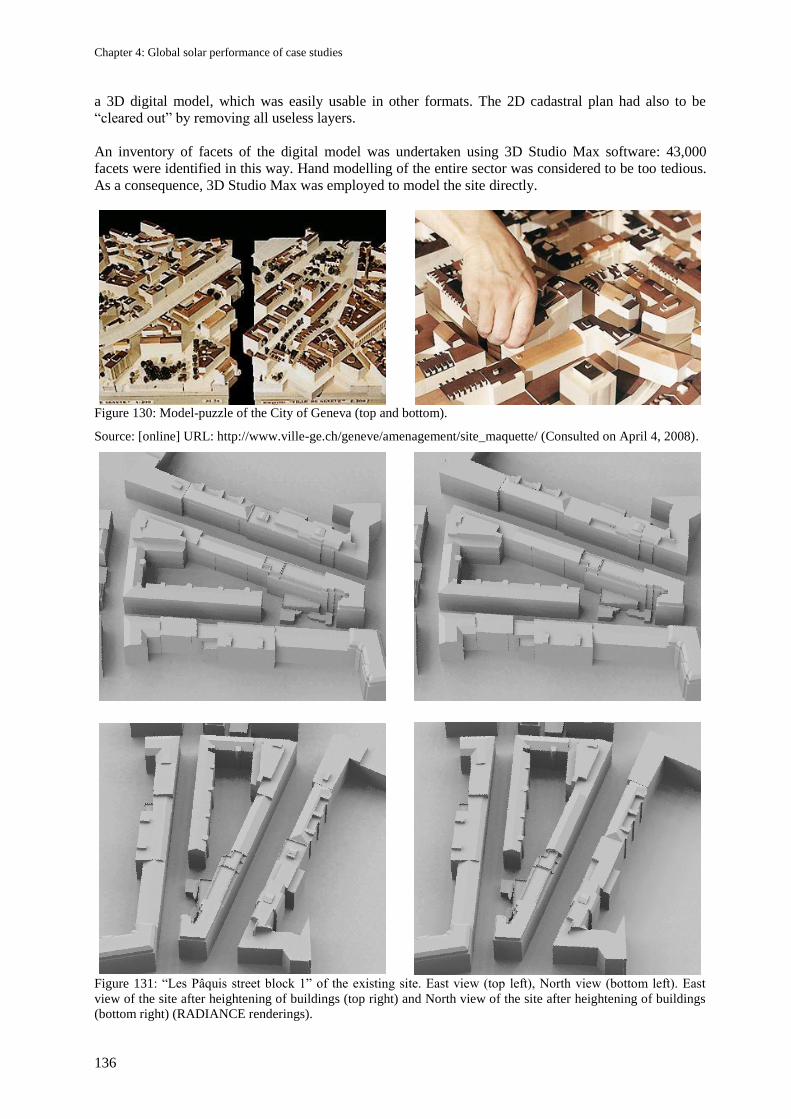
Chapter 4: Global solar performance of case studies
136
a 3D digital model, which was easily usable in other formats. The 2D cadastral plan had also to be
―cleared out‖ by removing all useless layers.
An inventory of facets of the digital model was undertaken using 3D Studio Max software: 43,000
facets were identified in this way. Hand modelling of the entire sector was considered to be too tedious.
As a consequence, 3D Studio Max was employed to model the site directly.
Figure 130: Model-puzzle of the City of Geneva (top and bottom).
Source: [online] URL: http://www.ville-ge.ch/geneve/amenagement/site_maquette/ (Consulted on April 4, 2008).
Figure 131: ―Les Pâquis street block 1‖ of the existing site. East view (top left), North view (bottom left). East
view of the site after heightening of buildings (top right) and North view of the site after heightening of buildings
(bottom right) (RADIANCE renderings).
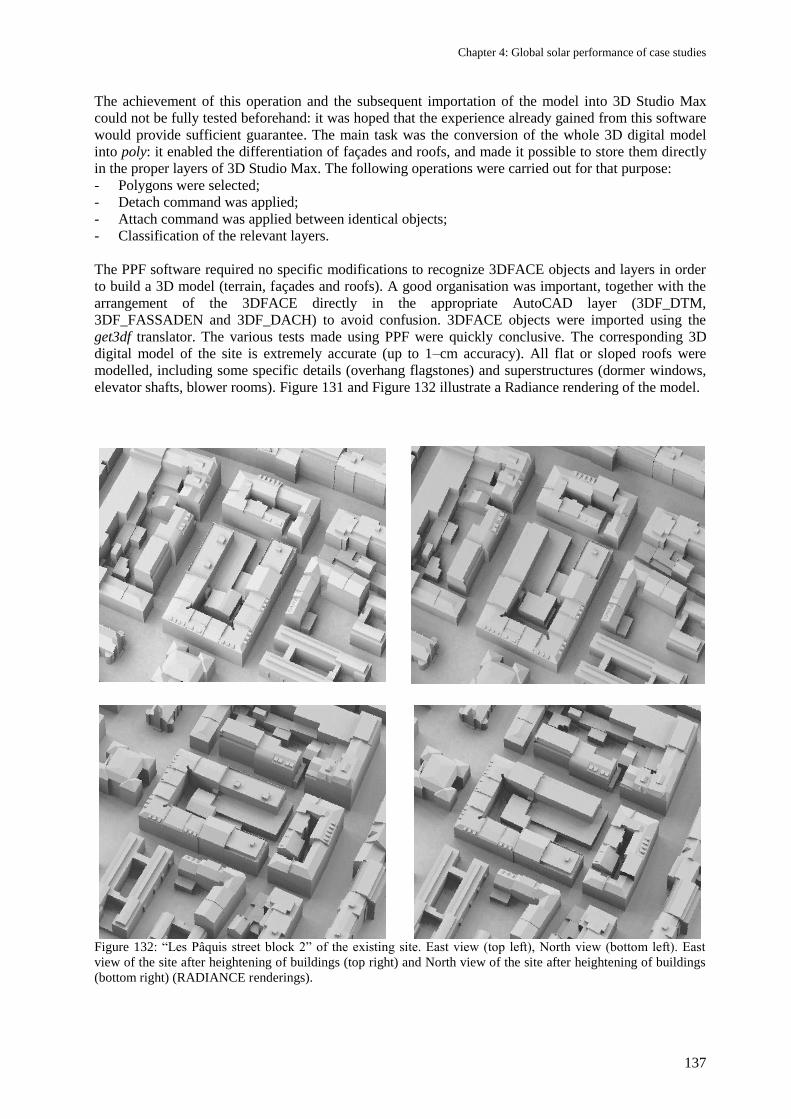
Chapter 4: Global solar performance of case studies
137
The achievement of this operation and the subsequent importation of the model into 3D Studio Max
could not be fully tested beforehand: it was hoped that the experience already gained from this software
would provide sufficient guarantee. The main task was the conversion of the whole 3D digital model
into poly: it enabled the differentiation of façades and roofs, and made it possible to store them directly
in the proper layers of 3D Studio Max. The following operations were carried out for that purpose:
- Polygons were selected;
- Detach command was applied;
- Attach command was applied between identical objects;
- Classification of the relevant layers.
The PPF software required no specific modifications to recognize 3DFACE objects and layers in order
to build a 3D model (terrain, façades and roofs). A good organisation was important, together with the
arrangement of the 3DFACE directly in the appropriate AutoCAD layer (3DF_DTM,
3DF_FASSADEN and 3DF_DACH) to avoid confusion. 3DFACE objects were imported using the
get3df translator. The various tests made using PPF were quickly conclusive. The corresponding 3D
digital model of the site is extremely accurate (up to 1–cm accuracy). All flat or sloped roofs were
modelled, including some specific details (overhang flagstones) and superstructures (dormer windows,
elevator shafts, blower rooms). Figure 131 and Figure 132 illustrate a Radiance rendering of the model.
Figure 132: ―Les Pâquis street block 2‖ of the existing site. East view (top left), North view (bottom left). East
view of the site after heightening of buildings (top right) and North view of the site after heightening of buildings
(bottom right) (RADIANCE renderings).
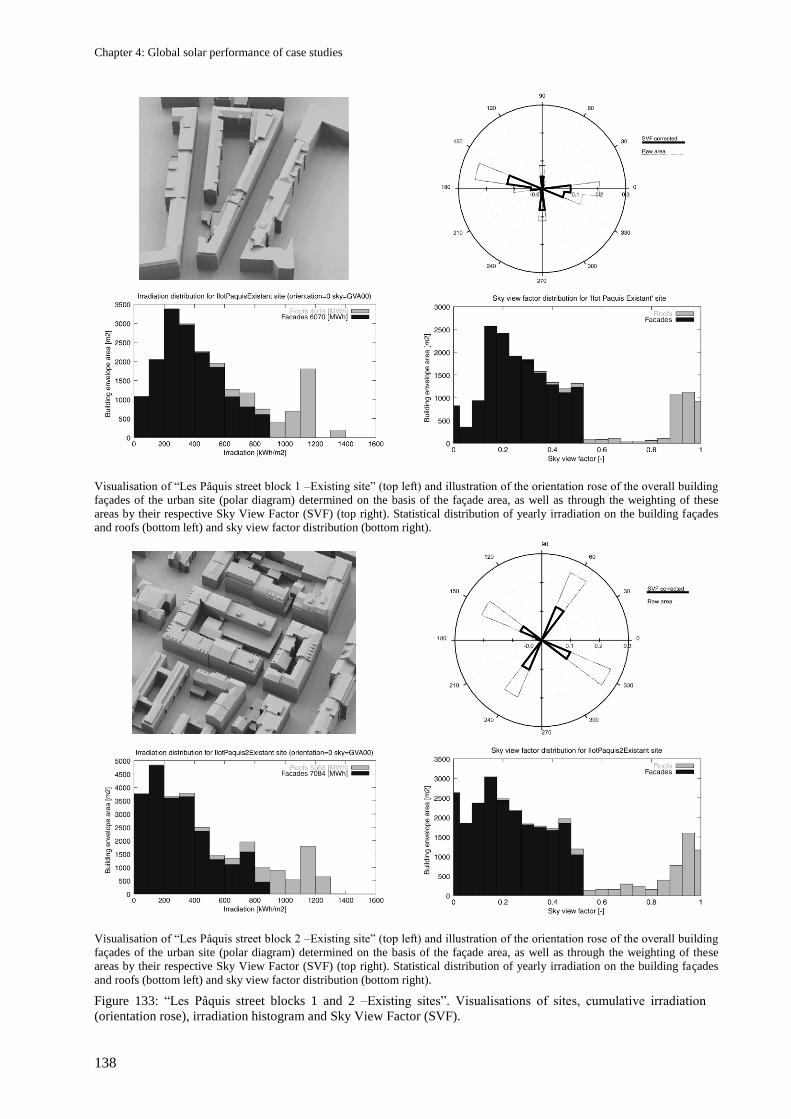
Chapter 4: Global solar performance of case studies
138
Visualisation of ―Les Pâquis street block 1 –Existing site‖ (top left) and illustration of the orientation rose of the overall building
façades of the urban site (polar diagram) determined on the basis of the façade area, as well as through the weighting of these
areas by their respective Sky View Factor (SVF) (top right). Statistical distribution of yearly irradiation on the building façades
and roofs (bottom left) and sky view factor distribution (bottom right).
Visualisation of ―Les Pâquis street block 2 –Existing site‖ (top left) and illustration of the orientation rose of the overall building
façades of the urban site (polar diagram) determined on the basis of the façade area, as well as through the weighting of these
areas by their respective Sky View Factor (SVF) (top right). Statistical distribution of yearly irradiation on the building façades
and roofs (bottom left) and sky view factor distribution (bottom right).
Figure 133: ―Les Pâquis street blocks 1 and 2 –Existing sites‖. Visualisations of sites, cumulative irradiation
(orientation rose), irradiation histogram and Sky View Factor (SVF).
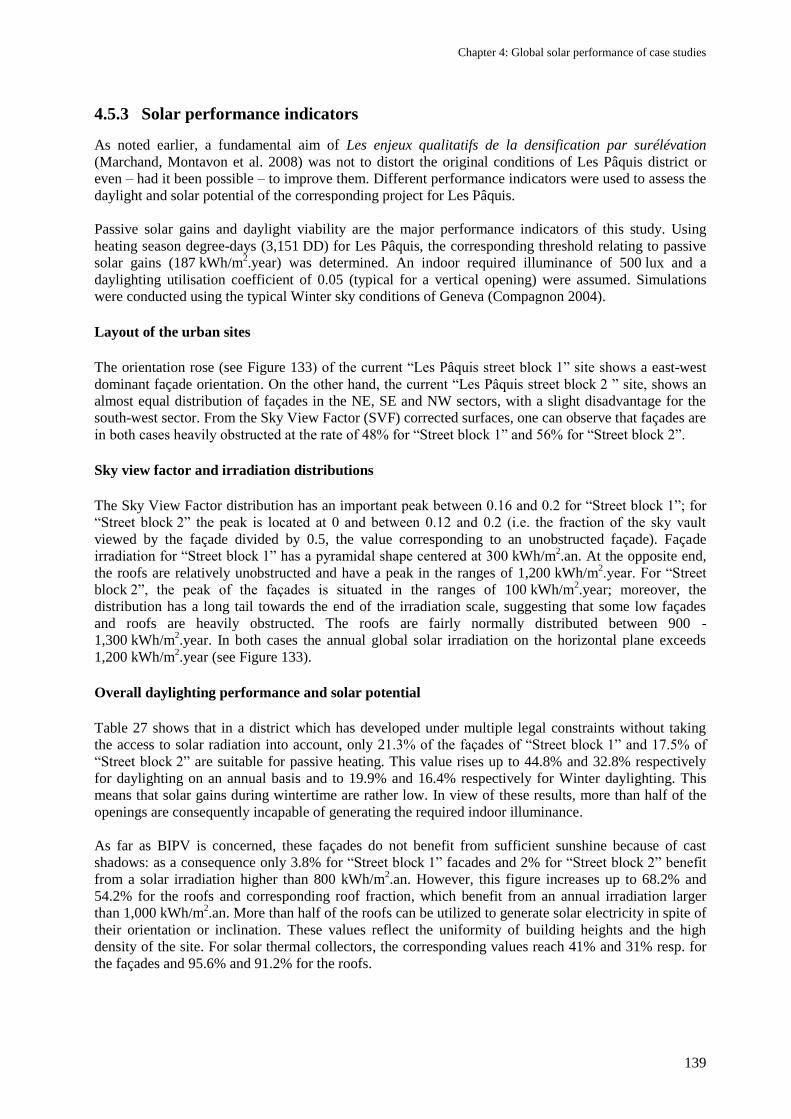
Chapter 4: Global solar performance of case studies
139
4.5.3 Solar performance indicators
As noted earlier, a fundamental aim of Les enjeux qualitatifs de la densification par surélévation
(Marchand, Montavon et al. 2008) was not to distort the original conditions of Les Pâquis district or
even – had it been possible – to improve them. Different performance indicators were used to assess the
daylight and solar potential of the corresponding project for Les Pâquis.
Passive solar gains and daylight viability are the major performance indicators of this study. Using
heating season degree-days (3,151 DD) for Les Pâquis, the corresponding threshold relating to passive
solar gains (187 kWh/m2.year) was determined. An indoor required illuminance of 500 lux and a
daylighting utilisation coefficient of 0.05 (typical for a vertical opening) were assumed. Simulations
were conducted using the typical Winter sky conditions of Geneva (Compagnon 2004).
Layout of the urban sites
The orientation rose (see Figure 133) of the current ―Les Pâquis street block 1‖ site shows a east-west
dominant façade orientation. On the other hand, the current ―Les Pâquis street block 2 ‖ site, shows an
almost equal distribution of façades in the NE, SE and NW sectors, with a slight disadvantage for the
south-west sector. From the Sky View Factor (SVF) corrected surfaces, one can observe that façades are
in both cases heavily obstructed at the rate of 48% for ―Street block 1‖ and 56% for ―Street block 2‖.
Sky view factor and irradiation distributions
The Sky View Factor distribution has an important peak between 0.16 and 0.2 for ―Street block 1‖; for
―Street block 2‖ the peak is located at 0 and between 0.12 and 0.2 (i.e. the fraction of the sky vault
viewed by the façade divided by 0.5, the value corresponding to an unobstructed façade). Façade
irradiation for ―Street block 1‖ has a pyramidal shape centered at 300 kWh/m2.an. At the opposite end,
the roofs are relatively unobstructed and have a peak in the ranges of 1,200 kWh/m2.year. For ―Street
block 2‖, the peak of the façades is situated in the ranges of 100 kWh/m2.year; moreover, the
distribution has a long tail towards the end of the irradiation scale, suggesting that some low façades
and roofs are heavily obstructed. The roofs are fairly normally distributed between 900 -
1,300 kWh/m2.year. In both cases the annual global solar irradiation on the horizontal plane exceeds
1,200 kWh/m2.year (see Figure 133).
Overall daylighting performance and solar potential
Table 27 shows that in a district which has developed under multiple legal constraints without taking
the access to solar radiation into account, only 21.3% of the façades of ―Street block 1‖ and 17.5% of
―Street block 2‖ are suitable for passive heating. This value rises up to 44.8% and 32.8% respectively
for daylighting on an annual basis and to 19.9% and 16.4% respectively for Winter daylighting. This
means that solar gains during wintertime are rather low. In view of these results, more than half of the
openings are consequently incapable of generating the required indoor illuminance.
As far as BIPV is concerned, these façades do not benefit from sufficient sunshine because of cast
shadows: as a consequence only 3.8% for ―Street block 1‖ facades and 2% for ―Street block 2‖ benefit
from a solar irradiation higher than 800 kWh/m2.an. However, this figure increases up to 68.2% and
54.2% for the roofs and corresponding roof fraction, which benefit from an annual irradiation larger
than 1,000 kWh/m2.an. More than half of the roofs can be utilized to generate solar electricity in spite of
their orientation or inclination. These values reflect the uniformity of building heights and the high
density of the site. For solar thermal collectors, the corresponding values reach 41% and 31% resp. for
the façades and 95.6% and 91.2% for the roofs.
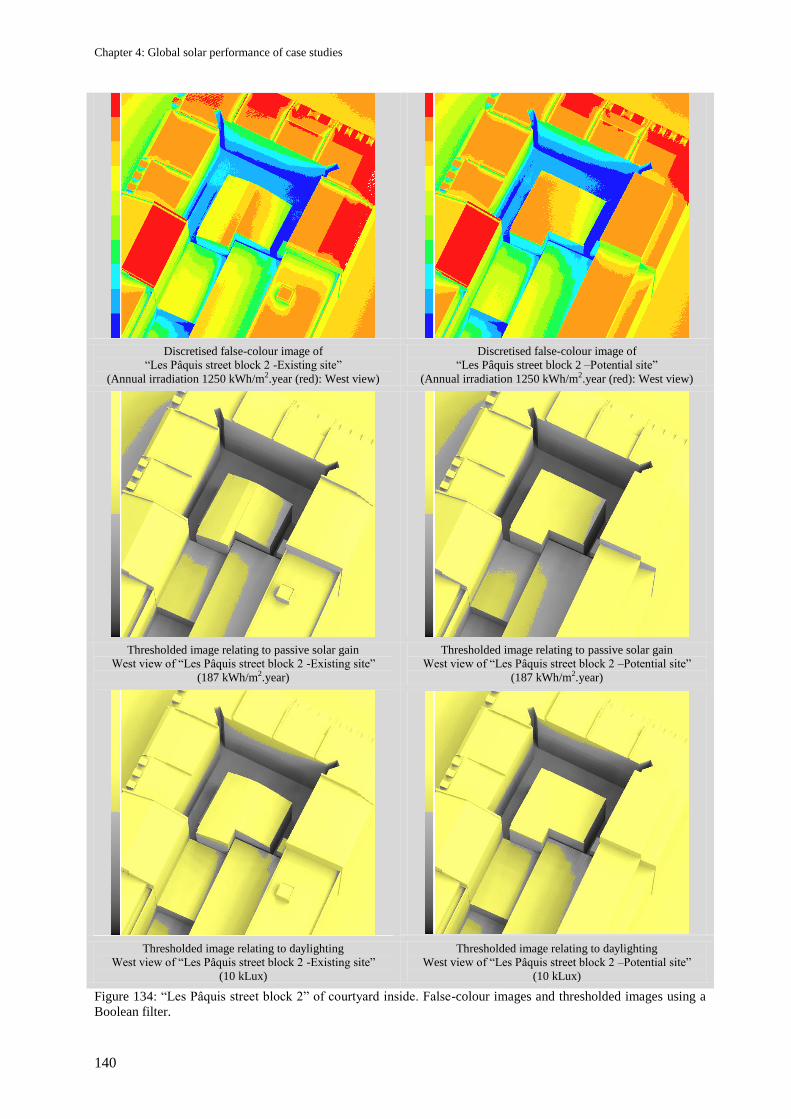
Chapter 4: Global solar performance of case studies
140
Discretised false-colour image of
―Les Pâquis street block 2 -Existing site‖
(Annual irradiation 1250 kWh/m2.year (red): West view)
Discretised false-colour image of
―Les Pâquis street block 2 –Potential site‖
(Annual irradiation 1250 kWh/m2.year (red): West view)
Thresholded image relating to passive solar gain
West view of ―Les Pâquis street block 2 -Existing site‖
(187 kWh/m2.year)
Thresholded image relating to passive solar gain
West view of ―Les Pâquis street block 2 –Potential site‖
(187 kWh/m2.year)
Thresholded image relating to daylighting
West view of ―Les Pâquis street block 2 -Existing site‖
(10 kLux)
Thresholded image relating to daylighting
West view of ―Les Pâquis street block 2 –Potential site‖
(10 kLux)
Figure 134: ―Les Pâquis street block 2‖ of courtyard inside. False-colour images and thresholded images using a
Boolean filter.
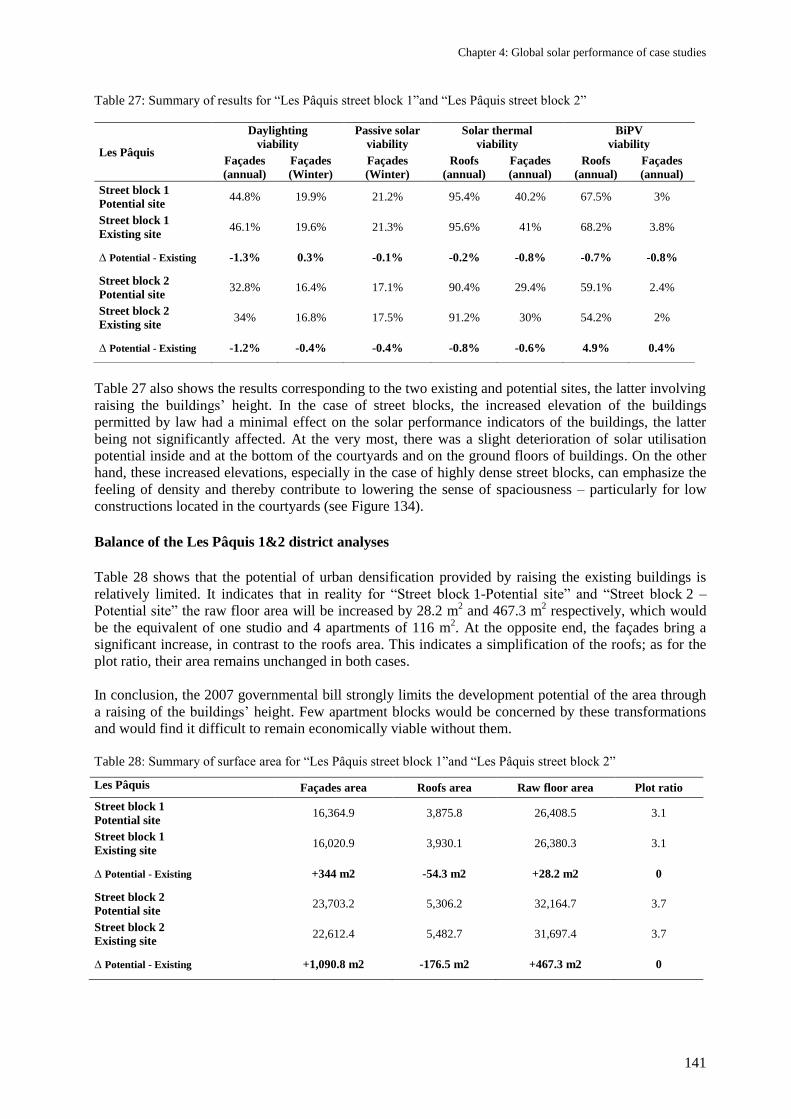
Chapter 4: Global solar performance of case studies
141
Table 27: Summary of results for ―Les Pâquis street block 1‖and ―Les Pâquis street block 2‖
Table 27 also shows the results corresponding to the two existing and potential sites, the latter involving
raising the buildings‘ height. In the case of street blocks, the increased elevation of the buildings
permitted by law had a minimal effect on the solar performance indicators of the buildings, the latter
being not significantly affected. At the very most, there was a slight deterioration of solar utilisation
potential inside and at the bottom of the courtyards and on the ground floors of buildings. On the other
hand, these increased elevations, especially in the case of highly dense street blocks, can emphasize the
feeling of density and thereby contribute to lowering the sense of spaciousness – particularly for low
constructions located in the courtyards (see Figure 134).
Balance of the Les Pâquis 1&2 district analyses
Table 28 shows that the potential of urban densification provided by raising the existing buildings is
relatively limited. It indicates that in reality for ―Street block 1-Potential site‖ and ―Street block 2 –
Potential site‖ the raw floor area will be increased by 28.2 m2 and 467.3 m
2 respectively, which would
be the equivalent of one studio and 4 apartments of 116 m2. At the opposite end, the façades bring a
significant increase, in contrast to the roofs area. This indicates a simplification of the roofs; as for the
plot ratio, their area remains unchanged in both cases.
In conclusion, the 2007 governmental bill strongly limits the development potential of the area through
a raising of the buildings‘ height. Few apartment blocks would be concerned by these transformations
and would find it difficult to remain economically viable without them.
Table 28: Summary of surface area for ―Les Pâquis street block 1‖and ―Les Pâquis street block 2‖
Les Pâquis Façades area Roofs area Raw floor area Plot ratio
Street block 1
Potential site 16,364.9 3,875.8 26,408.5 3.1
Street block 1
Existing site 16,020.9 3,930.1 26,380.3 3.1
∆ Potential - Existing +344 m2 -54.3 m2 +28.2 m2 0
Street block 2
Potential site 23,703.2 5,306.2 32,164.7 3.7
Street block 2
Existing site 22,612.4 5,482.7 31,697.4 3.7
∆ Potential - Existing +1,090.8 m2 -176.5 m2 +467.3 m2 0
Les Pâquis
Daylighting
viability
Passive solar
viability
Solar thermal
viability
BiPV
viability
Façades
(annual)
Façades
(Winter)
Façades
(Winter)
Roofs
(annual)
Façades
(annual)
Roofs
(annual)
Façades
(annual)
Street block 1
Potential site 44.8% 19.9% 21.2% 95.4% 40.2% 67.5% 3%
Street block 1
Existing site 46.1% 19.6% 21.3% 95.6% 41% 68.2% 3.8%
∆ Potential - Existing -1.3% 0.3% -0.1% -0.2% -0.8% -0.7% -0.8%
Street block 2
Potential site 32.8% 16.4% 17.1% 90.4% 29.4% 59.1% 2.4%
Street block 2
Existing site 34% 16.8% 17.5% 91.2% 30% 54.2% 2%
∆ Potential - Existing -1.2% -0.4% -0.4% -0.8% -0.6% 4.9% 0.4%
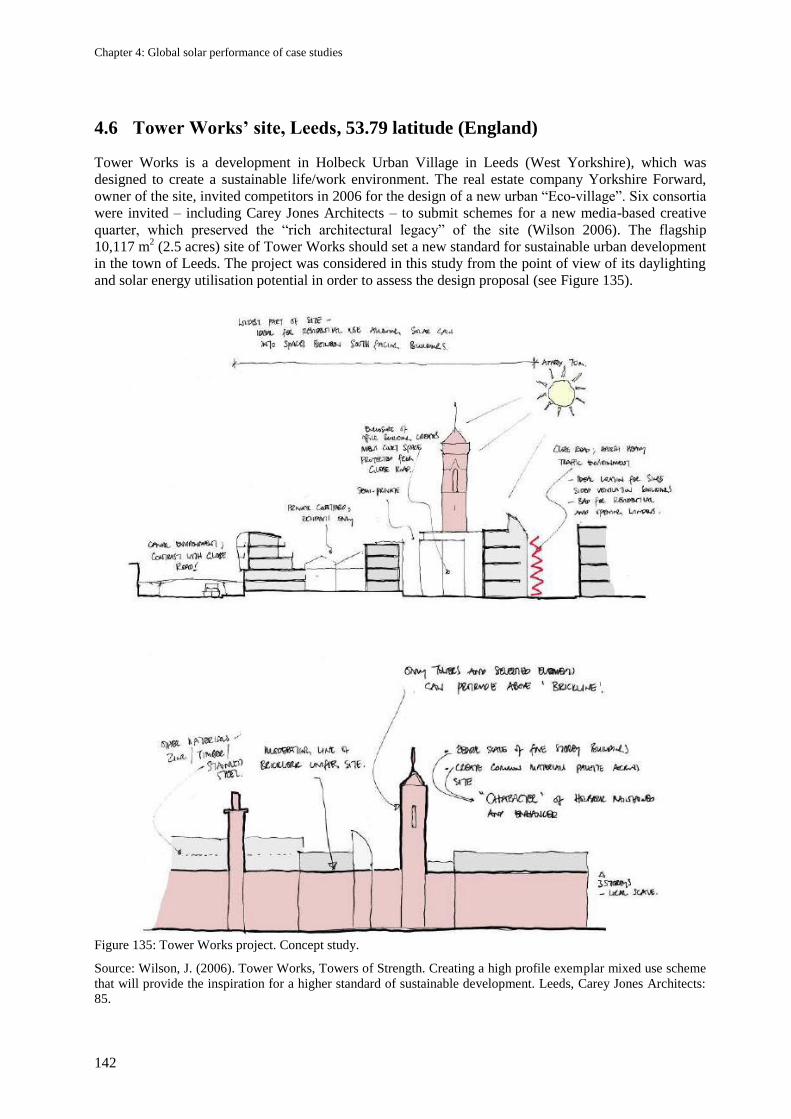
Chapter 4: Global solar performance of case studies
142
4.6 Tower Works’ site, Leeds, 53.79 latitude (England)
Tower Works is a development in Holbeck Urban Village in Leeds (West Yorkshire), which was
designed to create a sustainable life/work environment. The real estate company Yorkshire Forward,
owner of the site, invited competitors in 2006 for the design of a new urban ―Eco-village‖. Six consortia
were invited – including Carey Jones Architects – to submit schemes for a new media-based creative
quarter, which preserved the ―rich architectural legacy‖ of the site (Wilson 2006). The flagship
10,117 m2 (2.5 acres) site of Tower Works should set a new standard for sustainable urban development
in the town of Leeds. The project was considered in this study from the point of view of its daylighting
and solar energy utilisation potential in order to assess the design proposal (see Figure 135).
Figure 135: Tower Works project. Concept study.
Source: Wilson, J. (2006). Tower Works, Towers of Strength. Creating a high profile exemplar mixed use scheme
that will provide the inspiration for a higher standard of sustainable development. Leeds, Carey Jones Architects:
85.
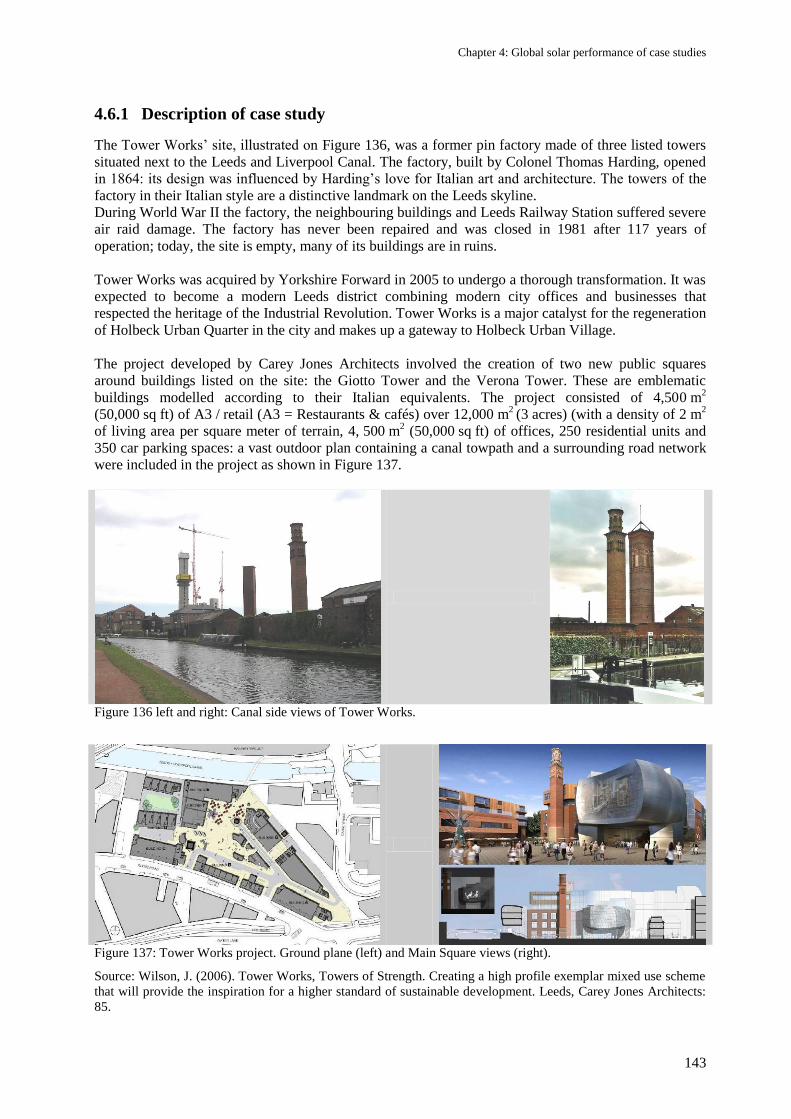
Chapter 4: Global solar performance of case studies
143
4.6.1 Description of case study
The Tower Works‘ site, illustrated on Figure 136, was a former pin factory made of three listed towers
situated next to the Leeds and Liverpool Canal. The factory, built by Colonel Thomas Harding, opened
in 1864: its design was influenced by Harding‘s love for Italian art and architecture. The towers of the
factory in their Italian style are a distinctive landmark on the Leeds skyline.
During World War II the factory, the neighbouring buildings and Leeds Railway Station suffered severe
air raid damage. The factory has never been repaired and was closed in 1981 after 117 years of
operation; today, the site is empty, many of its buildings are in ruins.
Tower Works was acquired by Yorkshire Forward in 2005 to undergo a thorough transformation. It was
expected to become a modern Leeds district combining modern city offices and businesses that
respected the heritage of the Industrial Revolution. Tower Works is a major catalyst for the regeneration
of Holbeck Urban Quarter in the city and makes up a gateway to Holbeck Urban Village.
The project developed by Carey Jones Architects involved the creation of two new public squares
around buildings listed on the site: the Giotto Tower and the Verona Tower. These are emblematic
buildings modelled according to their Italian equivalents. The project consisted of 4,500 m2
(50,000 sq ft) of A3 / retail (A3 = Restaurants & cafés) over 12,000 m2 (3 acres) (with a density of 2 m
2
of living area per square meter of terrain, 4, 500 m2 (50,000 sq ft) of offices, 250 residential units and
350 car parking spaces: a vast outdoor plan containing a canal towpath and a surrounding road network
were included in the project as shown in Figure 137.
Figure 136 left and right: Canal side views of Tower Works.
Figure 137: Tower Works project. Ground plane (left) and Main Square views (right).
Source: Wilson, J. (2006). Tower Works, Towers of Strength. Creating a high profile exemplar mixed use scheme
that will provide the inspiration for a higher standard of sustainable development. Leeds, Carey Jones Architects:
85.
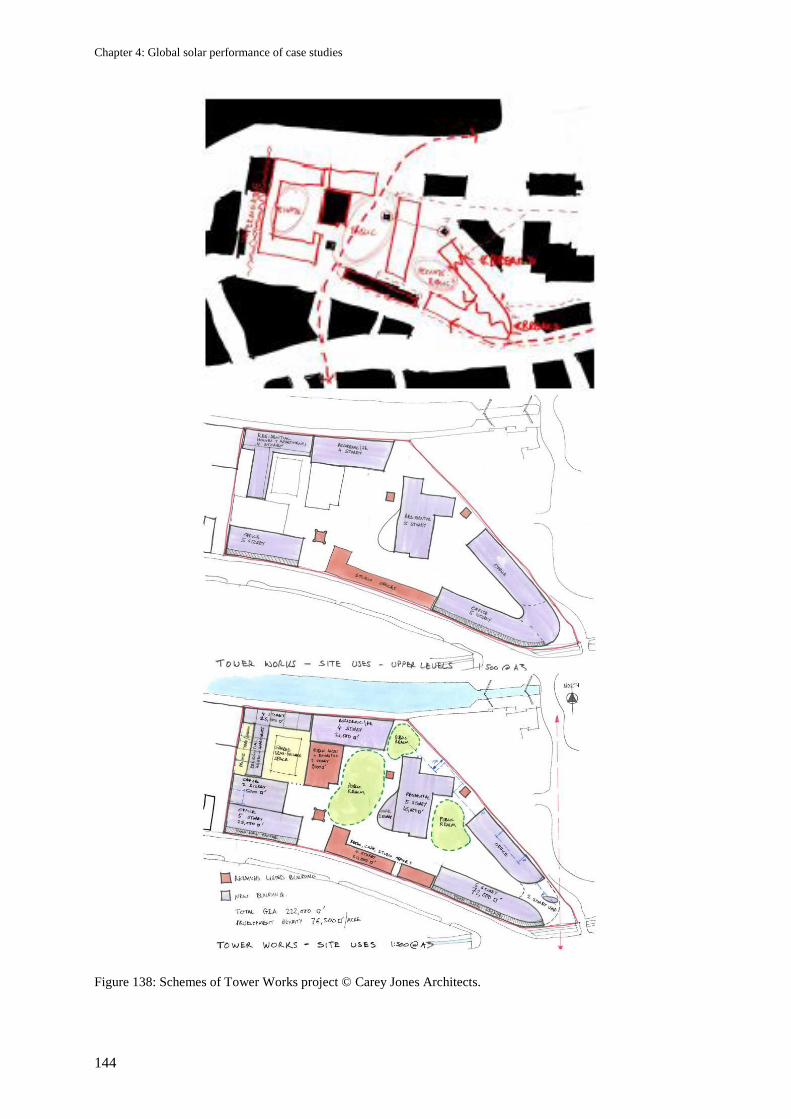
Chapter 4: Global solar performance of case studies
144
Figure 138: Schemes of Tower Works project © Carey Jones Architects.
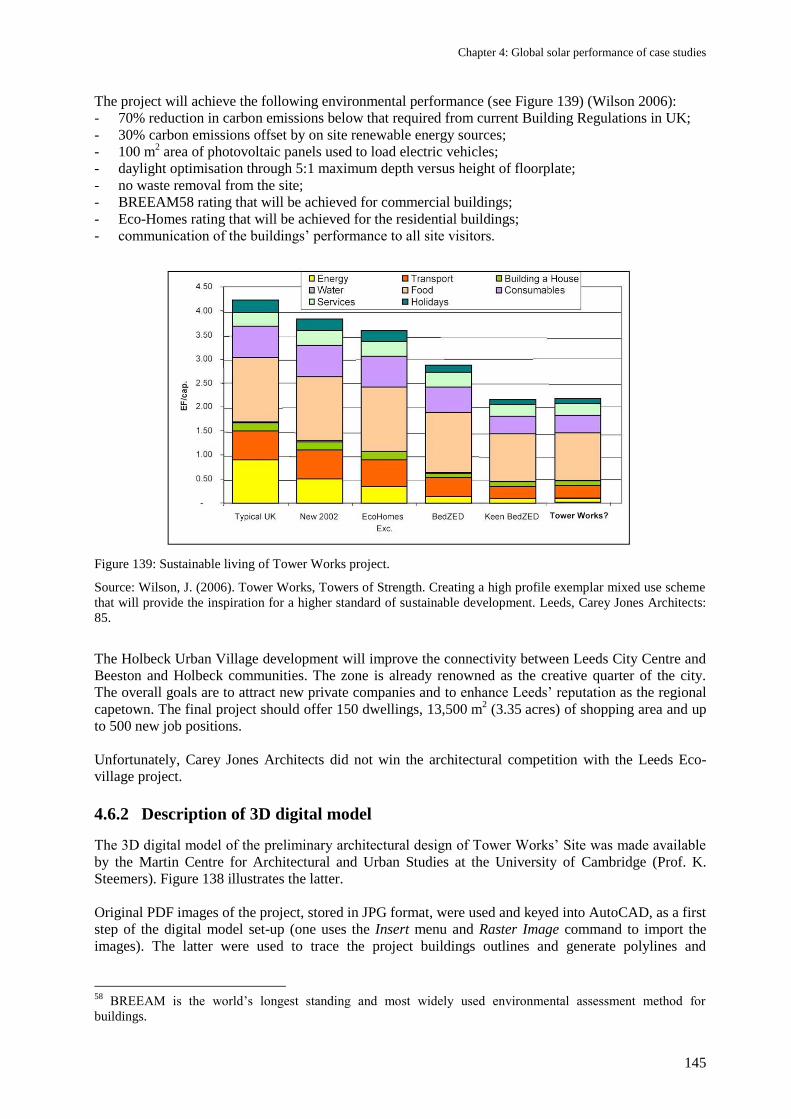
Chapter 4: Global solar performance of case studies
145
The project will achieve the following environmental performance (see Figure 139) (Wilson 2006):
- 70% reduction in carbon emissions below that required from current Building Regulations in UK;
- 30% carbon emissions offset by on site renewable energy sources;
- 100 m2 area of photovoltaic panels used to load electric vehicles;
- daylight optimisation through 5:1 maximum depth versus height of floorplate;
- no waste removal from the site;
- BREEAM58 rating that will be achieved for commercial buildings;
- Eco-Homes rating that will be achieved for the residential buildings;
- communication of the buildings‘ performance to all site visitors.
Figure 139: Sustainable living of Tower Works project.
Source: Wilson, J. (2006). Tower Works, Towers of Strength. Creating a high profile exemplar mixed use scheme
that will provide the inspiration for a higher standard of sustainable development. Leeds, Carey Jones Architects:
85.
The Holbeck Urban Village development will improve the connectivity between Leeds City Centre and
Beeston and Holbeck communities. The zone is already renowned as the creative quarter of the city.
The overall goals are to attract new private companies and to enhance Leeds‘ reputation as the regional
capetown. The final project should offer 150 dwellings, 13,500 m2 (3.35 acres) of shopping area and up
to 500 new job positions.
Unfortunately, Carey Jones Architects did not win the architectural competition with the Leeds Eco-
village project.
4.6.2 Description of 3D digital model
The 3D digital model of the preliminary architectural design of Tower Works‘ Site was made available
by the Martin Centre for Architectural and Urban Studies at the University of Cambridge (Prof. K.
Steemers). Figure 138 illustrates the latter.
Original PDF images of the project, stored in JPG format, were used and keyed into AutoCAD, as a first
step of the digital model set-up (one uses the Insert menu and Raster Image command to import the
images). The latter were used to trace the project buildings outlines and generate polylines and
58
BREEAM is the world‘s longest standing and most widely used environmental assessment method for
buildings.
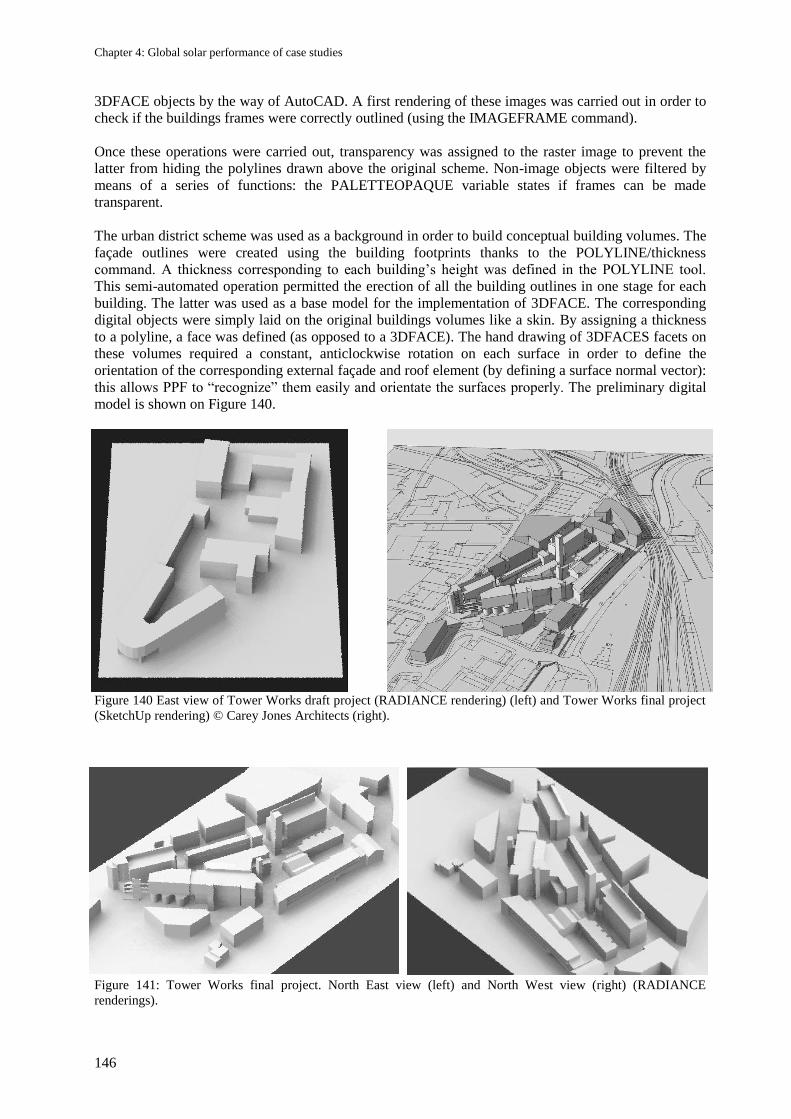
Chapter 4: Global solar performance of case studies
146
3DFACE objects by the way of AutoCAD. A first rendering of these images was carried out in order to
check if the buildings frames were correctly outlined (using the IMAGEFRAME command).
Once these operations were carried out, transparency was assigned to the raster image to prevent the
latter from hiding the polylines drawn above the original scheme. Non-image objects were filtered by
means of a series of functions: the PALETTEOPAQUE variable states if frames can be made
transparent.
The urban district scheme was used as a background in order to build conceptual building volumes. The
façade outlines were created using the building footprints thanks to the POLYLINE/thickness
command. A thickness corresponding to each building‘s height was defined in the POLYLINE tool.
This semi-automated operation permitted the erection of all the building outlines in one stage for each
building. The latter was used as a base model for the implementation of 3DFACE. The corresponding
digital objects were simply laid on the original buildings volumes like a skin. By assigning a thickness
to a polyline, a face was defined (as opposed to a 3DFACE). The hand drawing of 3DFACES facets on
these volumes required a constant, anticlockwise rotation on each surface in order to define the
orientation of the corresponding external façade and roof element (by defining a surface normal vector):
this allows PPF to ―recognize‖ them easily and orientate the surfaces properly. The preliminary digital
model is shown on Figure 140.
Figure 140 East view of Tower Works draft project (RADIANCE rendering) (left) and Tower Works final project
(SketchUp rendering) © Carey Jones Architects (right).
Figure 141: Tower Works final project. North East view (left) and North West view (right) (RADIANCE
renderings).
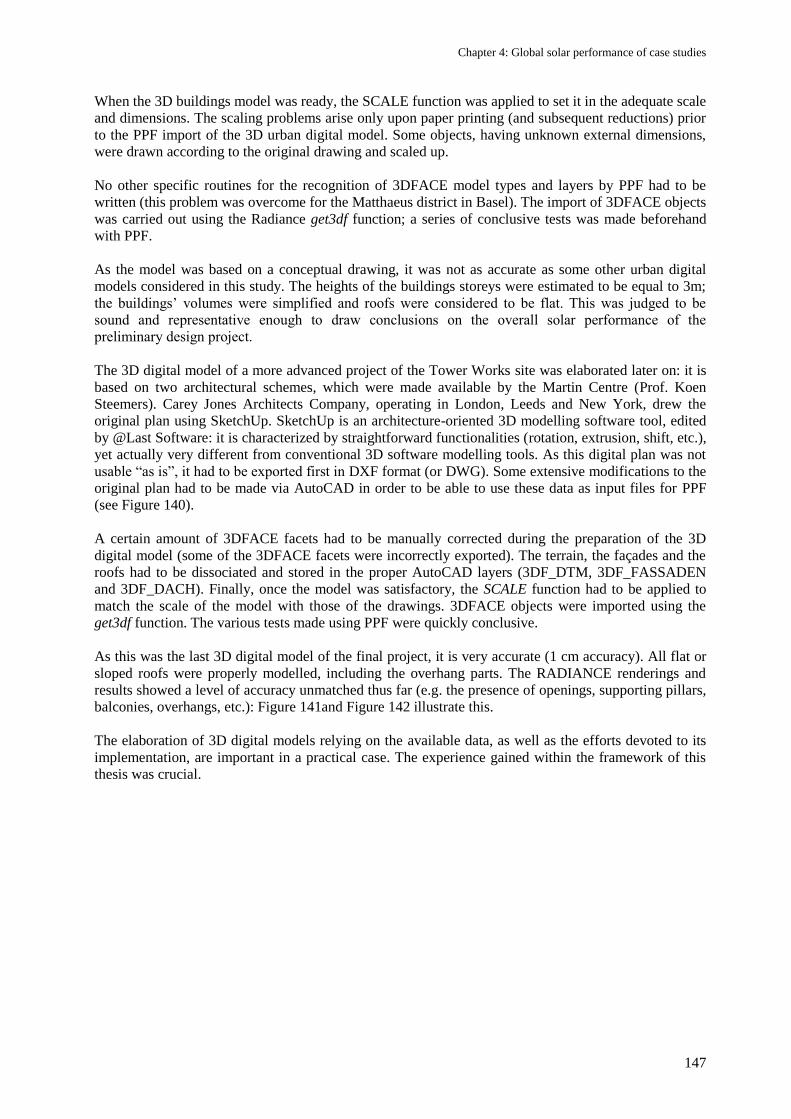
Chapter 4: Global solar performance of case studies
147
When the 3D buildings model was ready, the SCALE function was applied to set it in the adequate scale
and dimensions. The scaling problems arise only upon paper printing (and subsequent reductions) prior
to the PPF import of the 3D urban digital model. Some objects, having unknown external dimensions,
were drawn according to the original drawing and scaled up.
No other specific routines for the recognition of 3DFACE model types and layers by PPF had to be
written (this problem was overcome for the Matthaeus district in Basel). The import of 3DFACE objects
was carried out using the Radiance get3df function; a series of conclusive tests was made beforehand
with PPF.
As the model was based on a conceptual drawing, it was not as accurate as some other urban digital
models considered in this study. The heights of the buildings storeys were estimated to be equal to 3m;
the buildings‘ volumes were simplified and roofs were considered to be flat. This was judged to be
sound and representative enough to draw conclusions on the overall solar performance of the
preliminary design project.
The 3D digital model of a more advanced project of the Tower Works site was elaborated later on: it is
based on two architectural schemes, which were made available by the Martin Centre (Prof. Koen
Steemers). Carey Jones Architects Company, operating in London, Leeds and New York, drew the
original plan using SketchUp. SketchUp is an architecture-oriented 3D modelling software tool, edited
by @Last Software: it is characterized by straightforward functionalities (rotation, extrusion, shift, etc.),
yet actually very different from conventional 3D software modelling tools. As this digital plan was not
usable ―as is‖, it had to be exported first in DXF format (or DWG). Some extensive modifications to the
original plan had to be made via AutoCAD in order to be able to use these data as input files for PPF
(see Figure 140).
A certain amount of 3DFACE facets had to be manually corrected during the preparation of the 3D
digital model (some of the 3DFACE facets were incorrectly exported). The terrain, the façades and the
roofs had to be dissociated and stored in the proper AutoCAD layers (3DF_DTM, 3DF_FASSADEN
and 3DF_DACH). Finally, once the model was satisfactory, the SCALE function had to be applied to
match the scale of the model with those of the drawings. 3DFACE objects were imported using the
get3df function. The various tests made using PPF were quickly conclusive.
As this was the last 3D digital model of the final project, it is very accurate (1 cm accuracy). All flat or
sloped roofs were properly modelled, including the overhang parts. The RADIANCE renderings and
results showed a level of accuracy unmatched thus far (e.g. the presence of openings, supporting pillars,
balconies, overhangs, etc.): Figure 141and Figure 142 illustrate this.
The elaboration of 3D digital models relying on the available data, as well as the efforts devoted to its
implementation, are important in a practical case. The experience gained within the framework of this
thesis was crucial.
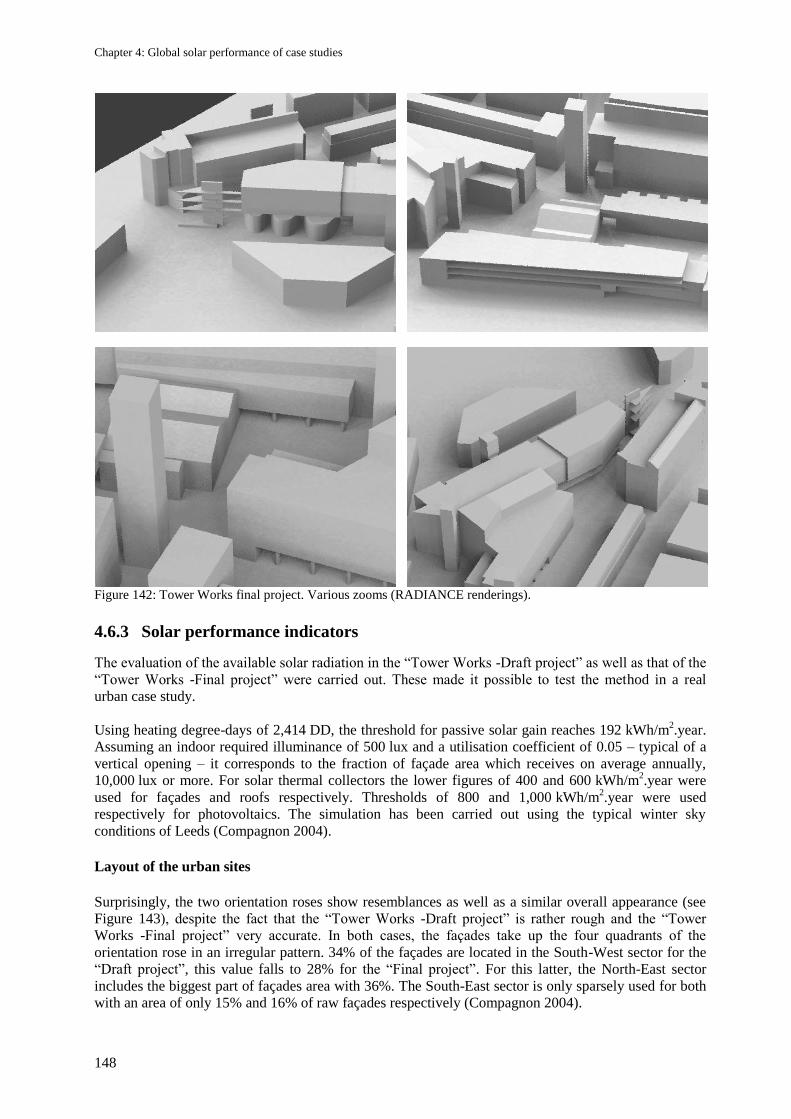
Chapter 4: Global solar performance of case studies
148
Figure 142: Tower Works final project. Various zooms (RADIANCE renderings).
4.6.3 Solar performance indicators
The evaluation of the available solar radiation in the ―Tower Works -Draft project‖ as well as that of the
―Tower Works -Final project‖ were carried out. These made it possible to test the method in a real
urban case study.
Using heating degree-days of 2,414 DD, the threshold for passive solar gain reaches 192 kWh/m2.year.
Assuming an indoor required illuminance of 500 lux and a utilisation coefficient of 0.05 – typical of a
vertical opening – it corresponds to the fraction of façade area which receives on average annually,
10,000 lux or more. For solar thermal collectors the lower figures of 400 and 600 kWh/m2.year were
used for façades and roofs respectively. Thresholds of 800 and 1,000 kWh/m2.year were used
respectively for photovoltaics. The simulation has been carried out using the typical winter sky
conditions of Leeds (Compagnon 2004).
Layout of the urban sites
Surprisingly, the two orientation roses show resemblances as well as a similar overall appearance (see
Figure 143), despite the fact that the ―Tower Works -Draft project‖ is rather rough and the ―Tower
Works -Final project‖ very accurate. In both cases, the façades take up the four quadrants of the
orientation rose in an irregular pattern. 34% of the façades are located in the South-West sector for the
―Draft project‖, this value falls to 28% for the ―Final project‖. For this latter, the North-East sector
includes the biggest part of façades area with 36%. The South-East sector is only sparsely used for both
with an area of only 15% and 16% of raw façades respectively (Compagnon 2004).
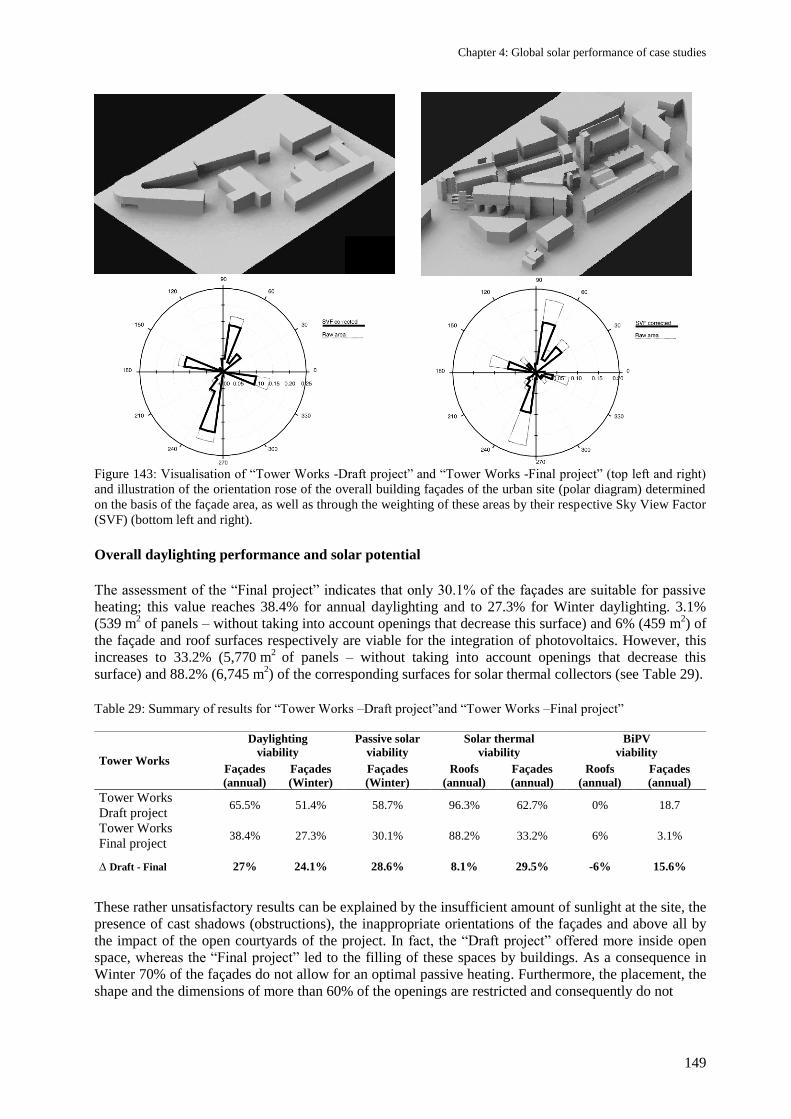
Chapter 4: Global solar performance of case studies
149
Figure 143: Visualisation of ―Tower Works -Draft project‖ and ―Tower Works -Final project‖ (top left and right)
and illustration of the orientation rose of the overall building façades of the urban site (polar diagram) determined
on the basis of the façade area, as well as through the weighting of these areas by their respective Sky View Factor
(SVF) (bottom left and right).
Overall daylighting performance and solar potential
The assessment of the ―Final project‖ indicates that only 30.1% of the façades are suitable for passive
heating; this value reaches 38.4% for annual daylighting and to 27.3% for Winter daylighting. 3.1%
(539 m2 of panels – without taking into account openings that decrease this surface) and 6% (459 m
2) of
the façade and roof surfaces respectively are viable for the integration of photovoltaics. However, this
increases to 33.2% (5,770 m2
of panels – without taking into account openings that decrease this
surface) and 88.2% (6,745 m2) of the corresponding surfaces for solar thermal collectors (see Table 29).
Table 29: Summary of results for ―Tower Works –Draft project‖and ―Tower Works –Final project‖
These rather unsatisfactory results can be explained by the insufficient amount of sunlight at the site, the
presence of cast shadows (obstructions), the inappropriate orientations of the façades and above all by
the impact of the open courtyards of the project. In fact, the ―Draft project‖ offered more inside open
space, whereas the ―Final project‖ led to the filling of these spaces by buildings. As a consequence in
Winter 70% of the façades do not allow for an optimal passive heating. Furthermore, the placement, the
shape and the dimensions of more than 60% of the openings are restricted and consequently do not
Tower Works
Daylighting
viability
Passive solar
viability
Solar thermal
viability
BiPV
viability
Façades
(annual)
Façades
(Winter)
Façades
(Winter)
Roofs
(annual)
Façades
(annual)
Roofs
(annual)
Façades
(annual)
Tower Works
Draft project 65.5% 51.4% 58.7% 96.3% 62.7% 0% 18.7
Tower Works
Final project 38.4% 27.3% 30.1% 88.2% 33.2% 6% 3.1%
∆ Draft - Final 27% 24.1% 28.6% 8.1% 29.5% -6% 15.6%
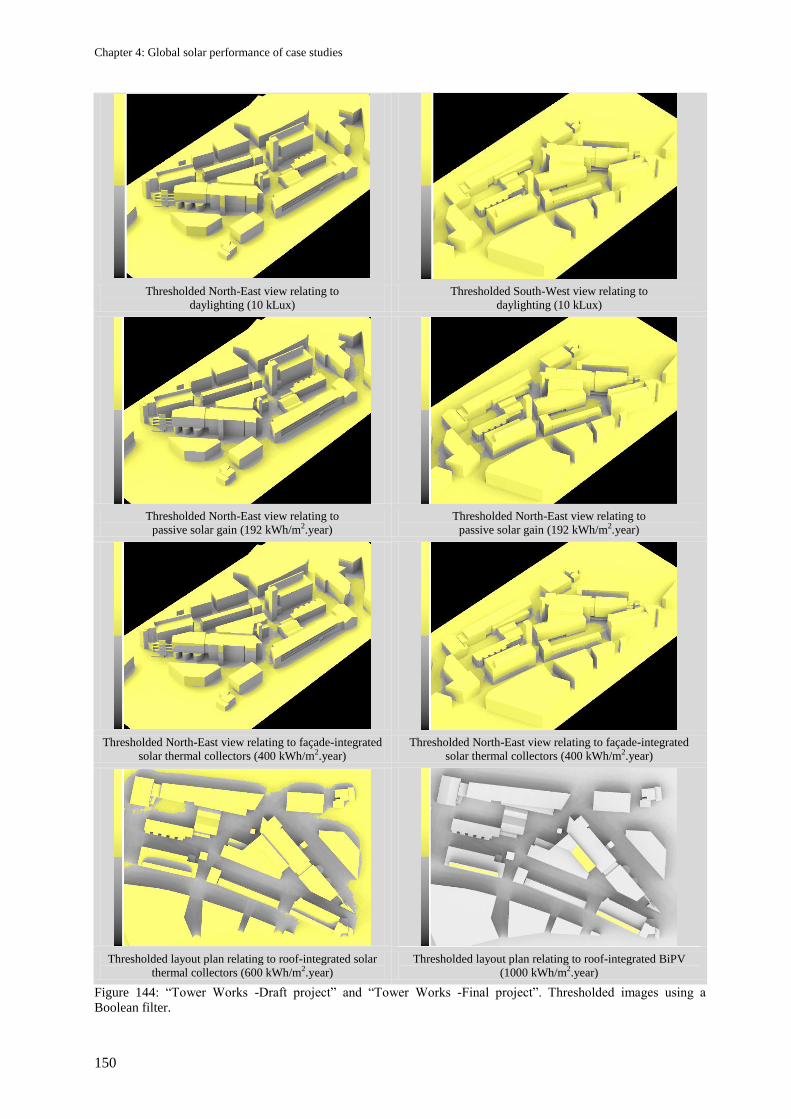
Chapter 4: Global solar performance of case studies
150
Thresholded North-East view relating to
daylighting (10 kLux)
Thresholded South-West view relating to
daylighting (10 kLux)
Thresholded North-East view relating to
passive solar gain (192 kWh/m2.year)
Thresholded North-East view relating to
passive solar gain (192 kWh/m2.year)
Thresholded North-East view relating to façade-integrated
solar thermal collectors (400 kWh/m2.year)
Thresholded North-East view relating to façade-integrated
solar thermal collectors (400 kWh/m2.year)
Thresholded layout plan relating to roof-integrated solar
thermal collectors (600 kWh/m2.year)
Thresholded layout plan relating to roof-integrated BiPV
(1000 kWh/m2.year)
Figure 144: ―Tower Works -Draft project‖ and ―Tower Works -Final project‖. Thresholded images using a
Boolean filter.
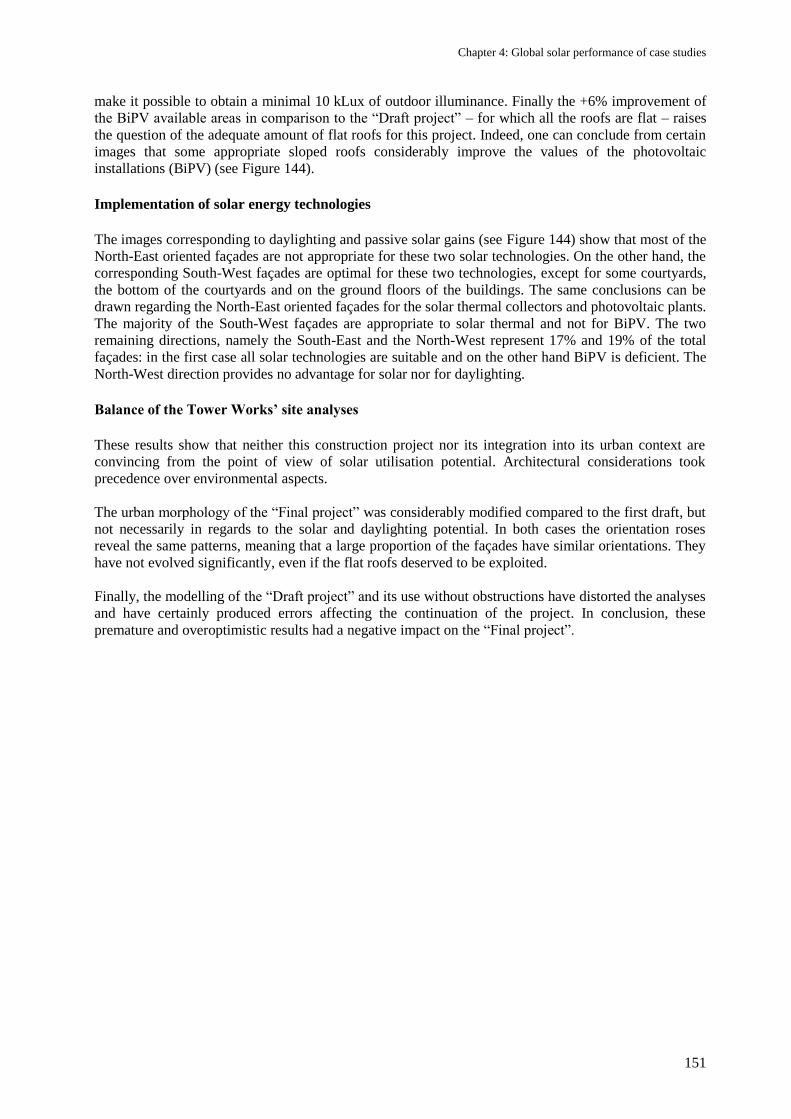
Chapter 4: Global solar performance of case studies
151
make it possible to obtain a minimal 10 kLux of outdoor illuminance. Finally the +6% improvement of
the BiPV available areas in comparison to the ―Draft project‖ – for which all the roofs are flat – raises
the question of the adequate amount of flat roofs for this project. Indeed, one can conclude from certain
images that some appropriate sloped roofs considerably improve the values of the photovoltaic
installations (BiPV) (see Figure 144).
Implementation of solar energy technologies
The images corresponding to daylighting and passive solar gains (see Figure 144) show that most of the
North-East oriented façades are not appropriate for these two solar technologies. On the other hand, the
corresponding South-West façades are optimal for these two technologies, except for some courtyards,
the bottom of the courtyards and on the ground floors of the buildings. The same conclusions can be
drawn regarding the North-East oriented façades for the solar thermal collectors and photovoltaic plants.
The majority of the South-West façades are appropriate to solar thermal and not for BiPV. The two
remaining directions, namely the South-East and the North-West represent 17% and 19% of the total
façades: in the first case all solar technologies are suitable and on the other hand BiPV is deficient. The
North-West direction provides no advantage for solar nor for daylighting.
Balance of the Tower Works’ site analyses
These results show that neither this construction project nor its integration into its urban context are
convincing from the point of view of solar utilisation potential. Architectural considerations took
precedence over environmental aspects.
The urban morphology of the ―Final project‖ was considerably modified compared to the first draft, but
not necessarily in regards to the solar and daylighting potential. In both cases the orientation roses
reveal the same patterns, meaning that a large proportion of the façades have similar orientations. They
have not evolved significantly, even if the flat roofs deserved to be exploited.
Finally, the modelling of the ―Draft project‖ and its use without obstructions have distorted the analyses
and have certainly produced errors affecting the continuation of the project. In conclusion, these
premature and overoptimistic results had a negative impact on the ―Final project‖.
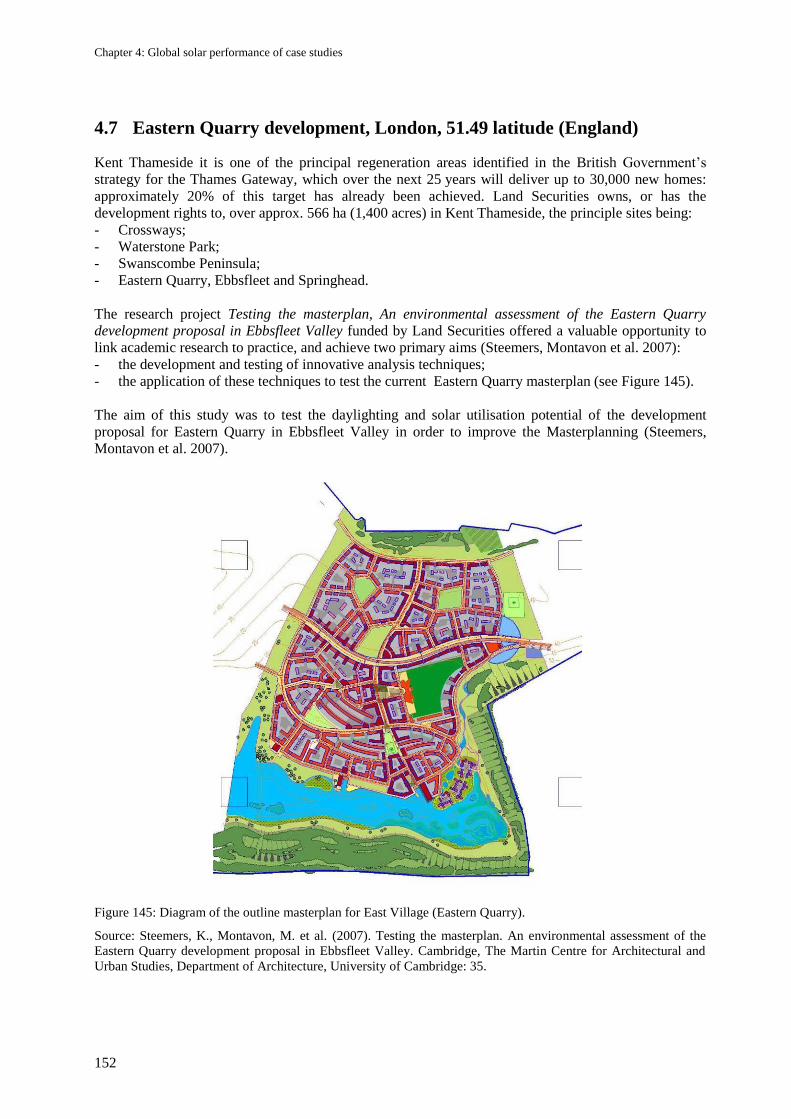
Chapter 4: Global solar performance of case studies
152
4.7 Eastern Quarry development, London, 51.49 latitude (England)
Kent Thameside it is one of the principal regeneration areas identified in the British Government‘s
strategy for the Thames Gateway, which over the next 25 years will deliver up to 30,000 new homes:
approximately 20% of this target has already been achieved. Land Securities owns, or has the
development rights to, over approx. 566 ha (1,400 acres) in Kent Thameside, the principle sites being:
- Crossways;
- Waterstone Park;
- Swanscombe Peninsula;
- Eastern Quarry, Ebbsfleet and Springhead.
The research project Testing the masterplan, An environmental assessment of the Eastern Quarry
development proposal in Ebbsfleet Valley funded by Land Securities offered a valuable opportunity to
link academic research to practice, and achieve two primary aims (Steemers, Montavon et al. 2007):
- the development and testing of innovative analysis techniques;
- the application of these techniques to test the current Eastern Quarry masterplan (see Figure 145).
The aim of this study was to test the daylighting and solar utilisation potential of the development
proposal for Eastern Quarry in Ebbsfleet Valley in order to improve the Masterplanning (Steemers,
Montavon et al. 2007).
Figure 145: Diagram of the outline masterplan for East Village (Eastern Quarry).
Source: Steemers, K., Montavon, M. et al. (2007). Testing the masterplan. An environmental assessment of the
Eastern Quarry development proposal in Ebbsfleet Valley. Cambridge, The Martin Centre for Architectural and
Urban Studies, Department of Architecture, University of Cambridge: 35.
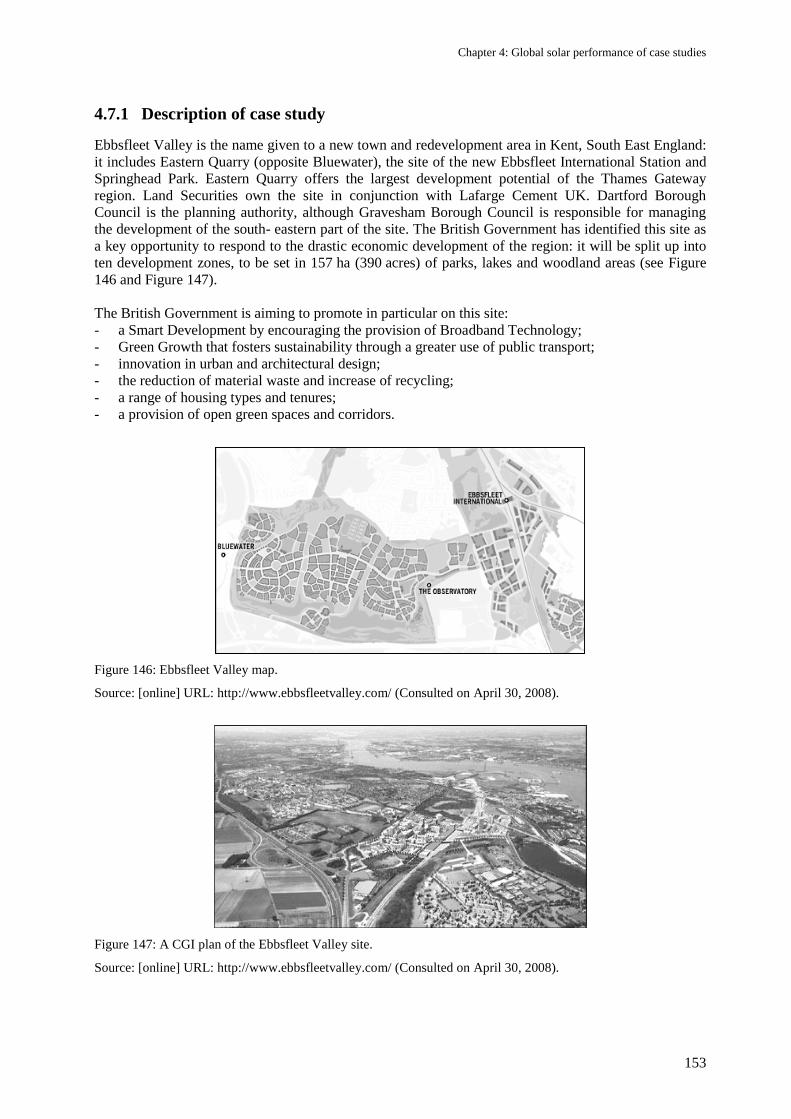
Chapter 4: Global solar performance of case studies
153
4.7.1 Description of case study
Ebbsfleet Valley is the name given to a new town and redevelopment area in Kent, South East England:
it includes Eastern Quarry (opposite Bluewater), the site of the new Ebbsfleet International Station and
Springhead Park. Eastern Quarry offers the largest development potential of the Thames Gateway
region. Land Securities own the site in conjunction with Lafarge Cement UK. Dartford Borough
Council is the planning authority, although Gravesham Borough Council is responsible for managing
the development of the south- eastern part of the site. The British Government has identified this site as
a key opportunity to respond to the drastic economic development of the region: it will be split up into
ten development zones, to be set in 157 ha (390 acres) of parks, lakes and woodland areas (see Figure
146 and Figure 147).
The British Government is aiming to promote in particular on this site:
- a Smart Development by encouraging the provision of Broadband Technology;
- Green Growth that fosters sustainability through a greater use of public transport;
- innovation in urban and architectural design;
- the reduction of material waste and increase of recycling;
- a range of housing types and tenures;
- a provision of open green spaces and corridors.
Figure 146: Ebbsfleet Valley map.
Source: [online] URL: http://www.ebbsfleetvalley.com/ (Consulted on April 30, 2008).
Figure 147: A CGI plan of the Ebbsfleet Valley site.
Source: [online] URL: http://www.ebbsfleetvalley.com/ (Consulted on April 30, 2008).
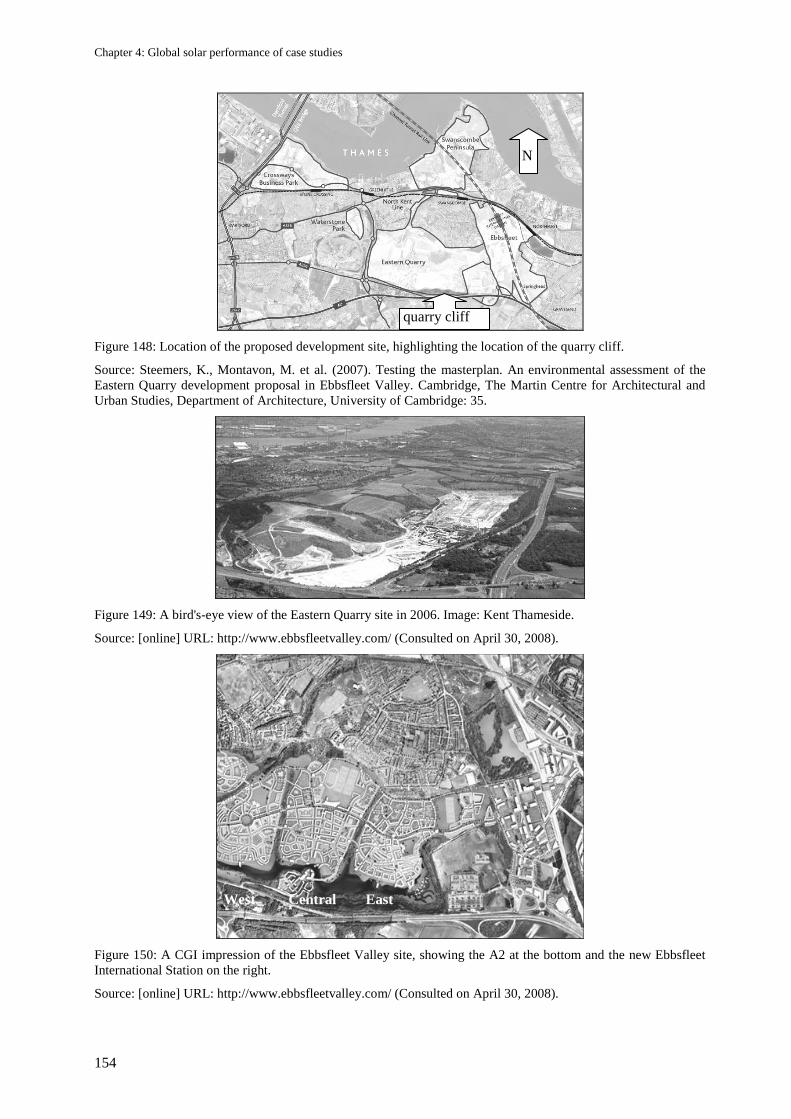
Chapter 4: Global solar performance of case studies
154
Figure 148: Location of the proposed development site, highlighting the location of the quarry cliff.
Source: Steemers, K., Montavon, M. et al. (2007). Testing the masterplan. An environmental assessment of the
Eastern Quarry development proposal in Ebbsfleet Valley. Cambridge, The Martin Centre for Architectural and
Urban Studies, Department of Architecture, University of Cambridge: 35.
Figure 149: A bird's-eye view of the Eastern Quarry site in 2006. Image: Kent Thameside.
Source: [online] URL: http://www.ebbsfleetvalley.com/ (Consulted on April 30, 2008).
Figure 150: A CGI impression of the Ebbsfleet Valley site, showing the A2 at the bottom and the new Ebbsfleet
International Station on the right.
Source: [online] URL: http://www.ebbsfleetvalley.com/ (Consulted on April 30, 2008).
quarry cliff
N
West Central East
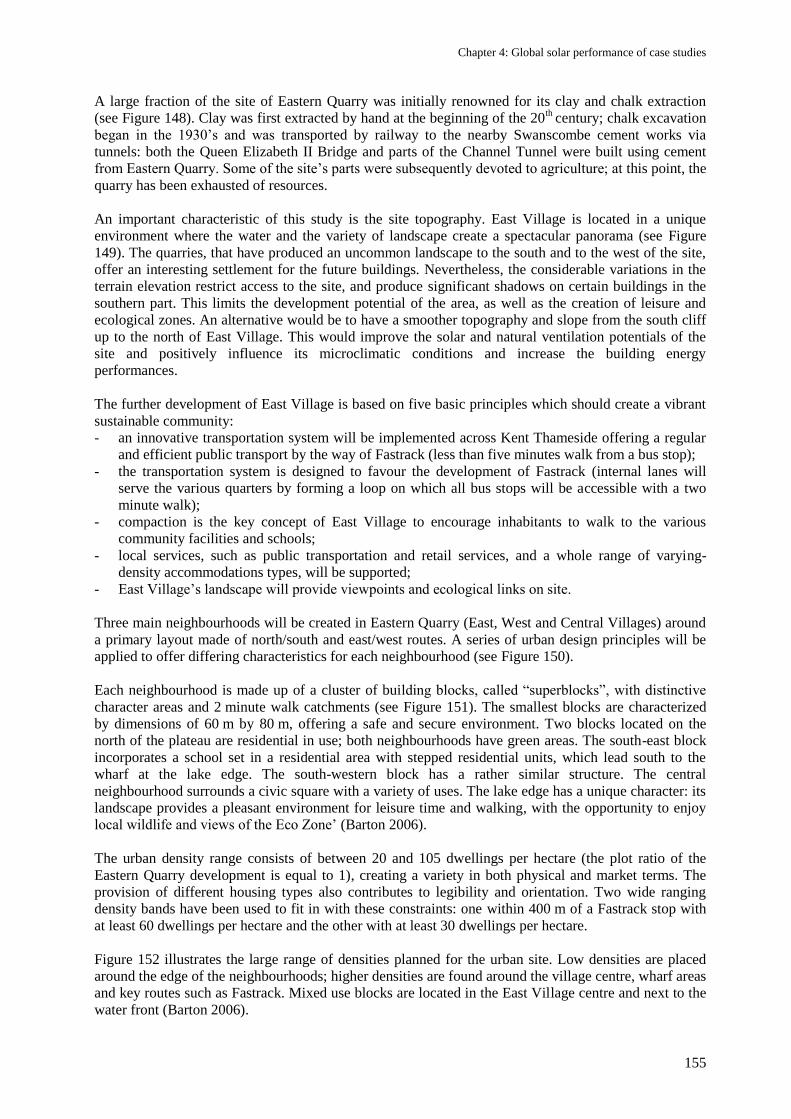
Chapter 4: Global solar performance of case studies
155
A large fraction of the site of Eastern Quarry was initially renowned for its clay and chalk extraction
(see Figure 148). Clay was first extracted by hand at the beginning of the 20th
century; chalk excavation
began in the 1930‘s and was transported by railway to the nearby Swanscombe cement works via
tunnels: both the Queen Elizabeth II Bridge and parts of the Channel Tunnel were built using cement
from Eastern Quarry. Some of the site‘s parts were subsequently devoted to agriculture; at this point, the
quarry has been exhausted of resources.
An important characteristic of this study is the site topography. East Village is located in a unique
environment where the water and the variety of landscape create a spectacular panorama (see Figure
149). The quarries, that have produced an uncommon landscape to the south and to the west of the site,
offer an interesting settlement for the future buildings. Nevertheless, the considerable variations in the
terrain elevation restrict access to the site, and produce significant shadows on certain buildings in the
southern part. This limits the development potential of the area, as well as the creation of leisure and
ecological zones. An alternative would be to have a smoother topography and slope from the south cliff
up to the north of East Village. This would improve the solar and natural ventilation potentials of the
site and positively influence its microclimatic conditions and increase the building energy
performances.
The further development of East Village is based on five basic principles which should create a vibrant
sustainable community:
- an innovative transportation system will be implemented across Kent Thameside offering a regular
and efficient public transport by the way of Fastrack (less than five minutes walk from a bus stop);
- the transportation system is designed to favour the development of Fastrack (internal lanes will
serve the various quarters by forming a loop on which all bus stops will be accessible with a two
minute walk);
- compaction is the key concept of East Village to encourage inhabitants to walk to the various
community facilities and schools;
- local services, such as public transportation and retail services, and a whole range of varying-
density accommodations types, will be supported;
- East Village‘s landscape will provide viewpoints and ecological links on site.
Three main neighbourhoods will be created in Eastern Quarry (East, West and Central Villages) around
a primary layout made of north/south and east/west routes. A series of urban design principles will be
applied to offer differing characteristics for each neighbourhood (see Figure 150).
Each neighbourhood is made up of a cluster of building blocks, called ―superblocks‖, with distinctive
character areas and 2 minute walk catchments (see Figure 151). The smallest blocks are characterized
by dimensions of 60 m by 80 m, offering a safe and secure environment. Two blocks located on the
north of the plateau are residential in use; both neighbourhoods have green areas. The south-east block
incorporates a school set in a residential area with stepped residential units, which lead south to the
wharf at the lake edge. The south-western block has a rather similar structure. The central
neighbourhood surrounds a civic square with a variety of uses. The lake edge has a unique character: its
landscape provides a pleasant environment for leisure time and walking, with the opportunity to enjoy
local wildlife and views of the Eco Zone‘ (Barton 2006).
The urban density range consists of between 20 and 105 dwellings per hectare (the plot ratio of the
Eastern Quarry development is equal to 1), creating a variety in both physical and market terms. The
provision of different housing types also contributes to legibility and orientation. Two wide ranging
density bands have been used to fit in with these constraints: one within 400 m of a Fastrack stop with
at least 60 dwellings per hectare and the other with at least 30 dwellings per hectare.
Figure 152 illustrates the large range of densities planned for the urban site. Low densities are placed
around the edge of the neighbourhoods; higher densities are found around the village centre, wharf areas
and key routes such as Fastrack. Mixed use blocks are located in the East Village centre and next to the
water front (Barton 2006).
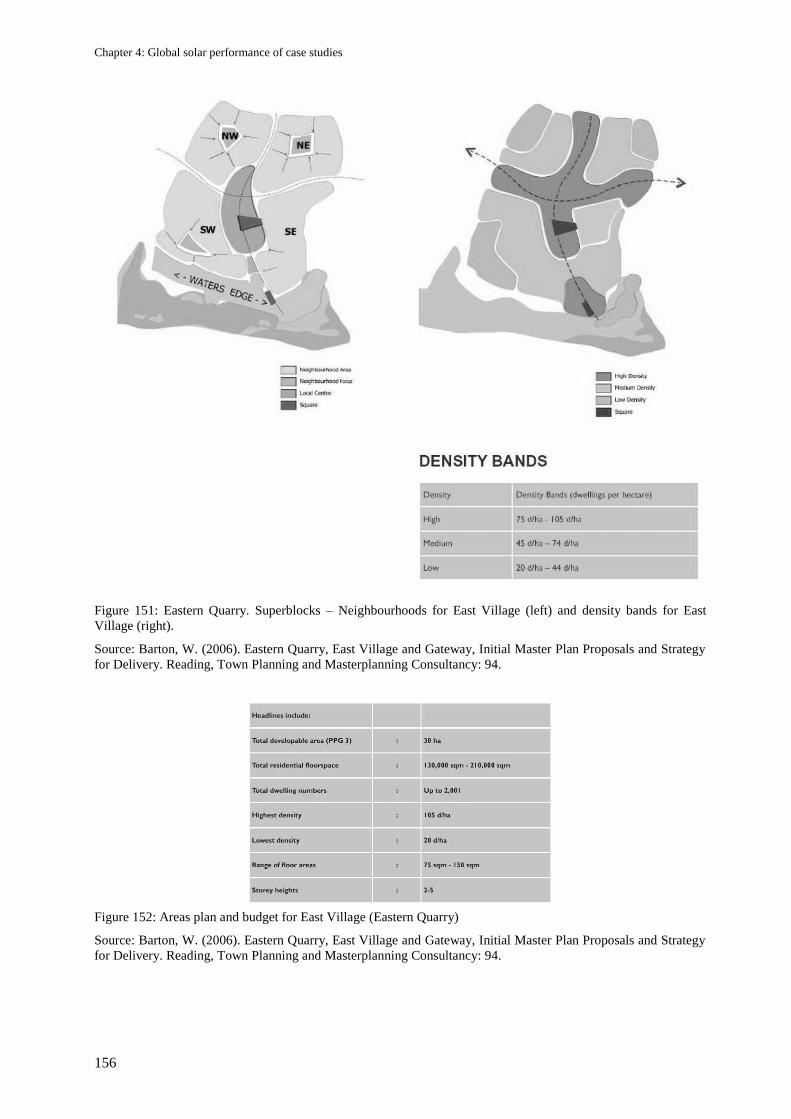
Chapter 4: Global solar performance of case studies
156
Figure 151: Eastern Quarry. Superblocks – Neighbourhoods for East Village (left) and density bands for East
Village (right).
Source: Barton, W. (2006). Eastern Quarry, East Village and Gateway, Initial Master Plan Proposals and Strategy
for Delivery. Reading, Town Planning and Masterplanning Consultancy: 94.
Figure 152: Areas plan and budget for East Village (Eastern Quarry)
Source: Barton, W. (2006). Eastern Quarry, East Village and Gateway, Initial Master Plan Proposals and Strategy
for Delivery. Reading, Town Planning and Masterplanning Consultancy: 94.
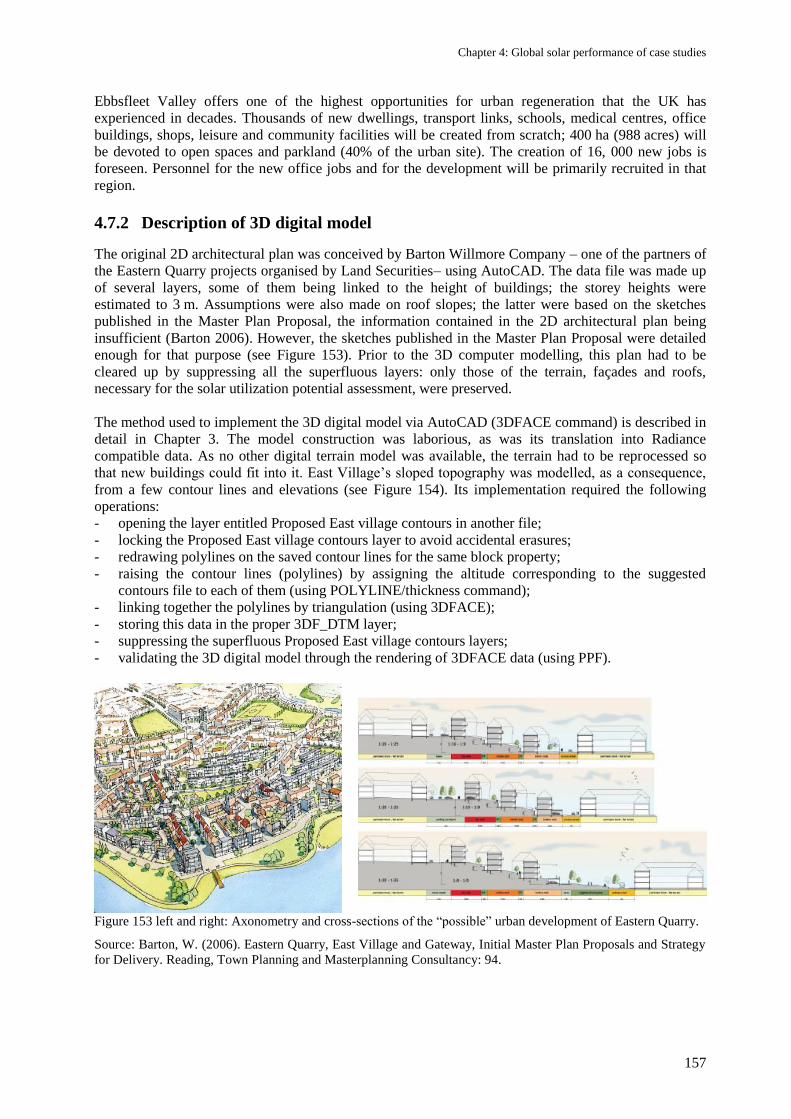
Chapter 4: Global solar performance of case studies
157
Ebbsfleet Valley offers one of the highest opportunities for urban regeneration that the UK has
experienced in decades. Thousands of new dwellings, transport links, schools, medical centres, office
buildings, shops, leisure and community facilities will be created from scratch; 400 ha (988 acres) will
be devoted to open spaces and parkland (40% of the urban site). The creation of 16, 000 new jobs is
foreseen. Personnel for the new office jobs and for the development will be primarily recruited in that
region.
4.7.2 Description of 3D digital model
The original 2D architectural plan was conceived by Barton Willmore Company – one of the partners of
the Eastern Quarry projects organised by Land Securities– using AutoCAD. The data file was made up
of several layers, some of them being linked to the height of buildings; the storey heights were
estimated to 3 m. Assumptions were also made on roof slopes; the latter were based on the sketches
published in the Master Plan Proposal, the information contained in the 2D architectural plan being
insufficient (Barton 2006). However, the sketches published in the Master Plan Proposal were detailed
enough for that purpose (see Figure 153). Prior to the 3D computer modelling, this plan had to be
cleared up by suppressing all the superfluous layers: only those of the terrain, façades and roofs,
necessary for the solar utilization potential assessment, were preserved.
The method used to implement the 3D digital model via AutoCAD (3DFACE command) is described in
detail in Chapter 3. The model construction was laborious, as was its translation into Radiance
compatible data. As no other digital terrain model was available, the terrain had to be reprocessed so
that new buildings could fit into it. East Village‘s sloped topography was modelled, as a consequence,
from a few contour lines and elevations (see Figure 154). Its implementation required the following
operations:
- opening the layer entitled Proposed East village contours in another file;
- locking the Proposed East village contours layer to avoid accidental erasures;
- redrawing polylines on the saved contour lines for the same block property;
- raising the contour lines (polylines) by assigning the altitude corresponding to the suggested
contours file to each of them (using POLYLINE/thickness command);
- linking together the polylines by triangulation (using 3DFACE);
- storing this data in the proper 3DF_DTM layer;
- suppressing the superfluous Proposed East village contours layers;
- validating the 3D digital model through the rendering of 3DFACE data (using PPF).
Figure 153 left and right: Axonometry and cross-sections of the ―possible‖ urban development of Eastern Quarry.
Source: Barton, W. (2006). Eastern Quarry, East Village and Gateway, Initial Master Plan Proposals and Strategy
for Delivery. Reading, Town Planning and Masterplanning Consultancy: 94.
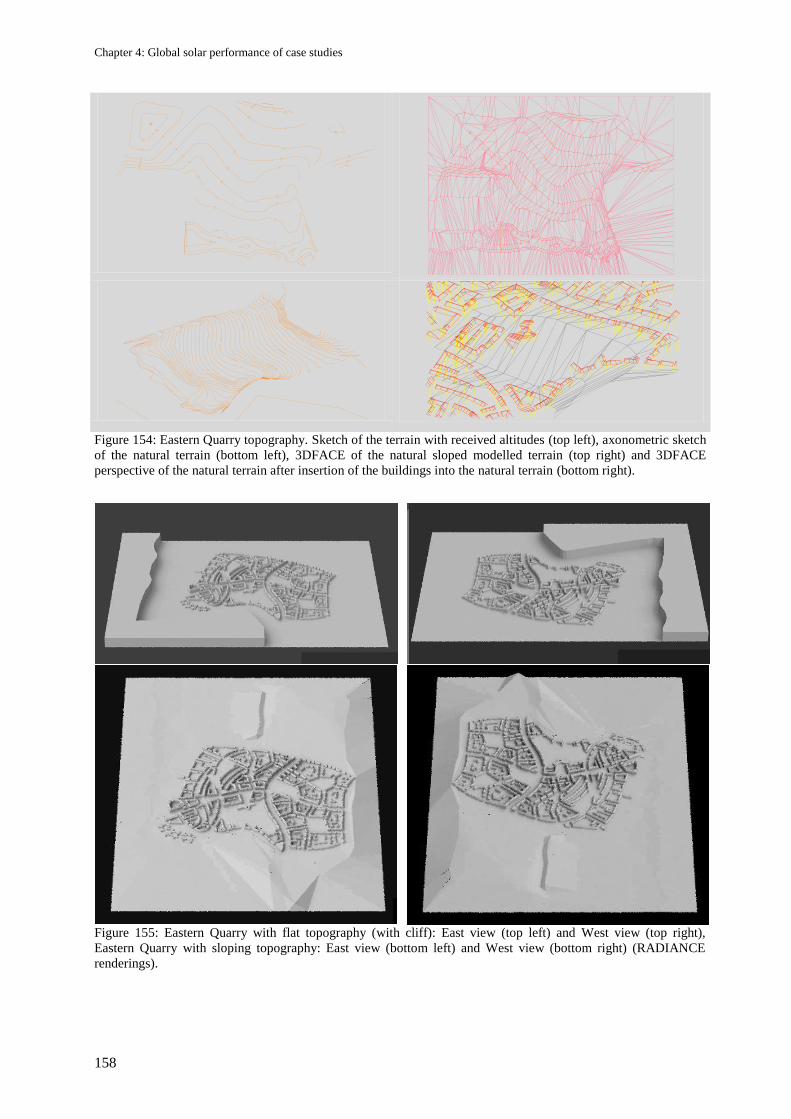
Chapter 4: Global solar performance of case studies
158
Figure 154: Eastern Quarry topography. Sketch of the terrain with received altitudes (top left), axonometric sketch
of the natural terrain (bottom left), 3DFACE of the natural sloped modelled terrain (top right) and 3DFACE
perspective of the natural terrain after insertion of the buildings into the natural terrain (bottom right).
Figure 155: Eastern Quarry with flat topography (with cliff): East view (top left) and West view (top right),
Eastern Quarry with sloping topography: East view (bottom left) and West view (bottom right) (RADIANCE
renderings).
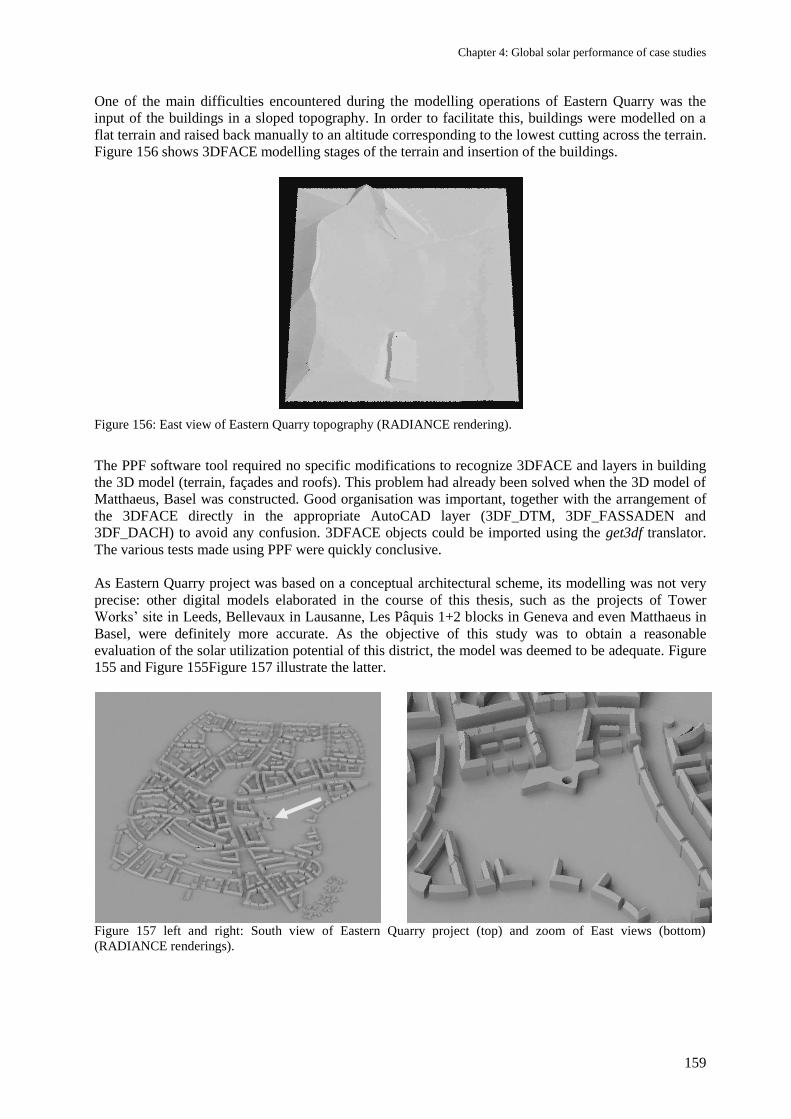
Chapter 4: Global solar performance of case studies
159
One of the main difficulties encountered during the modelling operations of Eastern Quarry was the
input of the buildings in a sloped topography. In order to facilitate this, buildings were modelled on a
flat terrain and raised back manually to an altitude corresponding to the lowest cutting across the terrain.
Figure 156 shows 3DFACE modelling stages of the terrain and insertion of the buildings.
Figure 156: East view of Eastern Quarry topography (RADIANCE rendering).
The PPF software tool required no specific modifications to recognize 3DFACE and layers in building
the 3D model (terrain, façades and roofs). This problem had already been solved when the 3D model of
Matthaeus, Basel was constructed. Good organisation was important, together with the arrangement of
the 3DFACE directly in the appropriate AutoCAD layer (3DF_DTM, 3DF_FASSADEN and
3DF_DACH) to avoid any confusion. 3DFACE objects could be imported using the get3df translator.
The various tests made using PPF were quickly conclusive.
As Eastern Quarry project was based on a conceptual architectural scheme, its modelling was not very
precise: other digital models elaborated in the course of this thesis, such as the projects of Tower
Works‘ site in Leeds, Bellevaux in Lausanne, Les Pâquis 1+2 blocks in Geneva and even Matthaeus in
Basel, were definitely more accurate. As the objective of this study was to obtain a reasonable
evaluation of the solar utilization potential of this district, the model was deemed to be adequate. Figure
155 and Figure 155Figure 157 illustrate the latter.
Figure 157 left and right: South view of Eastern Quarry project (top) and zoom of East views (bottom)
(RADIANCE renderings).
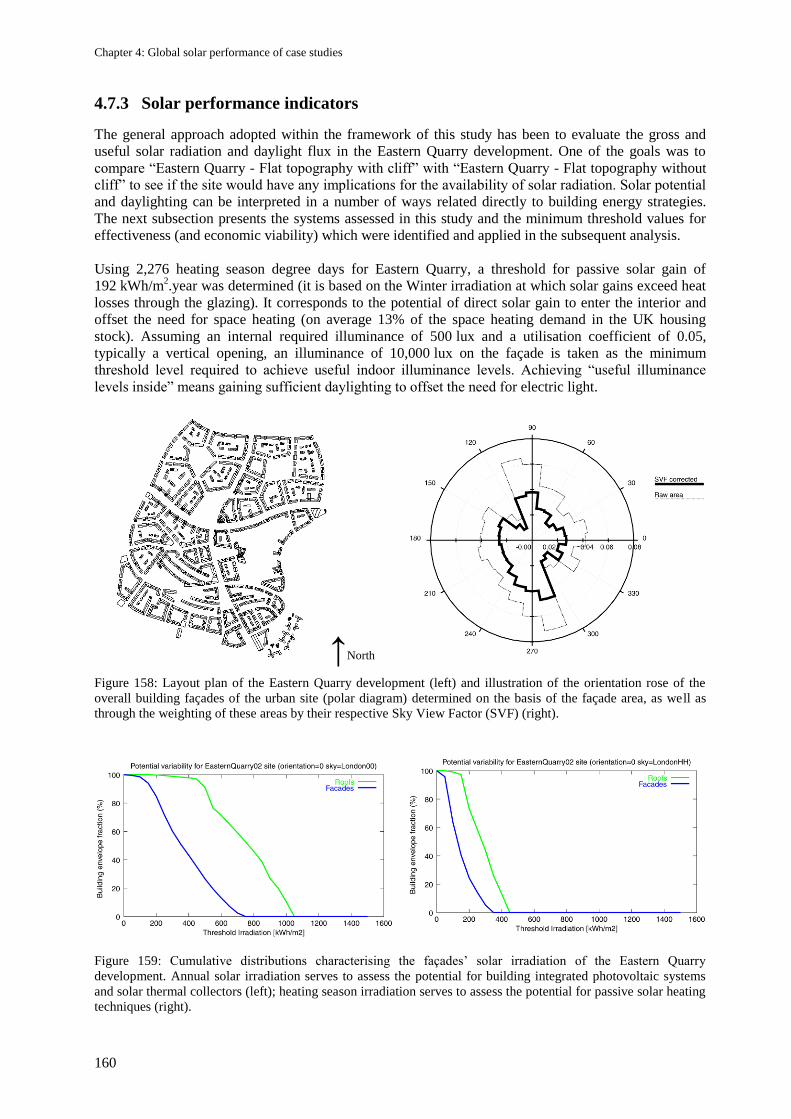
Chapter 4: Global solar performance of case studies
160
4.7.3 Solar performance indicators
The general approach adopted within the framework of this study has been to evaluate the gross and
useful solar radiation and daylight flux in the Eastern Quarry development. One of the goals was to
compare ―Eastern Quarry - Flat topography with cliff‖ with ―Eastern Quarry - Flat topography without
cliff‖ to see if the site would have any implications for the availability of solar radiation. Solar potential
and daylighting can be interpreted in a number of ways related directly to building energy strategies.
The next subsection presents the systems assessed in this study and the minimum threshold values for
effectiveness (and economic viability) which were identified and applied in the subsequent analysis.
Using 2,276 heating season degree days for Eastern Quarry, a threshold for passive solar gain of
192 kWh/m2.year was determined (it is based on the Winter irradiation at which solar gains exceed heat
losses through the glazing). It corresponds to the potential of direct solar gain to enter the interior and
offset the need for space heating (on average 13% of the space heating demand in the UK housing
stock). Assuming an internal required illuminance of 500 lux and a utilisation coefficient of 0.05,
typically a vertical opening, an illuminance of 10,000 lux on the façade is taken as the minimum
threshold level required to achieve useful indoor illuminance levels. Achieving ―useful illuminance
levels inside‖ means gaining sufficient daylighting to offset the need for electric light.
↑North
Figure 158: Layout plan of the Eastern Quarry development (left) and illustration of the orientation rose of the
overall building façades of the urban site (polar diagram) determined on the basis of the façade area, as well as
through the weighting of these areas by their respective Sky View Factor (SVF) (right).
Figure 159: Cumulative distributions characterising the façades‘ solar irradiation of the Eastern Quarry
development. Annual solar irradiation serves to assess the potential for building integrated photovoltaic systems
and solar thermal collectors (left); heating season irradiation serves to assess the potential for passive solar heating
techniques (right).
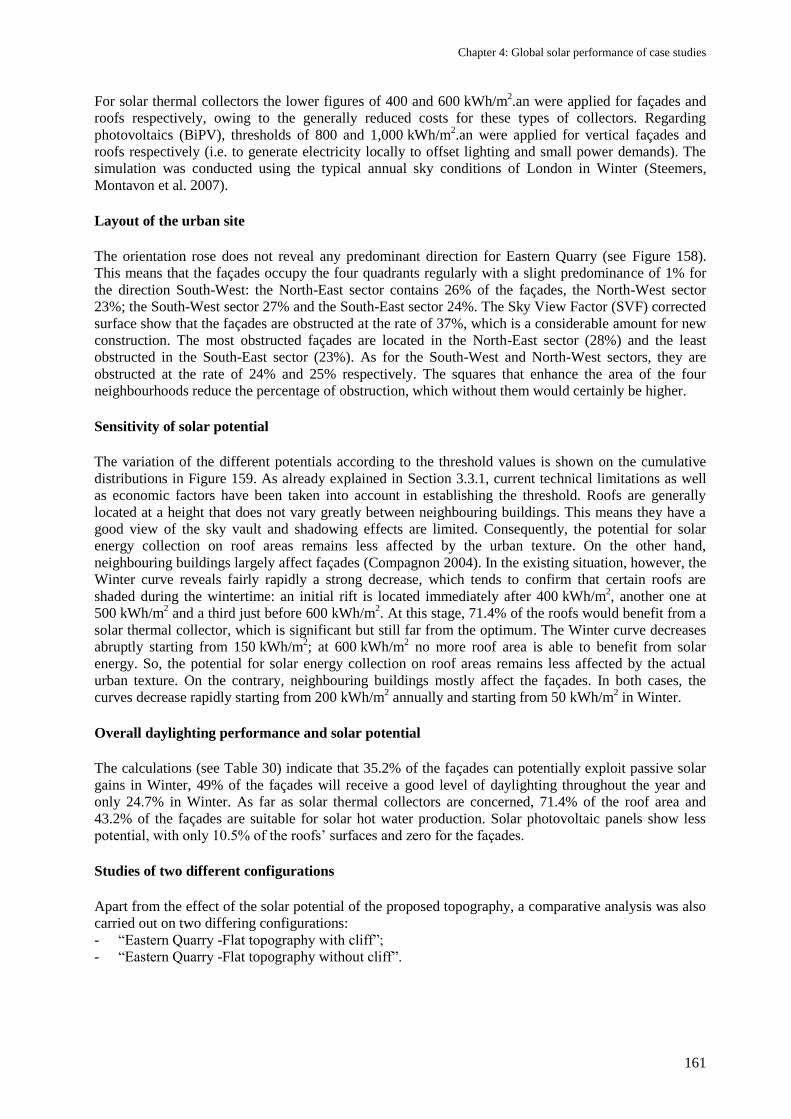
Chapter 4: Global solar performance of case studies
161
For solar thermal collectors the lower figures of 400 and 600 kWh/m2.an were applied for façades and
roofs respectively, owing to the generally reduced costs for these types of collectors. Regarding
photovoltaics (BiPV), thresholds of 800 and 1,000 kWh/m2.an were applied for vertical façades and
roofs respectively (i.e. to generate electricity locally to offset lighting and small power demands). The
simulation was conducted using the typical annual sky conditions of London in Winter (Steemers,
Montavon et al. 2007).
Layout of the urban site
The orientation rose does not reveal any predominant direction for Eastern Quarry (see Figure 158).
This means that the façades occupy the four quadrants regularly with a slight predominance of 1% for
the direction South-West: the North-East sector contains 26% of the façades, the North-West sector
23%; the South-West sector 27% and the South-East sector 24%. The Sky View Factor (SVF) corrected
surface show that the façades are obstructed at the rate of 37%, which is a considerable amount for new
construction. The most obstructed façades are located in the North-East sector (28%) and the least
obstructed in the South-East sector (23%). As for the South-West and North-West sectors, they are
obstructed at the rate of 24% and 25% respectively. The squares that enhance the area of the four
neighbourhoods reduce the percentage of obstruction, which without them would certainly be higher.
Sensitivity of solar potential
The variation of the different potentials according to the threshold values is shown on the cumulative
distributions in Figure 159. As already explained in Section 3.3.1, current technical limitations as well
as economic factors have been taken into account in establishing the threshold. Roofs are generally
located at a height that does not vary greatly between neighbouring buildings. This means they have a
good view of the sky vault and shadowing effects are limited. Consequently, the potential for solar
energy collection on roof areas remains less affected by the urban texture. On the other hand,
neighbouring buildings largely affect façades (Compagnon 2004). In the existing situation, however, the
Winter curve reveals fairly rapidly a strong decrease, which tends to confirm that certain roofs are
shaded during the wintertime: an initial rift is located immediately after 400 kWh/m2, another one at
500 kWh/m2 and a third just before 600 kWh/m
2. At this stage, 71.4% of the roofs would benefit from a
solar thermal collector, which is significant but still far from the optimum. The Winter curve decreases
abruptly starting from 150 kWh/m2; at 600 kWh/m
2 no more roof area is able to benefit from solar
energy. So, the potential for solar energy collection on roof areas remains less affected by the actual
urban texture. On the contrary, neighbouring buildings mostly affect the façades. In both cases, the
curves decrease rapidly starting from 200 kWh/m2 annually and starting from 50 kWh/m
2 in Winter.
Overall daylighting performance and solar potential
The calculations (see Table 30) indicate that 35.2% of the façades can potentially exploit passive solar
gains in Winter, 49% of the façades will receive a good level of daylighting throughout the year and
only 24.7% in Winter. As far as solar thermal collectors are concerned, 71.4% of the roof area and
43.2% of the façades are suitable for solar hot water production. Solar photovoltaic panels show less
potential, with only 10.5% of the roofs‘ surfaces and zero for the façades.
Studies of two different configurations
Apart from the effect of the solar potential of the proposed topography, a comparative analysis was also
carried out on two differing configurations:
- ―Eastern Quarry -Flat topography with cliff‖;
- ―Eastern Quarry -Flat topography without cliff‖.
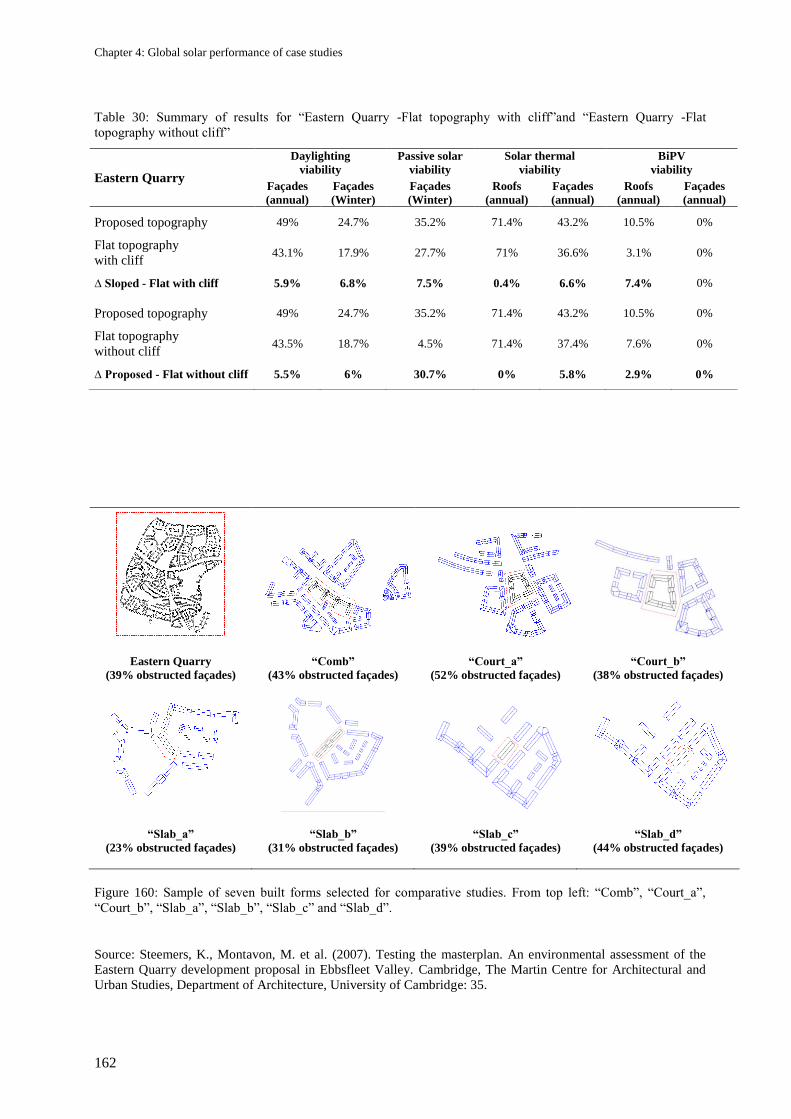
Chapter 4: Global solar performance of case studies
162
Table 30: Summary of results for ―Eastern Quarry -Flat topography with cliff‖and ―Eastern Quarry -Flat
topography without cliff‖
Eastern Quarry
Daylighting
viability
Passive solar
viability
Solar thermal
viability
BiPV
viability
Façades
(annual)
Façades
(Winter)
Façades
(Winter)
Roofs
(annual)
Façades
(annual)
Roofs
(annual)
Façades
(annual)
Proposed topography 49% 24.7% 35.2% 71.4% 43.2% 10.5% 0%
Flat topography
with cliff 43.1% 17.9% 27.7% 71% 36.6% 3.1% 0%
∆ Sloped - Flat with cliff 5.9% 6.8% 7.5% 0.4% 6.6% 7.4% 0%
Proposed topography 49% 24.7% 35.2% 71.4% 43.2% 10.5% 0%
Flat topography
without cliff 43.5% 18.7% 4.5% 71.4% 37.4% 7.6% 0%
∆ Proposed - Flat without cliff 5.5% 6% 30.7% 0% 5.8% 2.9% 0%
Eastern Quarry
(39% obstructed façades)
“Comb”
(43% obstructed façades)
“Court_a”
(52% obstructed façades)
“Court_b”
(38% obstructed façades)
“Slab_a”
(23% obstructed façades)
“Slab_b”
(31% obstructed façades)
“Slab_c”
(39% obstructed façades)
“Slab_d”
(44% obstructed façades)
Figure 160: Sample of seven built forms selected for comparative studies. From top left: ―Comb‖, ―Court_a‖,
―Court_b‖, ―Slab_a‖, ―Slab_b‖, ―Slab_c‖ and ―Slab_d‖.
Source: Steemers, K., Montavon, M. et al. (2007). Testing the masterplan. An environmental assessment of the
Eastern Quarry development proposal in Ebbsfleet Valley. Cambridge, The Martin Centre for Architectural and
Urban Studies, Department of Architecture, University of Cambridge: 35.
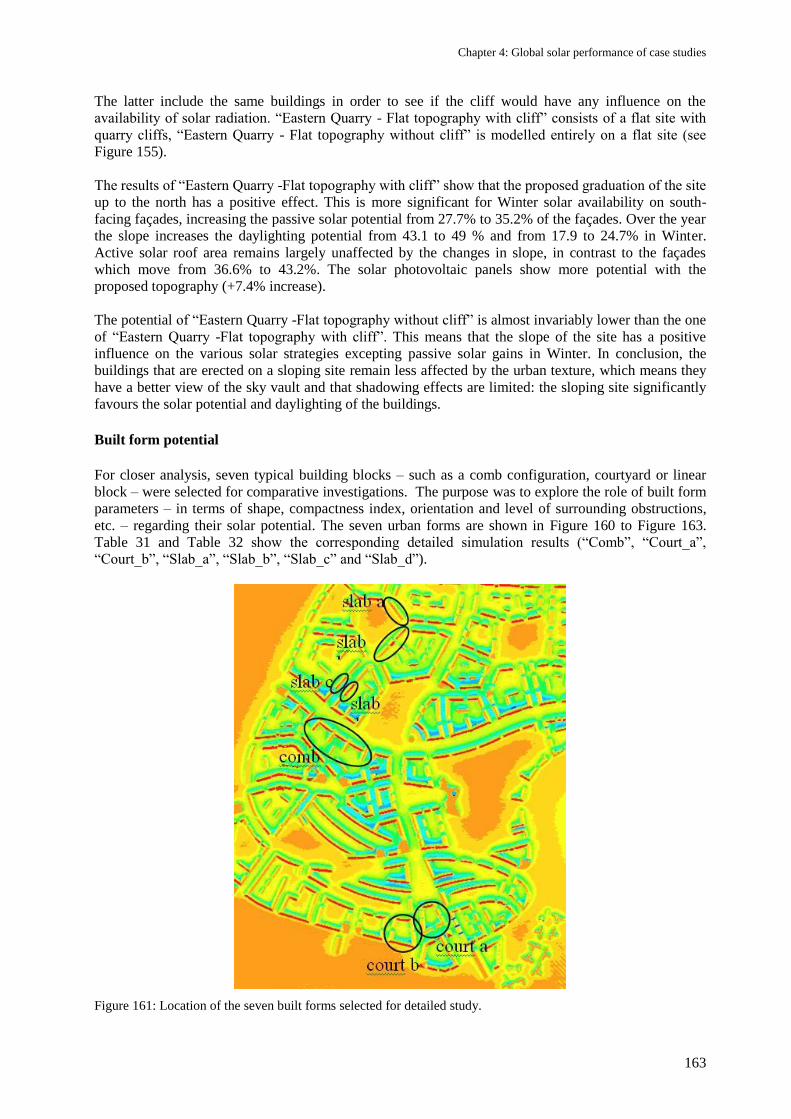
Chapter 4: Global solar performance of case studies
163
The latter include the same buildings in order to see if the cliff would have any influence on the
availability of solar radiation. ―Eastern Quarry - Flat topography with cliff‖ consists of a flat site with
quarry cliffs, ―Eastern Quarry - Flat topography without cliff‖ is modelled entirely on a flat site (see
Figure 155).
The results of ―Eastern Quarry -Flat topography with cliff‖ show that the proposed graduation of the site
up to the north has a positive effect. This is more significant for Winter solar availability on south-
facing façades, increasing the passive solar potential from 27.7% to 35.2% of the façades. Over the year
the slope increases the daylighting potential from 43.1 to 49 % and from 17.9 to 24.7% in Winter.
Active solar roof area remains largely unaffected by the changes in slope, in contrast to the façades
which move from 36.6% to 43.2%. The solar photovoltaic panels show more potential with the
proposed topography (+7.4% increase).
The potential of ―Eastern Quarry -Flat topography without cliff‖ is almost invariably lower than the one
of ―Eastern Quarry -Flat topography with cliff‖. This means that the slope of the site has a positive
influence on the various solar strategies excepting passive solar gains in Winter. In conclusion, the
buildings that are erected on a sloping site remain less affected by the urban texture, which means they
have a better view of the sky vault and that shadowing effects are limited: the sloping site significantly
favours the solar potential and daylighting of the buildings.
Built form potential
For closer analysis, seven typical building blocks – such as a comb configuration, courtyard or linear
block – were selected for comparative investigations. The purpose was to explore the role of built form
parameters – in terms of shape, compactness index, orientation and level of surrounding obstructions,
etc. – regarding their solar potential. The seven urban forms are shown in Figure 160 to Figure 163.
Table 31 and Table 32 show the corresponding detailed simulation results (―Comb‖, ―Court_a‖,
―Court_b‖, ―Slab_a‖, ―Slab_b‖, ―Slab_c‖ and ―Slab_d‖).
Figure 161: Location of the seven built forms selected for detailed study.
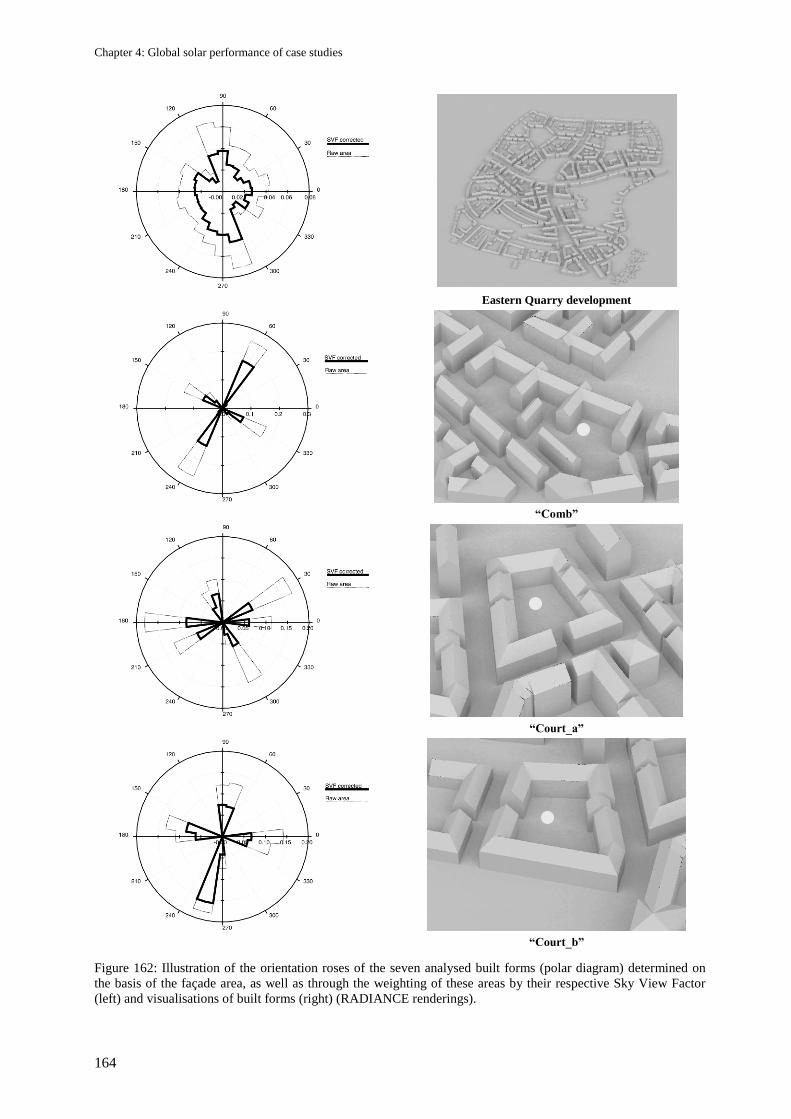
Chapter 4: Global solar performance of case studies
164
Eastern Quarry development
“Comb”
“Court_a”
“Court_b”
Figure 162: Illustration of the orientation roses of the seven analysed built forms (polar diagram) determined on
the basis of the façade area, as well as through the weighting of these areas by their respective Sky View Factor
(left) and visualisations of built forms (right) (RADIANCE renderings).
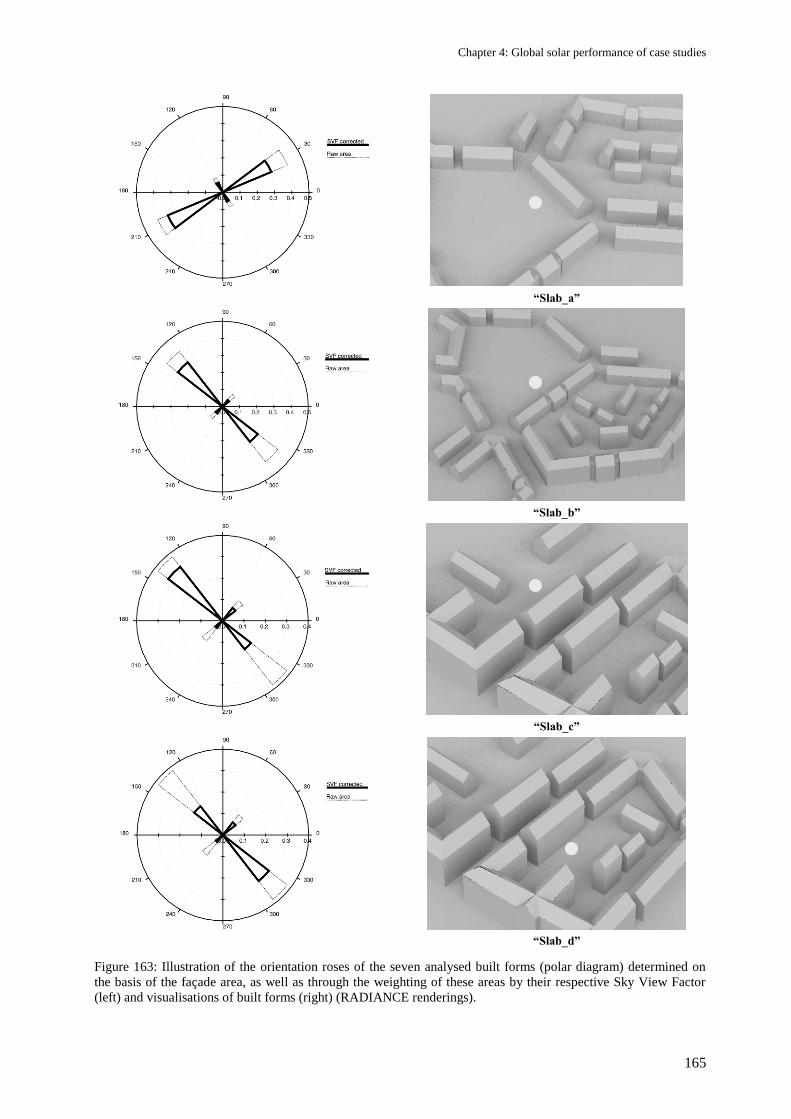
Chapter 4: Global solar performance of case studies
165
Figure 163: Illustration of the orientation roses of the seven analysed built forms (polar diagram) determined on
the basis of the façade area, as well as through the weighting of these areas by their respective Sky View Factor
(left) and visualisations of built forms (right) (RADIANCE renderings).
“Slab_a”
“Slab_b”
“Slab_c”
“Slab_d”
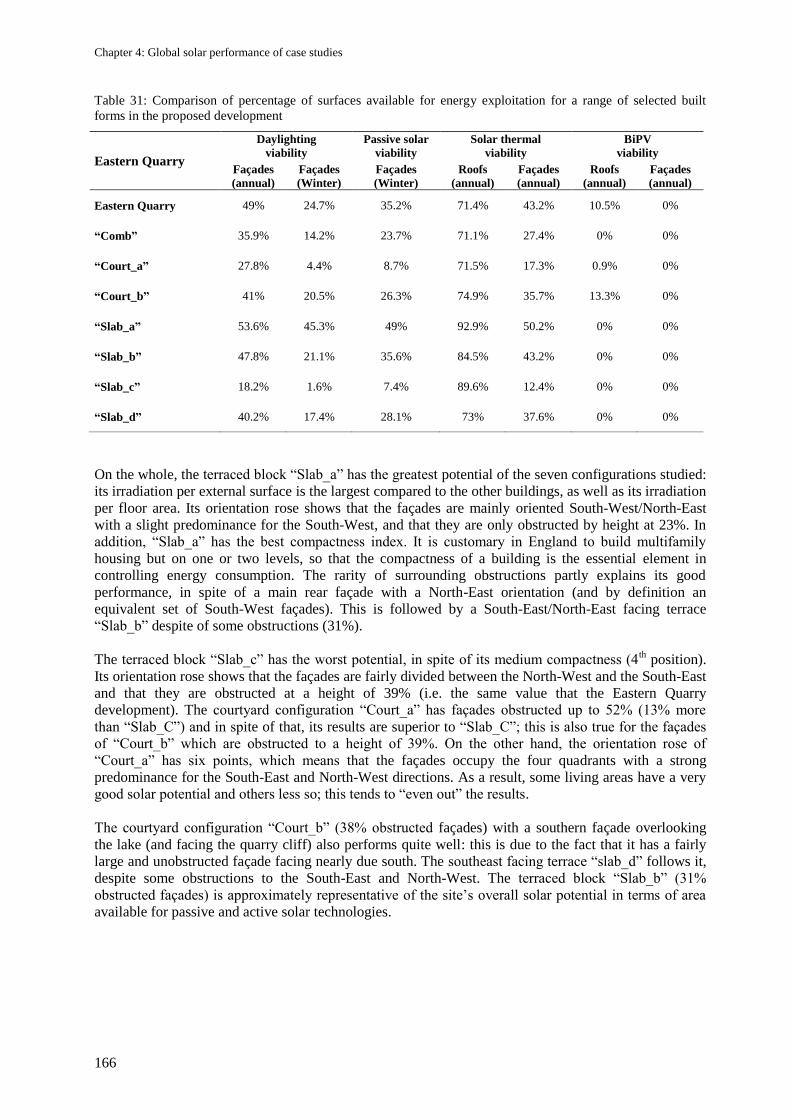
Chapter 4: Global solar performance of case studies
166
Table 31: Comparison of percentage of surfaces available for energy exploitation for a range of selected built
forms in the proposed development
Eastern Quarry
Daylighting
viability
Passive solar
viability
Solar thermal
viability
BiPV
viability
Façades
(annual)
Façades
(Winter)
Façades
(Winter)
Roofs
(annual)
Façades
(annual)
Roofs
(annual)
Façades
(annual)
Eastern Quarry 49% 24.7% 35.2% 71.4% 43.2% 10.5% 0%
“Comb” 35.9% 14.2% 23.7% 71.1% 27.4% 0% 0%
“Court_a” 27.8% 4.4% 8.7% 71.5% 17.3% 0.9% 0%
“Court_b” 41% 20.5% 26.3% 74.9% 35.7% 13.3% 0%
“Slab_a” 53.6% 45.3% 49% 92.9% 50.2% 0% 0%
“Slab_b” 47.8% 21.1% 35.6% 84.5% 43.2% 0% 0%
“Slab_c” 18.2% 1.6% 7.4% 89.6% 12.4% 0% 0%
“Slab_d” 40.2% 17.4% 28.1% 73% 37.6% 0% 0%
On the whole, the terraced block ―Slab_a‖ has the greatest potential of the seven configurations studied:
its irradiation per external surface is the largest compared to the other buildings, as well as its irradiation
per floor area. Its orientation rose shows that the façades are mainly oriented South-West/North-East
with a slight predominance for the South-West, and that they are only obstructed by height at 23%. In
addition, ―Slab_a‖ has the best compactness index. It is customary in England to build multifamily
housing but on one or two levels, so that the compactness of a building is the essential element in
controlling energy consumption. The rarity of surrounding obstructions partly explains its good
performance, in spite of a main rear façade with a North-East orientation (and by definition an
equivalent set of South-West façades). This is followed by a South-East/North-East facing terrace
―Slab_b‖ despite of some obstructions (31%).
The terraced block ―Slab_c‖ has the worst potential, in spite of its medium compactness (4th position).
Its orientation rose shows that the façades are fairly divided between the North-West and the South-East
and that they are obstructed at a height of 39% (i.e. the same value that the Eastern Quarry
development). The courtyard configuration ―Court_a‖ has façades obstructed up to 52% (13% more
than ―Slab_C‖) and in spite of that, its results are superior to ―Slab_C‖; this is also true for the façades
of ―Court_b‖ which are obstructed to a height of 39%. On the other hand, the orientation rose of
―Court_a‖ has six points, which means that the façades occupy the four quadrants with a strong
predominance for the South-East and North-West directions. As a result, some living areas have a very
good solar potential and others less so; this tends to ―even out‖ the results.
The courtyard configuration ―Court_b‖ (38% obstructed façades) with a southern façade overlooking
the lake (and facing the quarry cliff) also performs quite well: this is due to the fact that it has a fairly
large and unobstructed façade facing nearly due south. The southeast facing terrace ―slab_d‖ follows it,
despite some obstructions to the South-East and North-West. The terraced block ―Slab_b‖ (31%
obstructed façades) is approximately representative of the site‘s overall solar potential in terms of area
available for passive and active solar technologies.
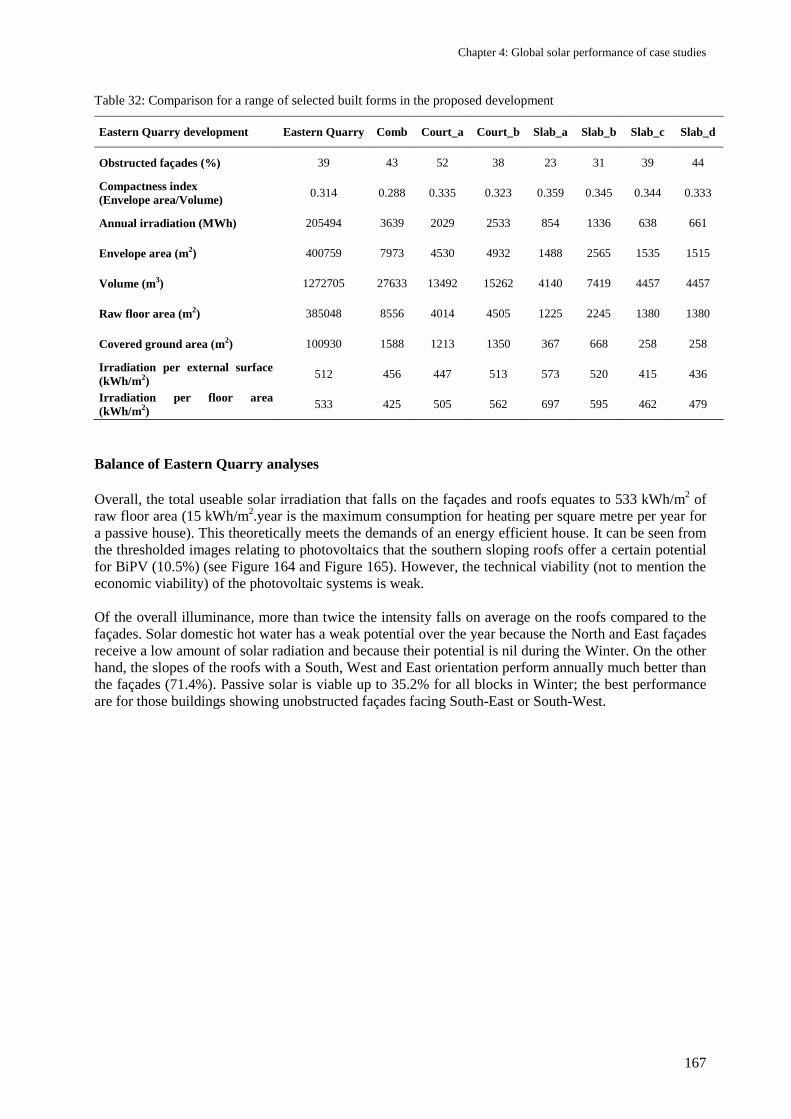
Chapter 4: Global solar performance of case studies
167
Table 32: Comparison for a range of selected built forms in the proposed development
Eastern Quarry development Eastern Quarry Comb Court_a Court_b Slab_a Slab_b Slab_c Slab_d
Obstructed façades (%) 39 43 52 38 23 31 39 44
Compactness index
(Envelope area/Volume) 0.314 0.288 0.335 0.323 0.359 0.345 0.344 0.333
Annual irradiation (MWh) 205494 3639 2029 2533 854 1336 638 661
Envelope area (m2) 400759 7973 4530 4932 1488 2565 1535 1515
Volume (m3) 1272705 27633 13492 15262 4140 7419 4457 4457
Raw floor area (m2) 385048 8556 4014 4505 1225 2245 1380 1380
Covered ground area (m2) 100930 1588 1213 1350 367 668 258 258
Irradiation per external surface
(kWh/m2) 512 456 447 513 573 520 415 436
Irradiation per floor area
(kWh/m2) 533 425 505 562 697 595 462 479
Balance of Eastern Quarry analyses
Overall, the total useable solar irradiation that falls on the façades and roofs equates to 533 kWh/m2 of
raw floor area (15 kWh/m2.year is the maximum consumption for heating per square metre per year for
a passive house). This theoretically meets the demands of an energy efficient house. It can be seen from
the thresholded images relating to photovoltaics that the southern sloping roofs offer a certain potential
for BiPV (10.5%) (see Figure 164 and Figure 165). However, the technical viability (not to mention the
economic viability) of the photovoltaic systems is weak.
Of the overall illuminance, more than twice the intensity falls on average on the roofs compared to the
façades. Solar domestic hot water has a weak potential over the year because the North and East façades
receive a low amount of solar radiation and because their potential is nil during the Winter. On the other
hand, the slopes of the roofs with a South, West and East orientation perform annually much better than
the façades (71.4%). Passive solar is viable up to 35.2% for all blocks in Winter; the best performance
are for those buildings showing unobstructed façades facing South-East or South-West.
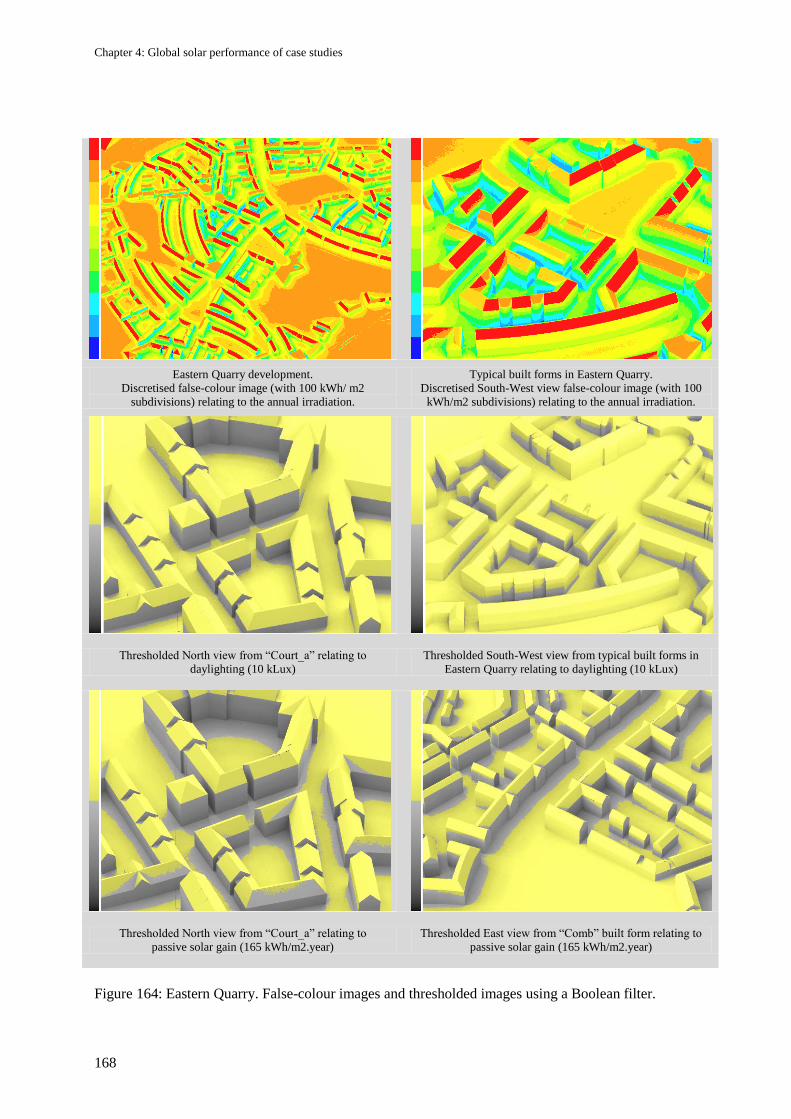
Chapter 4: Global solar performance of case studies
168
Figure 164: Eastern Quarry. False-colour images and thresholded images using a Boolean filter.
Eastern Quarry development.
Discretised false-colour image (with 100 kWh/ m2
subdivisions) relating to the annual irradiation.
Typical built forms in Eastern Quarry.
Discretised South-West view false-colour image (with 100
kWh/m2 subdivisions) relating to the annual irradiation.
Thresholded North view from ―Court_a‖ relating to
daylighting (10 kLux)
Thresholded South-West view from typical built forms in
Eastern Quarry relating to daylighting (10 kLux)
Thresholded North view from ―Court_a‖ relating to
passive solar gain (165 kWh/m2.year)
Thresholded East view from ―Comb‖ built form relating to
passive solar gain (165 kWh/m2.year)
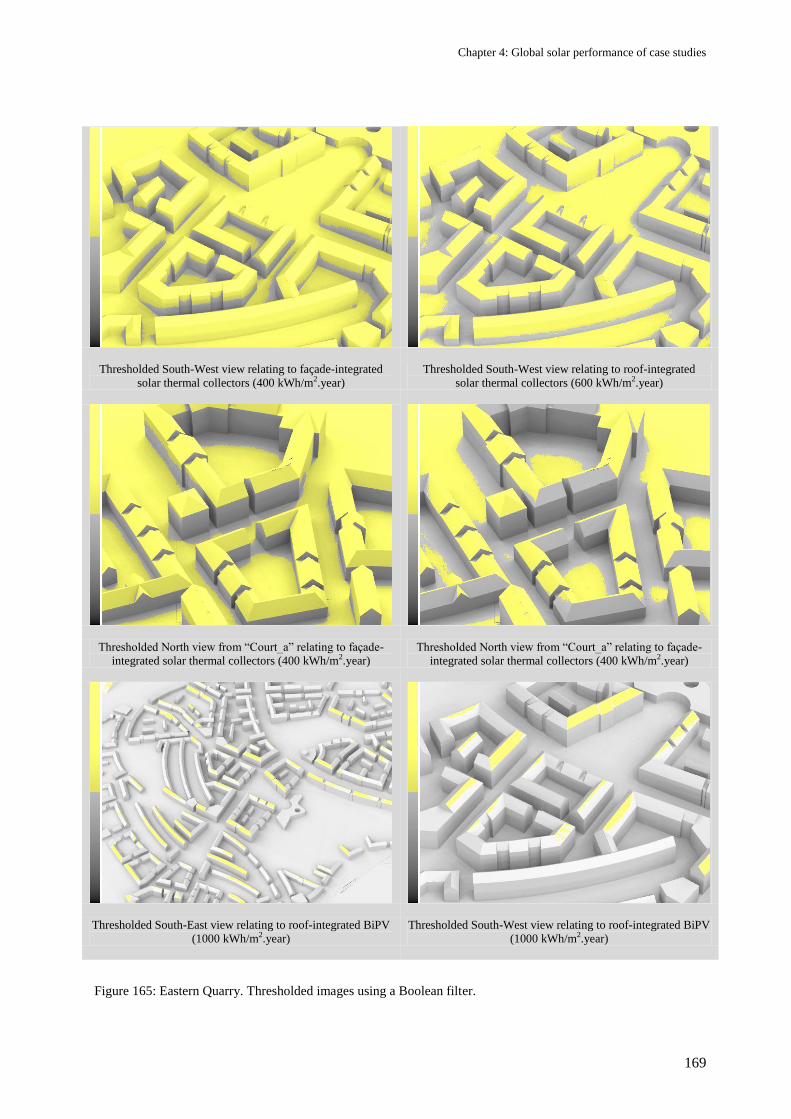
Chapter 4: Global solar performance of case studies
169
Thresholded South-West view relating to façade-integrated
solar thermal collectors (400 kWh/m2.year)
Thresholded South-West view relating to roof-integrated
solar thermal collectors (600 kWh/m2.year)
Thresholded North view from ―Court_a‖ relating to façade-
integrated solar thermal collectors (400 kWh/m2.year)
Thresholded North view from ―Court_a‖ relating to façade-
integrated solar thermal collectors (400 kWh/m2.year)
Thresholded South-East view relating to roof-integrated BiPV
(1000 kWh/m2.year)
Thresholded South-West view relating to roof-integrated BiPV
(1000 kWh/m2.year)
Figure 165: Eastern Quarry. Thresholded images using a Boolean filter.
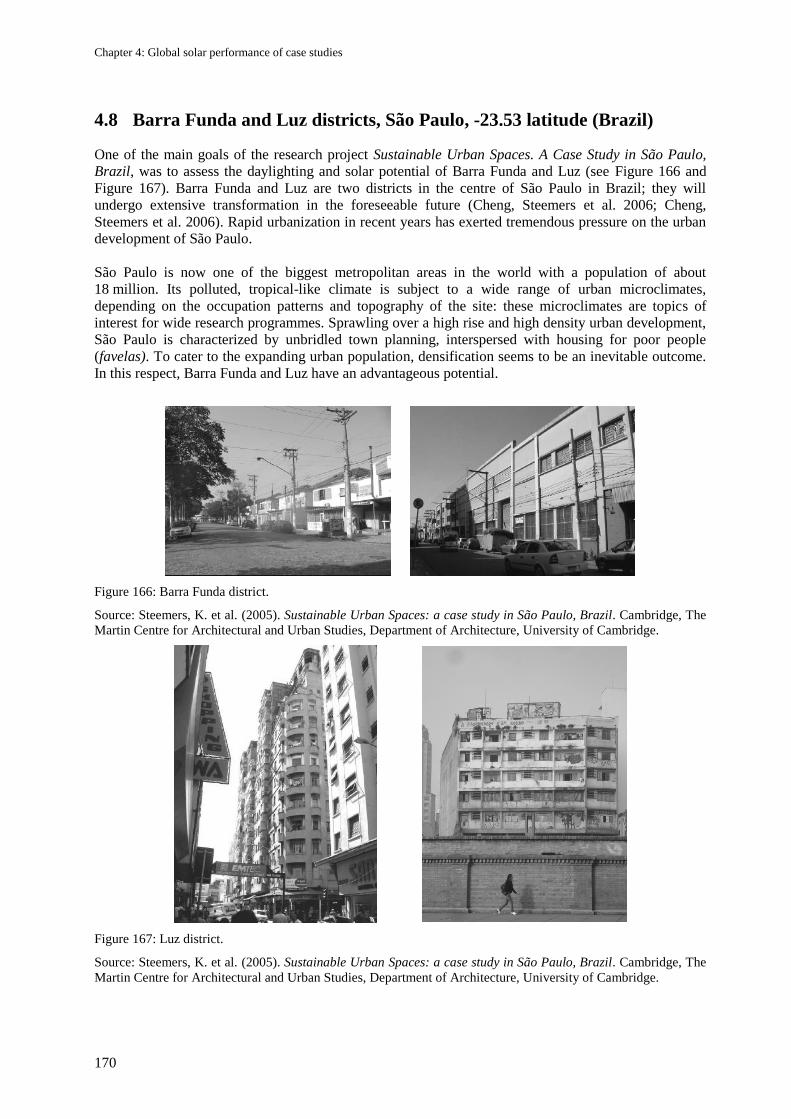
Chapter 4: Global solar performance of case studies
170
4.8 Barra Funda and Luz districts, São Paulo, -23.53 latitude (Brazil)
One of the main goals of the research project Sustainable Urban Spaces. A Case Study in São Paulo,
Brazil, was to assess the daylighting and solar potential of Barra Funda and Luz (see Figure 166 and
Figure 167). Barra Funda and Luz are two districts in the centre of São Paulo in Brazil; they will
undergo extensive transformation in the foreseeable future (Cheng, Steemers et al. 2006; Cheng,
Steemers et al. 2006). Rapid urbanization in recent years has exerted tremendous pressure on the urban
development of São Paulo.
São Paulo is now one of the biggest metropolitan areas in the world with a population of about
18 million. Its polluted, tropical-like climate is subject to a wide range of urban microclimates,
depending on the occupation patterns and topography of the site: these microclimates are topics of
interest for wide research programmes. Sprawling over a high rise and high density urban development,
São Paulo is characterized by unbridled town planning, interspersed with housing for poor people
(favelas). To cater to the expanding urban population, densification seems to be an inevitable outcome.
In this respect, Barra Funda and Luz have an advantageous potential.
Figure 166: Barra Funda district.
Source: Steemers, K. et al. (2005). Sustainable Urban Spaces: a case study in São Paulo, Brazil. Cambridge, The
Martin Centre for Architectural and Urban Studies, Department of Architecture, University of Cambridge.
Figure 167: Luz district.
Source: Steemers, K. et al. (2005). Sustainable Urban Spaces: a case study in São Paulo, Brazil. Cambridge, The
Martin Centre for Architectural and Urban Studies, Department of Architecture, University of Cambridge.
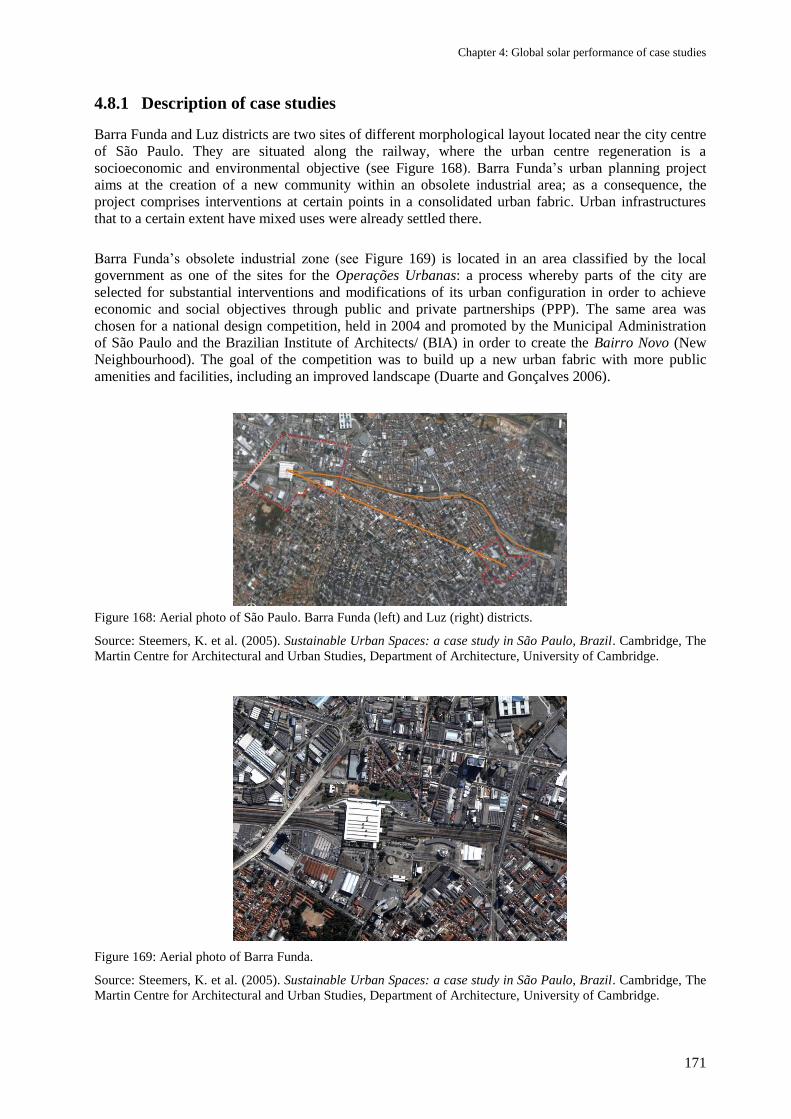
Chapter 4: Global solar performance of case studies
171
4.8.1 Description of case studies
Barra Funda and Luz districts are two sites of different morphological layout located near the city centre
of São Paulo. They are situated along the railway, where the urban centre regeneration is a
socioeconomic and environmental objective (see Figure 168). Barra Funda‘s urban planning project
aims at the creation of a new community within an obsolete industrial area; as a consequence, the
project comprises interventions at certain points in a consolidated urban fabric. Urban infrastructures
that to a certain extent have mixed uses were already settled there.
Barra Funda‘s obsolete industrial zone (see Figure 169) is located in an area classified by the local
government as one of the sites for the Operações Urbanas: a process whereby parts of the city are
selected for substantial interventions and modifications of its urban configuration in order to achieve
economic and social objectives through public and private partnerships (PPP). The same area was
chosen for a national design competition, held in 2004 and promoted by the Municipal Administration
of São Paulo and the Brazilian Institute of Architects/ (BIA) in order to create the Bairro Novo (New
Neighbourhood). The goal of the competition was to build up a new urban fabric with more public
amenities and facilities, including an improved landscape (Duarte and Gonçalves 2006).
Figure 168: Aerial photo of São Paulo. Barra Funda (left) and Luz (right) districts.
Source: Steemers, K. et al. (2005). Sustainable Urban Spaces: a case study in São Paulo, Brazil. Cambridge, The
Martin Centre for Architectural and Urban Studies, Department of Architecture, University of Cambridge.
Figure 169: Aerial photo of Barra Funda.
Source: Steemers, K. et al. (2005). Sustainable Urban Spaces: a case study in São Paulo, Brazil. Cambridge, The
Martin Centre for Architectural and Urban Studies, Department of Architecture, University of Cambridge.
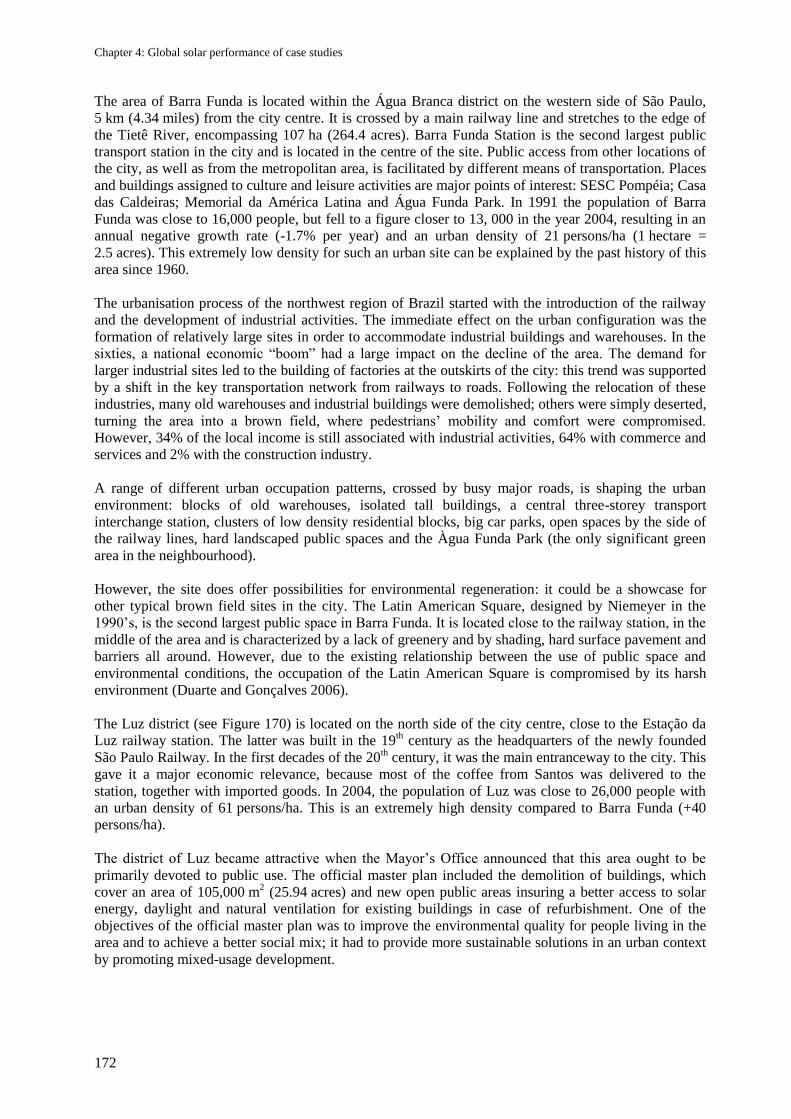
Chapter 4: Global solar performance of case studies
172
The area of Barra Funda is located within the Água Branca district on the western side of São Paulo,
5 km (4.34 miles) from the city centre. It is crossed by a main railway line and stretches to the edge of
the Tietê River, encompassing 107 ha (264.4 acres). Barra Funda Station is the second largest public
transport station in the city and is located in the centre of the site. Public access from other locations of
the city, as well as from the metropolitan area, is facilitated by different means of transportation. Places
and buildings assigned to culture and leisure activities are major points of interest: SESC Pompéia; Casa
das Caldeiras; Memorial da América Latina and Água Funda Park. In 1991 the population of Barra
Funda was close to 16,000 people, but fell to a figure closer to 13, 000 in the year 2004, resulting in an
annual negative growth rate (-1.7% per year) and an urban density of 21 persons/ha (1 hectare =
2.5 acres). This extremely low density for such an urban site can be explained by the past history of this
area since 1960.
The urbanisation process of the northwest region of Brazil started with the introduction of the railway
and the development of industrial activities. The immediate effect on the urban configuration was the
formation of relatively large sites in order to accommodate industrial buildings and warehouses. In the
sixties, a national economic ―boom‖ had a large impact on the decline of the area. The demand for
larger industrial sites led to the building of factories at the outskirts of the city: this trend was supported
by a shift in the key transportation network from railways to roads. Following the relocation of these
industries, many old warehouses and industrial buildings were demolished; others were simply deserted,
turning the area into a brown field, where pedestrians‘ mobility and comfort were compromised.
However, 34% of the local income is still associated with industrial activities, 64% with commerce and
services and 2% with the construction industry.
A range of different urban occupation patterns, crossed by busy major roads, is shaping the urban
environment: blocks of old warehouses, isolated tall buildings, a central three-storey transport
interchange station, clusters of low density residential blocks, big car parks, open spaces by the side of
the railway lines, hard landscaped public spaces and the Àgua Funda Park (the only significant green
area in the neighbourhood).
However, the site does offer possibilities for environmental regeneration: it could be a showcase for
other typical brown field sites in the city. The Latin American Square, designed by Niemeyer in the
1990‘s, is the second largest public space in Barra Funda. It is located close to the railway station, in the
middle of the area and is characterized by a lack of greenery and by shading, hard surface pavement and
barriers all around. However, due to the existing relationship between the use of public space and
environmental conditions, the occupation of the Latin American Square is compromised by its harsh
environment (Duarte and Gonçalves 2006).
The Luz district (see Figure 170) is located on the north side of the city centre, close to the Estação da
Luz railway station. The latter was built in the 19th century as the headquarters of the newly founded
São Paulo Railway. In the first decades of the 20th century, it was the main entranceway to the city. This
gave it a major economic relevance, because most of the coffee from Santos was delivered to the
station, together with imported goods. In 2004, the population of Luz was close to 26,000 people with
an urban density of 61 persons/ha. This is an extremely high density compared to Barra Funda (+40
persons/ha).
The district of Luz became attractive when the Mayor‘s Office announced that this area ought to be
primarily devoted to public use. The official master plan included the demolition of buildings, which
cover an area of 105,000 m2 (25.94 acres) and new open public areas insuring a better access to solar
energy, daylight and natural ventilation for existing buildings in case of refurbishment. One of the
objectives of the official master plan was to improve the environmental quality for people living in the
area and to achieve a better social mix; it had to provide more sustainable solutions in an urban context
by promoting mixed-usage development.
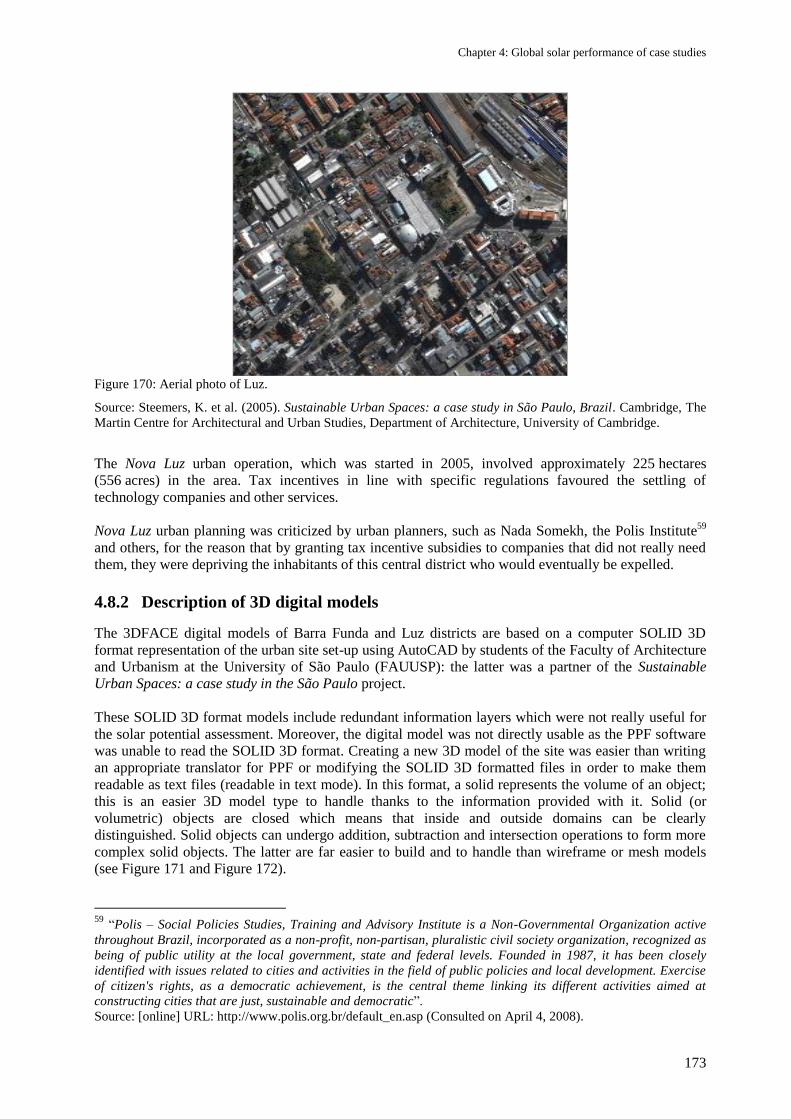
Chapter 4: Global solar performance of case studies
173
Figure 170: Aerial photo of Luz.
Source: Steemers, K. et al. (2005). Sustainable Urban Spaces: a case study in São Paulo, Brazil. Cambridge, The
Martin Centre for Architectural and Urban Studies, Department of Architecture, University of Cambridge.
The Nova Luz urban operation, which was started in 2005, involved approximately 225 hectares
(556 acres) in the area. Tax incentives in line with specific regulations favoured the settling of
technology companies and other services.
Nova Luz urban planning was criticized by urban planners, such as Nada Somekh, the Polis Institute59
and others, for the reason that by granting tax incentive subsidies to companies that did not really need
them, they were depriving the inhabitants of this central district who would eventually be expelled.
4.8.2 Description of 3D digital models
The 3DFACE digital models of Barra Funda and Luz districts are based on a computer SOLID 3D
format representation of the urban site set-up using AutoCAD by students of the Faculty of Architecture
and Urbanism at the University of São Paulo (FAUUSP): the latter was a partner of the Sustainable
Urban Spaces: a case study in the São Paulo project.
These SOLID 3D format models include redundant information layers which were not really useful for
the solar potential assessment. Moreover, the digital model was not directly usable as the PPF software
was unable to read the SOLID 3D format. Creating a new 3D model of the site was easier than writing
an appropriate translator for PPF or modifying the SOLID 3D formatted files in order to make them
readable as text files (readable in text mode). In this format, a solid represents the volume of an object;
this is an easier 3D model type to handle thanks to the information provided with it. Solid (or
volumetric) objects are closed which means that inside and outside domains can be clearly
distinguished. Solid objects can undergo addition, subtraction and intersection operations to form more
complex solid objects. The latter are far easier to build and to handle than wireframe or mesh models
(see Figure 171 and Figure 172).
59
―Polis – Social Policies Studies, Training and Advisory Institute is a Non-Governmental Organization active
throughout Brazil, incorporated as a non-profit, non-partisan, pluralistic civil society organization, recognized as
being of public utility at the local government, state and federal levels. Founded in 1987, it has been closely
identified with issues related to cities and activities in the field of public policies and local development. Exercise
of citizen's rights, as a democratic achievement, is the central theme linking its different activities aimed at
constructing cities that are just, sustainable and democratic‖.
Source: [online] URL: http://www.polis.org.br/default_en.asp (Consulted on April 4, 2008).
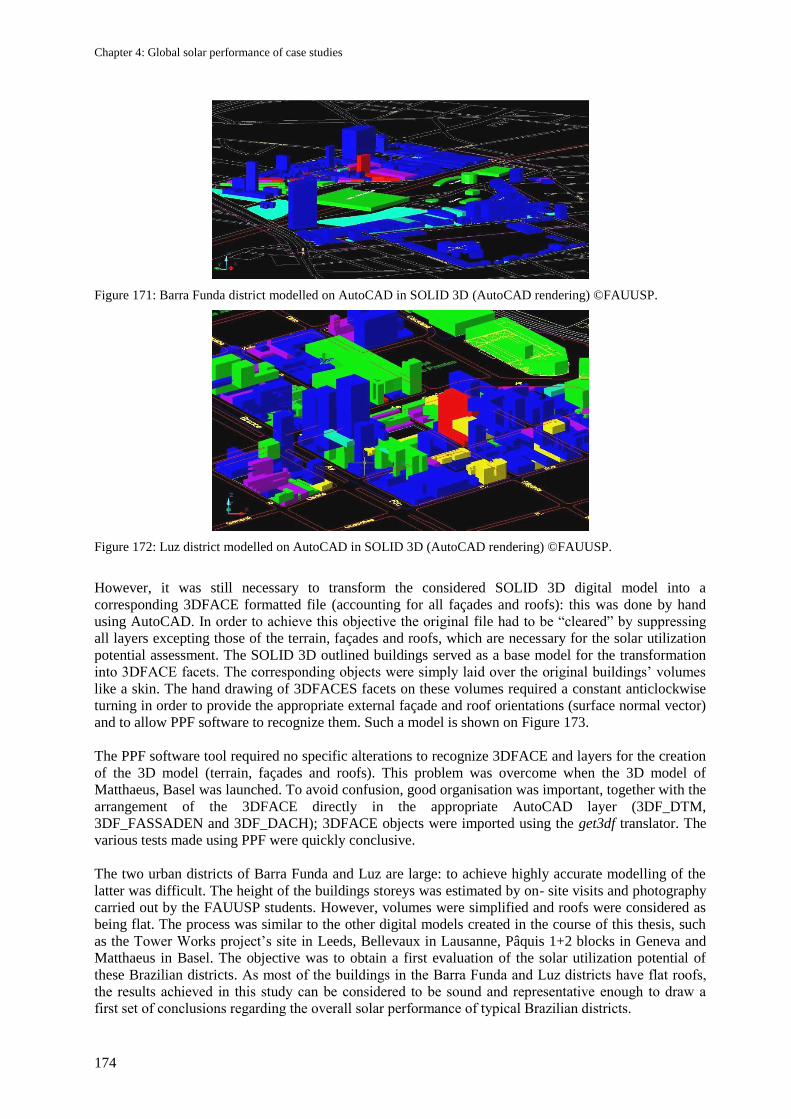
Chapter 4: Global solar performance of case studies
174
Figure 171: Barra Funda district modelled on AutoCAD in SOLID 3D (AutoCAD rendering) ©FAUUSP.
Figure 172: Luz district modelled on AutoCAD in SOLID 3D (AutoCAD rendering) ©FAUUSP.
However, it was still necessary to transform the considered SOLID 3D digital model into a
corresponding 3DFACE formatted file (accounting for all façades and roofs): this was done by hand
using AutoCAD. In order to achieve this objective the original file had to be ―cleared‖ by suppressing
all layers excepting those of the terrain, façades and roofs, which are necessary for the solar utilization
potential assessment. The SOLID 3D outlined buildings served as a base model for the transformation
into 3DFACE facets. The corresponding objects were simply laid over the original buildings‘ volumes
like a skin. The hand drawing of 3DFACES facets on these volumes required a constant anticlockwise
turning in order to provide the appropriate external façade and roof orientations (surface normal vector)
and to allow PPF software to recognize them. Such a model is shown on Figure 173.
The PPF software tool required no specific alterations to recognize 3DFACE and layers for the creation
of the 3D model (terrain, façades and roofs). This problem was overcome when the 3D model of
Matthaeus, Basel was launched. To avoid confusion, good organisation was important, together with the
arrangement of the 3DFACE directly in the appropriate AutoCAD layer (3DF_DTM,
3DF_FASSADEN and 3DF_DACH); 3DFACE objects were imported using the get3df translator. The
various tests made using PPF were quickly conclusive.
The two urban districts of Barra Funda and Luz are large: to achieve highly accurate modelling of the
latter was difficult. The height of the buildings storeys was estimated by on- site visits and photography
carried out by the FAUUSP students. However, volumes were simplified and roofs were considered as
being flat. The process was similar to the other digital models created in the course of this thesis, such
as the Tower Works project‘s site in Leeds, Bellevaux in Lausanne, Pâquis 1+2 blocks in Geneva and
Matthaeus in Basel. The objective was to obtain a first evaluation of the solar utilization potential of
these Brazilian districts. As most of the buildings in the Barra Funda and Luz districts have flat roofs,
the results achieved in this study can be considered to be sound and representative enough to draw a
first set of conclusions regarding the overall solar performance of typical Brazilian districts.
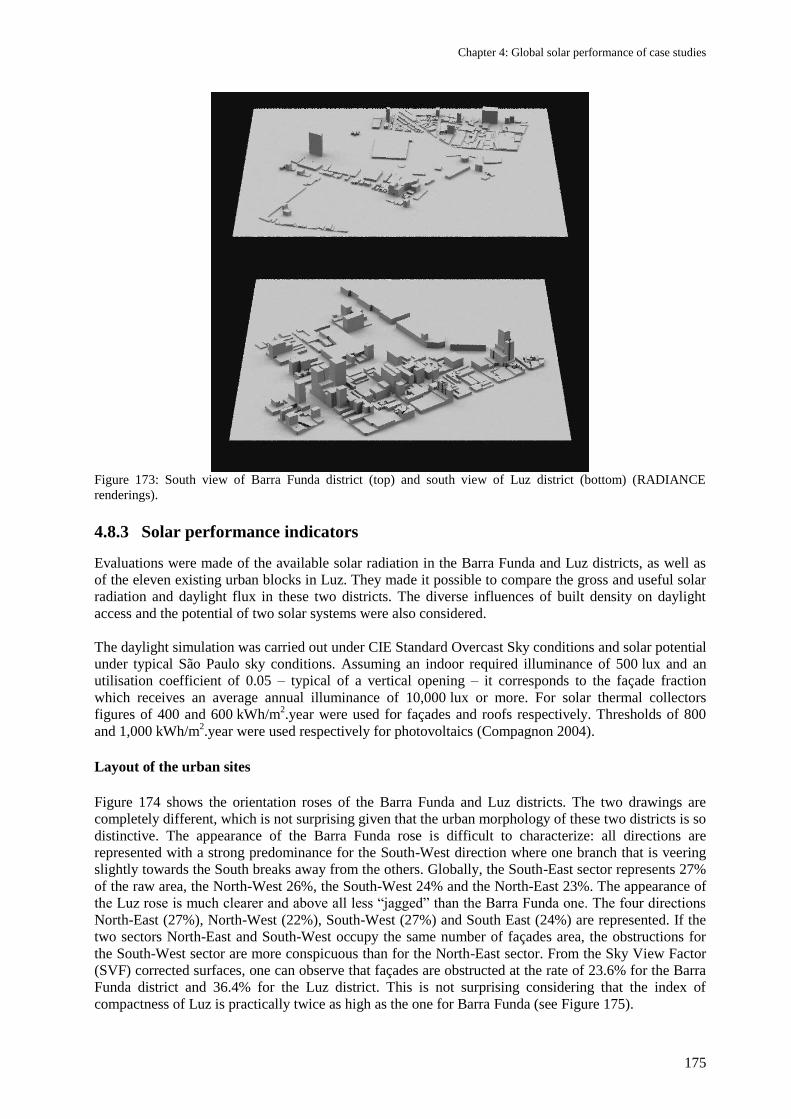
Chapter 4: Global solar performance of case studies
175
Figure 173: South view of Barra Funda district (top) and south view of Luz district (bottom) (RADIANCE
renderings).
4.8.3 Solar performance indicators
Evaluations were made of the available solar radiation in the Barra Funda and Luz districts, as well as
of the eleven existing urban blocks in Luz. They made it possible to compare the gross and useful solar
radiation and daylight flux in these two districts. The diverse influences of built density on daylight
access and the potential of two solar systems were also considered.
The daylight simulation was carried out under CIE Standard Overcast Sky conditions and solar potential
under typical São Paulo sky conditions. Assuming an indoor required illuminance of 500 lux and an
utilisation coefficient of 0.05 – typical of a vertical opening – it corresponds to the façade fraction
which receives an average annual illuminance of 10,000 lux or more. For solar thermal collectors
figures of 400 and 600 kWh/m2.year were used for façades and roofs respectively. Thresholds of 800
and 1,000 kWh/m2.year were used respectively for photovoltaics (Compagnon 2004).
Layout of the urban sites
Figure 174 shows the orientation roses of the Barra Funda and Luz districts. The two drawings are
completely different, which is not surprising given that the urban morphology of these two districts is so
distinctive. The appearance of the Barra Funda rose is difficult to characterize: all directions are
represented with a strong predominance for the South-West direction where one branch that is veering
slightly towards the South breaks away from the others. Globally, the South-East sector represents 27%
of the raw area, the North-West 26%, the South-West 24% and the North-East 23%. The appearance of
the Luz rose is much clearer and above all less ―jagged‖ than the Barra Funda one. The four directions
North-East (27%), North-West (22%), South-West (27%) and South East (24%) are represented. If the
two sectors North-East and South-West occupy the same number of façades area, the obstructions for
the South-West sector are more conspicuous than for the North-East sector. From the Sky View Factor
(SVF) corrected surfaces, one can observe that façades are obstructed at the rate of 23.6% for the Barra
Funda district and 36.4% for the Luz district. This is not surprising considering that the index of
compactness of Luz is practically twice as high as the one for Barra Funda (see Figure 175).
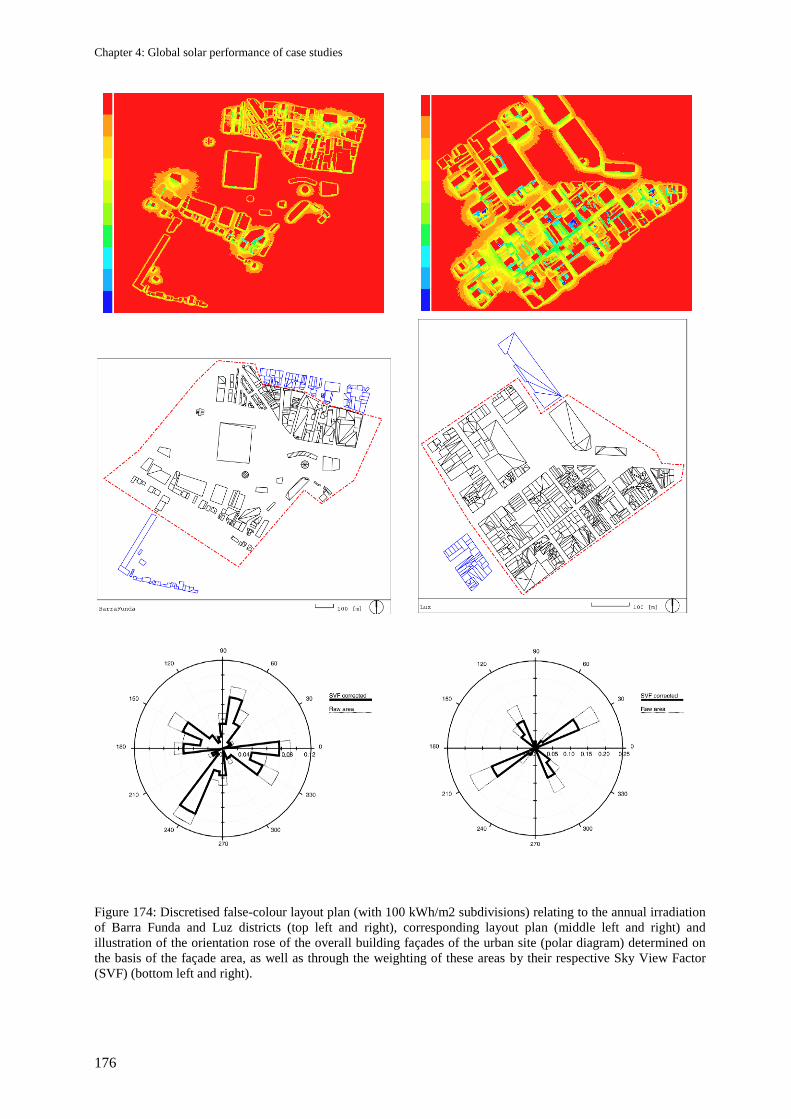
Chapter 4: Global solar performance of case studies
176
Figure 174: Discretised false-colour layout plan (with 100 kWh/m2 subdivisions) relating to the annual irradiation
of Barra Funda and Luz districts (top left and right), corresponding layout plan (middle left and right) and
illustration of the orientation rose of the overall building façades of the urban site (polar diagram) determined on
the basis of the façade area, as well as through the weighting of these areas by their respective Sky View Factor
(SVF) (bottom left and right).
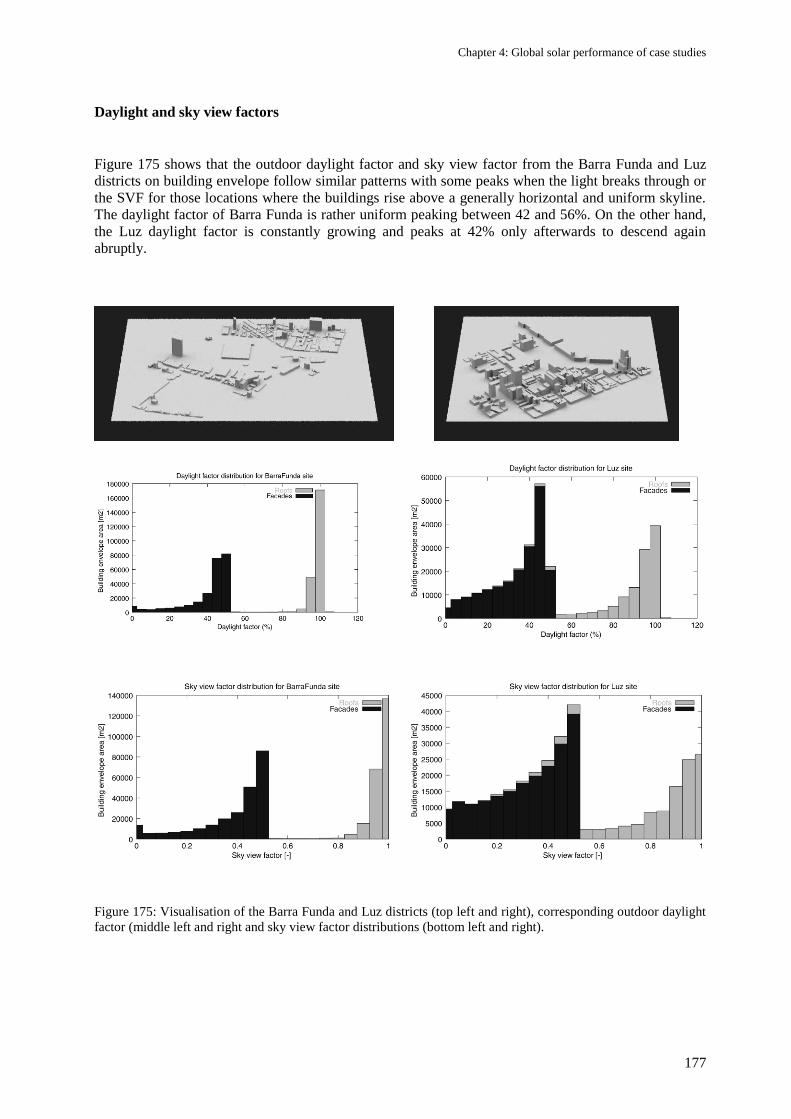
Chapter 4: Global solar performance of case studies
177
Daylight and sky view factors
Figure 175 shows that the outdoor daylight factor and sky view factor from the Barra Funda and Luz
districts on building envelope follow similar patterns with some peaks when the light breaks through or
the SVF for those locations where the buildings rise above a generally horizontal and uniform skyline.
The daylight factor of Barra Funda is rather uniform peaking between 42 and 56%. On the other hand,
the Luz daylight factor is constantly growing and peaks at 42% only afterwards to descend again
abruptly.
Figure 175: Visualisation of the Barra Funda and Luz districts (top left and right), corresponding outdoor daylight
factor (middle left and right and sky view factor distributions (bottom left and right).
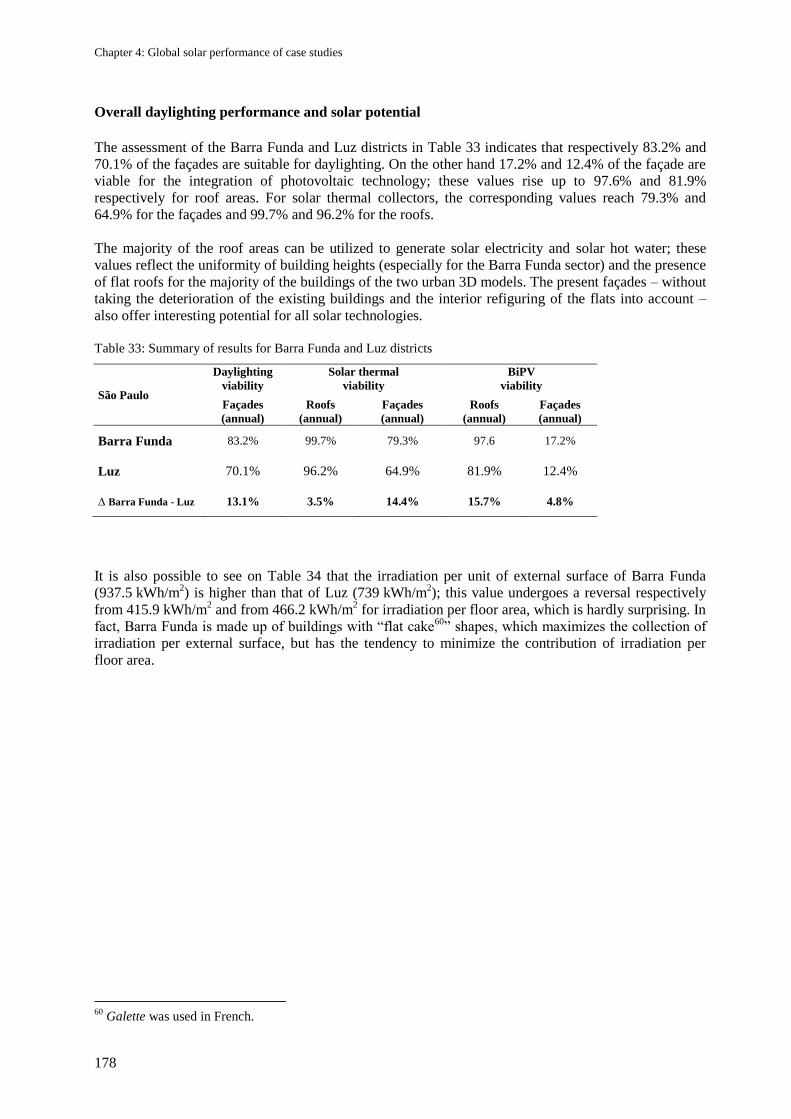
Chapter 4: Global solar performance of case studies
178
Overall daylighting performance and solar potential
The assessment of the Barra Funda and Luz districts in Table 33 indicates that respectively 83.2% and
70.1% of the façades are suitable for daylighting. On the other hand 17.2% and 12.4% of the façade are
viable for the integration of photovoltaic technology; these values rise up to 97.6% and 81.9%
respectively for roof areas. For solar thermal collectors, the corresponding values reach 79.3% and
64.9% for the façades and 99.7% and 96.2% for the roofs.
The majority of the roof areas can be utilized to generate solar electricity and solar hot water; these
values reflect the uniformity of building heights (especially for the Barra Funda sector) and the presence
of flat roofs for the majority of the buildings of the two urban 3D models. The present façades – without
taking the deterioration of the existing buildings and the interior refiguring of the flats into account –
also offer interesting potential for all solar technologies.
Table 33: Summary of results for Barra Funda and Luz districts
São Paulo
Daylighting
viability
Solar thermal
viability
BiPV
viability
Façades
(annual)
Roofs
(annual)
Façades
(annual)
Roofs
(annual)
Façades
(annual)
Barra Funda 83.2% 99.7% 79.3% 97.6 17.2%
Luz 70.1% 96.2% 64.9% 81.9% 12.4%
∆ Barra Funda - Luz 13.1% 3.5% 14.4% 15.7% 4.8%
It is also possible to see on Table 34 that the irradiation per unit of external surface of Barra Funda
(937.5 kWh/m2) is higher than that of Luz (739 kWh/m
2); this value undergoes a reversal respectively
from 415.9 kWh/m2 and from 466.2 kWh/m
2 for irradiation per floor area, which is hardly surprising. In
fact, Barra Funda is made up of buildings with ―flat cake60
‖ shapes, which maximizes the collection of
irradiation per external surface, but has the tendency to minimize the contribution of irradiation per
floor area.
60
Galette was used in French.
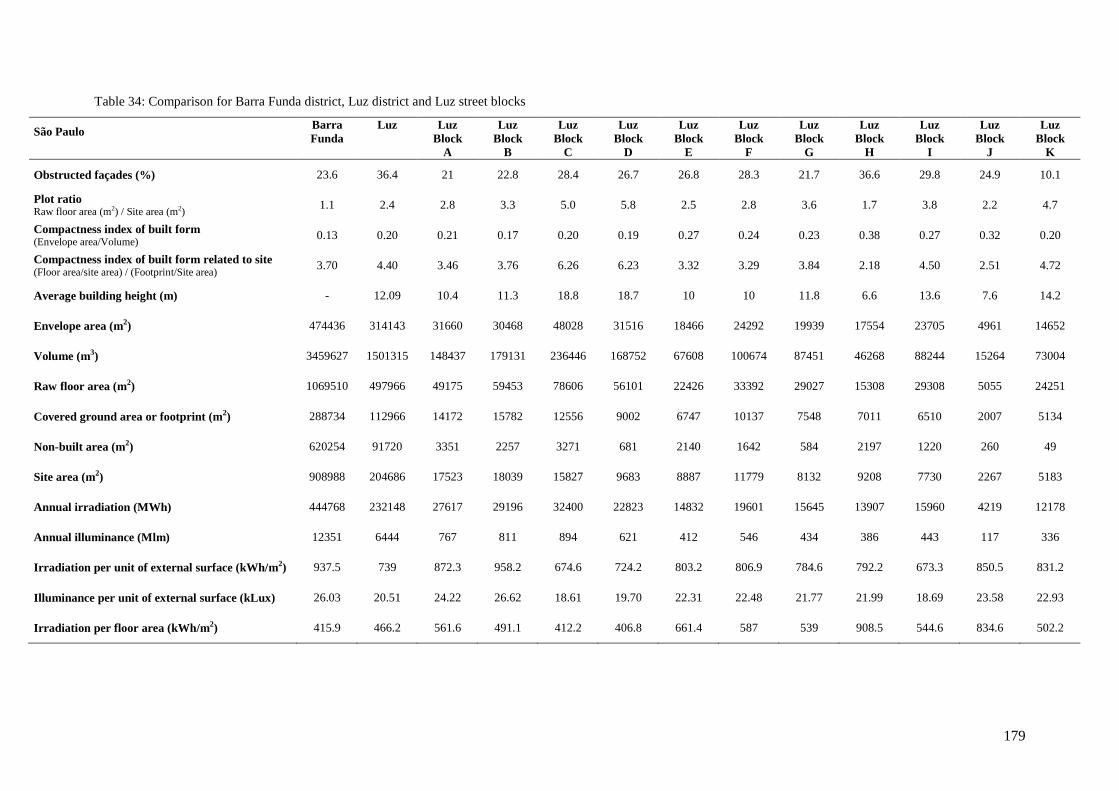
179
Table 34: Comparison for Barra Funda district, Luz district and Luz street blocks
São Paulo
Barra
Funda
Luz
Luz
Block
A
Luz
Block
B
Luz
Block
C
Luz
Block
D
Luz
Block
E
Luz
Block
F
Luz
Block
G
Luz
Block
H
Luz
Block
I
Luz
Block
J
Luz
Block
K
Obstructed façades (%) 23.6 36.4 21 22.8 28.4 26.7 26.8 28.3 21.7 36.6 29.8 24.9 10.1
Plot ratio Raw floor area (m2) / Site area (m2)
1.1 2.4 2.8 3.3 5.0 5.8 2.5 2.8 3.6 1.7 3.8 2.2 4.7
Compactness index of built form (Envelope area/Volume)
0.13 0.20 0.21 0.17 0.20 0.19 0.27 0.24 0.23 0.38 0.27 0.32 0.20
Compactness index of built form related to site (Floor area/site area) / (Footprint/Site area)
3.70 4.40 3.46 3.76 6.26 6.23 3.32 3.29 3.84 2.18 4.50 2.51 4.72
Average building height (m) - 12.09 10.4 11.3 18.8 18.7 10 10 11.8 6.6 13.6 7.6 14.2
Envelope area (m2) 474436 314143 31660 30468 48028 31516 18466 24292 19939 17554 23705 4961 14652
Volume (m3) 3459627 1501315 148437 179131 236446 168752 67608 100674 87451 46268 88244 15264 73004
Raw floor area (m2) 1069510 497966 49175 59453 78606 56101 22426 33392 29027 15308 29308 5055 24251
Covered ground area or footprint (m2) 288734 112966 14172 15782 12556 9002 6747 10137 7548 7011 6510 2007 5134
Non-built area (m2) 620254 91720 3351 2257 3271 681 2140 1642 584 2197 1220 260 49
Site area (m2) 908988 204686 17523 18039 15827 9683 8887 11779 8132 9208 7730 2267 5183
Annual irradiation (MWh) 444768 232148 27617 29196 32400 22823 14832 19601 15645 13907 15960 4219 12178
Annual illuminance (Mlm) 12351 6444 767 811 894 621 412 546 434 386 443 117 336
Irradiation per unit of external surface (kWh/m2) 937.5 739 872.3 958.2 674.6 724.2 803.2 806.9 784.6 792.2 673.3 850.5 831.2
Illuminance per unit of external surface (kLux) 26.03 20.51 24.22 26.62 18.61 19.70 22.31 22.48 21.77 21.99 18.69 23.58 22.93
Irradiation per floor area (kWh/m2) 415.9 466.2 561.6 491.1 412.2 406.8 661.4 587 539 908.5 544.6 834.6 502.2
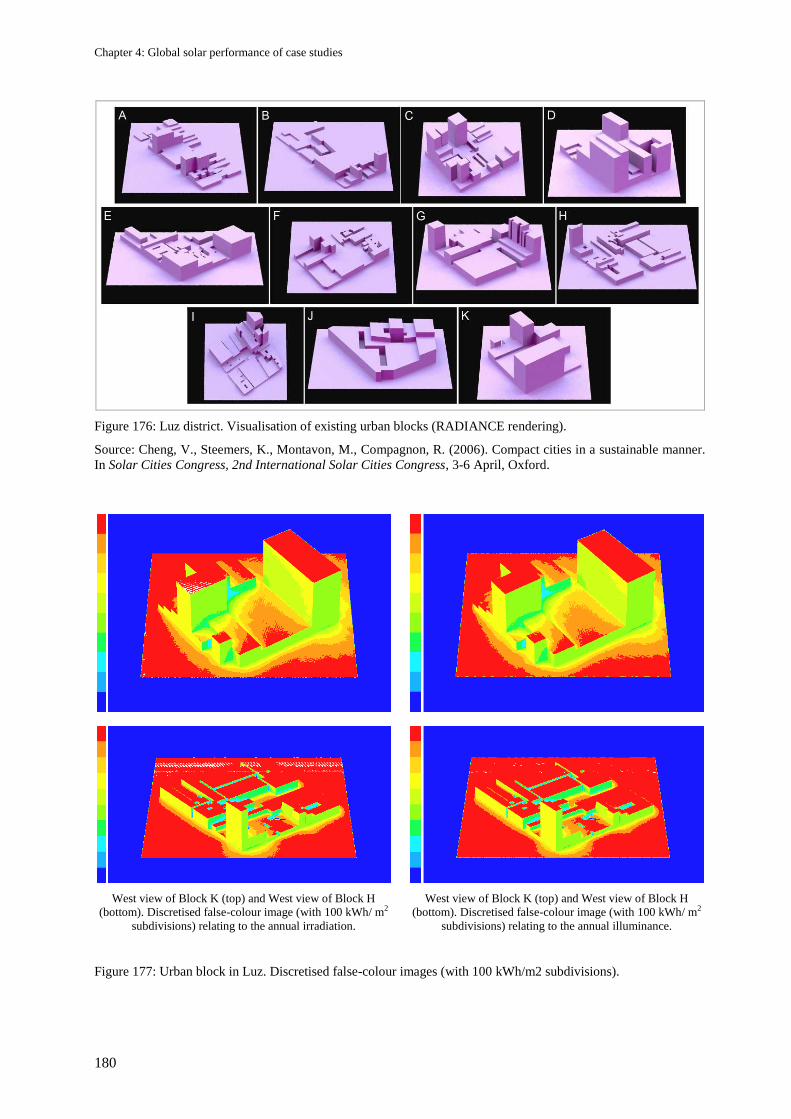
Chapter 4: Global solar performance of case studies
180
Figure 176: Luz district. Visualisation of existing urban blocks (RADIANCE rendering).
Source: Cheng, V., Steemers, K., Montavon, M., Compagnon, R. (2006). Compact cities in a sustainable manner.
In Solar Cities Congress, 2nd International Solar Cities Congress, 3-6 April, Oxford.
West view of Block K (top) and West view of Block H
(bottom). Discretised false-colour image (with 100 kWh/ m2
subdivisions) relating to the annual irradiation.
West view of Block K (top) and West view of Block H
(bottom). Discretised false-colour image (with 100 kWh/ m2
subdivisions) relating to the annual illuminance.
Figure 177: Urban block in Luz. Discretised false-colour images (with 100 kWh/m2 subdivisions).
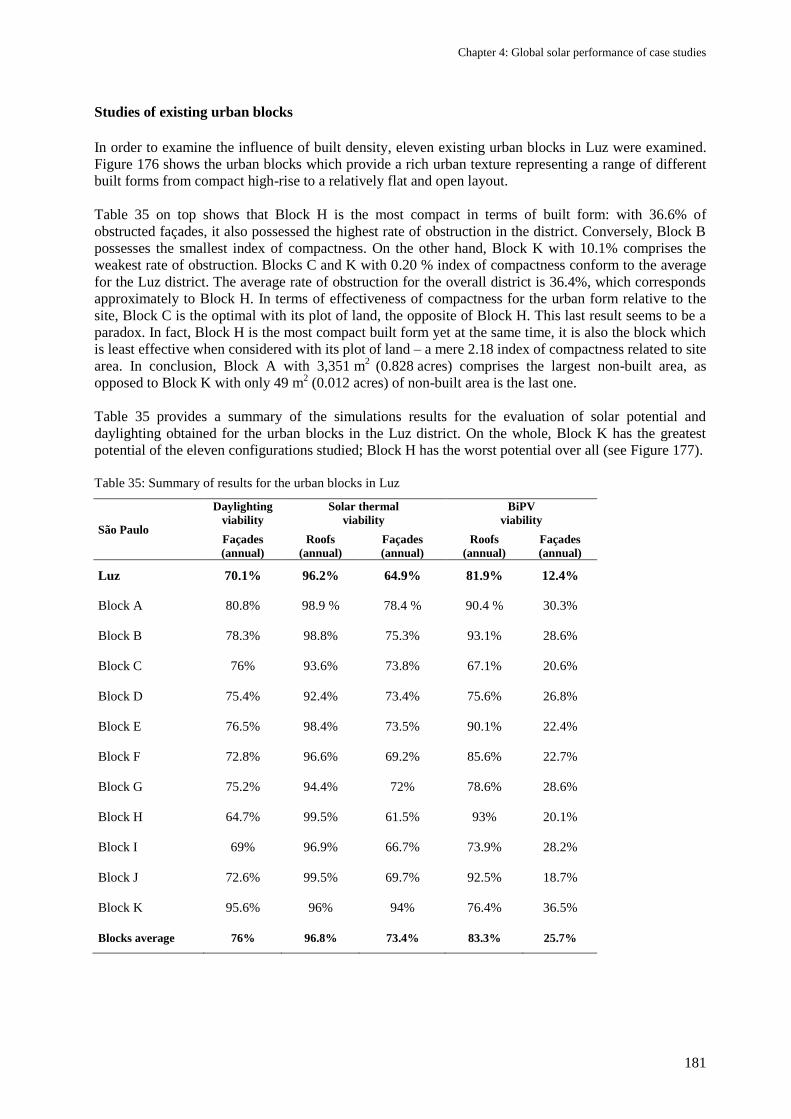
Chapter 4: Global solar performance of case studies
181
Studies of existing urban blocks
In order to examine the influence of built density, eleven existing urban blocks in Luz were examined.
Figure 176 shows the urban blocks which provide a rich urban texture representing a range of different
built forms from compact high-rise to a relatively flat and open layout.
Table 35 on top shows that Block H is the most compact in terms of built form: with 36.6% of
obstructed façades, it also possessed the highest rate of obstruction in the district. Conversely, Block B
possesses the smallest index of compactness. On the other hand, Block K with 10.1% comprises the
weakest rate of obstruction. Blocks C and K with 0.20 % index of compactness conform to the average
for the Luz district. The average rate of obstruction for the overall district is 36.4%, which corresponds
approximately to Block H. In terms of effectiveness of compactness for the urban form relative to the
site, Block C is the optimal with its plot of land, the opposite of Block H. This last result seems to be a
paradox. In fact, Block H is the most compact built form yet at the same time, it is also the block which
is least effective when considered with its plot of land – a mere 2.18 index of compactness related to site
area. In conclusion, Block A with 3,351 m2
(0.828 acres) comprises the largest non-built area, as
opposed to Block K with only 49 m2 (0.012 acres) of non-built area is the last one.
Table 35 provides a summary of the simulations results for the evaluation of solar potential and
daylighting obtained for the urban blocks in the Luz district. On the whole, Block K has the greatest
potential of the eleven configurations studied; Block H has the worst potential over all (see Figure 177).
Table 35: Summary of results for the urban blocks in Luz
São Paulo
Daylighting
viability
Solar thermal
viability
BiPV
viability
Façades
(annual)
Roofs
(annual)
Façades
(annual)
Roofs
(annual)
Façades
(annual)
Luz 70.1% 96.2% 64.9% 81.9% 12.4%
Block A 80.8% 98.9 % 78.4 % 90.4 % 30.3%
Block B 78.3% 98.8% 75.3% 93.1% 28.6%
Block C 76% 93.6% 73.8% 67.1% 20.6%
Block D 75.4% 92.4% 73.4% 75.6% 26.8%
Block E 76.5% 98.4% 73.5% 90.1% 22.4%
Block F 72.8% 96.6% 69.2% 85.6% 22.7%
Block G 75.2% 94.4% 72% 78.6% 28.6%
Block H 64.7% 99.5% 61.5% 93% 20.1%
Block I 69% 96.9% 66.7% 73.9% 28.2%
Block J 72.6% 99.5% 69.7% 92.5% 18.7%
Block K 95.6% 96% 94% 76.4% 36.5%
Blocks average 76% 96.8% 73.4% 83.3% 25.7%
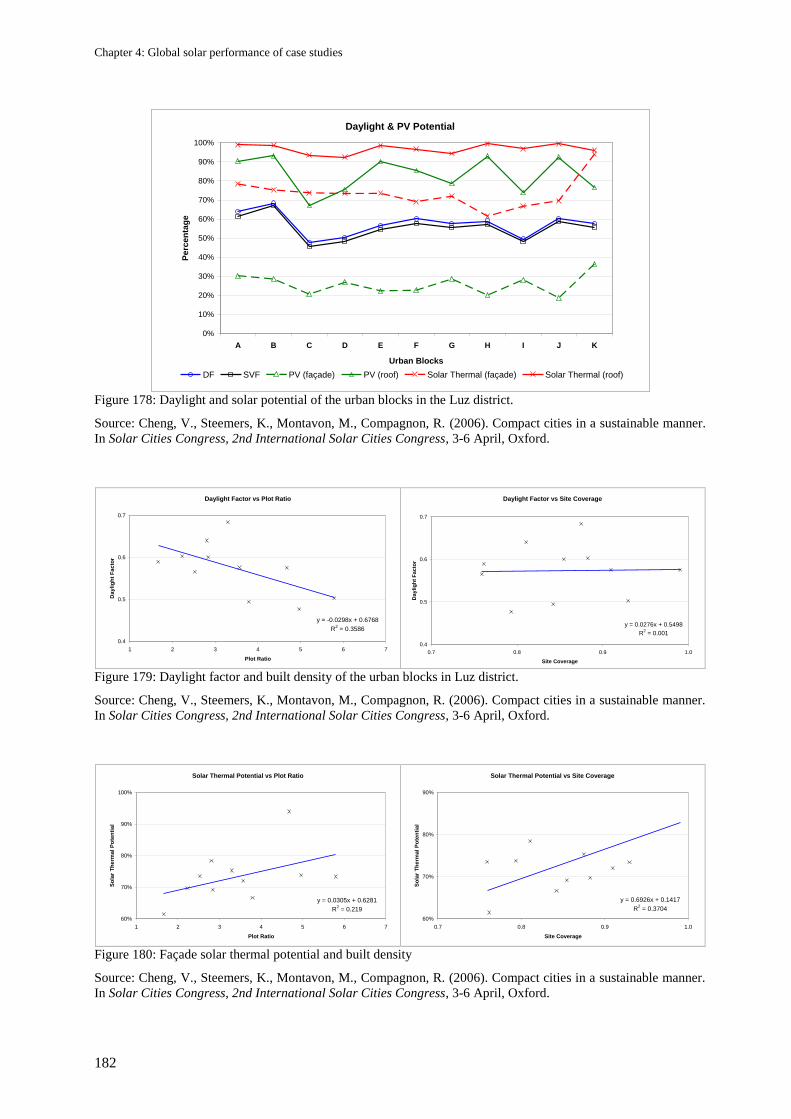
Chapter 4: Global solar performance of case studies
182
Daylight & PV Potential
0%
10%
20%
30%
40%
50%
60%
70%
80%
90%
100%
A B C D E F G H I J K
Urban Blocks
Perc
en
tag
e
DF SVF PV (façade) PV (roof) Solar Thermal (façade) Solar Thermal (roof)
Figure 178: Daylight and solar potential of the urban blocks in the Luz district.
Source: Cheng, V., Steemers, K., Montavon, M., Compagnon, R. (2006). Compact cities in a sustainable manner.
In Solar Cities Congress, 2nd International Solar Cities Congress, 3-6 April, Oxford.
Daylight Factor vs Plot Ratio
y = -0.0298x + 0.6768
R2 = 0.3586
0.4
0.5
0.6
0.7
1 2 3 4 5 6 7
Plot Ratio
Dayli
gh
t F
acto
r
Daylight Factor vs Site Coverage
y = 0.0276x + 0.5498
R2 = 0.001
0.4
0.5
0.6
0.7
0.7 0.8 0.9 1.0
Site Coverage
Day
lig
ht
Facto
r
Figure 179: Daylight factor and built density of the urban blocks in Luz district.
Source: Cheng, V., Steemers, K., Montavon, M., Compagnon, R. (2006). Compact cities in a sustainable manner.
In Solar Cities Congress, 2nd International Solar Cities Congress, 3-6 April, Oxford.
Solar Thermal Potential vs Plot Ratio
y = 0.0305x + 0.6281
R2 = 0.219
60%
70%
80%
90%
100%
1 2 3 4 5 6 7
Plot Ratio
So
lar
Th
erm
al
Po
ten
tia
l
Solar Thermal Potential vs Site Coverage
y = 0.6926x + 0.1417
R2 = 0.3704
60%
70%
80%
90%
0.7 0.8 0.9 1.0
Site Coverage
So
lar
Th
erm
al
Po
ten
tia
l
Figure 180: Façade solar thermal potential and built density
Source: Cheng, V., Steemers, K., Montavon, M., Compagnon, R. (2006). Compact cities in a sustainable manner.
In Solar Cities Congress, 2nd International Solar Cities Congress, 3-6 April, Oxford.
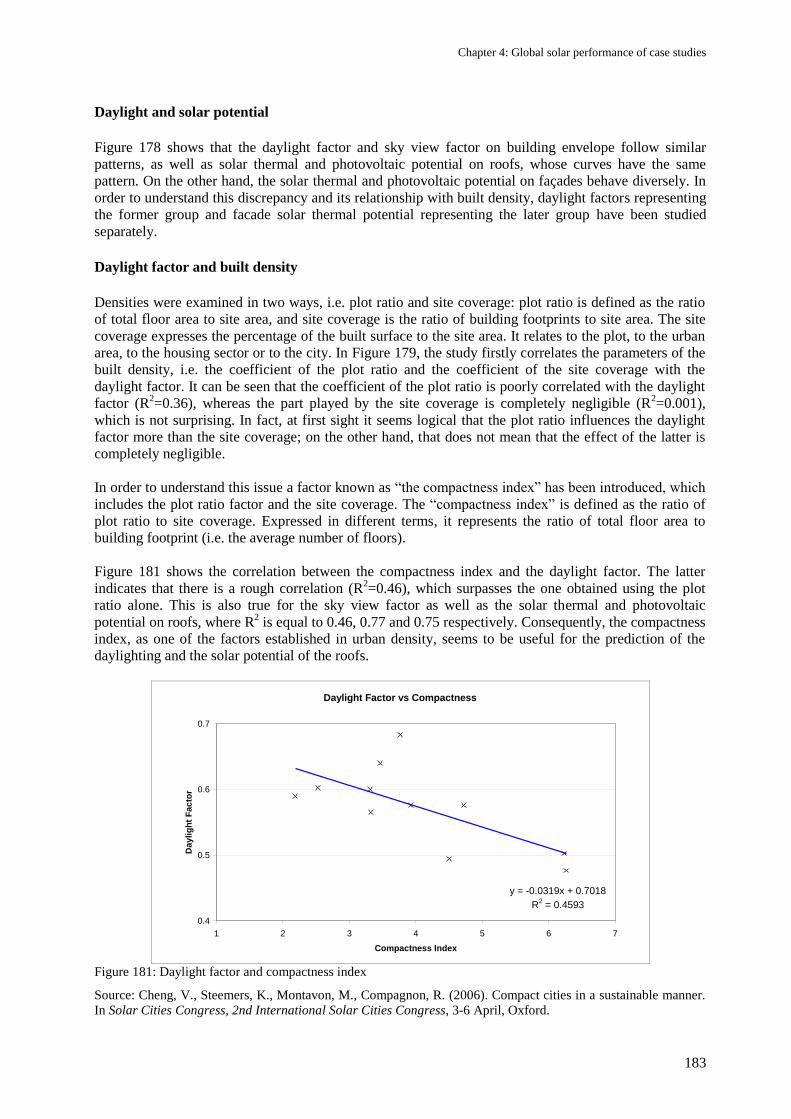
Chapter 4: Global solar performance of case studies
183
Daylight and solar potential
Figure 178 shows that the daylight factor and sky view factor on building envelope follow similar
patterns, as well as solar thermal and photovoltaic potential on roofs, whose curves have the same
pattern. On the other hand, the solar thermal and photovoltaic potential on façades behave diversely. In
order to understand this discrepancy and its relationship with built density, daylight factors representing
the former group and facade solar thermal potential representing the later group have been studied
separately.
Daylight factor and built density
Densities were examined in two ways, i.e. plot ratio and site coverage: plot ratio is defined as the ratio
of total floor area to site area, and site coverage is the ratio of building footprints to site area. The site
coverage expresses the percentage of the built surface to the site area. It relates to the plot, to the urban
area, to the housing sector or to the city. In Figure 179, the study firstly correlates the parameters of the
built density, i.e. the coefficient of the plot ratio and the coefficient of the site coverage with the
daylight factor. It can be seen that the coefficient of the plot ratio is poorly correlated with the daylight
factor (R2=0.36), whereas the part played by the site coverage is completely negligible (R
2=0.001),
which is not surprising. In fact, at first sight it seems logical that the plot ratio influences the daylight
factor more than the site coverage; on the other hand, that does not mean that the effect of the latter is
completely negligible.
In order to understand this issue a factor known as ―the compactness index‖ has been introduced, which
includes the plot ratio factor and the site coverage. The ―compactness index‖ is defined as the ratio of
plot ratio to site coverage. Expressed in different terms, it represents the ratio of total floor area to
building footprint (i.e. the average number of floors).
Figure 181 shows the correlation between the compactness index and the daylight factor. The latter
indicates that there is a rough correlation (R2=0.46), which surpasses the one obtained using the plot
ratio alone. This is also true for the sky view factor as well as the solar thermal and photovoltaic
potential on roofs, where R2 is equal to 0.46, 0.77 and 0.75 respectively. Consequently, the compactness
index, as one of the factors established in urban density, seems to be useful for the prediction of the
daylighting and the solar potential of the roofs.
Daylight Factor vs Compactness
y = -0.0319x + 0.7018
R2 = 0.4593
0.4
0.5
0.6
0.7
1 2 3 4 5 6 7
Compactness Index
Da
yli
gh
t F
ac
tor
Figure 181: Daylight factor and compactness index
Source: Cheng, V., Steemers, K., Montavon, M., Compagnon, R. (2006). Compact cities in a sustainable manner.
In Solar Cities Congress, 2nd International Solar Cities Congress, 3-6 April, Oxford.
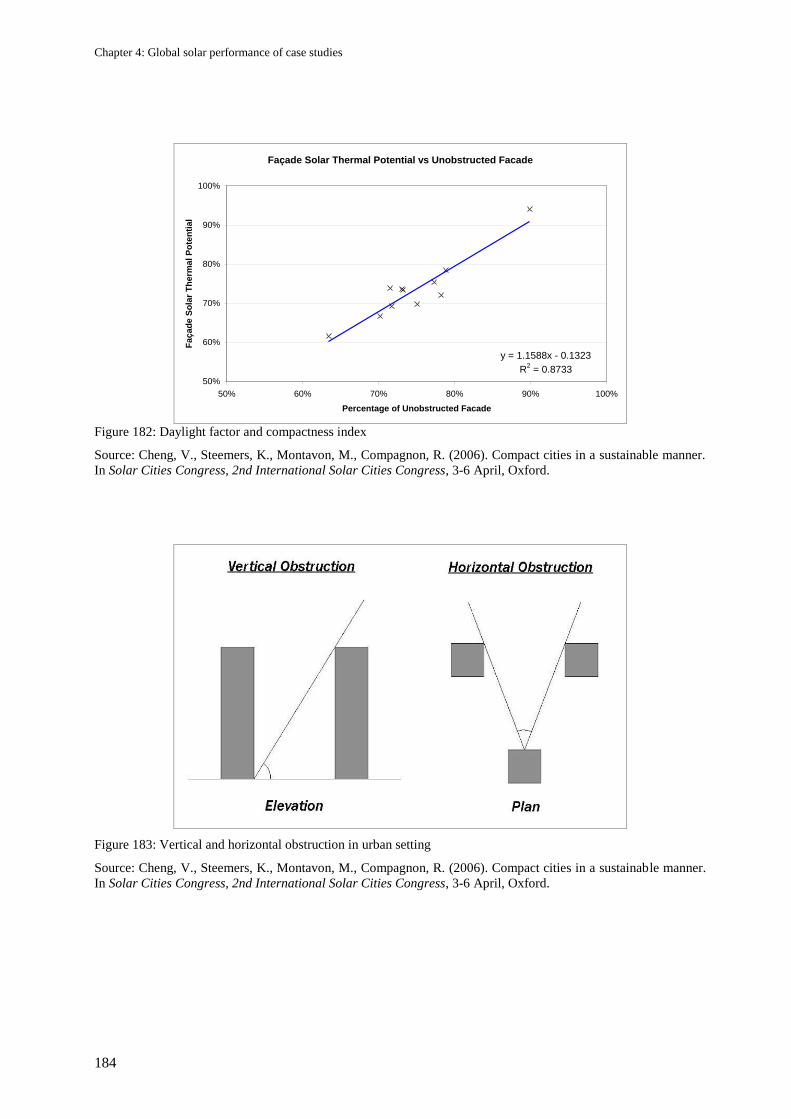
Chapter 4: Global solar performance of case studies
184
Façade Solar Thermal Potential vs Unobstructed Facade
y = 1.1588x - 0.1323
R2 = 0.8733
50%
60%
70%
80%
90%
100%
50% 60% 70% 80% 90% 100%
Percentage of Unobstructed Facade
Fa
ça
de
So
lar
Th
erm
al
Po
ten
tia
l
Figure 182: Daylight factor and compactness index
Source: Cheng, V., Steemers, K., Montavon, M., Compagnon, R. (2006). Compact cities in a sustainable manner.
In Solar Cities Congress, 2nd International Solar Cities Congress, 3-6 April, Oxford.
Figure 183: Vertical and horizontal obstruction in urban setting
Source: Cheng, V., Steemers, K., Montavon, M., Compagnon, R. (2006). Compact cities in a sustainable manner.
In Solar Cities Congress, 2nd International Solar Cities Congress, 3-6 April, Oxford.
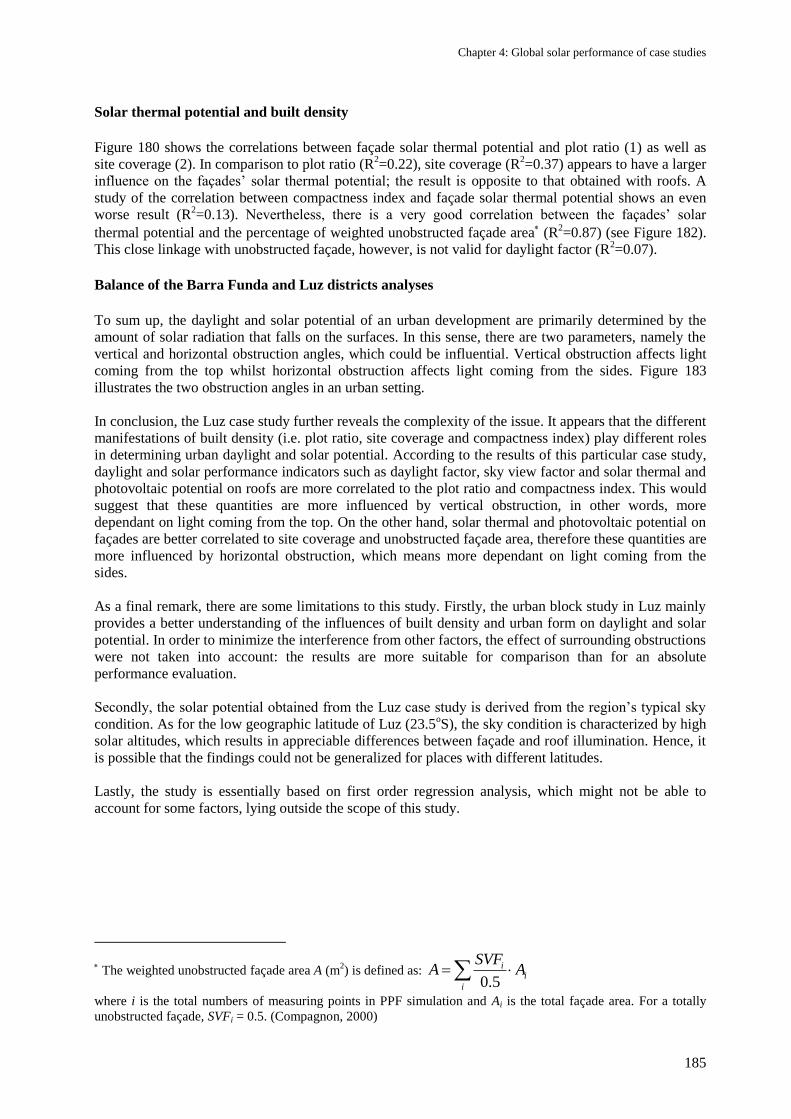
Chapter 4: Global solar performance of case studies
185
Solar thermal potential and built density
Figure 180 shows the correlations between façade solar thermal potential and plot ratio (1) as well as
site coverage (2). In comparison to plot ratio (R2=0.22), site coverage (R
2=0.37) appears to have a larger
influence on the façades‘ solar thermal potential; the result is opposite to that obtained with roofs. A
study of the correlation between compactness index and façade solar thermal potential shows an even
worse result (R2=0.13). Nevertheless, there is a very good correlation between the façades‘ solar
thermal potential and the percentage of weighted unobstructed façade area (R
2=0.87) (see Figure 182).
This close linkage with unobstructed façade, however, is not valid for daylight factor (R2=0.07).
Balance of the Barra Funda and Luz districts analyses
To sum up, the daylight and solar potential of an urban development are primarily determined by the
amount of solar radiation that falls on the surfaces. In this sense, there are two parameters, namely the
vertical and horizontal obstruction angles, which could be influential. Vertical obstruction affects light
coming from the top whilst horizontal obstruction affects light coming from the sides. Figure 183
illustrates the two obstruction angles in an urban setting.
In conclusion, the Luz case study further reveals the complexity of the issue. It appears that the different
manifestations of built density (i.e. plot ratio, site coverage and compactness index) play different roles
in determining urban daylight and solar potential. According to the results of this particular case study,
daylight and solar performance indicators such as daylight factor, sky view factor and solar thermal and
photovoltaic potential on roofs are more correlated to the plot ratio and compactness index. This would
suggest that these quantities are more influenced by vertical obstruction, in other words, more
dependant on light coming from the top. On the other hand, solar thermal and photovoltaic potential on
façades are better correlated to site coverage and unobstructed façade area, therefore these quantities are
more influenced by horizontal obstruction, which means more dependant on light coming from the
sides.
As a final remark, there are some limitations to this study. Firstly, the urban block study in Luz mainly
provides a better understanding of the influences of built density and urban form on daylight and solar
potential. In order to minimize the interference from other factors, the effect of surrounding obstructions
were not taken into account: the results are more suitable for comparison than for an absolute
performance evaluation.
Secondly, the solar potential obtained from the Luz case study is derived from the region‘s typical sky
condition. As for the low geographic latitude of Luz (23.5oS), the sky condition is characterized by high
solar altitudes, which results in appreciable differences between façade and roof illumination. Hence, it
is possible that the findings could not be generalized for places with different latitudes.
Lastly, the study is essentially based on first order regression analysis, which might not be able to
account for some factors, lying outside the scope of this study.
The weighted unobstructed façade area A (m
2) is defined as:
0.5
ii
i
SVFA A
where i is the total numbers of measuring points in PPF simulation and Ai is the total façade area. For a totally
unobstructed façade, SVFi = 0.5. (Compagnon, 2000)
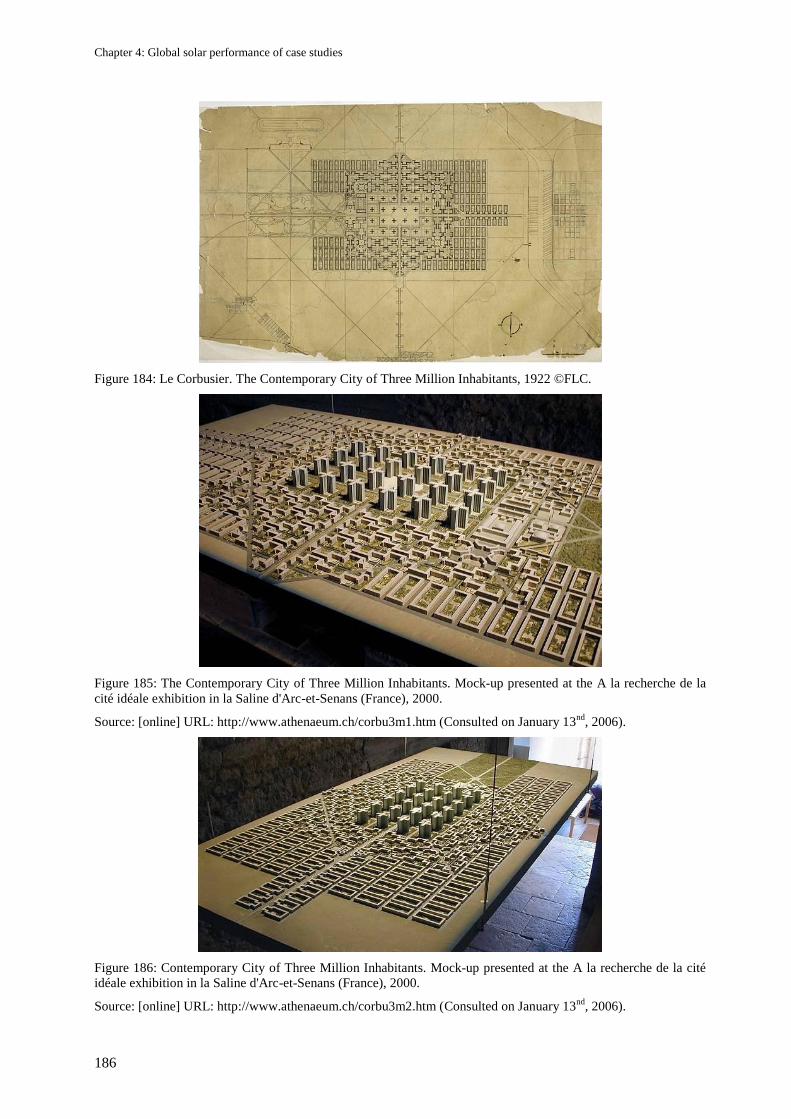
Chapter 4: Global solar performance of case studies
186
Figure 184: Le Corbusier. The Contemporary City of Three Million Inhabitants, 1922 ©FLC.
Figure 185: The Contemporary City of Three Million Inhabitants. Mock-up presented at the A la recherche de la
cité idéale exhibition in la Saline d'Arc-et-Senans (France), 2000.
Source: [online] URL: http://www.athenaeum.ch/corbu3m1.htm (Consulted on January 13nd
, 2006).
Figure 186: Contemporary City of Three Million Inhabitants. Mock-up presented at the A la recherche de la cité
idéale exhibition in la Saline d'Arc-et-Senans (France), 2000.
Source: [online] URL: http://www.athenaeum.ch/corbu3m2.htm (Consulted on January 13nd
, 2006).
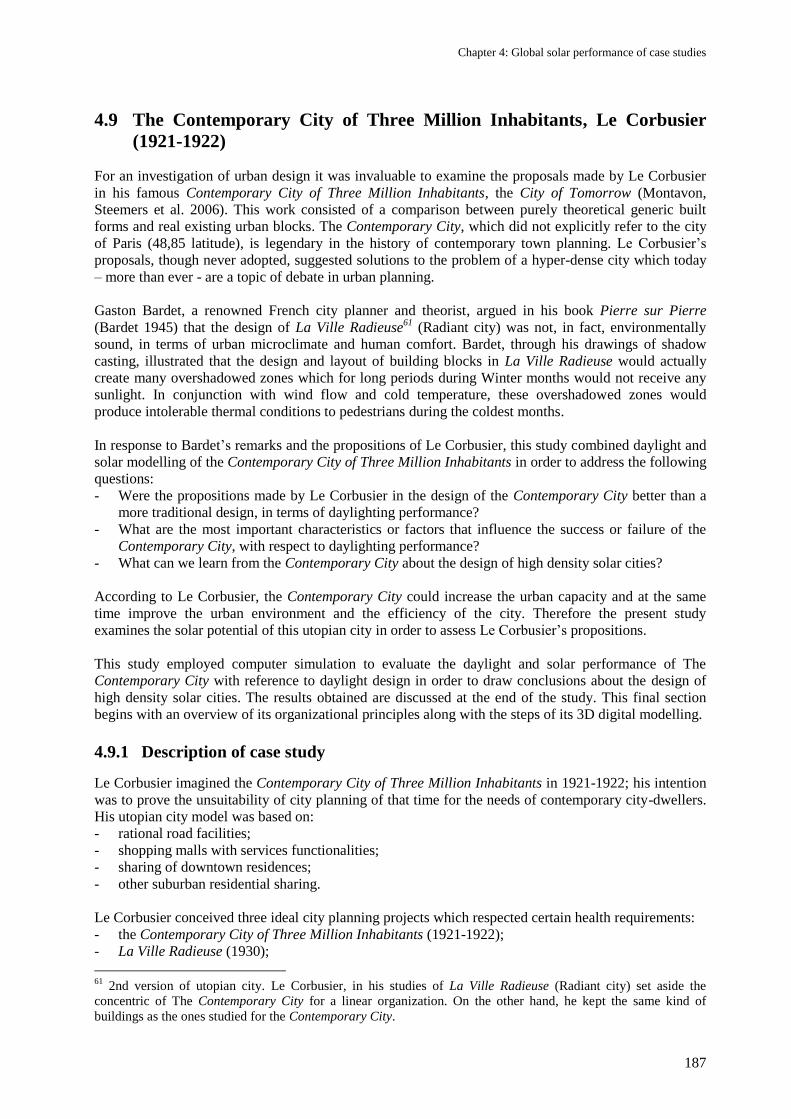
Chapter 4: Global solar performance of case studies
187
4.9 The Contemporary City of Three Million Inhabitants, Le Corbusier
(1921-1922)
For an investigation of urban design it was invaluable to examine the proposals made by Le Corbusier
in his famous Contemporary City of Three Million Inhabitants, the City of Tomorrow (Montavon,
Steemers et al. 2006). This work consisted of a comparison between purely theoretical generic built
forms and real existing urban blocks. The Contemporary City, which did not explicitly refer to the city
of Paris (48,85 latitude), is legendary in the history of contemporary town planning. Le Corbusier‘s
proposals, though never adopted, suggested solutions to the problem of a hyper-dense city which today
– more than ever - are a topic of debate in urban planning.
Gaston Bardet, a renowned French city planner and theorist, argued in his book Pierre sur Pierre
(Bardet 1945) that the design of La Ville Radieuse61
(Radiant city) was not, in fact, environmentally
sound, in terms of urban microclimate and human comfort. Bardet, through his drawings of shadow
casting, illustrated that the design and layout of building blocks in La Ville Radieuse would actually
create many overshadowed zones which for long periods during Winter months would not receive any
sunlight. In conjunction with wind flow and cold temperature, these overshadowed zones would
produce intolerable thermal conditions to pedestrians during the coldest months.
In response to Bardet‘s remarks and the propositions of Le Corbusier, this study combined daylight and
solar modelling of the Contemporary City of Three Million Inhabitants in order to address the following
questions:
- Were the propositions made by Le Corbusier in the design of the Contemporary City better than a
more traditional design, in terms of daylighting performance?
- What are the most important characteristics or factors that influence the success or failure of the
Contemporary City, with respect to daylighting performance?
- What can we learn from the Contemporary City about the design of high density solar cities?
According to Le Corbusier, the Contemporary City could increase the urban capacity and at the same
time improve the urban environment and the efficiency of the city. Therefore the present study
examines the solar potential of this utopian city in order to assess Le Corbusier‘s propositions.
This study employed computer simulation to evaluate the daylight and solar performance of The
Contemporary City with reference to daylight design in order to draw conclusions about the design of
high density solar cities. The results obtained are discussed at the end of the study. This final section
begins with an overview of its organizational principles along with the steps of its 3D digital modelling.
4.9.1 Description of case study
Le Corbusier imagined the Contemporary City of Three Million Inhabitants in 1921-1922; his intention
was to prove the unsuitability of city planning of that time for the needs of contemporary city-dwellers.
His utopian city model was based on:
- rational road facilities;
- shopping malls with services functionalities;
- sharing of downtown residences;
- other suburban residential sharing.
Le Corbusier conceived three ideal city planning projects which respected certain health requirements:
- the Contemporary City of Three Million Inhabitants (1921-1922);
- La Ville Radieuse (1930);
61
2nd version of utopian city. Le Corbusier, in his studies of La Ville Radieuse (Radiant city) set aside the
concentric of The Contemporary City for a linear organization. On the other hand, he kept the same kind of
buildings as the ones studied for the Contemporary City.
Chapter 4: Global solar performance of case studies
188
- and the industrial Ville Linéaire (Linear City);
the last project was a futuristic megapolis, which brought together wide-scale European-style cities
following two North-South and East-West axes.
He presented an urban planning system that tried to combine a high population density with green
spaces, natural ventilation and daylight provision. His view of the city at the beginning of the
20th century was very critical: he considered it to be sick and chaotic with the potential to trigger a
revolution. He tried to conceive a rational urban plan that the emerging industrial world could integrate
harmoniously into new cities. The concept of this city was virulently disputed by Gaston Bardet (1945)
and by Jean Lebreton (1945) as explained by Harzallah (Harzallah 2007).
The Contemporary City was first exhibited in November, 1922 at the Salon d’Automne in Paris. The
corresponding diorama, which was part of the urban art section, was set in a virtual terrain with hardly
any identifiable topography landmarks; Le Corbusier was obviously referring to Paris, whose
population exceeded three million in 1919, and which had not stopped growing since then (see Figure
184, Figure 185 and Figure 186). Later on, he adapted his utopian cities to Barcelona, Buenos-Aires,
São Paulo and Algiers.
The objective of Le Corbusier was to establish a green city for a million and a half inhabitants according
for the following basic principles:
- pedestrian ways must be free of motor traffic, the main axes exclusively devoted to automobiles
must be located far away from buildings (to avoid accidents with pedestrians);
- principles for urban settlement were established in order to influence the articulation of the linear
residential buildings (to achieve a rectangular angle);
- the various functional areas were ordered inside regular squared cells (to achieve an appropriate
zoning).
Three main urban areas were defined in this way:
- a business district and institutional buildings, such as university and governmental buildings,
located North near the railway station and the airport (comprising also hotels and embassies);
- an industrial area, located South, split up into heavy and light industries, as well as warehouses;
- a residential area, located between the business district and the industrial area, protected by a green
strip from the industrial zone.
Streets cut across the settlement orthogonally or diagonally for high-speed travelling, railways make up
an external belt, the metropolitan rail network is located underground.
The street blocks, shaped by the road mesh, make up 400 meter squares which differ from the historical
subdivision into smaller fractions. They are laid out in a way that can offer large open adjacent areas for
public usage: in order to achieve this result, expropriation of the current buildings was envisaged.
Starting from a standard gross area of 14 m2 per inhabitant, the accommodations were sized with a view
to minimizing the built-up surfaces: the result is 11% of the total covered area and an urban density of
1,000 inhabitants per hectare or 10 m2 per inhabitant (1,000 inhabitants per 2.5 acres). Construction-free
zones were mainly dedicated to green recreational areas. Pathways inside the park, protected by
awnings, were reserved for pedestrians. Access roads had three different section types (54 m with a
lateral tramway, 40 m and 28 m). The streets penetrated into the building blocks according to their
entrances, where parking lots would be available. Diagonal high-flow streets were elevated on pilings.
Residential accommodations were provided by linear eleven-storey macro buildings at right angles to
each other (residential buildings of the Contemporary City had a height of 50 metres). The ground,
entirely built on pillars, was completely adaptable to any kind of configuration. It was thus possible to
configure it anywhere within the park's surface and to distribute social and entertainment services as
required.
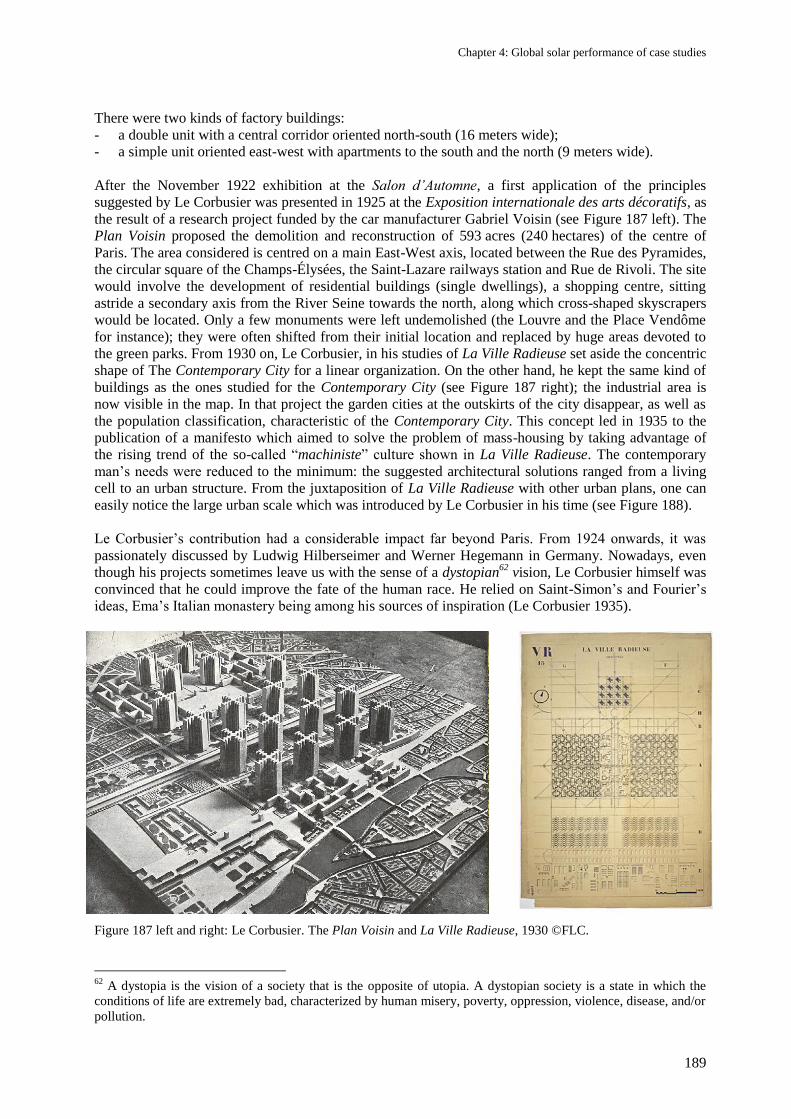
Chapter 4: Global solar performance of case studies
189
There were two kinds of factory buildings:
- a double unit with a central corridor oriented north-south (16 meters wide);
- a simple unit oriented east-west with apartments to the south and the north (9 meters wide).
After the November 1922 exhibition at the Salon d’Automne, a first application of the principles
suggested by Le Corbusier was presented in 1925 at the Exposition internationale des arts décoratifs, as
the result of a research project funded by the car manufacturer Gabriel Voisin (see Figure 187 left). The
Plan Voisin proposed the demolition and reconstruction of 593 acres (240 hectares) of the centre of
Paris. The area considered is centred on a main East-West axis, located between the Rue des Pyramides,
the circular square of the Champs-Élysées, the Saint-Lazare railways station and Rue de Rivoli. The site
would involve the development of residential buildings (single dwellings), a shopping centre, sitting
astride a secondary axis from the River Seine towards the north, along which cross-shaped skyscrapers
would be located. Only a few monuments were left undemolished (the Louvre and the Place Vendôme
for instance); they were often shifted from their initial location and replaced by huge areas devoted to
the green parks. From 1930 on, Le Corbusier, in his studies of La Ville Radieuse set aside the concentric
shape of The Contemporary City for a linear organization. On the other hand, he kept the same kind of
buildings as the ones studied for the Contemporary City (see Figure 187 right); the industrial area is
now visible in the map. In that project the garden cities at the outskirts of the city disappear, as well as
the population classification, characteristic of the Contemporary City. This concept led in 1935 to the
publication of a manifesto which aimed to solve the problem of mass-housing by taking advantage of
the rising trend of the so-called ―machiniste‖ culture shown in La Ville Radieuse. The contemporary
man‘s needs were reduced to the minimum: the suggested architectural solutions ranged from a living
cell to an urban structure. From the juxtaposition of La Ville Radieuse with other urban plans, one can
easily notice the large urban scale which was introduced by Le Corbusier in his time (see Figure 188).
Le Corbusier‘s contribution had a considerable impact far beyond Paris. From 1924 onwards, it was
passionately discussed by Ludwig Hilberseimer and Werner Hegemann in Germany. Nowadays, even
though his projects sometimes leave us with the sense of a dystopian62
vision, Le Corbusier himself was
convinced that he could improve the fate of the human race. He relied on Saint-Simon‘s and Fourier‘s
ideas, Ema‘s Italian monastery being among his sources of inspiration (Le Corbusier 1935).
Figure 187 left and right: Le Corbusier. The Plan Voisin and La Ville Radieuse, 1930 ©FLC.
62
A dystopia is the vision of a society that is the opposite of utopia. A dystopian society is a state in which the
conditions of life are extremely bad, characterized by human misery, poverty, oppression, violence, disease, and/or
pollution.
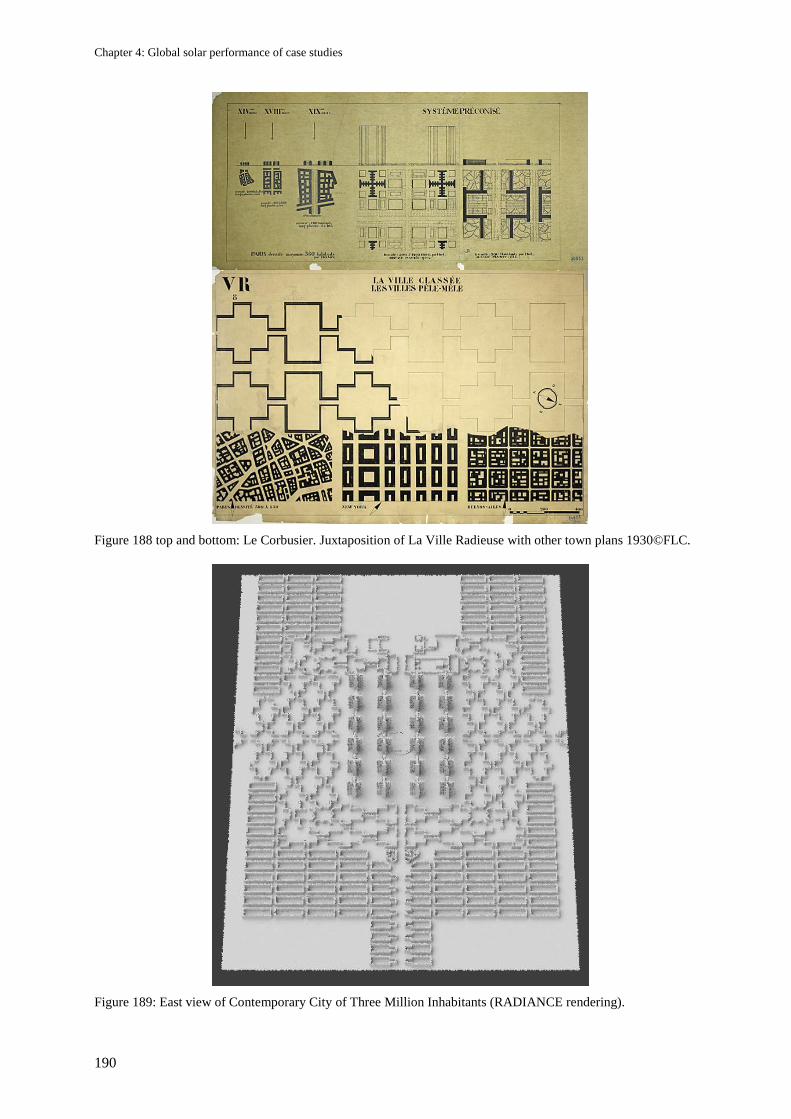
Chapter 4: Global solar performance of case studies
190
Figure 188 top and bottom: Le Corbusier. Juxtaposition of La Ville Radieuse with other town plans 1930©FLC.
Figure 189: East view of Contemporary City of Three Million Inhabitants (RADIANCE rendering).
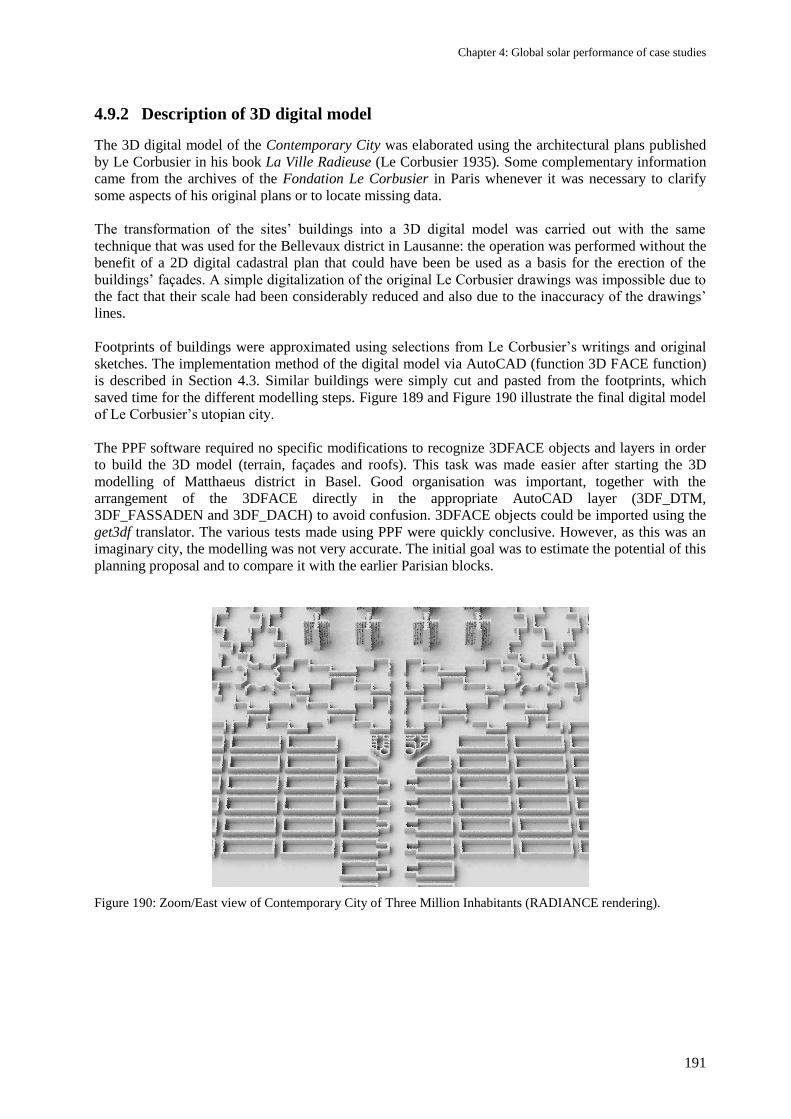
Chapter 4: Global solar performance of case studies
191
4.9.2 Description of 3D digital model
The 3D digital model of the Contemporary City was elaborated using the architectural plans published
by Le Corbusier in his book La Ville Radieuse (Le Corbusier 1935). Some complementary information
came from the archives of the Fondation Le Corbusier in Paris whenever it was necessary to clarify
some aspects of his original plans or to locate missing data.
The transformation of the sites‘ buildings into a 3D digital model was carried out with the same
technique that was used for the Bellevaux district in Lausanne: the operation was performed without the
benefit of a 2D digital cadastral plan that could have been be used as a basis for the erection of the
buildings‘ façades. A simple digitalization of the original Le Corbusier drawings was impossible due to
the fact that their scale had been considerably reduced and also due to the inaccuracy of the drawings‘
lines.
Footprints of buildings were approximated using selections from Le Corbusier‘s writings and original
sketches. The implementation method of the digital model via AutoCAD (function 3D FACE function)
is described in Section 4.3. Similar buildings were simply cut and pasted from the footprints, which
saved time for the different modelling steps. Figure 189 and Figure 190 illustrate the final digital model
of Le Corbusier‘s utopian city.
The PPF software required no specific modifications to recognize 3DFACE objects and layers in order
to build the 3D model (terrain, façades and roofs). This task was made easier after starting the 3D
modelling of Matthaeus district in Basel. Good organisation was important, together with the
arrangement of the 3DFACE directly in the appropriate AutoCAD layer (3DF_DTM,
3DF_FASSADEN and 3DF_DACH) to avoid confusion. 3DFACE objects could be imported using the
get3df translator. The various tests made using PPF were quickly conclusive. However, as this was an
imaginary city, the modelling was not very accurate. The initial goal was to estimate the potential of this
planning proposal and to compare it with the earlier Parisian blocks.
Figure 190: Zoom/East view of Contemporary City of Three Million Inhabitants (RADIANCE rendering).
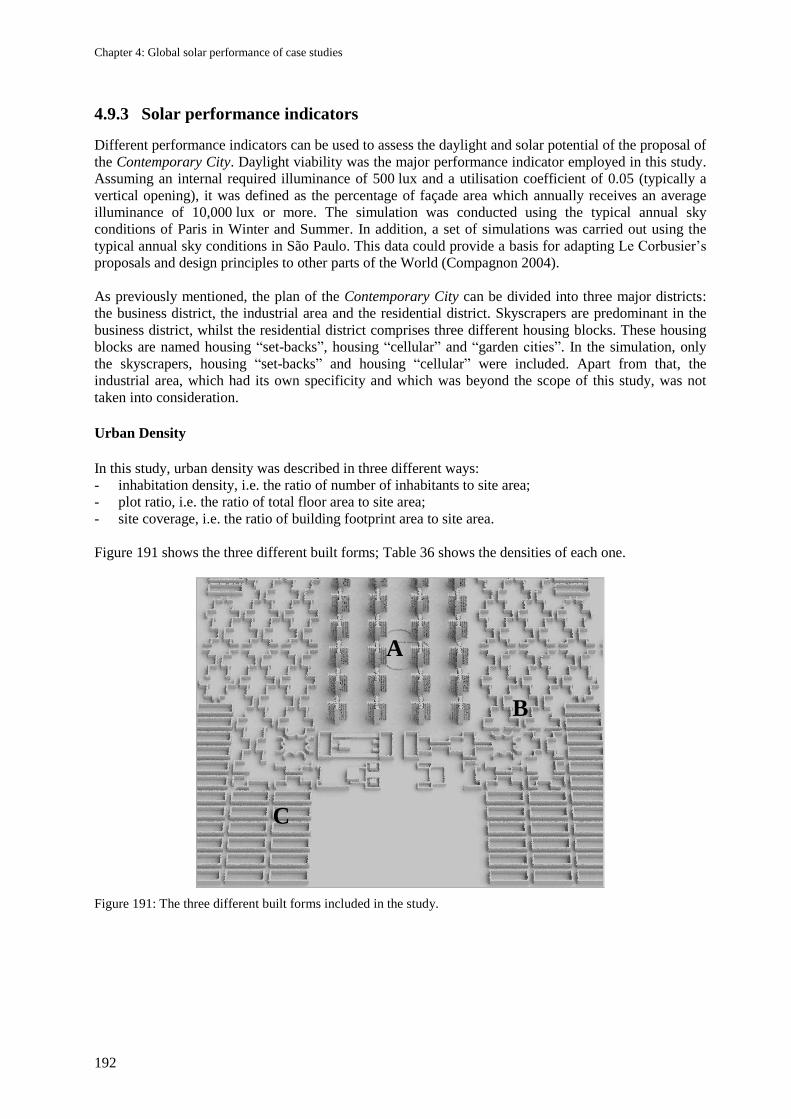
Chapter 4: Global solar performance of case studies
192
4.9.3 Solar performance indicators
Different performance indicators can be used to assess the daylight and solar potential of the proposal of
the Contemporary City. Daylight viability was the major performance indicator employed in this study.
Assuming an internal required illuminance of 500 lux and a utilisation coefficient of 0.05 (typically a
vertical opening), it was defined as the percentage of façade area which annually receives an average
illuminance of 10,000 lux or more. The simulation was conducted using the typical annual sky
conditions of Paris in Winter and Summer. In addition, a set of simulations was carried out using the
typical annual sky conditions in São Paulo. This data could provide a basis for adapting Le Corbusier‘s
proposals and design principles to other parts of the World (Compagnon 2004).
As previously mentioned, the plan of the Contemporary City can be divided into three major districts:
the business district, the industrial area and the residential district. Skyscrapers are predominant in the
business district, whilst the residential district comprises three different housing blocks. These housing
blocks are named housing ―set-backs‖, housing ―cellular‖ and ―garden cities‖. In the simulation, only
the skyscrapers, housing ―set-backs‖ and housing ―cellular‖ were included. Apart from that, the
industrial area, which had its own specificity and which was beyond the scope of this study, was not
taken into consideration.
Urban Density
In this study, urban density was described in three different ways:
- inhabitation density, i.e. the ratio of number of inhabitants to site area;
- plot ratio, i.e. the ratio of total floor area to site area;
- site coverage, i.e. the ratio of building footprint area to site area.
Figure 191 shows the three different built forms; Table 36 shows the densities of each one.
Figure 191: The three different built forms included in the study.
B
A
C
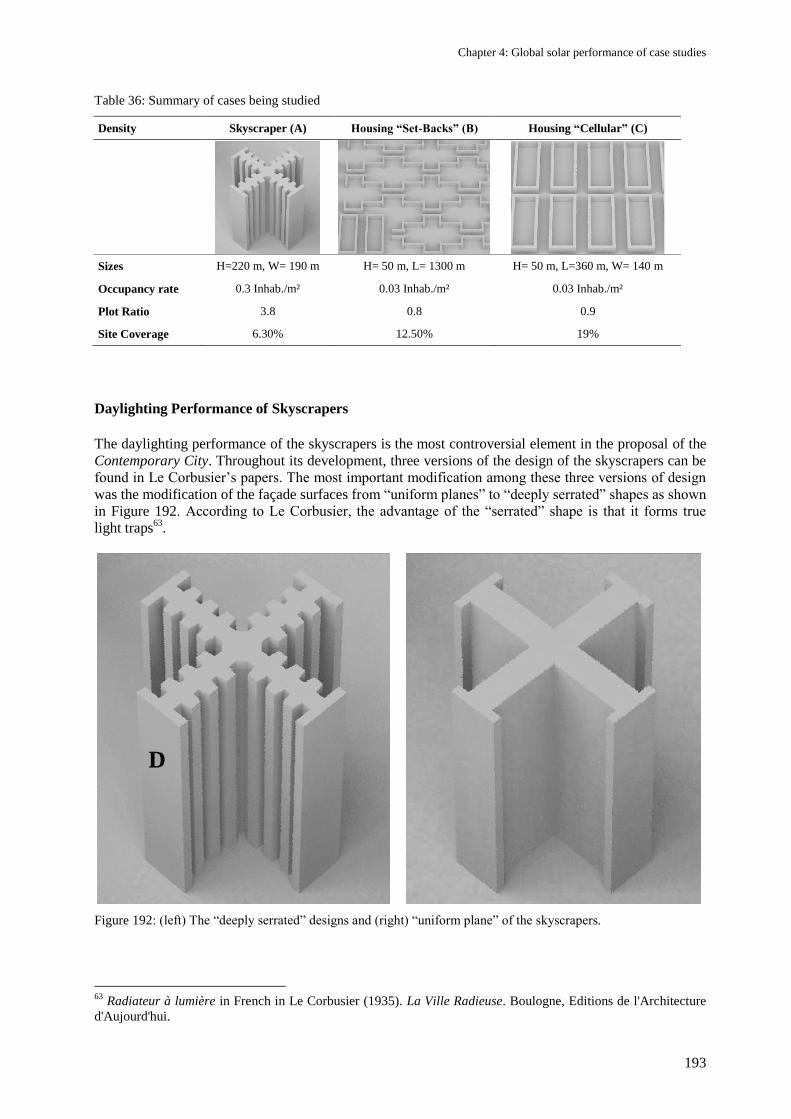
Chapter 4: Global solar performance of case studies
193
Table 36: Summary of cases being studied
Density Skyscraper (A) Housing “Set-Backs” (B) Housing “Cellular” (C)
Sizes H=220 m, W= 190 m H= 50 m, L= 1300 m H= 50 m, L=360 m, W= 140 m
Occupancy rate 0.3 Inhab./m² 0.03 Inhab./m² 0.03 Inhab./m²
Plot Ratio 3.8 0.8 0.9
Site Coverage 6.30% 12.50% 19%
Daylighting Performance of Skyscrapers
The daylighting performance of the skyscrapers is the most controversial element in the proposal of the
Contemporary City. Throughout its development, three versions of the design of the skyscrapers can be
found in Le Corbusier‘s papers. The most important modification among these three versions of design
was the modification of the façade surfaces from ―uniform planes‖ to ―deeply serrated‖ shapes as shown
in Figure 192. According to Le Corbusier, the advantage of the ―serrated‖ shape is that it forms true
light traps63
.
Figure 192: (left) The ―deeply serrated‖ designs and (right) ―uniform plane‖ of the skyscrapers.
63
Radiateur à lumière in French in Le Corbusier (1935). La Ville Radieuse. Boulogne, Editions de l'Architecture
d'Aujourd'hui.
D
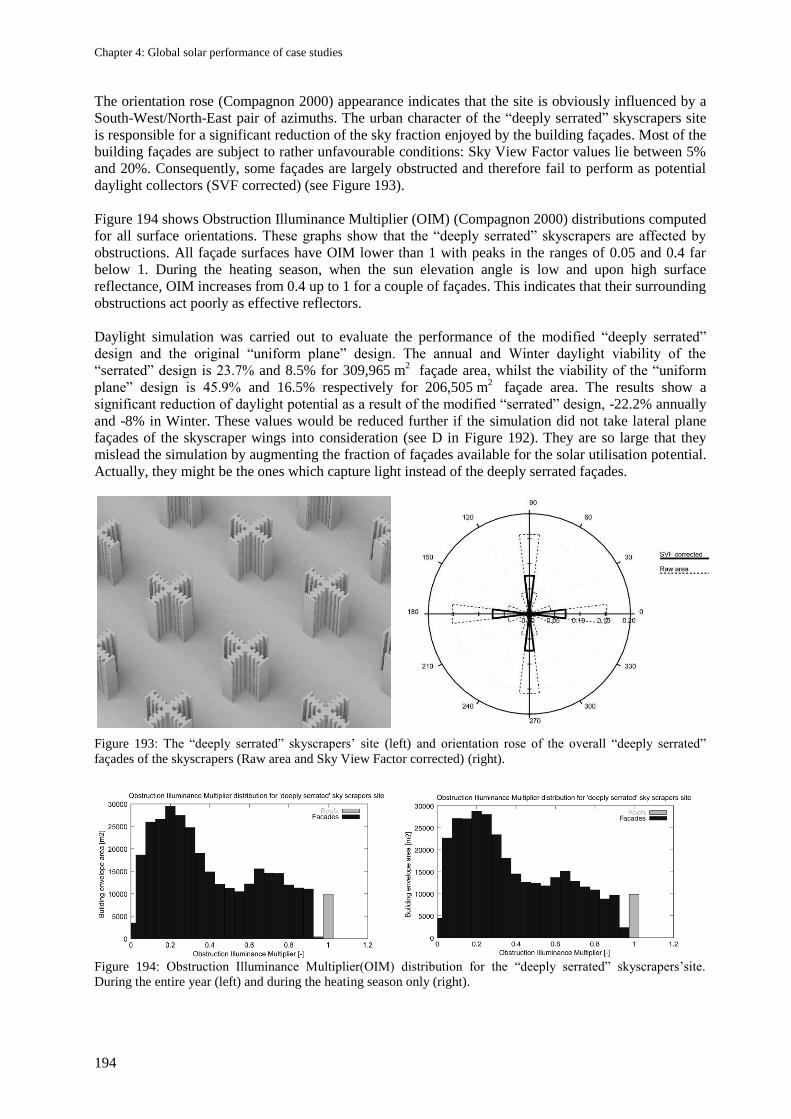
Chapter 4: Global solar performance of case studies
194
The orientation rose (Compagnon 2000) appearance indicates that the site is obviously influenced by a
South-West/North-East pair of azimuths. The urban character of the ―deeply serrated‖ skyscrapers site
is responsible for a significant reduction of the sky fraction enjoyed by the building façades. Most of the
building façades are subject to rather unfavourable conditions: Sky View Factor values lie between 5%
and 20%. Consequently, some façades are largely obstructed and therefore fail to perform as potential
daylight collectors (SVF corrected) (see Figure 193).
Figure 194 shows Obstruction Illuminance Multiplier (OIM) (Compagnon 2000) distributions computed
for all surface orientations. These graphs show that the ―deeply serrated‖ skyscrapers are affected by
obstructions. All façade surfaces have OIM lower than 1 with peaks in the ranges of 0.05 and 0.4 far
below 1. During the heating season, when the sun elevation angle is low and upon high surface
reflectance, OIM increases from 0.4 up to 1 for a couple of façades. This indicates that their surrounding
obstructions act poorly as effective reflectors.
Daylight simulation was carried out to evaluate the performance of the modified ―deeply serrated‖
design and the original ―uniform plane‖ design. The annual and Winter daylight viability of the
―serrated‖ design is 23.7% and 8.5% for 309,965 m2 façade area, whilst the viability of the ―uniform
plane‖ design is 45.9% and 16.5% respectively for 206,505 m2 façade area. The results show a
significant reduction of daylight potential as a result of the modified ―serrated‖ design, -22.2% annually
and -8% in Winter. These values would be reduced further if the simulation did not take lateral plane
façades of the skyscraper wings into consideration (see D in Figure 192). They are so large that they
mislead the simulation by augmenting the fraction of façades available for the solar utilisation potential.
Actually, they might be the ones which capture light instead of the deeply serrated façades.
Figure 193: The ―deeply serrated‖ skyscrapers‘ site (left) and orientation rose of the overall ―deeply serrated‖
façades of the skyscrapers (Raw area and Sky View Factor corrected) (right).
Figure 194: Obstruction Illuminance Multiplier(OIM) distribution for the ―deeply serrated‖ skyscrapers‘site.
During the entire year (left) and during the heating season only (right).
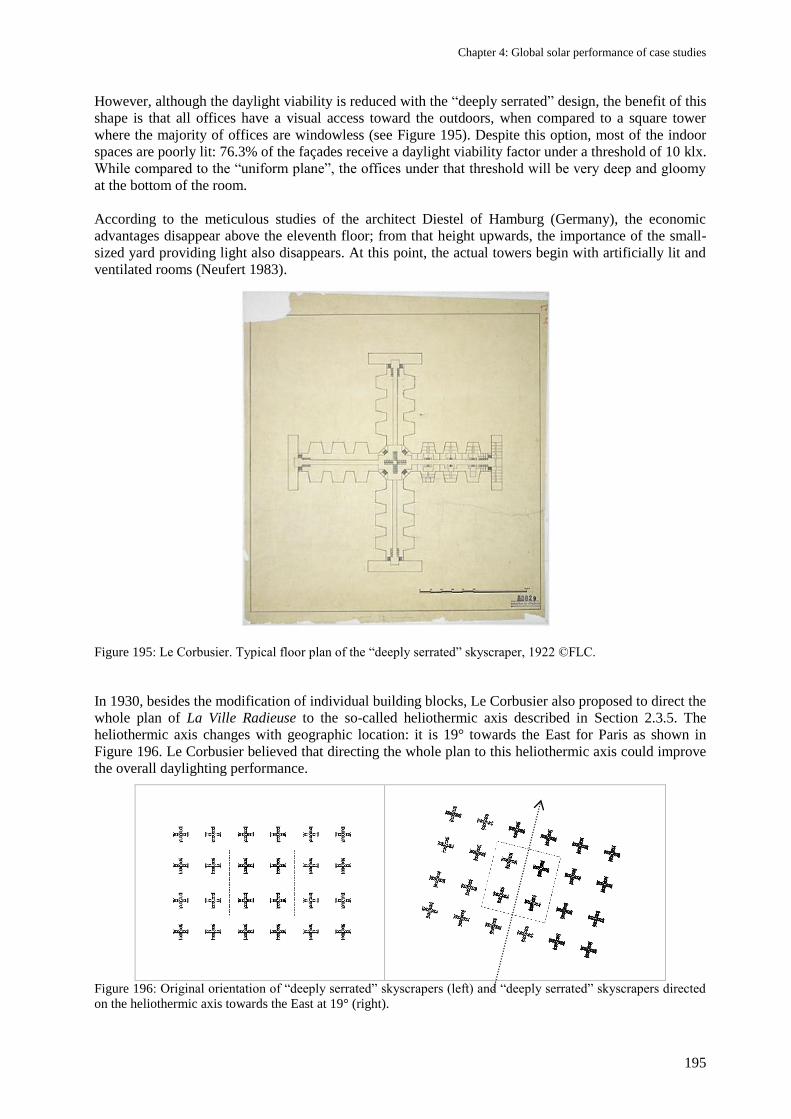
Chapter 4: Global solar performance of case studies
195
However, although the daylight viability is reduced with the ―deeply serrated‖ design, the benefit of this
shape is that all offices have a visual access toward the outdoors, when compared to a square tower
where the majority of offices are windowless (see Figure 195). Despite this option, most of the indoor
spaces are poorly lit: 76.3% of the façades receive a daylight viability factor under a threshold of 10 klx.
While compared to the ―uniform plane‖, the offices under that threshold will be very deep and gloomy
at the bottom of the room.
According to the meticulous studies of the architect Diestel of Hamburg (Germany), the economic
advantages disappear above the eleventh floor; from that height upwards, the importance of the small-
sized yard providing light also disappears. At this point, the actual towers begin with artificially lit and
ventilated rooms (Neufert 1983).
Figure 195: Le Corbusier. Typical floor plan of the ―deeply serrated‖ skyscraper, 1922 ©FLC.
In 1930, besides the modification of individual building blocks, Le Corbusier also proposed to direct the
whole plan of La Ville Radieuse to the so-called heliothermic axis described in Section 2.3.5. The
heliothermic axis changes with geographic location: it is 19° towards the East for Paris as shown in
Figure 196. Le Corbusier believed that directing the whole plan to this heliothermic axis could improve
the overall daylighting performance.
Figure 196: Original orientation of ―deeply serrated‖ skyscrapers (left) and ―deeply serrated‖ skyscrapers directed
on the heliothermic axis towards the East at 19° (right).
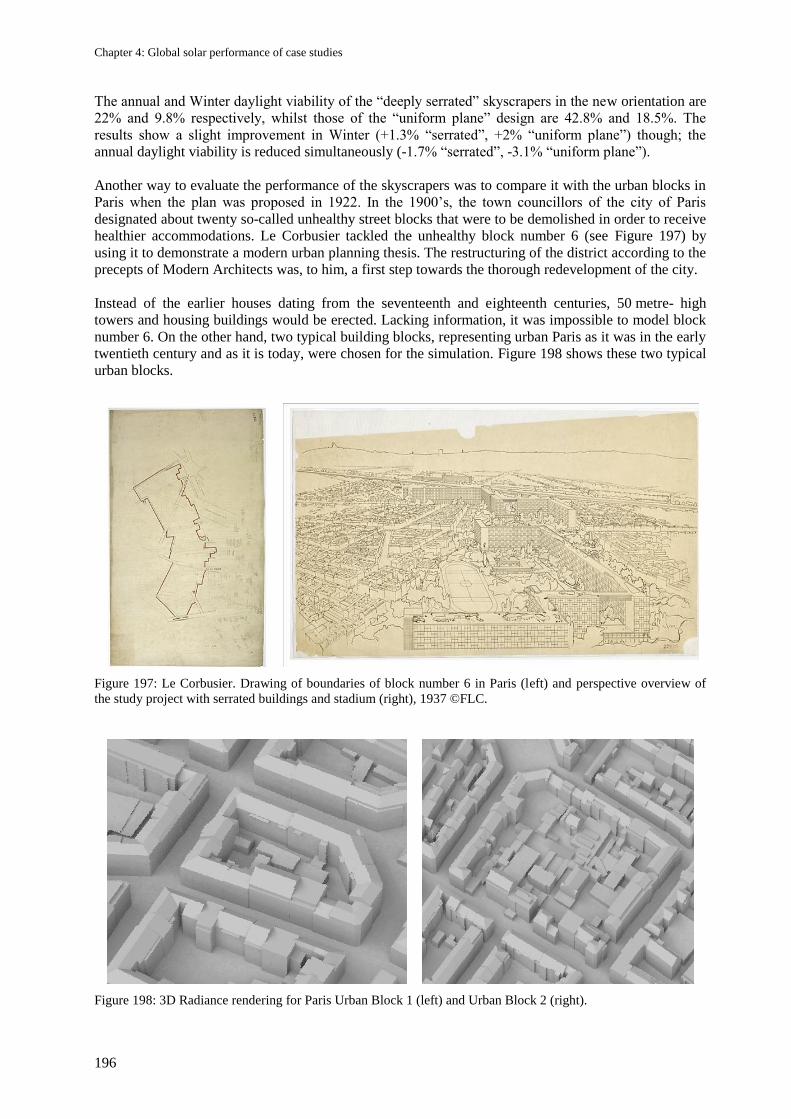
Chapter 4: Global solar performance of case studies
196
The annual and Winter daylight viability of the ―deeply serrated‖ skyscrapers in the new orientation are
22% and 9.8% respectively, whilst those of the ―uniform plane‖ design are 42.8% and 18.5%. The
results show a slight improvement in Winter (+1.3% ―serrated‖, +2% ―uniform plane‖) though; the
annual daylight viability is reduced simultaneously (-1.7% ―serrated‖, -3.1% ―uniform plane‖).
Another way to evaluate the performance of the skyscrapers was to compare it with the urban blocks in
Paris when the plan was proposed in 1922. In the 1900‘s, the town councillors of the city of Paris
designated about twenty so-called unhealthy street blocks that were to be demolished in order to receive
healthier accommodations. Le Corbusier tackled the unhealthy block number 6 (see Figure 197) by
using it to demonstrate a modern urban planning thesis. The restructuring of the district according to the
precepts of Modern Architects was, to him, a first step towards the thorough redevelopment of the city.
Instead of the earlier houses dating from the seventeenth and eighteenth centuries, 50 metre- high
towers and housing buildings would be erected. Lacking information, it was impossible to model block
number 6. On the other hand, two typical building blocks, representing urban Paris as it was in the early
twentieth century and as it is today, were chosen for the simulation. Figure 198 shows these two typical
urban blocks.
Figure 197: Le Corbusier. Drawing of boundaries of block number 6 in Paris (left) and perspective overview of
the study project with serrated buildings and stadium (right), 1937 ©FLC.
Figure 198: 3D Radiance rendering for Paris Urban Block 1 (left) and Urban Block 2 (right).
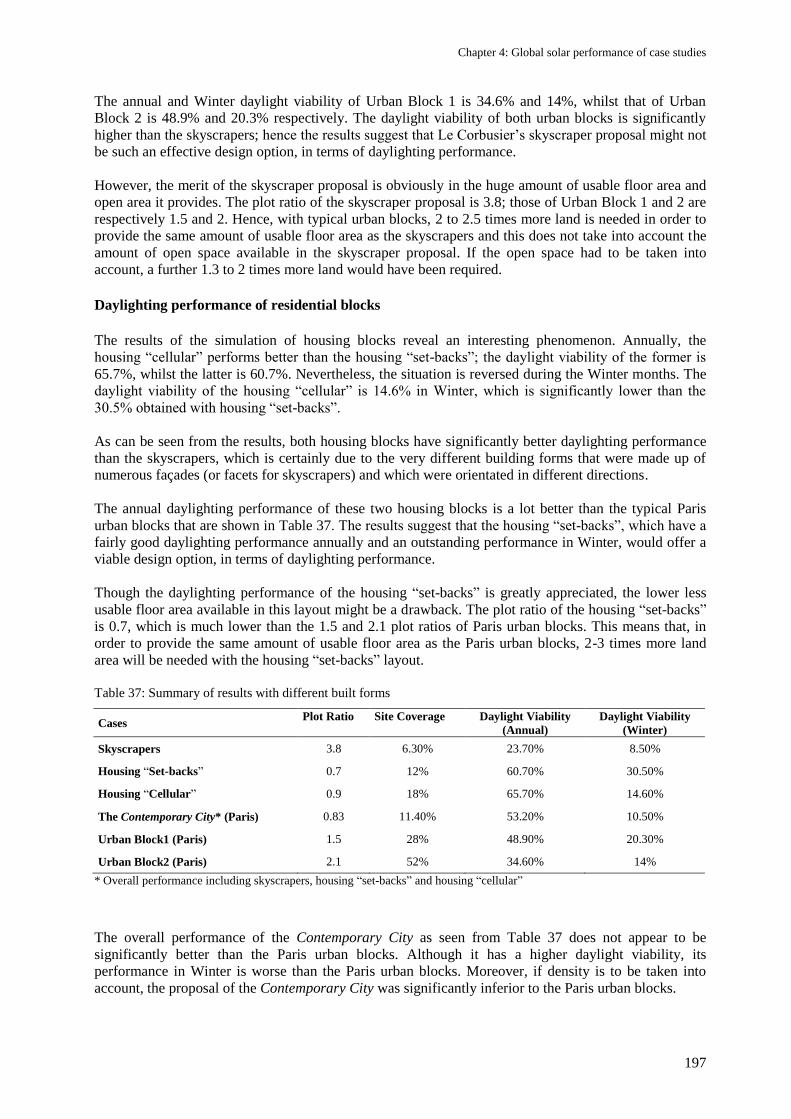
Chapter 4: Global solar performance of case studies
197
The annual and Winter daylight viability of Urban Block 1 is 34.6% and 14%, whilst that of Urban
Block 2 is 48.9% and 20.3% respectively. The daylight viability of both urban blocks is significantly
higher than the skyscrapers; hence the results suggest that Le Corbusier‘s skyscraper proposal might not
be such an effective design option, in terms of daylighting performance.
However, the merit of the skyscraper proposal is obviously in the huge amount of usable floor area and
open area it provides. The plot ratio of the skyscraper proposal is 3.8; those of Urban Block 1 and 2 are
respectively 1.5 and 2. Hence, with typical urban blocks, 2 to 2.5 times more land is needed in order to
provide the same amount of usable floor area as the skyscrapers and this does not take into account the
amount of open space available in the skyscraper proposal. If the open space had to be taken into
account, a further 1.3 to 2 times more land would have been required.
Daylighting performance of residential blocks
The results of the simulation of housing blocks reveal an interesting phenomenon. Annually, the
housing ―cellular‖ performs better than the housing ―set-backs‖; the daylight viability of the former is
65.7%, whilst the latter is 60.7%. Nevertheless, the situation is reversed during the Winter months. The
daylight viability of the housing ―cellular‖ is 14.6% in Winter, which is significantly lower than the
30.5% obtained with housing ―set-backs‖.
As can be seen from the results, both housing blocks have significantly better daylighting performance
than the skyscrapers, which is certainly due to the very different building forms that were made up of
numerous façades (or facets for skyscrapers) and which were orientated in different directions.
The annual daylighting performance of these two housing blocks is a lot better than the typical Paris
urban blocks that are shown in Table 37. The results suggest that the housing ―set-backs‖, which have a
fairly good daylighting performance annually and an outstanding performance in Winter, would offer a
viable design option, in terms of daylighting performance.
Though the daylighting performance of the housing ―set-backs‖ is greatly appreciated, the lower less
usable floor area available in this layout might be a drawback. The plot ratio of the housing ―set-backs‖
is 0.7, which is much lower than the 1.5 and 2.1 plot ratios of Paris urban blocks. This means that, in
order to provide the same amount of usable floor area as the Paris urban blocks, 2-3 times more land
area will be needed with the housing ―set-backs‖ layout.
Table 37: Summary of results with different built forms
Cases Plot Ratio
Site Coverage
Daylight Viability
(Annual)
Daylight Viability
(Winter)
Skyscrapers 3.8 6.30% 23.70% 8.50%
Housing ―Set-backs‖ 0.7 12% 60.70% 30.50%
Housing ―Cellular‖ 0.9 18% 65.70% 14.60%
The Contemporary City* (Paris) 0.83 11.40% 53.20% 10.50%
Urban Block1 (Paris) 1.5 28% 48.90% 20.30%
Urban Block2 (Paris) 2.1 52% 34.60% 14%
* Overall performance including skyscrapers, housing ―set-backs‖ and housing ―cellular‖
The overall performance of the Contemporary City as seen from Table 37 does not appear to be
significantly better than the Paris urban blocks. Although it has a higher daylight viability, its
performance in Winter is worse than the Paris urban blocks. Moreover, if density is to be taken into
account, the proposal of the Contemporary City was significantly inferior to the Paris urban blocks.
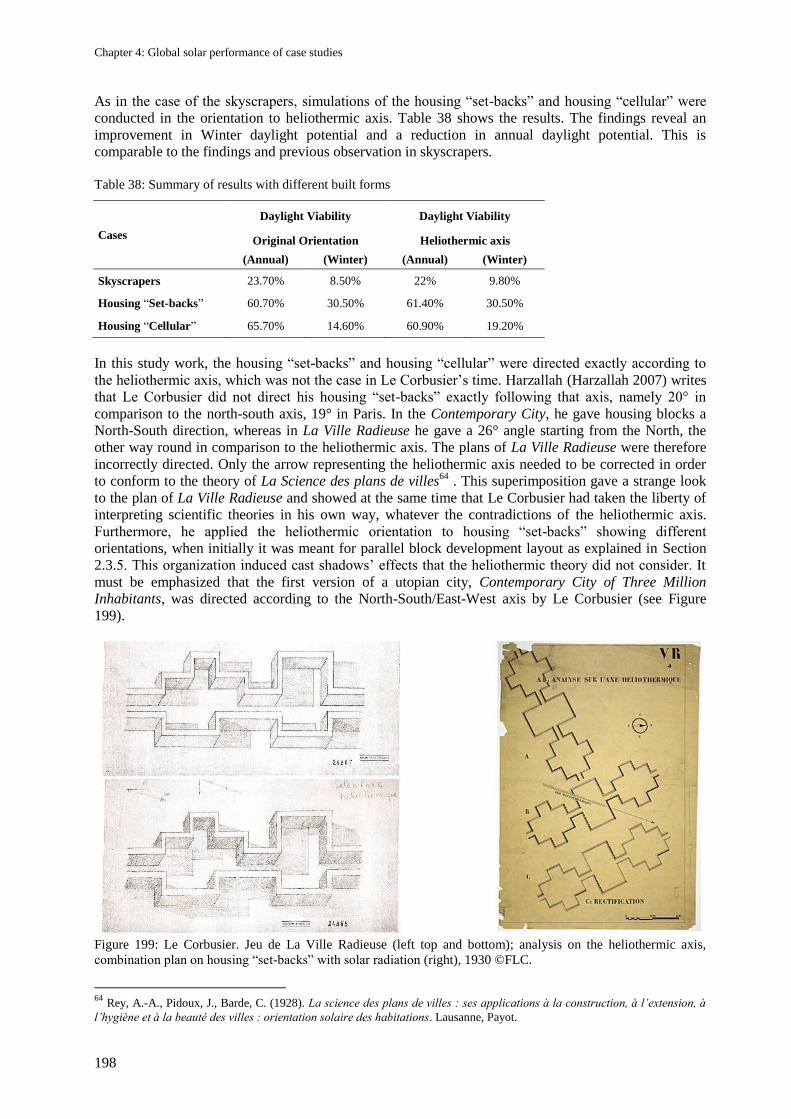
Chapter 4: Global solar performance of case studies
198
As in the case of the skyscrapers, simulations of the housing ―set-backs‖ and housing ―cellular‖ were
conducted in the orientation to heliothermic axis. Table 38 shows the results. The findings reveal an
improvement in Winter daylight potential and a reduction in annual daylight potential. This is
comparable to the findings and previous observation in skyscrapers.
Table 38: Summary of results with different built forms
Cases
Daylight Viability Daylight Viability
Original Orientation Heliothermic axis
(Annual) (Winter) (Annual) (Winter)
Skyscrapers 23.70% 8.50% 22% 9.80%
Housing ―Set-backs‖ 60.70% 30.50% 61.40% 30.50%
Housing ―Cellular‖ 65.70% 14.60% 60.90% 19.20%
In this study work, the housing ―set-backs‖ and housing ―cellular‖ were directed exactly according to
the heliothermic axis, which was not the case in Le Corbusier‘s time. Harzallah (Harzallah 2007) writes
that Le Corbusier did not direct his housing ―set-backs‖ exactly following that axis, namely 20° in
comparison to the north-south axis, 19° in Paris. In the Contemporary City, he gave housing blocks a
North-South direction, whereas in La Ville Radieuse he gave a 26° angle starting from the North, the
other way round in comparison to the heliothermic axis. The plans of La Ville Radieuse were therefore
incorrectly directed. Only the arrow representing the heliothermic axis needed to be corrected in order
to conform to the theory of La Science des plans de villes64
. This superimposition gave a strange look
to the plan of La Ville Radieuse and showed at the same time that Le Corbusier had taken the liberty of
interpreting scientific theories in his own way, whatever the contradictions of the heliothermic axis.
Furthermore, he applied the heliothermic orientation to housing ―set-backs‖ showing different
orientations, when initially it was meant for parallel block development layout as explained in Section
2.3.5. This organization induced cast shadows‘ effects that the heliothermic theory did not consider. It
must be emphasized that the first version of a utopian city, Contemporary City of Three Million
Inhabitants, was directed according to the North-South/East-West axis by Le Corbusier (see Figure
199).
Figure 199: Le Corbusier. Jeu de La Ville Radieuse (left top and bottom); analysis on the heliothermic axis,
combination plan on housing ―set-backs‖ with solar radiation (right), 1930 ©FLC.
64
Rey, A.-A., Pidoux, J., Barde, C. (1928). La science des plans de villes : ses applications à la construction, à l’extension, à
l’hygiène et à la beauté des villes : orientation solaire des habitations. Lausanne, Payot.
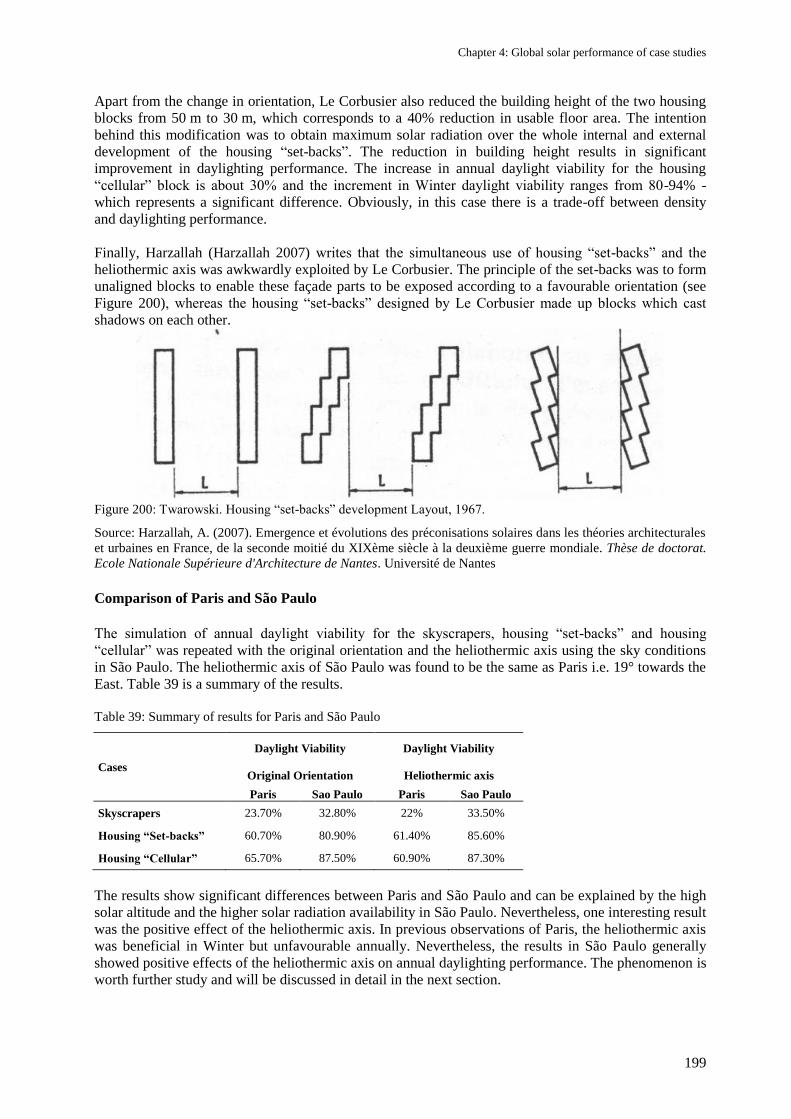
Chapter 4: Global solar performance of case studies
199
Apart from the change in orientation, Le Corbusier also reduced the building height of the two housing
blocks from 50 m to 30 m, which corresponds to a 40% reduction in usable floor area. The intention
behind this modification was to obtain maximum solar radiation over the whole internal and external
development of the housing ―set-backs‖. The reduction in building height results in significant
improvement in daylighting performance. The increase in annual daylight viability for the housing
―cellular‖ block is about 30% and the increment in Winter daylight viability ranges from 80-94% -
which represents a significant difference. Obviously, in this case there is a trade-off between density
and daylighting performance.
Finally, Harzallah (Harzallah 2007) writes that the simultaneous use of housing ―set-backs‖ and the
heliothermic axis was awkwardly exploited by Le Corbusier. The principle of the set-backs was to form
unaligned blocks to enable these façade parts to be exposed according to a favourable orientation (see
Figure 200), whereas the housing ―set-backs‖ designed by Le Corbusier made up blocks which cast
shadows on each other.
Figure 200: Twarowski. Housing ―set-backs‖ development Layout, 1967.
Source: Harzallah, A. (2007). Emergence et évolutions des préconisations solaires dans les théories architecturales
et urbaines en France, de la seconde moitié du XIXème siècle à la deuxième guerre mondiale. Thèse de doctorat.
Ecole Nationale Supérieure d'Architecture de Nantes. Université de Nantes
Comparison of Paris and São Paulo
The simulation of annual daylight viability for the skyscrapers, housing ―set-backs‖ and housing
―cellular‖ was repeated with the original orientation and the heliothermic axis using the sky conditions
in São Paulo. The heliothermic axis of São Paulo was found to be the same as Paris i.e. 19° towards the
East. Table 39 is a summary of the results.
Table 39: Summary of results for Paris and São Paulo
Cases
Daylight Viability Daylight Viability
Original Orientation Heliothermic axis
Paris Sao Paulo Paris Sao Paulo
Skyscrapers 23.70% 32.80% 22% 33.50%
Housing “Set-backs” 60.70% 80.90% 61.40% 85.60%
Housing “Cellular” 65.70% 87.50% 60.90% 87.30%
The results show significant differences between Paris and São Paulo and can be explained by the high
solar altitude and the higher solar radiation availability in São Paulo. Nevertheless, one interesting result
was the positive effect of the heliothermic axis. In previous observations of Paris, the heliothermic axis
was beneficial in Winter but unfavourable annually. Nevertheless, the results in São Paulo generally
showed positive effects of the heliothermic axis on annual daylighting performance. The phenomenon is
worth further study and will be discussed in detail in the next section.
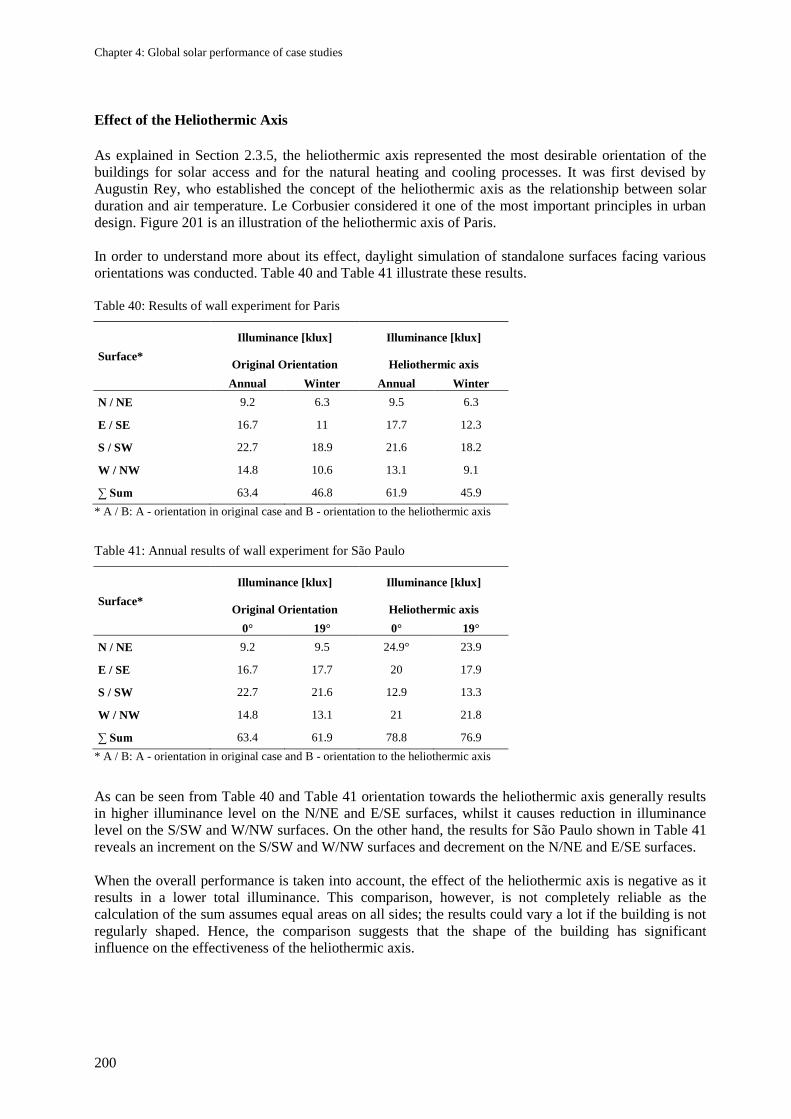
Chapter 4: Global solar performance of case studies
200
Effect of the Heliothermic Axis
As explained in Section 2.3.5, the heliothermic axis represented the most desirable orientation of the
buildings for solar access and for the natural heating and cooling processes. It was first devised by
Augustin Rey, who established the concept of the heliothermic axis as the relationship between solar
duration and air temperature. Le Corbusier considered it one of the most important principles in urban
design. Figure 201 is an illustration of the heliothermic axis of Paris.
In order to understand more about its effect, daylight simulation of standalone surfaces facing various
orientations was conducted. Table 40 and Table 41 illustrate these results.
Table 40: Results of wall experiment for Paris
Surface*
Illuminance [klux] Illuminance [klux]
Original Orientation Heliothermic axis
Annual Winter Annual Winter
N / NE 9.2 6.3 9.5 6.3
E / SE 16.7 11 17.7 12.3
S / SW 22.7 18.9 21.6 18.2
W / NW 14.8 10.6 13.1 9.1
∑ Sum 63.4 46.8 61.9 45.9
* A / B: A - orientation in original case and B - orientation to the heliothermic axis
Table 41: Annual results of wall experiment for São Paulo
Surface*
Illuminance [klux] Illuminance [klux]
Original Orientation Heliothermic axis
0° 19° 0° 19°
N / NE 9.2 9.5 24.9° 23.9
E / SE 16.7 17.7 20 17.9
S / SW 22.7 21.6 12.9 13.3
W / NW 14.8 13.1 21 21.8
∑ Sum 63.4 61.9 78.8 76.9
* A / B: A - orientation in original case and B - orientation to the heliothermic axis
As can be seen from Table 40 and Table 41 orientation towards the heliothermic axis generally results
in higher illuminance level on the N/NE and E/SE surfaces, whilst it causes reduction in illuminance
level on the S/SW and W/NW surfaces. On the other hand, the results for São Paulo shown in Table 41
reveals an increment on the S/SW and W/NW surfaces and decrement on the N/NE and E/SE surfaces.
When the overall performance is taken into account, the effect of the heliothermic axis is negative as it
results in a lower total illuminance. This comparison, however, is not completely reliable as the
calculation of the sum assumes equal areas on all sides; the results could vary a lot if the building is not
regularly shaped. Hence, the comparison suggests that the shape of the building has significant
influence on the effectiveness of the heliothermic axis.
Chapter 4: Global solar performance of case studies
201
Figure 201: The Heliothermic axis of Paris.
Balance of the Contemporary City of Three Million Inhabitants analyses
Numerical simulations carried out over several typical buildings of the Contemporary City of Three
Million Inhabitants, one of the precursory projects of La Ville Radieuse proposed by Le Corbusier,
showed that Bardet‘s and Lebreton‘s criticisms were well-founded. In a chapter entitled La Ville dite
radieuse (The so-called radiant city) published in Pierre sur Pierre (Bardet 1945), Bardet analysed in a
very critical way the various elements of La Ville Radieuse. Nothing was left aside, neither the
hyperconcentration intended by Le Corbusier, the housing ―set-backs‖ used, nor the supposed
suppressed corridor-like streets. Bardet also pointed out that the solar potential of indoor and outdoor
spaces of that city that would suffer, in his opinion, from insufficient exposure to the sun and from the
casting of huge shadows that would produce a cellar microclimate at the bottom of the city walls.
Lebreton also criticized the hyperconcentration, the density of shadows and, in particular, questions the
orientation and sunlight issues of that city: he deemed it obsolete to resort to heliothermic theories
(Harzallah 2007).
The comparison of density and daylight potential between the Contemporary City and the old Paris
urban blocks suggested that the claims made by Le Corbusier for this ambitious urban plan may not be
totally valid. The proposal might be effective in terms of transportation and in the availability of large
green and open areas; however, from the point of view of exposure to daylight, it did not seem to
perform better than the more traditional designs. Moreover, Le Corbusier overlooked the significant
ground-level shadows cast by such high buildings.
The daylighting performance of the skyscrapers was particularly poor. The findings appeared to suggest
that the skyscraper proposal was, indeed, an ineffective design option for Central Paris.
On the other hand, both housing ―set-backs‖ and housing ―cellular‖ showed good daylighting
performance. Nevertheless, the much less usable amount of floor area available in these layouts could
be a drawback.
The effect of the heliothermic axis is ambiguous. Although Le Corbusier considered it as ―the
framework of the city plan65
, its effect on daylight potential was not confirmed in the study. However,
65
L’armature du tracé urbain in French in the text.
Chapter 4: Global solar performance of case studies
202
the latter could have been somewhat biased as the effect of the heliothermic axis was evaluated purely
in terms of illumination; the results might have been different if other factors such as solar heat
gain/loss had been taken into consideration.
From 1927 until 1934, a first attempt at the construction of low-rent dwellings was carried out in Paris
and especially in its outlying districts. Twice during those years, the architect Le Corbusier, a huge
admirer of Haussmann‘s work, attempted to modify Paris‘ urban planning—at first through Le Plan
Voisin and then again in 1937. These projects, as outrageous as they may seem, were presented
seriously at that time. They reflected a new concept of the city, as well as an almost pathological
obsession to generate modernity.
In summary, the Contemporary City of Three Million Inhabitants, the rational and systematic urban
plan designed by Le Corbusier, does not seem to be an effective design option for either density or
daylighting performance. The architect seemed to aspire to a global and drastic reform of the urban
fabric of the capital. To serve that purpose, he mentioned health regulations that existed in the urban
thinking of his own era, yet which today are lacking in scientific rationality. His intention to generalize
this system to the scale of a city would turn out to be problematic and questionable. On the other hand,
the more random traditional pattern, which showed similar daylight potential and possibly higher
density, might have been a more appropriate choice.
One has to acknowledge that Le Corbusier‘s architecture principles were innovative for that time and
that they helped to solve the problem of the housing crisis. Moreover, he was also planning cities that
functioned and where the inhabitants could move around on foot. It must be borne in mind that a city
has to be a complete and harmonious entity, adapted to all of modern man‘s needs, which is contrary to
the notions of bedroom residential areas or dormitory suburbs.
Chapter 4: Global solar performance of case studies
203
4.10 Conclusion
Chapter 4 presented the different studies undertaken within the framework of national and international
research. As a first step, six existing urban sites in Switzerland and Brazil, as well as two projects in the
United Kingdom, a few generic models and a utopian city, were modelled and analyzed. The results
obtained from these different case studies revealed large variations of the potential for solar energy
collection on the buildings‘ façades and roofs.
The principal findings of this study confirm that, Matthaeus district in Basel has very large façade and
roof areas which open up good prospects for the utilisation of solar energy. As the high density of the
urban site reduces the sun and daylight access to the buildings, part of the area does not benefit from
yearly average solar irradiances and daylight illuminances that are technically and economically
appropriate for direct solar technologies. However, assessment of the relative fraction of suitable
façades and roofs, based on the minimum required irradiation and illuminance thresholds, shows that a
very significant part of these areas remains appropriate for solar technology operations, despite the
urban character of the site.
The study of the generic urban forms case in Basel reveals that the most efficient urban form in terms of
daylighting and solar potential is ―Blocks‖, followed by ―Slabs‖, ―Terraces‖, and ―Pavilions‖. The
urban form ―Blocks‖ would allow one to address the crucial problems which are crying out for a
solution in the towns: namely an alarming lack of dwellings and the necessary densification to
safeguard the green belts of the town periphery.
The pilot building ―Aloys-Fauquez N°29-31‖ study on the Bellevaux district in Lausanne confirm that
the total useable solar irradiation that falls on the façades and roofs theoretically meets the demand to
install solar thermal collectors on the façade. The irradiation per floor area evaluated by PPF is three
times larger than the thermal energy, which should cover the yearly hot water and heating requirements
for the building. Concerning the electricity needs, the effective output of the BiPV plant is not large
enough to cover the total demand for electricity, which is necessary for the proper functioning of the
building. In fact, this demand is twice as large as the output from the BiPV roofing installations.
The satellite town of Meyrin in Geneva developed in the spirit of the hygienist movement is generally
typified by the parallel blocks development layouts, which show a South-West/North-West orientation
and have a larger potential than the other configurations. Those buildings with a South-East/North-West
orientation should be a little further from each other for optimal performance.
Concerning Les Pâquis 1&2 district in Geneva, the potential of urban densification provided by raising
the existing buildings is relatively limited by the 2007 governmental bill. Few apartment blocks would
be concerned by these transformations and would find it difficult to remain economically viable without
them. The increased elevation of the buildings permitted by law had a minimal effect on the solar
performance indicators of the buildings, the latter being not significantly affected.
Tower Work‘s site results in Leeds show that neither the ―Final project‖ nor its integration into its urban
context are convincing from the point of view of solar utilisation potential. Architectural considerations
took precedence over environmental aspects. The modelling of the ―Draft project‖ and its use without
obstructions have distorted the analyses and have certainly produced errors affecting the continuation of
the project.
The results of ―Eastern Quarry -Flat topography with cliff‖ in London show that the proposed gradation
of the site up towards the north has a positive effect. This is more significant for Winter solar
availability on south-facing façades. The potential of ―Eastern Quarry -Flat topography without cliff‖ is
almost invariably lower than the one of ―Eastern Quarry -Flat topography with cliff‖. This means that
the slope of the site has a positive influence on the various solar strategies excepting passive solar gains
Chapter 4: Global solar performance of case studies
204
in Winter. In conclusion, the buildings that are erected on a sloping site remain less affected by the
urban texture, which means they have a better view of the sky vault and that shadowing effects are
limited: the sloping site significantly favours the solar potential and daylighting of the buildings.
Barra Funda and Luz analyses in São Paulo reveal that the different manifestations of built density (i.e.
plot ratio, site coverage and compactness index) play different roles in determining urban daylight and
solar potential. According to the results of this particular case study, daylight and solar performance
indicators such as daylight factor, sky view factor and solar thermal and photovoltaic potential on roofs
are more correlated to the plot ratio and compactness index. This would suggest that these quantities are
more influenced by vertical obstruction, in other words, more dependent on light coming from the top.
On the other hand, solar thermal and photovoltaic potential on façades are better correlated to site
coverage and unobstructed façade area, therefore these quantities are more influenced by horizontal
obstruction, which means more dependence on light coming from the sides.
The Contemporary City of Three Million Inhabitants, the rational and systematic urban plan designed
by Le Corbusier, does not seem to be an effective design option for either density or daylighting
performance. The architect seemed to aspire to a global and drastic reform of the urban fabric of the
capital. To serve that purpose, he mentioned health regulations that existed in the urban thinking of his
own era, yet which today are lacking in scientific rationality. His intention to generalize this system to
the scale of a city would turn out to be problematic and questionable. On the other hand, the more
random traditional pattern, which showed similar daylight potential and possibly higher density, might
have been a more appropriate choice.
Finally, this conclusion ends with a general evaluation concerning the impact of density on the cities
that were studied as well as a reminder about the implications of particular decisions concerning:
- Façades‘ exposure;
- Daylight and solar potential availability related to façades' exposure;
- Building height, street width or distance between buildings and orientation of streets;
- Annual and Winter daylight availability in courtyards;
- Orientation and degree of inclination of the section roofs (solar collectors).
Putting to one side the graphics relative to the impact on plot ratio and the impact on obstructions, this
evaluation has been carried out for each specific case with the help of an identical generic form – so as
not to favour or to neglect certain sites. Consequently, these results are uninfluenced and are in no way
dependent on the nature of the urban forms, except for the subsection Impact on density, which was
conducted on existing sites.
Impact on density
To curb urban sprawl there is an increasing demand for further densification of urban areas. There have
also been numerous controversial debates arguing for further densification on the basis of (net) energy
consumption. It is interesting therefore to explore the results in relation to site density in order to
identify whether any interesting relationships emerge.
The solar energy efficiency index related to site and buildings used in this conclusion was determined in
Section 4.3.3 – Section ―Generic urban forms studies‖. Figure 202 shows that a large site area with a
weak plot ratio will have a relatively low solar energy efficiency index related to site: such is the case
for the Meyrin site which possesses a plot ratio of 0.19 and a solar energy efficiency index of 0.12.
Compared to this, ―Les Pâquis street block 2‖ with a plot ratio of 6.04 possesses with 3.30 the highest
solar energy efficiency index related to site. With only one exception, these two curves are therefore
strongly correlated, which is hardly surprising. Nevertheless, for the Bellevaux site the solar energy
efficiency index related to site exceeds the plot ratio. This means that for the Bellevaux site with an
average plot ratio of 0.50 and a solar energy efficiency index related to site of 0.68 its efficiency is
relatively higher in relation to its plot ratio. In addition, the curve of the solar energy efficiency index
related to site draws nearer twice as much as the two urban sites, Meyrin and Eastern Quarry, yet
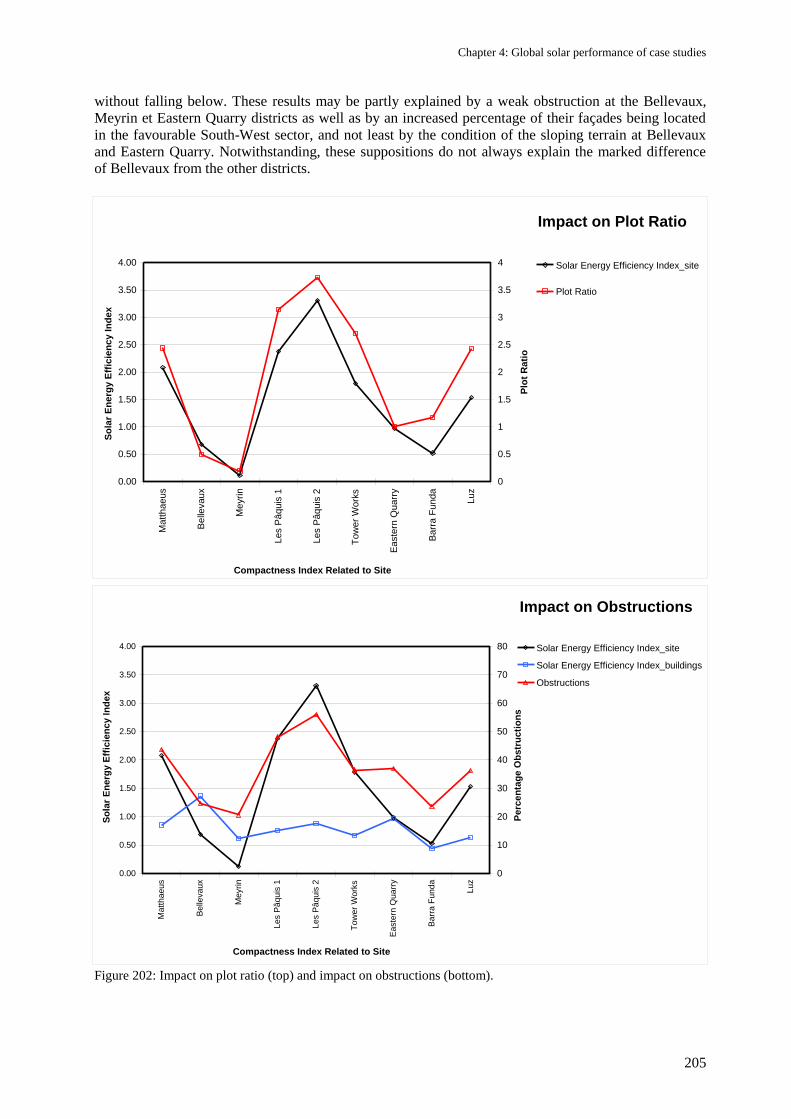
Chapter 4: Global solar performance of case studies
205
without falling below. These results may be partly explained by a weak obstruction at the Bellevaux,
Meyrin et Eastern Quarry districts as well as by an increased percentage of their façades being located
in the favourable South-West sector, and not least by the condition of the sloping terrain at Bellevaux
and Eastern Quarry. Notwithstanding, these suppositions do not always explain the marked difference
of Bellevaux from the other districts.
Impact on Plot Ratio
0.00
0.50
1.00
1.50
2.00
2.50
3.00
3.50
4.00
Matt
haeus
Belle
vaux
Meyrin
Les P
âquis
1
Les P
âquis
2
Tow
er
Work
s
Easte
rn Q
uarr
y
Barr
a F
unda
Luz
Compactness Index Related to Site
So
lar
En
erg
y E
ffic
ien
cy I
nd
ex
0
0.5
1
1.5
2
2.5
3
3.5
4
Plo
t R
ati
o
Solar Energy Efficiency Index_site
Plot Ratio
Impact on Obstructions
0.00
0.50
1.00
1.50
2.00
2.50
3.00
3.50
4.00
Matthaeus
Be
lleva
ux
Meyrin
Les P
âqu
is 1
Les P
âqu
is 2
To
we
r W
ork
s
Ea
ste
rn Q
uarr
y
Ba
rra
Fu
nda
Luz
Compactness Index Related to Site
So
lar
En
erg
y E
ffic
ien
cy I
nd
ex
0
10
20
30
40
50
60
70
80
Perc
en
tag
e O
bstr
ucti
on
s
Solar Energy Efficiency Index_site
Solar Energy Efficiency Index_buildings
Obstructions
Figure 202: Impact on plot ratio (top) and impact on obstructions (bottom).
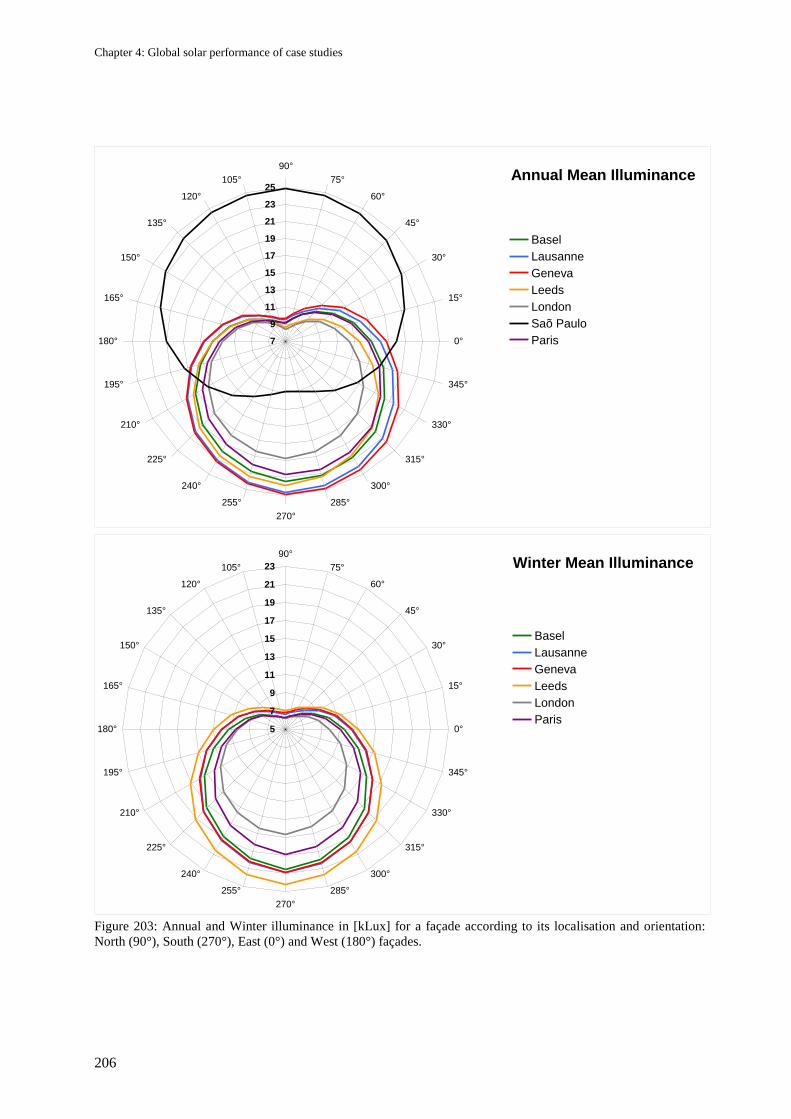
Chapter 4: Global solar performance of case studies
206
Annual Mean Illuminance
7
9
11
13
15
17
19
21
23
25
90°
75°
60°
45°
30°
15°
0°
345°
330°
315°
300°
285°
270°
255°
240°
225°
210°
195°
180°
165°
150°
135°
120°
105°
Basel
Lausanne
Geneva
Leeds
London
Saõ Paulo
Paris
Winter Mean Illuminance
5
7
9
11
13
15
17
19
21
23
90°
75°
60°
45°
30°
15°
0°
345°
330°
315°
300°
285°
270°
255°
240°
225°
210°
195°
180°
165°
150°
135°
120°
105°
Basel
Lausanne
Geneva
Leeds
London
Paris
Figure 203: Annual and Winter illuminance in [kLux] for a façade according to its localisation and orientation:
North (90°), South (270°), East (0°) and West (180°) façades.
Chapter 4: Global solar performance of case studies
207
To take this a step further, Figure 202 shows that the solar energy efficiency index related to the urban
sites and the obstructions follows similar patterns. On the other hand, the solar energy efficiency index
related to buildings is less well correlated.
The Bellevaux district has – with 25% of obstructed façades and the façades occupying the NE and NW
(both 25% with a slight predominance towards the direction SW (28%) – the strongest solar energy
efficiency index related to buildings and Barra Funda the weakest. Matthaeus district comes in second
place after Bellevaux. This histogram also demonstrates that ―Les Pâquis street block 2‖ – with 56% of
obstructed and an equal distribution of façades in the NE, SE and NW sectors, with a slight
disadvantage for the south-west sector – performs better in terms of annual irradiation than Meyrin –
with 20.6% of obstructed façades and the four directions NE, SE, SW and NW equally represented. The
Eastern Quarry development holds up better than Tower Works at the level of the urban form, however
its solar energy efficiency index related to site is inferior. Meyrin and Barra Funda are the two least
obstructed sites, which – either urban form and site – perform least well in terms of solar energy
efficiency.
A visual examination of the 3 curves reveals that ―Les Pâquis street block 2‖ comes in first place,
Matthaeus in second and Bellevaux in third – in terms of the solar energy efficiency index related to the
urban sites and buildings. The favourable climatic conditions of Geneva certainly explain in part this
performance for ―Les Pâquis street block 2‖, but they do not justify an equally good result in relation to
Meyrin which was constructed under the influence of the hygienist spirit of that period and whose
evaluation of solar potential was carried out with the typical Winter sky conditions of Geneva – in other
words the same as ―Les Pâquis street block 2‖.
Façades’ exposure
Figure 203 shows the annual and Winter illuminance in kilo-lux of a vertical street façade according to
its geographical location and its orientation, without taking the shadows cast by neighbouring buildings
into account. In the figure representing the Annual Mean Illuminance, one can clearly distinguish 2
groups whose façades annually receive for the same given direction a maximum illuminance:
- North façade for São Paulo;
- South façade for Basel, Lausanne, Geneva, Leeds, London and Paris.
For the European sites, it is obviously those orientations which are closest to the South (-45° and 45°)
which result in the strongest illuminance. However, in the group whose South façade is favourable,
Geneva clearly stands out from the rest in displaying a dramatically stronger illuminance going from
9.61 to 24.97 kLux and which moves in the direction of the East. Basel, Lausanne and Paris reveal the
same asymmetrical quality in veering towards the East, as opposed to Leeds which seems perfectly
symmetrical. Once again, it has to be emphasized that London possesses the smallest annual
illuminance (8.4 to 20.77 kLux) of all the sites and that naturally São Paulo with 12.92 to 24.88 kLux
performs the best. It‘s the Winter season which makes the difference here as there is not one day where
the temperature is lower than 12°C.
In contrast to the annual calculation, the Winter Mean Illuminance regroups all the sites in the
favourable direction South, except for the city of São Paulo which does not include a Winter season and
for which consequently the calculation was not effective.
In Winter, it is the Leeds site which astonishingly presents the strongest illuminance and London the
smallest. All the curves seem symmetrical and Geneva merges with the curve for Lausanne.
From this, one can therefore conclude that annually as in Winter the South direction seems to be the
most efficient in terms of daylighting for the European sites, but that the directions South-West and
North-East are still very suitable.
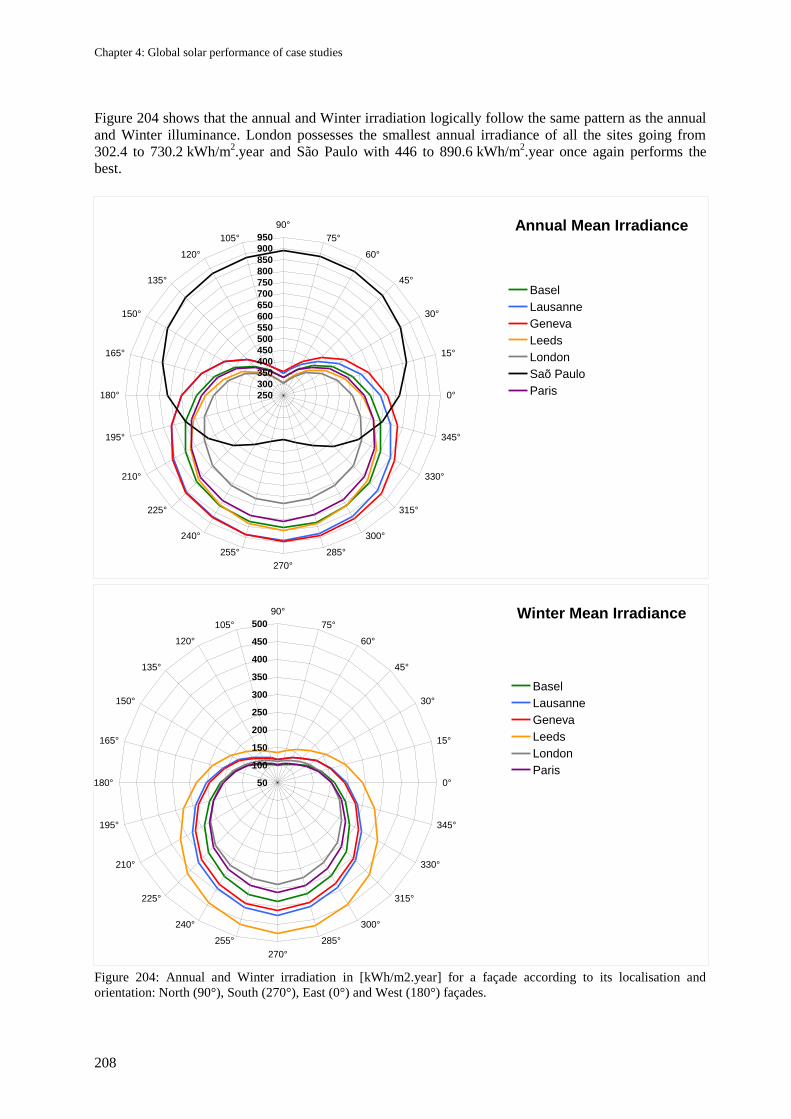
Chapter 4: Global solar performance of case studies
208
Figure 204 shows that the annual and Winter irradiation logically follow the same pattern as the annual
and Winter illuminance. London possesses the smallest annual irradiance of all the sites going from
302.4 to 730.2 kWh/m2.year and São Paulo with 446 to 890.6 kWh/m
2.year once again performs the
best.
Annual Mean Irradiance
250
300
350
400
450
500
550
600
650
700
750
800
850
900
950
90°
75°
60°
45°
30°
15°
0°
345°
330°
315°
300°
285°
270°
255°
240°
225°
210°
195°
180°
165°
150°
135°
120°
105°
Basel
Lausanne
Geneva
Leeds
London
Saõ Paulo
Paris
Winter Mean Irradiance
50
100
150
200
250
300
350
400
450
500
90°
75°
60°
45°
30°
15°
0°
345°
330°
315°
300°
285°
270°
255°
240°
225°
210°
195°
180°
165°
150°
135°
120°
105°
Basel
Lausanne
Geneva
Leeds
London
Paris
Figure 204: Annual and Winter irradiation in [kWh/m2.year] for a façade according to its localisation and
orientation: North (90°), South (270°), East (0°) and West (180°) façades.
Chapter 4: Global solar performance of case studies
209
Daylight and solar potential availability related to façades' exposure
Figure 205 to Figure 208 illustrate the orientations of the façades adapted to the different solar
technologies. These polar diagrams can help the architects and town-planners in adapting the
orientations of the buildings to the various solar strategies which have to be used to meet all
requirements. Daylighting is the technology which most of all encompasses the different polar diagrams
relative to each site. Those cities which receive annually more than 90% of daylighting availability run
from the direction North-East to North-West for:
- Basel : 60° NE to 150° NW;
- Lausanne : 60° NE to 135° NW;
- Geneva : 45° NE to 135° NW;
- Leeds : 45° NE to 150° NW;
- London : 45° NE to 150° NW;
- São Paulo : 0° to 360°;
- Paris : 60° NE to 150° NW.
The direction North-East displays a difference of 15° between Geneva, Leeds and London with Basel,
Lausanne and Paris. As for the direction North-West, there is a difference of 15° between Lausanne and
Geneva with the other European sites. Obviously, São Paulo has the most extensive daylighting with a
possible orientation of the buildings from 0° to 360° conserving practically for all directions a daylight
availability of 100%. Naturally, in Winter, there is less daylighting and the towns which receive more
than 90% of Winter daylighting availability run in the direction North-East to North-West for:
- Basel : 0° E to 180° W;
- Lausanne : 15° NE to 180° W;
- Geneva : 15° NE to 165° NW;
- Leeds : 15° NE to 165° NW;
- London : 15° NE to 165° NW;
- São Paulo : No Winter season;
- Paris : 0° E to 180° W.
As for passive solar availability, it rises for:
- Basel : 15° NE to 165° NW;
- Lausanne : 15° NE to 165° NW;
- Geneva : 15° NE to 165° NW;
- Leeds : 30° NE to 150° NW;
- London : 15° NE to 165° NW;
- São Paulo : No Winter season;
- Paris : 15° NE to 165° NW.
Leeds is the city which potentially can most exploit its passive solar gains in Winter. The optimal
orientations of active solar availability are close to those of daylighting:
- Basel : 45° NE to 135° NW;
- Lausanne : 60° NE to 120° NW;
- Geneva : 60° NE to 120° NW;
- Leeds : 45° NE to 150° NW;
- London : 30° NE to 150° NW;
- São Paulo : 0° to 360°;
- Paris : 45° NE to 135° NW.
As was the case with daylighting, São Paulo has the most extensive active solar availability with a
possible orientation of the buildings from 0° to 360°. Leeds is the only city whose potential for
orientations of active solar availability remain practically unchanged with regards to daylighting.
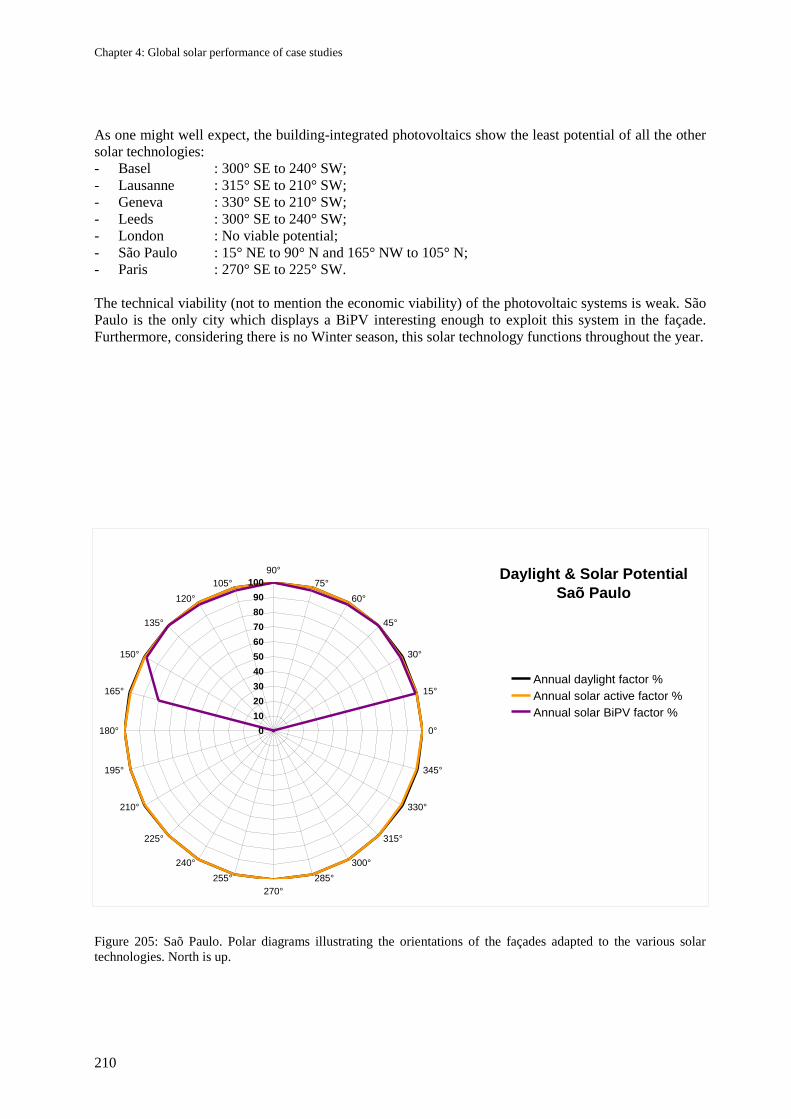
Chapter 4: Global solar performance of case studies
210
As one might well expect, the building-integrated photovoltaics show the least potential of all the other
solar technologies:
- Basel : 300° SE to 240° SW;
- Lausanne : 315° SE to 210° SW;
- Geneva : 330° SE to 210° SW;
- Leeds : 300° SE to 240° SW;
- London : No viable potential;
- São Paulo : 15° NE to 90° N and 165° NW to 105° N;
- Paris : 270° SE to 225° SW.
The technical viability (not to mention the economic viability) of the photovoltaic systems is weak. São
Paulo is the only city which displays a BiPV interesting enough to exploit this system in the façade.
Furthermore, considering there is no Winter season, this solar technology functions throughout the year.
Daylight & Solar Potential
Saõ Paulo
0
10
20
30
40
50
60
70
80
90
100
90°
75°
60°
45°
30°
15°
0°
345°
330°
315°
300°
285°
270°
255°
240°
225°
210°
195°
180°
165°
150°
135°
120°
105°
Annual daylight factor %
Annual solar active factor %
Annual solar BiPV factor %
Figure 205: Saõ Paulo. Polar diagrams illustrating the orientations of the façades adapted to the various solar
technologies. North is up.
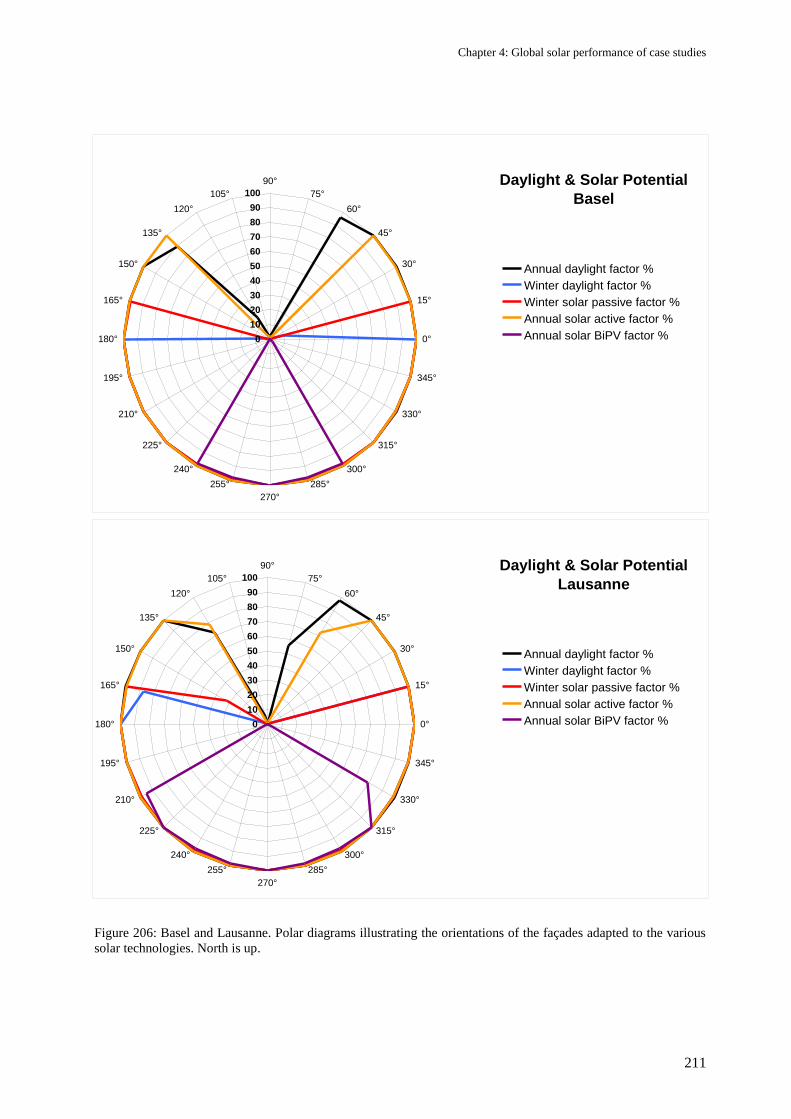
Chapter 4: Global solar performance of case studies
211
Daylight & Solar Potential
Basel
0
10
20
30
40
50
60
70
80
90
100
90°
75°
60°
45°
30°
15°
0°
345°
330°
315°
300°
285°
270°
255°
240°
225°
210°
195°
180°
165°
150°
135°
120°
105°
Annual daylight factor %
Winter daylight factor %
Winter solar passive factor %
Annual solar active factor %
Annual solar BiPV factor %
Daylight & Solar Potential
Lausanne
0
10
20
30
40
50
60
70
80
90
100
90°
75°
60°
45°
30°
15°
0°
345°
330°
315°
300°
285°
270°
255°
240°
225°
210°
195°
180°
165°
150°
135°
120°
105°
Annual daylight factor %
Winter daylight factor %
Winter solar passive factor %
Annual solar active factor %
Annual solar BiPV factor %
Figure 206: Basel and Lausanne. Polar diagrams illustrating the orientations of the façades adapted to the various
solar technologies. North is up.
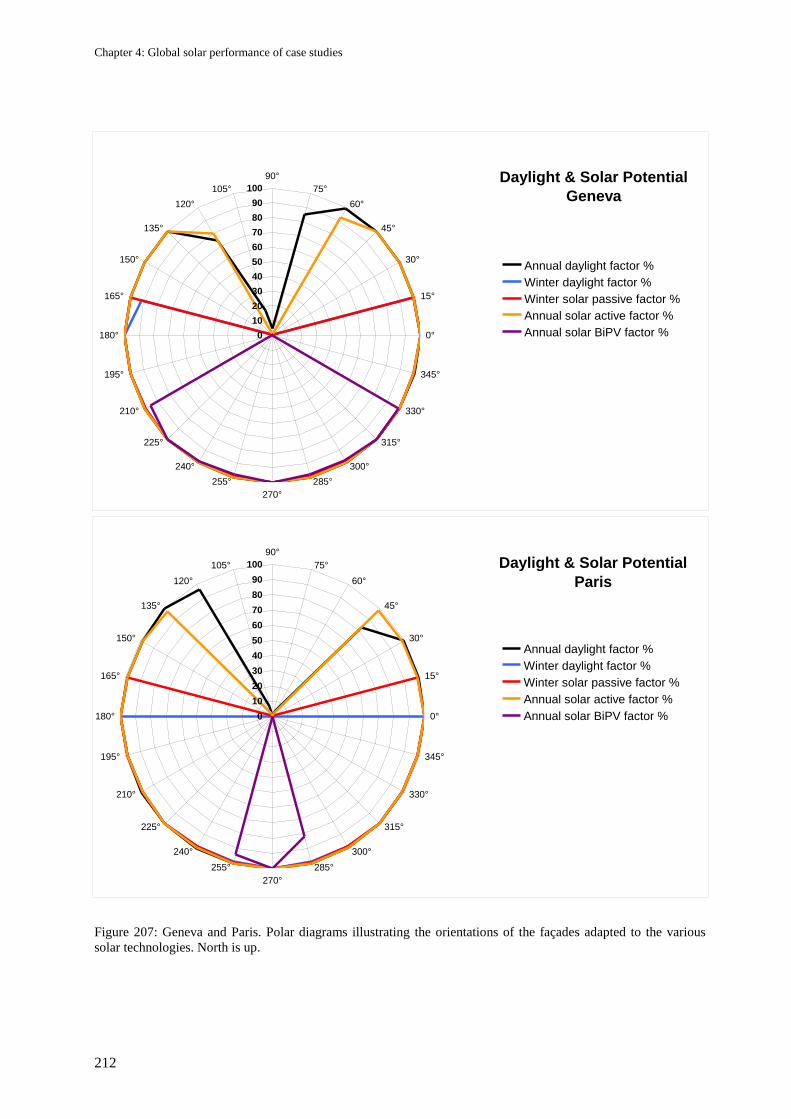
Chapter 4: Global solar performance of case studies
212
Daylight & Solar Potential
Geneva
0
10
20
30
40
50
60
70
80
90
100
90°
75°
60°
45°
30°
15°
0°
345°
330°
315°
300°
285°
270°
255°
240°
225°
210°
195°
180°
165°
150°
135°
120°
105°
Annual daylight factor %
Winter daylight factor %
Winter solar passive factor %
Annual solar active factor %
Annual solar BiPV factor %
Daylight & Solar Potential
Paris
0
10
20
30
40
50
60
70
80
90
100
90°
75°
60°
45°
30°
15°
0°
345°
330°
315°
300°
285°
270°
255°
240°
225°
210°
195°
180°
165°
150°
135°
120°
105°
Annual daylight factor %
Winter daylight factor %
Winter solar passive factor %
Annual solar active factor %
Annual solar BiPV factor %
Figure 207: Geneva and Paris. Polar diagrams illustrating the orientations of the façades adapted to the various
solar technologies. North is up.
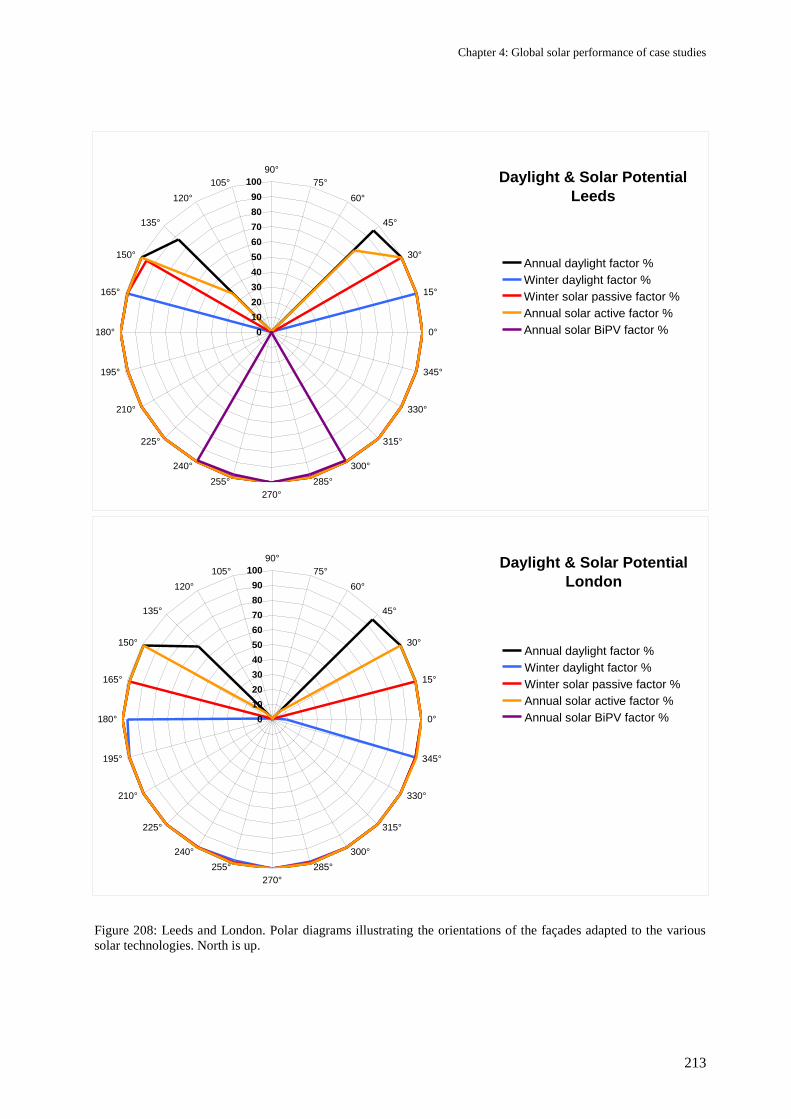
Chapter 4: Global solar performance of case studies
213
Daylight & Solar Potential
Leeds
0
10
20
30
40
50
60
70
80
90
100
90°
75°
60°
45°
30°
15°
0°
345°
330°
315°
300°
285°
270°
255°
240°
225°
210°
195°
180°
165°
150°
135°
120°
105°
Annual daylight factor %
Winter daylight factor %
Winter solar passive factor %
Annual solar active factor %
Annual solar BiPV factor %
Daylight & Solar Potential
London
0
10
20
30
40
50
60
70
80
90
100
90°
75°
60°
45°
30°
15°
0°
345°
330°
315°
300°
285°
270°
255°
240°
225°
210°
195°
180°
165°
150°
135°
120°
105°
Annual daylight factor %
Winter daylight factor %
Winter solar passive factor %
Annual solar active factor %
Annual solar BiPV factor %
Figure 208: Leeds and London. Polar diagrams illustrating the orientations of the façades adapted to the various
solar technologies. North is up.
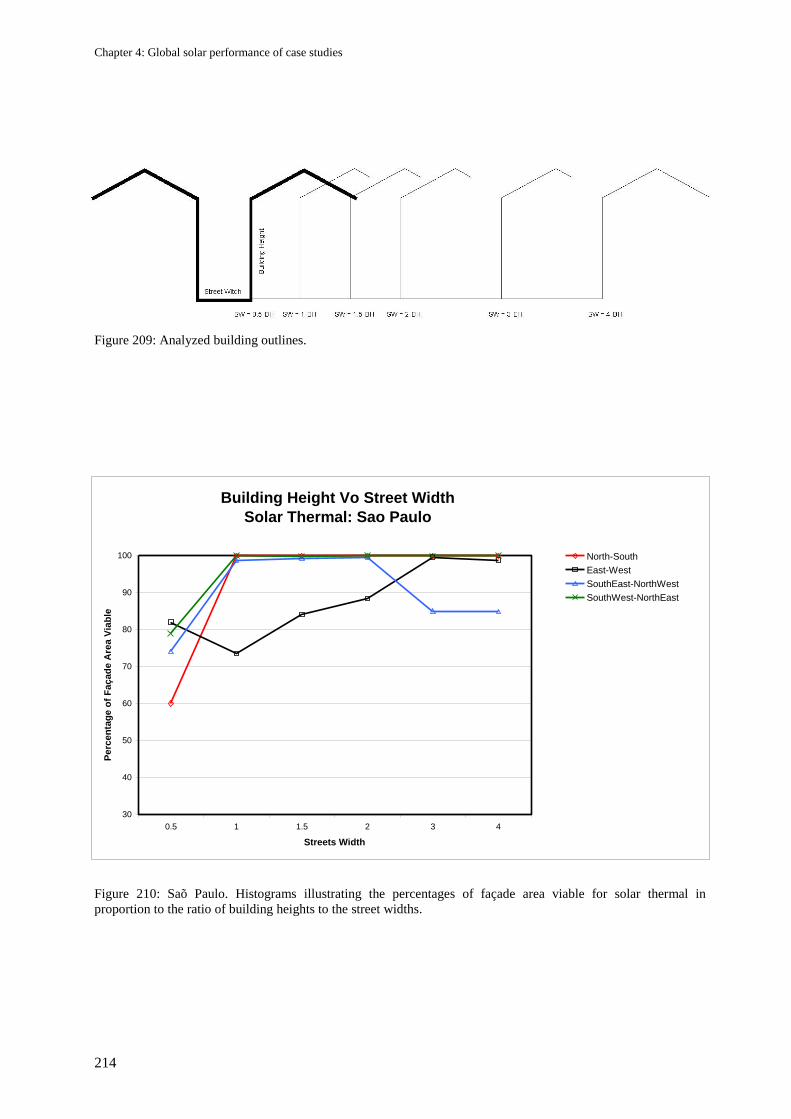
Chapter 4: Global solar performance of case studies
214
Figure 209: Analyzed building outlines.
Building Height Vo Street Width
Solar Thermal: Sao Paulo
30
40
50
60
70
80
90
100
0.5 1 1.5 2 3 4
Streets Width
Pe
rce
nta
ge
of
Faç
ad
e A
rea
Via
ble
North-South
East-West
SouthEast-NorthWest
SouthWest-NorthEast
Figure 210: Saõ Paulo. Histograms illustrating the percentages of façade area viable for solar thermal in
proportion to the ratio of building heights to the street widths.
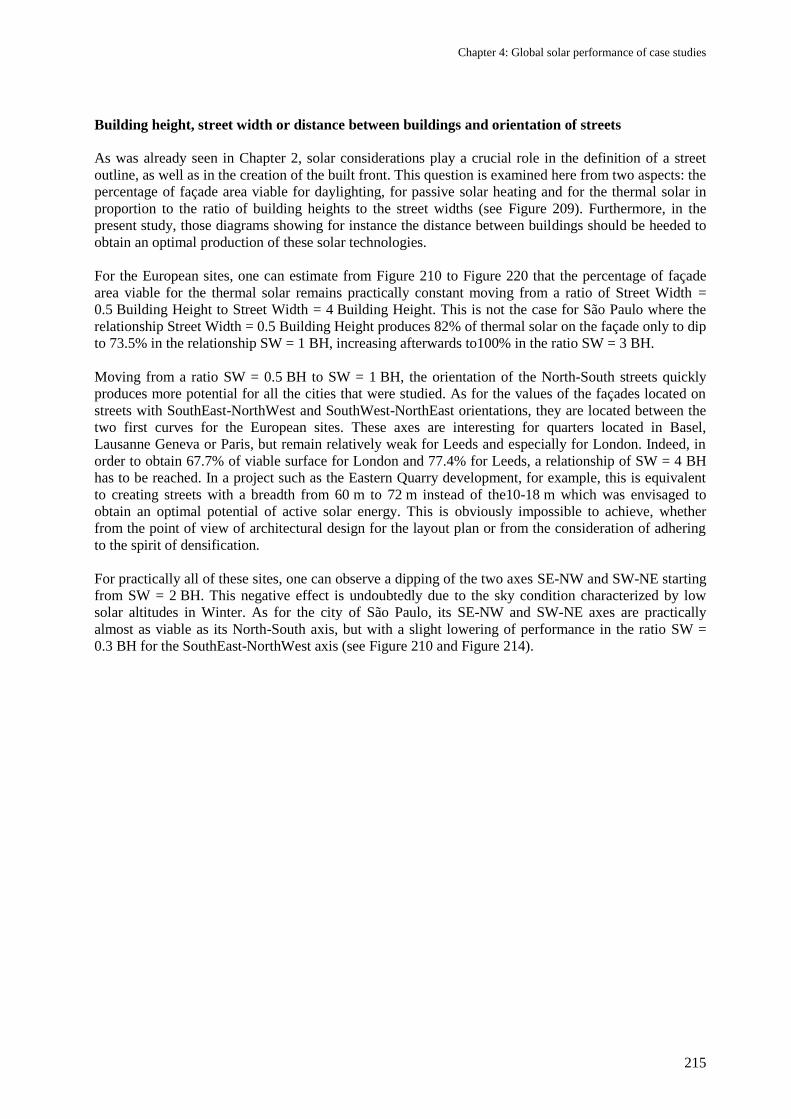
Chapter 4: Global solar performance of case studies
215
Building height, street width or distance between buildings and orientation of streets
As was already seen in Chapter 2, solar considerations play a crucial role in the definition of a street
outline, as well as in the creation of the built front. This question is examined here from two aspects: the
percentage of façade area viable for daylighting, for passive solar heating and for the thermal solar in
proportion to the ratio of building heights to the street widths (see Figure 209). Furthermore, in the
present study, those diagrams showing for instance the distance between buildings should be heeded to
obtain an optimal production of these solar technologies.
For the European sites, one can estimate from Figure 210 to Figure 220 that the percentage of façade
area viable for the thermal solar remains practically constant moving from a ratio of Street Width =
0.5 Building Height to Street Width = 4 Building Height. This is not the case for São Paulo where the
relationship Street Width = 0.5 Building Height produces 82% of thermal solar on the façade only to dip
to 73.5% in the relationship SW = 1 BH, increasing afterwards to100% in the ratio SW = 3 BH.
Moving from a ratio SW = 0.5 BH to SW = 1 BH, the orientation of the North-South streets quickly
produces more potential for all the cities that were studied. As for the values of the façades located on
streets with SouthEast-NorthWest and SouthWest-NorthEast orientations, they are located between the
two first curves for the European sites. These axes are interesting for quarters located in Basel,
Lausanne Geneva or Paris, but remain relatively weak for Leeds and especially for London. Indeed, in
order to obtain 67.7% of viable surface for London and 77.4% for Leeds, a relationship of SW = 4 BH
has to be reached. In a project such as the Eastern Quarry development, for example, this is equivalent
to creating streets with a breadth from 60 m to 72 m instead of the10-18 m which was envisaged to
obtain an optimal potential of active solar energy. This is obviously impossible to achieve, whether
from the point of view of architectural design for the layout plan or from the consideration of adhering
to the spirit of densification.
For practically all of these sites, one can observe a dipping of the two axes SE-NW and SW-NE starting
from SW = 2 BH. This negative effect is undoubtedly due to the sky condition characterized by low
solar altitudes in Winter. As for the city of São Paulo, its SE-NW and SW-NE axes are practically
almost as viable as its North-South axis, but with a slight lowering of performance in the ratio SW =
0.3 BH for the SouthEast-NorthWest axis (see Figure 210 and Figure 214).
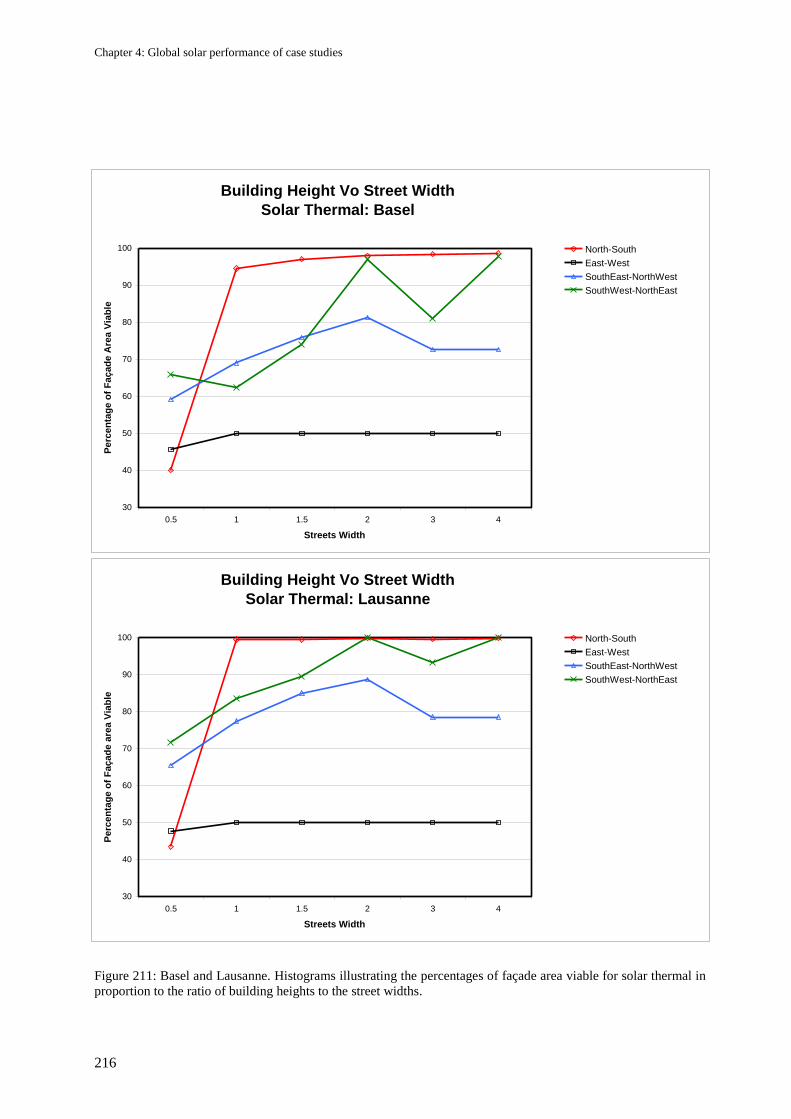
Chapter 4: Global solar performance of case studies
216
Building Height Vo Street Width
Solar Thermal: Basel
30
40
50
60
70
80
90
100
0.5 1 1.5 2 3 4
Streets Width
Pe
rce
nta
ge
of
Faç
ad
e A
rea
Via
ble
North-South
East-West
SouthEast-NorthWest
SouthWest-NorthEast
Building Height Vo Street Width
Solar Thermal: Lausanne
30
40
50
60
70
80
90
100
0.5 1 1.5 2 3 4
Streets Width
Perc
en
tag
e o
f F
açad
e a
rea V
iab
le
North-South
East-West
SouthEast-NorthWest
SouthWest-NorthEast
Figure 211: Basel and Lausanne. Histograms illustrating the percentages of façade area viable for solar thermal in
proportion to the ratio of building heights to the street widths.
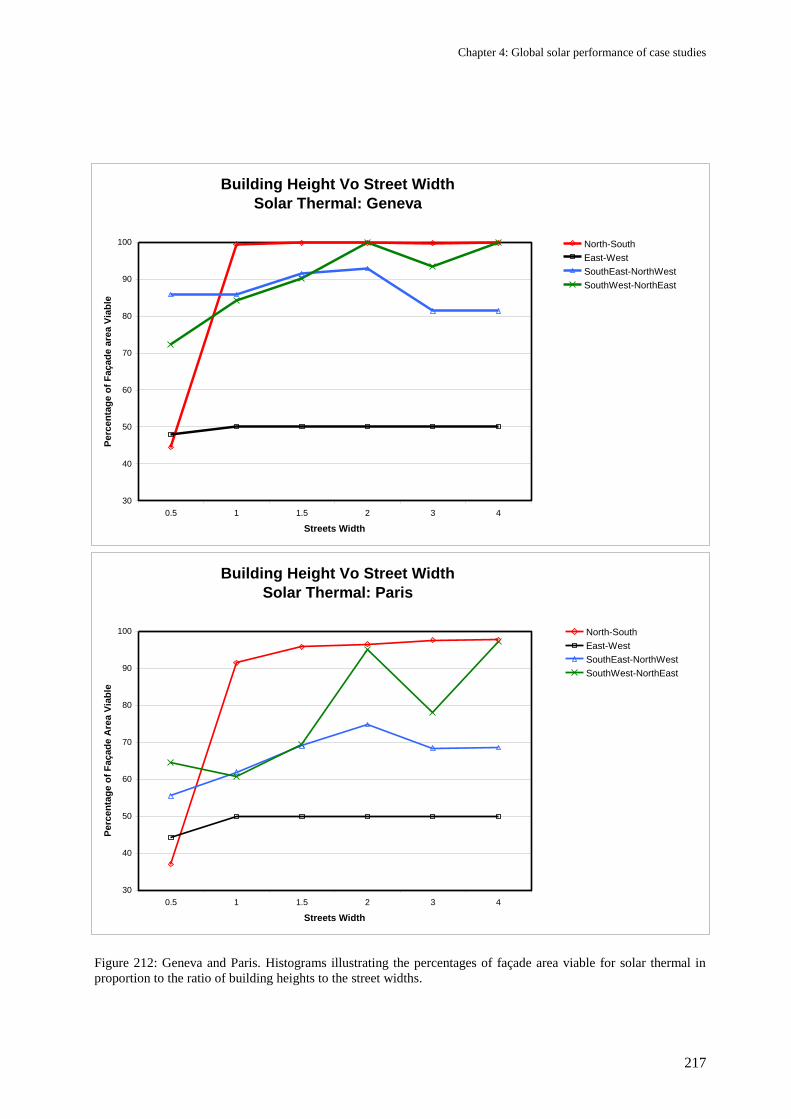
Chapter 4: Global solar performance of case studies
217
Building Height Vo Street Width
Solar Thermal: Geneva
30
40
50
60
70
80
90
100
0.5 1 1.5 2 3 4
Streets Width
Pe
rce
nta
ge
of
Faç
ad
e a
rea
Via
ble
North-South
East-West
SouthEast-NorthWest
SouthWest-NorthEast
Building Height Vo Street Width
Solar Thermal: Paris
30
40
50
60
70
80
90
100
0.5 1 1.5 2 3 4
Streets Width
Perc
en
tag
e o
f F
açad
e A
rea V
iab
le
North-South
East-West
SouthEast-NorthWest
SouthWest-NorthEast
Figure 212: Geneva and Paris. Histograms illustrating the percentages of façade area viable for solar thermal in
proportion to the ratio of building heights to the street widths.
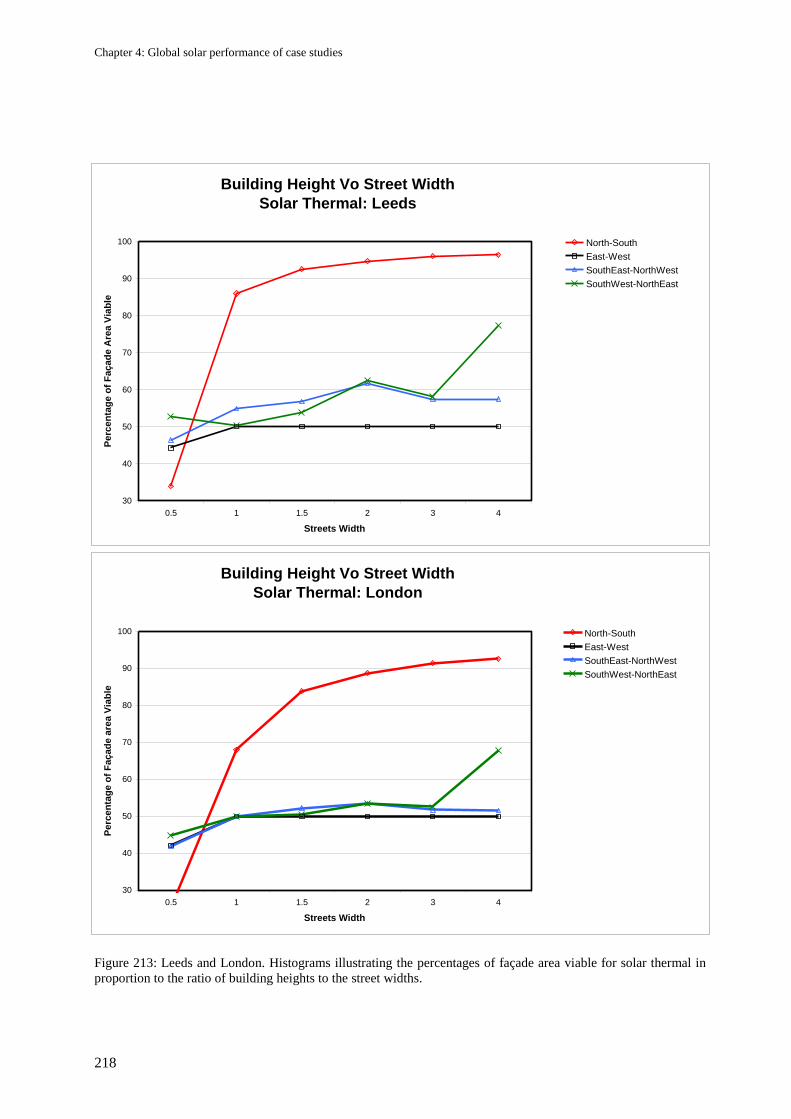
Chapter 4: Global solar performance of case studies
218
Building Height Vo Street Width
Solar Thermal: Leeds
30
40
50
60
70
80
90
100
0.5 1 1.5 2 3 4
Streets Width
Pe
rce
nta
ge
of
Faç
ad
e A
rea
Via
ble
North-South
East-West
SouthEast-NorthWest
SouthWest-NorthEast
Building Height Vo Street Width
Solar Thermal: London
30
40
50
60
70
80
90
100
0.5 1 1.5 2 3 4
Streets Width
Perc
en
tag
e o
f F
açad
e a
rea V
iab
le
North-South
East-West
SouthEast-NorthWest
SouthWest-NorthEast
Figure 213: Leeds and London. Histograms illustrating the percentages of façade area viable for solar thermal in
proportion to the ratio of building heights to the street widths.
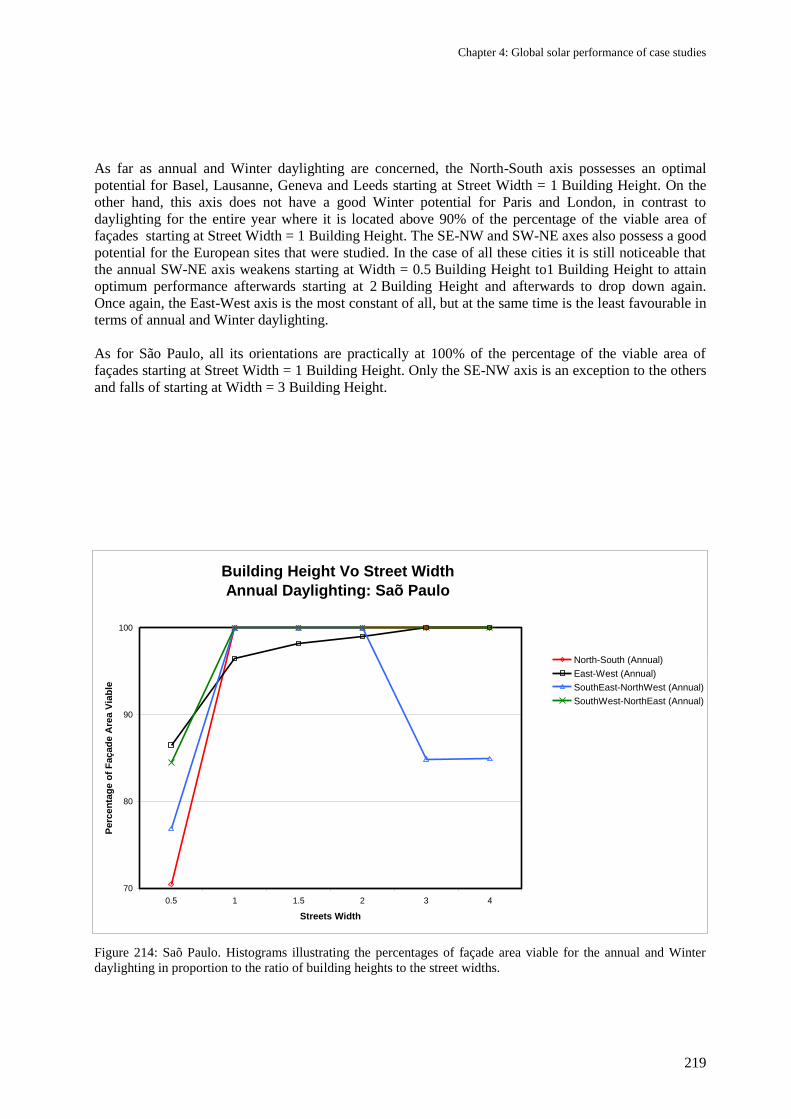
Chapter 4: Global solar performance of case studies
219
As far as annual and Winter daylighting are concerned, the North-South axis possesses an optimal
potential for Basel, Lausanne, Geneva and Leeds starting at Street Width = 1 Building Height. On the
other hand, this axis does not have a good Winter potential for Paris and London, in contrast to
daylighting for the entire year where it is located above 90% of the percentage of the viable area of
façades starting at Street Width = 1 Building Height. The SE-NW and SW-NE axes also possess a good
potential for the European sites that were studied. In the case of all these cities it is still noticeable that
the annual SW-NE axis weakens starting at Width = 0.5 Building Height to1 Building Height to attain
optimum performance afterwards starting at 2 Building Height and afterwards to drop down again.
Once again, the East-West axis is the most constant of all, but at the same time is the least favourable in
terms of annual and Winter daylighting.
As for São Paulo, all its orientations are practically at 100% of the percentage of the viable area of
façades starting at Street Width = 1 Building Height. Only the SE-NW axis is an exception to the others
and falls of starting at Width = 3 Building Height.
Building Height Vo Street Width
Annual Daylighting: Saõ Paulo
70
80
90
100
0.5 1 1.5 2 3 4
Streets Width
Perc
en
tag
e o
f F
açad
e A
rea V
iab
le
North-South (Annual)
East-West (Annual)
SouthEast-NorthWest (Annual)
SouthWest-NorthEast (Annual)
Figure 214: Saõ Paulo. Histograms illustrating the percentages of façade area viable for the annual and Winter
daylighting in proportion to the ratio of building heights to the street widths.
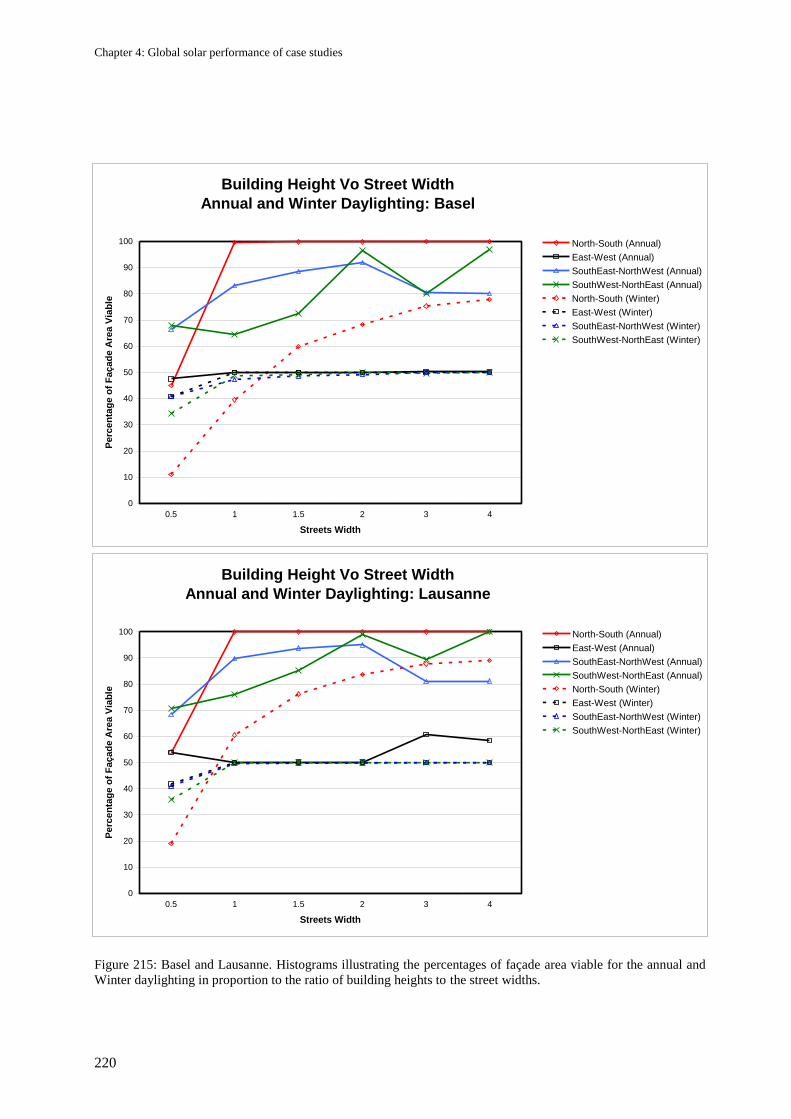
Chapter 4: Global solar performance of case studies
220
Building Height Vo Street Width
Annual and Winter Daylighting: Basel
0
10
20
30
40
50
60
70
80
90
100
0.5 1 1.5 2 3 4
Streets Width
Pe
rce
nta
ge o
f F
açad
e A
rea V
iab
le
North-South (Annual)
East-West (Annual)
SouthEast-NorthWest (Annual)
SouthWest-NorthEast (Annual)
North-South (Winter)
East-West (Winter)
SouthEast-NorthWest (Winter)
SouthWest-NorthEast (Winter)
Building Height Vo Street Width
Annual and Winter Daylighting: Lausanne
0
10
20
30
40
50
60
70
80
90
100
0.5 1 1.5 2 3 4
Streets Width
Perc
en
tag
e o
f F
açad
e A
rea V
iab
le
North-South (Annual)
East-West (Annual)
SouthEast-NorthWest (Annual)
SouthWest-NorthEast (Annual)
North-South (Winter)
East-West (Winter)
SouthEast-NorthWest (Winter)
SouthWest-NorthEast (Winter)
Figure 215: Basel and Lausanne. Histograms illustrating the percentages of façade area viable for the annual and
Winter daylighting in proportion to the ratio of building heights to the street widths.
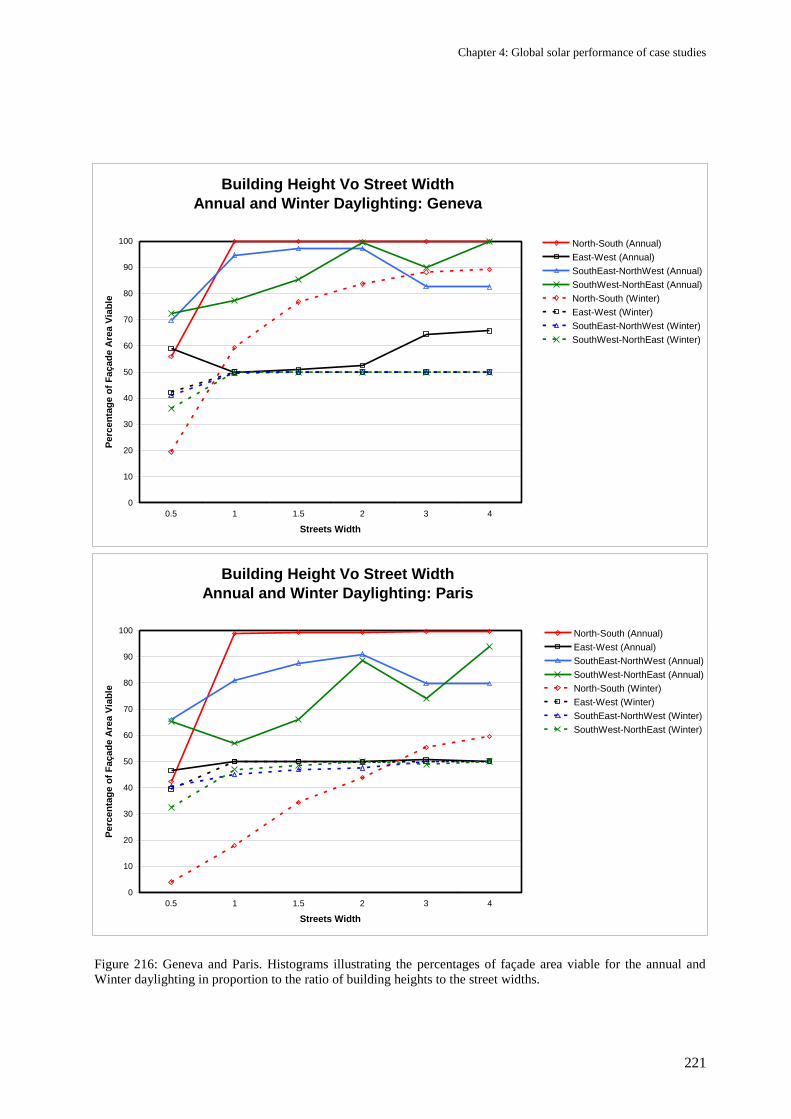
Chapter 4: Global solar performance of case studies
221
Building Height Vo Street Width
Annual and Winter Daylighting: Geneva
0
10
20
30
40
50
60
70
80
90
100
0.5 1 1.5 2 3 4
Streets Width
Perc
en
tag
e o
f F
açad
e A
rea V
iab
le
North-South (Annual)
East-West (Annual)
SouthEast-NorthWest (Annual)
SouthWest-NorthEast (Annual)
North-South (Winter)
East-West (Winter)
SouthEast-NorthWest (Winter)
SouthWest-NorthEast (Winter)
Building Height Vo Street Width
Annual and Winter Daylighting: Paris
0
10
20
30
40
50
60
70
80
90
100
0.5 1 1.5 2 3 4
Streets Width
Pe
rce
nta
ge
of
Faç
ad
e A
rea
Via
ble
North-South (Annual)
East-West (Annual)
SouthEast-NorthWest (Annual)
SouthWest-NorthEast (Annual)
North-South (Winter)
East-West (Winter)
SouthEast-NorthWest (Winter)
SouthWest-NorthEast (Winter)
Figure 216: Geneva and Paris. Histograms illustrating the percentages of façade area viable for the annual and
Winter daylighting in proportion to the ratio of building heights to the street widths.
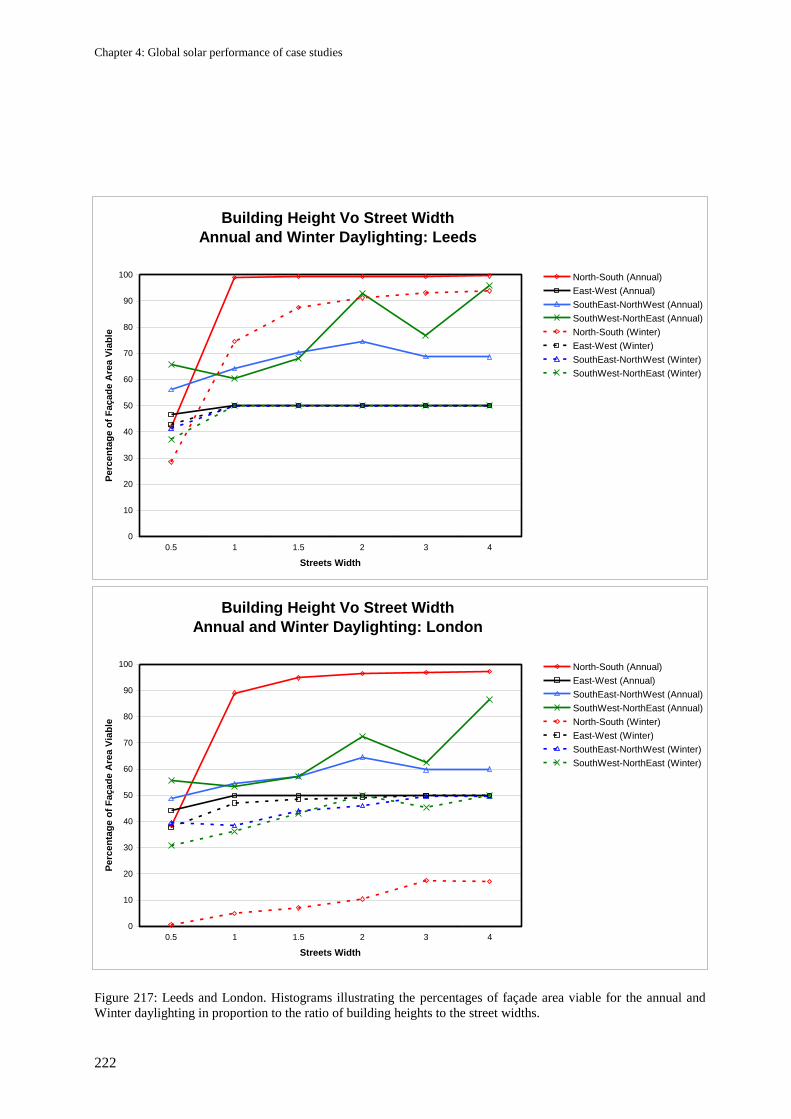
Chapter 4: Global solar performance of case studies
222
Building Height Vo Street Width
Annual and Winter Daylighting: Leeds
0
10
20
30
40
50
60
70
80
90
100
0.5 1 1.5 2 3 4
Streets Width
Perc
en
tag
e o
f F
açad
e A
rea V
iab
le
North-South (Annual)
East-West (Annual)
SouthEast-NorthWest (Annual)
SouthWest-NorthEast (Annual)
North-South (Winter)
East-West (Winter)
SouthEast-NorthWest (Winter)
SouthWest-NorthEast (Winter)
Building Height Vo Street Width
Annual and Winter Daylighting: London
0
10
20
30
40
50
60
70
80
90
100
0.5 1 1.5 2 3 4
Streets Width
Perc
en
tag
e o
f F
açad
e A
rea V
iab
le
North-South (Annual)
East-West (Annual)
SouthEast-NorthWest (Annual)
SouthWest-NorthEast (Annual)
North-South (Winter)
East-West (Winter)
SouthEast-NorthWest (Winter)
SouthWest-NorthEast (Winter)
Figure 217: Leeds and London. Histograms illustrating the percentages of façade area viable for the annual and
Winter daylighting in proportion to the ratio of building heights to the street widths.
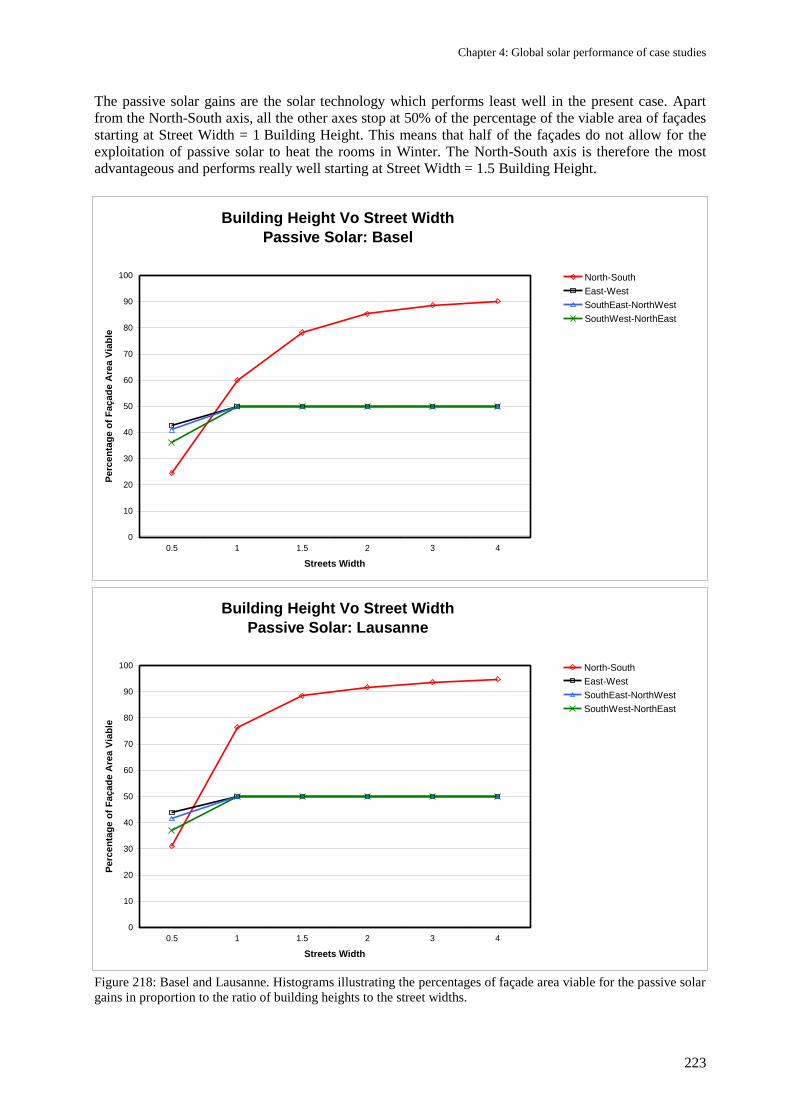
Chapter 4: Global solar performance of case studies
223
The passive solar gains are the solar technology which performs least well in the present case. Apart
from the North-South axis, all the other axes stop at 50% of the percentage of the viable area of façades
starting at Street Width = 1 Building Height. This means that half of the façades do not allow for the
exploitation of passive solar to heat the rooms in Winter. The North-South axis is therefore the most
advantageous and performs really well starting at Street Width = 1.5 Building Height.
Building Height Vo Street Width
Passive Solar: Basel
0
10
20
30
40
50
60
70
80
90
100
0.5 1 1.5 2 3 4
Streets Width
Perc
en
tag
e o
f F
açad
e A
rea V
iab
le
North-South
East-West
SouthEast-NorthWest
SouthWest-NorthEast
Building Height Vo Street Width
Passive Solar: Lausanne
0
10
20
30
40
50
60
70
80
90
100
0.5 1 1.5 2 3 4
Streets Width
Pe
rcen
tag
e o
f F
açad
e A
rea
Via
ble
North-South
East-West
SouthEast-NorthWest
SouthWest-NorthEast
Figure 218: Basel and Lausanne. Histograms illustrating the percentages of façade area viable for the passive solar
gains in proportion to the ratio of building heights to the street widths.
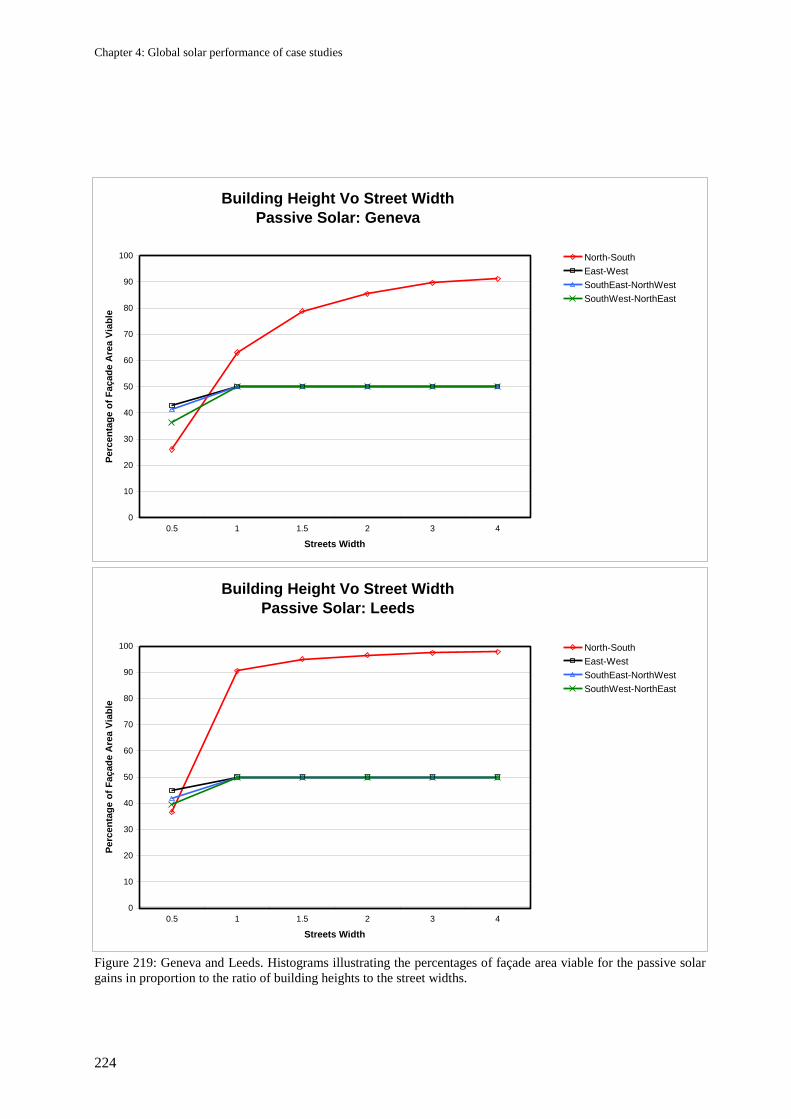
Chapter 4: Global solar performance of case studies
224
Building Height Vo Street Width
Passive Solar: Geneva
0
10
20
30
40
50
60
70
80
90
100
0.5 1 1.5 2 3 4
Streets Width
Perc
en
tag
e o
f F
açad
e A
rea V
iab
le
North-South
East-West
SouthEast-NorthWest
SouthWest-NorthEast
Building Height Vo Street Width
Passive Solar: Leeds
0
10
20
30
40
50
60
70
80
90
100
0.5 1 1.5 2 3 4
Streets Width
Perc
en
tag
e o
f F
aç
ad
e A
rea V
iab
le
North-South
East-West
SouthEast-NorthWest
SouthWest-NorthEast
Figure 219: Geneva and Leeds. Histograms illustrating the percentages of façade area viable for the passive solar
gains in proportion to the ratio of building heights to the street widths.
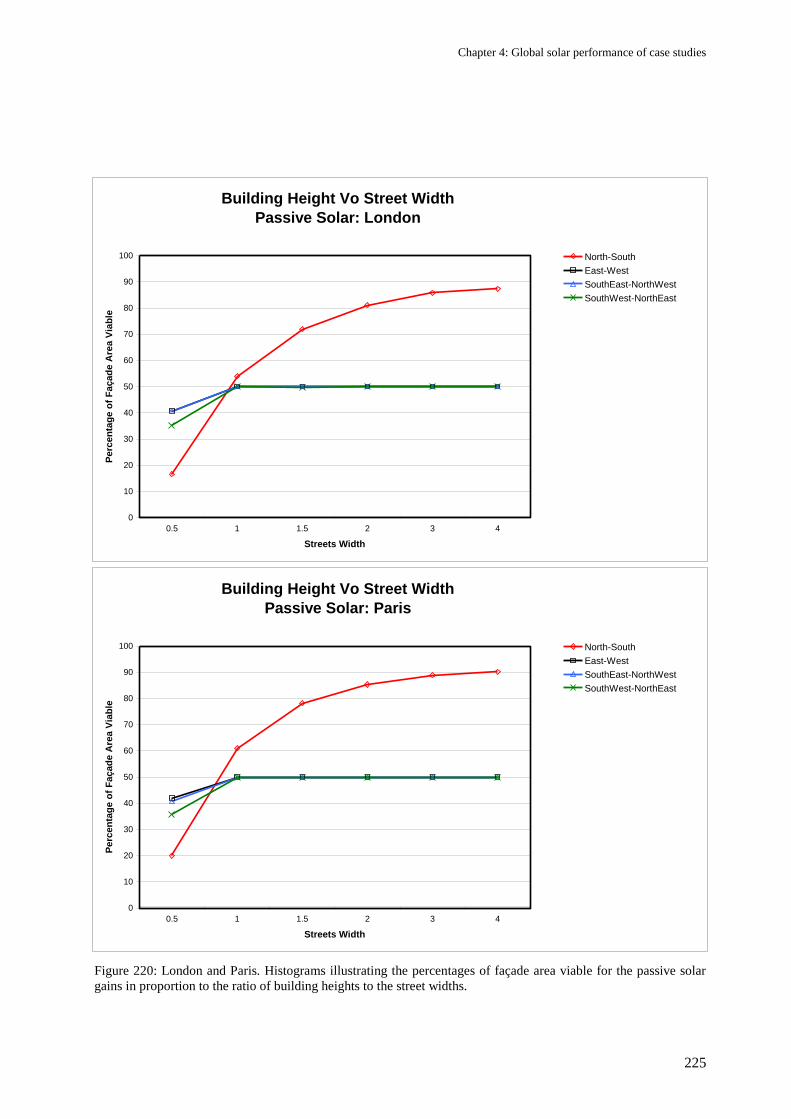
Chapter 4: Global solar performance of case studies
225
Building Height Vo Street Width
Passive Solar: London
0
10
20
30
40
50
60
70
80
90
100
0.5 1 1.5 2 3 4
Streets Width
Perc
en
tag
e o
f F
açad
e A
rea V
iab
le
North-South
East-West
SouthEast-NorthWest
SouthWest-NorthEast
Building Height Vo Street Width
Passive Solar: Paris
0
10
20
30
40
50
60
70
80
90
100
0.5 1 1.5 2 3 4
Streets Width
Perc
en
tag
e o
f F
aç
ad
e A
rea V
iab
le
North-South
East-West
SouthEast-NorthWest
SouthWest-NorthEast
Figure 220: London and Paris. Histograms illustrating the percentages of façade area viable for the passive solar
gains in proportion to the ratio of building heights to the street widths.
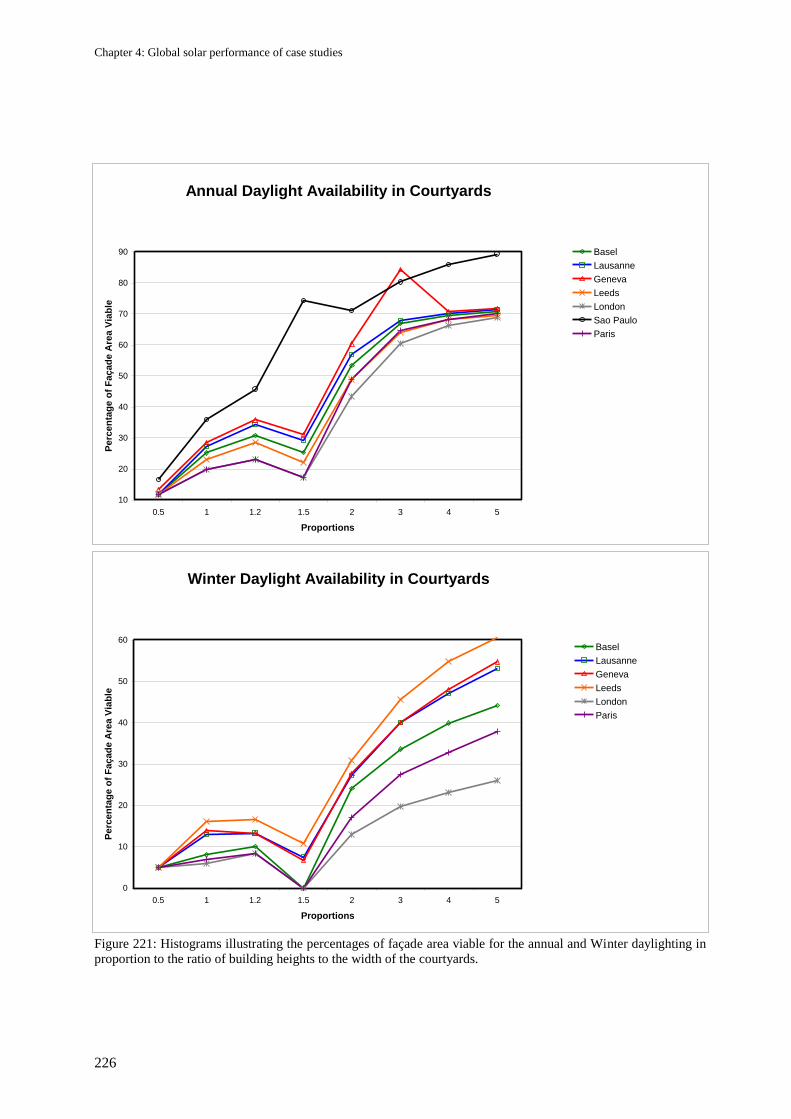
Chapter 4: Global solar performance of case studies
226
Annual Daylight Availability in Courtyards
10
20
30
40
50
60
70
80
90
0.5 1 1.2 1.5 2 3 4 5
Proportions
Perc
en
tag
e o
f F
açad
e A
rea V
iab
le
Basel
Lausanne
Geneva
Leeds
London
Sao Paulo
Paris
Winter Daylight Availability in Courtyards
0
10
20
30
40
50
60
0.5 1 1.2 1.5 2 3 4 5
Proportions
Pe
rce
nta
ge
of
Faç
ad
e A
rea
Via
ble
Basel
Lausanne
Geneva
Leeds
London
Paris
Figure 221: Histograms illustrating the percentages of façade area viable for the annual and Winter daylighting in
proportion to the ratio of building heights to the width of the courtyards.
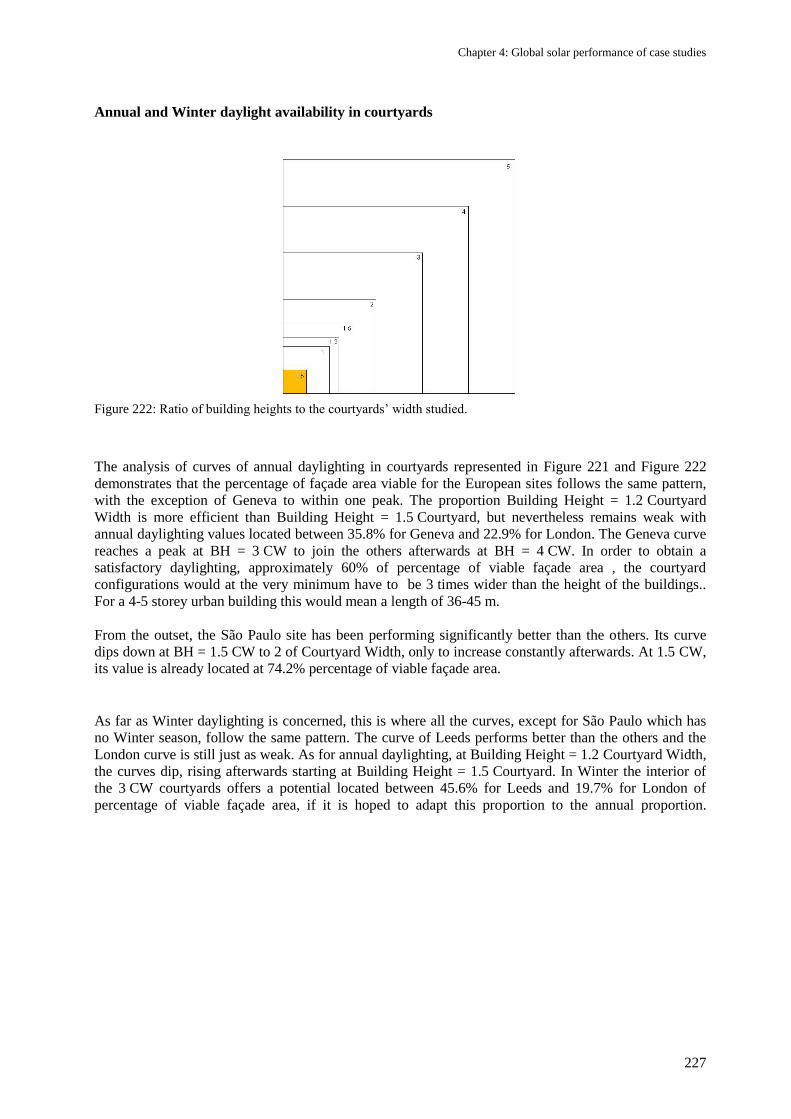
Chapter 4: Global solar performance of case studies
227
Annual and Winter daylight availability in courtyards
Figure 222: Ratio of building heights to the courtyards‘ width studied.
The analysis of curves of annual daylighting in courtyards represented in Figure 221 and Figure 222
demonstrates that the percentage of façade area viable for the European sites follows the same pattern,
with the exception of Geneva to within one peak. The proportion Building Height = 1.2 Courtyard
Width is more efficient than Building Height = 1.5 Courtyard, but nevertheless remains weak with
annual daylighting values located between 35.8% for Geneva and 22.9% for London. The Geneva curve
reaches a peak at BH = 3 CW to join the others afterwards at BH = 4 CW. In order to obtain a
satisfactory daylighting, approximately 60% of percentage of viable façade area , the courtyard
configurations would at the very minimum have to be 3 times wider than the height of the buildings..
For a 4-5 storey urban building this would mean a length of 36-45 m.
From the outset, the São Paulo site has been performing significantly better than the others. Its curve
dips down at BH = 1.5 CW to 2 of Courtyard Width, only to increase constantly afterwards. At 1.5 CW,
its value is already located at 74.2% percentage of viable façade area.
As far as Winter daylighting is concerned, this is where all the curves, except for São Paulo which has
no Winter season, follow the same pattern. The curve of Leeds performs better than the others and the
London curve is still just as weak. As for annual daylighting, at Building Height = 1.2 Courtyard Width,
the curves dip, rising afterwards starting at Building Height = 1.5 Courtyard. In Winter the interior of
the 3 CW courtyards offers a potential located between 45.6% for Leeds and 19.7% for London of
percentage of viable façade area, if it is hoped to adapt this proportion to the annual proportion.
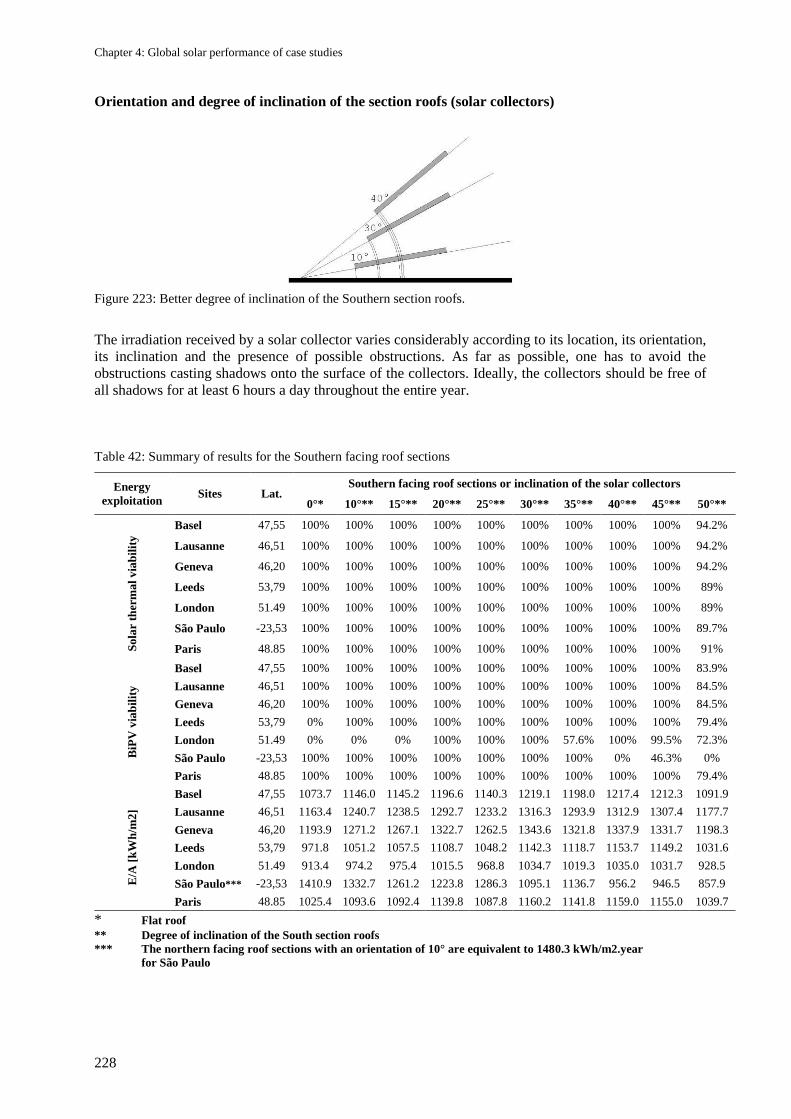
Chapter 4: Global solar performance of case studies
228
Orientation and degree of inclination of the section roofs (solar collectors)
Figure 223: Better degree of inclination of the Southern section roofs.
The irradiation received by a solar collector varies considerably according to its location, its orientation,
its inclination and the presence of possible obstructions. As far as possible, one has to avoid the
obstructions casting shadows onto the surface of the collectors. Ideally, the collectors should be free of
all shadows for at least 6 hours a day throughout the entire year.
Table 42: Summary of results for the Southern facing roof sections
Energy
exploitation Sites Lat.
Southern facing roof sections or inclination of the solar collectors
0°* 10°** 15°** 20°** 25°** 30°** 35°** 40°** 45°** 50°**
So
lar
ther
ma
l v
iab
ilit
y
Basel 47,55 100% 100% 100% 100% 100% 100% 100% 100% 100% 94.2%
Lausanne 46,51 100% 100% 100% 100% 100% 100% 100% 100% 100% 94.2%
Geneva 46,20 100% 100% 100% 100% 100% 100% 100% 100% 100% 94.2%
Leeds 53,79 100% 100% 100% 100% 100% 100% 100% 100% 100% 89%
London 51.49 100% 100% 100% 100% 100% 100% 100% 100% 100% 89%
São Paulo -23,53 100% 100% 100% 100% 100% 100% 100% 100% 100% 89.7%
Paris 48.85 100% 100% 100% 100% 100% 100% 100% 100% 100% 91%
BiP
V v
iab
ilit
y
Basel 47,55 100% 100% 100% 100% 100% 100% 100% 100% 100% 83.9%
Lausanne 46,51 100% 100% 100% 100% 100% 100% 100% 100% 100% 84.5%
Geneva 46,20 100% 100% 100% 100% 100% 100% 100% 100% 100% 84.5%
Leeds 53,79 0% 100% 100% 100% 100% 100% 100% 100% 100% 79.4%
London 51.49 0% 0% 0% 100% 100% 100% 57.6% 100% 99.5% 72.3%
São Paulo -23,53 100% 100% 100% 100% 100% 100% 100% 0% 46.3% 0%
Paris 48.85 100% 100% 100% 100% 100% 100% 100% 100% 100% 79.4%
E/A
[k
Wh
/m2
]
Basel 47,55 1073.7 1146.0 1145.2 1196.6 1140.3 1219.1 1198.0 1217.4 1212.3 1091.9
Lausanne 46,51 1163.4 1240.7 1238.5 1292.7 1233.2 1316.3 1293.9 1312.9 1307.4 1177.7
Geneva 46,20 1193.9 1271.2 1267.1 1322.7 1262.5 1343.6 1321.8 1337.9 1331.7 1198.3
Leeds 53,79 971.8 1051.2 1057.5 1108.7 1048.2 1142.3 1118.7 1153.7 1149.2 1031.6
London 51.49 913.4 974.2 975.4 1015.5 968.8 1034.7 1019.3 1035.0 1031.7 928.5
São Paulo*** -23,53 1410.9 1332.7 1261.2 1223.8 1286.3 1095.1 1136.7 956.2 946.5 857.9
Paris 48.85 1025.4 1093.6 1092.4 1139.8 1087.8 1160.2 1141.8 1159.0 1155.0 1039.7
* Flat roof ** Degree of inclination of the South section roofs *** The northern facing roof sections with an orientation of 10° are equivalent to 1480.3 kWh/m2.year
for São Paulo
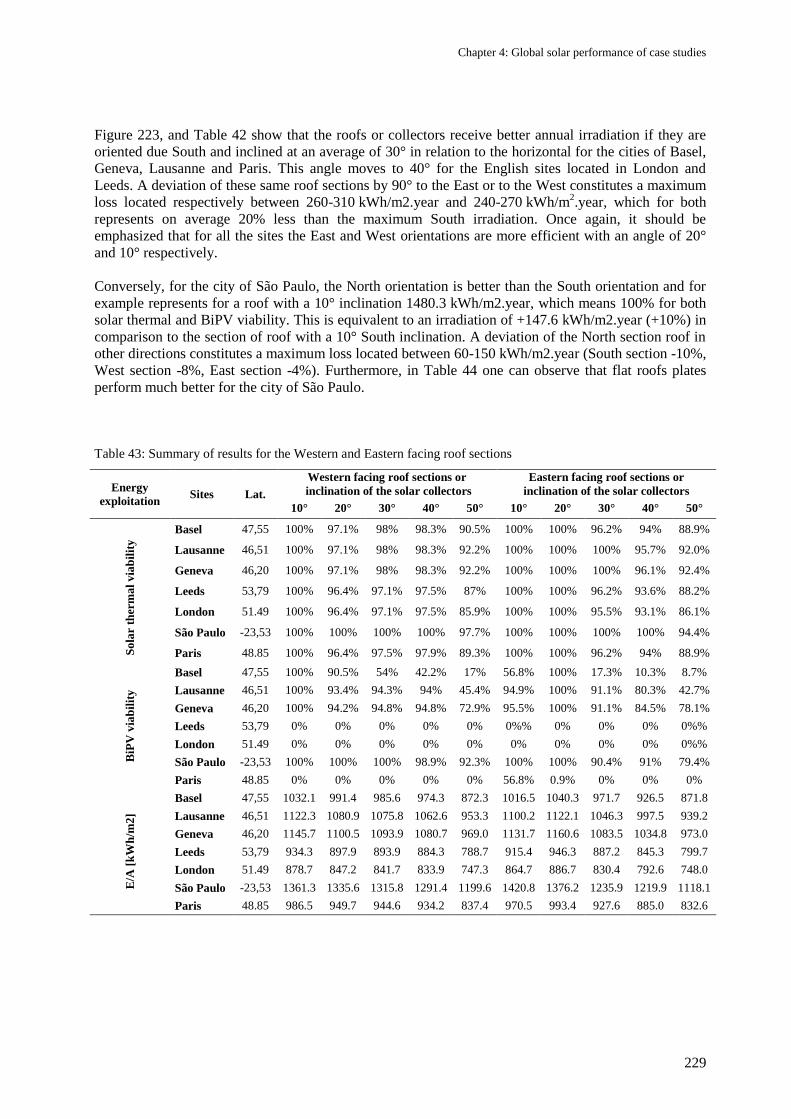
Chapter 4: Global solar performance of case studies
229
Figure 223, and Table 42 show that the roofs or collectors receive better annual irradiation if they are
oriented due South and inclined at an average of 30° in relation to the horizontal for the cities of Basel,
Geneva, Lausanne and Paris. This angle moves to 40° for the English sites located in London and
Leeds. A deviation of these same roof sections by 90° to the East or to the West constitutes a maximum
loss located respectively between 260-310 kWh/m2.year and 240-270 kWh/m2.year, which for both
represents on average 20% less than the maximum South irradiation. Once again, it should be
emphasized that for all the sites the East and West orientations are more efficient with an angle of 20°
and 10° respectively.
Conversely, for the city of São Paulo, the North orientation is better than the South orientation and for
example represents for a roof with a 10° inclination 1480.3 kWh/m2.year, which means 100% for both
solar thermal and BiPV viability. This is equivalent to an irradiation of +147.6 kWh/m2.year (+10%) in
comparison to the section of roof with a 10° South inclination. A deviation of the North section roof in
other directions constitutes a maximum loss located between 60-150 kWh/m2.year (South section -10%,
West section -8%, East section -4%). Furthermore, in Table 44 one can observe that flat roofs plates
perform much better for the city of São Paulo.
Table 43: Summary of results for the Western and Eastern facing roof sections
Energy
exploitation Sites Lat.
Western facing roof sections or
inclination of the solar collectors
Eastern facing roof sections or
inclination of the solar collectors
10° 20° 30° 40° 50° 10° 20° 30° 40° 50°
So
lar
ther
ma
l v
iab
ilit
y
Basel 47,55 100% 97.1% 98% 98.3% 90.5% 100% 100% 96.2% 94% 88.9%
Lausanne 46,51 100% 97.1% 98% 98.3% 92.2% 100% 100% 100% 95.7% 92.0%
Geneva 46,20 100% 97.1% 98% 98.3% 92.2% 100% 100% 100% 96.1% 92.4%
Leeds 53,79 100% 96.4% 97.1% 97.5% 87% 100% 100% 96.2% 93.6% 88.2%
London 51.49 100% 96.4% 97.1% 97.5% 85.9% 100% 100% 95.5% 93.1% 86.1%
São Paulo -23,53 100% 100% 100% 100% 97.7% 100% 100% 100% 100% 94.4%
Paris 48.85 100% 96.4% 97.5% 97.9% 89.3% 100% 100% 96.2% 94% 88.9%
BiP
V v
iab
ilit
y
Basel 47,55 100% 90.5% 54% 42.2% 17% 56.8% 100% 17.3% 10.3% 8.7%
Lausanne 46,51 100% 93.4% 94.3% 94% 45.4% 94.9% 100% 91.1% 80.3% 42.7%
Geneva 46,20 100% 94.2% 94.8% 94.8% 72.9% 95.5% 100% 91.1% 84.5% 78.1%
Leeds 53,79 0% 0% 0% 0% 0% 0%% 0% 0% 0% 0%%
London 51.49 0% 0% 0% 0% 0% 0% 0% 0% 0% 0%%
São Paulo -23,53 100% 100% 100% 98.9% 92.3% 100% 100% 90.4% 91% 79.4%
Paris 48.85 0% 0% 0% 0% 0% 56.8% 0.9% 0% 0% 0%
E/A
[k
Wh
/m2
]
Basel 47,55 1032.1 991.4 985.6 974.3 872.3 1016.5 1040.3 971.7 926.5 871.8
Lausanne 46,51 1122.3 1080.9 1075.8 1062.6 953.3 1100.2 1122.1 1046.3 997.5 939.2
Geneva 46,20 1145.7 1100.5 1093.9 1080.7 969.0 1131.7 1160.6 1083.5 1034.8 973.0
Leeds 53,79 934.3 897.9 893.9 884.3 788.7 915.4 946.3 887.2 845.3 799.7
London 51.49 878.7 847.2 841.7 833.9 747.3 864.7 886.7 830.4 792.6 748.0
São Paulo -23,53 1361.3 1335.6 1315.8 1291.4 1199.6 1420.8 1376.2 1235.9 1219.9 1118.1
Paris 48.85 986.5 949.7 944.6 934.2 837.4 970.5 993.4 927.6 885.0 832.6
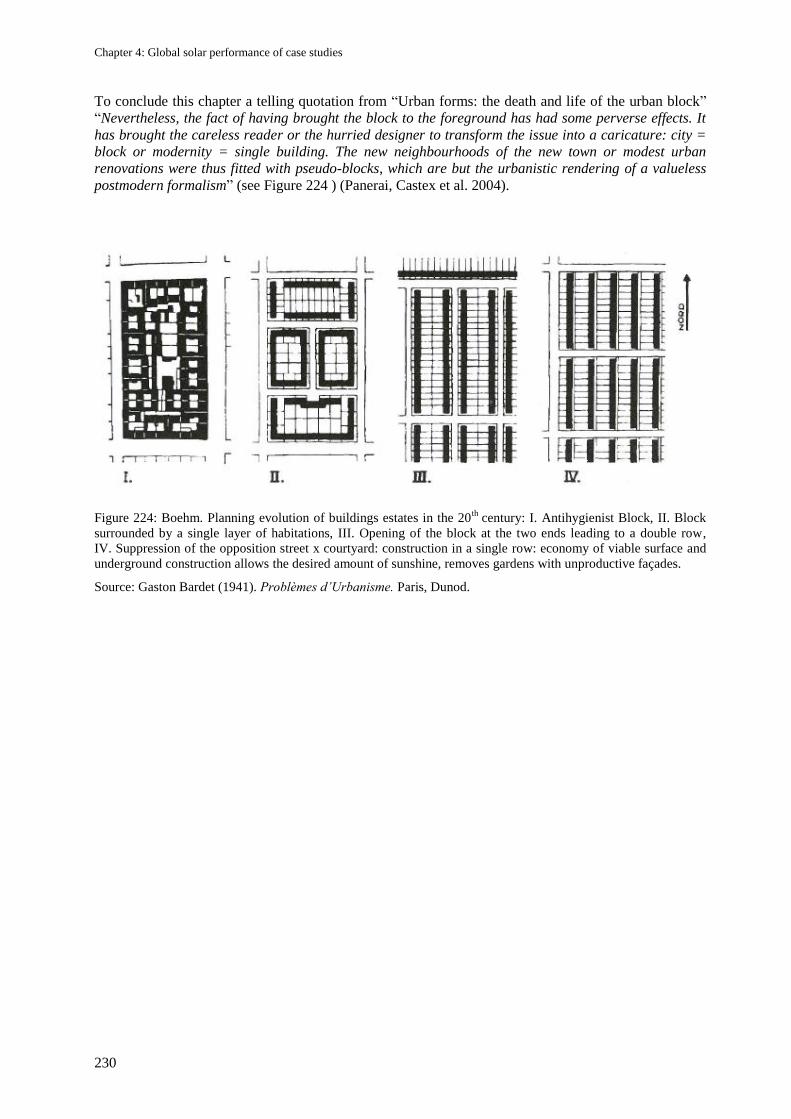
Chapter 4: Global solar performance of case studies
230
To conclude this chapter a telling quotation from ―Urban forms: the death and life of the urban block‖
―Nevertheless, the fact of having brought the block to the foreground has had some perverse effects. It
has brought the careless reader or the hurried designer to transform the issue into a caricature: city =
block or modernity = single building. The new neighbourhoods of the new town or modest urban
renovations were thus fitted with pseudo-blocks, which are but the urbanistic rendering of a valueless
postmodern formalism‖ (see Figure 224 ) (Panerai, Castex et al. 2004).
Figure 224: Boehm. Planning evolution of buildings estates in the 20th
century: I. Antihygienist Block, II. Block
surrounded by a single layer of habitations, III. Opening of the block at the two ends leading to a double row,
IV. Suppression of the opposition street x courtyard: construction in a single row: economy of viable surface and
underground construction allows the desired amount of sunshine, removes gardens with unproductive façades.
Source: Gaston Bardet (1941). Problèmes d’Urbanisme. Paris, Dunod.
231
Chapter 5: Achievements and future outlook
5.1 Achievements
The principal aim of this doctoral thesis was the evaluation of the gross and useful solar radiation and
daylight flux which are impinging the envelopes of buildings in representative urban environments
located in Switzerland, the United Kingdom and Brazil. It focuses on the relatively large scale of urban
districts and involves eight urban sites in the world which were modelled and analyzed.
The method adopted for all computer simulations consisted in modelling—via a computer-aided
drawing piece of software, namely AutoCAD— the digital model of each building or group of buildings
prior to their export toward a urban performance analysis software (PPF software package). Spatial
distributions of solar irradiation and daylight fluxes over the overall building façades and roofs were
calculated using ray-tracing simulation techniques in order to determine the appropriate placement of
different solar technologies (passive and active solar, photovoltaic and daylighting). Several
performance indicators were used to assess the solar utilisation potential of these urban sites (e.g.
statistics of sky view factors and daylight factors) in order to identify optimal solar strategies for these
urban contexts.
The second objective of this thesis was the comparison of conceptual urban planning and design in
order to explore the impact of different indicators of building density in an urban context. To achieve
this, four different types of representative built forms in Basel and in the other European cities were
compared for their daylighting and solar potentials. In addition, comparisons between the urban sites
and various density indicators were carried out.
Finally, the third objective of this study was to examine some of Le Corbusier‘s original architectural
concepts. To this end, numerical simulations were carried out using a rational approach applied to Le
Corbusier‘s proposition concerning the ―solar theory‖ he used in his urban projects.
This study also presents the various works and sun-related recommendations that have appeared
principally since the end of the 19th century, together with the various related scientific models and
software tools. Many theories, tools and methods have been suggested by physicians, engineers and
physicists, as well as by the architects themselves. What emerges from the latter regarding the various
solar orientations alternatives is the existence of a persistent problem from the 19th century until the
beginning of the 20th. Even today, in spite of our increased scientific knowledge of solar energy, this
choice is frequently problematic and restrictive. This study offers some alternative approaches, but as
the field is so vast and the time so limited some of these questions will regrettably for the time being
remain unanswered.
Before concluding this research, it is worthwhile to look again at the three statements of the thesis set
down at its beginning:
Hypothesis 1: The shape and spatial layout of the buildings can considerably improve their solar
energy incomes.
This hypothesis was analyzed throughout Chapter 4 using concrete examples and case studies. The
shape and buildings layout can drastically modify the main façades‘ orientation from which solar energy
collection depends. Indeed, it is necessary to juggle with all the directions to provide an appropriate
response to all the practical constraints and improve the viability of solar technologies. For certain
towns, the margin of manoeuvrability is broader than for others. However one has to choose the
predominant parameters of a design project and conversely abandon those, which are not achievable or
have an insignificant impact on the final results, such as implementing PV panels on façades in a dense
urban area.
Chapter 5: Achievements and future outlook
232
Hypothesis 2: High density does not always reduce the utilization potential of solar energy in an
urban context.
This hypothesis was also analyzed in the course of this thesis. The results also suggest that considerable
progress can be achieved in terms of daylight and solar potential, simply by reorganizing the layout of
building blocks without reducing the amount of usable floor area. For all that, extensive covering of the
site is not generally preferable because it reduces the daylight availability and solar potential on the
building façades. Nevertheless, the roof surfaces do remain an important source of usable surface for
thermal solar and BiPV applications.
Hypothesis 3: The Contemporary City of Three Million Inhabitants would not offer the expected
quality of solar exposure claimed by Le Corbusier at that earlier time.
Hypothesis 3 was proved by comparing the daylighting performance and solar potential of Le
Corbusier‘s Contemporary City with two classical Parisian urban blocks. The rational and systematic
urban plan designed by Le Corbusier, is not an effective design option for either density or daylighting
performance. Indeed, the more random traditional pattern showed a comparable daylighting potential
and possibly higher urban density. Relying on health regulations and without any scientific basis, Le
Corbusier‘s plan was simply too radical a reform of the urban fabric of the French capital.
To claim that this doctoral thesis includes all the aspects of urban design and building shapes would be
pretentious. ―Indeed, in this complex system which is the city, everything has an influence on
everything: economic logic, the logic of property, financial logic, the logic of regulations, technological
and behavioural logic are constantly interreacting‖ (Allain 2004). The same urban design could be
suitable for a given location and not for another, because of the different neighbourhood constraints. It
does not make sense to maximize the buildings performance in terms of daylighting and solar potential,
if afterwards we are going to place it in non appropriate location. As Goethe said of Christopher
Marlowe‘s Dr Faustus: ―Wie gross ist alles angelegt?‖. Far more pertinent to this research one could do
no better than to ponder again the phrase by Prof. Rémy Allain66
who has brought so much knowledge
to all those who have chosen the town as their preoccupation : ―One has to realize that the urban form
is not easily grasped‖.
5.2 Future Outlook
This study could be extended in various ways. In addition to the computer analyses related to the solar
potential of buildings, it could be extended in order to include geographic and temporal sectors in
Canada, China, Danemark, Germany, Italy, Japan, Russia, USA, Spain, etc.
It would also be useful to compile a handbook/catalogue comprising all possible combinations of
generic urban layouts with their impact in terms of daylighting and solar potential in a built
environment. One essential requirement would be to model urban forms with an identical plot ratio in
order to obtain comparable results. This study could also include a choice of ―good and bad‖ examples
of existing districts using the same methods of analysis used in the present research study. This
catalogue would be of enormous value to urban planners and architects for the creation of housing
estates or entire districts. It would also be interesting to extend this analysis to other representative
regions located at different latitudes to provide more detailed knowledge in planning solar cities.
Moreover, it would be important to include in this study a Summer daylighting analysis of urban zones
in order to examine overheating risks. The problem of overheating is especially relevant today and
resolving it would avoid using air conditioning in certain buildings. It would be invaluable in creating
66
Prof. Rémy Allain, RESO (Rennes - Espaces et Sociétés), UMR CNRS 6590. Allain, R. (2004). La morphologie
urbaine. Paris, Armand Colin/SEJER.
Chapter 5: Achievements and future outlook
233
districts which would limit overheating risks. In fact, if urban shapes strongly influence the daylighting
of buildings during the Winter period, this impact is lower in the Summer period for our latitudes.
To return to the simulations, a precise positioning of the windows on the external building envelopes
would be of great interest. Analysis of this kind would allow us to consider the windows of the envelope
and thereby provide an estimation of the amount façade openings as well as contributions to solar gains.
No cast shadow can impede the utilisation of solar energy. Another possible approach would be to
evaluate the direct shading effects of trees on buildings. A shading effect does not only affect buildings
but also the interstitial spaces in-between them which are usually in semidarkness. An examination of
the impact of built forms on exterior zones would considerably enhance this study.
To conclude an analysis of the so-called non-passive solar zones in buildings in order to avoid them as
much as possible would also be of undeniable benefit to the solar performance of buildings. Spaces
which are in the buildings‘ angles or on the inside buildings and which cannot sufficiently benefit from
daylight, solar gains and natural ventilation must be avoided. One could also proceed to an in-depth
study of buildings in relation to their compactness in order to increase the amount of floor area
benefitting from daylight and passive solar energy.

235
Bibliography
Aida, M. and K. Gotoh (1982). "Urban albedo as a function of the urban structure — A two-
dimensional numerical simulation, Part II." Boundary-Layer Meteorology 23(4): pp. 415-424.
Allain, R. (2004). La morphologie urbaine. Paris, Armand Colin/SEJER.
Allix, G. (2009). Urbanisation: et si les villes étaient la solution ? De nombreuses métropoles émettent
moins de C02 par habitant que le taux de la moyenne nationale. Le Monde - Dossier Environnement.
Paris: 3, July-Agust 2009.
Ashmore, J. and P. Richens (2001). "Computer Simulation in Daylight Design: a comparison."
Architectural Science Review 44(1): pp. 33-44.
Bardet, G. (1945). Pierre sur Pierre. Paris, Editions L.C.B.
Barton, W. (2006). Eastern Quarry, East Village and Gateway, Initial Master Plan Proposals and
Strategy for Delivery. Reading, Town Planning and Masterplanning Consultancy: 94.
Basel-Stadt, B. d. K. (2001). Pilot region Basel: die 2000 Watt-Gesellschaft, Strategie Nachhaltigkeit
der ETH.
Beaudry, E. (2005). Reconstruction 3D d'une ville à partir de photos: essais sur Sherbrooke, Mini-projet
dans le cours IFT786, Session été 2005. Laboratoires Planiart et Laborius. Sherbrooke, Université de
Sherbrooke.
Bourbia, F. and H. B. Awbi (2004). "Building cluster and shading in urban canyon for hot dry climate,
Part 2: Shading simulation." Renewable Energy 29: pp. 291–301.
Broadbent, G. (1990). Emerging Concepts in Urban Space Design. London, E&FN Spon.
Cárdenas-Jirón, L. A. (2009). Comparison of thermal energy performance on two distinctive urban
fabrics at neighbourhood scale. In Proceedings CISBAT 2009, 2–3 Sept 2009, Lausanne.
Carneiro, C. and F. Golay (2007). Un modèle urbain numérique… et puis ? Vers une étude d‘utilité. In
Proceedings GéoCongrès 2007, 2-5 october, Québec, Canada.
Cheng, V., K. Steemers, M. Montavon and R. Compagnon (2006). Compact cities in a sustainable
manner. 2nd International Solar Cities Congress, 3-6 April, Oxford.
Cheng, V., K. Steemers, M. Montavon and R. Compagnon (2006). Urban Form, Density and Solar
Potential. In Proceedings PLEA2006, 23rd International Conference on Passive and Low Energy
Architecture, 6-8 September.
Chevrier, C. and J.-P. Perrin (2001). Interactive 3D reconstruction for urban areas: an image based tool.
Nancy, Centre de Recherche en Architecture et Ingénierie, Ecole Nationale Supérieure d'Architecture de
Nancy: 13. [online] URL: http://www.crai.archi.fr/media/pdf/caadFutures2001.pdf. Consulted on
February 1, 2008.
Cohen, M. F. and J. R. Wallace (1993). Radiosity and Realistic Image Synthesis. Cambridge, MA,
Academic Press Professional.
Bibliography
236
Compagnon, R. (2000). PRECis: Assessing the Potential for Renewable Energy in Cities, Annexe3:
Solar and daylight availability in urban areas. Fribourg, University of Applied Sciences of Western
Switzerland (HES-SO).
Compagnon, R. (2002). L'architecture au doigt et à l'oeil. La Liberté. Fribourg, October 2002: 35.
Compagnon, R. (2004). "Solar and daylight availability in the urban fabric." Energy and Buildings
36(4): 321-328.
Compagnon, R. and D. Raydan (2000). Irradiance and illuminance distributions in urban areas. In
Proceedings PLEA 2000, 17st International Conference on Passive and Low Energy Architecture, July
3-5, Cambridge (UK).
Comtat&Allardet and Aubade (2008). Le chauffage: les différente énergies, [online] URL:
http://www.leguideduchauffage.com/actualites-energies.php. Consulted on January 7, 2008.
Djafi, F. (2005). L‘apport du réalisme visuel à la représentation de l‘image de synthèse dans un contexte
de conception architecturale assistée par ordinateur (CAAO). Faculté d'aménagement, d'architecture et
des arts visuels. Québec, Université de Laval: 140.
Duarte, D. and J. Gonçalves (2006). Environment and Urbanization: Microclimatic Variations in a
Brownfield Site in Sao Paulo, Brazil. In Proceedings PLEA2006, 23rd International Conference on
Passive and Low Energy Architecture, 6-8 September, Geneva, Switzerland.
Eaton, R. (2001). Cités idéales, L'utopisme et l'environnement (non) bâti. Anvers, Fonds Mercator.
ETSU (1987). Passive solar design programme, leaflet 19: Housing estate layout: a design aid. ETSU,
Harwell: UK.
Everett, R. (1980). Passive solar in Milton Keynes, Research Report ERG 031. Milton Keynes (UK),
Energy Research Group,The Open University.
Ganz, C., A. Muller, J.-B. Gay, N. Kohler, C.-A. Roulet and J.-L. Scartezzini (1990). Le Soleil, Chaleur
et lumière dans le bâtiment. Zürich, SIA.
Gay, J.-B., M. Montavon, D. Von der Muehll, D. Malatesta, A. da Cunha and J.-P. Dind (2004).
Quartiers durables BaLaLuZh, Quartier Bellevaux - Lausanne, Rapport final de la phase 1. Lausanne
(Switzerland), Solar Energy and Building Physics Laboratory (LESO-PB), Ecole Politechnique
Fédérale de Lausanne (EPFL).
Goral, C. M., K. E. Torrance, D. P. Greenberg and B. Battaile (1984). "Modeling the Interaction of
Light Between Diffuse Surfaces." Computer Graphics 18(3): 10.
Goulding, J. R., J. O. Lewis and T. C. Steemers (1986). Energy in architecture : the European passive
solar handbook. London, Batsford for the Commission of the European Communities.
Gropius, W. (1935). The new architecture and The bauhaus. London, Faber and Faber Limited.
Grundbuch- und Vermessungsamt, B.-S. (2005). Gebäudedaten, [online] URL: http://www.gva-
bs.ch/produkte_3d-stadtmodelle_gebaeude.cfm. Consulted on June10, 2005.
Gupta, V. (1987). Thermal efficiency of building clusters: an index for non-air-conditioned buildings in
hot climates. in: D. Hawkes et al. (Eds.), Energy and Urban Built Form, Butterworths, UK.
Bibliography
237
Gupta, V. K. (1984). "Solar radiation and urban design for hot climates." Environment and Planning B:
Planning and Design 11(4): pp. 435-454.
Harzallah, A. (2007). Emergence et évolutions des préconisations solaires dans les théories
architecturales et urbaines en France, de la seconde moitié du XIXème siècle à la deuxième guerre
mondiale. Thèse de doctorat. Ecole Nationale Supérieure d'Architecture de Nantes, Université de
Nantes.
HMSO (1971a). Sunlight and daylight: planning criteria for the design of buildings. UK Department of
the Environment / Welsh Office.
HMSO (1971b). Sunlight and daylight: planning criteria for the design of buildings. UK Department of
the Environment / Welsh Office.
Houpert, S. (2006). Approche inverse pour la résolution de contraintes solaires et visuelles dans le
projet architectural et urbain, Développement et application du logiciel SVR. Thèse de doctorat. Ecole
Nationale Supérieure d'Architecture de Nantes. Nantes, Université de Nantes.
Janey, N. (2007). Infographie, [online] URL: http://raphaello.univ-fcomte.fr/Ig/Default.htm. Consulted
on November 3, 2007
Kaempf, J. H., M. Montavon, J. Bunyesc, R. Bolliger and D. Robinson (2007). Optimisation of
Buildings Daylight Availability. In Proceedings CISBAT 2007, 4–5 Sept 2007, Lausanne.
Kaempf, J. H., M. Montavon, J. Bunyesc, R. Bolliger and D. Robinson (2009). "Optimisation of
buildings‘ solar irradiation availability." Solar Energy 84(4): 596-603.
Klemm, K. and D. Heim (2009). Wind flow and sun accessibility in narrow spaces between buildings.
In Proceedings CISBAT 2009, 2–3 Sept 2009, Lausanne.
Knowles, R. L. (2003). "The solar envelope: Its meaning for energy and buildings." Energy and
Buildings 35(1): 15-25.
Kovach, A. and J. Schmid (1996). "Determination of energy output losses due to shading of building-
integrated photovoltaic arrays using a raytracing technique." Solar Energy 57(2): 117-124.
Kristl, Z. and A. Krainer (2001). "Energy evaluation of urban structure and dimensioning of building
site using iso-shadow method." Solar energy 70(1): 23-34
Kunstler, J. H. (1996). Home from nowhere: remaking our everyday world for the 21st century. New
York, Simon & Schuster.
Le Corbusier (1935). La Ville Radieuse. Boulogne, Editions de l'Architecture d'Aujourd'hui.
Le Corbusier (1935). La Ville Radieuse : éléments d‘une doctrine d‘urbanisme pour l‘équipement de la
civilisation machiniste. Boulogne, Editions de l‘Architecture d‘Aujourd‘hui.
Leung, K. S. and K. Steemers (2009). Exploring solar-responsive morphology for high-density housing
in the tropics. In Proceedings CISBAT 2009, 2–3 Sept 2009, Lausanne.
Littlefair, P. (1991). Site layout planning for daylight and sunlight: a guide to good practice, BRE
Report 209, BREPress (UK).
Bibliography
238
Littlefair, P., M. Santamouris, S. Alvarez, A. Dupagne, D. Hall, J. Teller, J. F. Coronel and N.
Papanikolaou (2000 ). Environmental site layout planning: solar access, microclimate and passive
cooling in urban areas. London (UK), Building Research Establishment.
Maas, H.-G. (1999). Closed solutions for the determination of parametric building models from
invariant moments of airborne laserscanner data. ISPRS Conference 'Automatic Extraction of GIS
Objects from Digital Imagery', International Archives of Photogrammetry and Remote Sensing, Vol. 32,
Part 3-2W5, pp. 193-199, 6-10 September, Munich, Germany.
Maas, H.-G. (1999). Fast determination of parametric house models from dense airborne laserscanner
data. International Workshop on Mobile Mapping Technology, International Archives of
Photogrammetry and Remote Sensing Vol. 32, Part 2W1, 21-23 April, Bangkok, Thailand.
March, L. (1972). Elementary models of built forms. In Urban Space and Structures. Eds L. Martin and
L. March. Cambridge, Cambridge University Press: 55
March, L. and M. Trace (1962). The land use performances of selected arrays of built forms, Working
Paper N°2. Cambridge, The Martin Centre for Architectural and Urban Studies, Department of
Architecture, University of Cambridge.
Marchand, B., M. Montavon, K. Bossy, G. Doessegger and J. Urfer (2008). Ville de Genève. Les
enjeux qualitatifs de la densification par surélévation. Geneva, DeLaMa Urbanisme et aménagement du
territoire - Service d'urbanisme de la ville de Genève.
Mardaljevic, J. (1995). "Validation of a lighting simulation program under real sky conditions."
Lighting research & technology 27(4): 181-188
Mardaljevic, J. and J. Rylatt (2000). An imagebased analysis of solar radiation for urban settings. In
Proceedings PLEA 2000, 17st International Conference on Passive and Low Energy Architecture, July
3-5, Cambridge (UK).
Mardaljevic, J. and M. Rylatt (2003). "Irradiation mapping of complex urban environments: an image-
based approach " Energy and Buildings 35(1): 27-35.
Marsh, A. (2004). Non-Uniformity in the Incident Solar Radiation over the Facades of High Rise
Buildings. In Proceedings PLEA 2004, 21st International Conference on Passive and Low Energy
Architecture, 19-22 September, Eindhoven, The Netherlands.
Martin, L. and L. March (1972). Urban Space and Structures. Cambridge, UK, Cambridge University
Press.
Massé, G., et al. (1943). Le soleil. Techniques et Architecture. Paris (France), Altedia Communication:
169-221.
Mazzoni, C. (2000). De la ville-parc à l'immeuble à cour ouverte, Paris (1919-1939). Paris, Presses
Universitaires du Septentrion 2000.
Meier, W. (2008). 3D-Stadtmodell des Kantons Basel-Stadt, Grundbuch- und Vermessungsamt,
Justizdepartement des Kantons Basel-Stadt: 2.
Mohsen, M. A. (1979). "Solar Radiation and Courtyard House Forms II: Application of the Model."
Building and Environment 14: pp. 185-201.
Montavon, M., D. Robinson, J.-L. Scartezzini and R. Compagnon (2007). "Urban daylight and solar
radiation potential: analysis of three Swiss districts." International Journal of Solar Energy. (submitted).
Bibliography
239
Montavon, M., J.-L. Scartezzini and R. Compagnon (2004). Comparison of the solar energy utilisation
potential of different urban environments. In Proceedings PLEA 2004, 21st International Conference on
Passive and Low Energy Architecture, 19-22 September, Eindhoven, The Netherlands.
Montavon, M., J.-L. Scartezzini and R. Compagnon (2004). Solar energy utilisation potential of three
Swiss urban sites. In Proceedings 13th Status-Seminar Energie und Umweltforschung im Bauwesen, 9-
10 September, Zürich, Switzerland.
Montavon, M., K. Steemers, V. Cheng and R. Compagnon (2006). La Ville Radieuse by Le Corbusier,
once again a case study. In Proceedings PLEA 2006, 23rd International Conference on Passive and
Low Energy Architecture, 6-8 September, Geneva, Switzerland.
Morello, E. and C. Ratti (2009). "Sunscapes: ‗Solar envelopes‘ and the analysis of urban DEMs "
Computers, Environment and Urban Systems 33(1): pp. 26-34
Muhaisen, A. S. (2006). "Shading simulation of the courtyard form in different climatic regions."
Building and Environment 41(12): pp. 1731-1741
Muhaisen, A. S. and M. B. Gadi (2006). "Effect of courtyard proportions on solar heat gain and energy
requirement in the temperate climate of Rome." Building and Environment 41(3): pp. 245-253
Neufert, E. (1983). Les éléments des projets de construction Paris, Dunod.
Ng, E. (2004). Better Daylight and Natural Ventilation by Design. In Proceedings PLEA 2004, 21st
International Conference on Passive and Low Energy Architecture, 19-22 September, Eindhoven, The
Netherlands.
Nikolopoulou, M. (2004). RUROS: Rediscovering. the Urban Realm and Open Spaces. Designing Open
Spaces in the Urban Environment: a Bioclimatic Approach. Fifth Framework Programme of the EU,
Jan. 2001 to March 2004. Pikermi Attiki (Greece), Department of Buildings, Centre for Renewable
Energy Sources (CRES).
Nunez, M. and T. R. Oke (1976). "Long-wave radiative flux divergence and nocturnal cooling of the
urban atmosphere." Boundary-Layer Meteorology 10(2): pp. 121-135.
Okeil, A. (2004). In Search for Energy Efficient Urban Forms: The Residential Solar Block. In
Proceedings of the Fifth International Conference on Indoor Air Quality, Ventilation and Energy
Conservation in Buildings, May 2004, Toronto.
Panão, M. J. N. O., H. J. P. Gonçalves and P. M. C. Ferrão (2008). "Optimization of the urban building
efficiency potential for mid-latitude climates using a genetic algorithm approach." Renewable Energy
33(5): pp. 887-896.
Panerai, P., J. Castex, J. C. Depaule and I. Samuels (2004). Urban Forms: The Death and Life of the
Urban Block. Oxford.
Peckham, R. J. (1985). Shading evaluations with general three-dimensional models. Oxford (UK),
Elsevier Science.
Perrin, J.-P., N. Allani-Bouhoula, C. Chevrier and E. Viard (1998). Projet MEDINA : reconstruction de
volumétries urbaines. Nancy, Centre de Recherche en Architecture et Ingénierie, Ecole Nationale
Supérieure d'Architecture de Nancy: 8.
Philippe Panerai, J. C., Jean-Charles Depaule (1997). Formes urbaines de l'îlot à la barre, Parenthèses
Bibliography
240
Quaschning, V. and R. Hanitsch (1998). "Irradiance calculation on shaded surfaces " Solar Energy
62(5): 369-375.
Raclot, D., C. Puech, N. Mathys, B. Roux, A. Jacome, J. Asseline and J.-S. Bailly (2005).
"Photographies aériennes prises par drone et Modèle Numérique de Terrain : apports pour l'observatoire
sur l'érosion de Draix." Géomorphologie : relief, processus, environnement 1(2005): 7-20. [online]
URL:http://geomorphologie.revues.org/document209.html. Consulted on September 1, 2007.
Ratti, C., D. Raydan and K. Steemers (2003). "Building form and environmental performance:
archetypes, analysis and an arid climate " Energy and Buildings 35 (1): pp. 49-59
Rey, A.-A., J. Pidoux and C. Barde (1928). La science des plans de villes : ses applications à la
construction, à l‘extension, à l‘hygiène et à la beauté des villes : orientation solaire des habitations.
Lausanne, Payot.
Richens, P. (1997). Image processing for urban scale environmental modelling. In Proceedings Fifth
International IBPSA Conference: Building Simulation 97, Prague (Czech Republic), International
Building Performance Simulation Association.
Robinson, D. (2006). "Urban morphology and indicators of radiation availability." Solar Energy 80(12):
1643-1648.
Robinson, D., J.-L. Scartezzini, M. Montavon and R. Compagnon (2005). SOLURBAN: Solar
Utilisation Potential of Urban Sites, Swiss Federal Office for Energy (OFEN). Lausanne (Switzerland),
Solar Energy and Building Physics Laboratory (LESO-PB), Ecole Polytechnique Fédérale de Lausanne
(EPFL).
Robinson, D. and A. Stone (2004). Irradiation modelling made simple: the cumulative sky approach and
its applications. In Proceedings PLEA 2004, 21st International Conference on Passive and Low Energy
Architecture, 19-22 September, Eindhoven, The Netherlands.
Roudaut, P. and C. Vidal (2008). Evaluation de CUDA par un ray-tracing, Mini projet 2008, [online]
URL: http://xtra.creativity.free.fr/CUDA/CUDA.pdf. Consulted on August 31, 2009
Ruano, M. (1999). EcoUrbanism. Sustainable Human Settlements: 60 cases studies. Barcelona,
Editorial Gustavo Gili SA.
Sailor, D. and H. Fan (2002). "Modeling the diurnal variability of effective albedo for cities."
Atmospheric Environment 36(4): pp. 713-725.
Scartezzini, J.-L., M. Montavon and R. Compagnon (2002). Computer evaluation of the solar energy
potential in an urban environment. EuroSun2002, Bologna (Italy).
SOLAR Agentur (2009). Schweizer Solarpreis 2009, MFH-Sanierung Feldbergstrasse 4+6, 4057 Basel,
[online] URL: http://www.solaragentur.ch/dokumente//G-09-08-20%20Viriden.pdf Consulted on
December 1, 2009. Schweizer Solarpreis 2009, SOLAR Agentur Schweiz.
Steemers, K., N. Baker, D. Crowther, J. Dubiel, M. H. Nikolopoulou and C. Ratti (1997). "City texture
and microclimate." Urban Design Studies 3: pp. 25-50.
Steemers, K., M. Montavon, V. Cheng, R. Compagnon and F. Oliviera Sa (2007). Testing the
masterplan. An environmental assessment of the Eastern Quarry development proposal in Ebbsfleet
Bibliography
241
Valley. Cambridge, The Martin Centre for Architectural and Urban Studies, Department of
Architecture, University of Cambridge: 35.
Steemers, K., D. Raydan, C. Ratti and D. Robinson (2000). PRECis: Assessing the Potential for
Renewable Energy in Cities. The European Commission, Directorate General XII Science, Research
and Development, Joule III Non Nuclear Energy Programme. Cambridge, The Martin Centre for
Architectural and Urban Studies, Department of Architecture, University of Cambridge.
Teller, J. and S. Azar (2001). "Townscope II—A computer system to support solar access decision-
making." Solar Energy 70(3): 187-200.
Vinaccia, G. (1943-52). Per la Città di Domani, Volume I: Come il clima plasma la forma urbana e
l'architettura -la sanità e l'igiene cittadina. Roma, Palombi.
von Weizsacker, E., A. B. Lovins and L. H. Lovins (1997 ). Factor four: doubling wealth - halving
resource use: the new report to the Club of Rome. London, Earthscan.
Ward Larson, G. and R. Shakespeare (2003 [1998]). Rendering with Radiance: The Art and Science of
Lighting Visualization 1998. Davis, California (USA), Space& Light.
Wilson, J. (2006). Tower Works, Towers of Strength. Creating a high profile exemplar mixed use
scheme that will provide the inspiration for a higher standard of sustainable development. Leeds, Carey
Jones Architects: 85.
Wirth, B. (2005). "Systèmes d‘information du territoire, La troisième dimension dans la mensuration
officielle." Géomatique Suisse(6).
Yezioro, A., I. G. Capeluto and E. Shaviv (2006). "Design guidelines for appropriate insolation of urban
squares." Renewable Energy 31(7): 1011-1023.
Yezioro, A. and E. Shaviv (1994). "SHADING: a design tool for analyzing mutual shading between
buildings." Solar Energy 52(1): 27-37.


Curriculum Vitae
Education
2010 Ph.D. in Environment (EDEN), LESO-PB, ENAC, IIC, EPFL
Thesis title: ―Optimisation of Urban Form by the Evaluation of the Solar Potential‖.
2001 M.Sc. of Art in Architecture, EPFL (―Diplôme d'architecte EPFL‖).
1993 Bachelor of Art in Architecture, HES-Bernoise (―Diplôme d'architecte HES‖).
1989 Federal certificate of Architectural Draughtsman, CFPS, Sion
(―CFC, Certificat Fédéral de Capacité de dessinatrice en bâtiments‖).
1985 Diploma of Secondary Education, Collège de Derborence, Conthey, Switzerland
Scientific orientation (niveau A).
Academic Awards
2004 Performance bonus as a research assistant at LESO-PB, ENAC, IIC, EPFL
2000 Cantonal Bank of Vaud (BCV) Prize for an Architectural Project at EPFL, SAR
4th year project for a parliament building for the City of Lausanne under the direction of Professor
Giorgio Grassi, who had been invited by the EPFL. Giorgio Grassi is architect in Milan and
Professor of the Architecture Department at the Politecnico in Milan, Italy.
Fellowship
2005 – 2006 Swiss National Science Foundation (SNF) Fellowship
Granted to prospective researchers.
Professional Experience
2010 – Architect EPFL-HES, City of Pully, Town planning and Environment service, Switzerland
2008 – 2009 Architect EPFL-HES by CCHE Architecture SA, Lausanne, Switzerland
Yverdon Gymnasium, CESSNOV: Construction manager, management of refurbishment site
for the asbestos decontamination phase and renovation of the faculty room (budget 3 millions).
2006 – 2008 External Assistant SAR (Winter semester, 20%), EPFL, MAS "UE-M Space and Light"
Dr Bernard Paule, lecturer
2006 – 2007 Architect EPFL-HES by Pont12 Architectes SA, Lausanne, Switzerland
Tunnel-Riponne building blocks in Lausanne: Construction manager, management of
refurbishment sites in the rue du Tunnel 10-16 and the rue des Deux-Marchés 11- 15
(budget 7 millions).
Thermal energy calculation of various projects according to the SIA norm 380/1
2005 – 2006 Visiting Scholar at the Martin Centre for Architectural and Urban Studies, Department of
Architecture, University of Cambridge, UK, Prof. Koen Steemers
Participation in a research project financed by the British Academy:
"Sustainable Urban Spaces. A Case Study in Saõ Paulo, Brazil": A theoretical comparison of
built forms in order to investigate the diverse effects of the built-up density in São Paulo, plus
evaluation of a range of urban blocks located in Luz and Barra Funa, two districts in the city
centre of São Paulo in Brazil.
2001 – 2005 Research Assistant, Solar Energy and Building Physics Laboratory (LESO-PB), IIC, ENAC,
EPFL, Prof. Jean-Louis Scartezzini, Privat-docent Dr Jean-Bernard Gay (retired)
Participation in two research projects financed by the Swiss Federal Office of Energy (SFOE):
"SOLURBAN": Evaluation of the solar potential in various urban environments (Basel,
Lausanne and Geneva). Research project with the goal of promoting sustainable urban
architecture and of allowing a better direct use of solar energy in the urban environment.
"Quartiers Durables" (Sustainable districts): Research project devoted to the application of
sustainable development and various strategies in the case of refurbishment or reconstruction.
The aim of this study is to demonstrate why the social and economic issues affecting building
refurbishment or demolition should be addressed before major refurbishment work is undertaken.
Marylène Montavon
Born on June 13, 1968
Swiss & Italian citizenships
Married, 1 child
"DB GBF Areal competition": Evaluation of the solar potential of projects submitted to the
architectural competition of an industrial wasteland in Basel, Switzerland.
Licensed examiner for MAS "Indoor Environment Quality", EPFL
Prof. Claude-Alain Roulet (retired), now Lecturer EPFL
1999 – 2001 Student Assistant, Theory and History of Architecture Laboratory (LTH2), IA, ENAC, EPFL
Prof. Bruno Marchand
Participation in several research tasks and publications.
Participation in staging two exhibitions.
1995 – 1996 Architect HES by Jean-Pierre Perraudin, Architect EPFL-SIA, Sion, Switzerland
Various architectural competitions.
Assistant to the project director for the building of a country mansion in Sion.
1990 – 1991 Internship by Michel Waeber, Architect SIA, Barberêche, Fribourg, Switzerland
Project of the extension of the Art and History Museum of the City of Fribourg.
1985 – 1989 Training program for Architectural Draughtsmanship by Esthi & Peter Schwendener,
Architects EPFZ-SIA, Sion, Switzerland (―Apprentissage de dessinatrice en bâtiments‖).
Independent architect activity
2010 Métamorphose competition with Pont12 Architectes SA, Switzerland
Sustainable urban development, Lausanne, Switzerland.
Corsier competition with Anastasio Di Virgilio, Campobasso, Italy
Joint urban development between Maison Neuve and Prés Grange areas, Geneva, Switzerland.
2001 Minergie house with thermal solar panels and eco-materials, Ardon, Switzerland
Project and construction.
1996 Bavois competition
Motorway relay in Bavois, Vaud, Switzerland.
Consulting and Services
2005 – present Evaluation of the solar potential of various architectural projects/Evaluation of various
architectural competitions using the SNARC method:
DELAMA Devanthéry-Lamunière-Marchand Urbanisme, Geneva, Switzerland: Various
studies connected to the quality aspects of densification by elevation in the City of Geneva,
Switzerland.
CAR Cambridge Architectural Research Ltd in Cambridge (UK), Prof. Koen Steemers:
Evaluation of the architectural competition Tower Works for the reclamation of an industrial
wasteland in Leeds in England plus evaluation of a development project of the Eastern Quarry
site in the United Kingdom.
Laboratory of Geographic Information Systems, LASIG, EPFL: Study of several building
blocks in the old town district of Geneva, Switzerland.
Prof. Claude-Alain Roulet (retired), Lecturer EPFL and Maire of Apples, Switzerland:
Evaluation of projects for the architectural competition at the Collège d‘Apples, Switzerland.
Privat-Docent Dr Jean-Bernard Gay (retired), LESO-PB, EPFL: Evaluation of projects
submitted to the architectural competition for the extension of the Ethnographic Museum and the
Institute of Ethnology of the City of Neuchâtel, Switzerland.
2007 – present Reviewer for "Solar Energy" journal
2002 – 2005 Member of the Teaching Commission SAR, ENAC, EPFL
Computer skills
Software ArchiCAD, AutoCad, PPF, RADIANCE, EPQR, LESOSAI, Photoshop, Illustrator, FrameMaker,
InDesign, QuarkXpress, Filemaker, Microsoft Office, Endnote.
Languages
French Native language
Italian Fluent, spoken and written
English Good, spoken and written
German Good, spoken and written
Publications
Link http://infoscience.epfl.ch/