texte intégral / full text (pdf, 24 mib)
TRANSCRIPT
POUR L'OBTENTION DU GRADE DE DOCTEUR ÈS SCIENCES
acceptée sur proposition du jury:
Prof. C. Dehollain, présidente du juryProf. G. De Micheli, Dr S. Carrara, directeurs de thèse
Prof. N. de Rooij, rapporteur Dr V. Erokhin, rapporteur
Dr M. Op de Beeck, rapporteuse
Implantable Multi-panel Platform for Continuous Monitoring of Exogenous and Endogenous Metabolites for Applications
in Personalized Medicine
THÈSE NO 6604 (2015)
ÉCOLE POLYTECHNIQUE FÉDÉRALE DE LAUSANNE
PRÉSENTÉE LE 11 SEPTEMBRE 2015
À LA FACULTÉ INFORMATIQUE ET COMMUNICATIONSLABORATOIRE DES SYSTÈMES INTÉGRÉS (IC/STI)
PROGRAMME DOCTORAL EN MICROSYSTÈMES ET MICROÉLECTRONIQUE
Suisse2015
PAR
Camilla BAJ-ROSSI

AcknowledgementsMy first acknowledgment goes to my thesis directors, Prof. Giovanni De Micheli and Dr. MER
Sandro Carrara. In these four years they taught me the meaning and method in doing research,
and they gave me the possibility to work on interesting and innovative projects, giving me
advices and freedom to explore new idea. Moreover, they created an amazing environment in
the lab, where I have been always surrounded by competent colleagues and friends. It will be
difficult to find a better environment to work.
I want to thank Prof. Fabio Grassi and Prof. Catherine Dehollain to have been helpful part-
ners in the project I have been involved with, and to have and offered me their knowledge
and advices. Financial supports were from the Swiss National Science Foundation Sinergia
Project, code CRSII2 1275471 and title ”Innovative Enabling Micro-Nano-Bio-technologies for
Implantable systems in molecular medicine and personalized therapy”.
Giuseppe D. Albini is acknowledged for his help for the Monte Carlo simulations. SEM images
were acquired in the facilities at the CIME (EPFL) with the aid of Prof. Cantoni and Mrs.
Fabienne Bobard. The microfabrication of the platform was realized with the precious help of
the CMI staff.
I want to thank Mrs. Marie Halm for taking care of all the Ph.D. students in the doctoral
program of Microsystems and Microelectronics.
A special thanks goes to Christina for her patience in answering to the hundreds of questions
that all the people in LSI ask her every single day, and for her efficiency in administering all the
lab issues. Many thanks also to Anil and Rodolphe for helping me every time it was needed. I
also want to thank Mr. Badertscher for his help in many practical works that were very critical
in the realization of the implantable device, and for the interesting discussions that we had
sometimes.
A special thanks to Andrea. For the enthusiasm that you show for every plan I make, for your
wise advice, for your collaboration during our Ph.D., for tolerate my changing mood even in
difficult days, and for your unconditioned support for every choice I make.
A special thanks to Irene. We actually started our first project together long time ago (2008) for
the Bachelor thesis, then we ended up in LSI for our master project in 2010. Then we started
our Ph.D. on the same day and after four years we are reaching the end of this experience.
Thanks for the mutual support and for the precious technical collaboration. I will definitely
miss it.
Another special thanks to Michele, my flatmate/colleague and friend for his help in technical
matters, his philosophical discussions and for sharing the everyday-life.
i
Acknowledgements
I want to thank the ”Sinergia” team. Working with you towards the realization of this project
has been the most challenging and exciting part of my work: thanks to Sara for the realization
of the read-out IC and for all the measurements that we run together; to Enver for the realiza-
tion of the power management unit; to Stefano for his work on the receiving unit and for the
helpful discussions that we had on electronics; to Francesca for the realization of the Android
interface; to Tanja for the in-vivo tests with animals and for her help in preparing manuscripts.
We all together proved that a good team can bring very good results. A thanks goes also to
Christian for his help in providing me the reconstituted cytochrome and for his collaboration.
In these four years I had the chance to share the lab with colleagues that became friends.
Thanks to Cristina, a perfect lab-mate, office-mate and party-mate; to Francesca for sharing
good and bad time in the lab and also during volleyball matches; to Fede for his help in revising
manuscripts and for his organization skills very helpful during our trips around the world; to
Vasilis for his wise advice and his friendship; to Jack for your unmissable anecdote. A thanks
to all the actual and former lab members that made great my time in LSI: Wenqi, Jaume,
Alena, Julien, Shashi, Pierre-Emmanuel, Srini, Gözen, Somayyeh, Hu, Ciprian, Francesco,
Eleni, Hassan, Nima, Ioulia, Davide, Aya, Jiang, Xifang, Luca, Maxime, Winston.
A special thanks to the group of the ”coffee break in Coupole”: Matteo, Annina, Ludo, Ican,
Pableras, Ruben, Michela, Max and Karim. Thanks for the random discussions, sometimes
philosophical conversations, for all the parties and dinners, for the trips that we organized
together and for your friendship.
Thanks to all the friends that I met in Lausanne outside the lab: to my flatmate Egle, for the
motivation you are able to transmit; to Nicee, Sophie, to ”les amis” (Lucio, Diego, Matteo,
Antonio), and to ”les filles” of the Ecublens team.
Thanks to Josefine and Rosa for our long-distance friendship.
I want to thank my friends in Italy: to Clelia, Kristen, Tiziana, Simone, Alessandro, Daniele and
Andrea, because I can always count on you. To Ele, for your never-ending friendship, and to
my ”Brocchi” friends because they will support me wherever I will go.
To conclude I want to thank my family. I feel so lucky to have such an amazing family that for
me is a source of inspiration, motivation and strength. I have many relatives but all of them
are always been present in the important moments of my life to support me and to celebrate.
A very special thanks to my brother, to mum and dad for their unconditioned love and support,
and for the time together that is never enough.
ii
AbstractNowadays, scientific advances are leading to the discovery of newer, better, more targeted
treatments that will improve the human health. However, despite the promising results and
the major advantages in treatments offered to patients, these personalized medical treatments
are limited to few cases.
Translational medicine research with animals is needed to find innovative, safe and life-saving
solutions for patients, especially in drug development. Although technological improvements
may lead one day to the end of animal testing, today those strategies are not sufficient, due to
the complexity of living organisms.
The living conditions of these animals are of primary importance because high stress levels
can affect the experimental results. In this respect, the monitoring of the animals in a small
living space by means of a fully implantable device, can contribute to minimize the human
intervention, increasing the comfort for the animals.
The objective of this thesis is the design and characterization of a fully implantable biosensor
array for the real-time detection of endogenous and exogenous metabolites, for the monitoring
of small caged animals in drug development, and for future applications in personalized
medicine.
The fully implantable device consists of: a passive sensing platform consisting of an array of
four independent electrochemical biosensors, together with a pH sensor and a temperature
sensor for the optimization of the sensing performances in different physiological conditions;
integrated circuits capable of performing multiple electrochemical measurements; a coil
for remote powering of the integrated circuit and the short-range data transmission to an
external device; a membrane packaging ensuring measurements with high signal-to-noise
ratio, biocompatibility and selectivity against possible interfering molecules in biological
fluids.
This thesis describes in detail the implantable device highlighting the following results:
• In vitro monitoring of four anti-cancer drugs and an anti-inflammatory drug within the
pharmacological ranges in undiluted human serum;
• Demonstration of the in vitro functionality of the complete system, showing that the
external powering system correctly operate the device, and receive the data from the
sensors;
• In vivo biocompatibility tests of the packaging, showing after 30 days a significant
reduction of the inflammatory response in time, suggesting normal host recovery;
iii

Acknowledgements
• In vivo continuous monitoring of an anti-inflammatory drug, demonstrating the proof-
of-concept of the system for future personalized medicine applications.
Key words: biosensors, drug monitoring, carbon nanotubes, cytochrome P450, packaging,
implantable
iv
RésuméAujourd’hui, les progrès scientifiques aboutissent à la découverte de nouveaux traitements,
plus ciblés, destinés à améliorer la santé humaine. Cependant, en dépit de résultats pro-
metteurs et des avantages qu’ils apportent auprès des patients, ces traitements médicaux
personnalisés sont restreints à quelques cas.
La recherche en médecine translationnelle sur les animaux est nécessaire pour trouver des
solutions innovantes et sûres pour les patients, en particulier dans le développement de mé-
dicaments. Bien que les améliorations technologiques pourront conduire un jour à la fin de
l’expérimentation animale, ces stratégies ne sont pas encore suffisantes aujourd’hui, en raison
de la complexité des organismes vivants.
Les conditions de vie des animaux sont d’une importance capitale étant donné que des ni-
veaux élevés de stress peuvent affecter les résultats expérimentaux. Ainsi, la surveillance des
animaux dans une petite surface habitable, au travers d’un dispositif totalement implantable,
peut contribuer à réduire au minimum l’intervention humain et à augmenter le confort.
L’objectif de cette thèse est la conception et la caractérisation d’une matrice de biocapteurs
totalement implantable dédiée à la détection en temps réel de métabolites endogènes et exo-
gènes, pour la surveillance de petits animaux en cage dans le développement de médicaments
et pour les futures applications de médecine personnalisée.
Le dispositif entièrement implantable se compose : d’une plate-forme de détection passive,
constituée d’un réseau de quatre biocapteurs électrochimiques indépendants, d’un capteur
de pH et d’un capteur de température pour l’optimisation des performances de détection
à diverses conditions physiologiques ; de circuits intégrés capables d’effectuer de multiples
mesures électrochimiques ; d’une bobine pour l’alimentation à distance des circuits intégrés
et la transmission de donnée à courte portée vers un dispositif externe ; d’une encapsulation
par membranes permettant des mesures avec un rapport signal sur bruit élevé et assurant
biocompatibilité et sélectivité par rapport à des molécules parasites présentes dans les fluides
biologiques.
Cette thèse décrit en détail le dispositif implantable réalisé et met en évidence les résultats
suivants :
• Surveillance in vitro de quatre médicaments anticancéreux et d’un médicament anti-
inflammatoire dans les intervalles pharmacologiques du sérum humain non dilué ;
• Démonstration de la fonctionnalité in vitro de l’ensemble du système, validant le sys-
tème d’alimentation externe et la transmission correcte des données provenant des
v
Acknowledgements
capteurs ;
• Tests in vivo de biocompatibilité montrant après 30 jours une importante réduction de
la réponse inflammatoire, ce qui suggère la guérison normale de l’hôte ;
• Suivi continu in vivo d’un médicament anti-inflammatoire, montrant la preuve de
concept du système pour les futures applications en médecine personnalisée.
Mots clefs : biocapteurs, surveillance des médicaments, nanotubes de carbone, cytochrome
P450, packaging, implantable
vi
SommarioSempre piú innovazioni nel mondo scientifico stanno portando alla scoperta di trattamenti
farmacologici piú nuovi e personalizzati, che miglioreranno la qualitá della vita. Nonostante
i risultati promettenti e i miglioramenti nei trattamenti offerti ai pazienti, fin’ora le terapie
personalizzate sono casi limitati.
La ricerca in medicina traslazionale necessita la sperimentazione animale per trovare solu-
zioni innovative, sicure per i pazienti, soprattutto nel settore di ricerca e sviluppo di farmaci.
Nonostante gli avanzamenti tecnologici potrebbero, un giorno, portare alla fine della speri-
mentazione animale, tutt’ora la ricerca non ne puó fare a meno, vista la complessitá degli
organismi viventi.
Le condizioni di vita degli animali da laboratorio sono di fondamentale importanza dal mo-
mento che le condizioni di stress a cui gli animali sono sottoposti possono condizionare
notevolmente i risultati sperimentali. Per questo motivo, la possibilitá di monitorare gli ani-
mali in un ridotto spazio vitale a cui sono abituati, potrebbe migliorare la loro condizione
riducendo l’intervento umano.
L’obiettivo di questa tesi é lo sviluppo e la caratterizzazione di un biosensore impiantabile
per il monitoraggio in tempo reale di metaboliti endogeni ed esogeni, per applicazioni in
ricerca farmaceutica e in medicina personalizzata. Il biosensore é impiantato in animali da
laboratorio di piccola taglia (topi), liberi di muoversi in una gabbia.
Il biosensore impiantabile é composto da: una piattaforma che consiste in un array di quattro
sensori elettrochimici, con un sensore per il pH e uno per la temperatura che permettono
di ottimizzare le prestazioni dei sensori in diverse condizioni fisiologiche; circuiti integrati
che possono misurare diversi parametri contemporaneamente; un’antenna per alimentare a
distanza i circuiti integrati e per trasmettere i dati esternamente ad un computer o un tablet;
un sistema di membrane e un packaging esterno che assicura contemporaneamente la bio-
compatibilitá, misure con un elevato rapporto segnale-rumore, e selettivitá verso i metaboliti
di interesse, filtrando le molecole interferenti presenti nei fluidi biologici.
Il lavoro di questa tesi descrive in dettaglio il sistema impiantabile, in particolare focalizzandosi
sui seguenti risultati:
• Il monitoraggio in vitro di quattro farmaci anti-tumorali e di un farmaco anti-infiammatorio,
misurando livelli di concentrazione fisiologici;
• Dimostrazione del funzionamento in vitro del sistema completo, mostrando che il
sistema di alimentazione esterno trasmette correttamente la potenza al sensore e riceve
vii
Acknowledgements
i dati dal sensore;
• Test in vivo di biocompatibilitá del packaging, provando che dopo 30 giorni il livello
di infiammazione cala notevolmente, dimostrando la biocompatibilitá del sistema
impiantabile;
• Monitoraggio continuo in vivo di un farmaco anti-infiammatorio e di glucosio, dimo-
strando che il sistema presenta un potenziale per essere migliorato in futuro per ricerche
su animali in medicina personalizzata.
Parole chiave: biosensori, monitoraggio di farmaci, nanotubi di carbonio, citocromo P450,
packaging, impiantabile
viii
ContentsAcknowledgements i
Abstract (English/French/Italian) iii
List of abbreviations xiii
1 Introduction 1
1.1 Personalized medicine . . . . . . . . . . . . . . . . . . . . . . . . . . . . . . . . . . 1
1.2 Current State-of-the-art in Personalized Medicine . . . . . . . . . . . . . . . . . . 3
1.2.1 The predictive methods: the ”–omics” sciences . . . . . . . . . . . . . . . 3
1.2.2 Therapeutic Drug Monitoring . . . . . . . . . . . . . . . . . . . . . . . . . 7
1.3 Biosensors: towards the optimization of personalized medicine . . . . . . . . . 10
1.4 Implantable sensors for drugs: market analysis . . . . . . . . . . . . . . . . . . . 12
1.5 Research contribution . . . . . . . . . . . . . . . . . . . . . . . . . . . . . . . . . . 14
1.6 Thesis organization . . . . . . . . . . . . . . . . . . . . . . . . . . . . . . . . . . . . 15
2 Implantable biosensor: theory and state-of-the-art 17
2.1 Electrochemical sensing techniques: an overview . . . . . . . . . . . . . . . . . . 18
2.1.1 Background on electroanalytical techniques . . . . . . . . . . . . . . . . . 18
2.1.2 Enhanced sensitivity in biosensing . . . . . . . . . . . . . . . . . . . . . . 23
2.2 Detection of drugs and metabolites with electrochemical sensors . . . . . . . . 25
2.2.1 Measurements of electroactive substances . . . . . . . . . . . . . . . . . . 25
2.3 Strategies for the detection of non-electroactive substances . . . . . . . . . . . . 27
2.3.1 Detection of glucose and lactate with oxidases . . . . . . . . . . . . . . . . 27
2.3.2 Detection of non-electroactive drugs with Cytochrome P450 . . . . . . . 29
2.3.3 P450 based biosensors: state of the art . . . . . . . . . . . . . . . . . . . . 33
2.4 Implantable electrochemical biosensors . . . . . . . . . . . . . . . . . . . . . . . 38
2.4.1 Biocompatibility and sensor functionality . . . . . . . . . . . . . . . . . . 38
2.4.2 Electronics and power supply for an autonomous device . . . . . . . . . 45
2.5 Summary . . . . . . . . . . . . . . . . . . . . . . . . . . . . . . . . . . . . . . . . . . 46
3 Drug monitoring with screen-printed electrodes 47
3.1 Cytochrome P450-mediated drug detection . . . . . . . . . . . . . . . . . . . . . 47
3.1.1 Methods . . . . . . . . . . . . . . . . . . . . . . . . . . . . . . . . . . . . . . 47
ix
Contents
3.1.2 Investigation on Protein Attachment on CNTs . . . . . . . . . . . . . . . . 49
3.1.3 Analysis of the reduction current and of the microsomal contributes . . 51
3.1.4 Improvement with CNTs . . . . . . . . . . . . . . . . . . . . . . . . . . . . . 55
3.2 Drug measurement results . . . . . . . . . . . . . . . . . . . . . . . . . . . . . . . 57
3.2.1 Single and multiple drug detection . . . . . . . . . . . . . . . . . . . . . . 57
3.2.2 Solutions for multiple drug detection . . . . . . . . . . . . . . . . . . . . . 59
3.2.3 Sensor stability and continuous drug monitoring . . . . . . . . . . . . . . 60
3.2.4 Repeatability . . . . . . . . . . . . . . . . . . . . . . . . . . . . . . . . . . . 62
3.3 Detection of electroactive drugs . . . . . . . . . . . . . . . . . . . . . . . . . . . . 62
3.4 Summary . . . . . . . . . . . . . . . . . . . . . . . . . . . . . . . . . . . . . . . . . . 63
4 Design and test of the implantable sensor platform 65
4.1 Platform design and microfabrication . . . . . . . . . . . . . . . . . . . . . . . . . 66
4.1.1 Microfabrication . . . . . . . . . . . . . . . . . . . . . . . . . . . . . . . . . 67
4.1.2 Design . . . . . . . . . . . . . . . . . . . . . . . . . . . . . . . . . . . . . . . 68
4.2 Sensor Characterization . . . . . . . . . . . . . . . . . . . . . . . . . . . . . . . . . 70
4.2.1 Methods . . . . . . . . . . . . . . . . . . . . . . . . . . . . . . . . . . . . . . 70
4.2.2 Characterization of bare electrodes . . . . . . . . . . . . . . . . . . . . . . 71
4.2.3 CNT deposition techniques . . . . . . . . . . . . . . . . . . . . . . . . . . . 72
4.2.4 Glucose and Lactate . . . . . . . . . . . . . . . . . . . . . . . . . . . . . . . 75
4.2.5 Drugs . . . . . . . . . . . . . . . . . . . . . . . . . . . . . . . . . . . . . . . . 76
4.2.6 The pH sensor . . . . . . . . . . . . . . . . . . . . . . . . . . . . . . . . . . . 78
4.2.7 The temperature sensor . . . . . . . . . . . . . . . . . . . . . . . . . . . . . 82
4.3 Summary . . . . . . . . . . . . . . . . . . . . . . . . . . . . . . . . . . . . . . . . . . 83
5 Membrane and packaging 85
5.1 Membrane . . . . . . . . . . . . . . . . . . . . . . . . . . . . . . . . . . . . . . . . . 86
5.1.1 Methods . . . . . . . . . . . . . . . . . . . . . . . . . . . . . . . . . . . . . . 86
5.1.2 Need for membranes . . . . . . . . . . . . . . . . . . . . . . . . . . . . . . . 87
5.1.3 Permselective membrane . . . . . . . . . . . . . . . . . . . . . . . . . . . . 88
5.1.4 Outer membrane: epoxy-enhanced polyurethane membrane . . . . . . . 91
5.1.5 Monitoring Acetaminophen and glucose with the same sensing platform 96
5.2 Assembly and biocompatible packaging of the final device . . . . . . . . . . . . 97
5.2.1 Methods . . . . . . . . . . . . . . . . . . . . . . . . . . . . . . . . . . . . . . 98
5.2.2 Final external packaging: epoxy-enhanced polyurethane . . . . . . . . . 99
5.3 Summary . . . . . . . . . . . . . . . . . . . . . . . . . . . . . . . . . . . . . . . . . . 101
6 The implantable device 103
6.1 System description . . . . . . . . . . . . . . . . . . . . . . . . . . . . . . . . . . . . 104
6.1.1 Readout electronics and remote powering system . . . . . . . . . . . . . . 104
6.1.2 Short-range data communication & Android interface . . . . . . . . . . . 108
6.2 Preliminary in-vitro measurements . . . . . . . . . . . . . . . . . . . . . . . . . . 108
6.2.1 Platform and IC characterization with the system of membrane . . . . . 108
x
Contents
6.2.2 Active chip characterization . . . . . . . . . . . . . . . . . . . . . . . . . . . 109
6.3 In-vitro measurements with the implantable device . . . . . . . . . . . . . . . . 110
6.4 In-vivo measurements with the implantable device . . . . . . . . . . . . . . . . . 113
6.5 Summary . . . . . . . . . . . . . . . . . . . . . . . . . . . . . . . . . . . . . . . . . . 116
7 Conclusions 119
A Appendix: Methods for analysis of calibration curves 123
A.1 Experiment planning . . . . . . . . . . . . . . . . . . . . . . . . . . . . . . . . . . . 123
A.2 Regression analysis . . . . . . . . . . . . . . . . . . . . . . . . . . . . . . . . . . . . 123
A.3 Evaluate the regression analysis . . . . . . . . . . . . . . . . . . . . . . . . . . . . 124
A.4 Calculate the LOD . . . . . . . . . . . . . . . . . . . . . . . . . . . . . . . . . . . . . 124
A.5 Reproducibility or precision of the response . . . . . . . . . . . . . . . . . . . . . 125
A.6 Selectivity and its response to interferences . . . . . . . . . . . . . . . . . . . . . 125
A Appendix: Details on CNTs 127
A.1 Electric properties of CNTs . . . . . . . . . . . . . . . . . . . . . . . . . . . . . . . 127
A.2 Fabrication and integration of CNTs on electrodes . . . . . . . . . . . . . . . . . 127
Bibliography 156
Curriculum Vitae 157
xi

List of abbreviationsAIM Argon Ion Milling
ALD Atomic Layer Deposition
ANOVA Analysis Of Variance
AP Air Pouch
ATP Adenosine Triphosphate
AUC Area Under the Curve
ADME Adsorption, Distribution, Metabolism, Excretion
BSA Bovine Serum Albumin
CA Chronoamperometry
CAc Cellulose Acetate
CC Carbon Cloth
cDNA Complementary Deoxyribonucleic Acid
CE Counter Electrode
CGM Continuous Glucose Monitoring
CNT Carbon-Nanotube
CV Cyclic Voltammetry
CYP Cytochrome P450 Gene
DDAB Didodecyldimethylammonium Bromide
DNA Deoxyribonucleic Acid
DPV Differential Pulse Voltammetry
FAD Flavin Adenine Dinucleotide
FBGC Foreign Body Giant Cell
FBR Foreign Body Reaction
FDA Food and Drugs Administration
FMN Flavin Mononucleotide
GC Glassy Carbon
GOx Glucose Oxidase
IC Integrated Circuit
IrOx Iridium Oxide
iSFET Ion-Sensitive Field-Effect Transistor
LB Langmuir-Blodgett
LBL Layer-by-layer
LDH Lactate Dehydrogenase
xiii
Contents
LDO Low-Drop Out
LOx Lactate Oxidase
LOD Limit of Detection
LOR Lift-Off Resist
LPS Lipopolysaccharide
LSV Linear Sweep Voltammetry
MEC Minimum Effective Concentration
MPS 3-Mercapto-1-Propenesulfonic Acid
msP450 Microsome systems containing P450 and POR
MTC Minimum Toxic Concentration
MWCNT Multi-Walled Carbon-Nanotube
NADH Nicotinamide Adenine Dinucleotide
NADPH Nicotinamide Adenine Dinucleotide Phosphate
NAPQI N-Acetyl-p-Benzoquinone-Imine
OCP Open Circuit Potential
OOK On-Off Keying
P450 Cytochrome P450
PBS Phosphate Buffered Saline
PCB Printed Circuit Board
PDDA Poly-(Dimethyl-Diallyl-Ammonium-chloride)
PEI Polyethylenimine
PEG Polyethylene Glycol
PG Pyrolytic Graphite
POR P450 Oxido-Reductase
PSRR Power Supply Rejection Ratio
PSS Sodium Poly-(Styrene Sulfonate)
PTFE Polytetrafluoroethylene
PU Polyurethane
QDs Quantum dot
RE Reference Electrode
RNA Ribonucleic Acid
RSD Relative Standard Deviation
RTD Resistive Thermal Device
SAM Self-Assembled Monolayer
SCE Saturated Calomel Electrode
SEM Scanning Electron Micrograph
SHE Standard Hydrogen Electrode
SPE Screen-Printed-Electrode
SRS Substrate Recognition Sites
SWCNT Single-Walled Carbon-Nanotube
SWV Square Wave Voltammetry
TDM Therapeutic Drug Monitoring
tr-CysMM thiol-reactive Cystamine-Maleimide
xiv

Contents
VEGF Vascular Endothelial Growth Factor
WE Working Electrode
xv

1 Introduction
“It’s far more important to know what person the disease has than what disease the
person has.”
Hippocrates (460-370 BC)
1.1 Personalized medicine
Despite the continuous advances in the discovery and design of new drugs, the inter-individual
variability in the response to the standard dose of a given drug remains a serious problem
in clinical practice [1]. The inter-individual variability consists in genetic differences [2] that
modulate the drug pharmacokinetics and/or pharmacodynamics, which lead to different
therapeutic outcomes, or even to severe side effects or adverse drug reactions. Moreover,
individual differences in response to drugs also depend on a complex intersection of envi-
ronmental, social and cultural factors [3], including nutrition, organ function, age, sex, body
weight, infections, diseases, and co-medications [4].
Nowadays typically clinicians have no choice but to follow a non-optimal approach to pre-
scribing drugs and other treatments. This approach relies on the trial-and-error model: the
doctor takes a decision about what drugs to prescribe based only on general information
about what might actually work for that particular patient. If the medication does not work
after a few weeks, the doctor may change drug or dosage. The effect of the combination of
this trial-and-error model with intrinsic variability among individuals leads to patient dissat-
isfaction, adverse drug responses, with a significant effect on the quality and cost of health
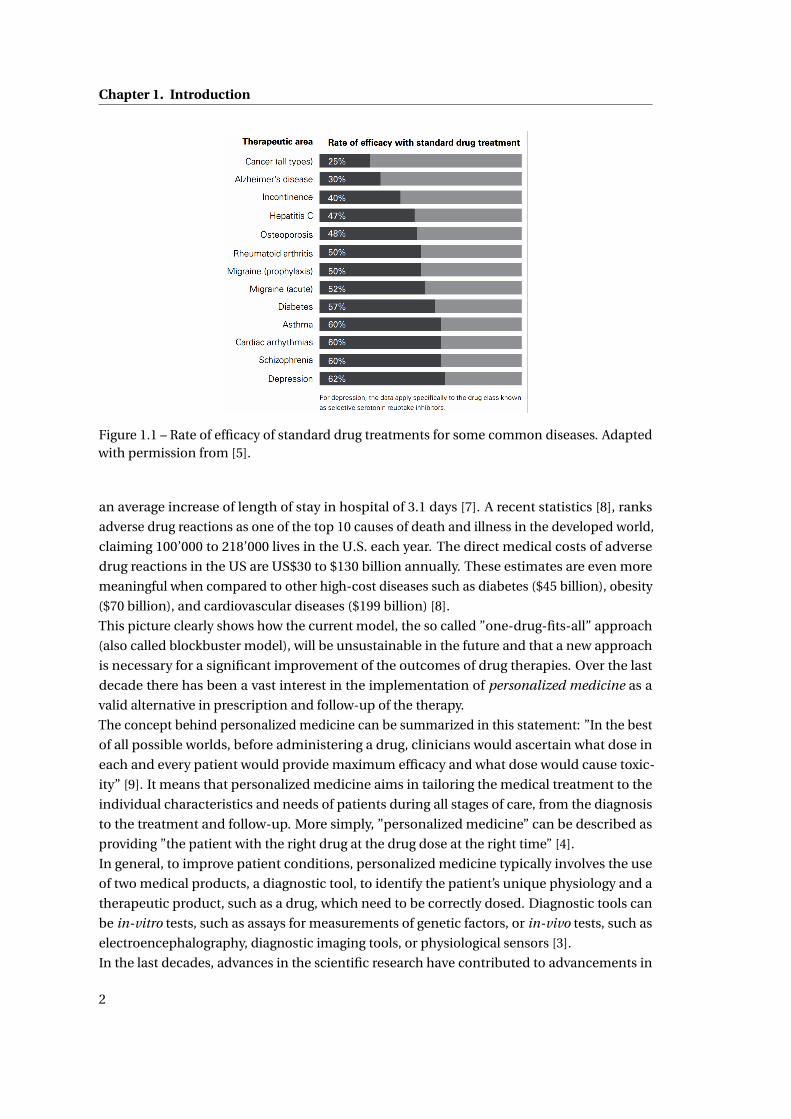
care. A 2001 study showed that the response rates of patients to medications from different
therapeutic classes ranged from 25% (oncology) to 62% (depression), as shown in Fig. 1.1,
[5]. In addition, an estimated 2.2 million (6-7% of all hospitalization) adverse drug reactions
occur each year in the U.S., including more than 100,000 deaths [3], costing to the health care
system billions of dollars. Another study demonstrated that adverse drug events result in
more than 770,000 cases, among injuries and deaths each year in the U.S. [6], and result in
1
Chapter 1. Introduction
Figure 1.1 – Rate of efficacy of standard drug treatments for some common diseases. Adaptedwith permission from [5].
an average increase of length of stay in hospital of 3.1 days [7]. A recent statistics [8], ranks
adverse drug reactions as one of the top 10 causes of death and illness in the developed world,
claiming 100’000 to 218’000 lives in the U.S. each year. The direct medical costs of adverse
drug reactions in the US are US$30 to $130 billion annually. These estimates are even more
meaningful when compared to other high-cost diseases such as diabetes ($45 billion), obesity
($70 billion), and cardiovascular diseases ($199 billion) [8].
This picture clearly shows how the current model, the so called ”one-drug-fits-all” approach
(also called blockbuster model), will be unsustainable in the future and that a new approach
is necessary for a significant improvement of the outcomes of drug therapies. Over the last
decade there has been a vast interest in the implementation of personalized medicine as a
valid alternative in prescription and follow-up of the therapy.
The concept behind personalized medicine can be summarized in this statement: ”In the best
of all possible worlds, before administering a drug, clinicians would ascertain what dose in
each and every patient would provide maximum efficacy and what dose would cause toxic-
ity” [9]. It means that personalized medicine aims in tailoring the medical treatment to the
individual characteristics and needs of patients during all stages of care, from the diagnosis
to the treatment and follow-up. More simply, ”personalized medicine” can be described as
providing ”the patient with the right drug at the drug dose at the right time” [4].
In general, to improve patient conditions, personalized medicine typically involves the use
of two medical products, a diagnostic tool, to identify the patient’s unique physiology and a
therapeutic product, such as a drug, which need to be correctly dosed. Diagnostic tools can
be in-vitro tests, such as assays for measurements of genetic factors, or in-vivo tests, such as
electroencephalography, diagnostic imaging tools, or physiological sensors [3].
In the last decades, advances in the scientific research have contributed to advancements in
2
1.2. Current State-of-the-art in Personalized Medicine
technology with the realization of new diagnostic approaches which led to the introduction of
personalized medicine approaches in clinical practice. In the past two years, the Food and
Drug Administration (FDA) has approved some ”targeted therapies”, such as the drug for cystic
fibrosis ivacaftor, for patients with a specific genetic mutation, or the anti-cancer drugs
critotinib, vemurafinib, dafrafenib, and tremetinib, for patients whose tumors have
specific genetic characteristics, which were previously identified by a diagnostic test [3].
Personalized medicine has the potential to decrease the costs associated with health care in
enabling clinicians to provide more effective treatments, reducing the number of side effects
and adverse drug episodes. Moreover, personalized medicine promises to enhance drug
research and development by shortening the overall drug development and review times,
with the final results of significantly reducing the costs. A recent statistics reports that at
present, in the U.S., 15 years are needed to completely develop a single drug, from discovery to
market availability, and the average cost of the overall process is between $800 million and $1
billion, due to the high number of failures (approximately 7,500 compounds fail for every one
that receives approval). Thus, any reduction in drug research and development costs, could
considerably decrease the overall cost of health care [10, 11].
However, despite the promising results and the major advantages in treatments offered to
patients, these personalized medical treatments are few cases, and the trial-and-error ap-
proach still persists. The reason is that a complete transition from trial-and-error medicine
to personalized medicine meets some important technological barriers but also industrial
constraints [12]. There is now a general consensus that the ”one-drug-fits-all” approach has
significant limitations and nowadays pharmaceutical industry is highly interested in investing
in personalized medicine, as revealed by the growing number of companion diagnostic com-
panies [13, 14]. Nevertheless, in general the pharmaceutical industry still bases most of the
drug development on the blockbuster model [13].
The next section will review the current state-of-the-art of the disciplines employed for the
personalization of drug therapies.
1.2 Current State-of-the-art in Personalized Medicine
1.2.1 The predictive methods: the ”–omics” sciences
The so-called –omics sciences, pharmacogenomics, transcriptomics, proteomics and pharmaco
metabonomics represent the state-of-the-art in our ability to predict the reaction of a patient
to a specific therapy [9].
Pharmacogenetics or pharmacogenomics, is ”the study of how individual genetic differences
affect drug response” [10]. More specifically, pharmacogenetics is the study of single genes
and their effects on inter-individual differences in drug-metabolizing enzymes, while phar-
macogenomics represents the whole genome application of pharmacogenetics. The goal of
pharmacogenomics is to optimize a therapy according to the unique genotype of patients, by
ensuring maximum efficiency with minimal adverse effects. For instance, pharmacogenomic
assessment of drug metabolizing enzymes can improve the optimization of drug dosage [12].
3
Chapter 1. Introduction
The first pharmacogenetic test that was approved by the FDA in January 2005, is the AmpliChip
CYP450 test, a commercial assay for the detection of cytochrome P450 2D6 and P450 2C19
genetic variability [15], which play a major role in the metabolism of an estimated 25% of all
prescribed drugs. It is intended to aid the clinicians in determining therapeutic strategy and
dosages for drugs metabolized by the CYP2D6 or CYP2C19 gene product.
In 2013, the FDA published a list of more than 100 pharmacogenomic biomarkers (from germ-
line or somatic gene variants, functional deficiencies, chromosomal abnormalities, to selected
protein biomarkers that are used to select patients for treatment) that can be used to identify
responders and non-responders to medications, avoiding adverse events, and optimizing
the dosage for more than 100 drugs [16]. Many in vitro diagnostic devices or imaging tools
are nowadays produced to detect these biomarkers, with the objective to provide essential
information for the safe and effective use of a corresponding drug. Twenty of the pharma-
cogenomic biomarkers (53%) had a corresponding diagnostic device approved in the USA
[17]. Among them, only three showed successful drug diagnostic co-development, while for
the other 17 biomarkers, the drug and its diagnostic device were developed and approved
separately [18].
An interesting example of a shortcoming in pharmacogenomic testing is the polymorphism in
the gene that encodes cytochrome P450 1A2 (CYP1A2) that participates in the metabolism
of almost two dozen drugs (e.g. tacrine, caffeine, theophylline, erythromycin, propranolol,
naproxen and verapamil). The human genome contains 57 cytochrome P450 genes (CYPs) that
encode for the ezyme family of cytochrome P450 (P450), involved in phase I drug metabolism,
when enzymes introduce reactive and polar groups into their substrates [19]. However, less
than 12 P450 enzymes, mostly members of the P4501, P4502 and P4503 families, are respon-
sible for the metabolism of virtually all drugs. In the human populations studied, over 60
variant alleles of the CYP1A2 gene have been detected. Therefore, unless every variant site in
the genome that affects CYP1A2 expression is tested, it is difficult to conclude that a patient
is a poor, intermediate, efficient, or ultra-rapid metabolizer, because of the complexity of
the genome. At present, a DNA test cannot provide absolute certainty in predicting drug
responses for individual patients [9]. The unequivocal prediction of drug response is also not
possible for other genes that encode other drug-metabolizing enzymes or transporters (e.g.
is even worse the case of the gene CYP2D6). Therefore, as recent studies [20, 10] concluded,
pharmacogenomics alone cannot provide absolute certainty in predicting drug responses for
individual patients.
Moreover, the translation of pharmacogenomics research findings into clinical practice has
been slow, due to the lack of consistent interpretation of pharmacogenomics test results,
availability of clinical guidelines for prescribing on the basis of test results, and adequate
knowledge-based decision support systems [22].
Transcriptomics is the discipline that studies the gene transcription1. With respect to person-
alized therapy, transcriptomics aims to find some correlations between the gene expression
1In transcription, a portion of a double-stranded DNA template gives rise to a single-stranded RNA molecule.The RNA molecule can be a ”finished product” that serves some important function within the cell, or it goesthrough a translation step, which ultimately results in the production of a protein molecule [23].
4
1.2. Current State-of-the-art in Personalized Medicine
mRNATranscriptome
GenesGenome
ProteinsProteome
MetabolitesMetabolome
Phenotype
EnvironmentEnvironment
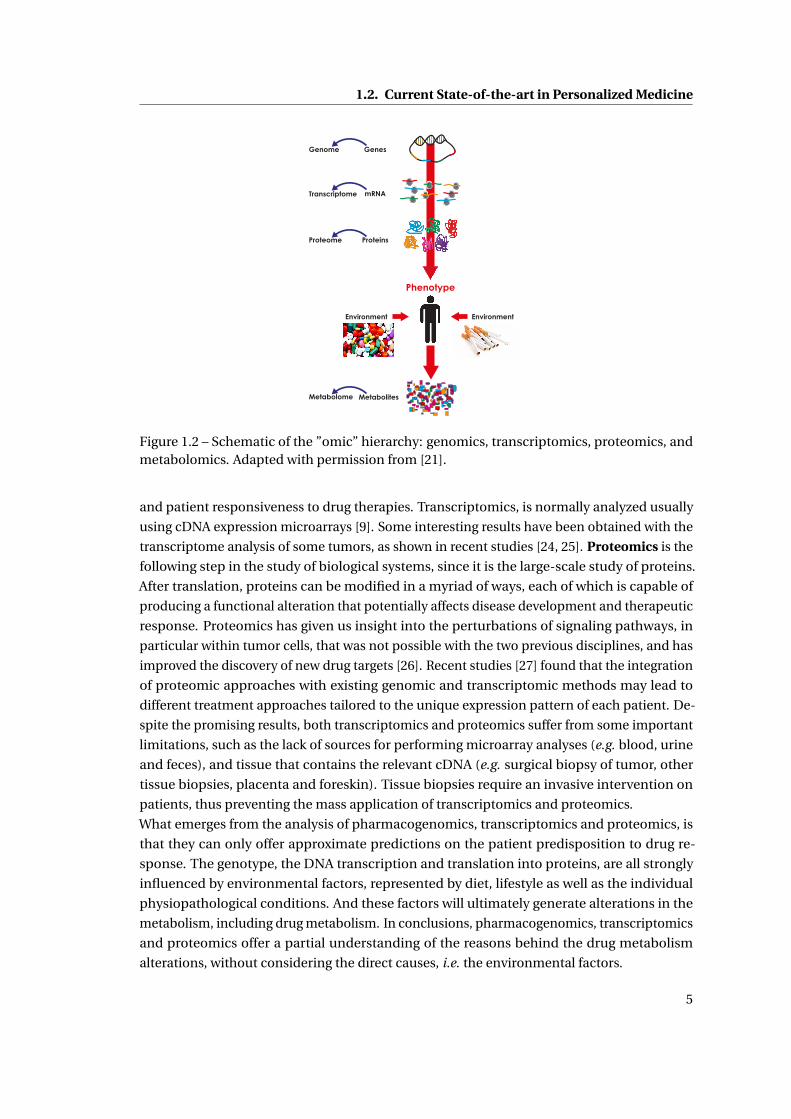
Figure 1.2 – Schematic of the ”omic” hierarchy: genomics, transcriptomics, proteomics, andmetabolomics. Adapted with permission from [21].
and patient responsiveness to drug therapies. Transcriptomics, is normally analyzed usually
using cDNA expression microarrays [9]. Some interesting results have been obtained with the
transcriptome analysis of some tumors, as shown in recent studies [24, 25]. Proteomics is the
following step in the study of biological systems, since it is the large-scale study of proteins.
After translation, proteins can be modified in a myriad of ways, each of which is capable of
producing a functional alteration that potentially affects disease development and therapeutic
response. Proteomics has given us insight into the perturbations of signaling pathways, in
particular within tumor cells, that was not possible with the two previous disciplines, and has
improved the discovery of new drug targets [26]. Recent studies [27] found that the integration
of proteomic approaches with existing genomic and transcriptomic methods may lead to
different treatment approaches tailored to the unique expression pattern of each patient. De-
spite the promising results, both transcriptomics and proteomics suffer from some important
limitations, such as the lack of sources for performing microarray analyses (e.g. blood, urine
and feces), and tissue that contains the relevant cDNA (e.g. surgical biopsy of tumor, other
tissue biopsies, placenta and foreskin). Tissue biopsies require an invasive intervention on
patients, thus preventing the mass application of transcriptomics and proteomics.
What emerges from the analysis of pharmacogenomics, transcriptomics and proteomics, is
that they can only offer approximate predictions on the patient predisposition to drug re-
sponse. The genotype, the DNA transcription and translation into proteins, are all strongly
influenced by environmental factors, represented by diet, lifestyle as well as the individual
physiopathological conditions. And these factors will ultimately generate alterations in the
metabolism, including drug metabolism. In conclusions, pharmacogenomics, transcriptomics
and proteomics offer a partial understanding of the reasons behind the drug metabolism
alterations, without considering the direct causes, i.e. the environmental factors.
5
Chapter 1. Introduction
Metabolites are the final products of cellular regulatory process, and their levels can be re-
garded as the ultimate response of biological systems to genetic or environmental changes
[28], (Fig. 1.2). Metabonomics, the study of metabolite profiling in multicellular systems (e.g.
intact laboratory animals and patients), is the complement of metabolomics, the study of
metabolites in isolated cell systems (e.g. organ and cell cultures) [19]. The novel approach that
combines metabolite profiling and chemometrics2 to model and predict efficacy or toxicity of
drug on an individual subject is called pharmaco-metabonomics [30]. The main assumption
behind the pharmaco-metabonomics is that the pre-dose metabolite profile of an individual
could contains sufficient information to enable the prediction of aspects of drug metabolism
and toxicity without any prior knowledge of the genomic profile of that individual [9].
Unlike genomics and proteomics, metabolomics deals with a great number of molecules char-
acterized by a huge chemical diversity that makes the analysis of full cellular metabolomes very
challenging. The principal analytical technologies or platforms that have been developed to
detect and quantify metabolites are preferentially based on nuclear magnetic resonance spec-
troscopy, hyphenated mass spectrometry techniques (often combined with high-performance
liquid chromatography) [9]. Currently, no single point-of-care methods enable the complete
coverage of all metabolites present at the cellular level or in biological fluids and only a rela-
tively limited fraction of known metabolomes can be analyzed [28].
The appeal of metabonomics is that, for example, a dose of a specific drug in a patient can
be monitored for its phenotype (drug disposition, efficacy, therapeutic failure and toxicity),
by profiling in the urine either the drug metabolites or the patterns of the thousands of small
metabolites. Specific patterns might indicate an individual’s predisposition to a toxic drug
response long before clinical effects become evident. Hence, in principle, this technique offers
great promise for attaining personalized drug therapy [31]. Few encouraging studies predicted
the drug clearance based on metabolomic investigation in a clinical setting, with regard to the
immunosuppressant drug, tacrolimus [32],and the anti-inflammatory drug acetaminophen
[30]. However, the use of metabolomics in the clinical setting is still far from reality, because it
requires analytical and clinical validation of the metabolomic approach, and, finally, a clinical
utility.
In summary, a single approach (e.g. genomics, proteomics, transcriptomics and metabo-
nomics) seems to be non sufficient to identify all the genes and gene products that are respon-
sible for either the efficacy or toxicity of a particular drug. The above-mentioned approaches
must be used in combination, and they are still under development. Pharmaco-metabonomics
seems promising but for the moment, it is too advanced, because it requires high sensitivity
techniques and profiling of hundreds of different metabolites at once. Moreover, for some
applications a simple prediction of drug response is not enough for a safe drug administration,
such as the cases reported in Table 1.1. A very promising alternative approach to these ’predic-
tive’ methods, for an effective optimization of a drug therapy, is a ’corrective’ method, based on
the direct quantification of the drug response after the administration. This is what is currently
done with the therapeutic drug monitoring (TDM), a multi-disciplinary clinical discipline
2Chemometrics is the branch of chemistry concerned with the analysis of chemical data (exctracting informa-tion from data) and ensuring that experimental data contain maximum information [29].
6
1.2. Current State-of-the-art in Personalized Medicine
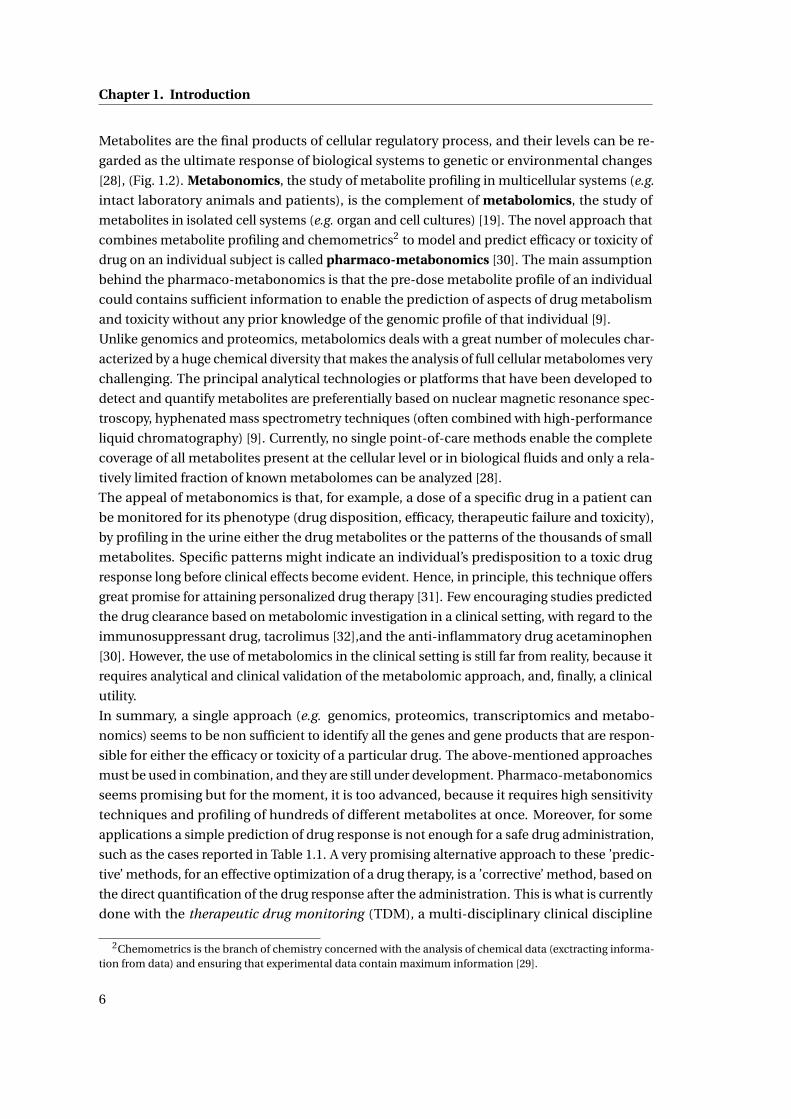
Table 1.1 – Clinical pharmacological cases when TDM is essential.
List of pharmacological cases
Toxicity suspected, or whether the minimum toxic concentration level has to be defined.
Lack of response, or whether the minimum effective concentration level has to be defined.
Assessment of compliance with medication regimen.
Assess therapy following a change in dosage regimen.
Change in clinical state of the patient.
Potential drug interaction due to change in co-medications.
Manifestations of toxicity and disease state are similar.
focused to improve patient care by individually adjusting the dose of drugs according to the
individual pharmacokinetic profile.
1.2.2 Therapeutic Drug Monitoring
Therapeutic drug monitoring (TDM) is defined as ”the direct measurement of drug levels that,
with appropriate clinical pharmacological interpretation, will directly affect prescribing proce-
dures” [33]. The aim of TDM is to measure the concentration of the drug at steady-state (or the
maximum drug concentration) and to modify the dose to obtain a desired drug concentration
known to be associated with efficacy and not toxicity [34]. Before going into details on the
TDM current practice, we first need to introduce some basic concepts of pharmacokinetics.
Pharmacokinetics describes the time course of the concentration of a drug in a body fluid,
preferably plasma or blood, that results from the administration of a certain dosage regimen.
In simple words, pharmacokinetics describes the ensemble of actions of the body on a drug,
divided in four main phases: Adsorption, Distribution, Metabolism, Excretion, (ADME)3.
By measuring the drug concentration in body fluids over the time we can follow the path of
the drug along the ADME phases. A typical plasma concentration time profile after oral drug
administration is shown in Fig. 1.3. MEC, defined as the ”minimum effective concentration”,
is the minimum concentration needed to produce the desired pharmacological effect. MTC,
defined as the ”maximum tolerated concentration”, or alternatively ”minimum toxic concen-
tration”, is an upper limit of concentration beyond which toxic effect or dangerous side effects
start showing up4.
3Absorption happens when the drug is administered orally, and it is the phase when the drug goes across severalphysiological barriers, like the gastrointestinal tract. The percentage of drug that actually reaches the systemiccirculation is defined as bioavailability. Distribution occurs when the drug leaves the vascular system to differentcompartments, either tissues or organs. In the metabolism phase, normally mediated by specific enzymes, thedrugs are converted into molecules that are easier to eliminate. Excretion is the irreversible elimination of acompound from the body.
4These definitions are valid assuming that there is rapid and homogeneous equilibration of the drug concentra-tion between plasma and the target site, and the pharmacologic effects are directly related to the concentration atthe target site.
7
Chapter 1. Introduction
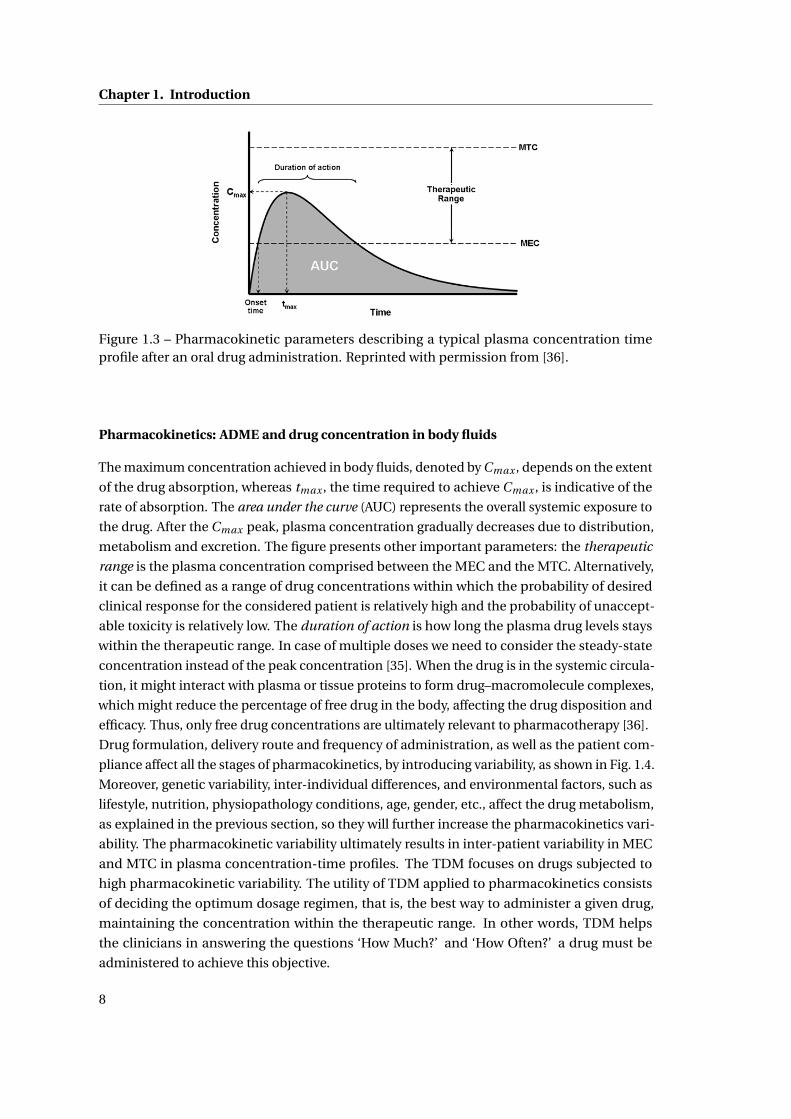
Figure 1.3 – Pharmacokinetic parameters describing a typical plasma concentration timeprofile after an oral drug administration. Reprinted with permission from [36].
Pharmacokinetics: ADME and drug concentration in body fluids
The maximum concentration achieved in body fluids, denoted by Cmax , depends on the extent
of the drug absorption, whereas tmax , the time required to achieve Cmax , is indicative of the
rate of absorption. The area under the curve (AUC) represents the overall systemic exposure to
the drug. After the Cmax peak, plasma concentration gradually decreases due to distribution,
metabolism and excretion. The figure presents other important parameters: the therapeutic
range is the plasma concentration comprised between the MEC and the MTC. Alternatively,
it can be defined as a range of drug concentrations within which the probability of desired
clinical response for the considered patient is relatively high and the probability of unaccept-
able toxicity is relatively low. The duration of action is how long the plasma drug levels stays
within the therapeutic range. In case of multiple doses we need to consider the steady-state
concentration instead of the peak concentration [35]. When the drug is in the systemic circula-
tion, it might interact with plasma or tissue proteins to form drug–macromolecule complexes,
which might reduce the percentage of free drug in the body, affecting the drug disposition and
efficacy. Thus, only free drug concentrations are ultimately relevant to pharmacotherapy [36].
Drug formulation, delivery route and frequency of administration, as well as the patient com-
pliance affect all the stages of pharmacokinetics, by introducing variability, as shown in Fig. 1.4.
Moreover, genetic variability, inter-individual differences, and environmental factors, such as
lifestyle, nutrition, physiopathology conditions, age, gender, etc., affect the drug metabolism,
as explained in the previous section, so they will further increase the pharmacokinetics vari-
ability. The pharmacokinetic variability ultimately results in inter-patient variability in MEC
and MTC in plasma concentration-time profiles. The TDM focuses on drugs subjected to
high pharmacokinetic variability. The utility of TDM applied to pharmacokinetics consists
of deciding the optimum dosage regimen, that is, the best way to administer a given drug,
maintaining the concentration within the therapeutic range. In other words, TDM helps
the clinicians in answering the questions ‘How Much?’ and ‘How Often?’ a drug must be
administered to achieve this objective.
8
1.2. Current State-of-the-art in Personalized Medicine
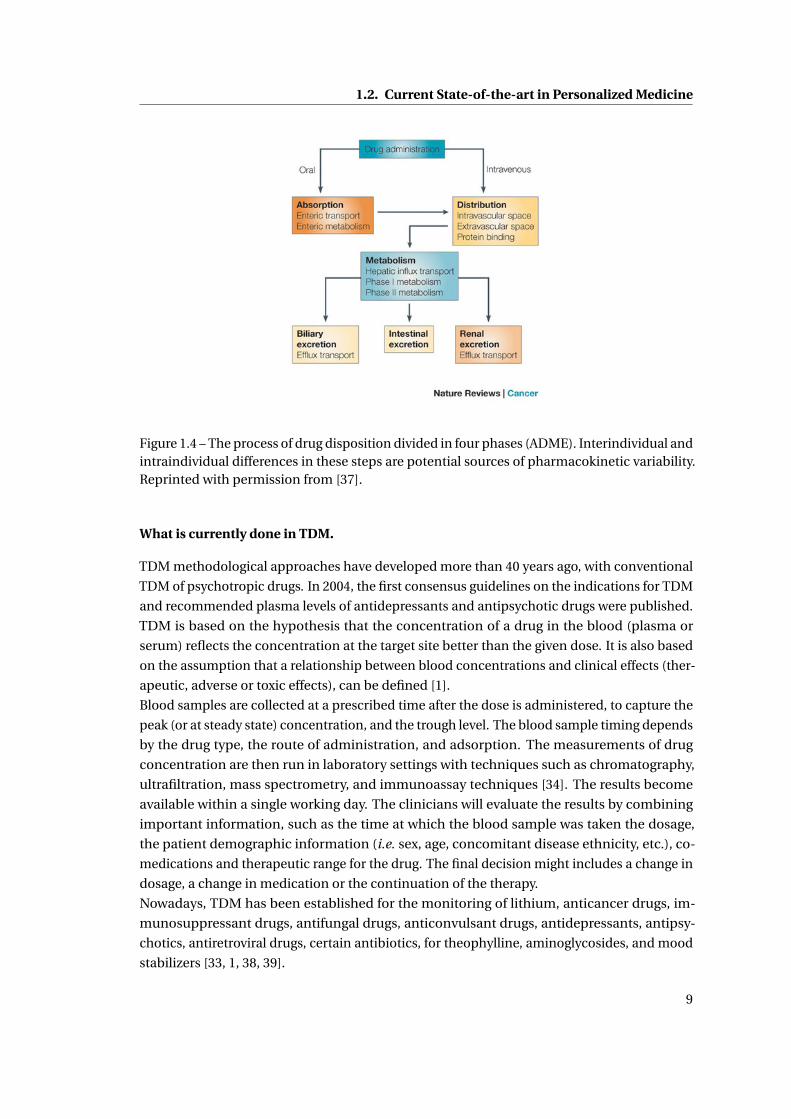
Figure 1.4 – The process of drug disposition divided in four phases (ADME). Interindividual andintraindividual differences in these steps are potential sources of pharmacokinetic variability.Reprinted with permission from [37].
What is currently done in TDM.
TDM methodological approaches have developed more than 40 years ago, with conventional
TDM of psychotropic drugs. In 2004, the first consensus guidelines on the indications for TDM
and recommended plasma levels of antidepressants and antipsychotic drugs were published.
TDM is based on the hypothesis that the concentration of a drug in the blood (plasma or
serum) reflects the concentration at the target site better than the given dose. It is also based
on the assumption that a relationship between blood concentrations and clinical effects (ther-
apeutic, adverse or toxic effects), can be defined [1].
Blood samples are collected at a prescribed time after the dose is administered, to capture the
peak (or at steady state) concentration, and the trough level. The blood sample timing depends
by the drug type, the route of administration, and adsorption. The measurements of drug
concentration are then run in laboratory settings with techniques such as chromatography,
ultrafiltration, mass spectrometry, and immunoassay techniques [34]. The results become
available within a single working day. The clinicians will evaluate the results by combining
important information, such as the time at which the blood sample was taken the dosage,
the patient demographic information (i.e. sex, age, concomitant disease ethnicity, etc.), co-
medications and therapeutic range for the drug. The final decision might includes a change in
dosage, a change in medication or the continuation of the therapy.
Nowadays, TDM has been established for the monitoring of lithium, anticancer drugs, im-
munosuppressant drugs, antifungal drugs, anticonvulsant drugs, antidepressants, antipsy-
chotics, antiretroviral drugs, certain antibiotics, for theophylline, aminoglycosides, and mood
stabilizers [33, 1, 38, 39].
9
Chapter 1. Introduction
Limits of TDM
Despite the promising results in clinical applications of TDM, so far it has been introduced to
a limited number of patients and on few drugs [33], in my opinion for the following reasons:
• Technology: Current analytical techniques in TDM practice grant highly accurate, se-
lective, and reproducible drug measurements. However these techniques are time
consuming and require highly-trained staff, and they can be performed in only a limited
number of laboratories or specific centers, at high costs and at the expense of a longer
time lag between TDM request and reporting of results.
• Human error: A recent study on the clinical use of TDM on antidepressants reveals
that between 25% and 40% of the requests for TDM were inappropriate and that the
interpretation of the results led to about 20% of the therapeutic adjustments being
incorrect [33]. Most of the reasons are due to human errors in misinterpretation of the
results. Additionally, repetitive manual data handling represents an additional source of
errors in diagnosis. For the optimal evaluation and decision in TDM, a team of experts is
needed, which should consists of pharmacologists, clinical pharmacists and analytical
scientists.
• Incorrect timing: The same study [33] reports that in the majority of the cases, blood
samples were collected at a non-optimal time frame. The timing in sample collection
and also in drug administration is essential for a precise tuning of the patient’s dosage
[34].
• Drug Development: A reason for the slow development of TDM is the lack of sufficient
information regarding the pharmacokinetic/pharmacodynamic of drugs. It is common
belief that TDM should also be introduced during drug development and in pharma-
covigilance. Although high-throughput laboratory methods are now available, clinical
trials usually do not include measurements of blood concentrations. These should
be implemented in the near future to provide earlier insight about the correlation be-
tween drug concentrations and clinical outcomes, thus enabling the development of
compounds with an higher degree of therapy personalization [33].
The success of personalized medicine and TDM depends on having accurate diagnostic tests
that could overcome these limitations. As it will be explained in the next section, TDM and
personalized medicine would greatly benefit from the introduction of innovative biosensors
in clinical practice.
1.3 Biosensors: towards the optimization of personalized medicine
The analysis of the current state-of-the-art in personalized medicine raises the need for a new
innovative technology that should present the following features:
10
1.3. Biosensors: towards the optimization of personalized medicine
• Point-of-care, cheap, disposable and reliable: The development of a quick, easy, and
inexpensive diagnostic technology can be the driving force to encourage patients and
industry to adopt personalized therapy policies.
• Wearable m-health device: Recently, more and more companies, like Google or Apple,
are investing in mobile-health (m-health), i.e. the practice of medicine supported by
mobile devices [40]. A ”smart” technology able to monitor the patient’s status and
transmit in real-time this information to doctors would enable a more effective patient
monitoring and treatment outside the traditional medical care settings of hospitals.
Instead, more people would be treated at home and at work, and would also be able to
maintain their lifestyle and quality of life.
• Small, miniaturized device and compatible with the current electronic technology: Minia-
turization and integration of the technology in a small device is essential for the develop-
ment of portable and non-expensive devices and it can be achieved by microelectronic
compatible technologies.
• Continuous monitoring: Some applications might require single time self-testing, such
as for a pregnancy test, in other cases there is a daily need for measurement, as for
glucose monitoring in diabetes. For drug monitoring, as it emerges from TDM practice,
blood samples are collected once the drug concentrations have reached the steady-state,
i.e. at least 3.3 half-live at the current dosage regimen [34]. However drugs with long
half-lives, especially if toxicity is suspected, should be monitored at early stage. While
in some cases disposable devices are more indicated, for other cases, especially for
drug monitoring, the realization of fully implantable systems for continuous measure-
ments would represent a major breakthrough, and improve the TDM practice. With
an implantable sensor the measurement can be activated from outside, thus tuning
and adapting the measurement timing to the specific drug monitored. An implantable
sensor would offer much more flexibility and accuracy at the same time.
• Multiparameter: Even in TDM it is important to control other parameters, such as
endogenous metabolites, blood pressure, pH and temperature, for an accurate therapy,
finely tuned towards individual patients [3]. Moreover, the possibility to measure several
drug concentrations would improve the accuracy of TDM when assuming drug cocktails,
to control the drug interactions. Drug interactions are by far one of the most important
source of variability in drug response [12].
The technology that best match all these requirements would be an implantable or disposable
electrochemical biosensor for real-time and continuous drug monitoring, able to monitor
other parameters, with fully electronics that could actuate the device, collect the data and
transmit the data to an external user.
Biosensors are generally concerned with sensing and measuring particular chemicals which
may even not be biological molecules themselves and which are usually known as the sub-
strate or analyte (see Fig. 1.5). The presence of the analyte is detected trough a recognition
11
Chapter 1. Introduction
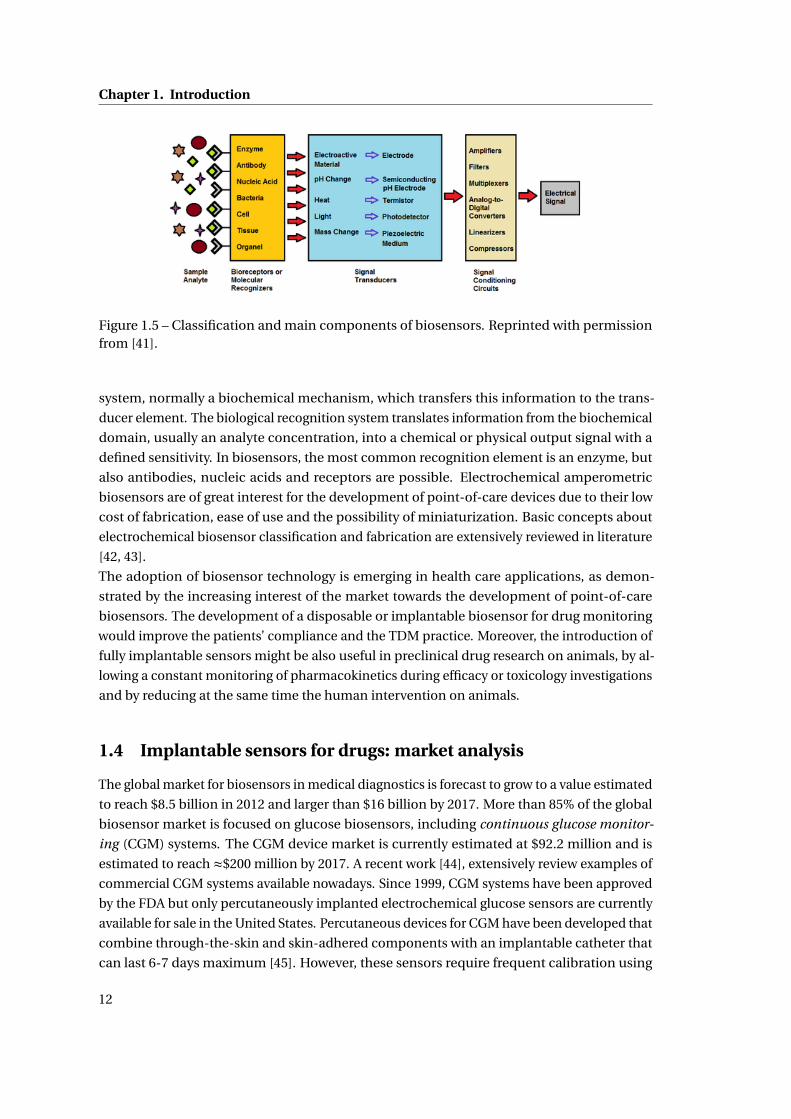
Figure 1.5 – Classification and main components of biosensors. Reprinted with permissionfrom [41].
system, normally a biochemical mechanism, which transfers this information to the trans-
ducer element. The biological recognition system translates information from the biochemical
domain, usually an analyte concentration, into a chemical or physical output signal with a
defined sensitivity. In biosensors, the most common recognition element is an enzyme, but
also antibodies, nucleic acids and receptors are possible. Electrochemical amperometric
biosensors are of great interest for the development of point-of-care devices due to their low
cost of fabrication, ease of use and the possibility of miniaturization. Basic concepts about
electrochemical biosensor classification and fabrication are extensively reviewed in literature
[42, 43].
The adoption of biosensor technology is emerging in health care applications, as demon-
strated by the increasing interest of the market towards the development of point-of-care
biosensors. The development of a disposable or implantable biosensor for drug monitoring
would improve the patients’ compliance and the TDM practice. Moreover, the introduction of
fully implantable sensors might be also useful in preclinical drug research on animals, by al-
lowing a constant monitoring of pharmacokinetics during efficacy or toxicology investigations
and by reducing at the same time the human intervention on animals.
1.4 Implantable sensors for drugs: market analysis
The global market for biosensors in medical diagnostics is forecast to grow to a value estimated
to reach $8.5 billion in 2012 and larger than $16 billion by 2017. More than 85% of the global
biosensor market is focused on glucose biosensors, including continuous glucose monitor-
ing (CGM) systems. The CGM device market is currently estimated at $92.2 million and is
estimated to reach ≈$200 million by 2017. A recent work [44], extensively review examples of
commercial CGM systems available nowadays. Since 1999, CGM systems have been approved
by the FDA but only percutaneously implanted electrochemical glucose sensors are currently
available for sale in the United States. Percutaneous devices for CGM have been developed that
combine through-the-skin and skin-adhered components with an implantable catheter that
can last 6-7 days maximum [45]. However, these sensors require frequent calibration using
12
1.4. Implantable sensors for drugs: market analysis
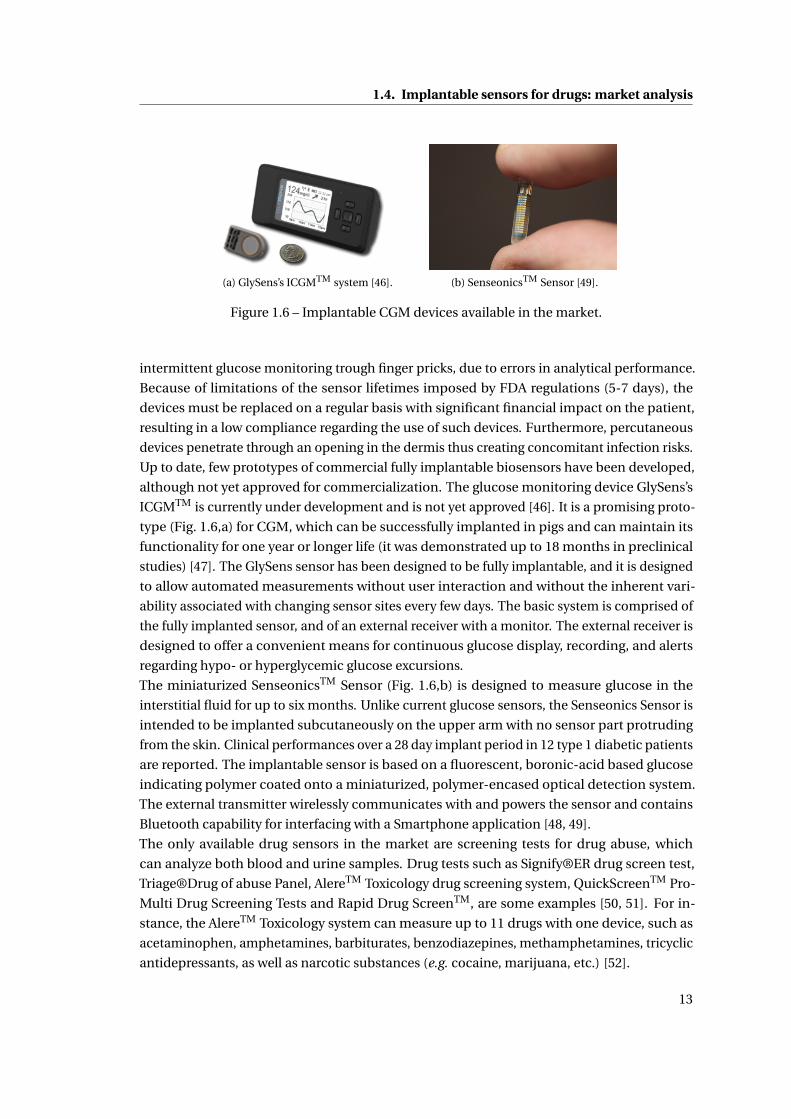
(a) GlySens’s ICGMTM system [46]. (b) SenseonicsTM Sensor [49].
Figure 1.6 – Implantable CGM devices available in the market.
intermittent glucose monitoring trough finger pricks, due to errors in analytical performance.
Because of limitations of the sensor lifetimes imposed by FDA regulations (5-7 days), the
devices must be replaced on a regular basis with significant financial impact on the patient,
resulting in a low compliance regarding the use of such devices. Furthermore, percutaneous
devices penetrate through an opening in the dermis thus creating concomitant infection risks.
Up to date, few prototypes of commercial fully implantable biosensors have been developed,
although not yet approved for commercialization. The glucose monitoring device GlySens’s
ICGMTM is currently under development and is not yet approved [46]. It is a promising proto-
type (Fig. 1.6,a) for CGM, which can be successfully implanted in pigs and can maintain its
functionality for one year or longer life (it was demonstrated up to 18 months in preclinical
studies) [47]. The GlySens sensor has been designed to be fully implantable, and it is designed
to allow automated measurements without user interaction and without the inherent vari-
ability associated with changing sensor sites every few days. The basic system is comprised of
the fully implanted sensor, and of an external receiver with a monitor. The external receiver is
designed to offer a convenient means for continuous glucose display, recording, and alerts
regarding hypo- or hyperglycemic glucose excursions.
The miniaturized SenseonicsTM Sensor (Fig. 1.6,b) is designed to measure glucose in the
interstitial fluid for up to six months. Unlike current glucose sensors, the Senseonics Sensor is
intended to be implanted subcutaneously on the upper arm with no sensor part protruding
from the skin. Clinical performances over a 28 day implant period in 12 type 1 diabetic patients
are reported. The implantable sensor is based on a fluorescent, boronic-acid based glucose
indicating polymer coated onto a miniaturized, polymer-encased optical detection system.
The external transmitter wirelessly communicates with and powers the sensor and contains
Bluetooth capability for interfacing with a Smartphone application [48, 49].
The only available drug sensors in the market are screening tests for drug abuse, which
can analyze both blood and urine samples. Drug tests such as Signify®ER drug screen test,
Triage®Drug of abuse Panel, AlereTM Toxicology drug screening system, QuickScreenTM Pro-
Multi Drug Screening Tests and Rapid Drug ScreenTM, are some examples [50, 51]. For in-
stance, the AlereTM Toxicology system can measure up to 11 drugs with one device, such as
acetaminophen, amphetamines, barbiturates, benzodiazepines, methamphetamines, tricyclic
antidepressants, as well as narcotic substances (e.g. cocaine, marijuana, etc.) [52].
13
Chapter 1. Introduction
At the moment, the market shows an enormous demand of point-of-care devices for glucose
monitoring, but not yet for drugs. The research is currently interested in developing sensors
for drug monitoring, and new sensors would represent a new interesting market opportunity.
1.5 Research contribution
The objective of this thesis is the design and characterization of an implantable electro-
chemical biosensor platform for the real-time and continuous monitoring of drug and other
parameters, such as endogenous metabolite concentrations, pH and temperature, to be fur-
ther fully equipped with electronics that could actuate the device, collect the data and transmit
the data to an external user.
The present research is part of a bigger project5 that aims to develop an implantable system for
drug monitoring in mice used in research on animals. Small animal models are increasingly be-
ing used in the first phase of clinical trials for drug development. The living conditions of these
animals are of primary importance because the stress level can affect the measurement results.
This means that the animal must be in a comfortable environment and capable to move freely.
Therefore, the final aim of this project is to monitor the animal in a living space, such as a cage,
by means of a fully implantable device, in order to minimize the human intervention. The
device must be battery-less, thus an intelligent powering system is designed to continuously
transfer the power to the implantable system according to the position of the animal. The
fully implantable device consists of: 1) a passive sensing platform, 2) integrated circuits (ICs)
to perform electrochemical measurements and 3) a coil for power and data transmission6 .
The device is intended to be implanted subcutaneously in mice. The present work will mostly
focus on the realization of the passive sensing platform, and on the integration with the other
components for the development of a working prototype.
The realization of such a device has to take into account several requirements: it must be
biocompatible and retain the sensor functionality, in order to ensure a correct integration with
the body as well as electrical integrity; it has to guarantee high sensitivity and selectivity for the
detection of several molecules within the physiological ranges. The next chapter will present
all the design choices that have been made in this thesis to fulfill these requirements, with
details on the current state-of-the-art.
Concerning the presented state-of-the-art, this thesis presents innovative contributions on:
• Multiple drug detection. Selective detection of drugs and drug pairs has been achieved
with different strategies, which combine the electrode functionalization with nanoma-
terials and enzymes. Several drugs have been monitored within the pharmacological
ranges in undiluted human serum. As a proof-of-concept, the continuous monitoring
of an anti-inflammatory drug was accomplished, thus showing the potential of the
presented method as a valid alternative in TDM practice.
5SNF Sinergia Project, code CRSII2_147694/1 and title ”Innovative Enabling Micro-Nano-Bio-technologies forImplantable systems in molecular medicine and personalised therapy, project prolongation”.
6The powering system and the ICs have been realized by other collaborators.
14
1.6. Thesis organization
• Monitoring multiple parameters. The electrochemical platform was designed to host
four independent biosensors, for the monitoring of drugs and endogenous metabolites,
a pH sensor, and a temperature sensor. The design of a sensing platform for electro-
chemical measurement, combined with the presence of a pH and a temperature sensor,
is a strategy to optimize the sensing performance in different physiological conditions,
since changes in pH and temperature can affect the sensor specificity.
• System design, fabrication, characterization and integration. The research is focused on
the complete design and fabrication of the sensing platform and its integration with the
electronics and an intelligent powering system for real-time monitoring molecules in
freely-moving animals.
• Biocompatibility and packaging. This work deals with the complex integration of micro-
fabricated sensors, nanomaterials, enzymes, system of membranes and an external
packaging, to ensure at the same time measurements with high signal-to-noise ratio,
biocompatibility and selectivity against possible interfering molecules in biological
fluids.
1.6 Thesis organization
Following the Introduction, the thesis is organized as follows:
Chapter 2 gives an overview on the state-of-the-art concerning the strategies that were chosen
in the present research for the realization of the fully implantable device. Biosensing strategies,
the use of nanomaterials, as well as the choice of a complex packaging are discussed and
compared.
Chapter 3 presents several possibilities of biosensors for drug monitoring. The sensor based on
cytochrome P450 and carbon-nanotubes is employed for single and multiple drug detection.
The continuous monitoring of the anti-inflammatory drug Naproxen is presented in this
chapter, with particular concern on its potentiality and limitations. Detection of drugs without
enzymes is also shown. Finally, a discussion on possible strategies for enhancing the specificity
of the sensor in case of multiple drug detection is presented.
Chapter 4 presents the design, fabrication and characterization of the electrochemical sensing
platform, with respect to the constraints given by the integration with the electronics and by
the final application. The calibration towards drugs, endogenous metabolites, pH and temper-
ature with the micro-fabricated platform is reported, proving the flexibility and accuracy of
this designed platform.
Chapter 5 shows the complex system of membranes and polymers for the realization of the
final packaging for the implantable system, that could ensure a good level of biocompatibility
and the permselective ability against interfering molecules present in biological fluids.
15

Chapter 1. Introduction
Chapter 6 focuses on the assembly of the implantable system, on the in-vitro and in-vivo
characterization, with a detailed description of the complete system.
16
2 Implantable biosensor: theory andstate-of-the-art
“If I have seen further it is by standing on the shoulders of Giants.”
Isaac Newton, (1642-1727)
As stated in the Introduction, the objective of this thesis is the design and characterization of
an implantable electrochemical biosensor for real-time and continuous monitoring of drug
and other parameters, such as endogenous metabolite concentrations, pH and temperature,
which can be further integrated with electronics that could actuate the device, collect the
data and transmit them to an external user. The realization of this device has to take into
account several requirements: the biosensors are electrochemical-based devices, able to
perform electroanalytical techniques; high signal-to-noise ratio is required to achieve high
precision in the quantification of the drugs and metabolites in biological fluids within the
pharmacological and physiological ranges; the sensing platform is intended to measure
drugs, drug cocktails and endogenous metabolites, as glucose and lactate; the device must
be protected with a biocompatible packaging, in order to ensure the integration within the
body as well as electrical integrity; it needs autonomy in terms of power supply and sensor
actuation. This chapter will present design strategies to fulfill these requirements, with an
overview on the theory and the current state-of-the-art. More specifically, this chapter will
address these questions:
• How electrochemical measurements are done?
• How the sensor signal can be enhanced to fit the physiological range?
• What can be measured by electrochemical sensor?
• Which are the main issues to be considered for the design of a biocompatible packaging?
• How the sensor can be integrated in a small implantable device?
17
Chapter 2. Implantable biosensor: theory and state-of-the-art
2.1 Electrochemical sensing techniques: an overview
2.1.1 Background on electroanalytical techniques
Electrochemical sensors for the measurement of analytes of interest in clinical chemistry are
ideally suited for the realization of portable or implantable devices, due to their high sensitivity
and selectivity, portable field-based size, rapid response time and low-cost [43]. Furthermore,
electrochemical sensors can be employed in numerous applications in clinical diagnosis,
environmental monitoring and food analysis [53]. Summarizing the complete state-of-the-art
for electrochemical sensors is a difficult tasks, as an enormous amount of possibilities exists
in terms of techniques and applications. However, some reviews synthesize well the main
concepts and applications for electrochemical sensors [54, 55].
The typical electrochemical biosensor configuration is based on a two- or three-electrode
cell topology. An electrolytic cell is created by placing metallic electrodes into an electrolyte.
The electrolyte is usually a conductive solution made by water or other solvents in which ions
are solvated. In biosensors, the electrolytes are biological samples, since body fluids, such as
blood or interstitial fluids, are salt and water-based, thus conductive solutions.
The oxidation/reduction (redox) reactions occurring onto metallic electrodes when they are
placed inside an electrolytic solution, are responsible for producing charge separation at the
interface between the solid metal and the solution. Once they are separated, the charged
particles create an electrostatic field and its associated potential difference. A potential
difference can be measured between the two electrodes, one called working electrode (WE)
and the other reference electrode (RE). The potential of the cell, which corresponds to the
potential difference between the two electrodes, is expressed by the Nernst equation:
E = [EΘO/R ]SHE + RT
nFln
CO
CR(2.1)
where E is the differential potential between the two electrodes, [EΘO/R ]SHE is the standard
redox potential referred to the standard hydrogen electrode (SHE), R is the gas constant, T
the absolute temperature, n the number of electrons exchanged in the redox reaction, F the
Faraday constant, and CO and CR are the concentration of the oxidized and reduced species,
respectively. The standard redox potential is measured under standard conditions, at 10C,
a 1 M concentration for each ion participating in the reaction, with a partial gas pressure of
1 atm for each gas that is part of the reaction, and metals in their pure state. Values of the
standard redox potential for different redox couples have been measured with respect to the
SHE reference electrode. However many other standard reference electrodes can be used,
such as the silver silver-chloride (Ag /AgC l ) electrode, or the saturated calomel electrode (SCE),
by adjusting the potential with respect to the standard SHE [56]. The equilibrium potential is
measured when the redox reaction reaches the equilibrium. In this condition, as demonstrated
from the Eq. 2.1, the concentration of oxidized species equalizes the concentration of reduced
species. Thus, by applying a varying potential, the equilibrium between the concentration
of oxidized and reduced species will change, accordingly. The Nernst equation (Eq. 2.1) is a
18
2.1. Electrochemical sensing techniques: an overview
fundamental expression that specifies the relationship between the potential difference and
the concentrations of the two species (designated O and R) involved in the redox reaction.
When an external potential is applied to the electrodes, a current flow is generated across the
cell, and it can be measured and related to the concentration of the oxidized/reduced species.
By applying a potential higher than the equilibrium redox potential, the concentration of
oxidized species will be predominant and an anodic current will be measured, while vice-versa,
a cathodic current will be measured. The total current recorded in the electrochemical cell is
the sum of the anodic and the cathodic current.
With the 2-electrode configuration, it is extremely difficult to maintain a constant potential at
the RE: the RE acts at the same time as electron supplier as well as reference for the potential,
with the consequence that the current could change its potential [57]. To solve this problem a
third electrode, the counter electrode (CE) is introduced. In the 3-electrode cell topology, the
reference electrode acts as reference in measuring and controlling the WE potential and it
does not enable any current flow; the CE pumps (or collects) the current needed to balance the
current required (or measured) at the WE. The WE is typically the electrode where the analyte
of interest undergoes reduction or oxidation. Thus, the current flowing between WE and CE is
indicative of the concentration of the oxidized and/or the reduced species, according to the
polarization (e.g the direction of the applied potential).
In practice, currents and potentials in the 3-electrode cell are regulated by a potentiostat,
which controls the potential difference between RE and WE by adjusting the current at the CE.
A fully implantable electrochemical sensor will therefore require a miniaturized 3-electrode
cell, a potentiostat circuit, and a power supply.
Many electroanalytical techniques are currently employed in electrochemical sensors: the
most common are potentiostatic methods and potentiodynamic methods. The next sec-
tion will focus on the methods that were employed in this thesis: chronoamperometry, an
example of potentiostatic method, cyclic voltammetry and square-wave voltammetry, as
potentiodynamic methods. The main principle is that these techniques are used to measure
the concentration of a specific analyte (or substance), which is electrochemically active and
undergoes reduction or oxidation.
In an electroanalytical experiment, the applied potential forces the ratio COCR
to adopt a specific
value consistent with the Nernst equation (eq. 2.1). In general, however, the concentration of
the species CO and CR at the electrode surface are not the same as those in the bulk solution.
Thus, a driving diffusion force transports the analyte to, or from the electrode surface. This
transport of analyte towards the electrode surface, coupled with its oxidation or reduction,
as it arrives at the surface, determines the magnitude of the current that will be measured.
The difference in concentration between the solution near the electrode surface and the bulk
solution, is determined by the value of the applied potential, according to the Nernst equation
(eq. 2.1). Thus, by combining Fick’s first law of diffusion with Faraday’s law, a fundamental
relationship is obtained, used to calculate the current in any electroanalytical experiment [56]:
i (t ) = dQ
d t=−nF (F lux) = nF AD
(δC
δx
)x=0
(2.2)
19
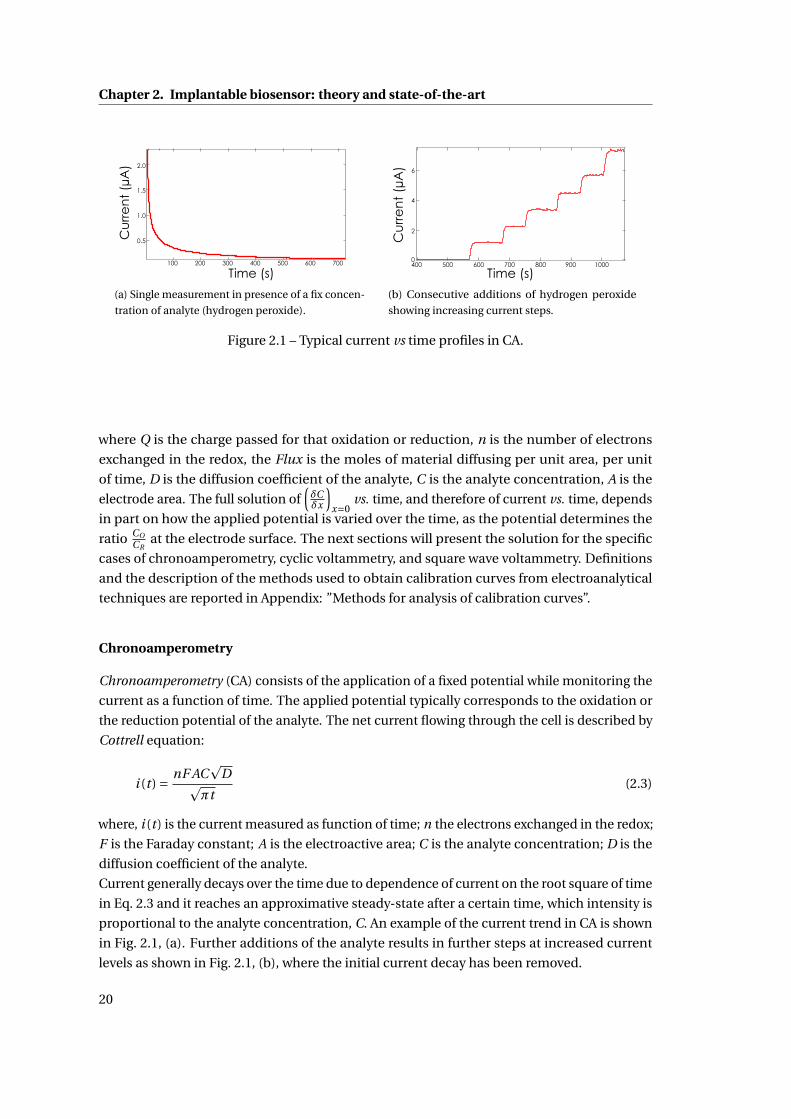
Chapter 2. Implantable biosensor: theory and state-of-the-art
Cu
rre
nt
(µA
)
Time (s)
1.5
1.0
0.5
700600500400300200100
2.0
(a) Single measurement in presence of a fix concen-
tration of analyte (hydrogen peroxide).
Cu
rre
nt
(µA
)
Time (s)
2
4
6
400 500 600 700 800 900 10000
(b) Consecutive additions of hydrogen peroxide
showing increasing current steps.
Figure 2.1 – Typical current vs time profiles in CA.
where Q is the charge passed for that oxidation or reduction, n is the number of electrons
exchanged in the redox, the Flux is the moles of material diffusing per unit area, per unit
of time, D is the diffusion coefficient of the analyte, C is the analyte concentration, A is the
electrode area. The full solution of(δCδx
)x=0
vs. time, and therefore of current vs. time, depends
in part on how the applied potential is varied over the time, as the potential determines the
ratio COCR
at the electrode surface. The next sections will present the solution for the specific
cases of chronoamperometry, cyclic voltammetry, and square wave voltammetry. Definitions
and the description of the methods used to obtain calibration curves from electroanalytical
techniques are reported in Appendix: ”Methods for analysis of calibration curves”.
Chronoamperometry
Chronoamperometry (CA) consists of the application of a fixed potential while monitoring the
current as a function of time. The applied potential typically corresponds to the oxidation or
the reduction potential of the analyte. The net current flowing through the cell is described by
Cottrell equation:
i (t ) = nF ACp
Dpπt
(2.3)
where, i (t ) is the current measured as function of time; n the electrons exchanged in the redox;
F is the Faraday constant; A is the electroactive area; C is the analyte concentration; D is the
diffusion coefficient of the analyte.
Current generally decays over the time due to dependence of current on the root square of time
in Eq. 2.3 and it reaches an approximative steady-state after a certain time, which intensity is
proportional to the analyte concentration, C. An example of the current trend in CA is shown
in Fig. 2.1, (a). Further additions of the analyte results in further steps at increased current
levels as shown in Fig. 2.1, (b), where the initial current decay has been removed.
20
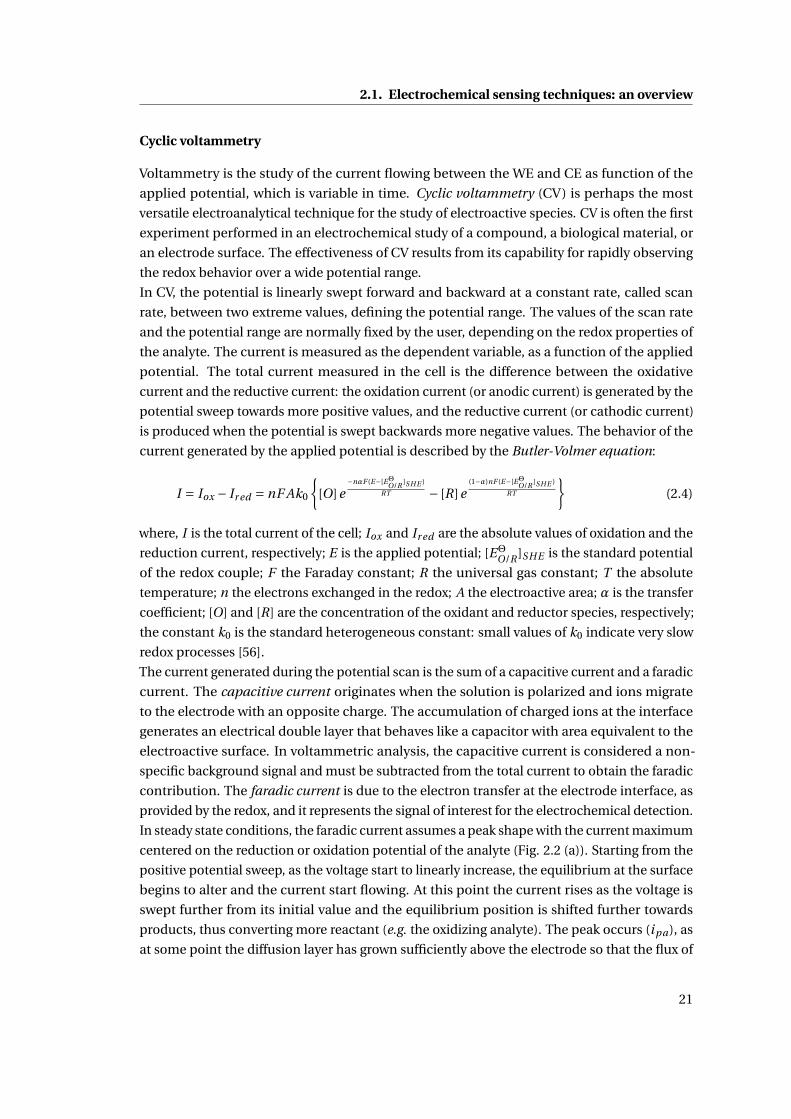
2.1. Electrochemical sensing techniques: an overview
Cyclic voltammetry
Voltammetry is the study of the current flowing between the WE and CE as function of the
applied potential, which is variable in time. Cyclic voltammetry (CV) is perhaps the most
versatile electroanalytical technique for the study of electroactive species. CV is often the first
experiment performed in an electrochemical study of a compound, a biological material, or
an electrode surface. The effectiveness of CV results from its capability for rapidly observing
the redox behavior over a wide potential range.
In CV, the potential is linearly swept forward and backward at a constant rate, called scan
rate, between two extreme values, defining the potential range. The values of the scan rate
and the potential range are normally fixed by the user, depending on the redox properties of
the analyte. The current is measured as the dependent variable, as a function of the applied
potential. The total current measured in the cell is the difference between the oxidative
current and the reductive current: the oxidation current (or anodic current) is generated by the
potential sweep towards more positive values, and the reductive current (or cathodic current)
is produced when the potential is swept backwards more negative values. The behavior of the
current generated by the applied potential is described by the Butler-Volmer equation:
I = Iox − Ir ed = nF Ak0
[O]e
−nαF (E−[EΘO/R ]SHE )
RT − [R]e(1−α)nF (E−[EΘO/R ]SHE )
RT
(2.4)
where, I is the total current of the cell; Iox and Ir ed are the absolute values of oxidation and the
reduction current, respectively; E is the applied potential; [EΘO/R ]SHE is the standard potential
of the redox couple; F the Faraday constant; R the universal gas constant; T the absolute
temperature; n the electrons exchanged in the redox; A the electroactive area; α is the transfer
coefficient; [O] and [R] are the concentration of the oxidant and reductor species, respectively;
the constant k0 is the standard heterogeneous constant: small values of k0 indicate very slow
redox processes [56].
The current generated during the potential scan is the sum of a capacitive current and a faradic
current. The capacitive current originates when the solution is polarized and ions migrate
to the electrode with an opposite charge. The accumulation of charged ions at the interface
generates an electrical double layer that behaves like a capacitor with area equivalent to the
electroactive surface. In voltammetric analysis, the capacitive current is considered a non-
specific background signal and must be subtracted from the total current to obtain the faradic
contribution. The faradic current is due to the electron transfer at the electrode interface, as
provided by the redox, and it represents the signal of interest for the electrochemical detection.
In steady state conditions, the faradic current assumes a peak shape with the current maximum
centered on the reduction or oxidation potential of the analyte (Fig. 2.2 (a)). Starting from the
positive potential sweep, as the voltage start to linearly increase, the equilibrium at the surface
begins to alter and the current start flowing. At this point the current rises as the voltage is
swept further from its initial value and the equilibrium position is shifted further towards
products, thus converting more reactant (e.g. the oxidizing analyte). The peak occurs (ipa), as
at some point the diffusion layer has grown sufficiently above the electrode so that the flux of
21
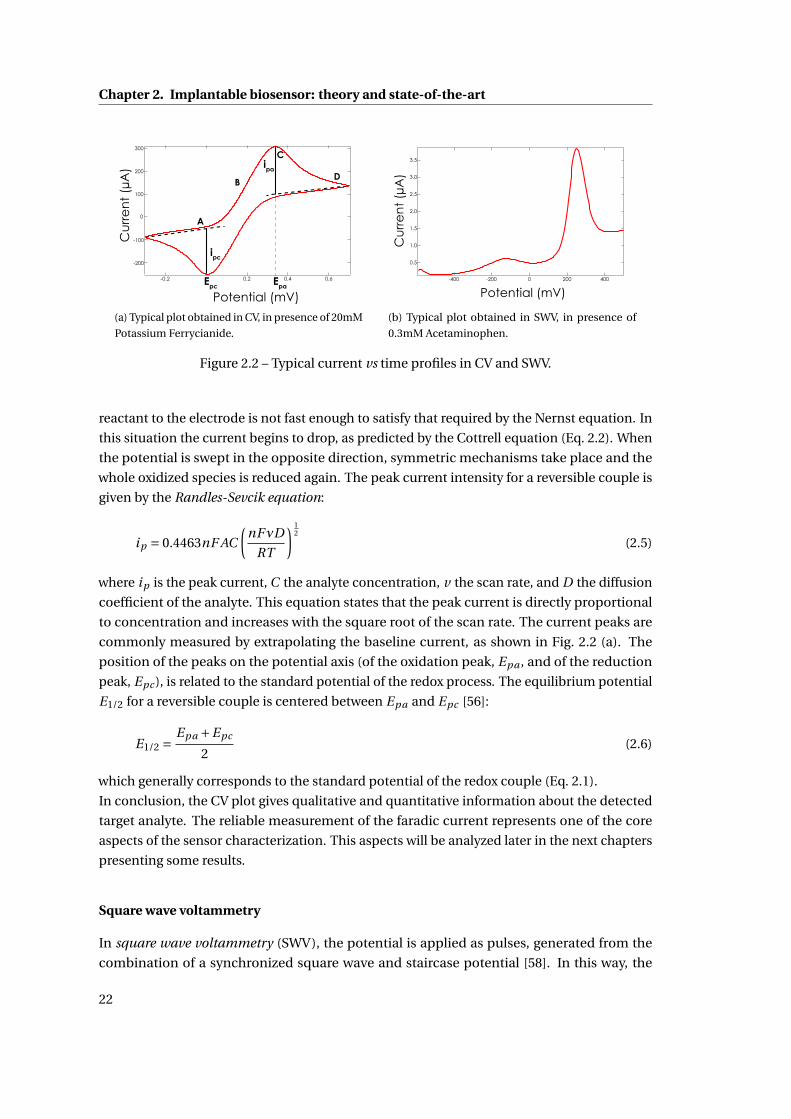
Chapter 2. Implantable biosensor: theory and state-of-the-art
300
200
100
0
-100
-200
Cu
rre
nt
(µA
)
0.60.40.2-0.2
Potential (mV)
ipc
ipa
A
B
C
D
Epc Epa
(a) Typical plot obtained in CV, in presence of 20mM
Potassium Ferrycianide.
3.5
3.0
2.5
2.0
1.5
1.0
0.5
-400 -200 0 200 400
Cu
rre
nt
(µA
)
Potential (mV)
(b) Typical plot obtained in SWV, in presence of
0.3mM Acetaminophen.
Figure 2.2 – Typical current vs time profiles in CV and SWV.
reactant to the electrode is not fast enough to satisfy that required by the Nernst equation. In
this situation the current begins to drop, as predicted by the Cottrell equation (Eq. 2.2). When
the potential is swept in the opposite direction, symmetric mechanisms take place and the
whole oxidized species is reduced again. The peak current intensity for a reversible couple is
given by the Randles-Sevcik equation:
ip = 0.4463nF AC
(nFνD
RT
) 12
(2.5)
where ip is the peak current, C the analyte concentration, v the scan rate, and D the diffusion
coefficient of the analyte. This equation states that the peak current is directly proportional
to concentration and increases with the square root of the scan rate. The current peaks are
commonly measured by extrapolating the baseline current, as shown in Fig. 2.2 (a). The
position of the peaks on the potential axis (of the oxidation peak, Epa , and of the reduction
peak, Epc ), is related to the standard potential of the redox process. The equilibrium potential
E1/2 for a reversible couple is centered between Epa and Epc [56]:
E1/2 =Epa +Epc
2(2.6)
which generally corresponds to the standard potential of the redox couple (Eq. 2.1).
In conclusion, the CV plot gives qualitative and quantitative information about the detected
target analyte. The reliable measurement of the faradic current represents one of the core
aspects of the sensor characterization. This aspects will be analyzed later in the next chapters
presenting some results.
Square wave voltammetry
In square wave voltammetry (SWV), the potential is applied as pulses, generated from the
combination of a synchronized square wave and staircase potential [58]. In this way, the
22
2.1. Electrochemical sensing techniques: an overview
double layer charging current may be made negligible by measurement at a suitable time
after the pulses occur. The staircase allows the electrode potential to be swept over the
useful potential range. The theory for a reversible redox couple predicts that the resulting
current-time behavior should be symmetrical showing a well-defined bellshaped peak at E1/2.
The peak current is a linear function of the concentration and the square root of the square
wave frequency. The peak current is a more complicated function of square wave amplitude,
measurement time, and staircase amplitude [59], as shown in the following equation:
i =[
nF ACp
D√πtp
]Ψ (∆ES ,ESW ) (2.7)
where the current response is expressed in terms of a normalized current function Ψ. In
Equation 2.7, i is the measured current on each pulse; n is the number of electrons transferred;
F is the Faraday constant; A is the area of the electrode; D is the analyte diffusion constant; C
is the bulk concentration of the analyte; tp is the pulse width (half the staircase period); the
entire quantity in the square brackets is the maximum current that would be obtained with a
normal pulse experiment under the same conditions;Ψ is the dimensionless current function,
which depends on the step height ∆ES , and the square wave amplitude ESW [58]. The non-
normalized current response depends on the frequency√
f , according to Equation 2.7, (the
reciprocal of the pulse width tp ). Thus, by increasing the square wave frequency, the square
wave peak current will increase, and hence the sensitivity.
Not only SWV provides a convenient symmetrical peak with high sensitivity, but the SWV also
gives excellent rejection of background current [58]. Figure 2.2 (b) shows a typical SWV plot,
where the oxidation current is reported vs. the potential.
2.1.2 Enhanced sensitivity in biosensing
Electroanalytical techniques are used to characterize the sensor, i.e. to quantify the sensor
response upon a variation in the analyte concentration. As main requirement, the sensor
response has to be accurate enough to measure every significant physiological variation of
the analyte concentration. For many applications, sensors are required to detect analytes in
the micro-molar, nano-molar, or even lower ranges. Several strategies have been investigated
in research, to enhance the output signals of the sensor, and to suit the small sizes of the
miniaturized devices.
Recent developments in nanotechnology have revealed new nano-structured materials, which
have useful properties for numerous electrochemical sensor and biosensor applications [60].
Nanostructures enable the control over the fundamental properties of electrode materials,
thus improving the signal response [61].
Moreover, when proteins and enzymes are immobilized on electrodes, nanostructures en-
hance the electron transfer between the electrode and the protein, thus improving the catalytic
reaction [62]. In general, nano-structured materials improve the electron transfer between the
electrode and an electroactive specie. The enhancement of electron transfer is an extremely
23
Chapter 2. Implantable biosensor: theory and state-of-the-art
important challenge in the case of enzymatic biosensors, because a protein shell electrically
insulates the redox-active site of most enzymes [63]. Nanomaterials such as carbon-nanotubes
or nanoparticles have a promotion effect on the direct electron transfer between enzymes
and the surface of the electrode, thus obviating the need for mediators or co-substrates [64].
Owing similar dimensions of redox proteins, nanomaterials can be used for an effective elec-
trical wiring of redox enzymes [65]. Many nanomaterials have been used as intermediate
layers for integrating electrodes with biomolecules (enzymes, antibodies, etc.), to enhance the
performance of electrochemical biosensors [64, 66]. The most successful implementations of
nanomaterials are: carbon-nanotubes [67], nanowires [68, 69], nanoparticles [70], conductive
polymers or conductive polymer/nanocomposites [71, 72], graphene, graphite petals and flow-
ers [73], and hybrid composite materials. The next section will focus on carbon-nanotubes, as
they were used in the present research.
Carbon-nanotubes
Carbon-nanotubes (CNTs) have been recognized as very promising nanomaterials for enhanc-
ing electron transfer in biosensing, thanks to their electrical and electrochemical properties.
CNTs are well-ordered, hollow graphitic nanomaterials made of cylinders of sp2-hybridized
carbon atoms. CNTs can be classed as single-walled nanotubes (SWNTs), which are single
sheets of graphene ”rolled” into tubes, or multi-walled nanotubes (MWNTs), which consist of
several concentric tubes sharing a common longitudinal axis. Single- or multi-walled nature,
roll up angle, presence of imperfections in their structure, length, diameter and chemical
groups significantly affect the ensemble of CNT properties. CNTs have lengths that can vary
from several hundreds of nanometers to few millimeters, but their diameters vary upon their
class: SWNTs are 0.4–2 nm in diameter and MWNTs are 2–100 nm in diameter [74].
The favorable electrochemical properties of CNTs have been extensively exploited to enhance
sensor performance in terms of sensitivity and limit of detection (LOD), for many different
electrochemical sensing devices, ranging from enzymatic to DNA-hybridization biosensors.
The role of CNTs for the construction of novel biosensing devices has been recently reviewed
[75, 62, 76, 77, 78].
For biosensing applications, CNTs present several advantages: small size with larger surface
area, high conductivity, high chemical stability and sensitivity, high electrocatalytic effect
and a fast electron-transfer rate [79, 80, 81]. Recent studies [82, 83] have proved that CNTs
enhance the electrochemical reactivity of enzymes with retention of their biocatalytic activ-
ity. However, one of the main contributions to the enhancement of the sensor sensitivity
is due to the increase in electroactive area available for the enzyme immobilization. The
nano-tubes and enzyme molecules are of similar dimensions, which facilitates the adsorption
of the enzyme without significant loss of its biocatalytic shape, form or function [76]. Various
methods are available for the immobilization of enzymes on CNTs, as described in many
papers [83, 84, 85, 86].
The biosensors described in this thesis are based on MWCNTs. More details about the proper-
ties and fabrication of CNTs can be found in the Appendix: ”Details on CNTs”.
24
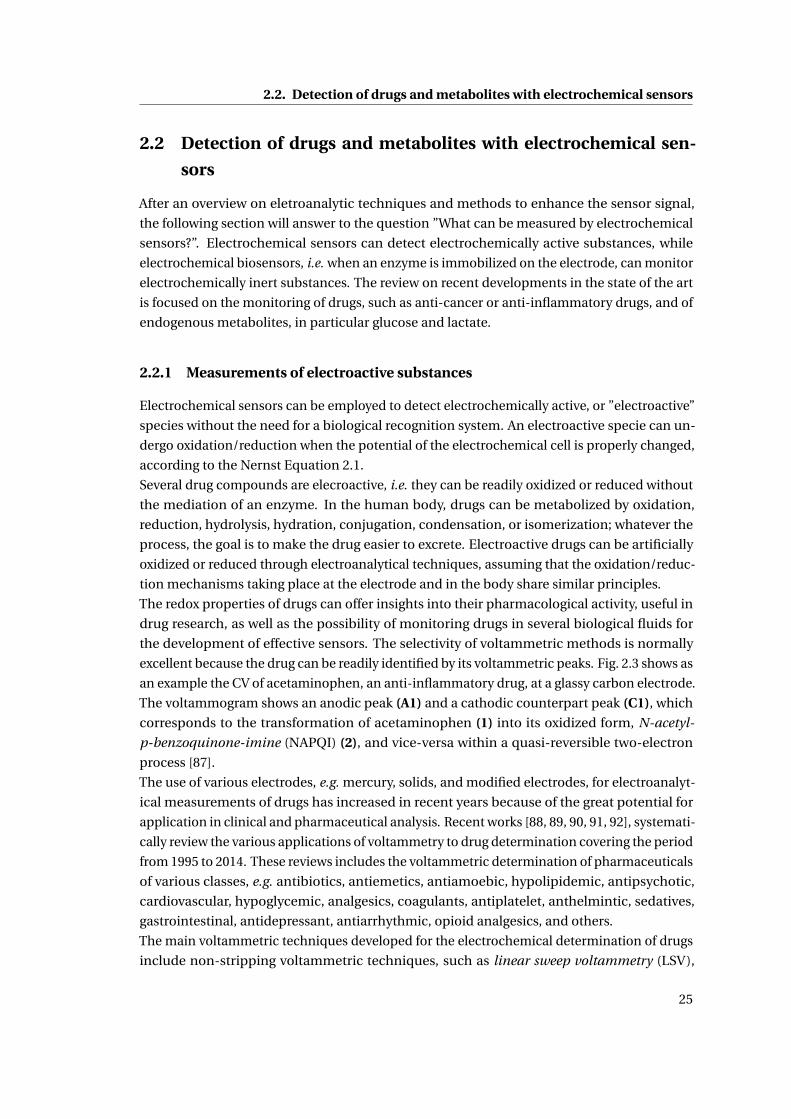
2.2. Detection of drugs and metabolites with electrochemical sensors
2.2 Detection of drugs and metabolites with electrochemical sen-
sors
After an overview on eletroanalytic techniques and methods to enhance the sensor signal,
the following section will answer to the question ”What can be measured by electrochemical
sensors?”. Electrochemical sensors can detect electrochemically active substances, while
electrochemical biosensors, i.e. when an enzyme is immobilized on the electrode, can monitor
electrochemically inert substances. The review on recent developments in the state of the art
is focused on the monitoring of drugs, such as anti-cancer or anti-inflammatory drugs, and of
endogenous metabolites, in particular glucose and lactate.
2.2.1 Measurements of electroactive substances
Electrochemical sensors can be employed to detect electrochemically active, or ”electroactive”
species without the need for a biological recognition system. An electroactive specie can un-
dergo oxidation/reduction when the potential of the electrochemical cell is properly changed,
according to the Nernst Equation 2.1.
Several drug compounds are elecroactive, i.e. they can be readily oxidized or reduced without
the mediation of an enzyme. In the human body, drugs can be metabolized by oxidation,
reduction, hydrolysis, hydration, conjugation, condensation, or isomerization; whatever the
process, the goal is to make the drug easier to excrete. Electroactive drugs can be artificially
oxidized or reduced through electroanalytical techniques, assuming that the oxidation/reduc-
tion mechanisms taking place at the electrode and in the body share similar principles.
The redox properties of drugs can offer insights into their pharmacological activity, useful in
drug research, as well as the possibility of monitoring drugs in several biological fluids for
the development of effective sensors. The selectivity of voltammetric methods is normally
excellent because the drug can be readily identified by its voltammetric peaks. Fig. 2.3 shows as
an example the CV of acetaminophen, an anti-inflammatory drug, at a glassy carbon electrode.
The voltammogram shows an anodic peak (A1) and a cathodic counterpart peak (C1), which
corresponds to the transformation of acetaminophen (1) into its oxidized form, N-acetyl-
p-benzoquinone-imine (NAPQI) (2), and vice-versa within a quasi-reversible two-electron
process [87].
The use of various electrodes, e.g. mercury, solids, and modified electrodes, for electroanalyt-
ical measurements of drugs has increased in recent years because of the great potential for
application in clinical and pharmaceutical analysis. Recent works [88, 89, 90, 91, 92], systemati-
cally review the various applications of voltammetry to drug determination covering the period
from 1995 to 2014. These reviews includes the voltammetric determination of pharmaceuticals
of various classes, e.g. antibiotics, antiemetics, antiamoebic, hypolipidemic, antipsychotic,
cardiovascular, hypoglycemic, analgesics, coagulants, antiplatelet, anthelmintic, sedatives,
gastrointestinal, antidepressant, antiarrhythmic, opioid analgesics, and others.
The main voltammetric techniques developed for the electrochemical determination of drugs
include non-stripping voltammetric techniques, such as linear sweep voltammetry (LSV),
25
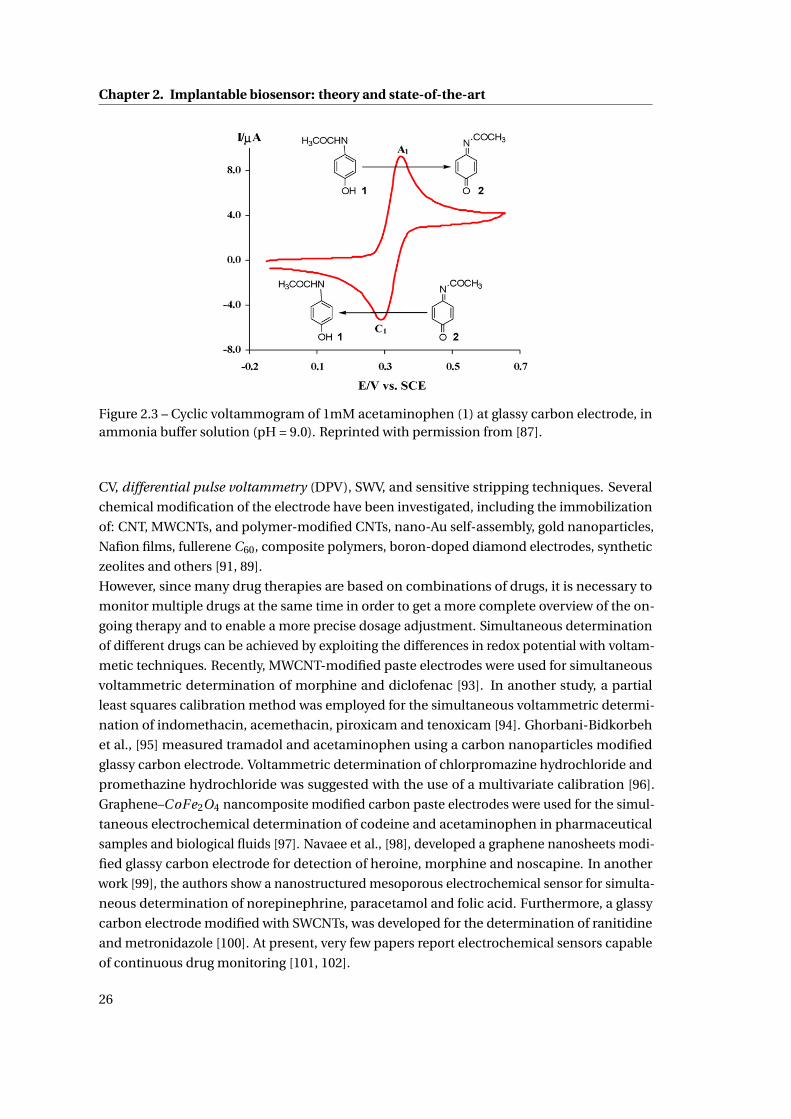
Chapter 2. Implantable biosensor: theory and state-of-the-art
Figure 2.3 – Cyclic voltammogram of 1mM acetaminophen (1) at glassy carbon electrode, inammonia buffer solution (pH = 9.0). Reprinted with permission from [87].
CV, differential pulse voltammetry (DPV), SWV, and sensitive stripping techniques. Several
chemical modification of the electrode have been investigated, including the immobilization
of: CNT, MWCNTs, and polymer-modified CNTs, nano-Au self-assembly, gold nanoparticles,
Nafion films, fullerene C60, composite polymers, boron-doped diamond electrodes, synthetic
zeolites and others [91, 89].
However, since many drug therapies are based on combinations of drugs, it is necessary to
monitor multiple drugs at the same time in order to get a more complete overview of the on-
going therapy and to enable a more precise dosage adjustment. Simultaneous determination
of different drugs can be achieved by exploiting the differences in redox potential with voltam-
metic techniques. Recently, MWCNT-modified paste electrodes were used for simultaneous
voltammetric determination of morphine and diclofenac [93]. In another study, a partial
least squares calibration method was employed for the simultaneous voltammetric determi-
nation of indomethacin, acemethacin, piroxicam and tenoxicam [94]. Ghorbani-Bidkorbeh
et al., [95] measured tramadol and acetaminophen using a carbon nanoparticles modified
glassy carbon electrode. Voltammetric determination of chlorpromazine hydrochloride and
promethazine hydrochloride was suggested with the use of a multivariate calibration [96].
Graphene–CoFe2O4 nancomposite modified carbon paste electrodes were used for the simul-
taneous electrochemical determination of codeine and acetaminophen in pharmaceutical
samples and biological fluids [97]. Navaee et al., [98], developed a graphene nanosheets modi-
fied glassy carbon electrode for detection of heroine, morphine and noscapine. In another
work [99], the authors show a nanostructured mesoporous electrochemical sensor for simulta-
neous determination of norepinephrine, paracetamol and folic acid. Furthermore, a glassy
carbon electrode modified with SWCNTs, was developed for the determination of ranitidine
and metronidazole [100]. At present, very few papers report electrochemical sensors capable
of continuous drug monitoring [101, 102].
26
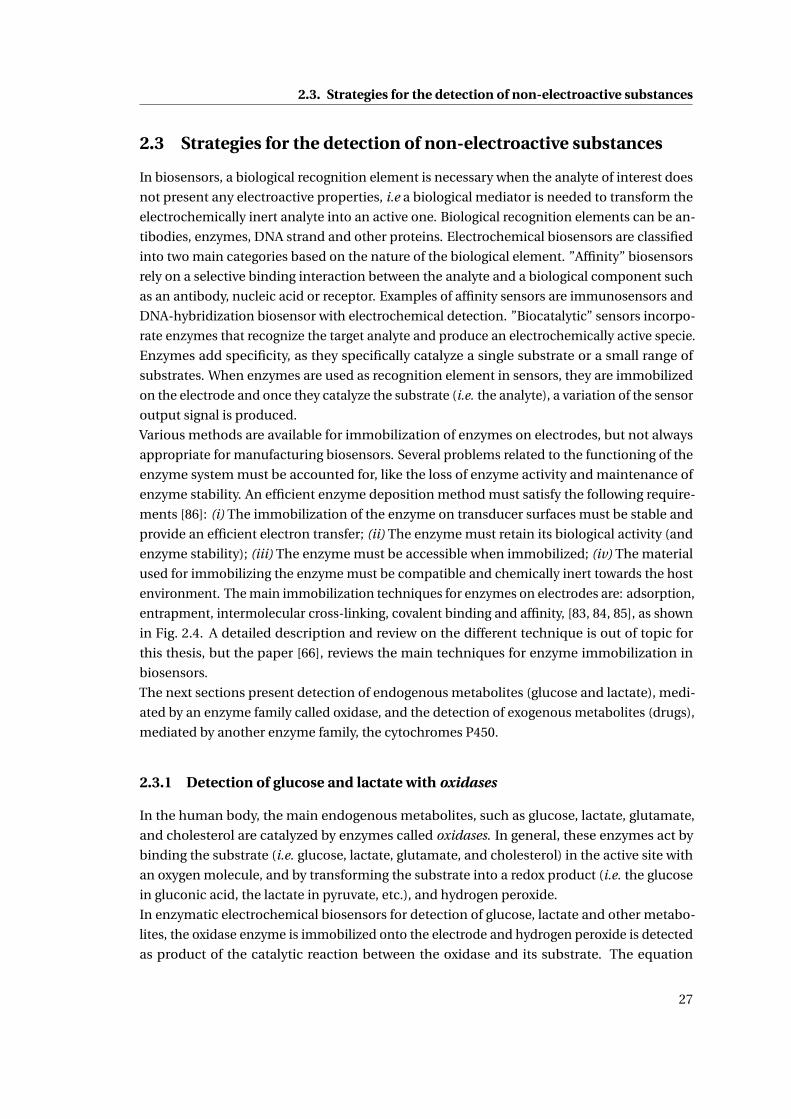
2.3. Strategies for the detection of non-electroactive substances
2.3 Strategies for the detection of non-electroactive substances
In biosensors, a biological recognition element is necessary when the analyte of interest does
not present any electroactive properties, i.e a biological mediator is needed to transform the
electrochemically inert analyte into an active one. Biological recognition elements can be an-
tibodies, enzymes, DNA strand and other proteins. Electrochemical biosensors are classified
into two main categories based on the nature of the biological element. ”Affinity” biosensors
rely on a selective binding interaction between the analyte and a biological component such
as an antibody, nucleic acid or receptor. Examples of affinity sensors are immunosensors and
DNA-hybridization biosensor with electrochemical detection. ”Biocatalytic” sensors incorpo-
rate enzymes that recognize the target analyte and produce an electrochemically active specie.
Enzymes add specificity, as they specifically catalyze a single substrate or a small range of
substrates. When enzymes are used as recognition element in sensors, they are immobilized
on the electrode and once they catalyze the substrate (i.e. the analyte), a variation of the sensor
output signal is produced.
Various methods are available for immobilization of enzymes on electrodes, but not always
appropriate for manufacturing biosensors. Several problems related to the functioning of the
enzyme system must be accounted for, like the loss of enzyme activity and maintenance of
enzyme stability. An efficient enzyme deposition method must satisfy the following require-
ments [86]: (i) The immobilization of the enzyme on transducer surfaces must be stable and
provide an efficient electron transfer; (ii) The enzyme must retain its biological activity (and
enzyme stability); (iii) The enzyme must be accessible when immobilized; (iv) The material
used for immobilizing the enzyme must be compatible and chemically inert towards the host
environment. The main immobilization techniques for enzymes on electrodes are: adsorption,
entrapment, intermolecular cross-linking, covalent binding and affinity, [83, 84, 85], as shown
in Fig. 2.4. A detailed description and review on the different technique is out of topic for
this thesis, but the paper [66], reviews the main techniques for enzyme immobilization in
biosensors.
The next sections present detection of endogenous metabolites (glucose and lactate), medi-
ated by an enzyme family called oxidase, and the detection of exogenous metabolites (drugs),
mediated by another enzyme family, the cytochromes P450.
2.3.1 Detection of glucose and lactate with oxidases
In the human body, the main endogenous metabolites, such as glucose, lactate, glutamate,
and cholesterol are catalyzed by enzymes called oxidases. In general, these enzymes act by
binding the substrate (i.e. glucose, lactate, glutamate, and cholesterol) in the active site with
an oxygen molecule, and by transforming the substrate into a redox product (i.e. the glucose
in gluconic acid, the lactate in pyruvate, etc.), and hydrogen peroxide.
In enzymatic electrochemical biosensors for detection of glucose, lactate and other metabo-
lites, the oxidase enzyme is immobilized onto the electrode and hydrogen peroxide is detected
as product of the catalytic reaction between the oxidase and its substrate. The equation
27
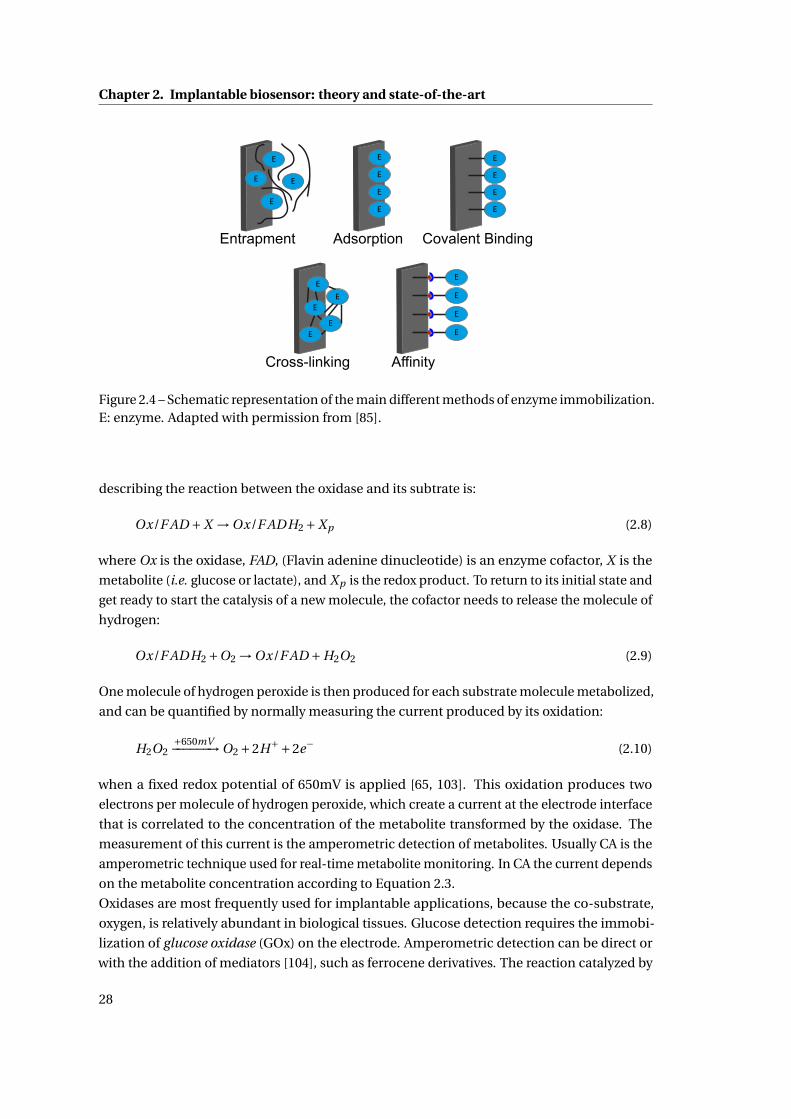
Chapter 2. Implantable biosensor: theory and state-of-the-art
EE
E
EE
E
E
E
E
E
E
E
E
EE
E
E
E
E
E
E
Entrapment Adsorption Covalent Binding
Cross-linking Affinity
Figure 2.4 – Schematic representation of the main different methods of enzyme immobilization.E: enzyme. Adapted with permission from [85].
describing the reaction between the oxidase and its subtrate is:
Ox/F AD +X →Ox/F AD H2 +Xp (2.8)
where Ox is the oxidase, FAD, (Flavin adenine dinucleotide) is an enzyme cofactor, X is the
metabolite (i.e. glucose or lactate), and Xp is the redox product. To return to its initial state and
get ready to start the catalysis of a new molecule, the cofactor needs to release the molecule of
hydrogen:
Ox/F AD H2 +O2 →Ox/F AD +H2O2 (2.9)
One molecule of hydrogen peroxide is then produced for each substrate molecule metabolized,
and can be quantified by normally measuring the current produced by its oxidation:
H2O2+650mV−−−−−−→O2 +2H++2e− (2.10)
when a fixed redox potential of 650mV is applied [65, 103]. This oxidation produces two
electrons per molecule of hydrogen peroxide, which create a current at the electrode interface
that is correlated to the concentration of the metabolite transformed by the oxidase. The
measurement of this current is the amperometric detection of metabolites. Usually CA is the
amperometric technique used for real-time metabolite monitoring. In CA the current depends
on the metabolite concentration according to Equation 2.3.
Oxidases are most frequently used for implantable applications, because the co-substrate,
oxygen, is relatively abundant in biological tissues. Glucose detection requires the immobi-
lization of glucose oxidase (GOx) on the electrode. Amperometric detection can be direct or
with the addition of mediators [104], such as ferrocene derivatives. The reaction catalyzed by
28
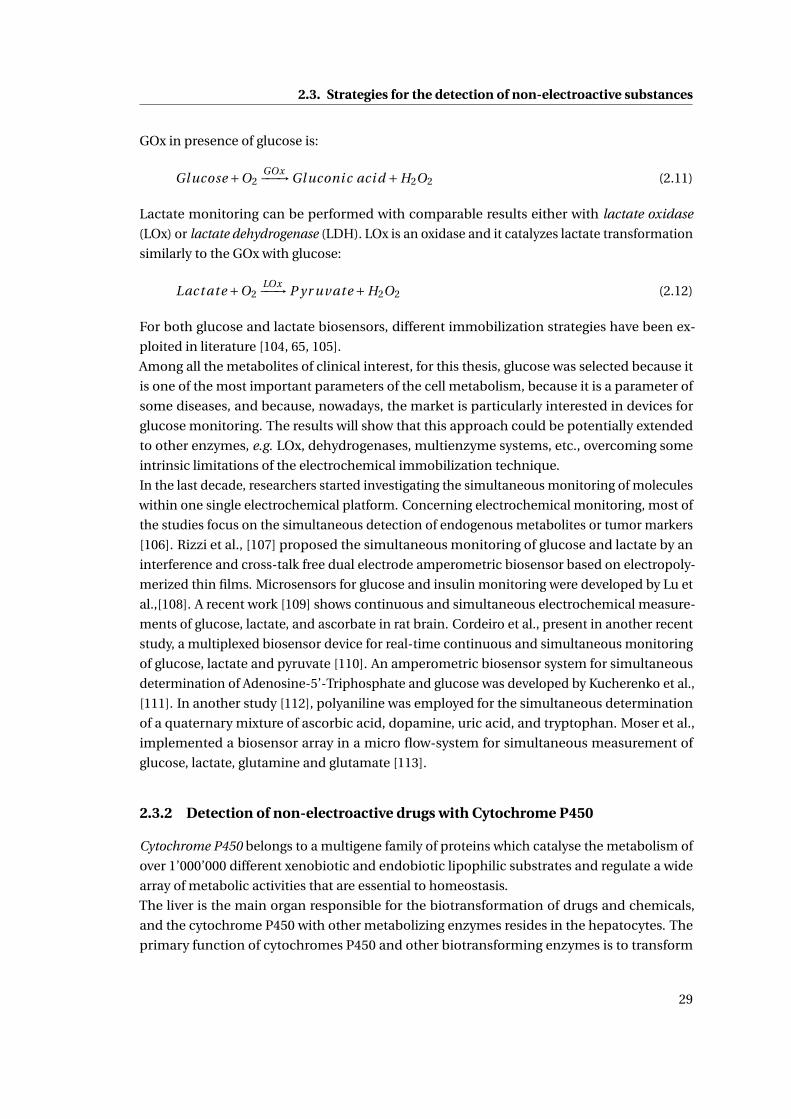
2.3. Strategies for the detection of non-electroactive substances
GOx in presence of glucose is:
Gl ucose +O2GOx−−−→Gl uconi c aci d +H2O2 (2.11)
Lactate monitoring can be performed with comparable results either with lactate oxidase
(LOx) or lactate dehydrogenase (LDH). LOx is an oxidase and it catalyzes lactate transformation
similarly to the GOx with glucose:
Lact ate +O2LOx−−−→ P yr uvate +H2O2 (2.12)
For both glucose and lactate biosensors, different immobilization strategies have been ex-
ploited in literature [104, 65, 105].
Among all the metabolites of clinical interest, for this thesis, glucose was selected because it
is one of the most important parameters of the cell metabolism, because it is a parameter of
some diseases, and because, nowadays, the market is particularly interested in devices for
glucose monitoring. The results will show that this approach could be potentially extended
to other enzymes, e.g. LOx, dehydrogenases, multienzyme systems, etc., overcoming some
intrinsic limitations of the electrochemical immobilization technique.
In the last decade, researchers started investigating the simultaneous monitoring of molecules
within one single electrochemical platform. Concerning electrochemical monitoring, most of
the studies focus on the simultaneous detection of endogenous metabolites or tumor markers
[106]. Rizzi et al., [107] proposed the simultaneous monitoring of glucose and lactate by an
interference and cross-talk free dual electrode amperometric biosensor based on electropoly-
merized thin films. Microsensors for glucose and insulin monitoring were developed by Lu et
al.,[108]. A recent work [109] shows continuous and simultaneous electrochemical measure-
ments of glucose, lactate, and ascorbate in rat brain. Cordeiro et al., present in another recent
study, a multiplexed biosensor device for real-time continuous and simultaneous monitoring
of glucose, lactate and pyruvate [110]. An amperometric biosensor system for simultaneous
determination of Adenosine-5’-Triphosphate and glucose was developed by Kucherenko et al.,
[111]. In another study [112], polyaniline was employed for the simultaneous determination
of a quaternary mixture of ascorbic acid, dopamine, uric acid, and tryptophan. Moser et al.,
implemented a biosensor array in a micro flow-system for simultaneous measurement of
glucose, lactate, glutamine and glutamate [113].
2.3.2 Detection of non-electroactive drugs with Cytochrome P450
Cytochrome P450 belongs to a multigene family of proteins which catalyse the metabolism of
over 1’000’000 different xenobiotic and endobiotic lipophilic substrates and regulate a wide
array of metabolic activities that are essential to homeostasis.
The liver is the main organ responsible for the biotransformation of drugs and chemicals,
and the cytochrome P450 with other metabolizing enzymes resides in the hepatocytes. The
primary function of cytochromes P450 and other biotransforming enzymes is to transform
29
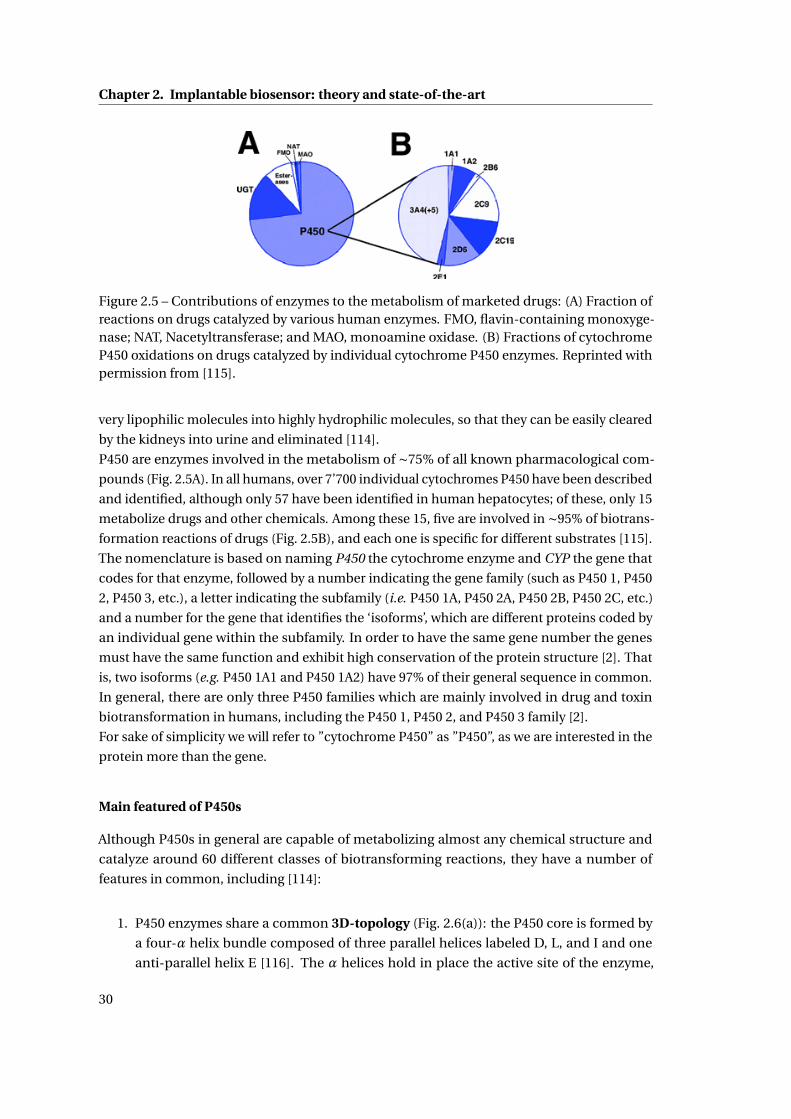
Chapter 2. Implantable biosensor: theory and state-of-the-art
Figure 2.5 – Contributions of enzymes to the metabolism of marketed drugs: (A) Fraction ofreactions on drugs catalyzed by various human enzymes. FMO, flavin-containing monoxyge-nase; NAT, Nacetyltransferase; and MAO, monoamine oxidase. (B) Fractions of cytochromeP450 oxidations on drugs catalyzed by individual cytochrome P450 enzymes. Reprinted withpermission from [115].
very lipophilic molecules into highly hydrophilic molecules, so that they can be easily cleared
by the kidneys into urine and eliminated [114].
P450 are enzymes involved in the metabolism of ∼75% of all known pharmacological com-
pounds (Fig. 2.5A). In all humans, over 7’700 individual cytochromes P450 have been described
and identified, although only 57 have been identified in human hepatocytes; of these, only 15
metabolize drugs and other chemicals. Among these 15, five are involved in ∼95% of biotrans-
formation reactions of drugs (Fig. 2.5B), and each one is specific for different substrates [115].
The nomenclature is based on naming P450 the cytochrome enzyme and CYP the gene that
codes for that enzyme, followed by a number indicating the gene family (such as P450 1, P450
2, P450 3, etc.), a letter indicating the subfamily (i.e. P450 1A, P450 2A, P450 2B, P450 2C, etc.)
and a number for the gene that identifies the ‘isoforms’, which are different proteins coded by
an individual gene within the subfamily. In order to have the same gene number the genes
must have the same function and exhibit high conservation of the protein structure [2]. That
is, two isoforms (e.g. P450 1A1 and P450 1A2) have 97% of their general sequence in common.
In general, there are only three P450 families which are mainly involved in drug and toxin
biotransformation in humans, including the P450 1, P450 2, and P450 3 family [2].
For sake of simplicity we will refer to ”cytochrome P450” as ”P450”, as we are interested in the
protein more than the gene.
Main featured of P450s
Although P450s in general are capable of metabolizing almost any chemical structure and
catalyze around 60 different classes of biotransforming reactions, they have a number of
features in common, including [114]:
1. P450 enzymes share a common 3D-topology (Fig. 2.6(a)): the P450 core is formed by
a four-α helix bundle composed of three parallel helices labeled D, L, and I and one
anti-parallel helix E [116]. The α helices hold in place the active site of the enzyme,
30
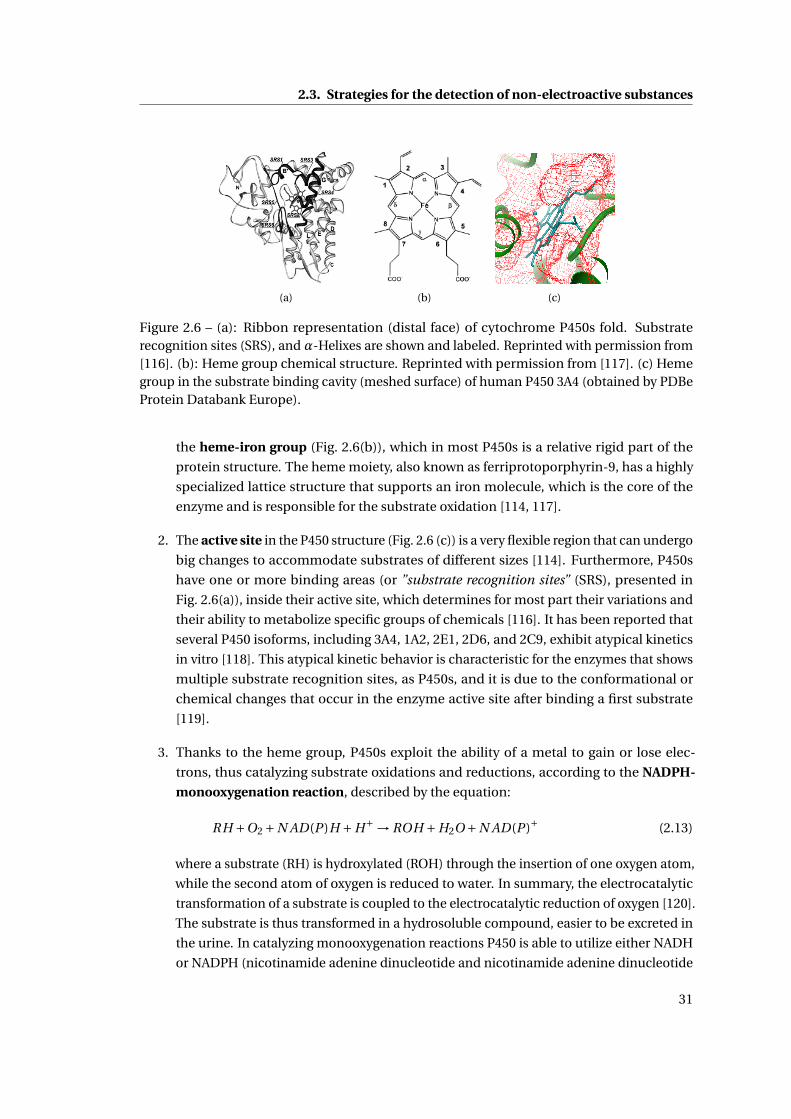
2.3. Strategies for the detection of non-electroactive substances
(a) (b) (c)
Figure 2.6 – (a): Ribbon representation (distal face) of cytochrome P450s fold. Substraterecognition sites (SRS), and α-Helixes are shown and labeled. Reprinted with permission from[116]. (b): Heme group chemical structure. Reprinted with permission from [117]. (c) Hemegroup in the substrate binding cavity (meshed surface) of human P450 3A4 (obtained by PDBeProtein Databank Europe).
the heme-iron group (Fig. 2.6(b)), which in most P450s is a relative rigid part of the
protein structure. The heme moiety, also known as ferriprotoporphyrin-9, has a highly
specialized lattice structure that supports an iron molecule, which is the core of the
enzyme and is responsible for the substrate oxidation [114, 117].
2. The active site in the P450 structure (Fig. 2.6 (c)) is a very flexible region that can undergo
big changes to accommodate substrates of different sizes [114]. Furthermore, P450s
have one or more binding areas (or ”substrate recognition sites” (SRS), presented in
Fig. 2.6(a)), inside their active site, which determines for most part their variations and
their ability to metabolize specific groups of chemicals [116]. It has been reported that
several P450 isoforms, including 3A4, 1A2, 2E1, 2D6, and 2C9, exhibit atypical kinetics
in vitro [118]. This atypical kinetic behavior is characteristic for the enzymes that shows
multiple substrate recognition sites, as P450s, and it is due to the conformational or
chemical changes that occur in the enzyme active site after binding a first substrate
[119].
3. Thanks to the heme group, P450s exploit the ability of a metal to gain or lose elec-
trons, thus catalyzing substrate oxidations and reductions, according to the NADPH-
monooxygenation reaction, described by the equation:
RH +O2 +N AD(P )H +H+ → ROH +H2O +N AD(P )+ (2.13)
where a substrate (RH) is hydroxylated (ROH) through the insertion of one oxygen atom,
while the second atom of oxygen is reduced to water. In summary, the electrocatalytic
transformation of a substrate is coupled to the electrocatalytic reduction of oxygen [120].
The substrate is thus transformed in a hydrosoluble compound, easier to be excreted in
the urine. In catalyzing monooxygenation reactions P450 is able to utilize either NADH
or NADPH (nicotinamide adenine dinucleotide and nicotinamide adenine dinucleotide
31
Chapter 2. Implantable biosensor: theory and state-of-the-art
(a) (b)
Figure 2.7 – (a): Relationship of POR to a microsomal P450 enzyme. ER is the endoplasmicreticulum and CYTO is the cytoplasm. Reprinted with permission from [121]. (b): Cytochromeb5 structure (from PDBe Protein Data Bank Europe).
phosphate, respectively) as electron donors (Equation 2.13).
4. All P450s have closely associated redox partners, the cytochrome b5 and P450 oxidore-
ductase (POR), able to supply them with electrons for their catalytic activities. POR is
a flavoprotein complex, that binds two flavins, FAD (flavin adenine dinucleotide) and
FMN (flavin mononucleotide), which act as electron carriers. POR complex operates
as follows (Fig. 2.7 (a)): the electrons from the transformation of the cellular NADPH
to NADP+, are taken up by the FAD moiety, which is reduced to FADH2. Then FADH2
reduces FMN to FMNH2, which in turn passes its two electrons to the P450 heme group
[121]. Cytochrome b5 (Fig. 2.7 (b)) is an electron transport heme-protein that, similarly
to P450, is built around a central heme group. In nature this protein converts in the cells
NADH to NAD+, building up proton gradients which stimulate the flow of electrons
[114].
5. The overall reaction of Eq. 2.13, in reality is a quite complex catalytic cycle, reported
in Fig. 2.8. In this cycle, RH is the P450 substrate, while ROH is its the oxidised form.
The first step is the substrate (RH) binding to the P450 active site (2) followed by the
first electron transfer, that causes the reduction of the ferric heme (Fe3+ to Fe2+), (3).
The introduction of oxygen activates the heme group and induces the creation of an
intermediate, the oxy-P450 complex, (4). The second electron transfer, which is the
rate limiting step of the cycle, generates a peroxo-ferric intermediate (5a), and then
its protonated form hydroperoxo-ferric intermediate (5b). It follows the heterolysis
of the O −O bond that causes the release of a water molecule and the creation of a
highly active Iron(IV)-oxo ferryl intermediate (6). This reactive intermediate forces the
transfer of an oxygen atom into the substrate that leads to the formation and release
of the ROH product (7), with the regeneration of the initial state of the heme group (1)
[115]. The three abortive reactions ”shunts” shown in Fig. 2.8, are due to some instable
intermediates that lead to substrate dissociation, production of intermediary products
with the regeneration of the active site to the initial condition, step (1).
32
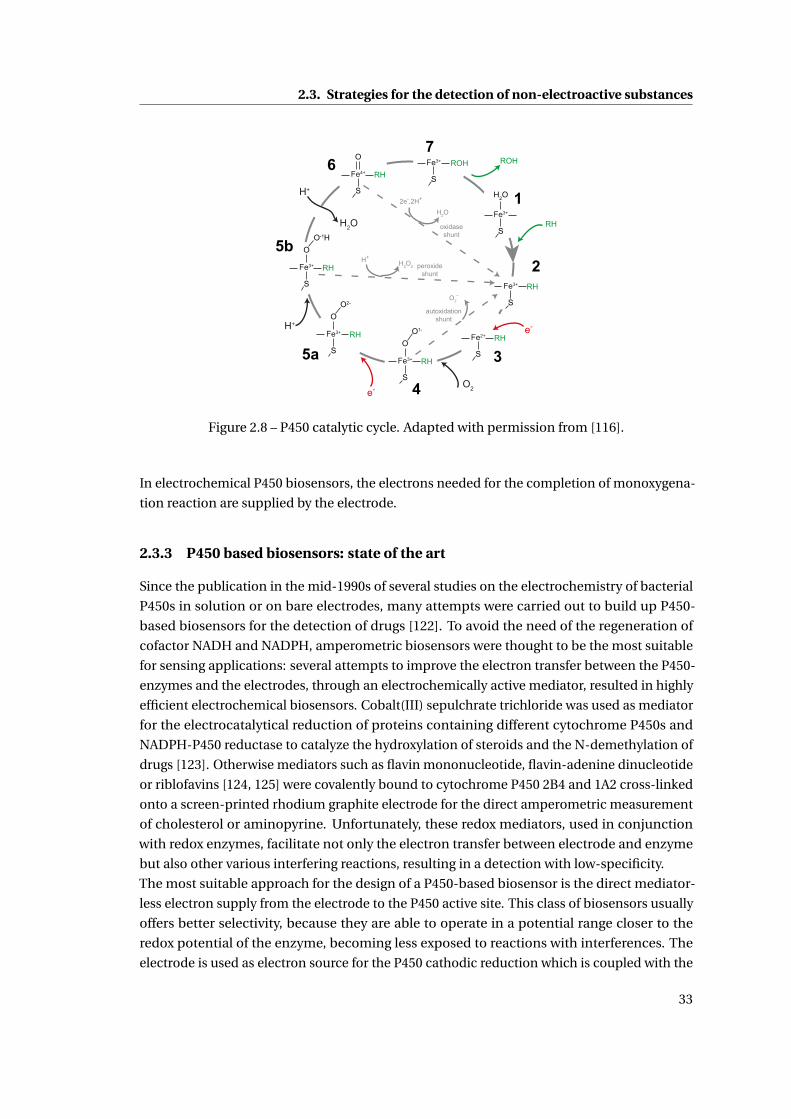
2.3. Strategies for the detection of non-electroactive substances
RH
e-
Fe3+
S
H2O
Fe3+
S
RH
1
2
Fe2+
S
RH
3Fe3+
S
RH
OO1-
4
Fe3+
S
RH
OO2-
5a
O2e-
Fe3+
S
RH
OO-1H
5b
H+
Fe4+
S
RH
O6H+
H2O
Fe3+
S
ROH
7ROH
2e-,2H+
H2O
oxidaseshunt
H+H2O2 peroxide
shunt
O2-
autoxidationshunt
Figure 2.8 – P450 catalytic cycle. Adapted with permission from [116].
In electrochemical P450 biosensors, the electrons needed for the completion of monoxygena-
tion reaction are supplied by the electrode.
2.3.3 P450 based biosensors: state of the art
Since the publication in the mid-1990s of several studies on the electrochemistry of bacterial
P450s in solution or on bare electrodes, many attempts were carried out to build up P450-
based biosensors for the detection of drugs [122]. To avoid the need of the regeneration of
cofactor NADH and NADPH, amperometric biosensors were thought to be the most suitable
for sensing applications: several attempts to improve the electron transfer between the P450-
enzymes and the electrodes, through an electrochemically active mediator, resulted in highly
efficient electrochemical biosensors. Cobalt(III) sepulchrate trichloride was used as mediator
for the electrocatalytical reduction of proteins containing different cytochrome P450s and
NADPH-P450 reductase to catalyze the hydroxylation of steroids and the N-demethylation of
drugs [123]. Otherwise mediators such as flavin mononucleotide, flavin-adenine dinucleotide
or riblofavins [124, 125] were covalently bound to cytochrome P450 2B4 and 1A2 cross-linked
onto a screen-printed rhodium graphite electrode for the direct amperometric measurement
of cholesterol or aminopyrine. Unfortunately, these redox mediators, used in conjunction
with redox enzymes, facilitate not only the electron transfer between electrode and enzyme
but also other various interfering reactions, resulting in a detection with low-specificity.
The most suitable approach for the design of a P450-based biosensor is the direct mediator-
less electron supply from the electrode to the P450 active site. This class of biosensors usually
offers better selectivity, because they are able to operate in a potential range closer to the
redox potential of the enzyme, becoming less exposed to reactions with interferences. The
electrode is used as electron source for the P450 cathodic reduction which is coupled with the
33
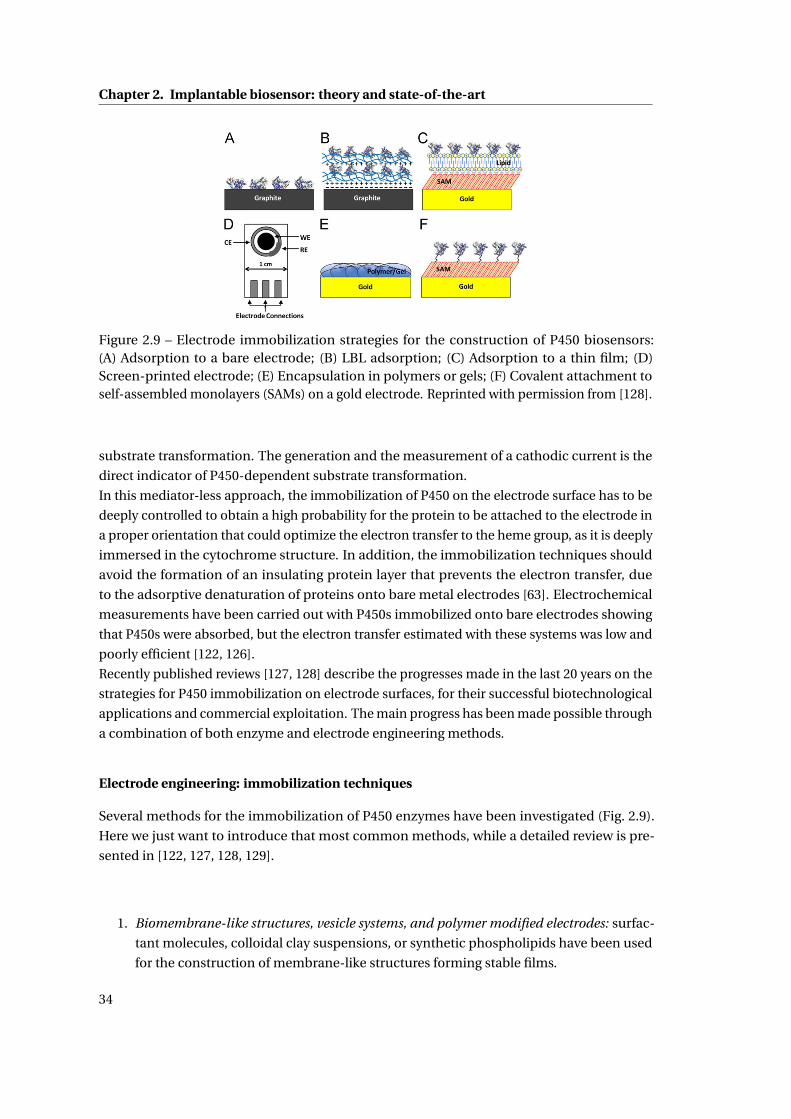
Chapter 2. Implantable biosensor: theory and state-of-the-art
Figure 2.9 – Electrode immobilization strategies for the construction of P450 biosensors:(A) Adsorption to a bare electrode; (B) LBL adsorption; (C) Adsorption to a thin film; (D)Screen-printed electrode; (E) Encapsulation in polymers or gels; (F) Covalent attachment toself-assembled monolayers (SAMs) on a gold electrode. Reprinted with permission from [128].
substrate transformation. The generation and the measurement of a cathodic current is the
direct indicator of P450-dependent substrate transformation.
In this mediator-less approach, the immobilization of P450 on the electrode surface has to be
deeply controlled to obtain a high probability for the protein to be attached to the electrode in
a proper orientation that could optimize the electron transfer to the heme group, as it is deeply
immersed in the cytochrome structure. In addition, the immobilization techniques should
avoid the formation of an insulating protein layer that prevents the electron transfer, due
to the adsorptive denaturation of proteins onto bare metal electrodes [63]. Electrochemical
measurements have been carried out with P450s immobilized onto bare electrodes showing
that P450s were absorbed, but the electron transfer estimated with these systems was low and
poorly efficient [122, 126].
Recently published reviews [127, 128] describe the progresses made in the last 20 years on the
strategies for P450 immobilization on electrode surfaces, for their successful biotechnological
applications and commercial exploitation. The main progress has been made possible through
a combination of both enzyme and electrode engineering methods.
Electrode engineering: immobilization techniques
Several methods for the immobilization of P450 enzymes have been investigated (Fig. 2.9).
Here we just want to introduce that most common methods, while a detailed review is pre-
sented in [122, 127, 128, 129].
1. Biomembrane-like structures, vesicle systems, and polymer modified electrodes: surfac-
tant molecules, colloidal clay suspensions, or synthetic phospholipids have been used
for the construction of membrane-like structures forming stable films.
34
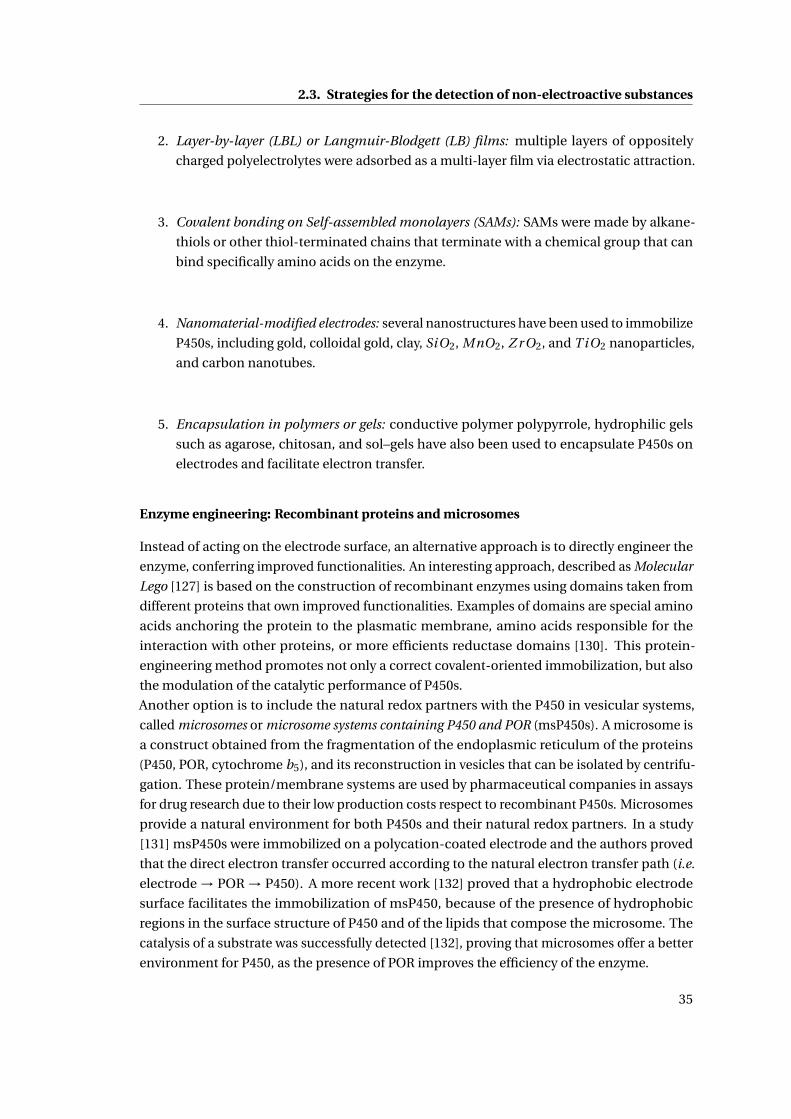
2.3. Strategies for the detection of non-electroactive substances
2. Layer-by-layer (LBL) or Langmuir-Blodgett (LB) films: multiple layers of oppositely
charged polyelectrolytes were adsorbed as a multi-layer film via electrostatic attraction.
3. Covalent bonding on Self-assembled monolayers (SAMs): SAMs were made by alkane-
thiols or other thiol-terminated chains that terminate with a chemical group that can
bind specifically amino acids on the enzyme.
4. Nanomaterial-modified electrodes: several nanostructures have been used to immobilize
P450s, including gold, colloidal gold, clay, SiO2, MnO2, Z r O2, and T iO2 nanoparticles,
and carbon nanotubes.
5. Encapsulation in polymers or gels: conductive polymer polypyrrole, hydrophilic gels
such as agarose, chitosan, and sol–gels have also been used to encapsulate P450s on
electrodes and facilitate electron transfer.
Enzyme engineering: Recombinant proteins and microsomes
Instead of acting on the electrode surface, an alternative approach is to directly engineer the
enzyme, conferring improved functionalities. An interesting approach, described as Molecular
Lego [127] is based on the construction of recombinant enzymes using domains taken from
different proteins that own improved functionalities. Examples of domains are special amino
acids anchoring the protein to the plasmatic membrane, amino acids responsible for the
interaction with other proteins, or more efficients reductase domains [130]. This protein-
engineering method promotes not only a correct covalent-oriented immobilization, but also
the modulation of the catalytic performance of P450s.
Another option is to include the natural redox partners with the P450 in vesicular systems,
called microsomes or microsome systems containing P450 and POR (msP450s). A microsome is
a construct obtained from the fragmentation of the endoplasmic reticulum of the proteins
(P450, POR, cytochrome b5), and its reconstruction in vesicles that can be isolated by centrifu-
gation. These protein/membrane systems are used by pharmaceutical companies in assays
for drug research due to their low production costs respect to recombinant P450s. Microsomes
provide a natural environment for both P450s and their natural redox partners. In a study
[131] msP450s were immobilized on a polycation-coated electrode and the authors proved
that the direct electron transfer occurred according to the natural electron transfer path (i.e.
electrode → POR → P450). A more recent work [132] proved that a hydrophobic electrode
surface facilitates the immobilization of msP450, because of the presence of hydrophobic
regions in the surface structure of P450 and of the lipids that compose the microsome. The
catalysis of a substrate was successfully detected [132], proving that microsomes offer a better
environment for P450, as the presence of POR improves the efficiency of the enzyme.
35
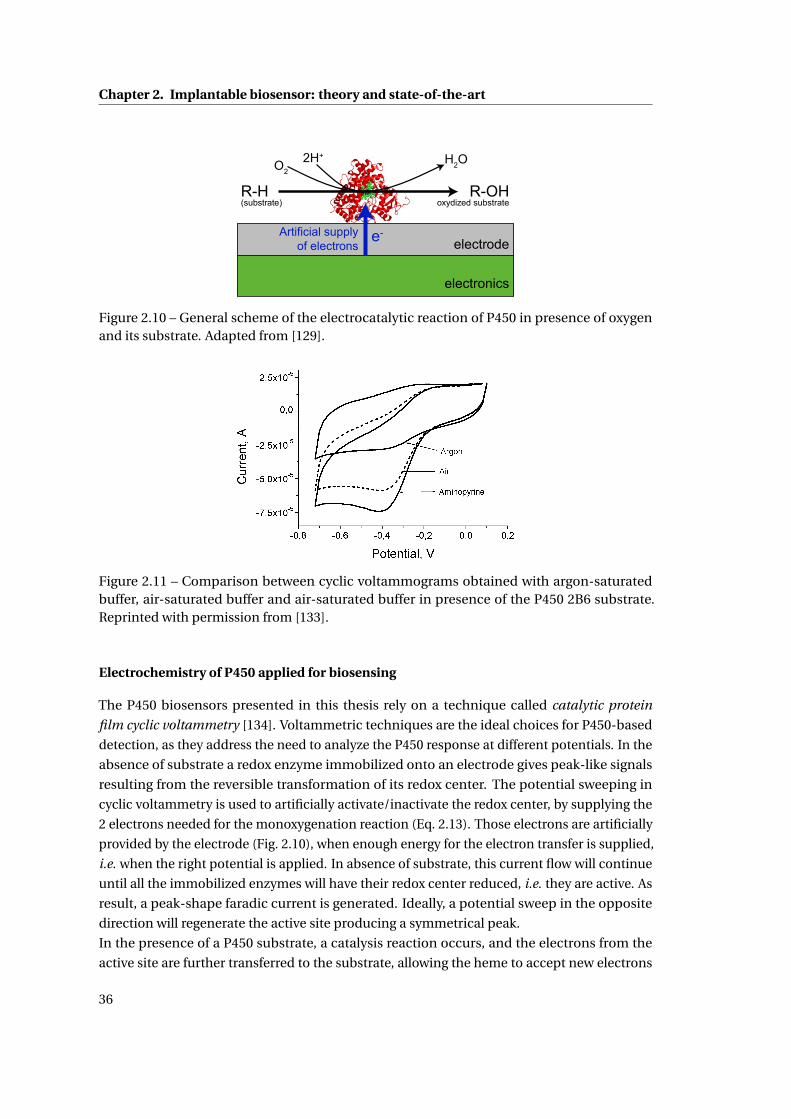
Chapter 2. Implantable biosensor: theory and state-of-the-art
R-H(substrate)
H2O
R-OHoxydized substrate
O22H+
e-electrode
Artificial supply of electrons
electronics
Figure 2.10 – General scheme of the electrocatalytic reaction of P450 in presence of oxygenand its substrate. Adapted from [129].
Figure 2.11 – Comparison between cyclic voltammograms obtained with argon-saturatedbuffer, air-saturated buffer and air-saturated buffer in presence of the P450 2B6 substrate.Reprinted with permission from [133].
Electrochemistry of P450 applied for biosensing
The P450 biosensors presented in this thesis rely on a technique called catalytic protein
film cyclic voltammetry [134]. Voltammetric techniques are the ideal choices for P450-based
detection, as they address the need to analyze the P450 response at different potentials. In the
absence of substrate a redox enzyme immobilized onto an electrode gives peak-like signals
resulting from the reversible transformation of its redox center. The potential sweeping in
cyclic voltammetry is used to artificially activate/inactivate the redox center, by supplying the
2 electrons needed for the monoxygenation reaction (Eq. 2.13). Those electrons are artificially
provided by the electrode (Fig. 2.10), when enough energy for the electron transfer is supplied,
i.e. when the right potential is applied. In absence of substrate, this current flow will continue
until all the immobilized enzymes will have their redox center reduced, i.e. they are active. As
result, a peak-shape faradic current is generated. Ideally, a potential sweep in the opposite
direction will regenerate the active site producing a symmetrical peak.
In the presence of a P450 substrate, a catalysis reaction occurs, and the electrons from the
active site are further transferred to the substrate, allowing the heme to accept new electrons
36
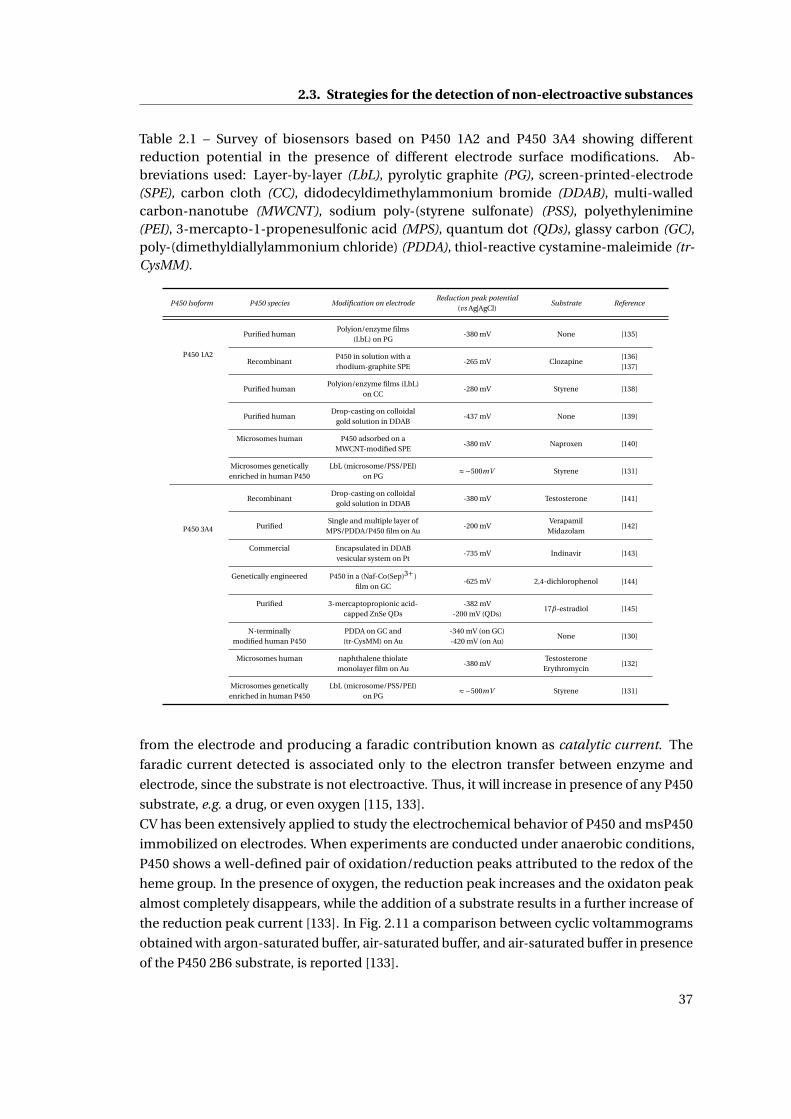
2.3. Strategies for the detection of non-electroactive substances
Table 2.1 – Survey of biosensors based on P450 1A2 and P450 3A4 showing differentreduction potential in the presence of different electrode surface modifications. Ab-breviations used: Layer-by-layer (LbL), pyrolytic graphite (PG), screen-printed-electrode(SPE), carbon cloth (CC), didodecyldimethylammonium bromide (DDAB), multi-walledcarbon-nanotube (MWCNT), sodium poly-(styrene sulfonate) (PSS), polyethylenimine(PEI), 3-mercapto-1-propenesulfonic acid (MPS), quantum dot (QDs), glassy carbon (GC),poly-(dimethyldiallylammonium chloride) (PDDA), thiol-reactive cystamine-maleimide (tr-CysMM).
P450 Isoform P450 species Modification on electrodeReduction peak potential
Substrate Reference(vs Ag|AgCl)
P450 1A2
Purified humanPolyion/enzyme films
-380 mV None [135](LbL) on PG
RecombinantP450 in solution with a
-265 mV Clozapine[136]
rhodium-graphite SPE [137]
Purified humanPolyion/enzyme films (LbL)
-280 mV Styrene [138]on CC
Purified humanDrop-casting on colloidal
-437 mV None [139]gold solution in DDAB
Microsomes human P450 adsorbed on a-380 mV Naproxen [140]
MWCNT-modified SPE
Microsomes genetically LbL (microsome/PSS/PEI) ≈−500mV Styrene [131]enriched in human P450 on PG
P450 3A4
RecombinantDrop-casting on colloidal
-380 mV Testosterone [141]gold solution in DDAB
PurifiedSingle and multiple layer of
-200 mVVerapamil
[142]MPS/PDDA/P450 film on Au Midazolam
Commercial Encapsulated in DDAB-735 mV Indinavir [143]
vesicular system on Pt
Genetically engineered P450 in a (Naf-Co(Sep)3+)-625 mV 2,4-dichlorophenol [144]
film on GC
Purified 3-mercaptopropionic acid- -382 mV17β-estradiol [145]
capped ZnSe QDs -200 mV (QDs)
N-terminally PDDA on GC and -340 mV (on GC)None [130]
modified human P450 (tr-CysMM) on Au -420 mV (on Au)
Microsomes human naphthalene thiolate-380 mV
Testosterone[132]
monolayer film on Au Erythromycin
Microsomes genetically LbL (microsome/PSS/PEI) ≈−500mV Styrene [131]enriched in human P450 on PG
from the electrode and producing a faradic contribution known as catalytic current. The
faradic current detected is associated only to the electron transfer between enzyme and
electrode, since the substrate is not electroactive. Thus, it will increase in presence of any P450
substrate, e.g. a drug, or even oxygen [115, 133].
CV has been extensively applied to study the electrochemical behavior of P450 and msP450
immobilized on electrodes. When experiments are conducted under anaerobic conditions,
P450 shows a well-defined pair of oxidation/reduction peaks attributed to the redox of the
heme group. In the presence of oxygen, the reduction peak increases and the oxidaton peak
almost completely disappears, while the addition of a substrate results in a further increase of
the reduction peak current [133]. In Fig. 2.11 a comparison between cyclic voltammograms
obtained with argon-saturated buffer, air-saturated buffer, and air-saturated buffer in presence
of the P450 2B6 substrate, is reported [133].
37
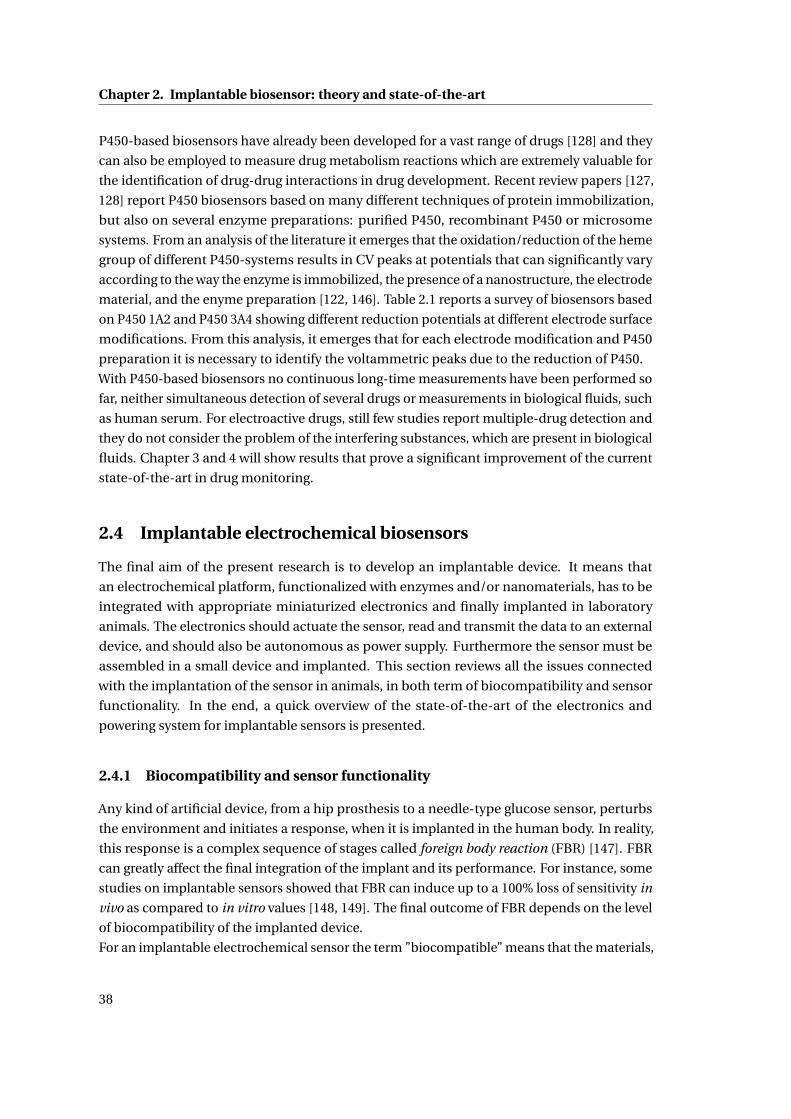
Chapter 2. Implantable biosensor: theory and state-of-the-art
P450-based biosensors have already been developed for a vast range of drugs [128] and they
can also be employed to measure drug metabolism reactions which are extremely valuable for
the identification of drug-drug interactions in drug development. Recent review papers [127,
128] report P450 biosensors based on many different techniques of protein immobilization,
but also on several enzyme preparations: purified P450, recombinant P450 or microsome
systems. From an analysis of the literature it emerges that the oxidation/reduction of the heme
group of different P450-systems results in CV peaks at potentials that can significantly vary
according to the way the enzyme is immobilized, the presence of a nanostructure, the electrode
material, and the enyme preparation [122, 146]. Table 2.1 reports a survey of biosensors based
on P450 1A2 and P450 3A4 showing different reduction potentials at different electrode surface
modifications. From this analysis, it emerges that for each electrode modification and P450
preparation it is necessary to identify the voltammetric peaks due to the reduction of P450.
With P450-based biosensors no continuous long-time measurements have been performed so
far, neither simultaneous detection of several drugs or measurements in biological fluids, such
as human serum. For electroactive drugs, still few studies report multiple-drug detection and
they do not consider the problem of the interfering substances, which are present in biological
fluids. Chapter 3 and 4 will show results that prove a significant improvement of the current
state-of-the-art in drug monitoring.
2.4 Implantable electrochemical biosensors
The final aim of the present research is to develop an implantable device. It means that
an electrochemical platform, functionalized with enzymes and/or nanomaterials, has to be
integrated with appropriate miniaturized electronics and finally implanted in laboratory
animals. The electronics should actuate the sensor, read and transmit the data to an external
device, and should also be autonomous as power supply. Furthermore the sensor must be
assembled in a small device and implanted. This section reviews all the issues connected
with the implantation of the sensor in animals, in both term of biocompatibility and sensor
functionality. In the end, a quick overview of the state-of-the-art of the electronics and
powering system for implantable sensors is presented.
2.4.1 Biocompatibility and sensor functionality
Any kind of artificial device, from a hip prosthesis to a needle-type glucose sensor, perturbs
the environment and initiates a response, when it is implanted in the human body. In reality,
this response is a complex sequence of stages called foreign body reaction (FBR) [147]. FBR
can greatly affect the final integration of the implant and its performance. For instance, some
studies on implantable sensors showed that FBR can induce up to a 100% loss of sensitivity in
vivo as compared to in vitro values [148, 149]. The final outcome of FBR depends on the level
of biocompatibility of the implanted device.
For an implantable electrochemical sensor the term ”biocompatible” means that the materials,
38
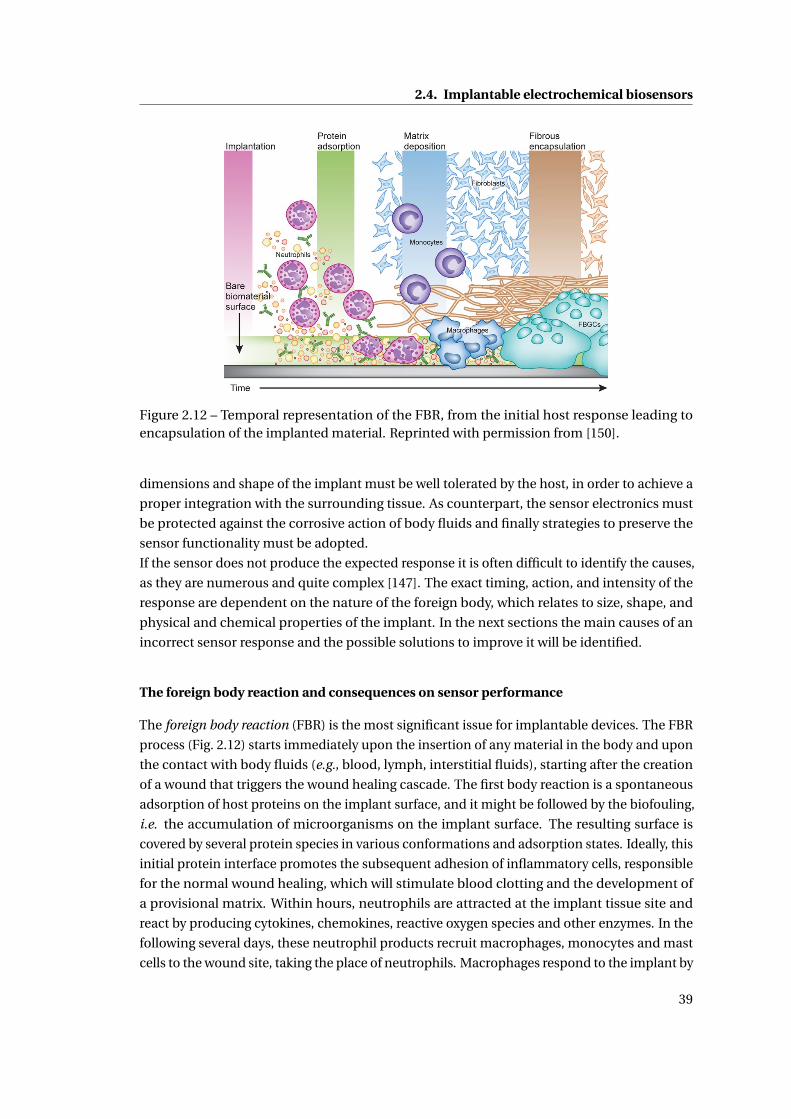
2.4. Implantable electrochemical biosensors
Figure 2.12 – Temporal representation of the FBR, from the initial host response leading toencapsulation of the implanted material. Reprinted with permission from [150].
dimensions and shape of the implant must be well tolerated by the host, in order to achieve a
proper integration with the surrounding tissue. As counterpart, the sensor electronics must
be protected against the corrosive action of body fluids and finally strategies to preserve the
sensor functionality must be adopted.
If the sensor does not produce the expected response it is often difficult to identify the causes,
as they are numerous and quite complex [147]. The exact timing, action, and intensity of the
response are dependent on the nature of the foreign body, which relates to size, shape, and
physical and chemical properties of the implant. In the next sections the main causes of an
incorrect sensor response and the possible solutions to improve it will be identified.
The foreign body reaction and consequences on sensor performance
The foreign body reaction (FBR) is the most significant issue for implantable devices. The FBR
process (Fig. 2.12) starts immediately upon the insertion of any material in the body and upon
the contact with body fluids (e.g., blood, lymph, interstitial fluids), starting after the creation
of a wound that triggers the wound healing cascade. The first body reaction is a spontaneous
adsorption of host proteins on the implant surface, and it might be followed by the biofouling,
i.e. the accumulation of microorganisms on the implant surface. The resulting surface is
covered by several protein species in various conformations and adsorption states. Ideally, this
initial protein interface promotes the subsequent adhesion of inflammatory cells, responsible
for the normal wound healing, which will stimulate blood clotting and the development of
a provisional matrix. Within hours, neutrophils are attracted at the implant tissue site and
react by producing cytokines, chemokines, reactive oxygen species and other enzymes. In the
following several days, these neutrophil products recruit macrophages, monocytes and mast
cells to the wound site, taking the place of neutrophils. Macrophages respond to the implant by
39
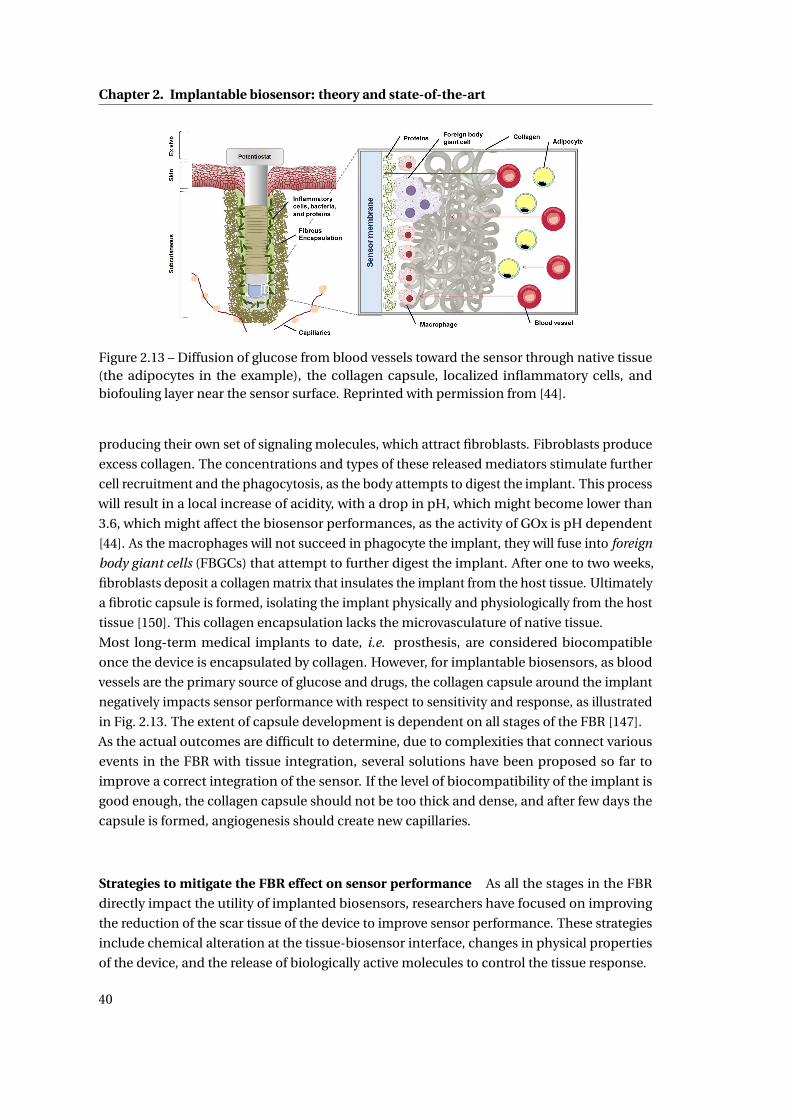
Chapter 2. Implantable biosensor: theory and state-of-the-art
Figure 2.13 – Diffusion of glucose from blood vessels toward the sensor through native tissue(the adipocytes in the example), the collagen capsule, localized inflammatory cells, andbiofouling layer near the sensor surface. Reprinted with permission from [44].
producing their own set of signaling molecules, which attract fibroblasts. Fibroblasts produce
excess collagen. The concentrations and types of these released mediators stimulate further
cell recruitment and the phagocytosis, as the body attempts to digest the implant. This process
will result in a local increase of acidity, with a drop in pH, which might become lower than
3.6, which might affect the biosensor performances, as the activity of GOx is pH dependent
[44]. As the macrophages will not succeed in phagocyte the implant, they will fuse into foreign
body giant cells (FBGCs) that attempt to further digest the implant. After one to two weeks,
fibroblasts deposit a collagen matrix that insulates the implant from the host tissue. Ultimately
a fibrotic capsule is formed, isolating the implant physically and physiologically from the host
tissue [150]. This collagen encapsulation lacks the microvasculature of native tissue.
Most long-term medical implants to date, i.e. prosthesis, are considered biocompatible
once the device is encapsulated by collagen. However, for implantable biosensors, as blood
vessels are the primary source of glucose and drugs, the collagen capsule around the implant
negatively impacts sensor performance with respect to sensitivity and response, as illustrated
in Fig. 2.13. The extent of capsule development is dependent on all stages of the FBR [147].
As the actual outcomes are difficult to determine, due to complexities that connect various
events in the FBR with tissue integration, several solutions have been proposed so far to
improve a correct integration of the sensor. If the level of biocompatibility of the implant is
good enough, the collagen capsule should not be too thick and dense, and after few days the
capsule is formed, angiogenesis should create new capillaries.
Strategies to mitigate the FBR effect on sensor performance As all the stages in the FBR
directly impact the utility of implanted biosensors, researchers have focused on improving
the reduction of the scar tissue of the device to improve sensor performance. These strategies
include chemical alteration at the tissue-biosensor interface, changes in physical properties
of the device, and the release of biologically active molecules to control the tissue response.
40
2.4. Implantable electrochemical biosensors
1. Anti-fouling sensor coatings: Reducing the initial biofouling is a common strategy, as
the adhesion of proteins and cells at the initial stage of FBR reduces sensor perfor-
mance. The reduction of biofouling is mainly achieved with an antifouling layer on
the outermost membrane surface that delays the protein adhesion. Hydrogels, Nafion,
surfactants, naturally derived materials, and others have been used with varying degrees
of effectiveness [147]. These anti-fouling coatings act by forming a layer of water, thus
preventing protein penetration to the surface [151].
2. Sensor geometry: Sensor geometry plays an equally important role with respect to
collagen encapsulation. The smaller the implanted device is, the faster and the better
will be the integration with the surrounding tissue [152]. Also the physical stress imposed
by the geometry of the implantable device represents another factor that contributes
to the FBR, i.e. sharp corners or edges could harm the body from inside, thus creating
additional inflammation, or injuries caused by the movement of the implanted material.
To avoid physical stresses, more flexible material can be used.
3. Polymer coatings: It is well-known that certain polymers elicit a more favorable FBR
than others. Polymer coatings are necessary for implantable enzymatic biosensors, as
they reduce the diffusion of interferences to the sensor while simultaneously balanc-
ing glucose and oxygen diffusion (see the next sections for more details). Among the
polymers commonly used for implant applications, Nafion, polyurethane (PU), polyethy-
lene glycol (PEG), and hydrogels have been successfully implemented as membranes
for glucose sensors implanted in subcutaneous tissues. Nafion is a perfluorosulfonic
acid-based polymer that has been implemented as a biocompatible coating. PU has
been extensively used as an outer membrane to act as a biocompatible interface with
the surrounding host tissue. Moreover, PU maintains sufficient oxygen transport while
limiting glucose diffusion to the sensor. Several scientists investigated the use of copoly-
mers blended with PU to enhanced both the stability and the biocompatibility. Yu et al.
[153] proposed an epoxy-polyurethane membrane to enhance the biocompatibility of
implantable glucose sensors. The authors reported that this membrane was successfully
used for glucose sensors implanted up to 56 days with good sensitivity.
Surface passivation with polyethylene glycol (PEG) or hydrogels has been a widely stud-
ied strategy for resisting biofouling as well as for reducing the collagen encapsulation
[44]. Chemical modifications of polymers improve in some extent the tissue biocom-
patibility, but other parameters also largely investigated are the porosity and young
modulus, both showing great influence in reducing the capsule formation [154].
4. Release of active material: The most characteristic outcome of the FBR is collagen encap-
sulation around the implanted device. Some studies showed that immediately after the
encapsulation, the glucose concentration is lower due to an insufficient vascularization.
However angiogenesis should produce new capillaries and more glucose should reach
the sensor surface [155]. Neovascularization can be improved by incorporating an angio-
genesis factor such as vascular endothelial growth factor (VEGF) or adding a structured
41
Chapter 2. Implantable biosensor: theory and state-of-the-art
polytetrafluoroethylene (PTFE) membrane on the sensor surface [156]. However, the risk
associated with the use of VEGF is its potential role in the growth of cancer cells [147].
Also drugs or small molecules are commonly integrated in the implant for a subsequent
release at the sensor-tissue interface, i.e. anti-inflammatory drugs [157], or nitric oxide
[158, 159].
Oxygen dependence
As previously stated, the electrochemical detection of hydrogen peroxide requires oxygen, a
cofactor in the oxidase enzymatic reaction. In interstitial fluids there is an ”oxigen deficit”,
as the concentration of oxygen is approximately 10 times lower than the concentration of
glucose. Oxygen deficiency is mitigated by using polymeric outer diffusion controlled mem-
branes, including polyurethane [153], Nafion [160], chitosan [160], silicone elastomer [161],
polycarbonate [162], silicone [163], and layer-by-layer assembled polyelectrolytes [164].
Interferences
When using amperometric sensors based on oxidases, the sensor response is oxygen de-
pendent and the hydrogen peroxide is measured at relatively high potential (600-650mV vs.
Ag/AgCl reference). At similar or lower potentials there is a significant number of endoge-
nous species (e.g., acetaminophen, ascorbic acid, and uric acid) that are oxidized and thus
contribute to the measured signal. Although sensor selectivity is of fundamental importance,
many reports in literature often neglect to address the problem of interfering species during
the sensor characterization [44]. A certain number of methods have been investigated to
eliminate the electrochemical interference, mostly applied to glucose biosensors [165]. Here a
selection of the most used methods is listed:
1. Coating with a preoxidizing layer: a preoxidizing layer can convert the electroactive
interfering specie into an inert form before it reaches the electrode. E.g. ascorbate
oxidase has been used as preoxidizing layer to catalyze the oxidation of ascorbic acid to
produce the electrochemically inert dehydroascorbic acid [166]. Other strong oxidants,
e.g., PbO2, B aO2, CeO2 and MnO2., were also employed as preoxidizing coating due to
their strong oxidizing ability. However, these oxidants are so strong that they were able
to eliminate not only the interferences but also the analytes [167, 168].
2. Covering the enzyme layer with a permselective membrane: Different polymers, in multi-
layer or mixed layers, have been used for blocking interfering electroactive compounds
based on their charge or size. Size exclusion acts through the size and the uniformity
of the pores of the membranes. Electropolymerized films, as poly(phenylenediamine),
polyphenol and poly(aminophenol) [169, 170, 171], and various substituted naph-
thalenes [172], have been extensively used to reject interferents based on size exclusion.
Electropolymerization coatings can be generated on extremely small surfaces with com-
42
2.4. Implantable electrochemical biosensors
plex geometries. However, the films formed often have limited stability for in vivo appli-
cations. Other common coatings based on size exclusion include plasma-polymerized
films [173], and cellulose-acetate membranes [174]. Polymeric films that repel the inter-
ferents based on electrostatic repulsion mainly are made in Nafion, which is a negatively-
charged perfluorinated ionomer able to effectively repel the negatively-charged ascorbic
acid and uric acid [175]. Multilayers have been used to combine the properties of differ-
ent films with different anti-interference properties. For example, alternate depositions
of cellulose acetate and Nafion have been used to eliminate the interference of neutral
acetaminophen and negatively-charged ascorbic and uric acids [176, 177, 178]. Moussy
et al. [179] prepared a needle-type glucose sensor based on a three-layer membranes
system, where Nafion was used as the outer layer, poly(phenylenediamine) as an inner
coating to reduce interferences by size exclusion, and the enzyme layer (GOx in a bovine-
serum-albumin matrix) was placed between the two layers. The use of a permselective
membrane is a fast and effective method to block interferents, but also simple to prepare,
as the membrane is normally dispersed over the electrode surface by dipping or spin
coating. As a result, the membrane thickness is hard to control.
3. Measuring the reduction current of hydrogen peroxide catalyzed by a mediator: mediators
have been developed in order to lower the applied potential into a window around 0.0V,
where few species are electroactive. Examples are the use of a metal-hexacyanoferrate
layer [180], metalized carbons, as rhodium or ruthenium on carbon [181], or horseradish
peroxidase immobilized with GOx [182]. If a mediator is used, there is always the
possibility to oxidize the reduced enzyme by oxygen and this will have a parasitic effect
on the substrate signal [147].
4. Lowering the potential applied by incorporating a mediator for the direct electron transfer
between enzyme and electrode: the main idea is to replace the oxygen with some redox-
active mediators to directly shuttle electrons between the active redox center of enzymes
and the electrode. In this way the measurements are independent of oxygen, and lower
potentials can be applied to the electrode. Examples are metal complexes (e.g., ferrocene
derivatives, or ruthenium or osmium complexes) [183, 165], conducting organic salts
[184], and organic-dye films [185]. Despite it is a promising approach, it is necessary
to include other methods for the filtering of interferences, as it is difficult to use the
mediator approach alone.
Stability and degradation of sensor components
Another factor that can determine the sensor failure after the implantation is the enzyme
instability and leaching [44]. Enzyme activity begins to decrease immediately due to the
polymer entrapment, or to the exposure to acid fluids, hydrogen peroxide and other reactive
radicals, during the FBR process. Several effective immobilization strategies to ensure enzyme
stability have been investigated so far: cross-linking of the enzyme with glutaraldehyde and/or
bovine serum albumin (BSA), enzyme entrapment within polymeric matrices (e.g., hydro-
43
Chapter 2. Implantable biosensor: theory and state-of-the-art
gels), and incorporation of the enzyme into electropolymerized conducting polymers such as
polypyrrole [186]. Nevertheless, enzyme suffers of an inherent loss of activity, primarily due to
the loss of non-covalently bonded FAD cofactor [187].
All the membranes used as sensing layer, barrier, and biocompatible layer are subjected to
degradation from FBR, calcification, and delamination.
In vivo calibration
Despite all the membranes and chemical modification, the analytical performance of an
enzymatic biosensor will dramatically change upon implantation, thus methods for assessing
sensor accuracy are essential. Traditionally, the in vivo accuracy of such devices is evaluated
with procedures for calibration during in vivo monitoring, by using external analyte measuring
devices, as a commercial glucometer [44].
The calibration of the biosensor represents a crucial step, which consists first in the determi-
nation of the parameters describing the relationship between the sensor output and the blood
analyte concentration, and secondly, in the subsequent use of these parameters to transform
the sensor output into an estimation of the blood analyte concentration in real time [188].
These parameters can be determined either through a single blood glucose measurement
(one-point calibration), or through two measurements (two-point calibration).
In the one-point calibration procedure [189], the sensor sensitivity S is determined from a sin-
gle blood glucose measurement, as the ratio between the corresponding sensor current I and
the blood analyte concentration G, which is measured with the external device. Subsequently,
the analyte concentration can be estimated in real time from the current I as G(t) = I (t)/S.
Two-point calibration is slightly more complex, as it requires the determination also of the
intercept of the calibration line. It is normally used when the intercept is not negligible, but it
is more time-consuming and it is more prone to measurement errors. Thus, the one-point
calibration procedure is preferred [189]. Repeated calibrations (twice per day), are required as
the sensor sensitivity changes over time due to physiological fluctuations [44].
Nevertheless, with an in vivo calibration the concentration of the analyte in interstitial fluids
should be similar to its blood concentration. There is always a physiological time lag between
blood and interstitial fluid analyte concentration that for glucose ranges between 5 and 15 min.
Lag depends on glucose uptake by cells, or from blood vessels, blood flow, and permeability of
capillaries, as well as on tissue responses to the sensor such as biofouling, and the collagen
encapsulation that limits the glucose diffusion to the sensor.
In conclusion, the development of an implantable biosensor presents many issues that are
generated by a myriad of causes. Nowadays, many strategies have been proposed to address
these issues, but exclusively for implantable glucose sensor. Chapter 5 will show solutions and
strategies selected in this thesis to best find a balance among all these constraints.
44
2.4. Implantable electrochemical biosensors
2.4.2 Electronics and power supply for an autonomous device
Fully implantable devices require an adequate electronic system for the correct sensor actua-
tion for long time. The device should be small, minimally invasive and it contains three main
blocks: (i) the sensing platform; (ii) interface electronics to control and readout the biosensor;
(iii) a power management unit.
From the point of view of the power management, the main challenge is to strike a balance
between the need for a small implant and the need to achieve an efficient power transfer to
the implanted system which is planned to be placed in a freely moving mice.
Although batteries have been largely used for supplying power in implantable devices [190],
they are not suitable for long-term implants because their limited lifetime necessitates fre-
quent replacement or recharging. Moreover, batteries are difficult to miniaturize, and, if the
application demands high currents, the battery lifetime is limited to a few hours [191]. Some
recent work showed that supercapacitors and carbon-nanotube based energy stores have great
potential to improve battery capacity, but have not yet matured to commercial availability
[192, 193, 194]. As alternative approach, percutaneous systems are rather undesirable due
to the potential risk of infection and the discomfort for the animal. The best choice is the
development of a wireless power delivery system.
For medical implants, several methods for wireless power delivery have been investigated.
Far-field coupling delivers power wirelessly in the form of ultra-high-frequency (UHF) radio
signals. For biomedical use, it has been applied to power a chip implanted in a flying insect to
acquire neural/EMG signals [195]. This method allows power transmission over long distance
(10 m), but it has very low transmission efficiency and safety issues [190]. The inductive
powering link is an attractive alternative, as it overcomes the low efficiency through the close
alignment between two coils. This method has been widely applied to medical implantable
devices [196, 197]. High efficiency is assured in the near-field (in the order of cm), but the link
efficiency drops rapidly as the distance between the coils increases. Thus, a close alignment
of the coils is required [190]. To achieve high efficiency from the wireless power transfer, the
coils and the coupling need to be optimized simultaneously.
For the sensor actuation, the readout electronics are generally realized with integrated circuits
(ICs) that can be easily miniaturized. The main challenge resides in developing ICs that could
perform the control and readout of both CA and CV for the biosensor, with low power con-
sumption.
Low power CA readout electronics, for glucose or neurotransmitters monitoring implantable
or wearable platforms, have been presented in [198, 199, 200]. In [201, 202, 203] ICs for CV
readout are presented with a control part that is implemented using external waveform gen-
erators. In [204] an IC for CA and CV control and readout is presented in 0.5 µm technology.
However the power consumption is 20 mW from 5 V supply voltage which is not compatible
with remotely powering. Thus, for the realization of the final goal of this thesis, the develop-
ment of customized ICs is required.
Finally, an appropriate communication system must be developed, that could transmit and
receive the data in real-time, and visualize the data on a screen.
45
Chapter 2. Implantable biosensor: theory and state-of-the-art
2.5 Summary
This chapter offered a wide overview on the state-of-the-art concerning the strategies that
were chosen in the present research for the realization of a fully implantable device. Electro-
analytical techniques were described and reviewed with concern on their application for
biosensing. The functionalization of the electrode surface with nanomaterial, was shown
as one of the best strategies to enhance high signal-to-noise ratio in biosensors, while the
employment of specific enzymes is required to obtain specificity. All issues related to the
biocompatibility and to the sensor functionality of the implantable device were analyzed
and addressed with different solutions that ensure a correct integration of the device in the
body. Finally an analysis of the possible methods to realize an autonomous system with the
electronics and power supply completely integrated were discussed. The present chapter can
be seen as a reference for all the results that will be presented in the thesis, and the following
chapters will show in which extent the present work goes beyond the state-of-the-art.
46
3 Drug monitoring with screen-printedelectrodes
In this chapter we present screen-printed electrodes (SPE) based sensors for drug detection
mediated by cytochrome P450 (P450), and for the detection of an electrochemically active drug.
Among several drugs we selected four anti-cancer drugs, for single drug detection but also for
multiple drug detection, as drugs are normally administered to patients in combinations. We
also measured naproxen, a commonly-used anti-inflammatory drug.
This chapter presents an initial investigation on drug detection in biological fluids, by using
SPEs with a carbon working electrode. The screen-printing technology allows the mass-
production of electrodes by reducing the fabrication costs, thus making the SPEs ideal for a
preliminary investigation on biosensors for drugs, based on P450.
3.1 Cytochrome P450-mediated drug detection
The biosensors presented in this section are based on the adsorption of multi-walled carbon
nanotubes (MWCNT) on SPEs, and on the adsorption of microsomes containing P450 (msP450)
on the nano-structured surface.
This section presents an initial investigation on the protein adsorption on MWCNTs; a study
on the voltammetric peaks obtained when msP450 is adsorbed on electrodes; the proof of the
improvement of the sensor sensitivity with MWCNTs; single and multiple drug detection, in a
normal test buffer and in serum; an investigation on the long-term stability of the biosensor.
3.1.1 Methods
MWCNTs (∼10 nm diameter and ∼ 1−2µm length) with 5% –COOH groups content, were
purchased as a powder (90% purity) from DropSens (Spain). Microsome containing cytochrome
P450 1A2 (msP450 1A2) and microsome containing cytochrome P450 3A4 (msP450 3A4) were
purchased from Sigma-Aldrich (Switzerland), and microsome containing cytochrome P450
2B6 (msP450 2B6) from BD Bioscience (USA). Microsomal P450s were purchased as isozyme
microsomes with recombinant human P450 1A2 (or P450 3A4, or P450 2B6), recombinant
47
Chapter 3. Drug monitoring with screen-printed electrodes
rabbit NADPH-P450 reductase, and cytochrome b5 (0.5 nmole of cytochrome P450 isozyme in
100 mM potassium phosphate, pH 7.4.) and used as received. The preparation of the purified
cytochrome P450 and purified cytochrome P450 reductase is reported in [205].
All the drugs, cyclophosphamide, ifosfamide, ftorafur, etoposide, and naproxen, were
purchased in powder from Sigma-Aldrich. Cyclophosphamide, ifosfamide, ftorafur were
dissolved in Milli-Q water. Etoposide was dissolved in dimethyl sulfoxide, and naproxen in
chromatography grade methanol, due to their low solubility in water.
All experiments were carried out in a 100 mM phosphate buffered saline solution (PBS, pH 7.4)
as supporting electrolyte.
Human serum was purchased from Lonza (Switzerland) and used without any dilution. For
measurements in mice serum, male C57BL/6 mice were used to extract serum samples. They
were intravenously injected with PBS. After 4 h, mice were euthanized, blood harvested and
left 1 h at room temperature. The blood was collected and then centrifuged at 7000 rpm for 10
min at 4C; serum and supernatant were stored at −80C.
The biosensors were prepared using commercial carbon paste SPEs (model DRP-C110, Drop
Sens, Spain) consisting of a carbon working electrode with an active area of 12.56 mm2, a
carbon counter electrode and an Ag|AgCl reference electrode. A 1 mg/ml solution of MWCNTs,
prepared in chloroform, was sonicated for 30 min to obtain a homogeneous suspension.
30µl of MWCNT solution were gradually deposited by drop-casting onto the working elec-
trode. After each single deposition, the chloroform evaporates and the nanotubes create a
3D porous nanostructure. 9 µl of msP450 solution were drop-cast onto the CNT-electrode
surface and incubated at 4C overnight, to promote an homogeneous protein adsorption
on the CNT-nanostructure. After a 8-h incubation at 4C, this procedure was repeated until
the nano-structured electrode was covered with three layers of protein. The functionalized
electrodes were stored at 4C and covered with PBS when not used.
Electrochemical measurements were performed using an Autolab electrochemical worksta-
tion (Metrohm, Switzerland). Morphological analysis of the nano-structured electrodes was
performed with acquisition of scanning electron micrographs (SEM), with a Philips/FEI XL-30F
microscope (Philips, The Netherlands). The scanning electron microscope was operated in
1.5–4.2 mm ultra-high resolution mode (UHR). The resolution was 2.5 nm at 1 kV.
The electrochemical response of the biosensor was investigated by CV at room temperature
under aerobic and anaerobic conditions, by applying a potential sweep generally between
−800 and +600 mV vs. Ag|AgCl at a scan rate of 20 mV/s. For experiments under anaerobic
conditions, the PBS solution was bubbled with N2 for 45 minutes before measurements in a
sealed electrochemical cell. During the measurements, N2 was continuously fluxed on the
solution surface in order to avoid oxygen contamination and not to affect the measurements.
For the sensor calibration, drug samples were added in increasing concentrations. The elec-
trode was covered with 100 µl of 100 mM PBS (pH 7.4) and drug samples were added at a fix
concentration. Sensitivity per unit area and limit of detection (LOD) were calculated from the
peak current, and estimated according to the procedure reported in the Appendix: ”Methods
for analysis of calibration curves”.
For the continuous monitoring of naproxen, an Alzet model 1002 micro-osmotic pump (USA)
48
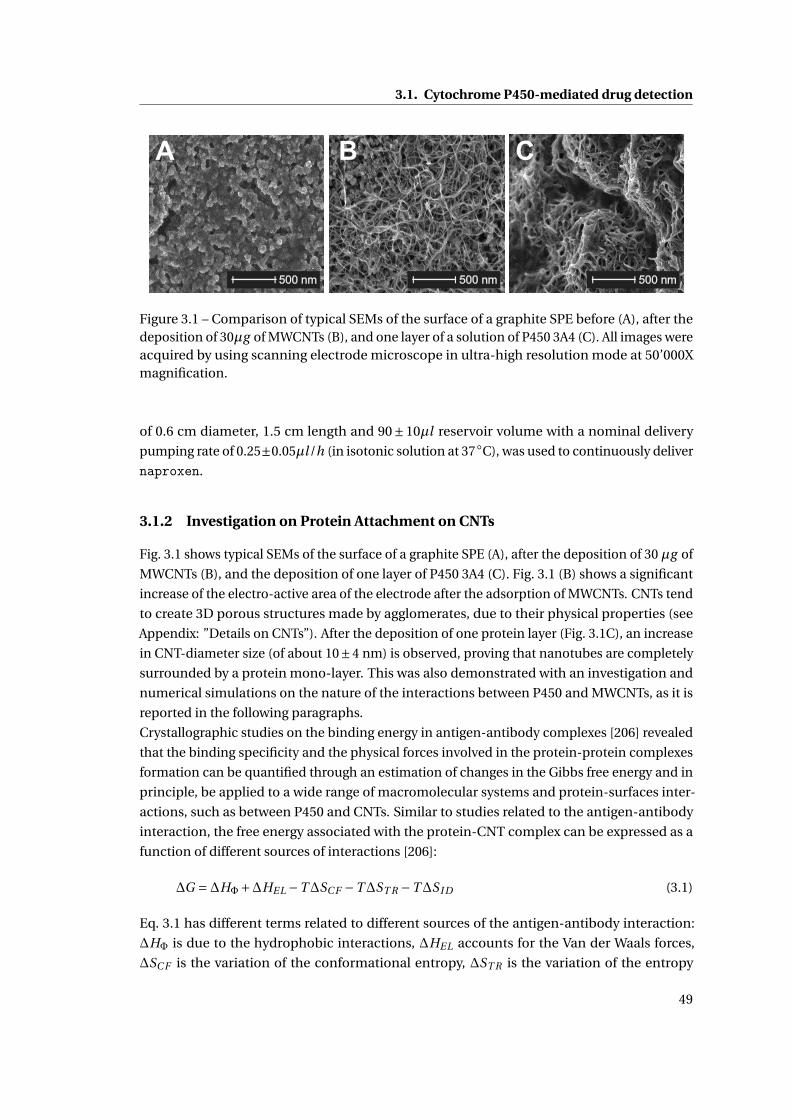
3.1. Cytochrome P450-mediated drug detection
A
500 nm 500 nm 500 nm
B C
Figure 3.1 – Comparison of typical SEMs of the surface of a graphite SPE before (A), after thedeposition of 30µg of MWCNTs (B), and one layer of a solution of P450 3A4 (C). All images wereacquired by using scanning electrode microscope in ultra-high resolution mode at 50’000Xmagnification.
of 0.6 cm diameter, 1.5 cm length and 90±10µl reservoir volume with a nominal delivery
pumping rate of 0.25±0.05µl /h (in isotonic solution at 37C), was used to continuously deliver
naproxen.
3.1.2 Investigation on Protein Attachment on CNTs
Fig. 3.1 shows typical SEMs of the surface of a graphite SPE (A), after the deposition of 30 µg of
MWCNTs (B), and the deposition of one layer of P450 3A4 (C). Fig. 3.1 (B) shows a significant
increase of the electro-active area of the electrode after the adsorption of MWCNTs. CNTs tend
to create 3D porous structures made by agglomerates, due to their physical properties (see
Appendix: ”Details on CNTs”). After the deposition of one protein layer (Fig. 3.1C), an increase
in CNT-diameter size (of about 10±4 nm) is observed, proving that nanotubes are completely
surrounded by a protein mono-layer. This was also demonstrated with an investigation and
numerical simulations on the nature of the interactions between P450 and MWCNTs, as it is
reported in the following paragraphs.
Crystallographic studies on the binding energy in antigen-antibody complexes [206] revealed
that the binding specificity and the physical forces involved in the protein-protein complexes
formation can be quantified through an estimation of changes in the Gibbs free energy and in
principle, be applied to a wide range of macromolecular systems and protein-surfaces inter-
actions, such as between P450 and CNTs. Similar to studies related to the antigen-antibody
interaction, the free energy associated with the protein-CNT complex can be expressed as a
function of different sources of interactions [206]:
∆G =∆HΦ+∆HEL −T∆SC F −T∆ST R −T∆S I D (3.1)
Eq. 3.1 has different terms related to different sources of the antigen-antibody interaction:
∆HΦ is due to the hydrophobic interactions, ∆HEL accounts for the Van der Waals forces,
∆SC F is the variation of the conformational entropy, ∆ST R is the variation of the entropy
49
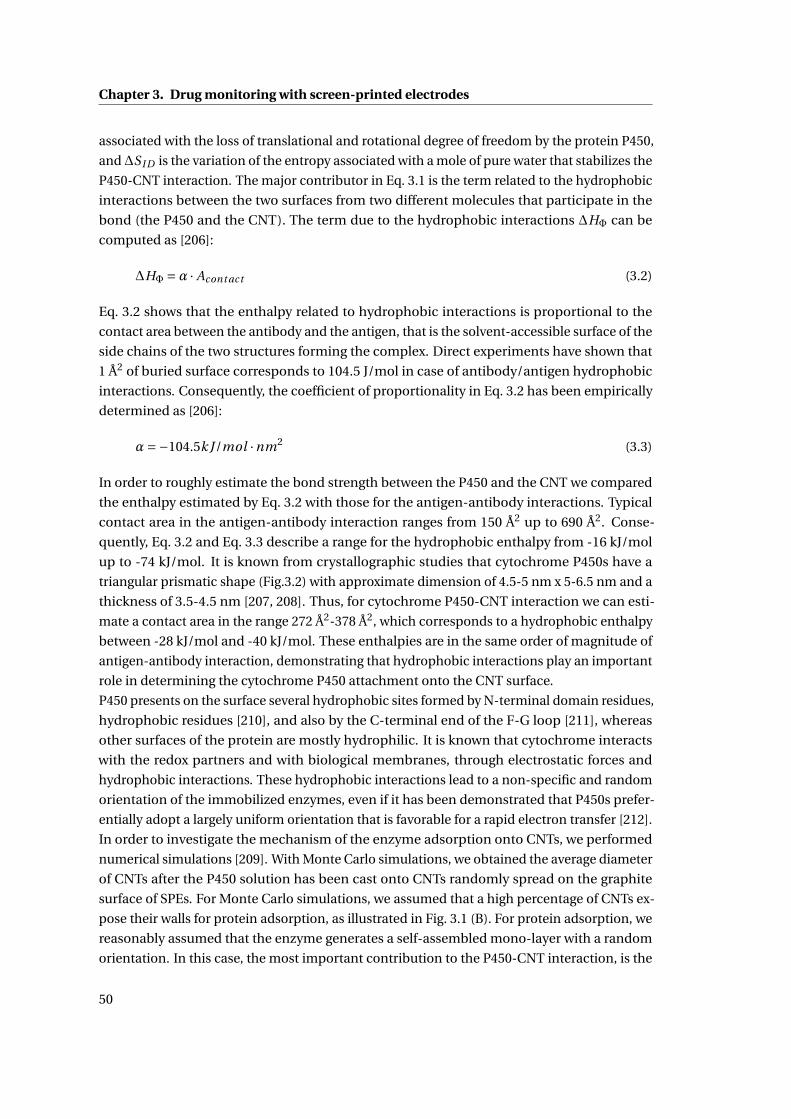
Chapter 3. Drug monitoring with screen-printed electrodes
associated with the loss of translational and rotational degree of freedom by the protein P450,
and∆S I D is the variation of the entropy associated with a mole of pure water that stabilizes the
P450-CNT interaction. The major contributor in Eq. 3.1 is the term related to the hydrophobic
interactions between the two surfaces from two different molecules that participate in the
bond (the P450 and the CNT). The term due to the hydrophobic interactions ∆HΦ can be
computed as [206]:
∆HΦ =α · Acont act (3.2)
Eq. 3.2 shows that the enthalpy related to hydrophobic interactions is proportional to the
contact area between the antibody and the antigen, that is the solvent-accessible surface of the
side chains of the two structures forming the complex. Direct experiments have shown that
1 Å2 of buried surface corresponds to 104.5 J/mol in case of antibody/antigen hydrophobic
interactions. Consequently, the coefficient of proportionality in Eq. 3.2 has been empirically
determined as [206]:
α=−104.5k J/mol ·nm2 (3.3)
In order to roughly estimate the bond strength between the P450 and the CNT we compared
the enthalpy estimated by Eq. 3.2 with those for the antigen-antibody interactions. Typical
contact area in the antigen-antibody interaction ranges from 150 Å2 up to 690 Å2. Conse-
quently, Eq. 3.2 and Eq. 3.3 describe a range for the hydrophobic enthalpy from -16 kJ/mol
up to -74 kJ/mol. It is known from crystallographic studies that cytochrome P450s have a
triangular prismatic shape (Fig.3.2) with approximate dimension of 4.5-5 nm x 5-6.5 nm and a
thickness of 3.5-4.5 nm [207, 208]. Thus, for cytochrome P450-CNT interaction we can esti-
mate a contact area in the range 272 Å2-378 Å2, which corresponds to a hydrophobic enthalpy
between -28 kJ/mol and -40 kJ/mol. These enthalpies are in the same order of magnitude of
antigen-antibody interaction, demonstrating that hydrophobic interactions play an important
role in determining the cytochrome P450 attachment onto the CNT surface.
P450 presents on the surface several hydrophobic sites formed by N-terminal domain residues,
hydrophobic residues [210], and also by the C-terminal end of the F-G loop [211], whereas
other surfaces of the protein are mostly hydrophilic. It is known that cytochrome interacts
with the redox partners and with biological membranes, through electrostatic forces and
hydrophobic interactions. These hydrophobic interactions lead to a non-specific and random
orientation of the immobilized enzymes, even if it has been demonstrated that P450s prefer-
entially adopt a largely uniform orientation that is favorable for a rapid electron transfer [212].
In order to investigate the mechanism of the enzyme adsorption onto CNTs, we performed
numerical simulations [209]. With Monte Carlo simulations, we obtained the average diameter
of CNTs after the P450 solution has been cast onto CNTs randomly spread on the graphite
surface of SPEs. For Monte Carlo simulations, we assumed that a high percentage of CNTs ex-
pose their walls for protein adsorption, as illustrated in Fig. 3.1 (B). For protein adsorption, we
reasonably assumed that the enzyme generates a self-assembled mono-layer with a random
orientation. In this case, the most important contribution to the P450-CNT interaction, is the
50
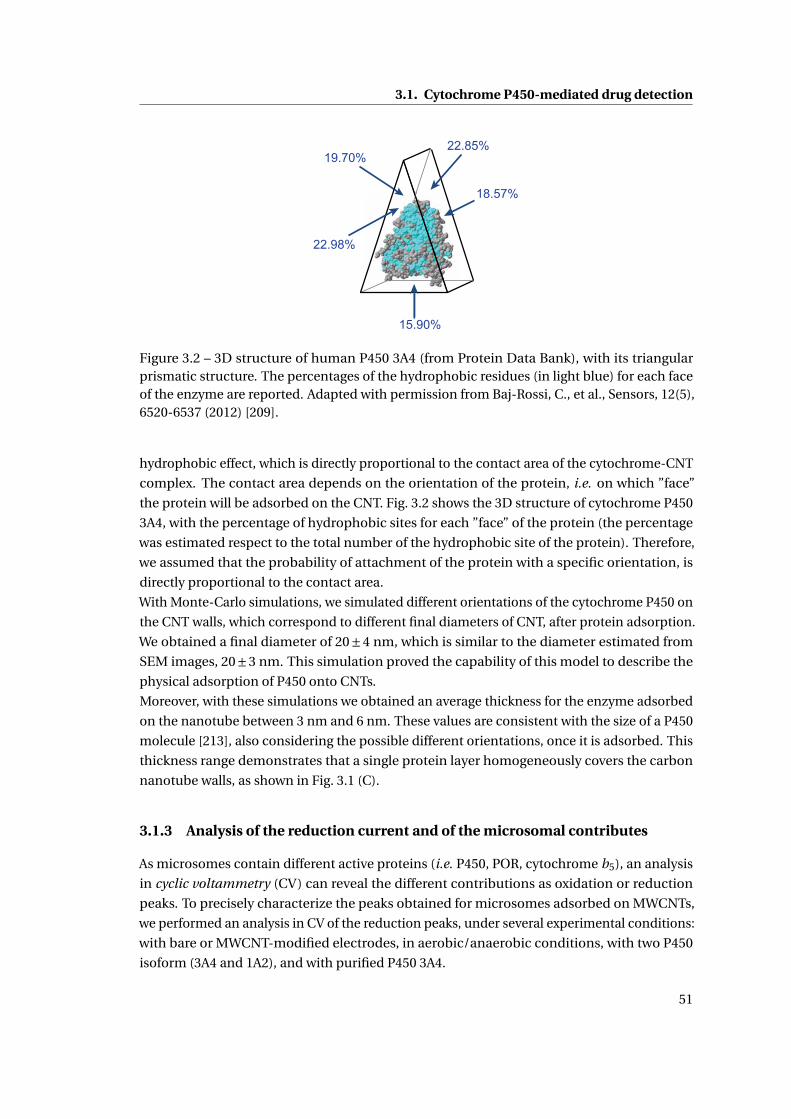
3.1. Cytochrome P450-mediated drug detection
22.98%
19.70%
15.90%
18.57%
22.85%
Figure 3.2 – 3D structure of human P450 3A4 (from Protein Data Bank), with its triangularprismatic structure. The percentages of the hydrophobic residues (in light blue) for each faceof the enzyme are reported. Adapted with permission from Baj-Rossi, C., et al., Sensors, 12(5),6520-6537 (2012) [209].
hydrophobic effect, which is directly proportional to the contact area of the cytochrome-CNT
complex. The contact area depends on the orientation of the protein, i.e. on which ”face”
the protein will be adsorbed on the CNT. Fig. 3.2 shows the 3D structure of cytochrome P450
3A4, with the percentage of hydrophobic sites for each ”face” of the protein (the percentage
was estimated respect to the total number of the hydrophobic site of the protein). Therefore,
we assumed that the probability of attachment of the protein with a specific orientation, is
directly proportional to the contact area.
With Monte-Carlo simulations, we simulated different orientations of the cytochrome P450 on
the CNT walls, which correspond to different final diameters of CNT, after protein adsorption.
We obtained a final diameter of 20±4 nm, which is similar to the diameter estimated from
SEM images, 20±3 nm. This simulation proved the capability of this model to describe the
physical adsorption of P450 onto CNTs.
Moreover, with these simulations we obtained an average thickness for the enzyme adsorbed
on the nanotube between 3 nm and 6 nm. These values are consistent with the size of a P450
molecule [213], also considering the possible different orientations, once it is adsorbed. This
thickness range demonstrates that a single protein layer homogeneously covers the carbon
nanotube walls, as shown in Fig. 3.1 (C).
3.1.3 Analysis of the reduction current and of the microsomal contributes
As microsomes contain different active proteins (i.e. P450, POR, cytochrome b5), an analysis
in cyclic voltammetry (CV) can reveal the different contributions as oxidation or reduction
peaks. To precisely characterize the peaks obtained for microsomes adsorbed on MWCNTs,
we performed an analysis in CV of the reduction peaks, under several experimental conditions:
with bare or MWCNT-modified electrodes, in aerobic/anaerobic conditions, with two P450
isoform (3A4 and 1A2), and with purified P450 3A4.
51
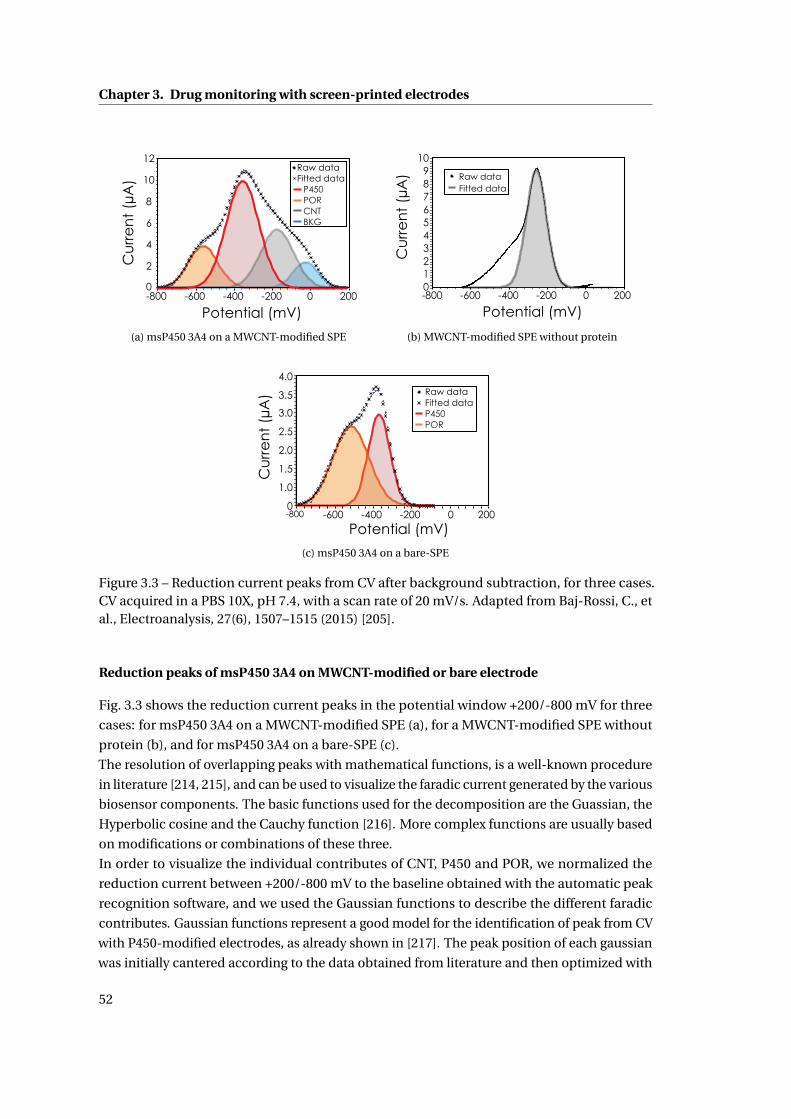
Chapter 3. Drug monitoring with screen-printed electrodes
Cu
rre
nt
(µA
)
0
2
4
6
8
10
12
-800 -600 -400 -200 0 200
Potential (mV)
PORP450
Raw dataFitted data
CNTBKG
(a) msP450 3A4 on a MWCNT-modified SPE
0123456789
10
-800 -600 -400 -200 0 200
Cu
rre
nt
(µA
)
Potential (mV)
Raw dataFitted data
(b) MWCNT-modified SPE without protein
0
1.0
1.5
2.0
2.5
3.0
3.5
4.0
-800 -600 -400 -200 0 200
Cu
rre
nt
(µA
)
Potential (mV)
PORP450
Raw dataFitted data
(c) msP450 3A4 on a bare-SPE
Figure 3.3 – Reduction current peaks from CV after background subtraction, for three cases.CV acquired in a PBS 10X, pH 7.4, with a scan rate of 20 mV/s. Adapted from Baj-Rossi, C., etal., Electroanalysis, 27(6), 1507–1515 (2015) [205].
Reduction peaks of msP450 3A4 on MWCNT-modified or bare electrode
Fig. 3.3 shows the reduction current peaks in the potential window +200/-800 mV for three
cases: for msP450 3A4 on a MWCNT-modified SPE (a), for a MWCNT-modified SPE without
protein (b), and for msP450 3A4 on a bare-SPE (c).
The resolution of overlapping peaks with mathematical functions, is a well-known procedure
in literature [214, 215], and can be used to visualize the faradic current generated by the various
biosensor components. The basic functions used for the decomposition are the Guassian, the
Hyperbolic cosine and the Cauchy function [216]. More complex functions are usually based
on modifications or combinations of these three.
In order to visualize the individual contributes of CNT, P450 and POR, we normalized the
reduction current between +200/-800 mV to the baseline obtained with the automatic peak
recognition software, and we used the Gaussian functions to describe the different faradic
contributes. Gaussian functions represent a good model for the identification of peak from CV
with P450-modified electrodes, as already shown in [217]. The peak position of each gaussian
was initially cantered according to the data obtained from literature and then optimized with
52
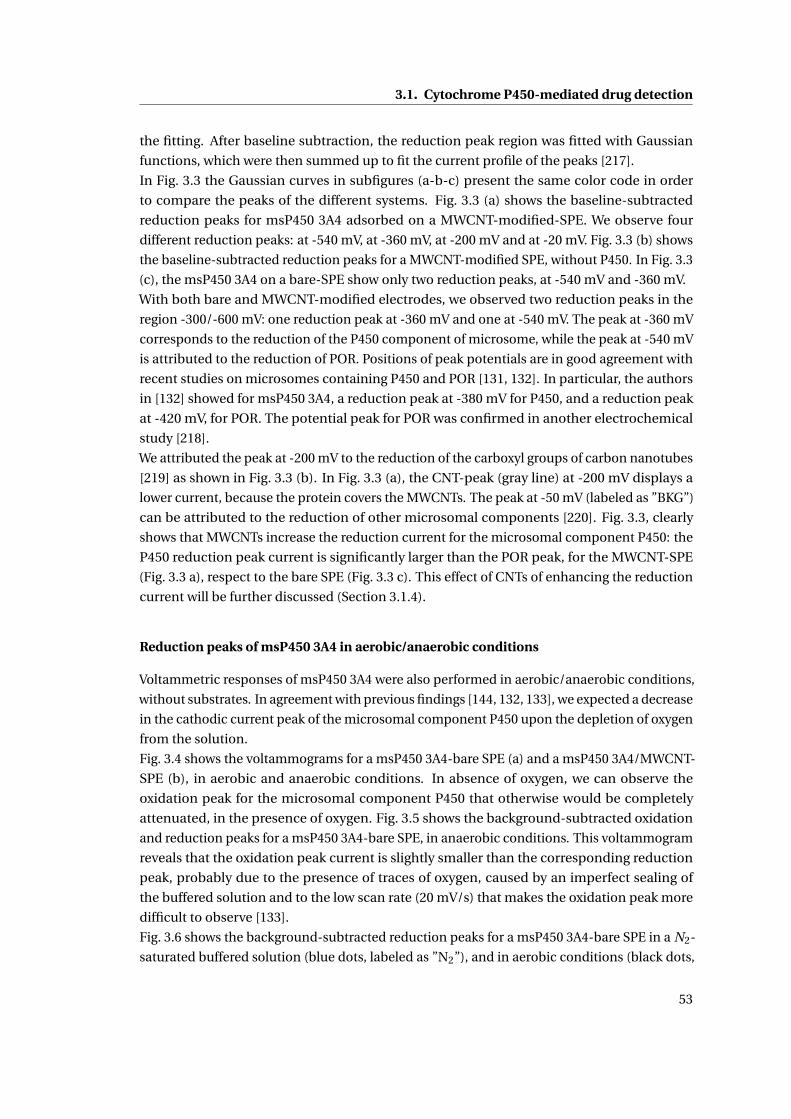
3.1. Cytochrome P450-mediated drug detection
the fitting. After baseline subtraction, the reduction peak region was fitted with Gaussian
functions, which were then summed up to fit the current profile of the peaks [217].
In Fig. 3.3 the Gaussian curves in subfigures (a-b-c) present the same color code in order
to compare the peaks of the different systems. Fig. 3.3 (a) shows the baseline-subtracted
reduction peaks for msP450 3A4 adsorbed on a MWCNT-modified-SPE. We observe four
different reduction peaks: at -540 mV, at -360 mV, at -200 mV and at -20 mV. Fig. 3.3 (b) shows
the baseline-subtracted reduction peaks for a MWCNT-modified SPE, without P450. In Fig. 3.3
(c), the msP450 3A4 on a bare-SPE show only two reduction peaks, at -540 mV and -360 mV.
With both bare and MWCNT-modified electrodes, we observed two reduction peaks in the
region -300/-600 mV: one reduction peak at -360 mV and one at -540 mV. The peak at -360 mV
corresponds to the reduction of the P450 component of microsome, while the peak at -540 mV
is attributed to the reduction of POR. Positions of peak potentials are in good agreement with
recent studies on microsomes containing P450 and POR [131, 132]. In particular, the authors
in [132] showed for msP450 3A4, a reduction peak at -380 mV for P450, and a reduction peak
at -420 mV, for POR. The potential peak for POR was confirmed in another electrochemical
study [218].
We attributed the peak at -200 mV to the reduction of the carboxyl groups of carbon nanotubes
[219] as shown in Fig. 3.3 (b). In Fig. 3.3 (a), the CNT-peak (gray line) at -200 mV displays a
lower current, because the protein covers the MWCNTs. The peak at -50 mV (labeled as ”BKG”)
can be attributed to the reduction of other microsomal components [220]. Fig. 3.3, clearly
shows that MWCNTs increase the reduction current for the microsomal component P450: the
P450 reduction peak current is significantly larger than the POR peak, for the MWCNT-SPE
(Fig. 3.3 a), respect to the bare SPE (Fig. 3.3 c). This effect of CNTs of enhancing the reduction
current will be further discussed (Section 3.1.4).
Reduction peaks of msP450 3A4 in aerobic/anaerobic conditions
Voltammetric responses of msP450 3A4 were also performed in aerobic/anaerobic conditions,
without substrates. In agreement with previous findings [144, 132, 133], we expected a decrease
in the cathodic current peak of the microsomal component P450 upon the depletion of oxygen
from the solution.
Fig. 3.4 shows the voltammograms for a msP450 3A4-bare SPE (a) and a msP450 3A4/MWCNT-
SPE (b), in aerobic and anaerobic conditions. In absence of oxygen, we can observe the
oxidation peak for the microsomal component P450 that otherwise would be completely
attenuated, in the presence of oxygen. Fig. 3.5 shows the background-subtracted oxidation
and reduction peaks for a msP450 3A4-bare SPE, in anaerobic conditions. This voltammogram
reveals that the oxidation peak current is slightly smaller than the corresponding reduction
peak, probably due to the presence of traces of oxygen, caused by an imperfect sealing of
the buffered solution and to the low scan rate (20 mV/s) that makes the oxidation peak more
difficult to observe [133].
Fig. 3.6 shows the background-subtracted reduction peaks for a msP450 3A4-bare SPE in a N2-
saturated buffered solution (blue dots, labeled as ”N2”), and in aerobic conditions (black dots,
53
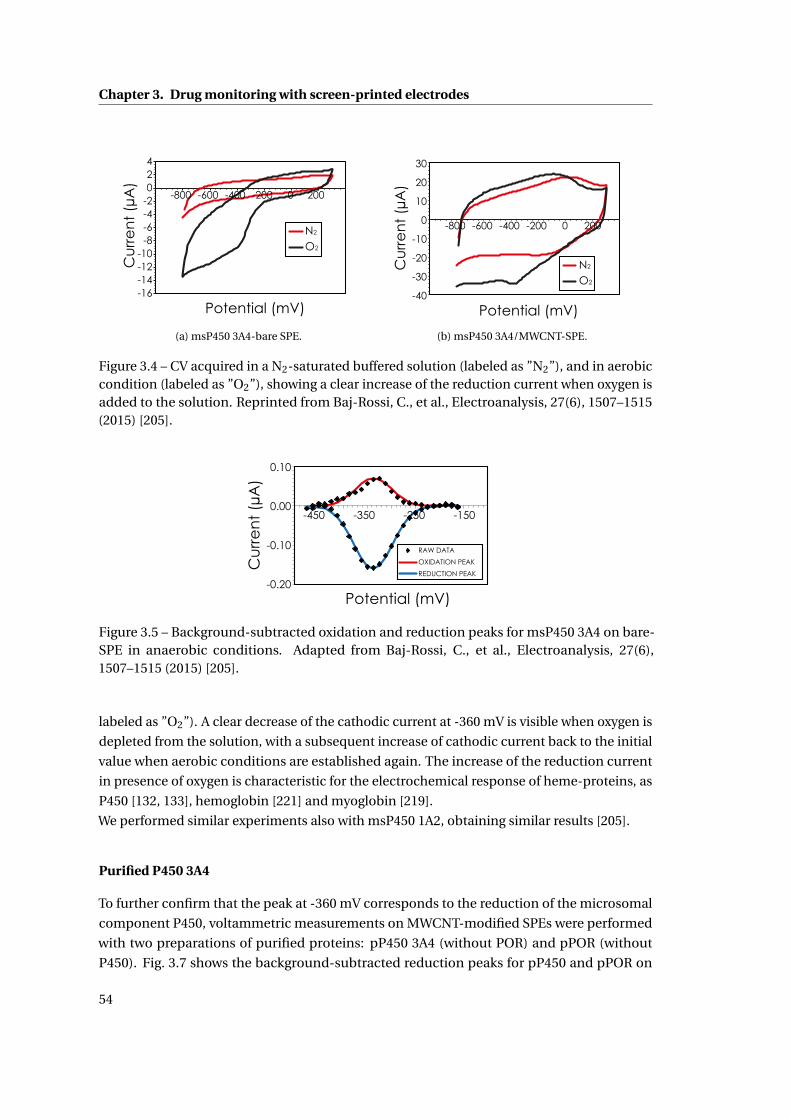
Chapter 3. Drug monitoring with screen-printed electrodes
-16-14-12-10
-8-6-4-2024
-800 -600 -400 -200 0 200
Cu
rre
nt
(µA
)
Potential (mV)
N2
O2
(a) msP450 3A4-bare SPE.
-40
-30
-20
-10
0
10
20
30
-800 -600 -400 -200 0 200
Potential (mV)
Cu
rre
nt
(µA
)
N2
O2
(b) msP450 3A4/MWCNT-SPE.
Figure 3.4 – CV acquired in a N2-saturated buffered solution (labeled as ”N2”), and in aerobiccondition (labeled as ”O2”), showing a clear increase of the reduction current when oxygen isadded to the solution. Reprinted from Baj-Rossi, C., et al., Electroanalysis, 27(6), 1507–1515(2015) [205].
Potential (mV)
Cu
rre
nt
(µA
)
RAW DATA
OXIDATION PEAK
REDUCTION PEAK
-150-250-350-450
0.10
0.00
-0.10
-0.20
Figure 3.5 – Background-subtracted oxidation and reduction peaks for msP450 3A4 on bare-SPE in anaerobic conditions. Adapted from Baj-Rossi, C., et al., Electroanalysis, 27(6),1507–1515 (2015) [205].
labeled as ”O2”). A clear decrease of the cathodic current at -360 mV is visible when oxygen is
depleted from the solution, with a subsequent increase of cathodic current back to the initial
value when aerobic conditions are established again. The increase of the reduction current
in presence of oxygen is characteristic for the electrochemical response of heme-proteins, as
P450 [132, 133], hemoglobin [221] and myoglobin [219].
We performed similar experiments also with msP450 1A2, obtaining similar results [205].
Purified P450 3A4
To further confirm that the peak at -360 mV corresponds to the reduction of the microsomal
component P450, voltammetric measurements on MWCNT-modified SPEs were performed
with two preparations of purified proteins: pP450 3A4 (without POR) and pPOR (without
P450). Fig. 3.7 shows the background-subtracted reduction peaks for pP450 and pPOR on
54
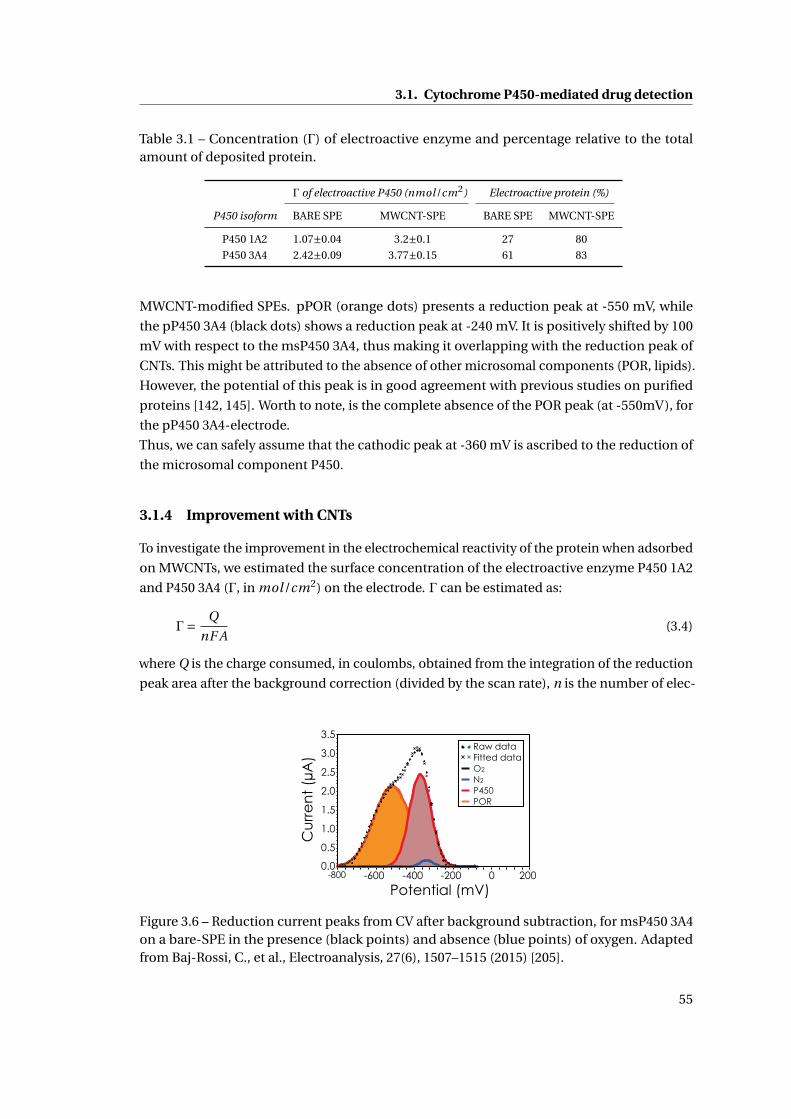
3.1. Cytochrome P450-mediated drug detection
Table 3.1 – Concentration (Γ) of electroactive enzyme and percentage relative to the totalamount of deposited protein.
Γ of electroactive P450 (nmol/cm2) Electroactive protein (%)
P450 isoform BARE SPE MWCNT-SPE BARE SPE MWCNT-SPE
P450 1A2 1.07±0.04 3.2±0.1 27 80
P450 3A4 2.42±0.09 3.77±0.15 61 83
MWCNT-modified SPEs. pPOR (orange dots) presents a reduction peak at -550 mV, while
the pP450 3A4 (black dots) shows a reduction peak at -240 mV. It is positively shifted by 100
mV with respect to the msP450 3A4, thus making it overlapping with the reduction peak of
CNTs. This might be attributed to the absence of other microsomal components (POR, lipids).
However, the potential of this peak is in good agreement with previous studies on purified
proteins [142, 145]. Worth to note, is the complete absence of the POR peak (at -550mV), for
the pP450 3A4-electrode.
Thus, we can safely assume that the cathodic peak at -360 mV is ascribed to the reduction of
the microsomal component P450.
3.1.4 Improvement with CNTs
To investigate the improvement in the electrochemical reactivity of the protein when adsorbed
on MWCNTs, we estimated the surface concentration of the electroactive enzyme P450 1A2
and P450 3A4 (Γ, in mol/cm2) on the electrode. Γ can be estimated as:
Γ= Q
nF A(3.4)
where Q is the charge consumed, in coulombs, obtained from the integration of the reduction
peak area after the background correction (divided by the scan rate), n is the number of elec-
0.0
0.5
1.0
1.5
2.0
2.5
3.0
3.5
-800 -600 -400 -200 0 200
Cu
rre
nt
(µA
)
Potential (mV)
N2
O2
Raw dataFitted data
P450POR
Figure 3.6 – Reduction current peaks from CV after background subtraction, for msP450 3A4on a bare-SPE in the presence (black points) and absence (blue points) of oxygen. Adaptedfrom Baj-Rossi, C., et al., Electroanalysis, 27(6), 1507–1515 (2015) [205].
55
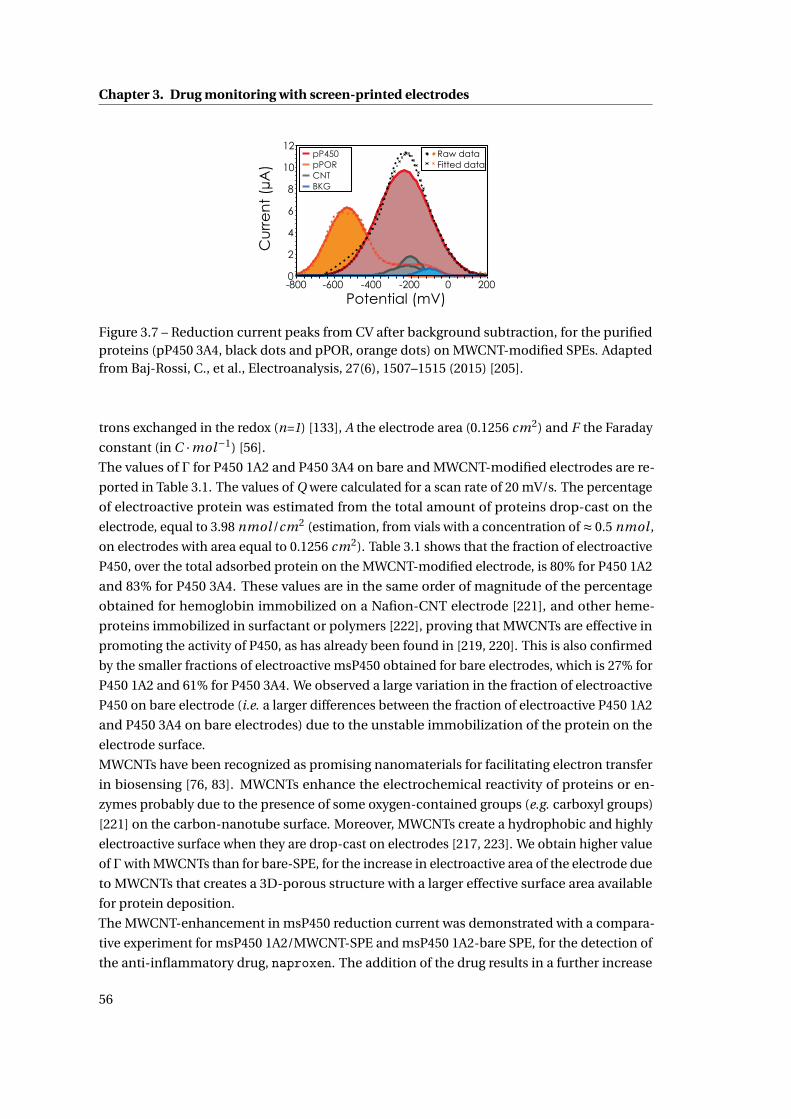
Chapter 3. Drug monitoring with screen-printed electrodes
0
2
4
6
8
10
12
-800 -600 -400 -200 0 200
Cu
rre
nt
(µA
)
Potential (mV)
pPORpP450
CNTBKG
Raw dataFitted data
Figure 3.7 – Reduction current peaks from CV after background subtraction, for the purifiedproteins (pP450 3A4, black dots and pPOR, orange dots) on MWCNT-modified SPEs. Adaptedfrom Baj-Rossi, C., et al., Electroanalysis, 27(6), 1507–1515 (2015) [205].
trons exchanged in the redox (n=1) [133], A the electrode area (0.1256 cm2) and F the Faraday
constant (in C ·mol−1) [56].
The values of Γ for P450 1A2 and P450 3A4 on bare and MWCNT-modified electrodes are re-
ported in Table 3.1. The values of Q were calculated for a scan rate of 20 mV/s. The percentage
of electroactive protein was estimated from the total amount of proteins drop-cast on the
electrode, equal to 3.98 nmol /cm2 (estimation, from vials with a concentration of ≈ 0.5 nmol ,
on electrodes with area equal to 0.1256 cm2). Table 3.1 shows that the fraction of electroactive
P450, over the total adsorbed protein on the MWCNT-modified electrode, is 80% for P450 1A2
and 83% for P450 3A4. These values are in the same order of magnitude of the percentage
obtained for hemoglobin immobilized on a Nafion-CNT electrode [221], and other heme-
proteins immobilized in surfactant or polymers [222], proving that MWCNTs are effective in
promoting the activity of P450, as has already been found in [219, 220]. This is also confirmed
by the smaller fractions of electroactive msP450 obtained for bare electrodes, which is 27% for
P450 1A2 and 61% for P450 3A4. We observed a large variation in the fraction of electroactive
P450 on bare electrode (i.e. a larger differences between the fraction of electroactive P450 1A2
and P450 3A4 on bare electrodes) due to the unstable immobilization of the protein on the
electrode surface.
MWCNTs have been recognized as promising nanomaterials for facilitating electron transfer
in biosensing [76, 83]. MWCNTs enhance the electrochemical reactivity of proteins or en-
zymes probably due to the presence of some oxygen-contained groups (e.g. carboxyl groups)
[221] on the carbon-nanotube surface. Moreover, MWCNTs create a hydrophobic and highly
electroactive surface when they are drop-cast on electrodes [217, 223]. We obtain higher value
of Γwith MWCNTs than for bare-SPE, for the increase in electroactive area of the electrode due
to MWCNTs that creates a 3D-porous structure with a larger effective surface area available
for protein deposition.
The MWCNT-enhancement in msP450 reduction current was demonstrated with a compara-
tive experiment for msP450 1A2/MWCNT-SPE and msP450 1A2-bare SPE, for the detection of
the anti-inflammatory drug, naproxen. The addition of the drug results in a further increase
56
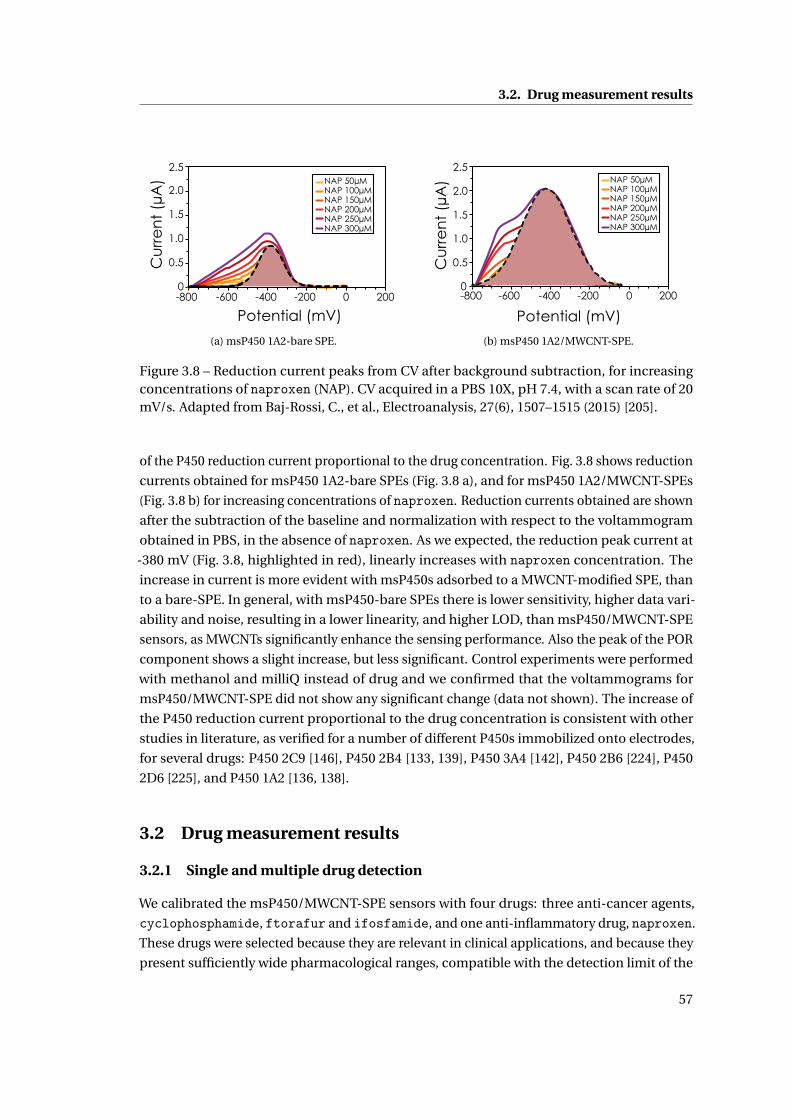
3.2. Drug measurement results
Cu
rre
nt
(µA
)
0
0.5
1.0
1.5
2.0
2.5
-800 -600 -400 -200 0 200
NAP 50µMNAP 100µMNAP 150µMNAP 200µMNAP 250µMNAP 300µM
Potential (mV)
(a) msP450 1A2-bare SPE.
Cu
rre
nt
(µA
)
0
0.5
1.0
1.5
2.0
2.5
-800 -600 -400 -200 0 200
Potential (mV)
NAP 50µMNAP 100µMNAP 150µMNAP 200µMNAP 250µMNAP 300µM
(b) msP450 1A2/MWCNT-SPE.
Figure 3.8 – Reduction current peaks from CV after background subtraction, for increasingconcentrations of naproxen (NAP). CV acquired in a PBS 10X, pH 7.4, with a scan rate of 20mV/s. Adapted from Baj-Rossi, C., et al., Electroanalysis, 27(6), 1507–1515 (2015) [205].
of the P450 reduction current proportional to the drug concentration. Fig. 3.8 shows reduction
currents obtained for msP450 1A2-bare SPEs (Fig. 3.8 a), and for msP450 1A2/MWCNT-SPEs
(Fig. 3.8 b) for increasing concentrations of naproxen. Reduction currents obtained are shown
after the subtraction of the baseline and normalization with respect to the voltammogram
obtained in PBS, in the absence of naproxen. As we expected, the reduction peak current at
-380 mV (Fig. 3.8, highlighted in red), linearly increases with naproxen concentration. The
increase in current is more evident with msP450s adsorbed to a MWCNT-modified SPE, than
to a bare-SPE. In general, with msP450-bare SPEs there is lower sensitivity, higher data vari-
ability and noise, resulting in a lower linearity, and higher LOD, than msP450/MWCNT-SPE
sensors, as MWCNTs significantly enhance the sensing performance. Also the peak of the POR
component shows a slight increase, but less significant. Control experiments were performed
with methanol and milliQ instead of drug and we confirmed that the voltammograms for
msP450/MWCNT-SPE did not show any significant change (data not shown). The increase of
the P450 reduction current proportional to the drug concentration is consistent with other
studies in literature, as verified for a number of different P450s immobilized onto electrodes,
for several drugs: P450 2C9 [146], P450 2B4 [133, 139], P450 3A4 [142], P450 2B6 [224], P450
2D6 [225], and P450 1A2 [136, 138].
3.2 Drug measurement results
3.2.1 Single and multiple drug detection
We calibrated the msP450/MWCNT-SPE sensors with four drugs: three anti-cancer agents,
cyclophosphamide, ftorafur and ifosfamide, and one anti-inflammatory drug, naproxen.
These drugs were selected because they are relevant in clinical applications, and because they
present sufficiently wide pharmacological ranges, compatible with the detection limit of the
57
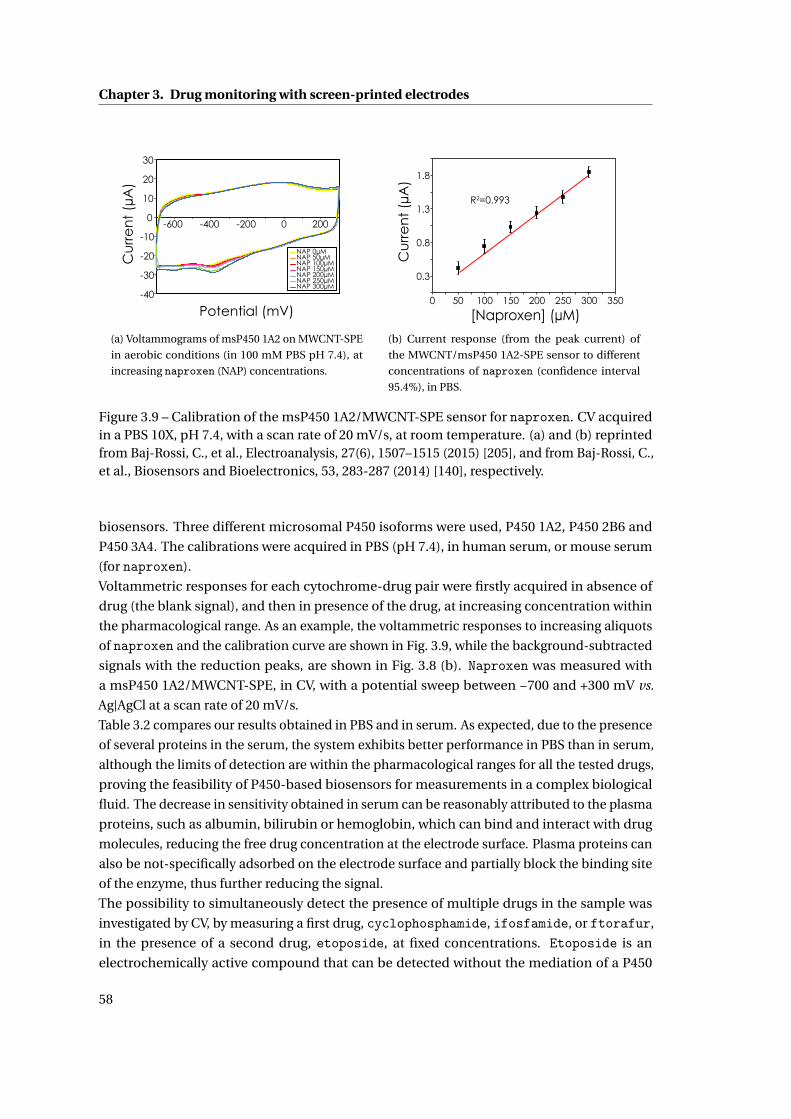
Chapter 3. Drug monitoring with screen-printed electrodes
Cu
rre
nt
(µA
)
Potential (mV)-40
-30
-20
-10
0
10
20
30
-600 -400 -200 0 200
NAP 0µMNAP 50µMNAP 100µMNAP 150µMNAP 200µMNAP 250µMNAP 300µM
(a) Voltammograms of msP450 1A2 on MWCNT-SPE
in aerobic conditions (in 100 mM PBS pH 7.4), at
increasing naproxen (NAP) concentrations.
Cu
rre
nt
(µA
)
[Naproxen] (µM)
R2=0.993
0.3
0.8
1.3
1.8
0 50 100 150 200 250 300 350
(b) Current response (from the peak current) of
the MWCNT/msP450 1A2-SPE sensor to different
concentrations of naproxen (confidence interval
95.4%), in PBS.
Figure 3.9 – Calibration of the msP450 1A2/MWCNT-SPE sensor for naproxen. CV acquiredin a PBS 10X, pH 7.4, with a scan rate of 20 mV/s, at room temperature. (a) and (b) reprintedfrom Baj-Rossi, C., et al., Electroanalysis, 27(6), 1507–1515 (2015) [205], and from Baj-Rossi, C.,et al., Biosensors and Bioelectronics, 53, 283-287 (2014) [140], respectively.
biosensors. Three different microsomal P450 isoforms were used, P450 1A2, P450 2B6 and
P450 3A4. The calibrations were acquired in PBS (pH 7.4), in human serum, or mouse serum
(for naproxen).
Voltammetric responses for each cytochrome-drug pair were firstly acquired in absence of
drug (the blank signal), and then in presence of the drug, at increasing concentration within
the pharmacological range. As an example, the voltammetric responses to increasing aliquots
of naproxen and the calibration curve are shown in Fig. 3.9, while the background-subtracted
signals with the reduction peaks, are shown in Fig. 3.8 (b). Naproxen was measured with
a msP450 1A2/MWCNT-SPE, in CV, with a potential sweep between −700 and +300 mV vs.
Ag|AgCl at a scan rate of 20 mV/s.
Table 3.2 compares our results obtained in PBS and in serum. As expected, due to the presence
of several proteins in the serum, the system exhibits better performance in PBS than in serum,
although the limits of detection are within the pharmacological ranges for all the tested drugs,
proving the feasibility of P450-based biosensors for measurements in a complex biological
fluid. The decrease in sensitivity obtained in serum can be reasonably attributed to the plasma
proteins, such as albumin, bilirubin or hemoglobin, which can bind and interact with drug
molecules, reducing the free drug concentration at the electrode surface. Plasma proteins can
also be not-specifically adsorbed on the electrode surface and partially block the binding site
of the enzyme, thus further reducing the signal.
The possibility to simultaneously detect the presence of multiple drugs in the sample was
investigated by CV, by measuring a first drug, cyclophosphamide, ifosfamide, or ftorafur,
in the presence of a second drug, etoposide, at fixed concentrations. Etoposide is an
electrochemically active compound that can be detected without the mediation of a P450
58
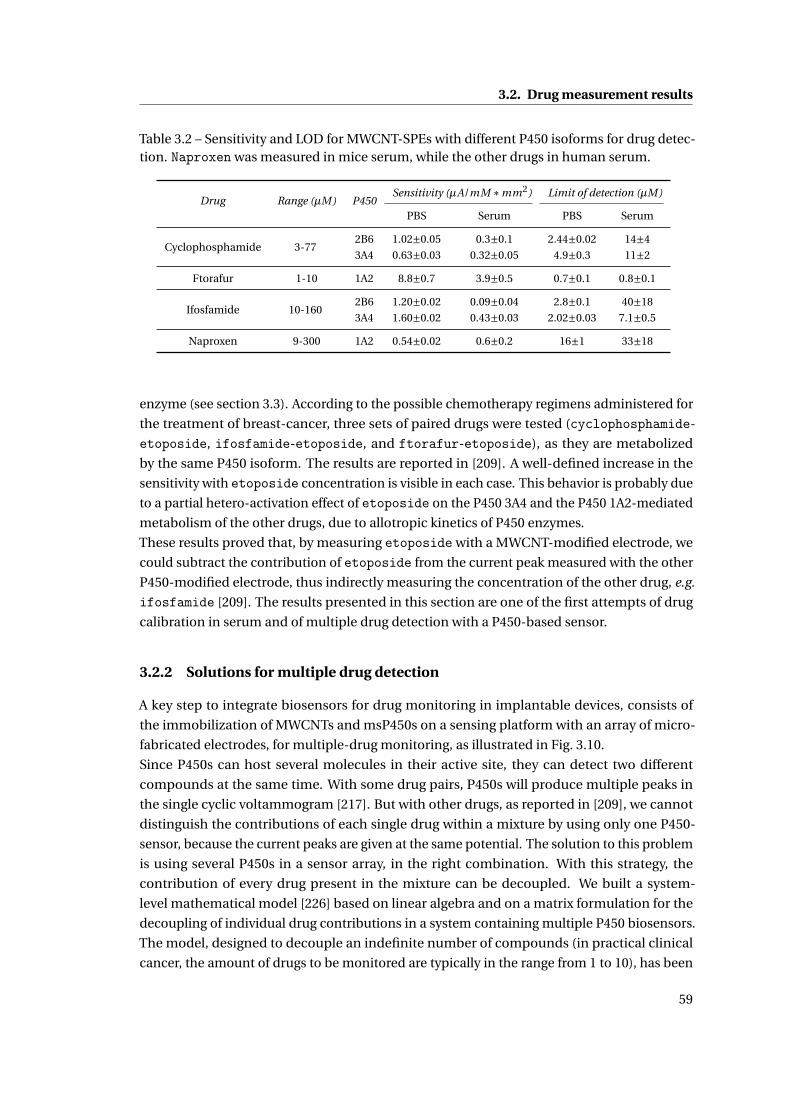
3.2. Drug measurement results
Table 3.2 – Sensitivity and LOD for MWCNT-SPEs with different P450 isoforms for drug detec-tion. Naproxen was measured in mice serum, while the other drugs in human serum.
Drug Range (µM) P450Sensitivity (µA/mM ∗mm2) Limit of detection (µM)
PBS Serum PBS Serum
Cyclophosphamide 3-772B6 1.02±0.05 0.3±0.1 2.44±0.02 14±4
3A4 0.63±0.03 0.32±0.05 4.9±0.3 11±2
Ftorafur 1-10 1A2 8.8±0.7 3.9±0.5 0.7±0.1 0.8±0.1
Ifosfamide 10-1602B6 1.20±0.02 0.09±0.04 2.8±0.1 40±18
3A4 1.60±0.02 0.43±0.03 2.02±0.03 7.1±0.5
Naproxen 9-300 1A2 0.54±0.02 0.6±0.2 16±1 33±18
enzyme (see section 3.3). According to the possible chemotherapy regimens administered for
the treatment of breast-cancer, three sets of paired drugs were tested (cyclophosphamide-
etoposide, ifosfamide-etoposide, and ftorafur-etoposide), as they are metabolized
by the same P450 isoform. The results are reported in [209]. A well-defined increase in the
sensitivity with etoposide concentration is visible in each case. This behavior is probably due
to a partial hetero-activation effect of etoposide on the P450 3A4 and the P450 1A2-mediated
metabolism of the other drugs, due to allotropic kinetics of P450 enzymes.
These results proved that, by measuring etoposide with a MWCNT-modified electrode, we
could subtract the contribution of etoposide from the current peak measured with the other
P450-modified electrode, thus indirectly measuring the concentration of the other drug, e.g.
ifosfamide [209]. The results presented in this section are one of the first attempts of drug
calibration in serum and of multiple drug detection with a P450-based sensor.
3.2.2 Solutions for multiple drug detection
A key step to integrate biosensors for drug monitoring in implantable devices, consists of
the immobilization of MWCNTs and msP450s on a sensing platform with an array of micro-
fabricated electrodes, for multiple-drug monitoring, as illustrated in Fig. 3.10.
Since P450s can host several molecules in their active site, they can detect two different
compounds at the same time. With some drug pairs, P450s will produce multiple peaks in
the single cyclic voltammogram [217]. But with other drugs, as reported in [209], we cannot
distinguish the contributions of each single drug within a mixture by using only one P450-
sensor, because the current peaks are given at the same potential. The solution to this problem
is using several P450s in a sensor array, in the right combination. With this strategy, the
contribution of every drug present in the mixture can be decoupled. We built a system-
level mathematical model [226] based on linear algebra and on a matrix formulation for the
decoupling of individual drug contributions in a system containing multiple P450 biosensors.
The model, designed to decouple an indefinite number of compounds (in practical clinical
cancer, the amount of drugs to be monitored are typically in the range from 1 to 10), has been
59
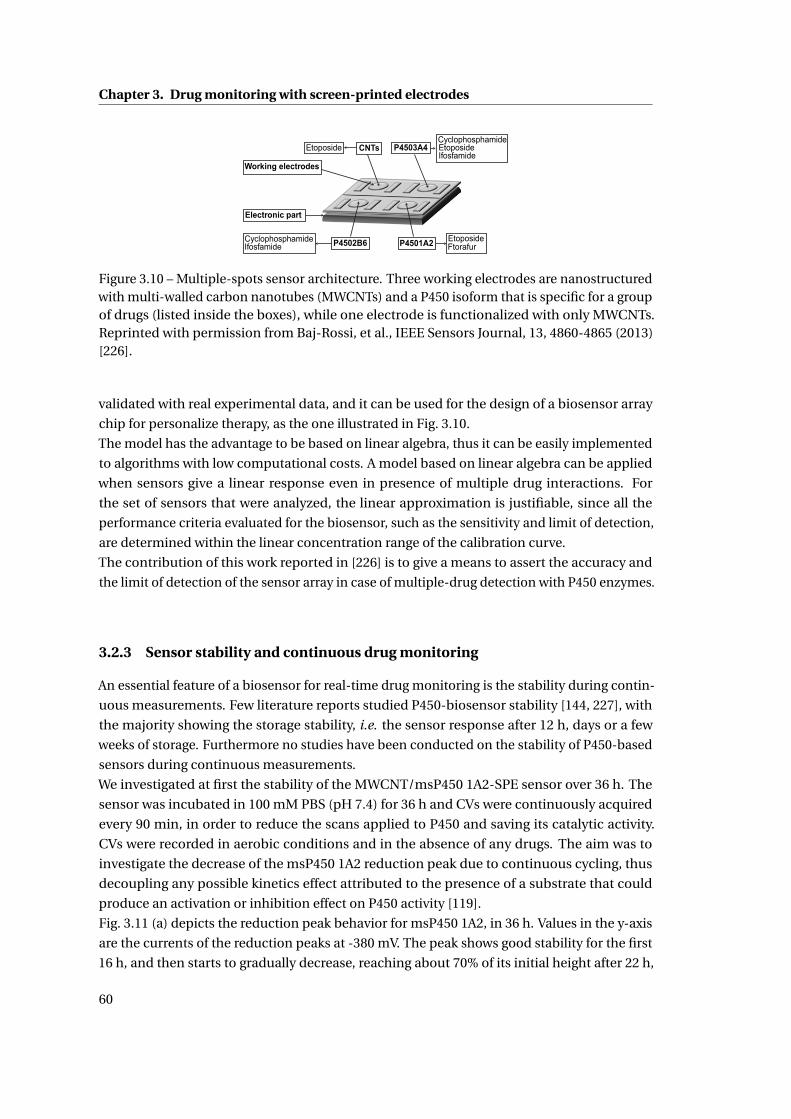
Chapter 3. Drug monitoring with screen-printed electrodes
CyclophosphamideEtoposideIfosfamide
Etoposide
CyclophosphamideIfosfamide
EtoposideP4502B6 P4501A2
P4503A4CNTs
Working electrodes
Electronic part
Ftorafur
Figure 3.10 – Multiple-spots sensor architecture. Three working electrodes are nanostructuredwith multi-walled carbon nanotubes (MWCNTs) and a P450 isoform that is specific for a groupof drugs (listed inside the boxes), while one electrode is functionalized with only MWCNTs.Reprinted with permission from Baj-Rossi, et al., IEEE Sensors Journal, 13, 4860-4865 (2013)[226].
validated with real experimental data, and it can be used for the design of a biosensor array
chip for personalize therapy, as the one illustrated in Fig. 3.10.
The model has the advantage to be based on linear algebra, thus it can be easily implemented
to algorithms with low computational costs. A model based on linear algebra can be applied
when sensors give a linear response even in presence of multiple drug interactions. For
the set of sensors that were analyzed, the linear approximation is justifiable, since all the
performance criteria evaluated for the biosensor, such as the sensitivity and limit of detection,
are determined within the linear concentration range of the calibration curve.
The contribution of this work reported in [226] is to give a means to assert the accuracy and
the limit of detection of the sensor array in case of multiple-drug detection with P450 enzymes.
3.2.3 Sensor stability and continuous drug monitoring
An essential feature of a biosensor for real-time drug monitoring is the stability during contin-
uous measurements. Few literature reports studied P450-biosensor stability [144, 227], with
the majority showing the storage stability, i.e. the sensor response after 12 h, days or a few
weeks of storage. Furthermore no studies have been conducted on the stability of P450-based
sensors during continuous measurements.
We investigated at first the stability of the MWCNT/msP450 1A2-SPE sensor over 36 h. The
sensor was incubated in 100 mM PBS (pH 7.4) for 36 h and CVs were continuously acquired
every 90 min, in order to reduce the scans applied to P450 and saving its catalytic activity.
CVs were recorded in aerobic conditions and in the absence of any drugs. The aim was to
investigate the decrease of the msP450 1A2 reduction peak due to continuous cycling, thus
decoupling any possible kinetics effect attributed to the presence of a substrate that could
produce an activation or inhibition effect on P450 activity [119].
Fig. 3.11 (a) depicts the reduction peak behavior for msP450 1A2, in 36 h. Values in the y-axis
are the currents of the reduction peaks at -380 mV. The peak shows good stability for the first
16 h, and then starts to gradually decrease, reaching about 70% of its initial height after 22 h,
60
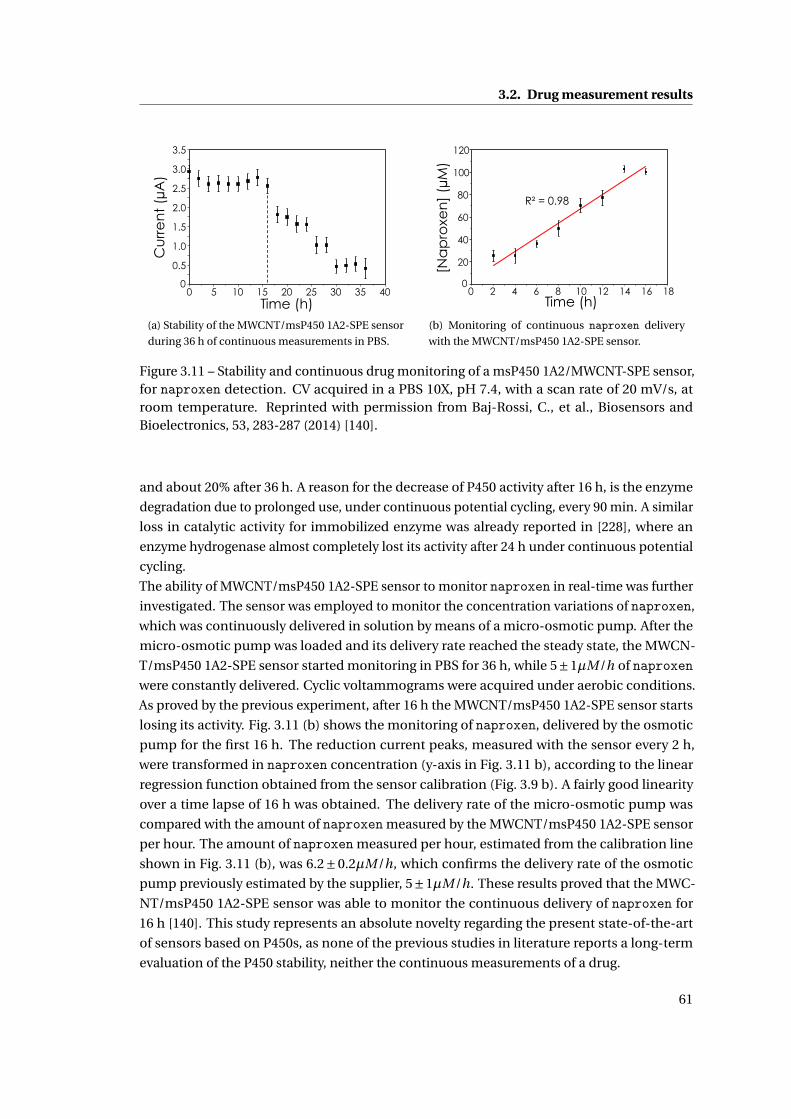
3.2. Drug measurement results
0
0.5
1.0
1.5
2.0
2.5
3.0
3.5
0 5 10 15 20 25 30 35 40
Cu
rre
nt
(µA
)
Time (h)(a) Stability of the MWCNT/msP450 1A2-SPE sensor
during 36 h of continuous measurements in PBS.
R² = 0.98
0
20
40
60
80
100
120
0 2 4 6 8 10 12 14 16 18
[Na
pro
xen
] (µ
M)
Time (h)
(b) Monitoring of continuous naproxen delivery
with the MWCNT/msP450 1A2-SPE sensor.
Figure 3.11 – Stability and continuous drug monitoring of a msP450 1A2/MWCNT-SPE sensor,for naproxen detection. CV acquired in a PBS 10X, pH 7.4, with a scan rate of 20 mV/s, atroom temperature. Reprinted with permission from Baj-Rossi, C., et al., Biosensors andBioelectronics, 53, 283-287 (2014) [140].
and about 20% after 36 h. A reason for the decrease of P450 activity after 16 h, is the enzyme
degradation due to prolonged use, under continuous potential cycling, every 90 min. A similar
loss in catalytic activity for immobilized enzyme was already reported in [228], where an
enzyme hydrogenase almost completely lost its activity after 24 h under continuous potential
cycling.
The ability of MWCNT/msP450 1A2-SPE sensor to monitor naproxen in real-time was further
investigated. The sensor was employed to monitor the concentration variations of naproxen,
which was continuously delivered in solution by means of a micro-osmotic pump. After the
micro-osmotic pump was loaded and its delivery rate reached the steady state, the MWCN-
T/msP450 1A2-SPE sensor started monitoring in PBS for 36 h, while 5±1µM/h of naproxenwere constantly delivered. Cyclic voltammograms were acquired under aerobic conditions.
As proved by the previous experiment, after 16 h the MWCNT/msP450 1A2-SPE sensor starts
losing its activity. Fig. 3.11 (b) shows the monitoring of naproxen, delivered by the osmotic
pump for the first 16 h. The reduction current peaks, measured with the sensor every 2 h,
were transformed in naproxen concentration (y-axis in Fig. 3.11 b), according to the linear
regression function obtained from the sensor calibration (Fig. 3.9 b). A fairly good linearity
over a time lapse of 16 h was obtained. The delivery rate of the micro-osmotic pump was
compared with the amount of naproxen measured by the MWCNT/msP450 1A2-SPE sensor
per hour. The amount of naproxen measured per hour, estimated from the calibration line
shown in Fig. 3.11 (b), was 6.2±0.2µM/h, which confirms the delivery rate of the osmotic
pump previously estimated by the supplier, 5±1µM/h. These results proved that the MWC-
NT/msP450 1A2-SPE sensor was able to monitor the continuous delivery of naproxen for
16 h [140]. This study represents an absolute novelty regarding the present state-of-the-art
of sensors based on P450s, as none of the previous studies in literature reports a long-term
evaluation of the P450 stability, neither the continuous measurements of a drug.
61
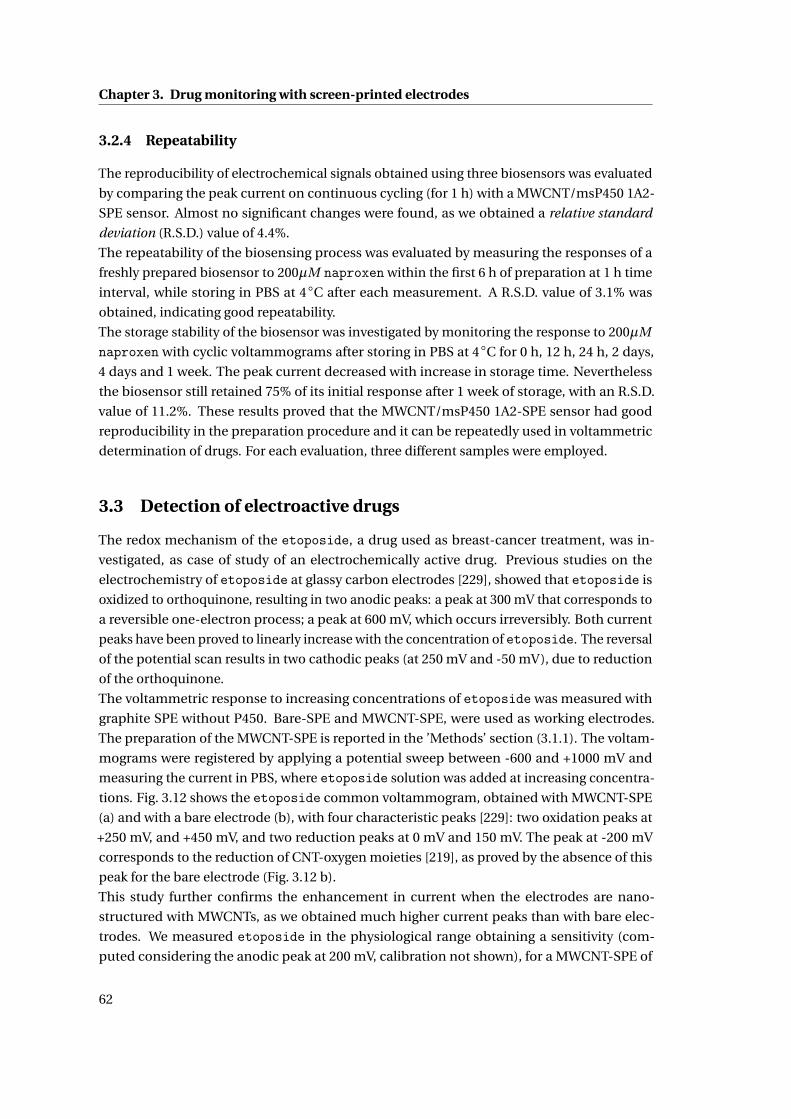
Chapter 3. Drug monitoring with screen-printed electrodes
3.2.4 Repeatability
The reproducibility of electrochemical signals obtained using three biosensors was evaluated
by comparing the peak current on continuous cycling (for 1 h) with a MWCNT/msP450 1A2-
SPE sensor. Almost no significant changes were found, as we obtained a relative standard
deviation (R.S.D.) value of 4.4%.
The repeatability of the biosensing process was evaluated by measuring the responses of a
freshly prepared biosensor to 200µM naproxen within the first 6 h of preparation at 1 h time
interval, while storing in PBS at 4C after each measurement. A R.S.D. value of 3.1% was
obtained, indicating good repeatability.
The storage stability of the biosensor was investigated by monitoring the response to 200µM
naproxen with cyclic voltammograms after storing in PBS at 4C for 0 h, 12 h, 24 h, 2 days,
4 days and 1 week. The peak current decreased with increase in storage time. Nevertheless
the biosensor still retained 75% of its initial response after 1 week of storage, with an R.S.D.
value of 11.2%. These results proved that the MWCNT/msP450 1A2-SPE sensor had good
reproducibility in the preparation procedure and it can be repeatedly used in voltammetric
determination of drugs. For each evaluation, three different samples were employed.
3.3 Detection of electroactive drugs
The redox mechanism of the etoposide, a drug used as breast-cancer treatment, was in-
vestigated, as case of study of an electrochemically active drug. Previous studies on the
electrochemistry of etoposide at glassy carbon electrodes [229], showed that etoposide is
oxidized to orthoquinone, resulting in two anodic peaks: a peak at 300 mV that corresponds to
a reversible one-electron process; a peak at 600 mV, which occurs irreversibly. Both current
peaks have been proved to linearly increase with the concentration of etoposide. The reversal
of the potential scan results in two cathodic peaks (at 250 mV and -50 mV), due to reduction
of the orthoquinone.
The voltammetric response to increasing concentrations of etoposide was measured with
graphite SPE without P450. Bare-SPE and MWCNT-SPE, were used as working electrodes.
The preparation of the MWCNT-SPE is reported in the ’Methods’ section (3.1.1). The voltam-
mograms were registered by applying a potential sweep between -600 and +1000 mV and
measuring the current in PBS, where etoposide solution was added at increasing concentra-
tions. Fig. 3.12 shows the etoposide common voltammogram, obtained with MWCNT-SPE
(a) and with a bare electrode (b), with four characteristic peaks [229]: two oxidation peaks at
+250 mV, and +450 mV, and two reduction peaks at 0 mV and 150 mV. The peak at -200 mV
corresponds to the reduction of CNT-oxygen moieties [219], as proved by the absence of this
peak for the bare electrode (Fig. 3.12 b).
This study further confirms the enhancement in current when the electrodes are nano-
structured with MWCNTs, as we obtained much higher current peaks than with bare elec-
trodes. We measured etoposide in the physiological range obtaining a sensitivity (com-
puted considering the anodic peak at 200 mV, calibration not shown), for a MWCNT-SPE of
62
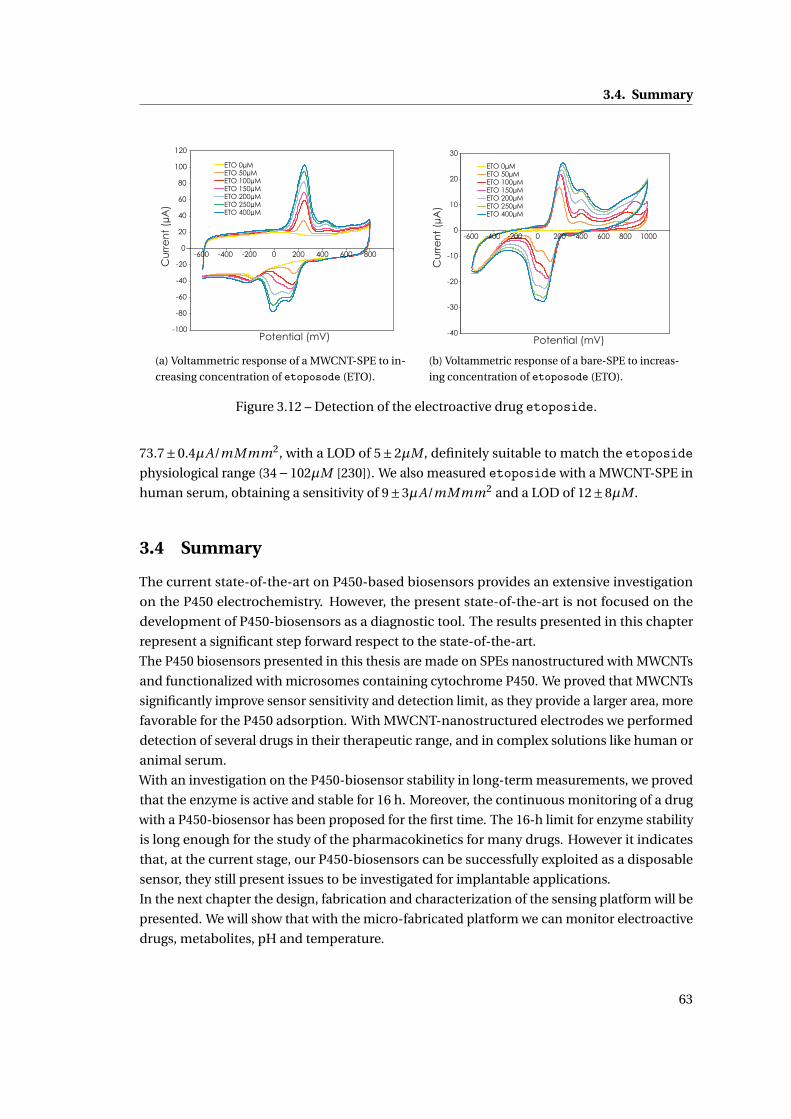
3.4. Summary
-100
-80
-60
-40
-20
0
20
40
60
80
100
120
-600 -400 -200 0 200 400 600 800
ETO 0µM ETO 50µM ETO 100µM ETO 150µM ETO 200µM ETO 250µM ETO 400µM
Cu
rre
nt
(µA
)
Potential (mV)
(a) Voltammetric response of a MWCNT-SPE to in-
creasing concentration of etoposode (ETO).
-40
-30
-20
-10
0
10
20
30
-600 -400 -200 0 200 400 600 800 1000
ETO 0µM ETO 50µM ETO 100µM ETO 150µM ETO 200µM ETO 250µM ETO 400µM
Potential (mV)
Cu
rre
nt
(µA
)
(b) Voltammetric response of a bare-SPE to increas-
ing concentration of etoposode (ETO).
Figure 3.12 – Detection of the electroactive drug etoposide.
73.7±0.4µA/mMmm2, with a LOD of 5±2µM , definitely suitable to match the etoposidephysiological range (34−102µM [230]). We also measured etoposide with a MWCNT-SPE in
human serum, obtaining a sensitivity of 9±3µA/mMmm2 and a LOD of 12±8µM .
3.4 Summary
The current state-of-the-art on P450-based biosensors provides an extensive investigation
on the P450 electrochemistry. However, the present state-of-the-art is not focused on the
development of P450-biosensors as a diagnostic tool. The results presented in this chapter
represent a significant step forward respect to the state-of-the-art.
The P450 biosensors presented in this thesis are made on SPEs nanostructured with MWCNTs
and functionalized with microsomes containing cytochrome P450. We proved that MWCNTs
significantly improve sensor sensitivity and detection limit, as they provide a larger area, more
favorable for the P450 adsorption. With MWCNT-nanostructured electrodes we performed
detection of several drugs in their therapeutic range, and in complex solutions like human or
animal serum.
With an investigation on the P450-biosensor stability in long-term measurements, we proved
that the enzyme is active and stable for 16 h. Moreover, the continuous monitoring of a drug
with a P450-biosensor has been proposed for the first time. The 16-h limit for enzyme stability
is long enough for the study of the pharmacokinetics for many drugs. However it indicates
that, at the current stage, our P450-biosensors can be successfully exploited as a disposable
sensor, they still present issues to be investigated for implantable applications.
In the next chapter the design, fabrication and characterization of the sensing platform will be
presented. We will show that with the micro-fabricated platform we can monitor electroactive
drugs, metabolites, pH and temperature.
63

4 Design and test of the implantablesensor platform
The need for system integration into a small implantable device strongly influences the
design constraints for every component of the device. As illustrated in Fig. 4.1, the fully
implantable device consists of: 1) a passive sensing platform, 2) integrated circuits (ICs) to
perform electrochemical measurements and 3) a coil for power and data transmission. As
an example, the sensing platform must be capable to monitor multiple parameters, must be
realized as small as possible, with biocompatible materials. Moreover, the sensing techniques
must be compatible with low-power electronics, and grant at the same time sufficient precision
for reliable measurements.
The electrochemical platform was designed to host five independent biosensors, for the
simultaneous monitoring of drugs and endogenous metabolites, pH, and a temperature
sensor. A sensing platform for electrochemical measurements, combined with the presence of
a pH and a temperature sensor, is designed to optimize the sensing performance in different
physiological conditions, as changes in pH and temperature can affect the sensor specificity.
This chapter presents the design, fabrication and characterization of the electrochemical
sensing platform, with respect to the constraints given by the integration with the electronics
SENSING PLATFORM
INTEGRATED CIRCUITS
COIL FOR POWER AND DATA TRANSMISSION
Figure 4.1 – Scheme of the integrated implantable device. Reprinted with permission fromBaj-Rossi, et al., IEEE Transaction on Biomedical Circuits and Systems, 8, 5, 636-647 (2014)[231].
65
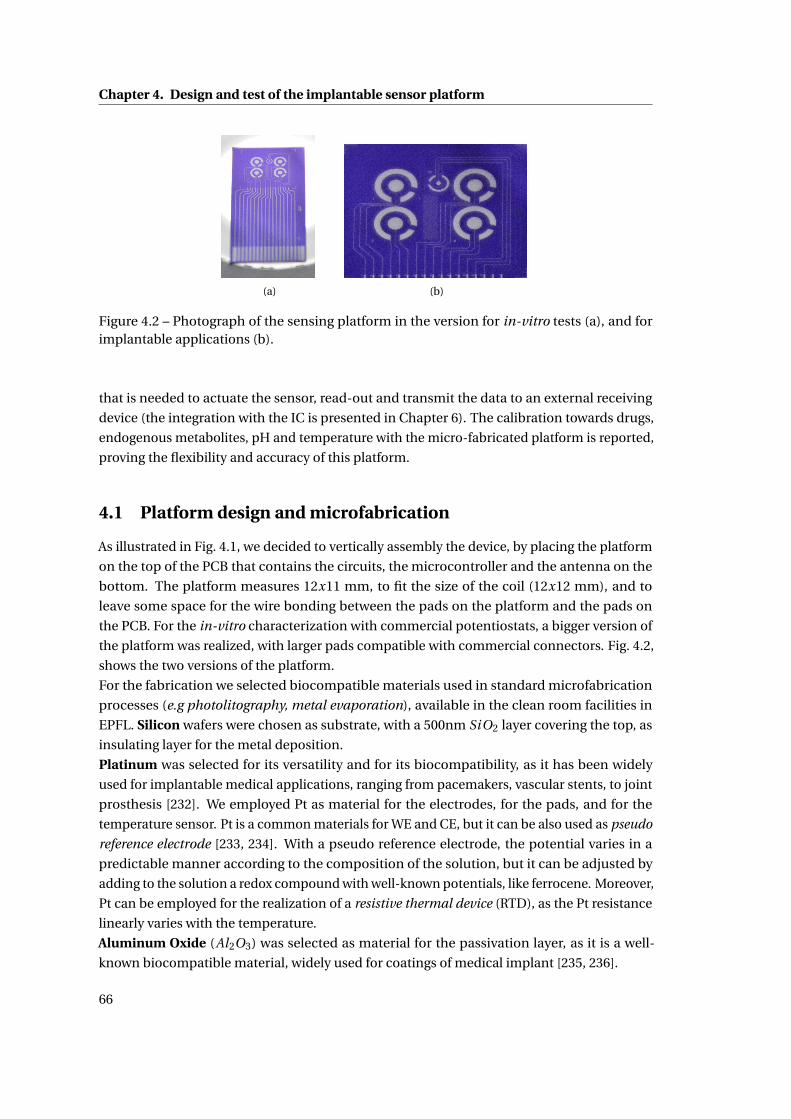
Chapter 4. Design and test of the implantable sensor platform
(a) (b)
Figure 4.2 – Photograph of the sensing platform in the version for in-vitro tests (a), and forimplantable applications (b).
that is needed to actuate the sensor, read-out and transmit the data to an external receiving
device (the integration with the IC is presented in Chapter 6). The calibration towards drugs,
endogenous metabolites, pH and temperature with the micro-fabricated platform is reported,
proving the flexibility and accuracy of this platform.
4.1 Platform design and microfabrication
As illustrated in Fig. 4.1, we decided to vertically assembly the device, by placing the platform
on the top of the PCB that contains the circuits, the microcontroller and the antenna on the
bottom. The platform measures 12x11 mm, to fit the size of the coil (12x12 mm), and to
leave some space for the wire bonding between the pads on the platform and the pads on
the PCB. For the in-vitro characterization with commercial potentiostats, a bigger version of
the platform was realized, with larger pads compatible with commercial connectors. Fig. 4.2,
shows the two versions of the platform.
For the fabrication we selected biocompatible materials used in standard microfabrication
processes (e.g photolitography, metal evaporation), available in the clean room facilities in
EPFL. Silicon wafers were chosen as substrate, with a 500nm SiO2 layer covering the top, as
insulating layer for the metal deposition.
Platinum was selected for its versatility and for its biocompatibility, as it has been widely
used for implantable medical applications, ranging from pacemakers, vascular stents, to joint
prosthesis [232]. We employed Pt as material for the electrodes, for the pads, and for the
temperature sensor. Pt is a common materials for WE and CE, but it can be also used as pseudo
reference electrode [233, 234]. With a pseudo reference electrode, the potential varies in a
predictable manner according to the composition of the solution, but it can be adjusted by
adding to the solution a redox compound with well-known potentials, like ferrocene. Moreover,
Pt can be employed for the realization of a resistive thermal device (RTD), as the Pt resistance
linearly varies with the temperature.
Aluminum Oxide (Al2O3) was selected as material for the passivation layer, as it is a well-
known biocompatible material, widely used for coatings of medical implant [235, 236].
66
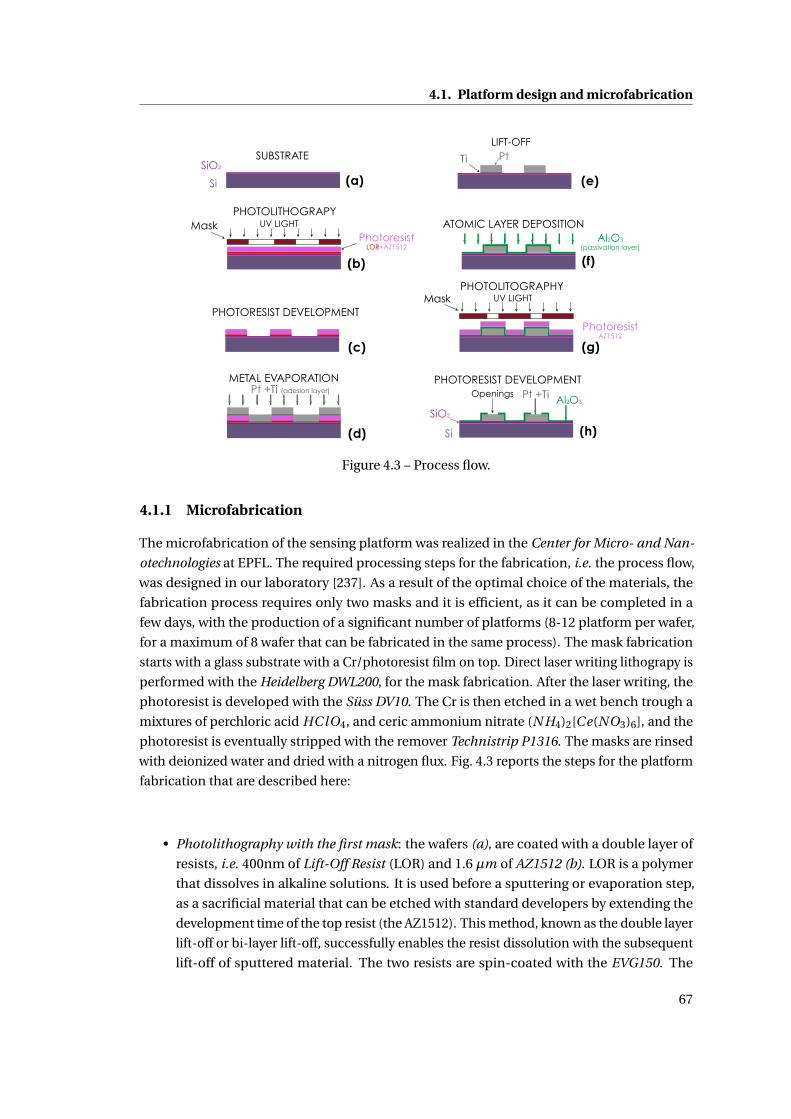
4.1. Platform design and microfabrication
(c)
(b)
(d)
(a)Si
SiO2
SUBSTRATE
Photoresist LOR+AZ1512
UV LIGHTMaskPHOTOLITHOGRAPY
PHOTORESIST DEVELOPMENT
Pt +Ti (adesion layer)
METAL EVAPORATION
(e)
(g)
(f)
(h)
PtTi
LIFT-OFF
Al2O3
(passivation layer)
ATOMIC LAYER DEPOSITION
Photoresist AZ1512
UV LIGHTMaskPHOTOLITOGRAPHY
Al2O3
Si
Openings Pt +Ti
SiO2
PHOTORESIST DEVELOPMENT
Figure 4.3 – Process flow.
4.1.1 Microfabrication
The microfabrication of the sensing platform was realized in the Center for Micro- and Nan-
otechnologies at EPFL. The required processing steps for the fabrication, i.e. the process flow,
was designed in our laboratory [237]. As a result of the optimal choice of the materials, the
fabrication process requires only two masks and it is efficient, as it can be completed in a
few days, with the production of a significant number of platforms (8-12 platform per wafer,
for a maximum of 8 wafer that can be fabricated in the same process). The mask fabrication
starts with a glass substrate with a Cr/photoresist film on top. Direct laser writing lithograpy is
performed with the Heidelberg DWL200, for the mask fabrication. After the laser writing, the
photoresist is developed with the Süss DV10. The Cr is then etched in a wet bench trough a
mixtures of perchloric acid HC lO4, and ceric ammonium nitrate (N H4)2[Ce(NO3)6], and the
photoresist is eventually stripped with the remover Technistrip P1316. The masks are rinsed
with deionized water and dried with a nitrogen flux. Fig. 4.3 reports the steps for the platform
fabrication that are described here:
• Photolithography with the first mask: the wafers (a), are coated with a double layer of
resists, i.e. 400nm of Lift-Off Resist (LOR) and 1.6 µm of AZ1512 (b). LOR is a polymer
that dissolves in alkaline solutions. It is used before a sputtering or evaporation step,
as a sacrificial material that can be etched with standard developers by extending the
development time of the top resist (the AZ1512). This method, known as the double layer
lift-off or bi-layer lift-off, successfully enables the resist dissolution with the subsequent
lift-off of sputtered material. The two resists are spin-coated with the EVG150. The
67
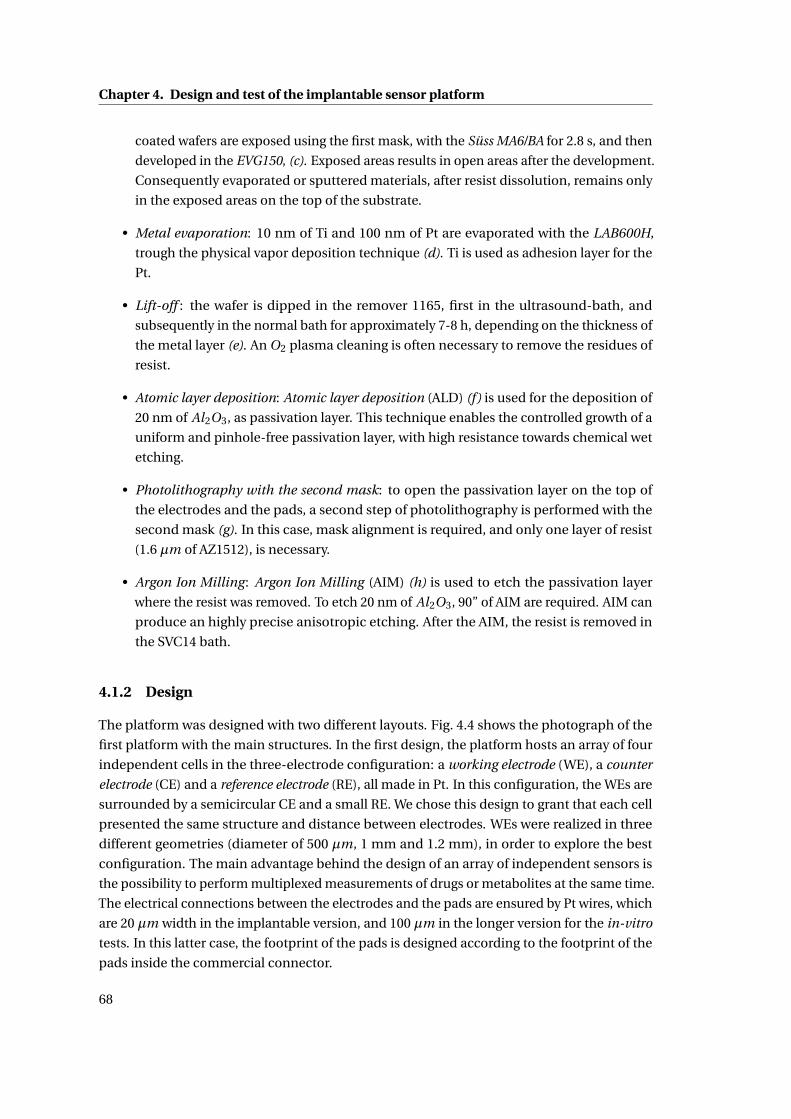
Chapter 4. Design and test of the implantable sensor platform
coated wafers are exposed using the first mask, with the Süss MA6/BA for 2.8 s, and then
developed in the EVG150, (c). Exposed areas results in open areas after the development.
Consequently evaporated or sputtered materials, after resist dissolution, remains only
in the exposed areas on the top of the substrate.
• Metal evaporation: 10 nm of Ti and 100 nm of Pt are evaporated with the LAB600H,
trough the physical vapor deposition technique (d). Ti is used as adhesion layer for the
Pt.
• Lift-off : the wafer is dipped in the remover 1165, first in the ultrasound-bath, and
subsequently in the normal bath for approximately 7-8 h, depending on the thickness of
the metal layer (e). An O2 plasma cleaning is often necessary to remove the residues of
resist.
• Atomic layer deposition: Atomic layer deposition (ALD) (f) is used for the deposition of
20 nm of Al2O3, as passivation layer. This technique enables the controlled growth of a
uniform and pinhole-free passivation layer, with high resistance towards chemical wet
etching.
• Photolithography with the second mask: to open the passivation layer on the top of
the electrodes and the pads, a second step of photolithography is performed with the
second mask (g). In this case, mask alignment is required, and only one layer of resist
(1.6 µm of AZ1512), is necessary.
• Argon Ion Milling: Argon Ion Milling (AIM) (h) is used to etch the passivation layer
where the resist was removed. To etch 20 nm of Al2O3, 90” of AIM are required. AIM can
produce an highly precise anisotropic etching. After the AIM, the resist is removed in
the SVC14 bath.
4.1.2 Design
The platform was designed with two different layouts. Fig. 4.4 shows the photograph of the
first platform with the main structures. In the first design, the platform hosts an array of four
independent cells in the three-electrode configuration: a working electrode (WE), a counter
electrode (CE) and a reference electrode (RE), all made in Pt. In this configuration, the WEs are
surrounded by a semicircular CE and a small RE. We chose this design to grant that each cell
presented the same structure and distance between electrodes. WEs were realized in three
different geometries (diameter of 500 µm, 1 mm and 1.2 mm), in order to explore the best
configuration. The main advantage behind the design of an array of independent sensors is
the possibility to perform multiplexed measurements of drugs or metabolites at the same time.
The electrical connections between the electrodes and the pads are ensured by Pt wires, which
are 20 µm width in the implantable version, and 100 µm in the longer version for the in-vitro
tests. In this latter case, the footprint of the pads is designed according to the footprint of the
pads inside the commercial connector.
68
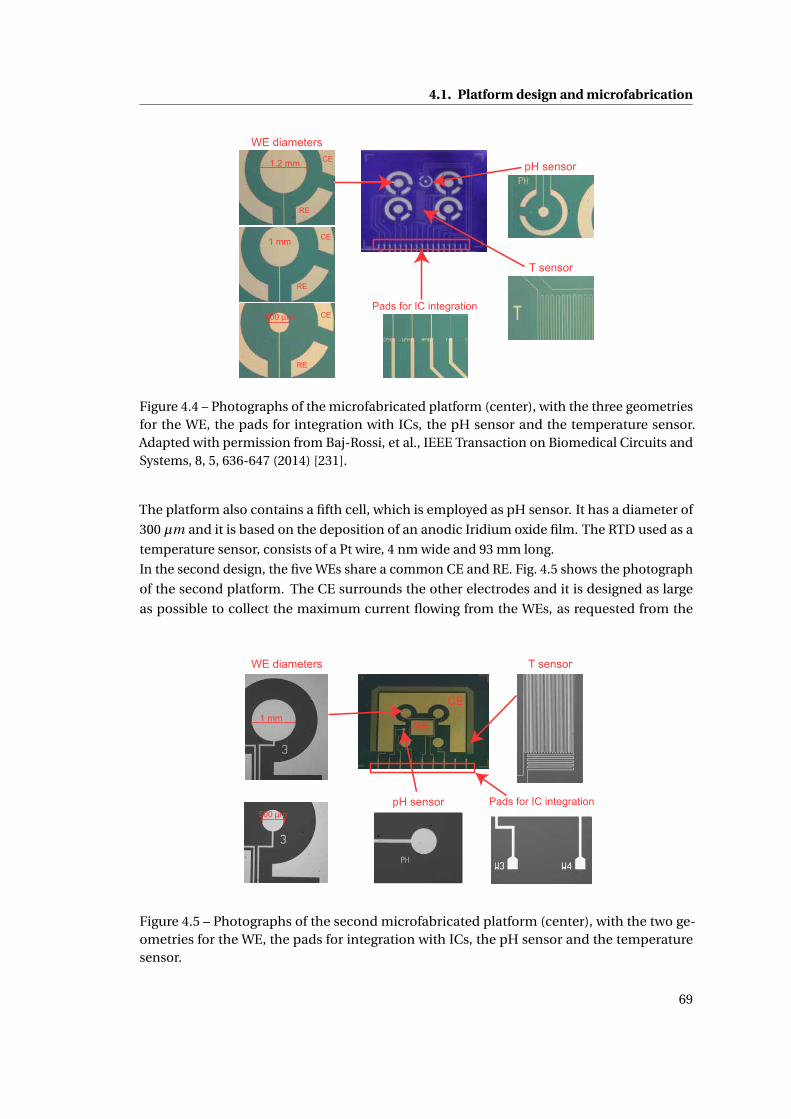
4.1. Platform design and microfabrication
1.2 mm
1 mm
500 µm
RE
CE
CE
CE
RE
RE
WE diameters
T sensor
pH sensor
Pads for IC integration
Figure 4.4 – Photographs of the microfabricated platform (center), with the three geometriesfor the WE, the pads for integration with ICs, the pH sensor and the temperature sensor.Adapted with permission from Baj-Rossi, et al., IEEE Transaction on Biomedical Circuits andSystems, 8, 5, 636-647 (2014) [231].
The platform also contains a fifth cell, which is employed as pH sensor. It has a diameter of
300 µm and it is based on the deposition of an anodic Iridium oxide film. The RTD used as a
temperature sensor, consists of a Pt wire, 4 nm wide and 93 mm long.
In the second design, the five WEs share a common CE and RE. Fig. 4.5 shows the photograph
of the second platform. The CE surrounds the other electrodes and it is designed as large
as possible to collect the maximum current flowing from the WEs, as requested from the
1 mm
500 µm
WE diameters T sensor
pH sensor Pads for IC integration
CE
RE
Figure 4.5 – Photographs of the second microfabricated platform (center), with the two ge-ometries for the WE, the pads for integration with ICs, the pH sensor and the temperaturesensor.
69
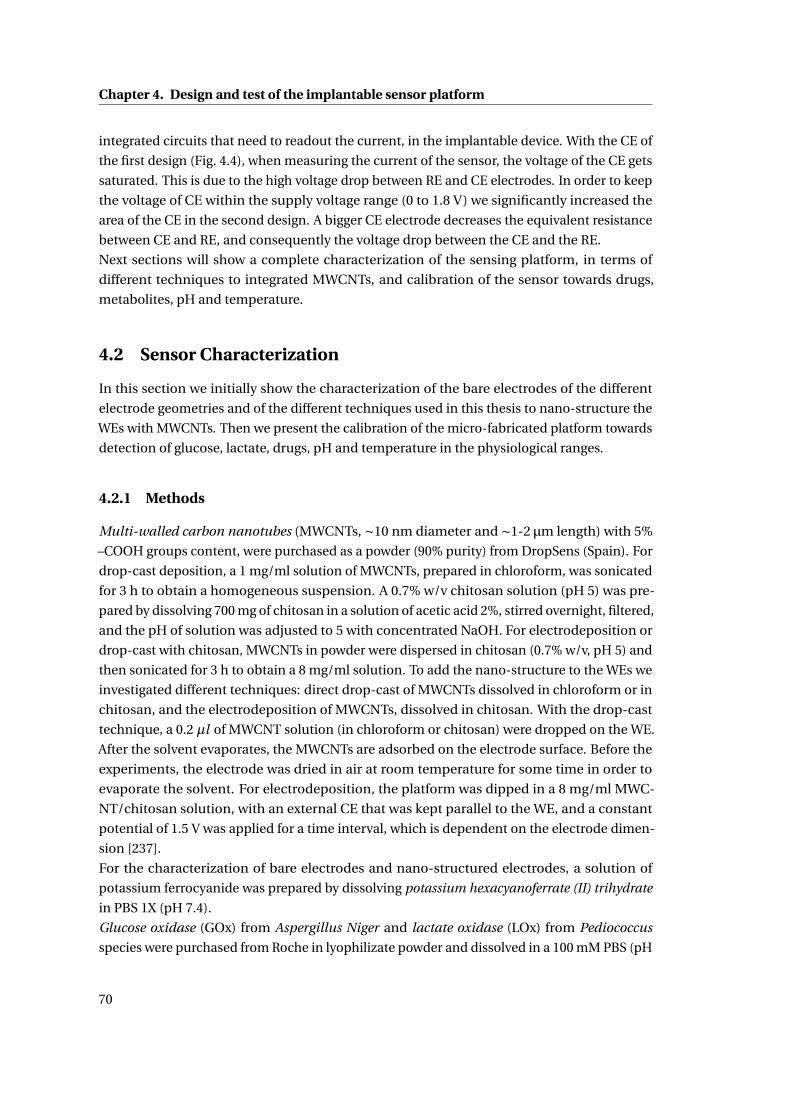
Chapter 4. Design and test of the implantable sensor platform
integrated circuits that need to readout the current, in the implantable device. With the CE of
the first design (Fig. 4.4), when measuring the current of the sensor, the voltage of the CE gets
saturated. This is due to the high voltage drop between RE and CE electrodes. In order to keep
the voltage of CE within the supply voltage range (0 to 1.8 V) we significantly increased the
area of the CE in the second design. A bigger CE electrode decreases the equivalent resistance
between CE and RE, and consequently the voltage drop between the CE and the RE.
Next sections will show a complete characterization of the sensing platform, in terms of
different techniques to integrated MWCNTs, and calibration of the sensor towards drugs,
metabolites, pH and temperature.
4.2 Sensor Characterization
In this section we initially show the characterization of the bare electrodes of the different
electrode geometries and of the different techniques used in this thesis to nano-structure the
WEs with MWCNTs. Then we present the calibration of the micro-fabricated platform towards
detection of glucose, lactate, drugs, pH and temperature in the physiological ranges.
4.2.1 Methods
Multi-walled carbon nanotubes (MWCNTs, ∼10 nm diameter and ∼1-2 µm length) with 5%
–COOH groups content, were purchased as a powder (90% purity) from DropSens (Spain). For
drop-cast deposition, a 1 mg/ml solution of MWCNTs, prepared in chloroform, was sonicated
for 3 h to obtain a homogeneous suspension. A 0.7% w/v chitosan solution (pH 5) was pre-
pared by dissolving 700 mg of chitosan in a solution of acetic acid 2%, stirred overnight, filtered,
and the pH of solution was adjusted to 5 with concentrated NaOH. For electrodeposition or
drop-cast with chitosan, MWCNTs in powder were dispersed in chitosan (0.7% w/v, pH 5) and
then sonicated for 3 h to obtain a 8 mg/ml solution. To add the nano-structure to the WEs we
investigated different techniques: direct drop-cast of MWCNTs dissolved in chloroform or in
chitosan, and the electrodeposition of MWCNTs, dissolved in chitosan. With the drop-cast
technique, a 0.2 µl of MWCNT solution (in chloroform or chitosan) were dropped on the WE.
After the solvent evaporates, the MWCNTs are adsorbed on the electrode surface. Before the
experiments, the electrode was dried in air at room temperature for some time in order to
evaporate the solvent. For electrodeposition, the platform was dipped in a 8 mg/ml MWC-
NT/chitosan solution, with an external CE that was kept parallel to the WE, and a constant
potential of 1.5 V was applied for a time interval, which is dependent on the electrode dimen-
sion [237].
For the characterization of bare electrodes and nano-structured electrodes, a solution of
potassium ferrocyanide was prepared by dissolving potassium hexacyanoferrate (II) trihydrate
in PBS 1X (pH 7.4).
Glucose oxidase (GOx) from Aspergillus Niger and lactate oxidase (LOx) from Pediococcus
species were purchased from Roche in lyophilizate powder and dissolved in a 100 mM PBS (pH
70
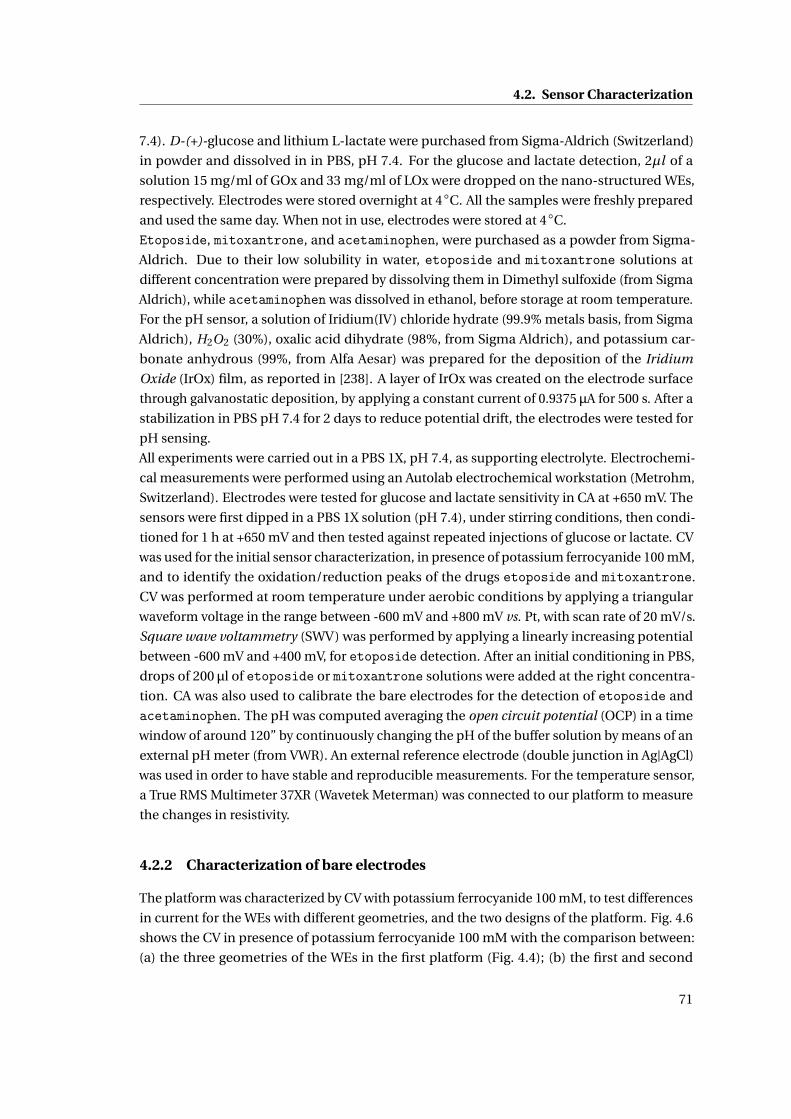
4.2. Sensor Characterization
7.4). D-(+)-glucose and lithium L-lactate were purchased from Sigma-Aldrich (Switzerland)
in powder and dissolved in in PBS, pH 7.4. For the glucose and lactate detection, 2µl of a
solution 15 mg/ml of GOx and 33 mg/ml of LOx were dropped on the nano-structured WEs,
respectively. Electrodes were stored overnight at 4C. All the samples were freshly prepared
and used the same day. When not in use, electrodes were stored at 4C.
Etoposide, mitoxantrone, and acetaminophen, were purchased as a powder from Sigma-
Aldrich. Due to their low solubility in water, etoposide and mitoxantrone solutions at
different concentration were prepared by dissolving them in Dimethyl sulfoxide (from Sigma
Aldrich), while acetaminophen was dissolved in ethanol, before storage at room temperature.
For the pH sensor, a solution of Iridium(IV) chloride hydrate (99.9% metals basis, from Sigma
Aldrich), H2O2 (30%), oxalic acid dihydrate (98%, from Sigma Aldrich), and potassium car-
bonate anhydrous (99%, from Alfa Aesar) was prepared for the deposition of the Iridium
Oxide (IrOx) film, as reported in [238]. A layer of IrOx was created on the electrode surface
through galvanostatic deposition, by applying a constant current of 0.9375 µA for 500 s. After a
stabilization in PBS pH 7.4 for 2 days to reduce potential drift, the electrodes were tested for
pH sensing.
All experiments were carried out in a PBS 1X, pH 7.4, as supporting electrolyte. Electrochemi-
cal measurements were performed using an Autolab electrochemical workstation (Metrohm,
Switzerland). Electrodes were tested for glucose and lactate sensitivity in CA at +650 mV. The
sensors were first dipped in a PBS 1X solution (pH 7.4), under stirring conditions, then condi-
tioned for 1 h at +650 mV and then tested against repeated injections of glucose or lactate. CV
was used for the initial sensor characterization, in presence of potassium ferrocyanide 100 mM,
and to identify the oxidation/reduction peaks of the drugs etoposide and mitoxantrone.
CV was performed at room temperature under aerobic conditions by applying a triangular
waveform voltage in the range between -600 mV and +800 mV vs. Pt, with scan rate of 20 mV/s.
Square wave voltammetry (SWV) was performed by applying a linearly increasing potential
between -600 mV and +400 mV, for etoposide detection. After an initial conditioning in PBS,
drops of 200 µl of etoposide or mitoxantrone solutions were added at the right concentra-
tion. CA was also used to calibrate the bare electrodes for the detection of etoposide and
acetaminophen. The pH was computed averaging the open circuit potential (OCP) in a time
window of around 120” by continuously changing the pH of the buffer solution by means of an
external pH meter (from VWR). An external reference electrode (double junction in Ag|AgCl)
was used in order to have stable and reproducible measurements. For the temperature sensor,
a True RMS Multimeter 37XR (Wavetek Meterman) was connected to our platform to measure
the changes in resistivity.
4.2.2 Characterization of bare electrodes
The platform was characterized by CV with potassium ferrocyanide 100 mM, to test differences
in current for the WEs with different geometries, and the two designs of the platform. Fig. 4.6
shows the CV in presence of potassium ferrocyanide 100 mM with the comparison between:
(a) the three geometries of the WEs in the first platform (Fig. 4.4); (b) the first and second
71
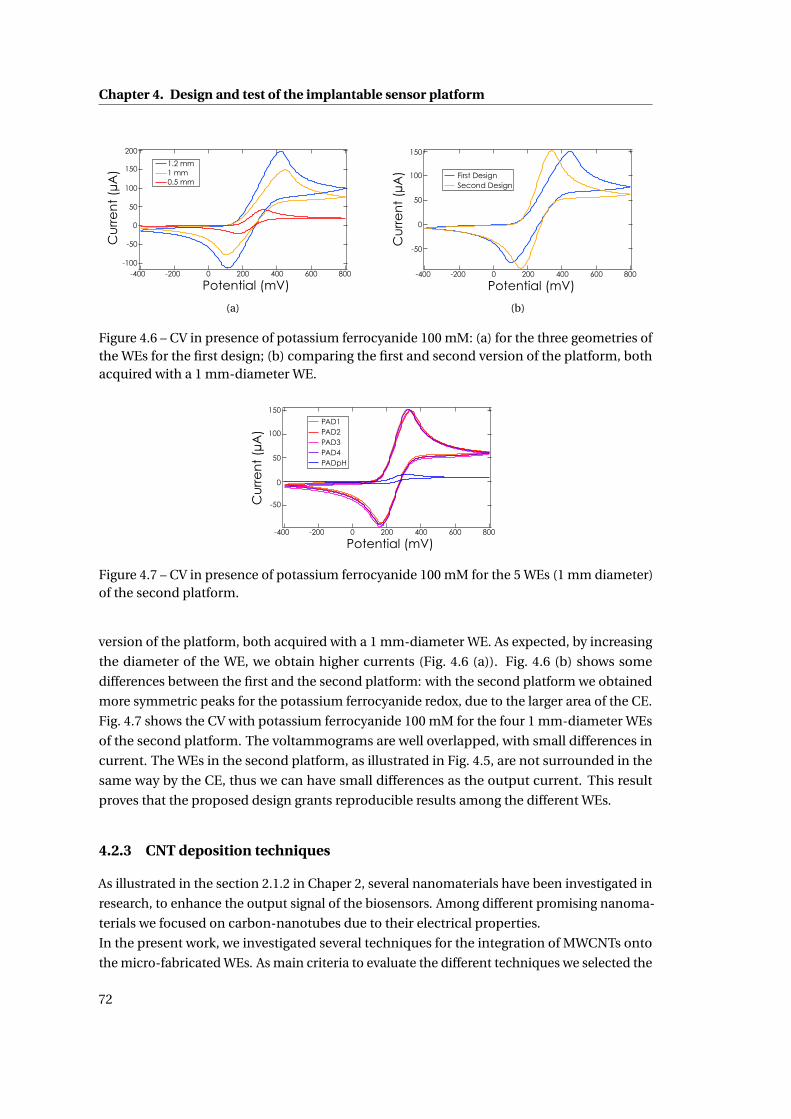
Chapter 4. Design and test of the implantable sensor platformC
urr
en
t (µ
A)
Potential (mV)
200
150
100
50
0
-50
-100-400 -200 0 200 400 600 800
1.2 mm1 mm0.5 mm
(a)
150
100
50
0
-50
Potential (mV)-400 -200 0 200 400 600 800
Cu
rre
nt
(µA
) First DesignSecond Design
(b)
Figure 4.6 – CV in presence of potassium ferrocyanide 100 mM: (a) for the three geometries ofthe WEs for the first design; (b) comparing the first and second version of the platform, bothacquired with a 1 mm-diameter WE.
150
100
50
0
-50
Potential (mV)-400 -200 0 200 400 600 800
Cu
rre
nt
(µA
)
PAD1PAD2PAD3PAD4PADpH
Figure 4.7 – CV in presence of potassium ferrocyanide 100 mM for the 5 WEs (1 mm diameter)of the second platform.
version of the platform, both acquired with a 1 mm-diameter WE. As expected, by increasing
the diameter of the WE, we obtain higher currents (Fig. 4.6 (a)). Fig. 4.6 (b) shows some
differences between the first and the second platform: with the second platform we obtained
more symmetric peaks for the potassium ferrocyanide redox, due to the larger area of the CE.
Fig. 4.7 shows the CV with potassium ferrocyanide 100 mM for the four 1 mm-diameter WEs
of the second platform. The voltammograms are well overlapped, with small differences in
current. The WEs in the second platform, as illustrated in Fig. 4.5, are not surrounded in the
same way by the CE, thus we can have small differences as the output current. This result
proves that the proposed design grants reproducible results among the different WEs.
4.2.3 CNT deposition techniques
As illustrated in the section 2.1.2 in Chaper 2, several nanomaterials have been investigated in
research, to enhance the output signal of the biosensors. Among different promising nanoma-
terials we focused on carbon-nanotubes due to their electrical properties.
In the present work, we investigated several techniques for the integration of MWCNTs onto
the micro-fabricated WEs. As main criteria to evaluate the different techniques we selected the
72
4.2. Sensor Characterization
200 µm 200 µm
Figure 4.8 – SEM of WEs with 500µm diameter, nano-structured with drop-cast MWCNTs (onthe left), and electrodeposited MWCNTs in a chitosan matrix (on the right).
efficacy to measure the analyte of interest within the pharmacological range, the simplicity of
the technique, and the biocompatibility, taking into account that the final goal of this project
is the integration of MWCNTs in an implantable device.
The first technique is the direct drop-cast of a solution of MWCNTs dissolved in chloroform, as
illustrated in the previous chapter for the measurements with screen-printed electrodes. With
micro-fabricated electrodes, subsequent drops of solutions were drop-cast on the WEs, with
a volume of 0.05µl −0.1µl , until 0.2µg of MWCNTs were adsorbed on the electrode surface.
This amount of MWCNTs was optimized by evaluating the performances of the sensor towards
glucose detection. Despite the simplicity of this technique, the precision of the deposition and
the repeatability is relatively low, as illustrated by the SEM in Fig. 4.8, on the left. A method to
control the deposition of MWCNTs and to ensure the repeatability of the deposition on differ-
ent sensors, is to check the similarity of the voltammogram by running a CV measurement
after CNT deposition.
In our group other techniques were investigated to integrate MWCNTs on micro-fabricated
electrodes: direct growth through chemical vapor deposition [239], and micro-spotting of
MWCNTs dissolved in Nafion [240]. While the direct growth is a very promising method,
as it enables the precise growth of CNTs and other nano-structures on electrodes with high
density, micro-spotting present a limited precision, as the spot size is fixed and limited by
the instrument resolution. As alternative technique, we investigated the electrodeposition of
MWCNTs in chitosan. Chitosan is a natural polysaccharide obtained from the deacetylation
of chitin, abundant in natural environment with low toxicity. Chitosan offers a unique set
of characteristics such as biocompatibility, simplicity of chemical modifications, superior
permeability to water, and biodegradability to harmless products, antibacterial properties,
gel-forming properties, and good adhesion properties due to hydrophilicity, physiological
inertness and affinity towards proteins. Due to its advantageous features, chitosan is one of
the most used biopolymers for the immobilization of enzymes and CNTs [241, 242, 243] for
biosensing applications [244].
Chitosan undergoes pH-dependent hydrogel formation, at the electrode interface. Carbon
nanotubes or other nano-materials can be incorporated in the chitosan solution for realiz-
ing subsequent immobilization on the electrode. Fig. 4.9 illustrates the electrodeposition of
73
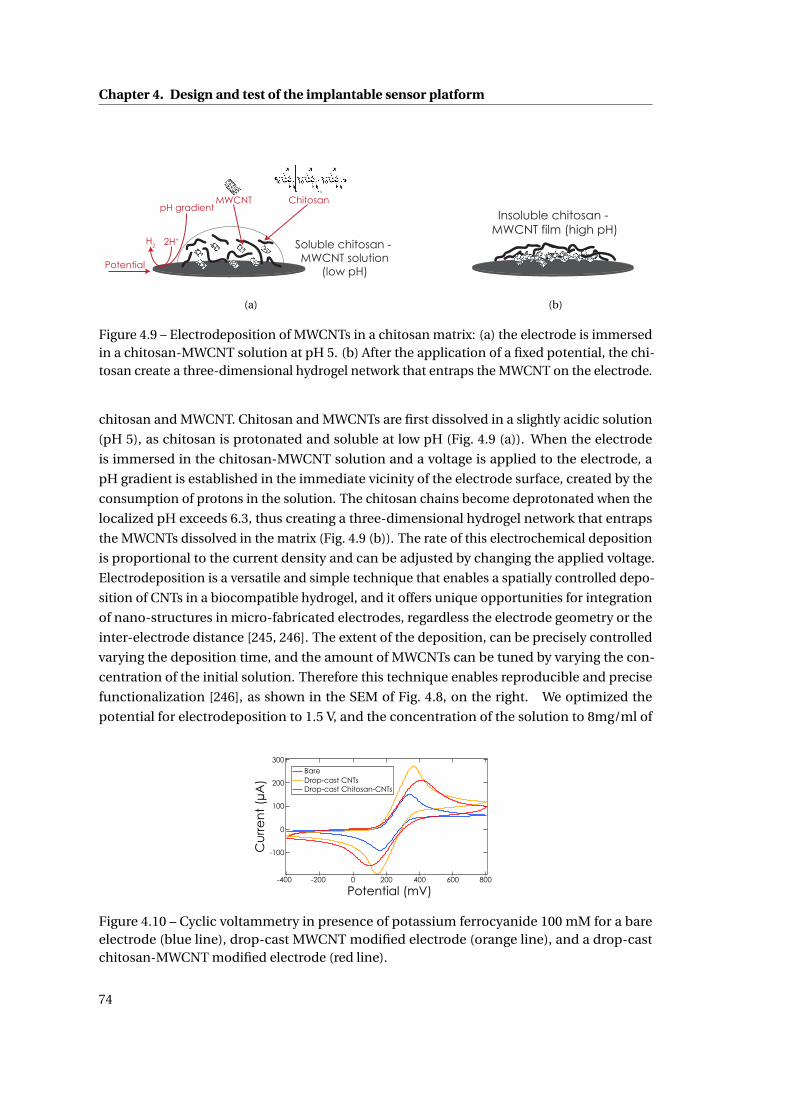
Chapter 4. Design and test of the implantable sensor platform
Soluble chitosan - MWCNT solution
(low pH)
ChitosanMWCNT
H2 2H+
pH gradient
Potential
(a)
Insoluble chitosan - MWCNT film (high pH)
(b)
Figure 4.9 – Electrodeposition of MWCNTs in a chitosan matrix: (a) the electrode is immersedin a chitosan-MWCNT solution at pH 5. (b) After the application of a fixed potential, the chi-tosan create a three-dimensional hydrogel network that entraps the MWCNT on the electrode.
chitosan and MWCNT. Chitosan and MWCNTs are first dissolved in a slightly acidic solution
(pH 5), as chitosan is protonated and soluble at low pH (Fig. 4.9 (a)). When the electrode
is immersed in the chitosan-MWCNT solution and a voltage is applied to the electrode, a
pH gradient is established in the immediate vicinity of the electrode surface, created by the
consumption of protons in the solution. The chitosan chains become deprotonated when the
localized pH exceeds 6.3, thus creating a three-dimensional hydrogel network that entraps
the MWCNTs dissolved in the matrix (Fig. 4.9 (b)). The rate of this electrochemical deposition
is proportional to the current density and can be adjusted by changing the applied voltage.
Electrodeposition is a versatile and simple technique that enables a spatially controlled depo-
sition of CNTs in a biocompatible hydrogel, and it offers unique opportunities for integration
of nano-structures in micro-fabricated electrodes, regardless the electrode geometry or the
inter-electrode distance [245, 246]. The extent of the deposition, can be precisely controlled
varying the deposition time, and the amount of MWCNTs can be tuned by varying the con-
centration of the initial solution. Therefore this technique enables reproducible and precise
functionalization [246], as shown in the SEM of Fig. 4.8, on the right. We optimized the
potential for electrodeposition to 1.5 V, and the concentration of the solution to 8mg/ml of
300
200
100
0
-100
Potential (mV)-400 -200 0 200 400 600 800
Cu
rre
nt
(µA
)
BareDrop-cast CNTsDrop-cast Chitosan-CNTs
Figure 4.10 – Cyclic voltammetry in presence of potassium ferrocyanide 100 mM for a bareelectrode (blue line), drop-cast MWCNT modified electrode (orange line), and a drop-castchitosan-MWCNT modified electrode (red line).
74
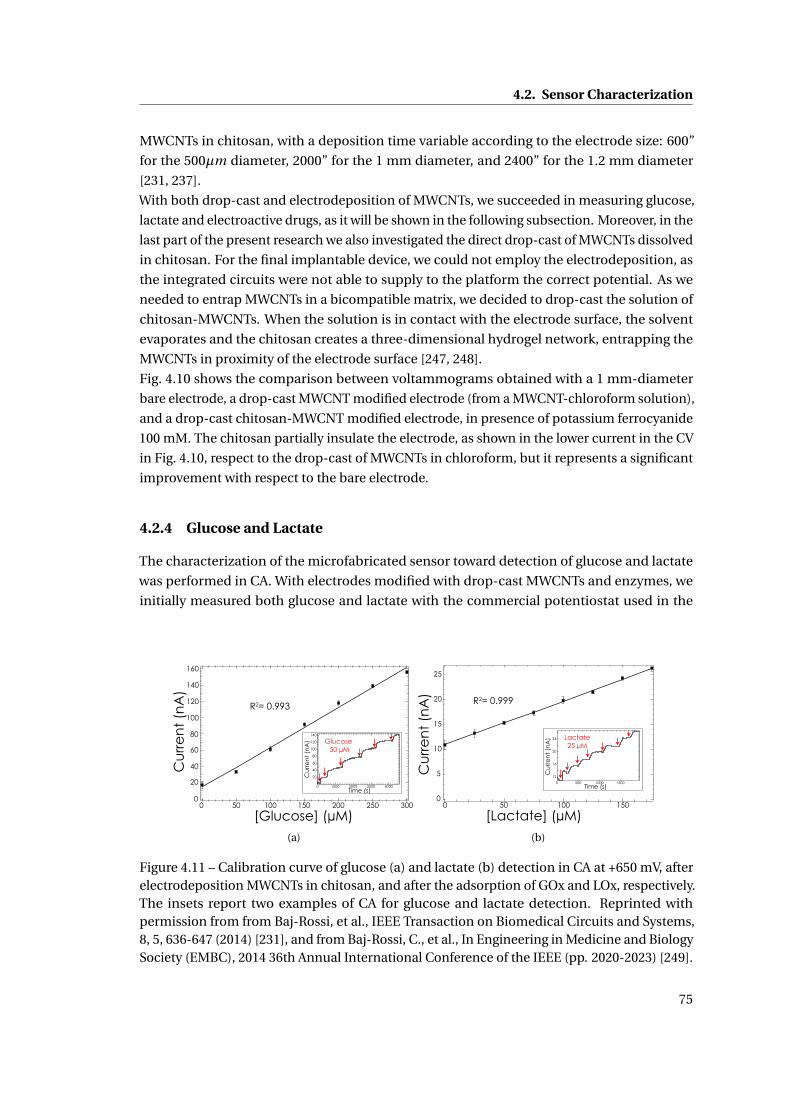
4.2. Sensor Characterization
MWCNTs in chitosan, with a deposition time variable according to the electrode size: 600”
for the 500µm diameter, 2000” for the 1 mm diameter, and 2400” for the 1.2 mm diameter
[231, 237].
With both drop-cast and electrodeposition of MWCNTs, we succeeded in measuring glucose,
lactate and electroactive drugs, as it will be shown in the following subsection. Moreover, in the
last part of the present research we also investigated the direct drop-cast of MWCNTs dissolved
in chitosan. For the final implantable device, we could not employ the electrodeposition, as
the integrated circuits were not able to supply to the platform the correct potential. As we
needed to entrap MWCNTs in a bicompatible matrix, we decided to drop-cast the solution of
chitosan-MWCNTs. When the solution is in contact with the electrode surface, the solvent
evaporates and the chitosan creates a three-dimensional hydrogel network, entrapping the
MWCNTs in proximity of the electrode surface [247, 248].
Fig. 4.10 shows the comparison between voltammograms obtained with a 1 mm-diameter
bare electrode, a drop-cast MWCNT modified electrode (from a MWCNT-chloroform solution),
and a drop-cast chitosan-MWCNT modified electrode, in presence of potassium ferrocyanide
100 mM. The chitosan partially insulate the electrode, as shown in the lower current in the CV
in Fig. 4.10, respect to the drop-cast of MWCNTs in chloroform, but it represents a significant
improvement with respect to the bare electrode.
4.2.4 Glucose and Lactate
The characterization of the microfabricated sensor toward detection of glucose and lactate
was performed in CA. With electrodes modified with drop-cast MWCNTs and enzymes, we
initially measured both glucose and lactate with the commercial potentiostat used in the
[Glucose] (µM)
R2= 0.993
Cu
rre
nt
(nA
)
120
100
80
60
40
20
0300250200150100500
140
160
140
120
100
80
60
40
20
40003000200010000
Glucose 50 µM
Time (s)
Cu
rre
nt
(nA
)
(a)
[Lactate] (µM)
Cu
rre
nt
(nA
)
R2= 0.999
25
20
15
10
5
0150100500
Time (s)
Lactate25 µM
24
20
16
12
150010005000
Cu
rre
nt
(nA
)
(b)
Figure 4.11 – Calibration curve of glucose (a) and lactate (b) detection in CA at +650 mV, afterelectrodeposition MWCNTs in chitosan, and after the adsorption of GOx and LOx, respectively.The insets report two examples of CA for glucose and lactate detection. Reprinted withpermission from from Baj-Rossi, et al., IEEE Transaction on Biomedical Circuits and Systems,8, 5, 636-647 (2014) [231], and from Baj-Rossi, C., et al., In Engineering in Medicine and BiologySociety (EMBC), 2014 36th Annual International Conference of the IEEE (pp. 2020-2023) [249].
75
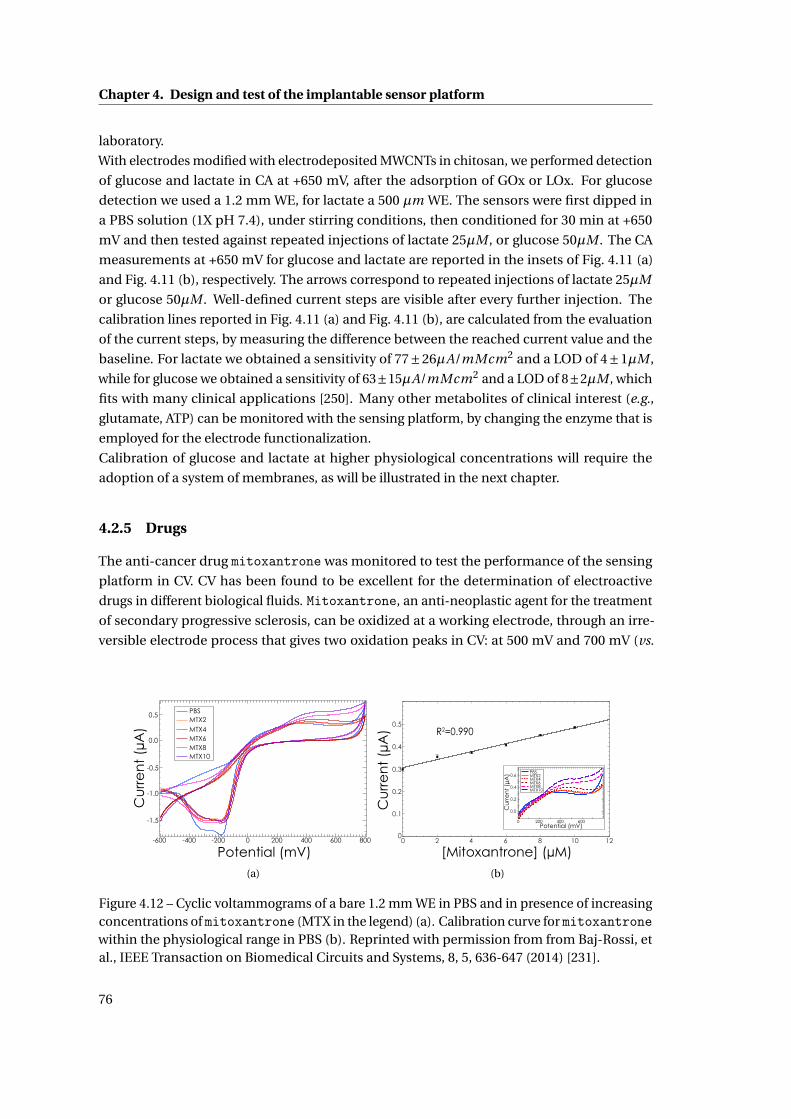
Chapter 4. Design and test of the implantable sensor platform
laboratory.
With electrodes modified with electrodeposited MWCNTs in chitosan, we performed detection
of glucose and lactate in CA at +650 mV, after the adsorption of GOx or LOx. For glucose
detection we used a 1.2 mm WE, for lactate a 500 µm WE. The sensors were first dipped in
a PBS solution (1X pH 7.4), under stirring conditions, then conditioned for 30 min at +650
mV and then tested against repeated injections of lactate 25µM , or glucose 50µM . The CA
measurements at +650 mV for glucose and lactate are reported in the insets of Fig. 4.11 (a)
and Fig. 4.11 (b), respectively. The arrows correspond to repeated injections of lactate 25µM
or glucose 50µM . Well-defined current steps are visible after every further injection. The
calibration lines reported in Fig. 4.11 (a) and Fig. 4.11 (b), are calculated from the evaluation
of the current steps, by measuring the difference between the reached current value and the
baseline. For lactate we obtained a sensitivity of 77±26µA/mMcm2 and a LOD of 4±1µM ,
while for glucose we obtained a sensitivity of 63±15µA/mMcm2 and a LOD of 8±2µM , which
fits with many clinical applications [250]. Many other metabolites of clinical interest (e.g.,
glutamate, ATP) can be monitored with the sensing platform, by changing the enzyme that is
employed for the electrode functionalization.
Calibration of glucose and lactate at higher physiological concentrations will require the
adoption of a system of membranes, as will be illustrated in the next chapter.
4.2.5 Drugs
The anti-cancer drug mitoxantrone was monitored to test the performance of the sensing
platform in CV. CV has been found to be excellent for the determination of electroactive
drugs in different biological fluids. Mitoxantrone, an anti-neoplastic agent for the treatment
of secondary progressive sclerosis, can be oxidized at a working electrode, through an irre-
versible electrode process that gives two oxidation peaks in CV: at 500 mV and 700 mV (vs.
Cu
rre
nt
(µA
)
Potential (mV)
-1.5
-1.0
-0.5
0.0
0.5
8006004002000-200-400-600
PBS MTX2 MTX4 MTX6 MTX8 MTX10
(a)
[Mitoxantrone] (µM)
R2=0.990
Cu
rre
nt
(µA
)
0.6
0.4
0.2
0.0
6004002000Potential (mV)
PBS MTX2 MTX4 MTX6 MTX8 MTX10
Cu
rre
nt
(µA
)
0 2 4 6 8 10 120
0.1
0.2
0.3
0.4
0.5
(b)
Figure 4.12 – Cyclic voltammograms of a bare 1.2 mm WE in PBS and in presence of increasingconcentrations of mitoxantrone (MTX in the legend) (a). Calibration curve for mitoxantronewithin the physiological range in PBS (b). Reprinted with permission from from Baj-Rossi, etal., IEEE Transaction on Biomedical Circuits and Systems, 8, 5, 636-647 (2014) [231].
76
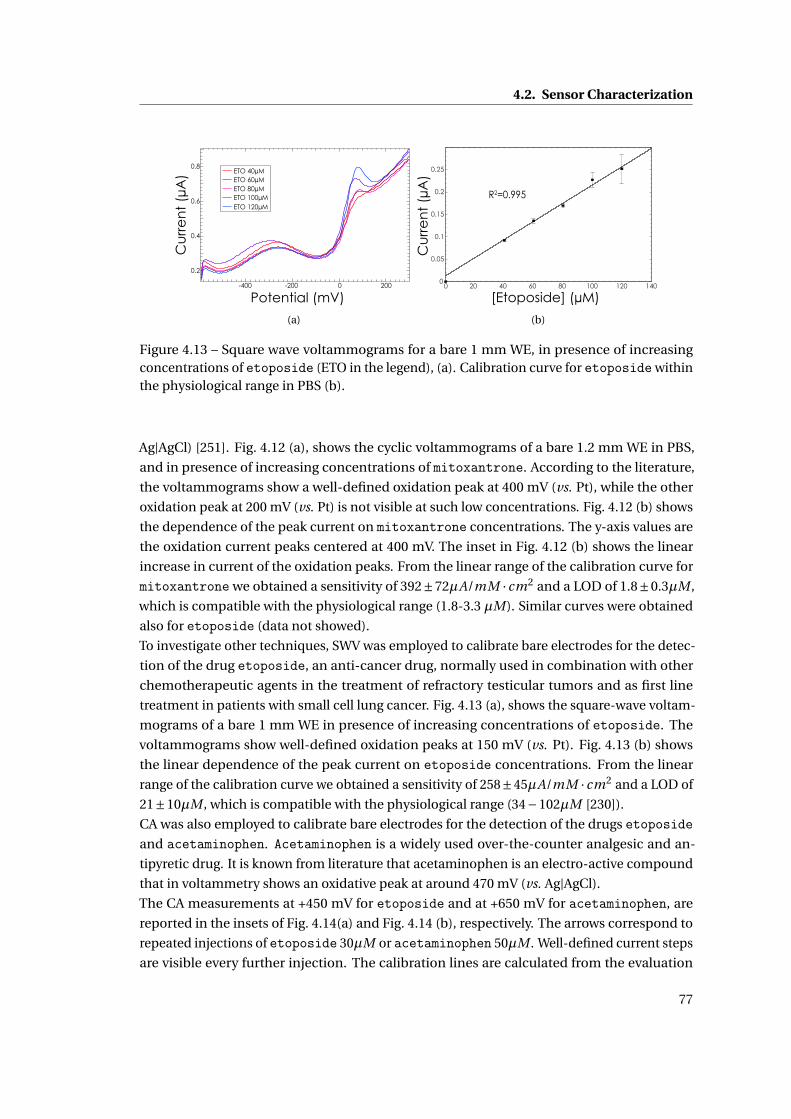
4.2. Sensor Characterization
0.8
0.6
0.4
0.2
-400 -200 0 200
ETO 40µM ETO 60µM ETO 80µM ETO 100µM ETO 120µM
Potential (mV)
Cu
rre
nt
(µA
)
(a)
Cu
rre
nt
(µA
)
[Etoposide] (µM)
R2=0.995
0 20 40 60 80 100 120 1400
0.05
0.1
0.15
0.2
0.25
(b)
Figure 4.13 – Square wave voltammograms for a bare 1 mm WE, in presence of increasingconcentrations of etoposide (ETO in the legend), (a). Calibration curve for etoposide withinthe physiological range in PBS (b).
Ag|AgCl) [251]. Fig. 4.12 (a), shows the cyclic voltammograms of a bare 1.2 mm WE in PBS,
and in presence of increasing concentrations of mitoxantrone. According to the literature,
the voltammograms show a well-defined oxidation peak at 400 mV (vs. Pt), while the other
oxidation peak at 200 mV (vs. Pt) is not visible at such low concentrations. Fig. 4.12 (b) shows
the dependence of the peak current on mitoxantrone concentrations. The y-axis values are
the oxidation current peaks centered at 400 mV. The inset in Fig. 4.12 (b) shows the linear
increase in current of the oxidation peaks. From the linear range of the calibration curve for
mitoxantrone we obtained a sensitivity of 392±72µA/mM · cm2 and a LOD of 1.8±0.3µM ,
which is compatible with the physiological range (1.8-3.3 µM). Similar curves were obtained
also for etoposide (data not showed).
To investigate other techniques, SWV was employed to calibrate bare electrodes for the detec-
tion of the drug etoposide, an anti-cancer drug, normally used in combination with other
chemotherapeutic agents in the treatment of refractory testicular tumors and as first line
treatment in patients with small cell lung cancer. Fig. 4.13 (a), shows the square-wave voltam-
mograms of a bare 1 mm WE in presence of increasing concentrations of etoposide. The
voltammograms show well-defined oxidation peaks at 150 mV (vs. Pt). Fig. 4.13 (b) shows
the linear dependence of the peak current on etoposide concentrations. From the linear
range of the calibration curve we obtained a sensitivity of 258±45µA/mM · cm2 and a LOD of
21±10µM , which is compatible with the physiological range (34−102µM [230]).
CA was also employed to calibrate bare electrodes for the detection of the drugs etoposideand acetaminophen. Acetaminophen is a widely used over-the-counter analgesic and an-
tipyretic drug. It is known from literature that acetaminophen is an electro-active compound
that in voltammetry shows an oxidative peak at around 470 mV (vs. Ag|AgCl).
The CA measurements at +450 mV for etoposide and at +650 mV for acetaminophen, are
reported in the insets of Fig. 4.14(a) and Fig. 4.14 (b), respectively. The arrows correspond to
repeated injections of etoposide 30µM or acetaminophen 50µM . Well-defined current steps
are visible every further injection. The calibration lines are calculated from the evaluation
77
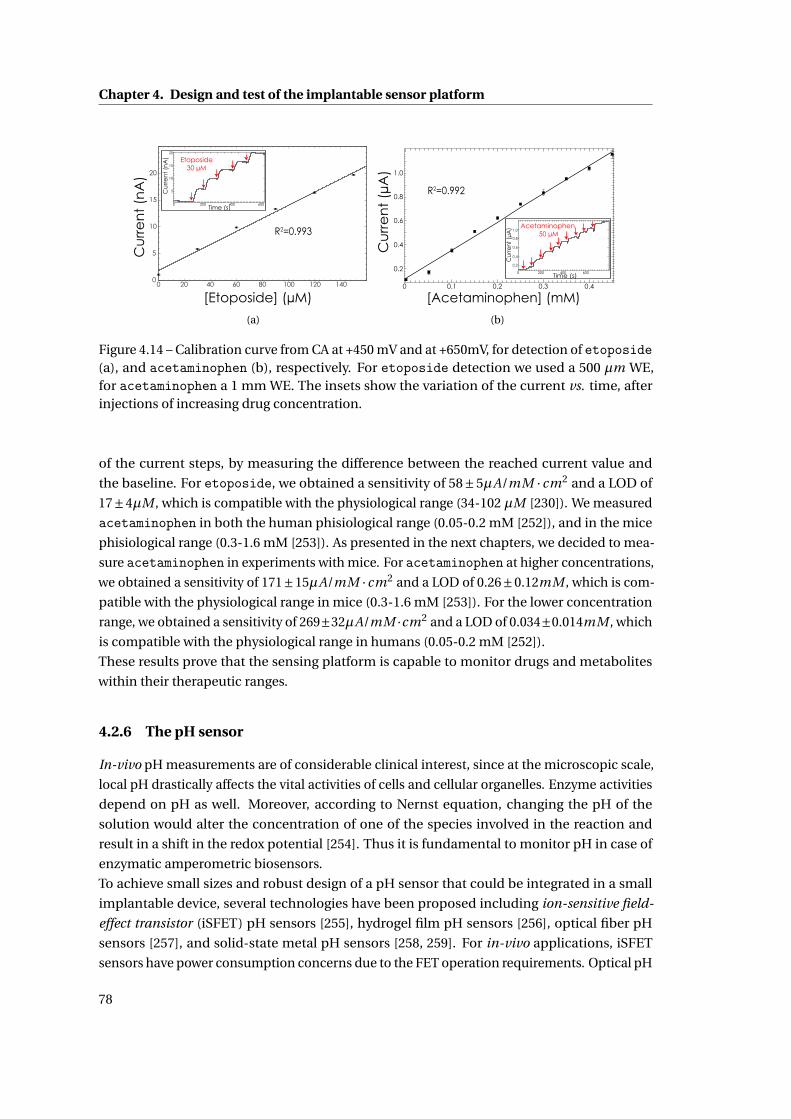
Chapter 4. Design and test of the implantable sensor platform
Cu
rre
nt
(nA
)
[Etoposide] (µM)
Cu
rre
nt
(nA
)
Time (s)
20
15
10
5
0 200 400 600
Etoposide30 µM
R2=0.993
0 20 40 60 80 100 120 1400
5
10
15
20
(a)
Cu
rre
nt
(µA
)
[Acetaminophen] (mM)
1.0
0.8
0.6
0.4
0.2
0.1 0.2 0.3 0.4
R2=0.992
Cur
rent
(µA
)
Time (s)
1.0
0.8
0.6
0.4
0 200 400 600
Acetaminophen 50 µM
0.2
0
(b)
Figure 4.14 – Calibration curve from CA at +450 mV and at +650mV, for detection of etoposide(a), and acetaminophen (b), respectively. For etoposide detection we used a 500 µm WE,for acetaminophen a 1 mm WE. The insets show the variation of the current vs. time, afterinjections of increasing drug concentration.
of the current steps, by measuring the difference between the reached current value and
the baseline. For etoposide, we obtained a sensitivity of 58±5µA/mM · cm2 and a LOD of
17±4µM , which is compatible with the physiological range (34-102 µM [230]). We measured
acetaminophen in both the human phisiological range (0.05-0.2 mM [252]), and in the mice
phisiological range (0.3-1.6 mM [253]). As presented in the next chapters, we decided to mea-
sure acetaminophen in experiments with mice. For acetaminophen at higher concentrations,
we obtained a sensitivity of 171±15µA/mM ·cm2 and a LOD of 0.26±0.12mM , which is com-
patible with the physiological range in mice (0.3-1.6 mM [253]). For the lower concentration
range, we obtained a sensitivity of 269±32µA/mM ·cm2 and a LOD of 0.034±0.014mM , which
is compatible with the physiological range in humans (0.05-0.2 mM [252]).
These results prove that the sensing platform is capable to monitor drugs and metabolites
within their therapeutic ranges.
4.2.6 The pH sensor
In-vivo pH measurements are of considerable clinical interest, since at the microscopic scale,
local pH drastically affects the vital activities of cells and cellular organelles. Enzyme activities
depend on pH as well. Moreover, according to Nernst equation, changing the pH of the
solution would alter the concentration of one of the species involved in the reaction and
result in a shift in the redox potential [254]. Thus it is fundamental to monitor pH in case of
enzymatic amperometric biosensors.
To achieve small sizes and robust design of a pH sensor that could be integrated in a small
implantable device, several technologies have been proposed including ion-sensitive field-
effect transistor (iSFET) pH sensors [255], hydrogel film pH sensors [256], optical fiber pH
sensors [257], and solid-state metal pH sensors [258, 259]. For in-vivo applications, iSFET
sensors have power consumption concerns due to the FET operation requirements. Optical pH
78
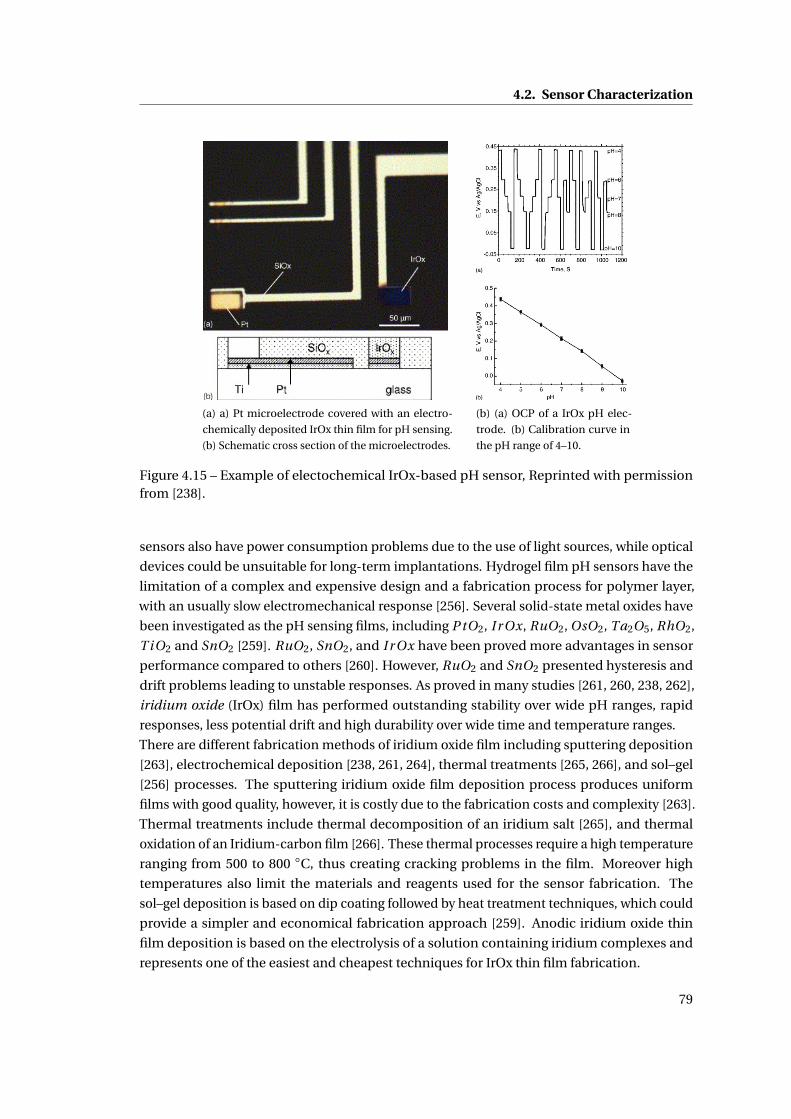
4.2. Sensor Characterization
(a) a) Pt microelectrode covered with an electro-
chemically deposited IrOx thin film for pH sensing.
(b) Schematic cross section of the microelectrodes.
(b) (a) OCP of a IrOx pH elec-
trode. (b) Calibration curve in
the pH range of 4–10.
Figure 4.15 – Example of electochemical IrOx-based pH sensor, Reprinted with permissionfrom [238].
sensors also have power consumption problems due to the use of light sources, while optical
devices could be unsuitable for long-term implantations. Hydrogel film pH sensors have the
limitation of a complex and expensive design and a fabrication process for polymer layer,
with an usually slow electromechanical response [256]. Several solid-state metal oxides have
been investigated as the pH sensing films, including P tO2, I r Ox, RuO2, OsO2, Ta2O5, RhO2,
T iO2 and SnO2 [259]. RuO2, SnO2, and I r Ox have been proved more advantages in sensor
performance compared to others [260]. However, RuO2 and SnO2 presented hysteresis and
drift problems leading to unstable responses. As proved in many studies [261, 260, 238, 262],
iridium oxide (IrOx) film has performed outstanding stability over wide pH ranges, rapid
responses, less potential drift and high durability over wide time and temperature ranges.
There are different fabrication methods of iridium oxide film including sputtering deposition
[263], electrochemical deposition [238, 261, 264], thermal treatments [265, 266], and sol–gel
[256] processes. The sputtering iridium oxide film deposition process produces uniform
films with good quality, however, it is costly due to the fabrication costs and complexity [263].
Thermal treatments include thermal decomposition of an iridium salt [265], and thermal
oxidation of an Iridium-carbon film [266]. These thermal processes require a high temperature
ranging from 500 to 800 C, thus creating cracking problems in the film. Moreover high
temperatures also limit the materials and reagents used for the sensor fabrication. The
sol–gel deposition is based on dip coating followed by heat treatment techniques, which could
provide a simpler and economical fabrication approach [259]. Anodic iridium oxide thin
film deposition is based on the electrolysis of a solution containing iridium complexes and
represents one of the easiest and cheapest techniques for IrOx thin film fabrication.
79
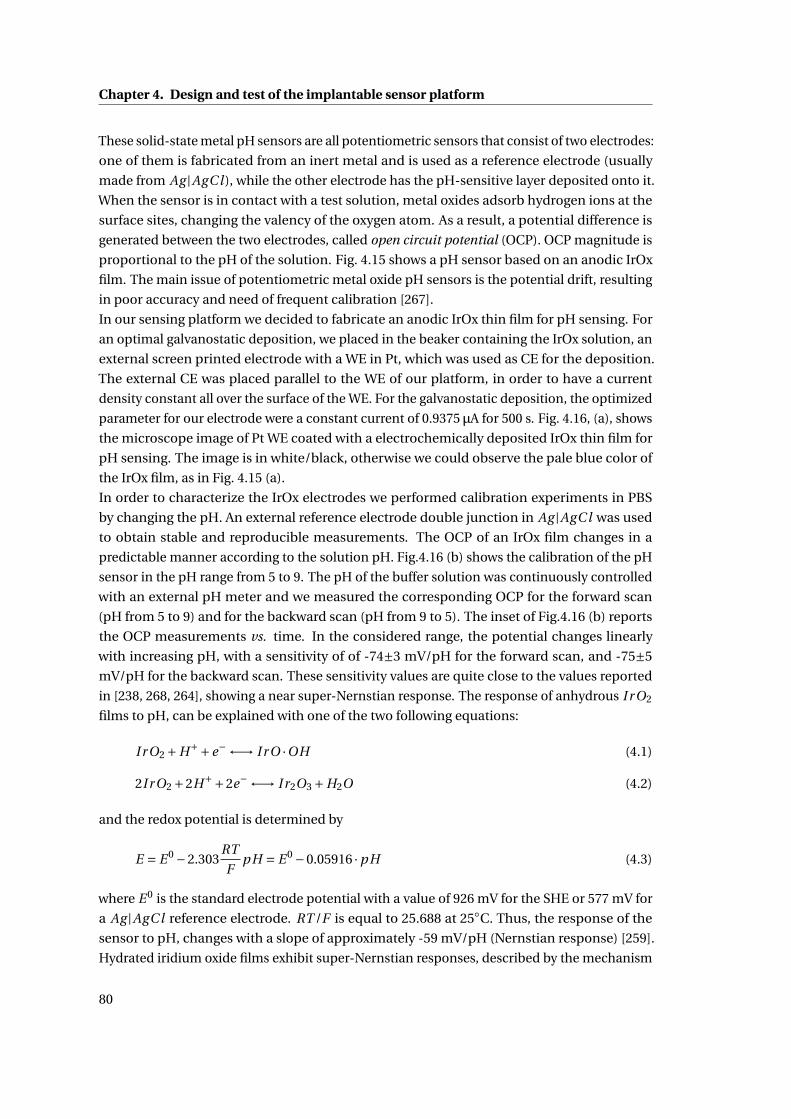
Chapter 4. Design and test of the implantable sensor platform
These solid-state metal pH sensors are all potentiometric sensors that consist of two electrodes:
one of them is fabricated from an inert metal and is used as a reference electrode (usually
made from Ag |AgC l ), while the other electrode has the pH-sensitive layer deposited onto it.
When the sensor is in contact with a test solution, metal oxides adsorb hydrogen ions at the
surface sites, changing the valency of the oxygen atom. As a result, a potential difference is
generated between the two electrodes, called open circuit potential (OCP). OCP magnitude is
proportional to the pH of the solution. Fig. 4.15 shows a pH sensor based on an anodic IrOx
film. The main issue of potentiometric metal oxide pH sensors is the potential drift, resulting
in poor accuracy and need of frequent calibration [267].
In our sensing platform we decided to fabricate an anodic IrOx thin film for pH sensing. For
an optimal galvanostatic deposition, we placed in the beaker containing the IrOx solution, an
external screen printed electrode with a WE in Pt, which was used as CE for the deposition.
The external CE was placed parallel to the WE of our platform, in order to have a current
density constant all over the surface of the WE. For the galvanostatic deposition, the optimized
parameter for our electrode were a constant current of 0.9375 µA for 500 s. Fig. 4.16, (a), shows
the microscope image of Pt WE coated with a electrochemically deposited IrOx thin film for
pH sensing. The image is in white/black, otherwise we could observe the pale blue color of
the IrOx film, as in Fig. 4.15 (a).
In order to characterize the IrOx electrodes we performed calibration experiments in PBS
by changing the pH. An external reference electrode double junction in Ag |AgC l was used
to obtain stable and reproducible measurements. The OCP of an IrOx film changes in a
predictable manner according to the solution pH. Fig.4.16 (b) shows the calibration of the pH
sensor in the pH range from 5 to 9. The pH of the buffer solution was continuously controlled
with an external pH meter and we measured the corresponding OCP for the forward scan
(pH from 5 to 9) and for the backward scan (pH from 9 to 5). The inset of Fig.4.16 (b) reports
the OCP measurements vs. time. In the considered range, the potential changes linearly
with increasing pH, with a sensitivity of of -74±3 mV/pH for the forward scan, and -75±5
mV/pH for the backward scan. These sensitivity values are quite close to the values reported
in [238, 268, 264], showing a near super-Nernstian response. The response of anhydrous I r O2
films to pH, can be explained with one of the two following equations:
I r O2 +H++e− ←→ I r O ·OH (4.1)
2I r O2 +2H++2e− ←→ I r2O3 +H2O (4.2)
and the redox potential is determined by
E = E 0 −2.303RT
FpH = E 0 −0.05916 ·pH (4.3)
where E 0 is the standard electrode potential with a value of 926 mV for the SHE or 577 mV for
a Ag |AgC l reference electrode. RT /F is equal to 25.688 at 25C. Thus, the response of the
sensor to pH, changes with a slope of approximately -59 mV/pH (Nernstian response) [259].
Hydrated iridium oxide films exhibit super-Nernstian responses, described by the mechanism
80
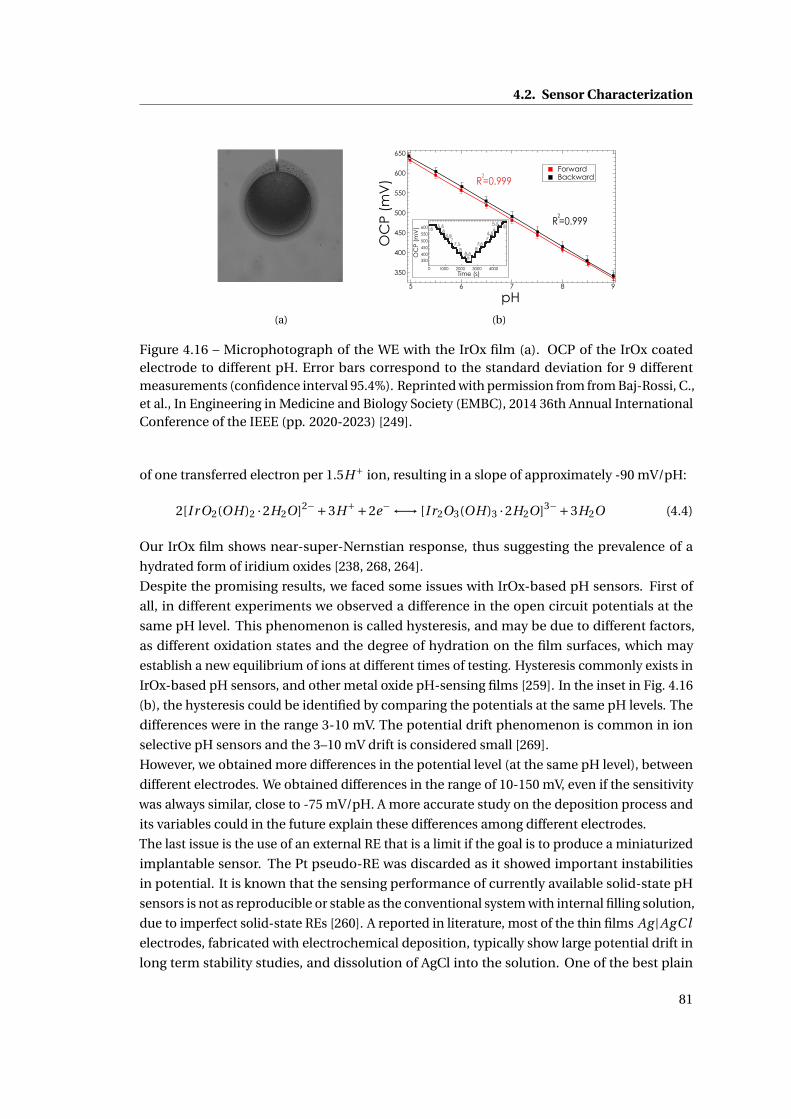
4.2. Sensor Characterization
(a)
650
600
550
500
450
400
350
OC
P (m
V)
98765
pH
ForwardBackward
R2=0.999
R2=0.999
0.2
600
550
500
450
400OC
P (m
V)
4000300020001000Time (s)
0
5 55.5 5.5
6 66.5 6.5
7 77.5 7.5
8 88.59350
(b)
Figure 4.16 – Microphotograph of the WE with the IrOx film (a). OCP of the IrOx coatedelectrode to different pH. Error bars correspond to the standard deviation for 9 differentmeasurements (confidence interval 95.4%). Reprinted with permission from from Baj-Rossi, C.,et al., In Engineering in Medicine and Biology Society (EMBC), 2014 36th Annual InternationalConference of the IEEE (pp. 2020-2023) [249].
of one transferred electron per 1.5H+ ion, resulting in a slope of approximately -90 mV/pH:
2[I r O2(OH)2 ·2H2O]2−+3H++2e− ←→ [I r2O3(OH)3 ·2H2O]3−+3H2O (4.4)
Our IrOx film shows near-super-Nernstian response, thus suggesting the prevalence of a
hydrated form of iridium oxides [238, 268, 264].
Despite the promising results, we faced some issues with IrOx-based pH sensors. First of
all, in different experiments we observed a difference in the open circuit potentials at the
same pH level. This phenomenon is called hysteresis, and may be due to different factors,
as different oxidation states and the degree of hydration on the film surfaces, which may
establish a new equilibrium of ions at different times of testing. Hysteresis commonly exists in
IrOx-based pH sensors, and other metal oxide pH-sensing films [259]. In the inset in Fig. 4.16
(b), the hysteresis could be identified by comparing the potentials at the same pH levels. The
differences were in the range 3-10 mV. The potential drift phenomenon is common in ion
selective pH sensors and the 3–10 mV drift is considered small [269].
However, we obtained more differences in the potential level (at the same pH level), between
different electrodes. We obtained differences in the range of 10-150 mV, even if the sensitivity
was always similar, close to -75 mV/pH. A more accurate study on the deposition process and
its variables could in the future explain these differences among different electrodes.
The last issue is the use of an external RE that is a limit if the goal is to produce a miniaturized
implantable sensor. The Pt pseudo-RE was discarded as it showed important instabilities
in potential. It is known that the sensing performance of currently available solid-state pH
sensors is not as reproducible or stable as the conventional system with internal filling solution,
due to imperfect solid-state REs [260]. A reported in literature, most of the thin films Ag |AgC l
electrodes, fabricated with electrochemical deposition, typically show large potential drift in
long term stability studies, and dissolution of AgCl into the solution. One of the best plain
81
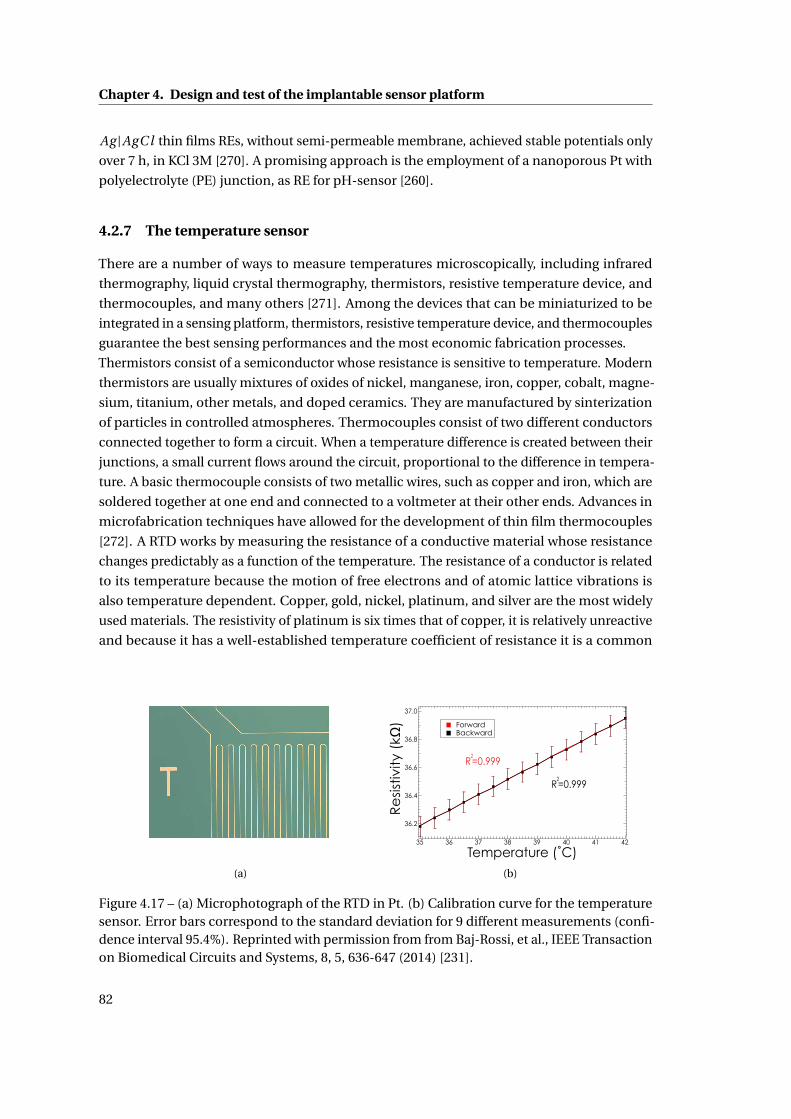
Chapter 4. Design and test of the implantable sensor platform
Ag |AgC l thin films REs, without semi-permeable membrane, achieved stable potentials only
over 7 h, in KCl 3M [270]. A promising approach is the employment of a nanoporous Pt with
polyelectrolyte (PE) junction, as RE for pH-sensor [260].
4.2.7 The temperature sensor
There are a number of ways to measure temperatures microscopically, including infrared
thermography, liquid crystal thermography, thermistors, resistive temperature device, and
thermocouples, and many others [271]. Among the devices that can be miniaturized to be
integrated in a sensing platform, thermistors, resistive temperature device, and thermocouples
guarantee the best sensing performances and the most economic fabrication processes.
Thermistors consist of a semiconductor whose resistance is sensitive to temperature. Modern
thermistors are usually mixtures of oxides of nickel, manganese, iron, copper, cobalt, magne-
sium, titanium, other metals, and doped ceramics. They are manufactured by sinterization
of particles in controlled atmospheres. Thermocouples consist of two different conductors
connected together to form a circuit. When a temperature difference is created between their
junctions, a small current flows around the circuit, proportional to the difference in tempera-
ture. A basic thermocouple consists of two metallic wires, such as copper and iron, which are
soldered together at one end and connected to a voltmeter at their other ends. Advances in
microfabrication techniques have allowed for the development of thin film thermocouples
[272]. A RTD works by measuring the resistance of a conductive material whose resistance
changes predictably as a function of the temperature. The resistance of a conductor is related
to its temperature because the motion of free electrons and of atomic lattice vibrations is
also temperature dependent. Copper, gold, nickel, platinum, and silver are the most widely
used materials. The resistivity of platinum is six times that of copper, it is relatively unreactive
and because it has a well-established temperature coefficient of resistance it is a common
(a)
37.0
36.8
36.6
36.4
36.2
Re
sist
ivity
(kΩ
)
4241403938373635
Temperature (˚C)
ForwardBackward
R2=0.999
R2=0.999
(b)
Figure 4.17 – (a) Microphotograph of the RTD in Pt. (b) Calibration curve for the temperaturesensor. Error bars correspond to the standard deviation for 9 different measurements (confi-dence interval 95.4%). Reprinted with permission from from Baj-Rossi, et al., IEEE Transactionon Biomedical Circuits and Systems, 8, 5, 636-647 (2014) [231].
82
4.3. Summary
choice for temperatures between -260 and 962 C [271]. RTDs can be highly accurate and are
also widely used in industrial applications [273]. RTD is best suited for lower temperature
applications, when high linearity is needed, and its fabrication can be easily implemented
within the microfabrication process of an electrochemical platform.
The RTD integrated in our platform consists of a Pt wire of 4 nm width and 93 mm length,
with an average resistivity of 34 kΩ at 20°C. Pt is commonly used in the production of resistive
thermal devices and it was chosen because, among other metals employed in RTDs such as Cu
and Ni, Pt represents the best trade-off between linear behavior, biocompatibility, and higher
metal resistivity, which allowed reducing the sensor sizes [271]. Moreover Pt was already used
for the realization of the other electrodes. Fig. 4.17 shows the response of the Pt-RTD upon
different temperatures in PBS. The temperature was first increased from 35°C to 42°C (forward
scan) and then was inversely changed (backward scan). The Pt-RTD shows a linear behavior
in the physiological temperature range with an average sensitivity of 0.108 ±0.001kΩ/°C,
which is comparable with the theoretical value of 0.13 kΩ/°C (that can be calculated from the
temperature coefficient of resistivity for Pt, α= 0.003729°C−1 at 20°C). High error bars are due
to the low accuracy of the instrument used to measure the resistivity.
4.3 Summary
The sensing platform was designed and realized considering biocompatibility, performances
and the constraints given by the integration with the electronics and by the final application.
Carbon-nanotubes are integrated on WEs to improve the sensitivity and the chitosan is em-
ployed to entrap them on the electrode surface, providing a biocompatible coating.
With various functionalization of the WEs, we performed calibration of glucose and lactate,
and of different drugs: acetaminophen, etoposide, and mitoxantrone.
We also showed the realization and the performances of a pH sensor and a temperature sen-
sor. In conclusion, so far, the complete integration of a pH and a temperature sensor within
an amperometric multi-panel platform that monitors glucose and drugs, still represents a
complete novelty.
83

5 Membrane and packaging
The key aspect for an implantable biosensor is the assessment of the biocompatibility and the
biostability. The implant must be well tolerated by the host, in terms of both the materials and
the shape of the device, in order to reduce the consequences of the foreign body reaction and
to achieve a proper integration with the surrounding tissue. The sensor electronics must be
protected by the corrosive action of body fluids and finally strategies to preserve the sensor
functionality must be adopted. The biocompatibility and biostability can be promoted by the
design of an effective membrane system and of a proper external packaging.
Other important aspects that should not be neglected are the constraints that come from the
integration of the sensing platform, presented in the previous chapter, with the custom-made
electronics that enables an autonomous powering and actuation of the device. The biosensors
must produce currents that fit the range established by the electronic system that read-out
and activate the sensors. The minimum current step detectable by our integrated electronic
is 12.5 nA and the circuit saturates at a current of 2 µA. Another limitation is the technique
available for the electrode functionalization: only a fixed potential of 650 mV can be applied
to the sensor with the customized ICs, thus electrodeposition of MWCNTs in chitosan or the
deposition of electropolymerized films are not feasible for the realization of our implantable
device, as 650 mV is often not enough to trigger the polymerization in many electropolymers
[246, 170]. Furthermore, we want to implant the device in the peritoneum of mice and monitor
for 30 days glucose and drugs in the physiological range, which is for glucose equal to 6-9 mM
for normal mice, and 12-15 mM for diabetic mice [274]. Finally, the sensors must selectively
detect glucose even in the presence of interfering compounds from the biological fluid the
device is in contact with, that might affect the sensor functionality.
In this chapter we first show the in-vitro characterization of the membranes used to filter the
interfering substances, such as ascorbic acid and uric acid, and a characterization only of the
outer biocompatible membrane in polyurethane. Then we show the in-vitro characterization
of the complete system of membranes for detection of glucose and the drug acetaminophen.
A long-term study of 30 and 50 days is presented to prove the stability of the sensor. The last
section of this chapter is dedicated to the assembly, packaging and in-vivo biocompatibility
tests obtained by implanting the device in mice for 30 days.
85
Chapter 5. Membrane and packaging
5.1 Membrane
5.1.1 Methods
For the electrode functionalization with MWCNTs, we employed the direct drop-cast of MWC-
NTs dissolved in chloroform, and a covering in MWCNT/chitosan. The procedure is reported
in Methods of the previous chapter. Glucose oxidase (GOx) from Aspergillus Niger was pur-
chased from Roche in lyophilizate powder and dissolved in PBS (1X, pH 7.4). Bovine serum
albumine and D-(+)-glucose were purchased from Sigma-Aldrich (Switzerland) in powder and
dissolved in in PBS, pH 7.4. For the glucose detection, 2µl of a solution 15 mg/ml of GOx were
dropped on the nano-structured WEs. Electrodes were stored overnight at 4C.
Acetaminophen, etoposide, ascorbic acid and uric acid were purchased as a powder from
Sigma-Aldrich. Due to their low solubility in water, acetaminophen and ascorbic acid were
dissolved in ethanol, while etoposide in DMSO. A H3BO3 buffer solution (0.02 M, pH 9.0 at
25C), was employed to prepare 3.57 mM UA stock solution. Solutions of ascorbic acid, uric
acid and acetaminophen were freshly prepared before each measurement. All the dilutions
were carried out in a PBS (1X, pH 7.4) solution. H2O2 was purchased from (Reactolab SA,
Switzerland) and was diluted in DI water.
Cellulose acetate (CAc) (average Mn ∼ 50,000) was purchased from Sigma Aldrich in powder. A
solution 5% (w/v) was obtained by dissolving 500 mg of CAc in 50% ethanol and 50% acetone
(5 ml each). The solution was stirred for 15’ with a speed of 250 rpm, to obtain a homogeneous
solution. The CAc membrane was transfered on the electrode by dip-coating: the lower part
of the platform (where the sensors are located), was dipped into 5% CAc for 10” and was
withdrawn slowly. It was then exposed to the vapor above the CAc solution for 5” and was
dipped again into the solution for 10”. The platform was removed and dried in air at room
temperature for 1 min and then placed in deionized water for 6 h to permit the dissolution in
water of entrapped solvent in the membrane pores [177]. A layer of Nafion 0.5 % or 5% was
added by drop-casting of 1µl of Nafion solution on the top of the cellulose acetate membrane,
and then dried for 10’ in air at room temperature [176, 178]. After this step, the enzyme layer
was deposited, first by drop-casting the solution of MWCNTs (first of a chloroform/MWCNT
solution 1m/ml and then of a chitosan/MWCNT solution 8 mg/ml), and the solution of GOx
(15 mg/ml). Before drying the enzyme, a 1 µl drop of glutaraldehyde (from Sigma-Aldrich)
0.25% is added on the enzyme solution and left at room temperature for drying. For detection
of acetaminophen, a layer of bovine serum albumin (BSA) was adsorbed on the CAc mem-
brane, before the deposition of the outer membrane, to facilitate the diffusion of the drug to
the electrode surface.
For the biocompatible outer membrane, a homogeneous solution was obtained by mixing 125
mg of an epoxy adhesive (EP42HT-2Med system), purchased by Master Bond (Hackensack,
USA) as a certified biocompatible two-components adhesive, 112.5 mg of Polyurethane (PU,
Sigma Aldrich), 12.5 mg of the surfactant agent Polyethylene glycol ether (Brij® 30, Sigma
Aldrich), for 10 ml of Tetrahydrofuran (Sigma Aldrich) used as solvent [153].
The deposition method of the biocompatible membrane is known as dip coating and it con-
86
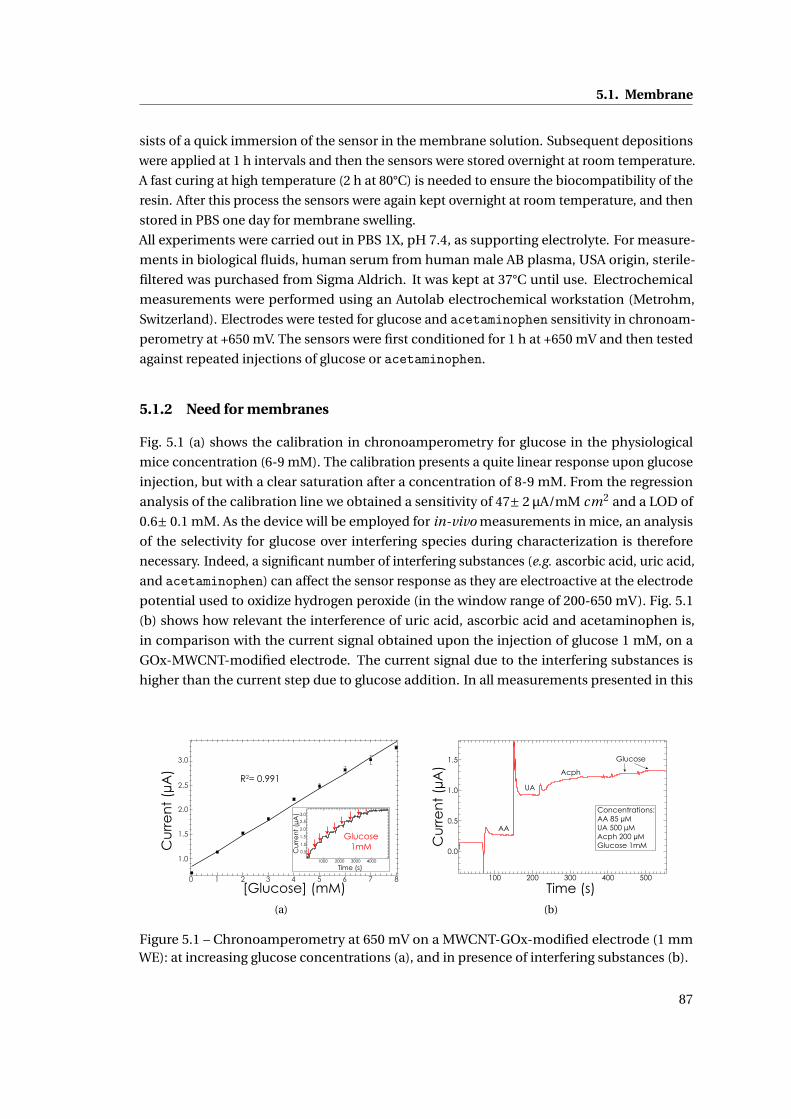
5.1. Membrane
sists of a quick immersion of the sensor in the membrane solution. Subsequent depositions
were applied at 1 h intervals and then the sensors were stored overnight at room temperature.
A fast curing at high temperature (2 h at 80°C) is needed to ensure the biocompatibility of the
resin. After this process the sensors were again kept overnight at room temperature, and then
stored in PBS one day for membrane swelling.
All experiments were carried out in PBS 1X, pH 7.4, as supporting electrolyte. For measure-
ments in biological fluids, human serum from human male AB plasma, USA origin, sterile-
filtered was purchased from Sigma Aldrich. It was kept at 37°C until use. Electrochemical
measurements were performed using an Autolab electrochemical workstation (Metrohm,
Switzerland). Electrodes were tested for glucose and acetaminophen sensitivity in chronoam-
perometry at +650 mV. The sensors were first conditioned for 1 h at +650 mV and then tested
against repeated injections of glucose or acetaminophen.
5.1.2 Need for membranes
Fig. 5.1 (a) shows the calibration in chronoamperometry for glucose in the physiological
mice concentration (6-9 mM). The calibration presents a quite linear response upon glucose
injection, but with a clear saturation after a concentration of 8-9 mM. From the regression
analysis of the calibration line we obtained a sensitivity of 47± 2 µA/mM cm2 and a LOD of
0.6± 0.1 mM. As the device will be employed for in-vivo measurements in mice, an analysis
of the selectivity for glucose over interfering species during characterization is therefore
necessary. Indeed, a significant number of interfering substances (e.g. ascorbic acid, uric acid,
and acetaminophen) can affect the sensor response as they are electroactive at the electrode
potential used to oxidize hydrogen peroxide (in the window range of 200-650 mV). Fig. 5.1
(b) shows how relevant the interference of uric acid, ascorbic acid and acetaminophen is,
in comparison with the current signal obtained upon the injection of glucose 1 mM, on a
GOx-MWCNT-modified electrode. The current signal due to the interfering substances is
higher than the current step due to glucose addition. In all measurements presented in this
Cu
rre
nt
(µA
)
[Glucose] (mM)
R2= 0.991
Cu
rre
nt
(µA
)
Time (s)
Glucose1mM
3.0
2.5
1.5
2.0
1.0
0.5
1000 2000 3000 4000
0 1 2 3 4 5 6 7 8
1.0
1.5
2.0
2.5
3.0
(a)
1.5
1.0
0.5
0.0
Cu
rre
nt
(µA
)
500400300200100
Time (s)
AA
UA
Acph
Glucose
Concentrations:AA 85 µMUA 500 µMAcph 200 µMGlucose 1mM
(b)
Figure 5.1 – Chronoamperometry at 650 mV on a MWCNT-GOx-modified electrode (1 mmWE): at increasing glucose concentrations (a), and in presence of interfering substances (b).
87
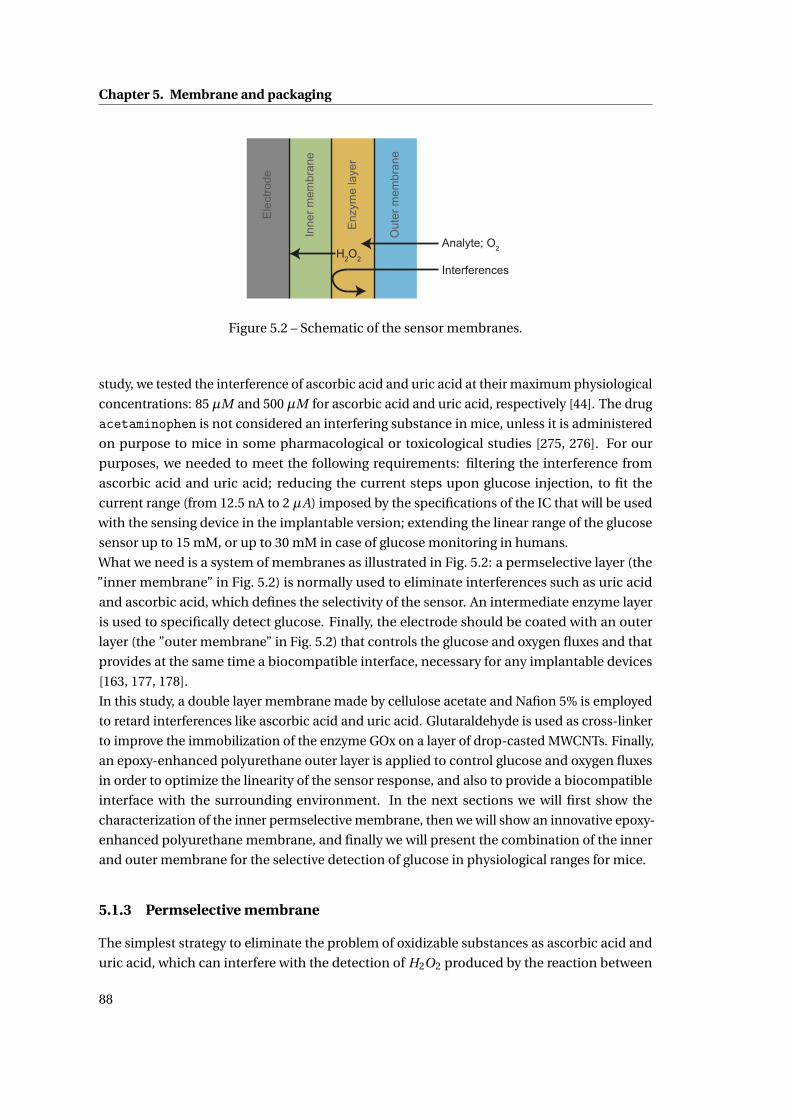
Chapter 5. Membrane and packaging
Ele
ctro
de
Inne
r mem
bran
e
Enz
yme
laye
r
Out
er m
embr
ane
Analyte; O2H2O2
Interferences
Figure 5.2 – Schematic of the sensor membranes.
study, we tested the interference of ascorbic acid and uric acid at their maximum physiological
concentrations: 85 µM and 500 µM for ascorbic acid and uric acid, respectively [44]. The drug
acetaminophen is not considered an interfering substance in mice, unless it is administered
on purpose to mice in some pharmacological or toxicological studies [275, 276]. For our
purposes, we needed to meet the following requirements: filtering the interference from
ascorbic acid and uric acid; reducing the current steps upon glucose injection, to fit the
current range (from 12.5 nA to 2 µA) imposed by the specifications of the IC that will be used
with the sensing device in the implantable version; extending the linear range of the glucose
sensor up to 15 mM, or up to 30 mM in case of glucose monitoring in humans.
What we need is a system of membranes as illustrated in Fig. 5.2: a permselective layer (the
”inner membrane” in Fig. 5.2) is normally used to eliminate interferences such as uric acid
and ascorbic acid, which defines the selectivity of the sensor. An intermediate enzyme layer
is used to specifically detect glucose. Finally, the electrode should be coated with an outer
layer (the ”outer membrane” in Fig. 5.2) that controls the glucose and oxygen fluxes and that
provides at the same time a biocompatible interface, necessary for any implantable devices
[163, 177, 178].
In this study, a double layer membrane made by cellulose acetate and Nafion 5% is employed
to retard interferences like ascorbic acid and uric acid. Glutaraldehyde is used as cross-linker
to improve the immobilization of the enzyme GOx on a layer of drop-casted MWCNTs. Finally,
an epoxy-enhanced polyurethane outer layer is applied to control glucose and oxygen fluxes
in order to optimize the linearity of the sensor response, and also to provide a biocompatible
interface with the surrounding environment. In the next sections we will first show the
characterization of the inner permselective membrane, then we will show an innovative epoxy-
enhanced polyurethane membrane, and finally we will present the combination of the inner
and outer membrane for the selective detection of glucose in physiological ranges for mice.
5.1.3 Permselective membrane
The simplest strategy to eliminate the problem of oxidizable substances as ascorbic acid and
uric acid, which can interfere with the detection of H2O2 produced by the reaction between
88
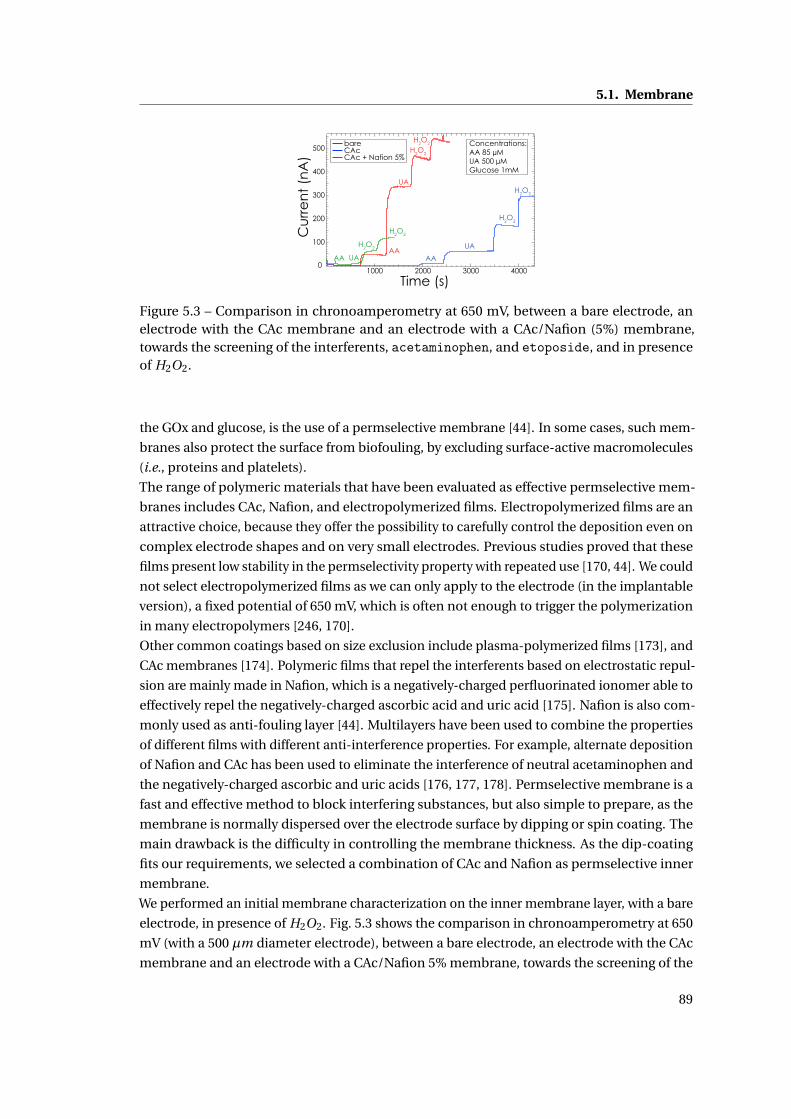
5.1. Membrane
500
400
300
200
100
0
Cu
rre
nt
(nA
)
4000300020001000
Time (s)
bare CAc CAc + Nafion 5%
AA UA
H2O2
Concentrations:AA 85 µMUA 500 µMGlucose 1mM
H2O2
AA
UA
H2O2
H2O2
AA
UA
H2O2
H2O2
Figure 5.3 – Comparison in chronoamperometry at 650 mV, between a bare electrode, anelectrode with the CAc membrane and an electrode with a CAc/Nafion (5%) membrane,towards the screening of the interferents, acetaminophen, and etoposide, and in presenceof H2O2.
the GOx and glucose, is the use of a permselective membrane [44]. In some cases, such mem-
branes also protect the surface from biofouling, by excluding surface-active macromolecules
(i.e., proteins and platelets).
The range of polymeric materials that have been evaluated as effective permselective mem-
branes includes CAc, Nafion, and electropolymerized films. Electropolymerized films are an
attractive choice, because they offer the possibility to carefully control the deposition even on
complex electrode shapes and on very small electrodes. Previous studies proved that these
films present low stability in the permselectivity property with repeated use [170, 44]. We could
not select electropolymerized films as we can only apply to the electrode (in the implantable
version), a fixed potential of 650 mV, which is often not enough to trigger the polymerization
in many electropolymers [246, 170].
Other common coatings based on size exclusion include plasma-polymerized films [173], and
CAc membranes [174]. Polymeric films that repel the interferents based on electrostatic repul-
sion are mainly made in Nafion, which is a negatively-charged perfluorinated ionomer able to
effectively repel the negatively-charged ascorbic acid and uric acid [175]. Nafion is also com-
monly used as anti-fouling layer [44]. Multilayers have been used to combine the properties
of different films with different anti-interference properties. For example, alternate deposition
of Nafion and CAc has been used to eliminate the interference of neutral acetaminophen and
the negatively-charged ascorbic and uric acids [176, 177, 178]. Permselective membrane is a
fast and effective method to block interfering substances, but also simple to prepare, as the
membrane is normally dispersed over the electrode surface by dipping or spin coating. The
main drawback is the difficulty in controlling the membrane thickness. As the dip-coating
fits our requirements, we selected a combination of CAc and Nafion as permselective inner
membrane.
We performed an initial membrane characterization on the inner membrane layer, with a bare
electrode, in presence of H2O2. Fig. 5.3 shows the comparison in chronoamperometry at 650
mV (with a 500 µm diameter electrode), between a bare electrode, an electrode with the CAc
membrane and an electrode with a CAc/Nafion 5% membrane, towards the screening of the
89
Chapter 5. Membrane and packaging
interferents, and in presence of H2O2. The CAc/Nafion 5% membrane resulted in excellent
permselectivity, with respect to the bare electrode but also with respect to the use of the CAc
membrane alone. With the CAc/Nafion 5% membrane, the interference from ascorbic acid is
completely eliminated and from uric acid is drastically reduced. Acetaminophen gives a sig-
nificant response with respect to the hydrogen peroxide. If this membrane system is used for
glucose monitoring in humans, another method to filter the interference of Acetaminophenis necessary, e.g. the employment of an electropolymerized film [170] or the employment of
a second working electrode for the differential subtraction of the interference [277]. As ex-
pected, the addition of the CAc membrane and later of the Nafion layer results in a significant
reduction of the current response.
Fig. 5.4 shows the performance of the permselective membrane in presence of the enzyme
layer of GOx, in chronoamperometry at 650 mV, in presence of increasing glucose concen-
trations. MWCNTs and GOx were immobilized on the top of the permselective membrane
made by CAc and Nafion. In implantable biosensors, the enzyme activity begins to decrease
immediately due to polymer entrapment, or to the exposure to acid fluids, hydrogen peroxide
and other reactive radicals, during the foreign body reaction process. Several effective immo-
bilization strategies to ensure enzyme stability have been investigated so far: cross-linking of
the enzyme with glutaraldehyde, enzyme entrapment within polymeric matrices (e.g., hydro-
gels), and incorporation of the enzyme into electropolymerized conducting polymers such as
polypyrrole [186]. Nevertheless, the enzyme suffers of an inherent loss of activity, primarily
due to the loss of noncovalently bonded FAD cofactor [187]. In our sensors, glutaraldehyde
was employed on the GOx, as many studies showed that glutaraldehyde plays an important
role in stabilizing the activity of the immobilized enzyme [177, 178, 278, 44]. Fig. 5.4 (a) also
reports the comparison between the use of a layer of Nafion 0.5% and Nafion 5%. From the
analysis of the permselective ability of the membrane (the zoom reported in Fig. 5.4 (b)), we
can conclude that a high Nafion concentration (5% instead of 0.5%) is necessary for a complete
filtering of uric acid and ascorbic acid. We also tested the ability of the membrane to filter the
presence of another drug, etoposide: Fig. 5.4 (b) shows that etoposide does not give any
response with the CAc/Nafion 5% membrane.
A lower Nafion concentration (0.5%) mitigates the saturation of the response upon glucose
injection, but it is less efficient in screening the interfering substances, as clearly shown in
Fig. 5.4 (b). With Nafion 5% the current response upon glucose injection is significantly higher,
but it saturates after the second injection of glucose 1 mM. As previously stated (chapter
II), the electrochemical detection of hydrogen peroxide requires oxygen as a cofactor in the
oxidase enzymatic reaction. However in interstitial fluids there is an ”oxigen deficit”, as the
concentration of oxygen is at least 10 times lower than the concentration of glucose, thus
making oxygen the rate-limiting substrate. And this is also the reason of the low linearity
of the sensor response upon glucose addition. This oxygen deficiency is mitigated by using
polymeric outer diffusion controlled membranes, including polyurethane [153], Nafion [160],
chitosan [160], silicone elastomer [161], polycarbonate [162], silicone [163], and layer-by-layer
assembled polyelectrolytes [164]. From the sensor response to glucose reported in Fig. 5.4
it is reasonable to assume that the enzyme quickly saturates due to the lack of oxygen, thus
90
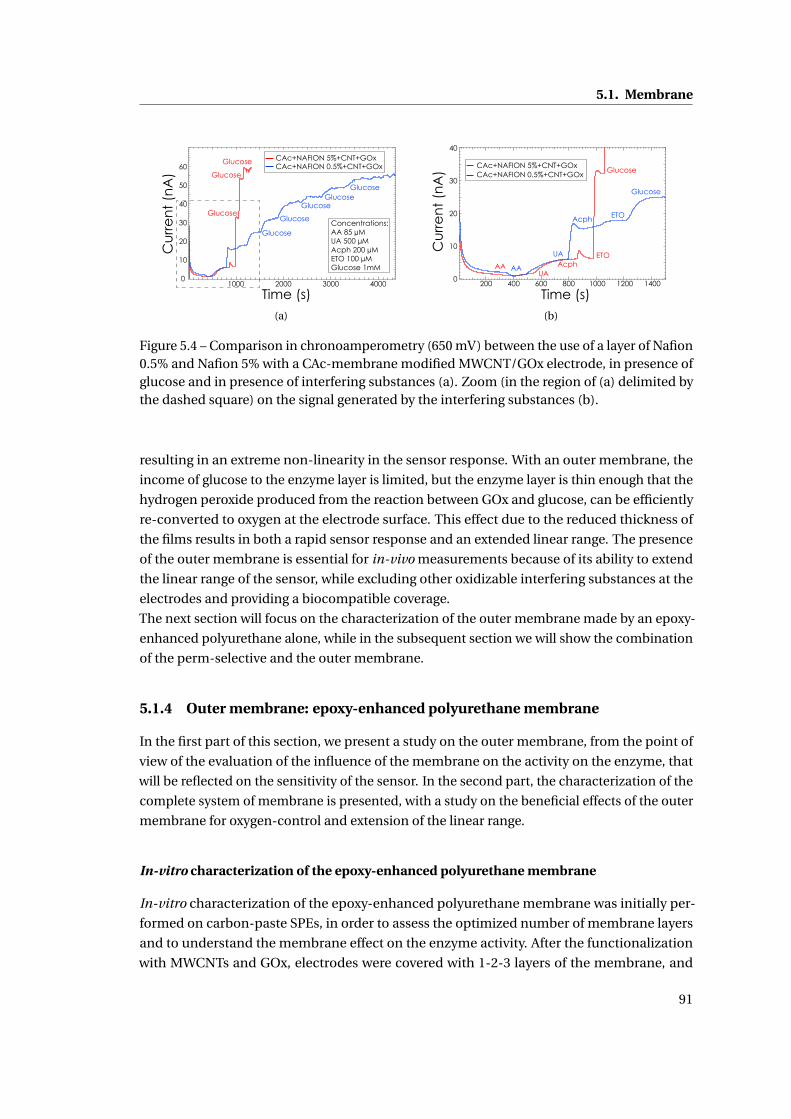
5.1. Membrane
60
50
40
30
20
10
0
Cu
rre
nt
(nA
)
4000300020001000
Time (s)
Glucose
Glucose
Glucose
Glucose
Glucose
GlucoseGlucose
Glucose
CAc+NAFION 5%+CNT+GOx CAc+NAFION 0.5%+CNT+GOx
Concentrations:AA 85 µMUA 500 µMAcph 200 µMETO 100 µMGlucose 1mM
(a)
40
30
20
10
0
Cu
rre
nt
(nA
)
140012001000800600400200
Time (s)
AAUA
AcphETO
Glucose
AA
UA
Acph ETO
Glucose
CAc+NAFION 5%+CNT+GOx CAc+NAFION 0.5%+CNT+GOx
(b)
Figure 5.4 – Comparison in chronoamperometry (650 mV) between the use of a layer of Nafion0.5% and Nafion 5% with a CAc-membrane modified MWCNT/GOx electrode, in presence ofglucose and in presence of interfering substances (a). Zoom (in the region of (a) delimited bythe dashed square) on the signal generated by the interfering substances (b).
resulting in an extreme non-linearity in the sensor response. With an outer membrane, the
income of glucose to the enzyme layer is limited, but the enzyme layer is thin enough that the
hydrogen peroxide produced from the reaction between GOx and glucose, can be efficiently
re-converted to oxygen at the electrode surface. This effect due to the reduced thickness of
the films results in both a rapid sensor response and an extended linear range. The presence
of the outer membrane is essential for in-vivo measurements because of its ability to extend
the linear range of the sensor, while excluding other oxidizable interfering substances at the
electrodes and providing a biocompatible coverage.
The next section will focus on the characterization of the outer membrane made by an epoxy-
enhanced polyurethane alone, while in the subsequent section we will show the combination
of the perm-selective and the outer membrane.
5.1.4 Outer membrane: epoxy-enhanced polyurethane membrane
In the first part of this section, we present a study on the outer membrane, from the point of
view of the evaluation of the influence of the membrane on the activity on the enzyme, that
will be reflected on the sensitivity of the sensor. In the second part, the characterization of the
complete system of membrane is presented, with a study on the beneficial effects of the outer
membrane for oxygen-control and extension of the linear range.
In-vitro characterization of the epoxy-enhanced polyurethane membrane
In-vitro characterization of the epoxy-enhanced polyurethane membrane was initially per-
formed on carbon-paste SPEs, in order to assess the optimized number of membrane layers
and to understand the membrane effect on the enzyme activity. After the functionalization
with MWCNTs and GOx, electrodes were covered with 1-2-3 layers of the membrane, and
91
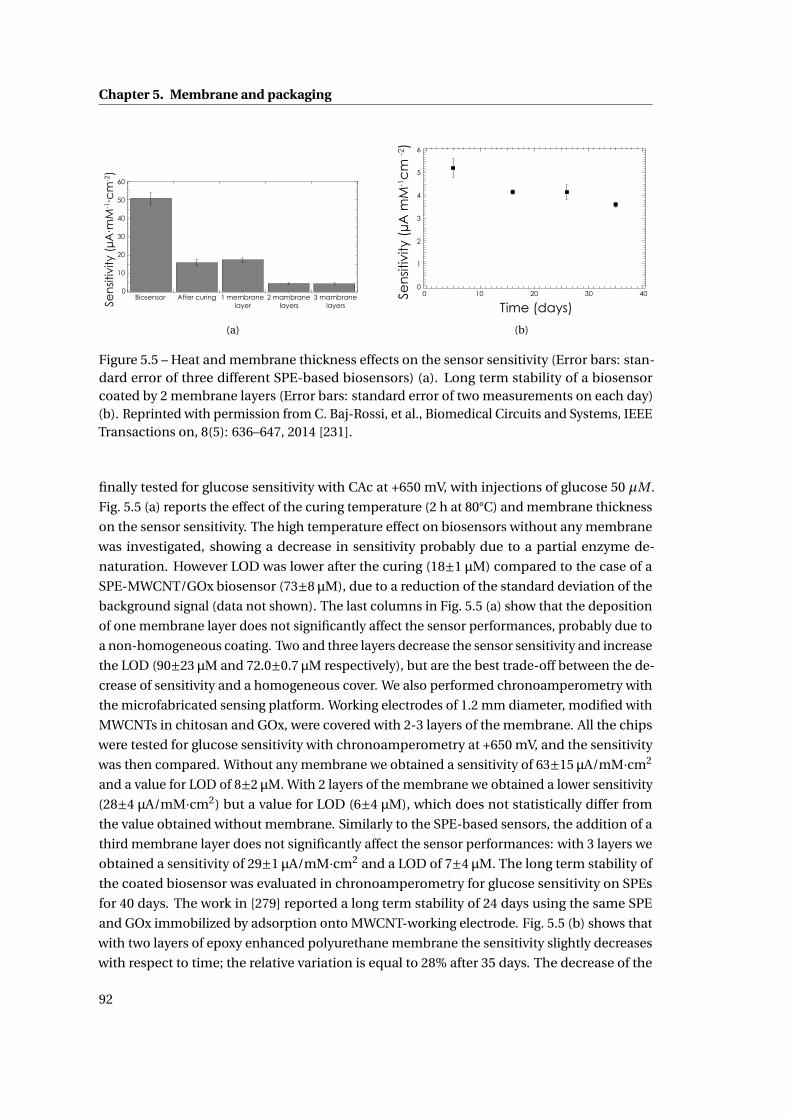
Chapter 5. Membrane and packaging
60
50
40
30
20
10
0Biosensor After curing 1 membrane
layer2 mambrane
layers3 mambrane
layersSen
sitiv
ity (
µA∙m
M-1∙c
m-2)
(a)
Time (days)
Sen
sitiv
ity (
µA m
M-1c
m -2
) 6
5
4
3
2
1
0403020100
(b)
Figure 5.5 – Heat and membrane thickness effects on the sensor sensitivity (Error bars: stan-dard error of three different SPE-based biosensors) (a). Long term stability of a biosensorcoated by 2 membrane layers (Error bars: standard error of two measurements on each day)(b). Reprinted with permission from C. Baj-Rossi, et al., Biomedical Circuits and Systems, IEEETransactions on, 8(5): 636–647, 2014 [231].
finally tested for glucose sensitivity with CAc at +650 mV, with injections of glucose 50 µM .
Fig. 5.5 (a) reports the effect of the curing temperature (2 h at 80°C) and membrane thickness
on the sensor sensitivity. The high temperature effect on biosensors without any membrane
was investigated, showing a decrease in sensitivity probably due to a partial enzyme de-
naturation. However LOD was lower after the curing (18±1 µM) compared to the case of a
SPE-MWCNT/GOx biosensor (73±8 µM), due to a reduction of the standard deviation of the
background signal (data not shown). The last columns in Fig. 5.5 (a) show that the deposition
of one membrane layer does not significantly affect the sensor performances, probably due to
a non-homogeneous coating. Two and three layers decrease the sensor sensitivity and increase
the LOD (90±23 µM and 72.0±0.7 µM respectively), but are the best trade-off between the de-
crease of sensitivity and a homogeneous cover. We also performed chronoamperometry with
the microfabricated sensing platform. Working electrodes of 1.2 mm diameter, modified with
MWCNTs in chitosan and GOx, were covered with 2-3 layers of the membrane. All the chips
were tested for glucose sensitivity with chronoamperometry at +650 mV, and the sensitivity
was then compared. Without any membrane we obtained a sensitivity of 63±15 µA/mM·cm2
and a value for LOD of 8±2 µM. With 2 layers of the membrane we obtained a lower sensitivity
(28±4 µA/mM·cm2) but a value for LOD (6±4 µM), which does not statistically differ from
the value obtained without membrane. Similarly to the SPE-based sensors, the addition of a
third membrane layer does not significantly affect the sensor performances: with 3 layers we
obtained a sensitivity of 29±1 µA/mM·cm2 and a LOD of 7±4 µM. The long term stability of
the coated biosensor was evaluated in chronoamperometry for glucose sensitivity on SPEs
for 40 days. The work in [279] reported a long term stability of 24 days using the same SPE
and GOx immobilized by adsorption onto MWCNT-working electrode. Fig. 5.5 (b) shows that
with two layers of epoxy enhanced polyurethane membrane the sensitivity slightly decreases
with respect to time; the relative variation is equal to 28% after 35 days. The decrease of the
92
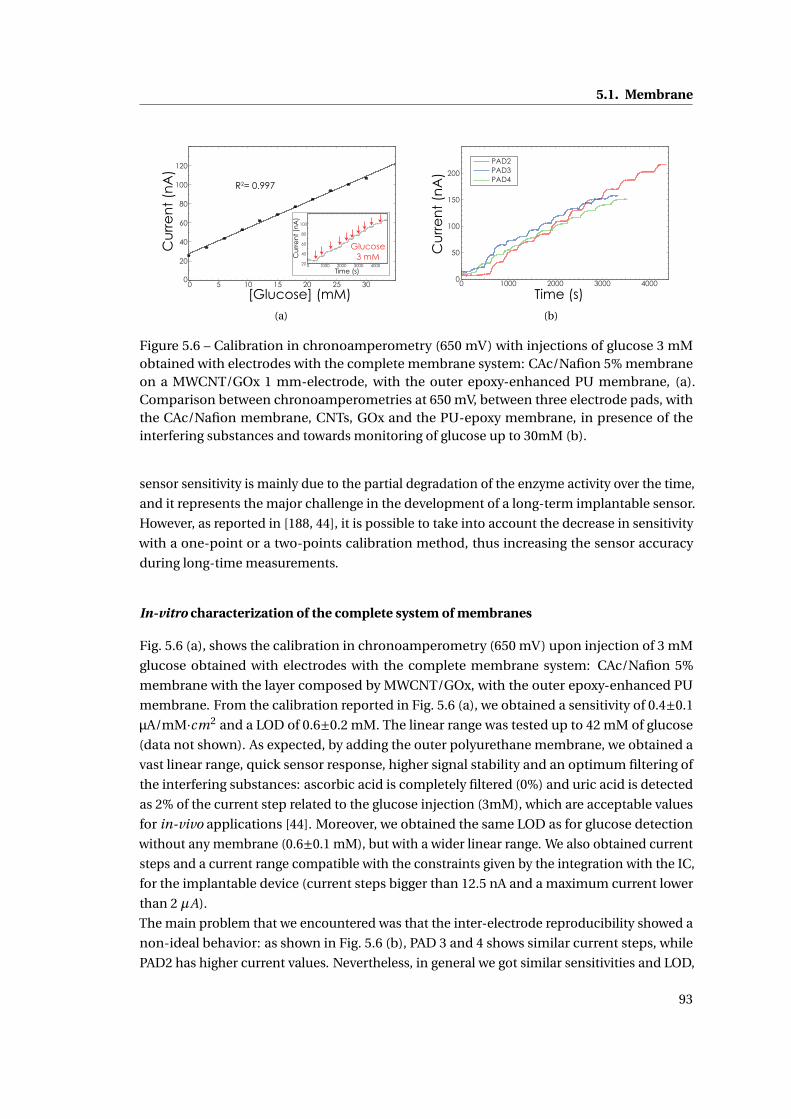
5.1. Membrane
0 5 10 15 20 25 300
20
40
60
80
100
120
[Glucose] (mM)
Cu
rre
nt
(nA
)R2= 0.997
0 1000 2000 3000 400020
40
60
80
100
Cu
rre
nt
(nA
)
Time (s)
Glucose3 mM
(a)
0 1000 2000 3000 40000
50
100
150
200
PAD2PAD3PAD4
Time (s)
Cu
rre
nt
(nA
)
(b)
Figure 5.6 – Calibration in chronoamperometry (650 mV) with injections of glucose 3 mMobtained with electrodes with the complete membrane system: CAc/Nafion 5% membraneon a MWCNT/GOx 1 mm-electrode, with the outer epoxy-enhanced PU membrane, (a).Comparison between chronoamperometries at 650 mV, between three electrode pads, withthe CAc/Nafion membrane, CNTs, GOx and the PU-epoxy membrane, in presence of theinterfering substances and towards monitoring of glucose up to 30mM (b).
sensor sensitivity is mainly due to the partial degradation of the enzyme activity over the time,
and it represents the major challenge in the development of a long-term implantable sensor.
However, as reported in [188, 44], it is possible to take into account the decrease in sensitivity
with a one-point or a two-points calibration method, thus increasing the sensor accuracy
during long-time measurements.
In-vitro characterization of the complete system of membranes
Fig. 5.6 (a), shows the calibration in chronoamperometry (650 mV) upon injection of 3 mM
glucose obtained with electrodes with the complete membrane system: CAc/Nafion 5%
membrane with the layer composed by MWCNT/GOx, with the outer epoxy-enhanced PU
membrane. From the calibration reported in Fig. 5.6 (a), we obtained a sensitivity of 0.4±0.1
µA/mM·cm2 and a LOD of 0.6±0.2 mM. The linear range was tested up to 42 mM of glucose
(data not shown). As expected, by adding the outer polyurethane membrane, we obtained a
vast linear range, quick sensor response, higher signal stability and an optimum filtering of
the interfering substances: ascorbic acid is completely filtered (0%) and uric acid is detected
as 2% of the current step related to the glucose injection (3mM), which are acceptable values
for in-vivo applications [44]. Moreover, we obtained the same LOD as for glucose detection
without any membrane (0.6±0.1 mM), but with a wider linear range. We also obtained current
steps and a current range compatible with the constraints given by the integration with the IC,
for the implantable device (current steps bigger than 12.5 nA and a maximum current lower
than 2 µA).
The main problem that we encountered was that the inter-electrode reproducibility showed a
non-ideal behavior: as shown in Fig. 5.6 (b), PAD 3 and 4 shows similar current steps, while
PAD2 has higher current values. Nevertheless, in general we got similar sensitivities and LOD,
93
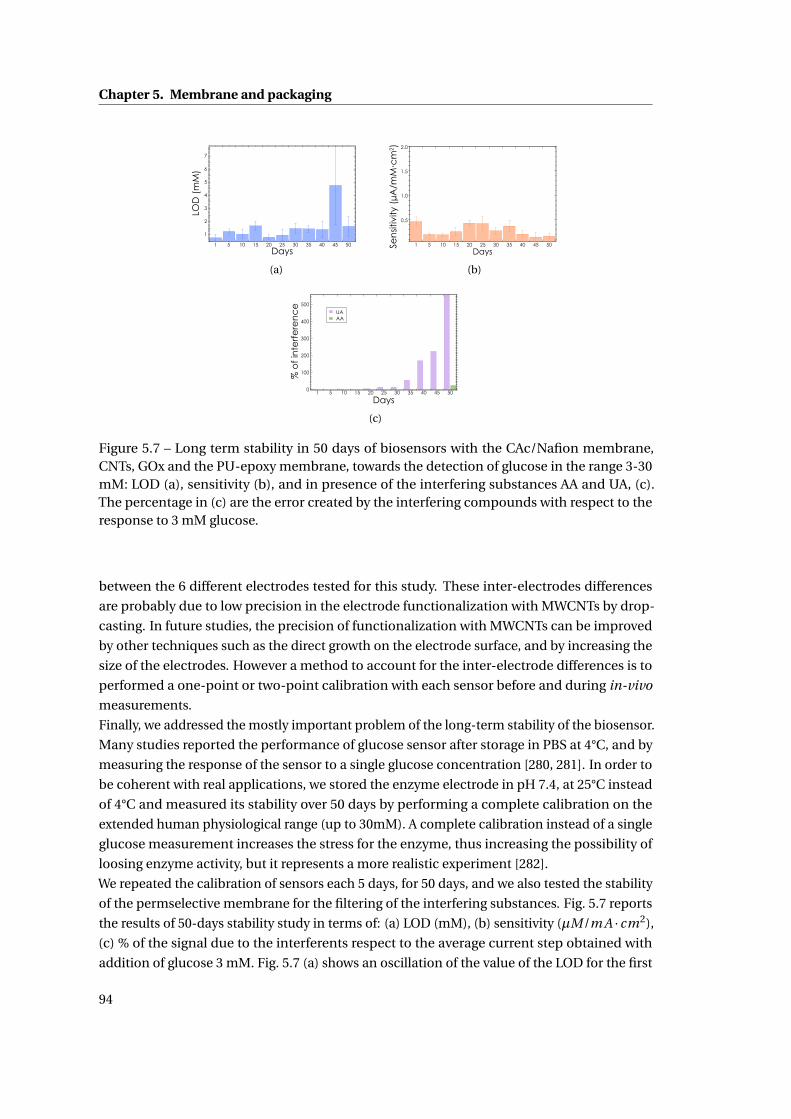
Chapter 5. Membrane and packaging
LOD
(m
M)
Days
7
5
3
2
6
4
1
1 5 10 15 20 25 30 35 40 45 50
(a)
Sen
sitiv
ity (
µA/m
M∙c
m2 ) 2.0
1.5
1.0
0.5
1 5 10 15 20 25 30 35 40 45 50
Days
(b)
UA AA
500
400
300
200
100
01 5 10 15 20 25 30 35 40 45 50
Days
% o
f in
terf
ere
nc
e
(c)
Figure 5.7 – Long term stability in 50 days of biosensors with the CAc/Nafion membrane,CNTs, GOx and the PU-epoxy membrane, towards the detection of glucose in the range 3-30mM: LOD (a), sensitivity (b), and in presence of the interfering substances AA and UA, (c).The percentage in (c) are the error created by the interfering compounds with respect to theresponse to 3 mM glucose.
between the 6 different electrodes tested for this study. These inter-electrodes differences
are probably due to low precision in the electrode functionalization with MWCNTs by drop-
casting. In future studies, the precision of functionalization with MWCNTs can be improved
by other techniques such as the direct growth on the electrode surface, and by increasing the
size of the electrodes. However a method to account for the inter-electrode differences is to
performed a one-point or two-point calibration with each sensor before and during in-vivo
measurements.
Finally, we addressed the mostly important problem of the long-term stability of the biosensor.
Many studies reported the performance of glucose sensor after storage in PBS at 4°C, and by
measuring the response of the sensor to a single glucose concentration [280, 281]. In order to
be coherent with real applications, we stored the enzyme electrode in pH 7.4, at 25°C instead
of 4°C and measured its stability over 50 days by performing a complete calibration on the
extended human physiological range (up to 30mM). A complete calibration instead of a single
glucose measurement increases the stress for the enzyme, thus increasing the possibility of
loosing enzyme activity, but it represents a more realistic experiment [282].
We repeated the calibration of sensors each 5 days, for 50 days, and we also tested the stability
of the permselective membrane for the filtering of the interfering substances. Fig. 5.7 reports
the results of 50-days stability study in terms of: (a) LOD (mM), (b) sensitivity (µM/m A · cm2),
(c) % of the signal due to the interferents respect to the average current step obtained with
addition of glucose 3 mM. Fig. 5.7 (a) shows an oscillation of the value of the LOD for the first
94
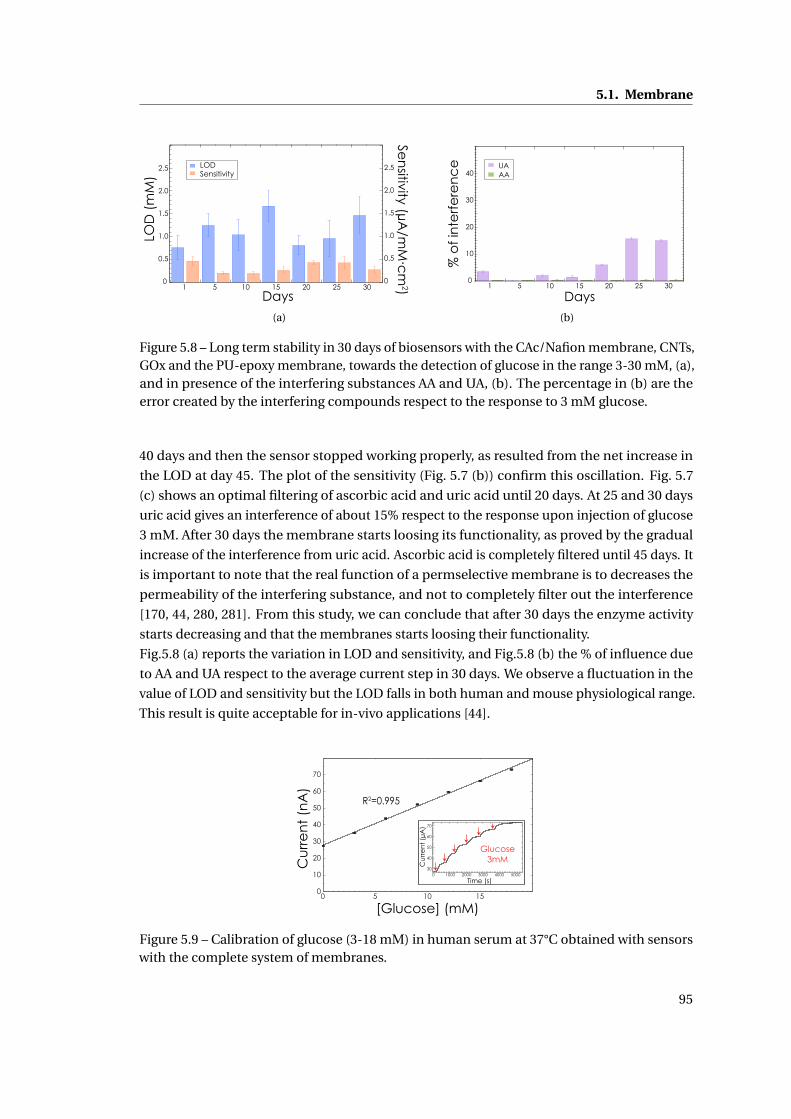
5.1. Membrane
LOD Sensitivity
2.5
2.0
1.5
1.0
0.5
0
2.5
2.0
1.5
1.0
0.5
01 5 10 15 20 25 30
Days
LO
D (
mM
)
Sen
sitivity (µA/m
M∙c
m2)
(a)
40
30
20
10
01 5 10 15 20 25 30
Days
UA AA
% o
f in
terf
ere
nc
e
(b)
Figure 5.8 – Long term stability in 30 days of biosensors with the CAc/Nafion membrane, CNTs,GOx and the PU-epoxy membrane, towards the detection of glucose in the range 3-30 mM, (a),and in presence of the interfering substances AA and UA, (b). The percentage in (b) are theerror created by the interfering compounds respect to the response to 3 mM glucose.
40 days and then the sensor stopped working properly, as resulted from the net increase in
the LOD at day 45. The plot of the sensitivity (Fig. 5.7 (b)) confirm this oscillation. Fig. 5.7
(c) shows an optimal filtering of ascorbic acid and uric acid until 20 days. At 25 and 30 days
uric acid gives an interference of about 15% respect to the response upon injection of glucose
3 mM. After 30 days the membrane starts loosing its functionality, as proved by the gradual
increase of the interference from uric acid. Ascorbic acid is completely filtered until 45 days. It
is important to note that the real function of a permselective membrane is to decreases the
permeability of the interfering substance, and not to completely filter out the interference
[170, 44, 280, 281]. From this study, we can conclude that after 30 days the enzyme activity
starts decreasing and that the membranes starts loosing their functionality.
Fig.5.8 (a) reports the variation in LOD and sensitivity, and Fig.5.8 (b) the % of influence due
to AA and UA respect to the average current step in 30 days. We observe a fluctuation in the
value of LOD and sensitivity but the LOD falls in both human and mouse physiological range.
This result is quite acceptable for in-vivo applications [44].
0 5 10 150
10
20
30
40
50
60
70
Cu
rre
nt
(nA
)
[Glucose] (mM)
R2=0.995
Cu
rre
nt
(µA
)
Time (s)
40
50
60
70
300 1000 30002000 4000 5000
Glucose3mM
Figure 5.9 – Calibration of glucose (3-18 mM) in human serum at 37°C obtained with sensorswith the complete system of membranes.
95
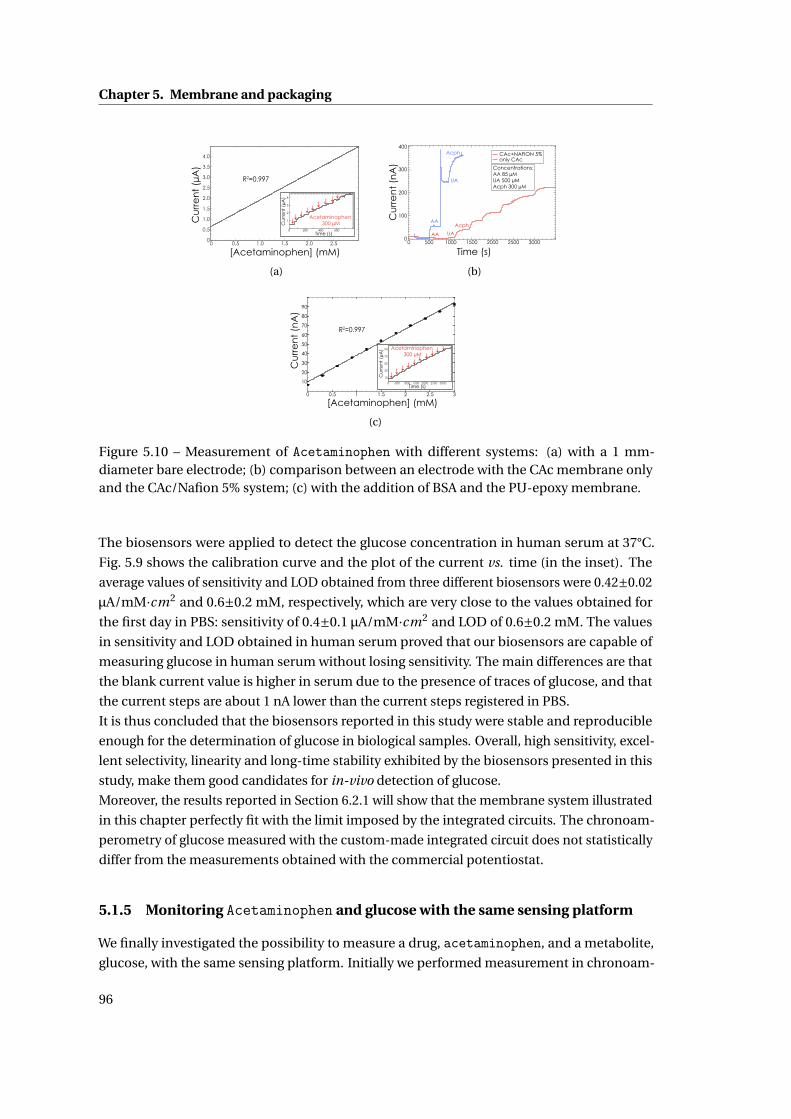
Chapter 5. Membrane and packaging
0 0.5 1.0 1.5 2.0 2.50
0.5
1.0
1.5
2.0
2.5
3.0
3.5
4.0
Cu
rre
nt
(µA
)
[Acetaminophen] (mM)
R2=0.997
Cu
rre
nt
(µA
)
Time (s)
Acetaminophen 300 µM
4
3
2
1
0 200 400 600
(a)
400
300
200
100
0
Cu
rre
nt
(nA
)
300025002000150010005000
Time (s)
AA UA
AA
UA
Acph
Concentrations:AA 85 µMUA 500 µMAcph 300 µM
CAc+NAFION 5%only CAc
Acph
(b)
Cu
rre
nt
(nA
)
[Acetaminophen] (mM)
R2=0.997
0 0.5 1 1.5 2 2.5 3
10
20
30
40
50
60
70
80
90
Cu
rre
nt
(µA
)
Time (s)
Acetaminophen 300 µM
0 500 1000 1500 2000 2500 3000
10
30
50
70
90
(c)
Figure 5.10 – Measurement of Acetaminophen with different systems: (a) with a 1 mm-diameter bare electrode; (b) comparison between an electrode with the CAc membrane onlyand the CAc/Nafion 5% system; (c) with the addition of BSA and the PU-epoxy membrane.
The biosensors were applied to detect the glucose concentration in human serum at 37°C.
Fig. 5.9 shows the calibration curve and the plot of the current vs. time (in the inset). The
average values of sensitivity and LOD obtained from three different biosensors were 0.42±0.02
µA/mM·cm2 and 0.6±0.2 mM, respectively, which are very close to the values obtained for
the first day in PBS: sensitivity of 0.4±0.1 µA/mM·cm2 and LOD of 0.6±0.2 mM. The values
in sensitivity and LOD obtained in human serum proved that our biosensors are capable of
measuring glucose in human serum without losing sensitivity. The main differences are that
the blank current value is higher in serum due to the presence of traces of glucose, and that
the current steps are about 1 nA lower than the current steps registered in PBS.
It is thus concluded that the biosensors reported in this study were stable and reproducible
enough for the determination of glucose in biological samples. Overall, high sensitivity, excel-
lent selectivity, linearity and long-time stability exhibited by the biosensors presented in this
study, make them good candidates for in-vivo detection of glucose.
Moreover, the results reported in Section 6.2.1 will show that the membrane system illustrated
in this chapter perfectly fit with the limit imposed by the integrated circuits. The chronoam-
perometry of glucose measured with the custom-made integrated circuit does not statistically
differ from the measurements obtained with the commercial potentiostat.
5.1.5 Monitoring Acetaminophen and glucose with the same sensing platform
We finally investigated the possibility to measure a drug, acetaminophen, and a metabolite,
glucose, with the same sensing platform. Initially we performed measurement in chronoam-
96
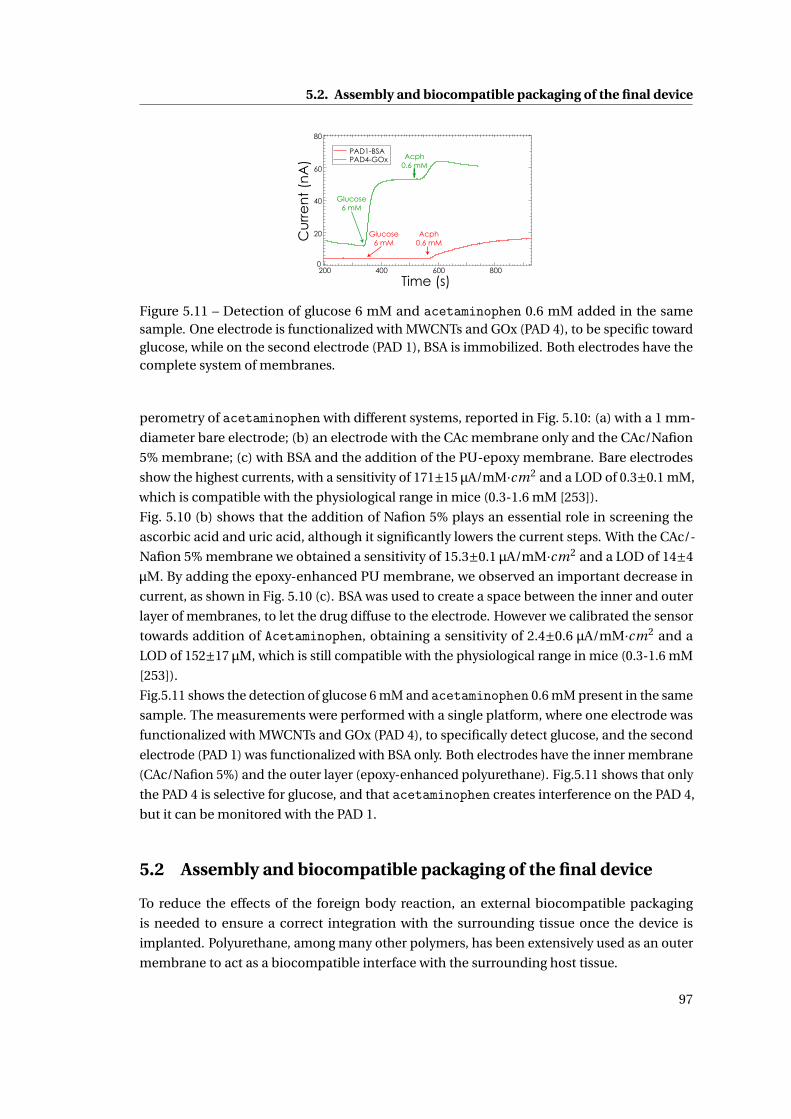
5.2. Assembly and biocompatible packaging of the final device
Cu
rre
nt
(nA
)
Time (s)
PAD4-GOx PAD1-BSA
Acph0.6 mM
80
60
40
20
0200 400 600 800
Glucose6 mM
Glucose6 mM
Acph0.6 mM
Figure 5.11 – Detection of glucose 6 mM and acetaminophen 0.6 mM added in the samesample. One electrode is functionalized with MWCNTs and GOx (PAD 4), to be specific towardglucose, while on the second electrode (PAD 1), BSA is immobilized. Both electrodes have thecomplete system of membranes.
perometry of acetaminophen with different systems, reported in Fig. 5.10: (a) with a 1 mm-
diameter bare electrode; (b) an electrode with the CAc membrane only and the CAc/Nafion
5% membrane; (c) with BSA and the addition of the PU-epoxy membrane. Bare electrodes
show the highest currents, with a sensitivity of 171±15 µA/mM·cm2 and a LOD of 0.3±0.1 mM,
which is compatible with the physiological range in mice (0.3-1.6 mM [253]).
Fig. 5.10 (b) shows that the addition of Nafion 5% plays an essential role in screening the
ascorbic acid and uric acid, although it significantly lowers the current steps. With the CAc/-
Nafion 5% membrane we obtained a sensitivity of 15.3±0.1 µA/mM·cm2 and a LOD of 14±4
µM. By adding the epoxy-enhanced PU membrane, we observed an important decrease in
current, as shown in Fig. 5.10 (c). BSA was used to create a space between the inner and outer
layer of membranes, to let the drug diffuse to the electrode. However we calibrated the sensor
towards addition of Acetaminophen, obtaining a sensitivity of 2.4±0.6 µA/mM·cm2 and a
LOD of 152±17 µM, which is still compatible with the physiological range in mice (0.3-1.6 mM
[253]).
Fig.5.11 shows the detection of glucose 6 mM and acetaminophen 0.6 mM present in the same
sample. The measurements were performed with a single platform, where one electrode was
functionalized with MWCNTs and GOx (PAD 4), to specifically detect glucose, and the second
electrode (PAD 1) was functionalized with BSA only. Both electrodes have the inner membrane
(CAc/Nafion 5%) and the outer layer (epoxy-enhanced polyurethane). Fig.5.11 shows that only
the PAD 4 is selective for glucose, and that acetaminophen creates interference on the PAD 4,
but it can be monitored with the PAD 1.
5.2 Assembly and biocompatible packaging of the final device
To reduce the effects of the foreign body reaction, an external biocompatible packaging
is needed to ensure a correct integration with the surrounding tissue once the device is
implanted. Polyurethane, among many other polymers, has been extensively used as an outer
membrane to act as a biocompatible interface with the surrounding host tissue.
97
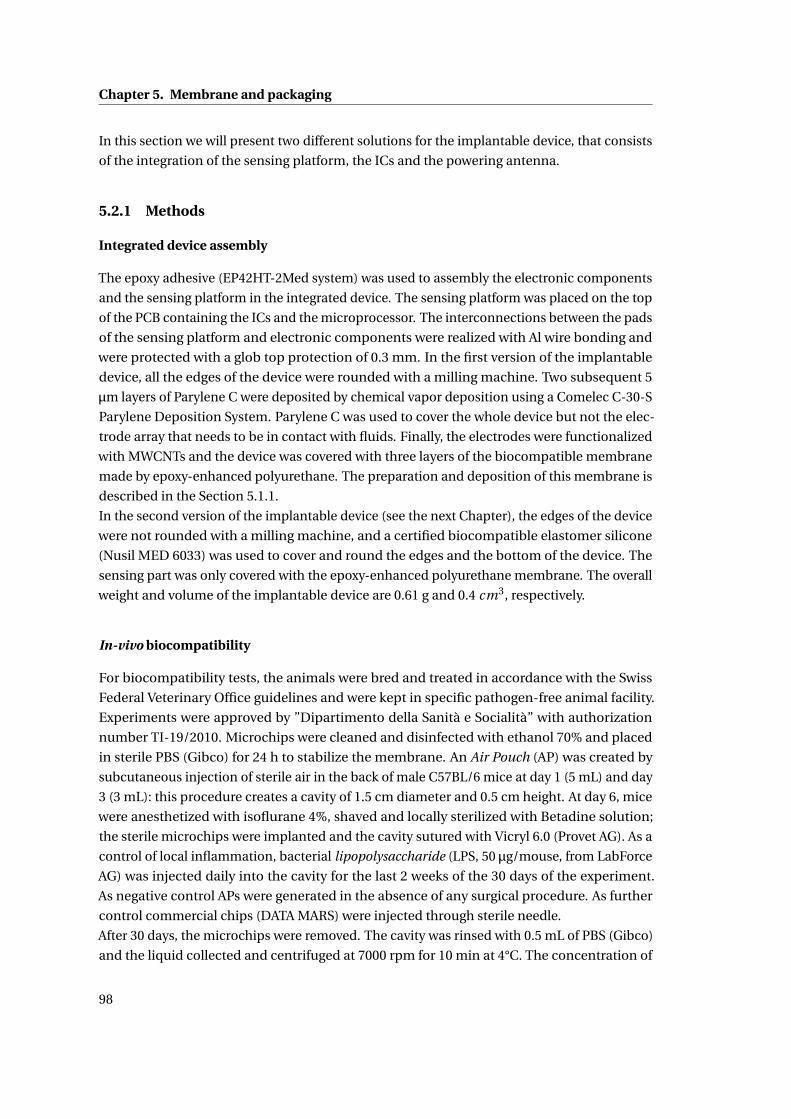
Chapter 5. Membrane and packaging
In this section we will present two different solutions for the implantable device, that consists
of the integration of the sensing platform, the ICs and the powering antenna.
5.2.1 Methods
Integrated device assembly
The epoxy adhesive (EP42HT-2Med system) was used to assembly the electronic components
and the sensing platform in the integrated device. The sensing platform was placed on the top
of the PCB containing the ICs and the microprocessor. The interconnections between the pads
of the sensing platform and electronic components were realized with Al wire bonding and
were protected with a glob top protection of 0.3 mm. In the first version of the implantable
device, all the edges of the device were rounded with a milling machine. Two subsequent 5
µm layers of Parylene C were deposited by chemical vapor deposition using a Comelec C-30-S
Parylene Deposition System. Parylene C was used to cover the whole device but not the elec-
trode array that needs to be in contact with fluids. Finally, the electrodes were functionalized
with MWCNTs and the device was covered with three layers of the biocompatible membrane
made by epoxy-enhanced polyurethane. The preparation and deposition of this membrane is
described in the Section 5.1.1.
In the second version of the implantable device (see the next Chapter), the edges of the device
were not rounded with a milling machine, and a certified biocompatible elastomer silicone
(Nusil MED 6033) was used to cover and round the edges and the bottom of the device. The
sensing part was only covered with the epoxy-enhanced polyurethane membrane. The overall
weight and volume of the implantable device are 0.61 g and 0.4 cm3, respectively.
In-vivo biocompatibility
For biocompatibility tests, the animals were bred and treated in accordance with the Swiss
Federal Veterinary Office guidelines and were kept in specific pathogen-free animal facility.
Experiments were approved by ”Dipartimento della Sanità e Socialità” with authorization
number TI-19/2010. Microchips were cleaned and disinfected with ethanol 70% and placed
in sterile PBS (Gibco) for 24 h to stabilize the membrane. An Air Pouch (AP) was created by
subcutaneous injection of sterile air in the back of male C57BL/6 mice at day 1 (5 mL) and day
3 (3 mL): this procedure creates a cavity of 1.5 cm diameter and 0.5 cm height. At day 6, mice
were anesthetized with isoflurane 4%, shaved and locally sterilized with Betadine solution;
the sterile microchips were implanted and the cavity sutured with Vicryl 6.0 (Provet AG). As a
control of local inflammation, bacterial lipopolysaccharide (LPS, 50 µg/mouse, from LabForce
AG) was injected daily into the cavity for the last 2 weeks of the 30 days of the experiment.
As negative control APs were generated in the absence of any surgical procedure. As further
control commercial chips (DATA MARS) were injected through sterile needle.
After 30 days, the microchips were removed. The cavity was rinsed with 0.5 mL of PBS (Gibco)
and the liquid collected and centrifuged at 7000 rpm for 10 min at 4°C. The concentration of
98
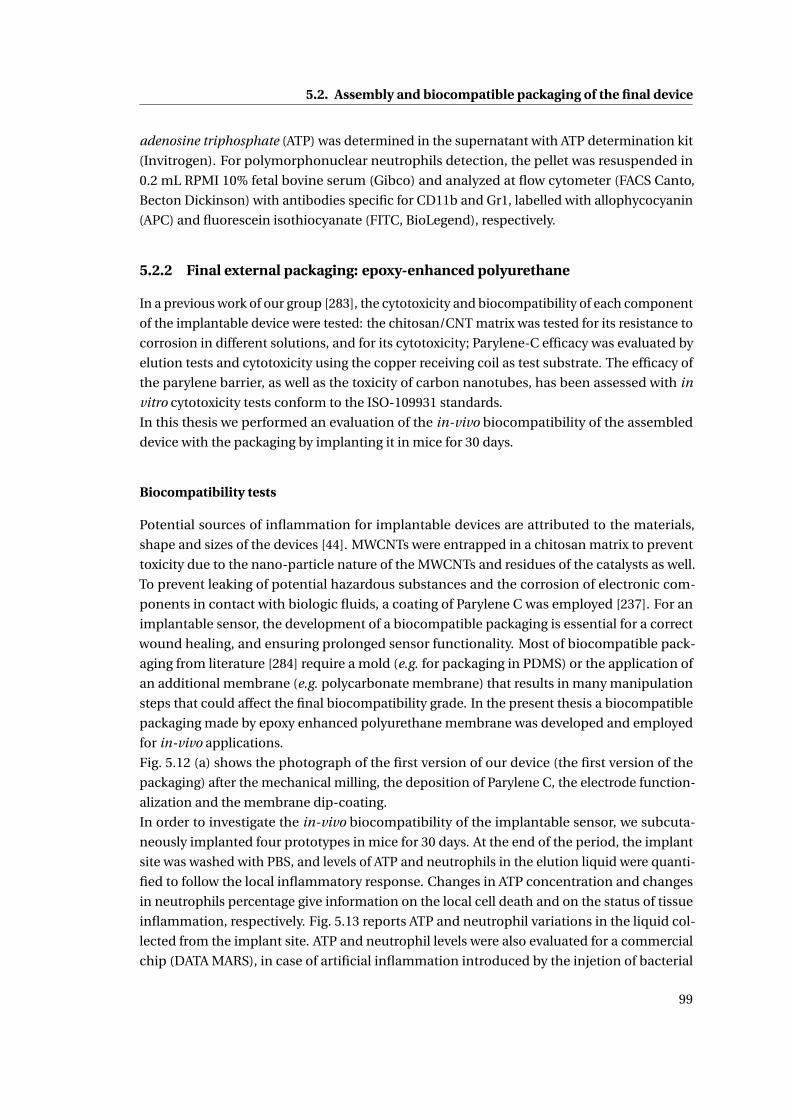
5.2. Assembly and biocompatible packaging of the final device
adenosine triphosphate (ATP) was determined in the supernatant with ATP determination kit
(Invitrogen). For polymorphonuclear neutrophils detection, the pellet was resuspended in
0.2 mL RPMI 10% fetal bovine serum (Gibco) and analyzed at flow cytometer (FACS Canto,
Becton Dickinson) with antibodies specific for CD11b and Gr1, labelled with allophycocyanin
(APC) and fluorescein isothiocyanate (FITC, BioLegend), respectively.
5.2.2 Final external packaging: epoxy-enhanced polyurethane
In a previous work of our group [283], the cytotoxicity and biocompatibility of each component
of the implantable device were tested: the chitosan/CNT matrix was tested for its resistance to
corrosion in different solutions, and for its cytotoxicity; Parylene-C efficacy was evaluated by
elution tests and cytotoxicity using the copper receiving coil as test substrate. The efficacy of
the parylene barrier, as well as the toxicity of carbon nanotubes, has been assessed with in
vitro cytotoxicity tests conform to the ISO-109931 standards.
In this thesis we performed an evaluation of the in-vivo biocompatibility of the assembled
device with the packaging by implanting it in mice for 30 days.
Biocompatibility tests
Potential sources of inflammation for implantable devices are attributed to the materials,
shape and sizes of the devices [44]. MWCNTs were entrapped in a chitosan matrix to prevent
toxicity due to the nano-particle nature of the MWCNTs and residues of the catalysts as well.
To prevent leaking of potential hazardous substances and the corrosion of electronic com-
ponents in contact with biologic fluids, a coating of Parylene C was employed [237]. For an
implantable sensor, the development of a biocompatible packaging is essential for a correct
wound healing, and ensuring prolonged sensor functionality. Most of biocompatible pack-
aging from literature [284] require a mold (e.g. for packaging in PDMS) or the application of
an additional membrane (e.g. polycarbonate membrane) that results in many manipulation
steps that could affect the final biocompatibility grade. In the present thesis a biocompatible
packaging made by epoxy enhanced polyurethane membrane was developed and employed
for in-vivo applications.
Fig. 5.12 (a) shows the photograph of the first version of our device (the first version of the
packaging) after the mechanical milling, the deposition of Parylene C, the electrode function-
alization and the membrane dip-coating.
In order to investigate the in-vivo biocompatibility of the implantable sensor, we subcuta-
neously implanted four prototypes in mice for 30 days. At the end of the period, the implant
site was washed with PBS, and levels of ATP and neutrophils in the elution liquid were quanti-
fied to follow the local inflammatory response. Changes in ATP concentration and changes
in neutrophils percentage give information on the local cell death and on the status of tissue
inflammation, respectively. Fig. 5.13 reports ATP and neutrophil variations in the liquid col-
lected from the implant site. ATP and neutrophil levels were also evaluated for a commercial
chip (DATA MARS), in case of artificial inflammation introduced by the injetion of bacterial
99
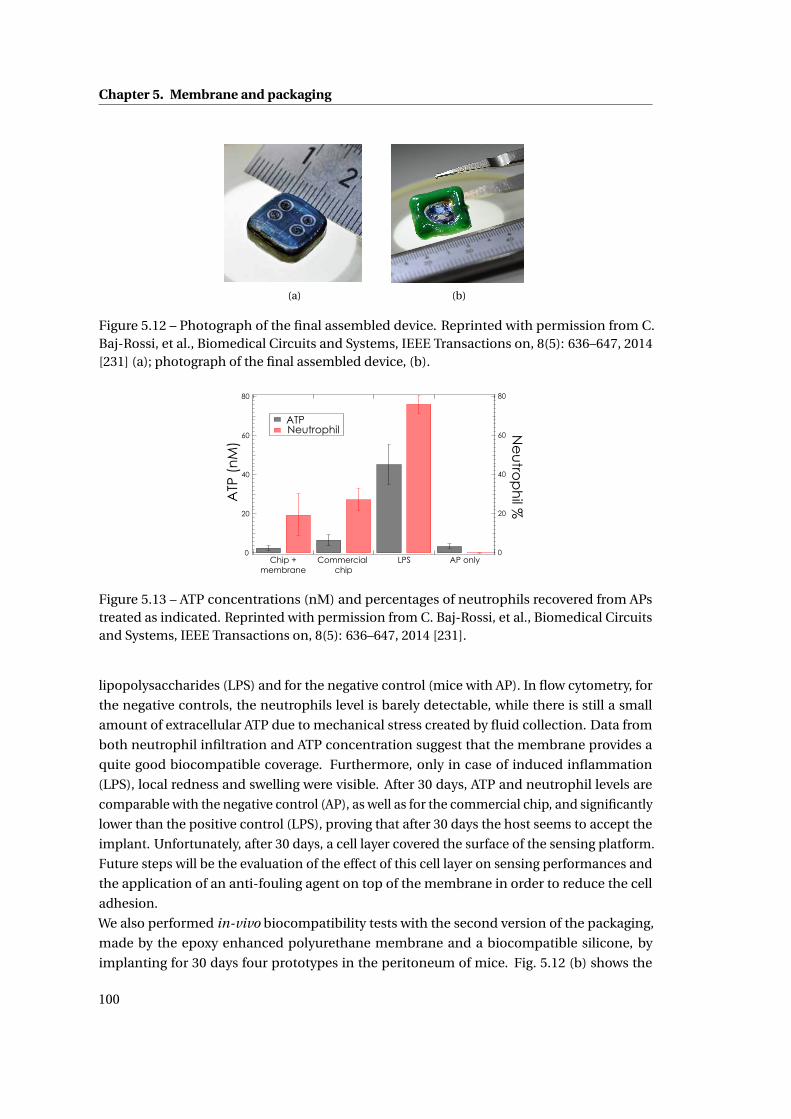
Chapter 5. Membrane and packaging
(a) (b)
Figure 5.12 – Photograph of the final assembled device. Reprinted with permission from C.Baj-Rossi, et al., Biomedical Circuits and Systems, IEEE Transactions on, 8(5): 636–647, 2014[231] (a); photograph of the final assembled device, (b).
80
60
40
20
0Chip +
membraneCommercial
chipLPS AP only
ATP Neutrophil
80
60
40
20
0
ATP
(n
M)
Ne
utro
ph
il %
Figure 5.13 – ATP concentrations (nM) and percentages of neutrophils recovered from APstreated as indicated. Reprinted with permission from C. Baj-Rossi, et al., Biomedical Circuitsand Systems, IEEE Transactions on, 8(5): 636–647, 2014 [231].
lipopolysaccharides (LPS) and for the negative control (mice with AP). In flow cytometry, for
the negative controls, the neutrophils level is barely detectable, while there is still a small
amount of extracellular ATP due to mechanical stress created by fluid collection. Data from
both neutrophil infiltration and ATP concentration suggest that the membrane provides a
quite good biocompatible coverage. Furthermore, only in case of induced inflammation
(LPS), local redness and swelling were visible. After 30 days, ATP and neutrophil levels are
comparable with the negative control (AP), as well as for the commercial chip, and significantly
lower than the positive control (LPS), proving that after 30 days the host seems to accept the
implant. Unfortunately, after 30 days, a cell layer covered the surface of the sensing platform.
Future steps will be the evaluation of the effect of this cell layer on sensing performances and
the application of an anti-fouling agent on top of the membrane in order to reduce the cell
adhesion.
We also performed in-vivo biocompatibility tests with the second version of the packaging,
made by the epoxy enhanced polyurethane membrane and a biocompatible silicone, by
implanting for 30 days four prototypes in the peritoneum of mice. Fig. 5.12 (b) shows the
100

5.3. Summary
photograph of the second version of our device. Unfortunately, the level of neutrophils was
still high after 30 days, proving that the host does not tolerate this implant. From these tests we
can conclude that the peritoneum is probably not the best place to implant our device, as the
mouse can easily scratch the suture and increase the level of the inflammation. Moreover in a
previous study from our group, a similar packaging (same materials but different shape) was
used for the same study and it showed after 30 days a significant reduction of the inflammatory
response in time, suggesting normal host recovery.
5.3 Summary
In this chapter we first presented the realization and the complete in-vitro characterization of
a system of membranes that consists of: an ”inner” permselective layer, designed to filter the
signal generated by the oxidation of interfering substances present in biological fluids, such as
ascorbic acid and uric acid; and an ”outer” layer made by an epoxy-enhanced polyurethane
film, that regulates the passage of glucose and oxygen to the electrode surface and provides
a biocompatible layer for a correct integration with the surrounding tissue. This system of
membrane was employed in a glucose sensor and it successfully monitored glucose in both
the human and mice physiological range, in PBS and in human serum at 37°C. The sensor
showed good stability for 30 days at 25°C, and the permselective membrane effectively filtered
out ascorbic acid and uric acid. Moreover, with the same system of membrane we developed a
biosensor for detection of the anti-inflammatory drug acetaminophen.
In the last section of this chapter we showed the assembly of the sensing platform with the
electronic components into the implantable device. The external packaging was tested to
assess the in-vivo biocompatibility by implanting the device in mice for 30 days. The tests
proved that the material used for the fabrication of the device and the external packaging
generated an inflammation level comparable to a commercial implantable chip, thus proving
that the device, after 30 days, is well tolerated by the host.
101

6 The implantable device
Fully implantable devices require an adequate electronic system for the correct sensor ac-
tuation, power management and data transmission. At the same time the device should be
small and minimally invasive. From the point of view of the power management, the main
challenge is to find a balance between the need of a small implant and the need to achieve
an efficient power transfer to the implanted system. Although batteries have been largely
used for supplying power in implantable devices [190], they are not suitable for long-term
implants because their limited lifetime necessitates frequent replacement or recharging. The
best choice is the development of a wireless power delivery system. For medical implant,
several methods for a wireless power delivery have been investigated so far in literature. We
opted for a battery-less inductive powering link system1, designed to continuously transfer
the power to the implantable device according to the position of the animal.
For the sensor actuation, the readout electronics were realized with miniaturized integrated
circuits (ICs)2. The main challenge resides in developing ICs that could perform the control
and readout of both chronoamperometry and cyclic voltammetry for a biosensor, with low
power consumption. Finally, an appropriate communication system was also developed, that
could transmit the data in real-time, receive and visualize the data on a screen3.
In this chapter we present the final integration of the implantable device into a working system.
The device consists of three main blocks: (i) the sensing platform; (ii) an interface electronics
to control and readout the biosensor; (iii) a power management unit. We decided to vertically
assembly the device, placing the platform on the top of the printed circuit board (PCB) that
contains the dedicated IC, a microcontroller and the antenna on the bottom. The platform
measures 12x11 mm, to fit the size of the coil (12x12 mm), and to leave some space for the
wire bonding between the pads on the platform and the pads on the PCB (as illustrated in
Fig. 4.1).
We show that the system can be autonomously powered, can effectively actuate the sensors
that are located on the sensing platform and can transmit the data to an external device, like a
1realized by Enver Kilinc, Radio Frequency Integrated Circuit Group, EPFL.2realized by Sara Ghoreishizadeh, Integrated System Laboratory, EPFL.3thanks to the work of Stefano Riario and Francesca Stradolini, Integrated System Laboratory, EPFL.
103
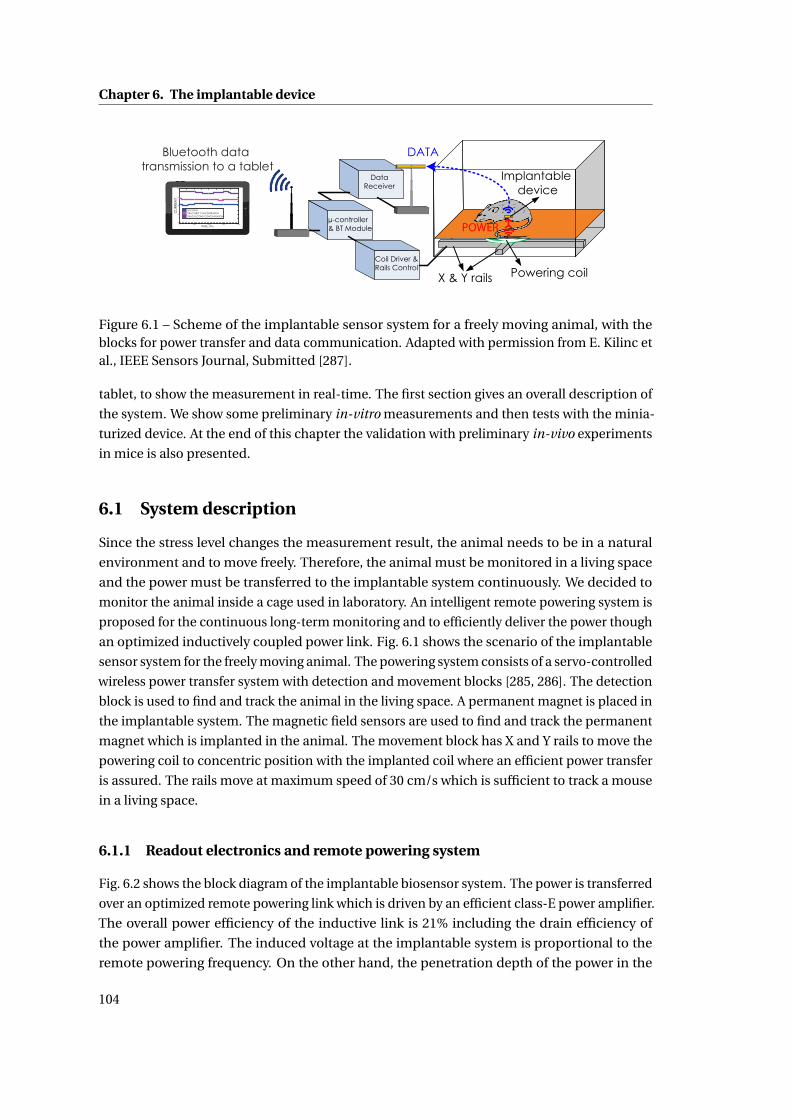
Chapter 6. The implantable device
Powering coil
POWER
DATA
Implantable device
µ-controller & BT Module
X & Y rails
Coil Driver &Rails Control
DataReceiver40
30
20
10
0
CU
RR
ENT
40003000200010000
TIME, ms
NO DRUG DRUG FIRST CONCENTRATION DRUG SECOND CONCENTRATION
Bluetooth data transmission to a tablet
Figure 6.1 – Scheme of the implantable sensor system for a freely moving animal, with theblocks for power transfer and data communication. Adapted with permission from E. Kilinc etal., IEEE Sensors Journal, Submitted [287].
tablet, to show the measurement in real-time. The first section gives an overall description of
the system. We show some preliminary in-vitro measurements and then tests with the minia-
turized device. At the end of this chapter the validation with preliminary in-vivo experiments
in mice is also presented.
6.1 System description
Since the stress level changes the measurement result, the animal needs to be in a natural
environment and to move freely. Therefore, the animal must be monitored in a living space
and the power must be transferred to the implantable system continuously. We decided to
monitor the animal inside a cage used in laboratory. An intelligent remote powering system is
proposed for the continuous long-term monitoring and to efficiently deliver the power though
an optimized inductively coupled power link. Fig. 6.1 shows the scenario of the implantable
sensor system for the freely moving animal. The powering system consists of a servo-controlled
wireless power transfer system with detection and movement blocks [285, 286]. The detection
block is used to find and track the animal in the living space. A permanent magnet is placed in
the implantable system. The magnetic field sensors are used to find and track the permanent
magnet which is implanted in the animal. The movement block has X and Y rails to move the
powering coil to concentric position with the implanted coil where an efficient power transfer
is assured. The rails move at maximum speed of 30 cm/s which is sufficient to track a mouse
in a living space.
6.1.1 Readout electronics and remote powering system
Fig. 6.2 shows the block diagram of the implantable biosensor system. The power is transferred
over an optimized remote powering link which is driven by an efficient class-E power amplifier.
The overall power efficiency of the inductive link is 21% including the drain efficiency of
the power amplifier. The induced voltage at the implantable system is proportional to the
remote powering frequency. On the other hand, the penetration depth of the power in the
104
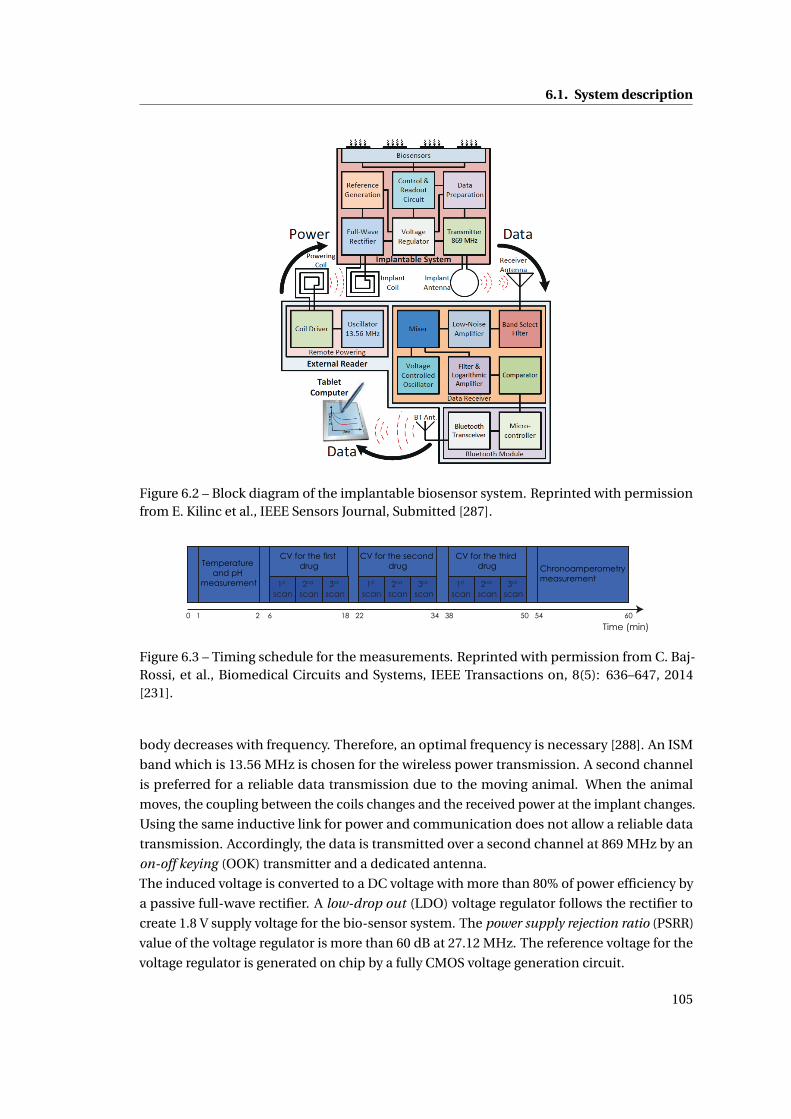
6.1. System description
Figure 6.2 – Block diagram of the implantable biosensor system. Reprinted with permissionfrom E. Kilinc et al., IEEE Sensors Journal, Submitted [287].
Time (min)0 1 2 6 18 22 34 38 50 54 60
Temperature and pH
measurement
CV for the first drug
CV for the second drug
CV for the third drug Chronoamperometry
measurement1st
scan2nd
scan3rd
scan1st
scan2nd
scan3rd
scan1st
scan2nd
scan3rd
scan
Figure 6.3 – Timing schedule for the measurements. Reprinted with permission from C. Baj-Rossi, et al., Biomedical Circuits and Systems, IEEE Transactions on, 8(5): 636–647, 2014[231].
body decreases with frequency. Therefore, an optimal frequency is necessary [288]. An ISM
band which is 13.56 MHz is chosen for the wireless power transmission. A second channel
is preferred for a reliable data transmission due to the moving animal. When the animal
moves, the coupling between the coils changes and the received power at the implant changes.
Using the same inductive link for power and communication does not allow a reliable data
transmission. Accordingly, the data is transmitted over a second channel at 869 MHz by an
on-off keying (OOK) transmitter and a dedicated antenna.
The induced voltage is converted to a DC voltage with more than 80% of power efficiency by
a passive full-wave rectifier. A low-drop out (LDO) voltage regulator follows the rectifier to
create 1.8 V supply voltage for the bio-sensor system. The power supply rejection ratio (PSRR)
value of the voltage regulator is more than 60 dB at 27.12 MHz. The reference voltage for the
voltage regulator is generated on chip by a fully CMOS voltage generation circuit.
105
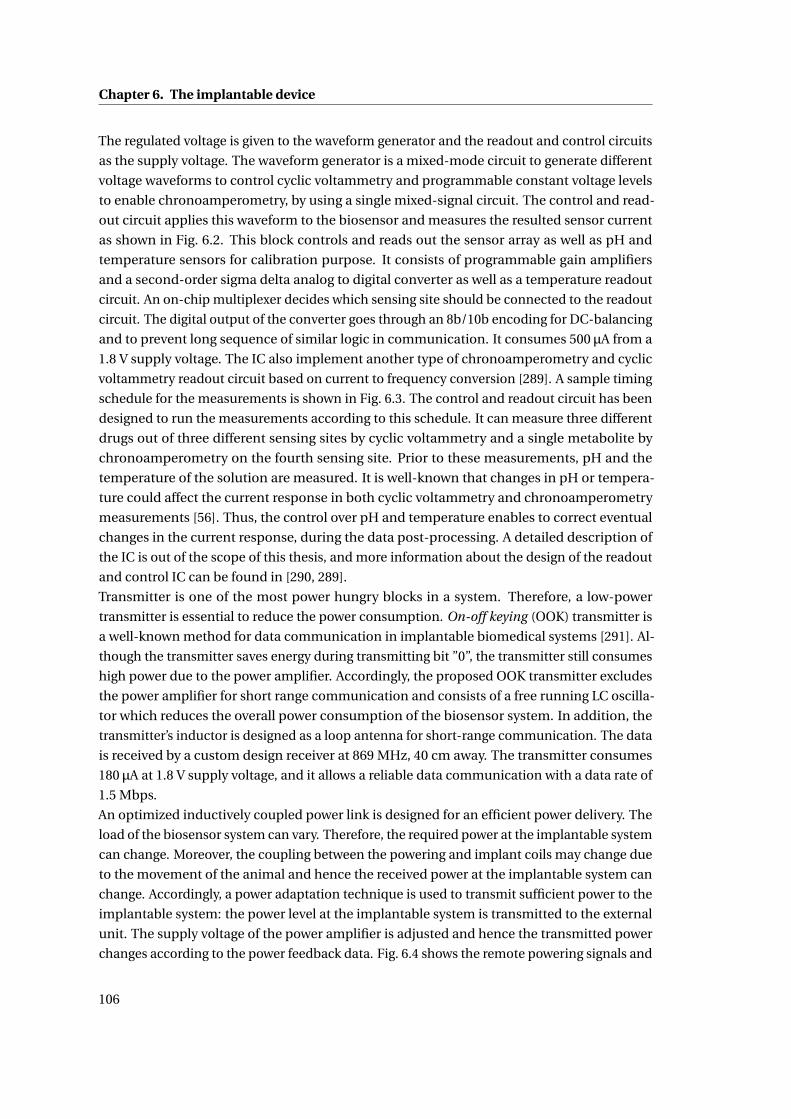
Chapter 6. The implantable device
The regulated voltage is given to the waveform generator and the readout and control circuits
as the supply voltage. The waveform generator is a mixed-mode circuit to generate different
voltage waveforms to control cyclic voltammetry and programmable constant voltage levels
to enable chronoamperometry, by using a single mixed-signal circuit. The control and read-
out circuit applies this waveform to the biosensor and measures the resulted sensor current
as shown in Fig. 6.2. This block controls and reads out the sensor array as well as pH and
temperature sensors for calibration purpose. It consists of programmable gain amplifiers
and a second-order sigma delta analog to digital converter as well as a temperature readout
circuit. An on-chip multiplexer decides which sensing site should be connected to the readout
circuit. The digital output of the converter goes through an 8b/10b encoding for DC-balancing
and to prevent long sequence of similar logic in communication. It consumes 500 µA from a
1.8 V supply voltage. The IC also implement another type of chronoamperometry and cyclic
voltammetry readout circuit based on current to frequency conversion [289]. A sample timing
schedule for the measurements is shown in Fig. 6.3. The control and readout circuit has been
designed to run the measurements according to this schedule. It can measure three different
drugs out of three different sensing sites by cyclic voltammetry and a single metabolite by
chronoamperometry on the fourth sensing site. Prior to these measurements, pH and the
temperature of the solution are measured. It is well-known that changes in pH or tempera-
ture could affect the current response in both cyclic voltammetry and chronoamperometry
measurements [56]. Thus, the control over pH and temperature enables to correct eventual
changes in the current response, during the data post-processing. A detailed description of
the IC is out of the scope of this thesis, and more information about the design of the readout
and control IC can be found in [290, 289].
Transmitter is one of the most power hungry blocks in a system. Therefore, a low-power
transmitter is essential to reduce the power consumption. On-off keying (OOK) transmitter is
a well-known method for data communication in implantable biomedical systems [291]. Al-
though the transmitter saves energy during transmitting bit ”0”, the transmitter still consumes
high power due to the power amplifier. Accordingly, the proposed OOK transmitter excludes
the power amplifier for short range communication and consists of a free running LC oscilla-
tor which reduces the overall power consumption of the biosensor system. In addition, the
transmitter’s inductor is designed as a loop antenna for short-range communication. The data
is received by a custom design receiver at 869 MHz, 40 cm away. The transmitter consumes
180 µA at 1.8 V supply voltage, and it allows a reliable data communication with a data rate of
1.5 Mbps.
An optimized inductively coupled power link is designed for an efficient power delivery. The
load of the biosensor system can vary. Therefore, the required power at the implantable system
can change. Moreover, the coupling between the powering and implant coils may change due
to the movement of the animal and hence the received power at the implantable system can
change. Accordingly, a power adaptation technique is used to transmit sufficient power to the
implantable system: the power level at the implantable system is transmitted to the external
unit. The supply voltage of the power amplifier is adjusted and hence the transmitted power
changes according to the power feedback data. Fig. 6.4 shows the remote powering signals and
106
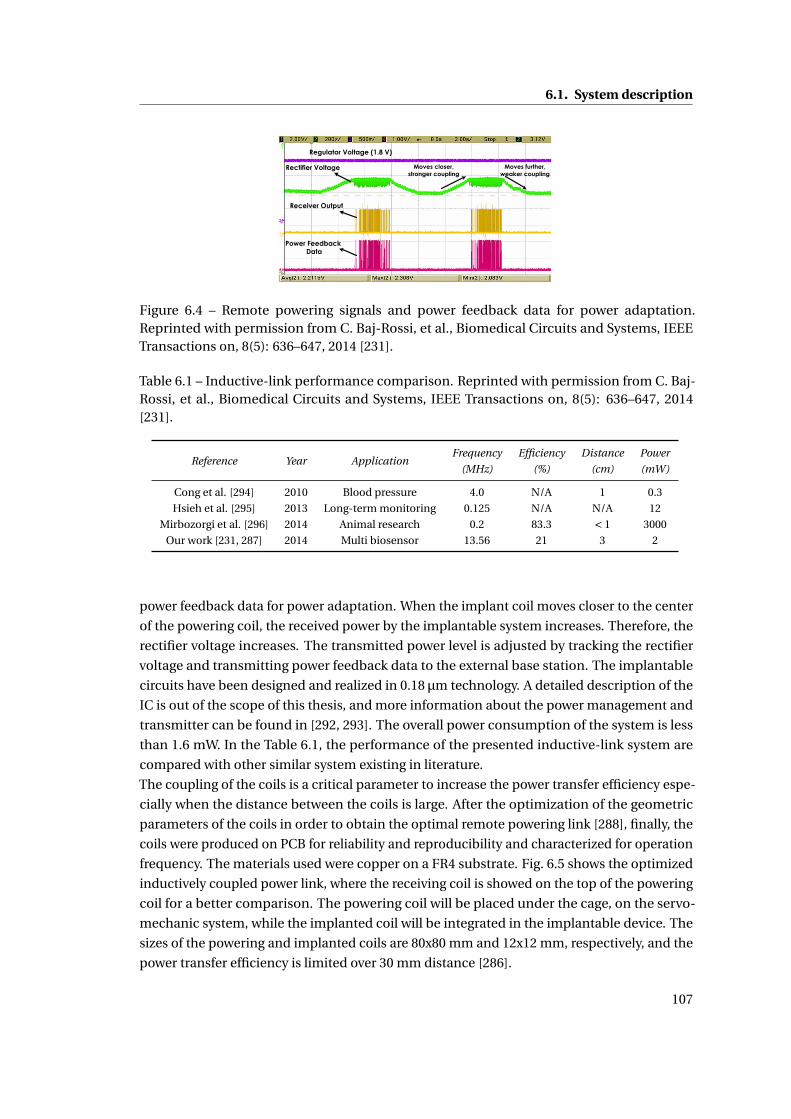
6.1. System description
Regulator Voltage (1.8 V)
Rectifier Voltage
Receiver Output
Power Feedback Data
Moves closer,stronger coupling
Moves further,weaker coupling
Figure 6.4 – Remote powering signals and power feedback data for power adaptation.Reprinted with permission from C. Baj-Rossi, et al., Biomedical Circuits and Systems, IEEETransactions on, 8(5): 636–647, 2014 [231].
Table 6.1 – Inductive-link performance comparison. Reprinted with permission from C. Baj-Rossi, et al., Biomedical Circuits and Systems, IEEE Transactions on, 8(5): 636–647, 2014[231].
Reference Year ApplicationFrequency Efficiency Distance Power
(MHz) (%) (cm) (mW)
Cong et al. [294] 2010 Blood pressure 4.0 N/A 1 0.3
Hsieh et al. [295] 2013 Long-term monitoring 0.125 N/A N/A 12
Mirbozorgi et al. [296] 2014 Animal research 0.2 83.3 < 1 3000
Our work [231, 287] 2014 Multi biosensor 13.56 21 3 2
power feedback data for power adaptation. When the implant coil moves closer to the center
of the powering coil, the received power by the implantable system increases. Therefore, the
rectifier voltage increases. The transmitted power level is adjusted by tracking the rectifier
voltage and transmitting power feedback data to the external base station. The implantable
circuits have been designed and realized in 0.18 µm technology. A detailed description of the
IC is out of the scope of this thesis, and more information about the power management and
transmitter can be found in [292, 293]. The overall power consumption of the system is less
than 1.6 mW. In the Table 6.1, the performance of the presented inductive-link system are
compared with other similar system existing in literature.
The coupling of the coils is a critical parameter to increase the power transfer efficiency espe-
cially when the distance between the coils is large. After the optimization of the geometric
parameters of the coils in order to obtain the optimal remote powering link [288], finally, the
coils were produced on PCB for reliability and reproducibility and characterized for operation
frequency. The materials used were copper on a FR4 substrate. Fig. 6.5 shows the optimized
inductively coupled power link, where the receiving coil is showed on the top of the powering
coil for a better comparison. The powering coil will be placed under the cage, on the servo-
mechanic system, while the implanted coil will be integrated in the implantable device. The
sizes of the powering and implanted coils are 80x80 mm and 12x12 mm, respectively, and the
power transfer efficiency is limited over 30 mm distance [286].
107
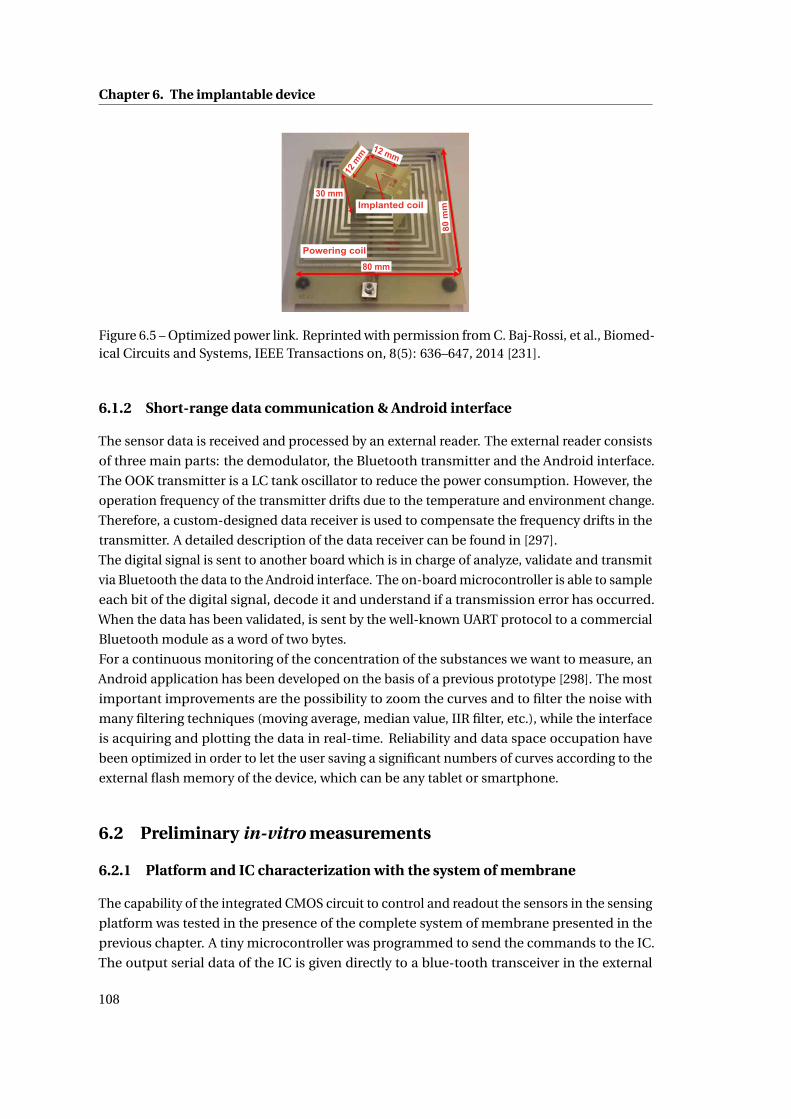
Chapter 6. The implantable device
30 mm
80 mm
80 m
m
Powering coil
Implanted coil
12 m
m
12 mm
Figure 6.5 – Optimized power link. Reprinted with permission from C. Baj-Rossi, et al., Biomed-ical Circuits and Systems, IEEE Transactions on, 8(5): 636–647, 2014 [231].
6.1.2 Short-range data communication & Android interface
The sensor data is received and processed by an external reader. The external reader consists
of three main parts: the demodulator, the Bluetooth transmitter and the Android interface.
The OOK transmitter is a LC tank oscillator to reduce the power consumption. However, the
operation frequency of the transmitter drifts due to the temperature and environment change.
Therefore, a custom-designed data receiver is used to compensate the frequency drifts in the
transmitter. A detailed description of the data receiver can be found in [297].
The digital signal is sent to another board which is in charge of analyze, validate and transmit
via Bluetooth the data to the Android interface. The on-board microcontroller is able to sample
each bit of the digital signal, decode it and understand if a transmission error has occurred.
When the data has been validated, is sent by the well-known UART protocol to a commercial
Bluetooth module as a word of two bytes.
For a continuous monitoring of the concentration of the substances we want to measure, an
Android application has been developed on the basis of a previous prototype [298]. The most
important improvements are the possibility to zoom the curves and to filter the noise with
many filtering techniques (moving average, median value, IIR filter, etc.), while the interface
is acquiring and plotting the data in real-time. Reliability and data space occupation have
been optimized in order to let the user saving a significant numbers of curves according to the
external flash memory of the device, which can be any tablet or smartphone.
6.2 Preliminary in-vitro measurements
6.2.1 Platform and IC characterization with the system of membrane
The capability of the integrated CMOS circuit to control and readout the sensors in the sensing
platform was tested in the presence of the complete system of membrane presented in the
previous chapter. A tiny microcontroller was programmed to send the commands to the IC.
The output serial data of the IC is given directly to a blue-tooth transceiver in the external
108
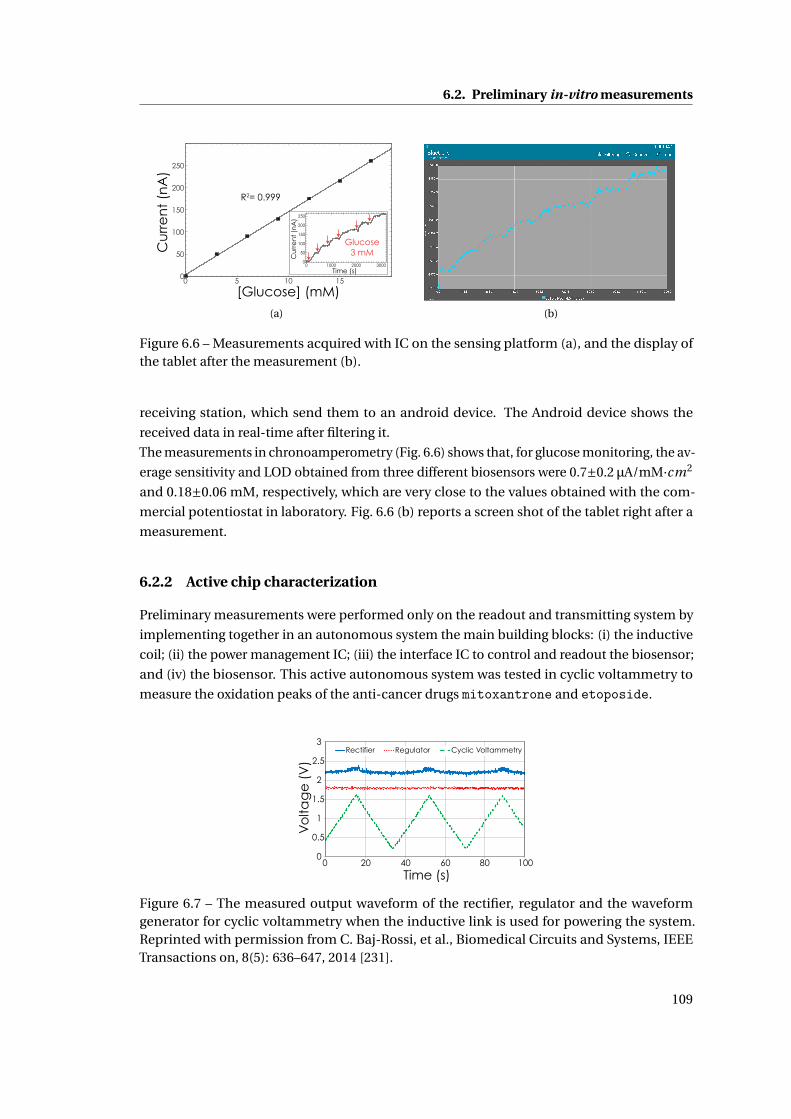
6.2. Preliminary in-vitro measurements
[Glucose] (mM)
Cu
rre
nt
(nA
)
R2= 0.999
0 5 10 150
50
100
150
200
250
Cu
rre
nt
(nA
)
Time (s)
Glucose3 mM
250
200
150
100
50
03000200010000
(a) (b)
Figure 6.6 – Measurements acquired with IC on the sensing platform (a), and the display ofthe tablet after the measurement (b).
receiving station, which send them to an android device. The Android device shows the
received data in real-time after filtering it.
The measurements in chronoamperometry (Fig. 6.6) shows that, for glucose monitoring, the av-
erage sensitivity and LOD obtained from three different biosensors were 0.7±0.2 µA/mM·cm2
and 0.18±0.06 mM, respectively, which are very close to the values obtained with the com-
mercial potentiostat in laboratory. Fig. 6.6 (b) reports a screen shot of the tablet right after a
measurement.
6.2.2 Active chip characterization
Preliminary measurements were performed only on the readout and transmitting system by
implementing together in an autonomous system the main building blocks: (i) the inductive
coil; (ii) the power management IC; (iii) the interface IC to control and readout the biosensor;
and (iv) the biosensor. This active autonomous system was tested in cyclic voltammetry to
measure the oxidation peaks of the anti-cancer drugs mitoxantrone and etoposide.
0
0.5
1
1.5
2
2.5
3
0 20 40 60 80 100
Vo
ltag
e (
V)
Time (s)
Regulator Cyclic VoltammetryRectifier
Figure 6.7 – The measured output waveform of the rectifier, regulator and the waveformgenerator for cyclic voltammetry when the inductive link is used for powering the system.Reprinted with permission from C. Baj-Rossi, et al., Biomedical Circuits and Systems, IEEETransactions on, 8(5): 636–647, 2014 [231].
109
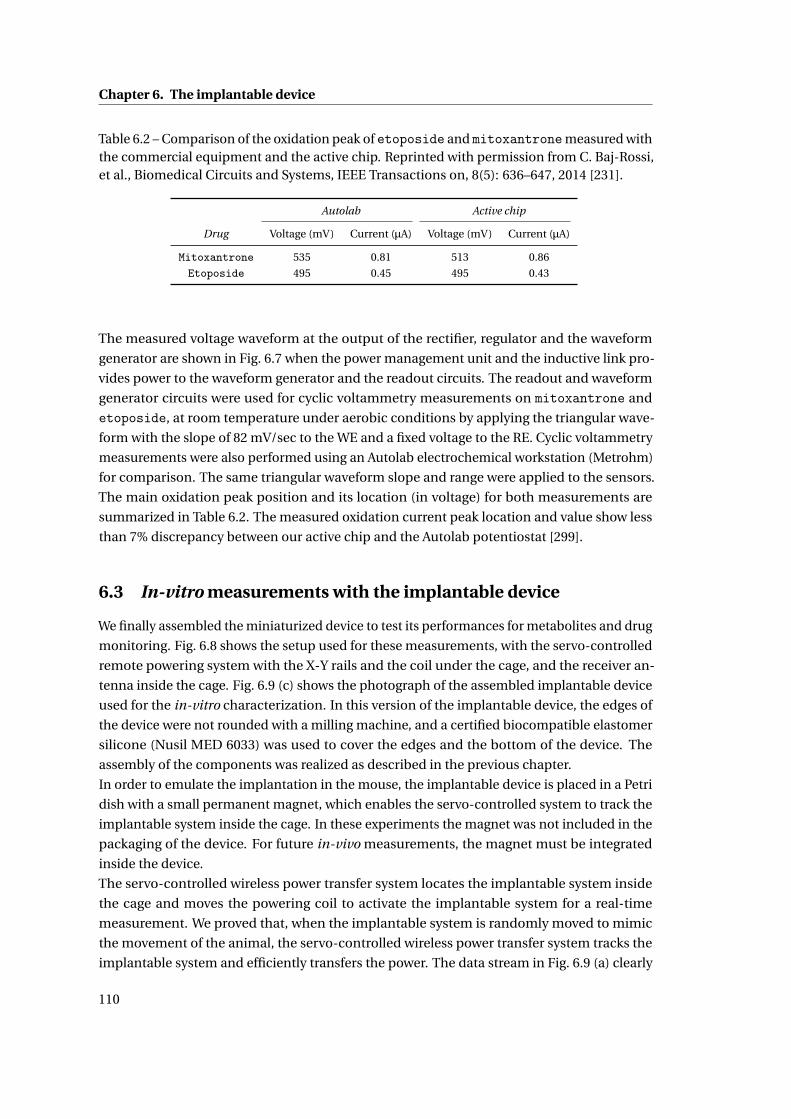
Chapter 6. The implantable device
Table 6.2 – Comparison of the oxidation peak of etoposide and mitoxantronemeasured withthe commercial equipment and the active chip. Reprinted with permission from C. Baj-Rossi,et al., Biomedical Circuits and Systems, IEEE Transactions on, 8(5): 636–647, 2014 [231].
Autolab Active chip
Drug Voltage (mV) Current (µA) Voltage (mV) Current (µA)
Mitoxantrone 535 0.81 513 0.86
Etoposide 495 0.45 495 0.43
The measured voltage waveform at the output of the rectifier, regulator and the waveform
generator are shown in Fig. 6.7 when the power management unit and the inductive link pro-
vides power to the waveform generator and the readout circuits. The readout and waveform
generator circuits were used for cyclic voltammetry measurements on mitoxantrone and
etoposide, at room temperature under aerobic conditions by applying the triangular wave-
form with the slope of 82 mV/sec to the WE and a fixed voltage to the RE. Cyclic voltammetry
measurements were also performed using an Autolab electrochemical workstation (Metrohm)
for comparison. The same triangular waveform slope and range were applied to the sensors.
The main oxidation peak position and its location (in voltage) for both measurements are
summarized in Table 6.2. The measured oxidation current peak location and value show less
than 7% discrepancy between our active chip and the Autolab potentiostat [299].
6.3 In-vitro measurements with the implantable device
We finally assembled the miniaturized device to test its performances for metabolites and drug
monitoring. Fig. 6.8 shows the setup used for these measurements, with the servo-controlled
remote powering system with the X-Y rails and the coil under the cage, and the receiver an-
tenna inside the cage. Fig. 6.9 (c) shows the photograph of the assembled implantable device
used for the in-vitro characterization. In this version of the implantable device, the edges of
the device were not rounded with a milling machine, and a certified biocompatible elastomer
silicone (Nusil MED 6033) was used to cover the edges and the bottom of the device. The
assembly of the components was realized as described in the previous chapter.
In order to emulate the implantation in the mouse, the implantable device is placed in a Petri
dish with a small permanent magnet, which enables the servo-controlled system to track the
implantable system inside the cage. In these experiments the magnet was not included in the
packaging of the device. For future in-vivo measurements, the magnet must be integrated
inside the device.
The servo-controlled wireless power transfer system locates the implantable system inside
the cage and moves the powering coil to activate the implantable system for a real-time
measurement. We proved that, when the implantable system is randomly moved to mimic
the movement of the animal, the servo-controlled wireless power transfer system tracks the
implantable system and efficiently transfers the power. The data stream in Fig. 6.9 (a) clearly
110
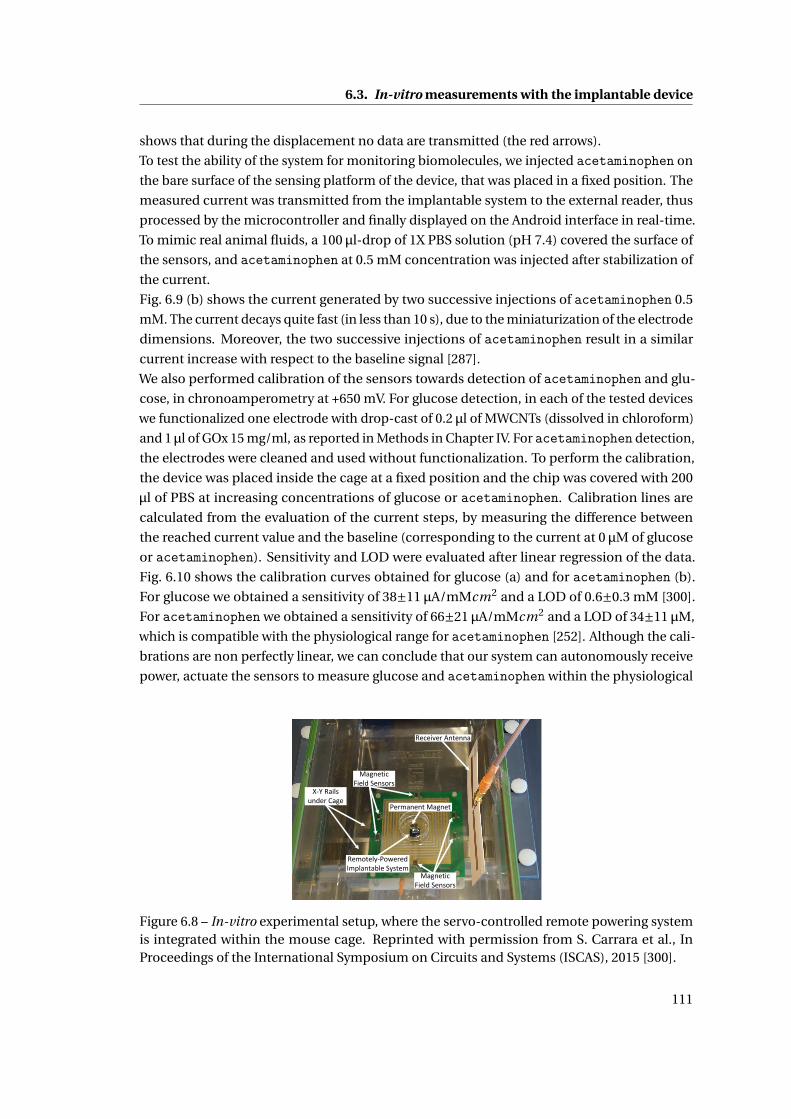
6.3. In-vitro measurements with the implantable device
shows that during the displacement no data are transmitted (the red arrows).
To test the ability of the system for monitoring biomolecules, we injected acetaminophen on
the bare surface of the sensing platform of the device, that was placed in a fixed position. The
measured current was transmitted from the implantable system to the external reader, thus
processed by the microcontroller and finally displayed on the Android interface in real-time.
To mimic real animal fluids, a 100 µl-drop of 1X PBS solution (pH 7.4) covered the surface of
the sensors, and acetaminophen at 0.5 mM concentration was injected after stabilization of
the current.
Fig. 6.9 (b) shows the current generated by two successive injections of acetaminophen 0.5
mM. The current decays quite fast (in less than 10 s), due to the miniaturization of the electrode
dimensions. Moreover, the two successive injections of acetaminophen result in a similar
current increase with respect to the baseline signal [287].
We also performed calibration of the sensors towards detection of acetaminophen and glu-
cose, in chronoamperometry at +650 mV. For glucose detection, in each of the tested devices
we functionalized one electrode with drop-cast of 0.2 µl of MWCNTs (dissolved in chloroform)
and 1 µl of GOx 15 mg/ml, as reported in Methods in Chapter IV. For acetaminophen detection,
the electrodes were cleaned and used without functionalization. To perform the calibration,
the device was placed inside the cage at a fixed position and the chip was covered with 200
µl of PBS at increasing concentrations of glucose or acetaminophen. Calibration lines are
calculated from the evaluation of the current steps, by measuring the difference between
the reached current value and the baseline (corresponding to the current at 0 µM of glucose
or acetaminophen). Sensitivity and LOD were evaluated after linear regression of the data.
Fig. 6.10 shows the calibration curves obtained for glucose (a) and for acetaminophen (b).
For glucose we obtained a sensitivity of 38±11 µA/mMcm2 and a LOD of 0.6±0.3 mM [300].
For acetaminophen we obtained a sensitivity of 66±21 µA/mMcm2 and a LOD of 34±11 µM,
which is compatible with the physiological range for acetaminophen [252]. Although the cali-
brations are non perfectly linear, we can conclude that our system can autonomously receive
power, actuate the sensors to measure glucose and acetaminophen within the physiological
Permanent Magnet
Remotely-Powered Implantable System
Magnetic Field Sensors
Magnetic Field Sensors
Receiver Antenna
X-Y Rails under Cage
Figure 6.8 – In-vitro experimental setup, where the servo-controlled remote powering systemis integrated within the mouse cage. Reprinted with permission from S. Carrara et al., InProceedings of the International Symposium on Circuits and Systems (ISCAS), 2015 [300].
111
Chapter 6. The implantable device
1 2 3 4 5 6 7 8 9 10
x 104
3700
3750
3800
3850
3900
3950
4000
4050
4100
4150
4200
Time (ms)
Sig
na
lMOVING
(a) (b)
(c)
Figure 6.9 – Data stream during chip displacement in the cage (a), reprinted with permission S.Carrara et al., In Proceedings of the International Symposium on Circuits and Systems (ISCAS),2015 [300]; real-time chronoamperometry in presence of acetaminophen 0.5 mM displayedon the tablet through the Android interface (b), reprinted with permission from E. Kilinc et al.,IEEE Sensors Journal, Submitted [287]; assembled implantable device (c).
range, read the data and transmit them to an external reader.
In order to test the ability of the powering system to resist to biological fluids after the implant,
30-days measurements were performed in PBS at room temperature. For this test we assem-
bled a device without the passive sensing-platform, as no electrochemical measurements
were needed, and we applied the external packaging only on the PBCs with the implant coil
and the second layer which houses electronic circuits and off-chip components, as described
in the previous chapter: the epoxy adhesive (EP42HT-2Med system) was used to assembly
the PCB with the antenna and the electronic component, two subsequent 5 µm layers of
Parylene C were deposited by chemical vapor deposition using a Comelec C-30-S Parylene
Deposition System, and a biocompatible Silicone (NuSil MED-6233), was used as external
cover. The implantable system was continuously immersed in the PBS solution for 30 days at
room temperature. The PBS solution is the standard buffer solution that simulates biological
fluids and that has the same pH as for the blood (pH 7.4). We monitored the stability of the
rectifier output, the regulator output voltages and the supply power of the power amplifier for
30 days. The results showed a good stability of the measured signals, thus proving that the
packaging ensures the protection to the implantable system from the corrosion created by the
biological fluids [287].
112
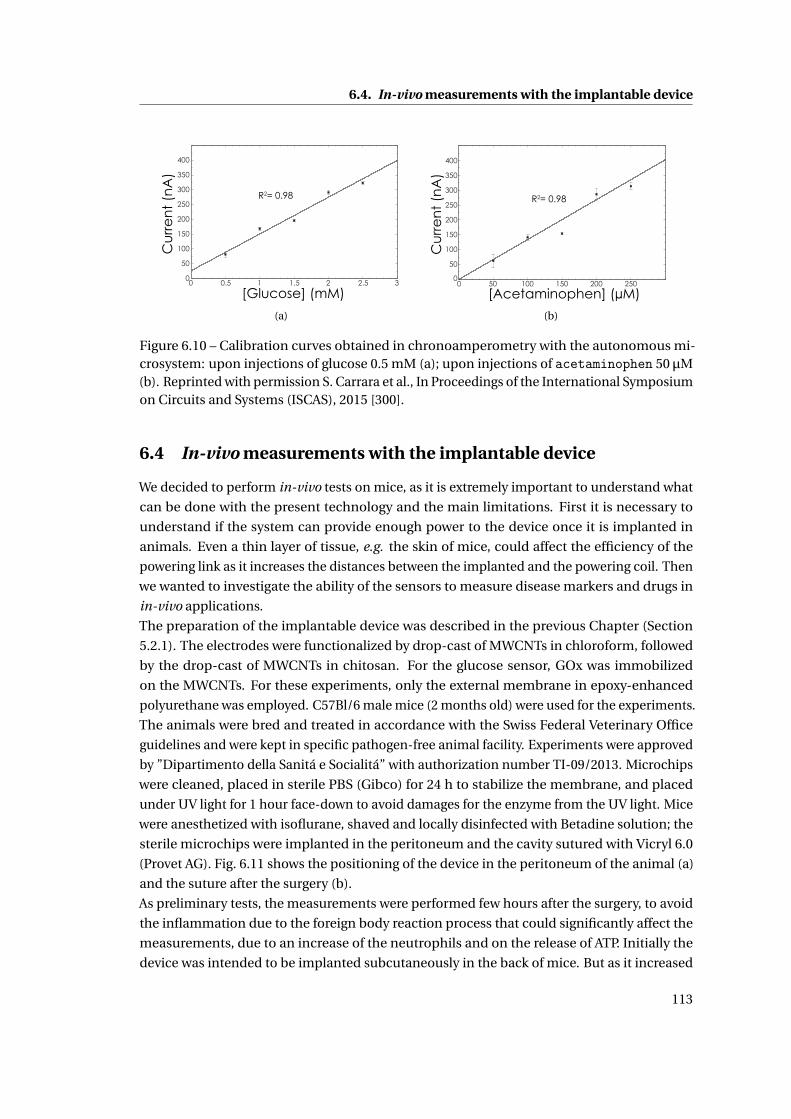
6.4. In-vivo measurements with the implantable device
0 0.5 1 1.5 2 2.5 30
50
100
150
200
250
300
350
400
[Glucose] (mM)
Cu
rre
nt
(nA
)
R2= 0.98
(a)
[Acetaminophen] (µM)
Cu
rre
nt
(nA
)
R2= 0.98
0 50 100 150 200 2500
50
100
150
200
250
300
350
400
(b)
Figure 6.10 – Calibration curves obtained in chronoamperometry with the autonomous mi-crosystem: upon injections of glucose 0.5 mM (a); upon injections of acetaminophen 50 µM(b). Reprinted with permission S. Carrara et al., In Proceedings of the International Symposiumon Circuits and Systems (ISCAS), 2015 [300].
6.4 In-vivo measurements with the implantable device
We decided to perform in-vivo tests on mice, as it is extremely important to understand what
can be done with the present technology and the main limitations. First it is necessary to
understand if the system can provide enough power to the device once it is implanted in
animals. Even a thin layer of tissue, e.g. the skin of mice, could affect the efficiency of the
powering link as it increases the distances between the implanted and the powering coil. Then
we wanted to investigate the ability of the sensors to measure disease markers and drugs in
in-vivo applications.
The preparation of the implantable device was described in the previous Chapter (Section
5.2.1). The electrodes were functionalized by drop-cast of MWCNTs in chloroform, followed
by the drop-cast of MWCNTs in chitosan. For the glucose sensor, GOx was immobilized
on the MWCNTs. For these experiments, only the external membrane in epoxy-enhanced
polyurethane was employed. C57Bl/6 male mice (2 months old) were used for the experiments.
The animals were bred and treated in accordance with the Swiss Federal Veterinary Office
guidelines and were kept in specific pathogen-free animal facility. Experiments were approved
by ”Dipartimento della Sanitá e Socialitá” with authorization number TI-09/2013. Microchips
were cleaned, placed in sterile PBS (Gibco) for 24 h to stabilize the membrane, and placed
under UV light for 1 hour face-down to avoid damages for the enzyme from the UV light. Mice
were anesthetized with isoflurane, shaved and locally disinfected with Betadine solution; the
sterile microchips were implanted in the peritoneum and the cavity sutured with Vicryl 6.0
(Provet AG). Fig. 6.11 shows the positioning of the device in the peritoneum of the animal (a)
and the suture after the surgery (b).
As preliminary tests, the measurements were performed few hours after the surgery, to avoid
the inflammation due to the foreign body reaction process that could significantly affect the
measurements, due to an increase of the neutrophils and on the release of ATP. Initially the
device was intended to be implanted subcutaneously in the back of mice. But as it increased
113
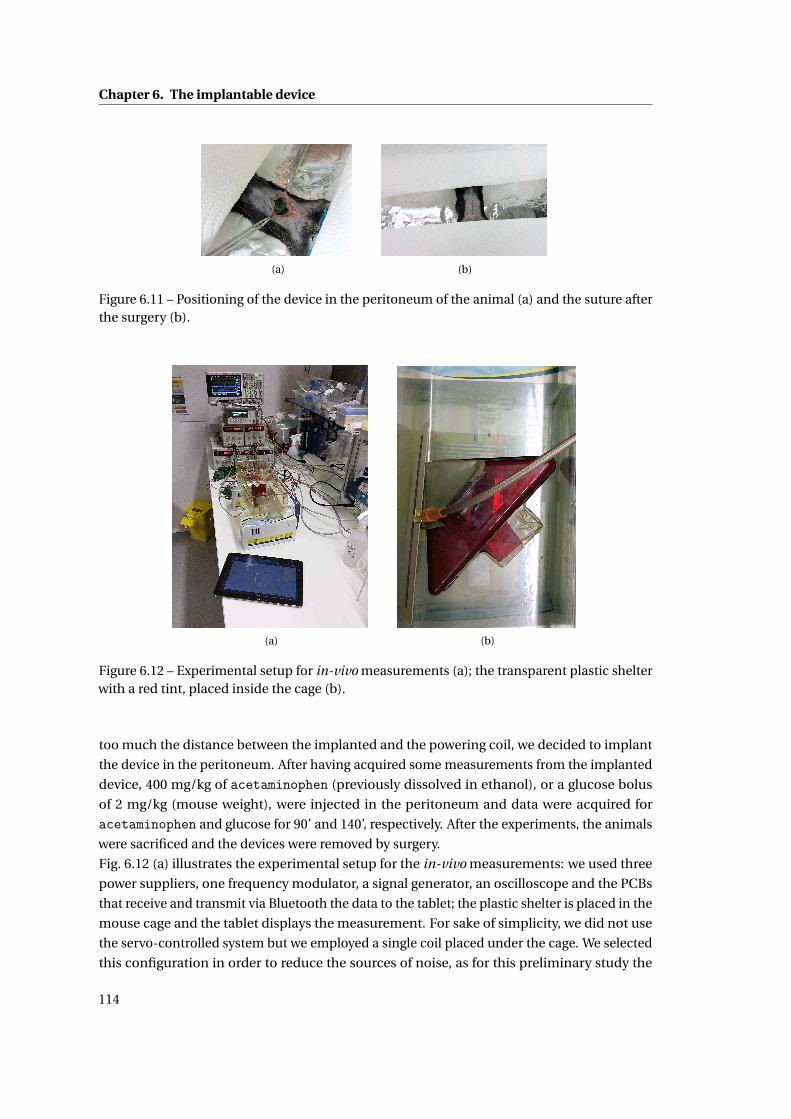
Chapter 6. The implantable device
(a) (b)
Figure 6.11 – Positioning of the device in the peritoneum of the animal (a) and the suture afterthe surgery (b).
(a) (b)
Figure 6.12 – Experimental setup for in-vivo measurements (a); the transparent plastic shelterwith a red tint, placed inside the cage (b).
too much the distance between the implanted and the powering coil, we decided to implant
the device in the peritoneum. After having acquired some measurements from the implanted
device, 400 mg/kg of acetaminophen (previously dissolved in ethanol), or a glucose bolus
of 2 mg/kg (mouse weight), were injected in the peritoneum and data were acquired for
acetaminophen and glucose for 90’ and 140’, respectively. After the experiments, the animals
were sacrificed and the devices were removed by surgery.
Fig. 6.12 (a) illustrates the experimental setup for the in-vivo measurements: we used three
power suppliers, one frequency modulator, a signal generator, an oscilloscope and the PCBs
that receive and transmit via Bluetooth the data to the tablet; the plastic shelter is placed in the
mouse cage and the tablet displays the measurement. For sake of simplicity, we did not use
the servo-controlled system but we employed a single coil placed under the cage. We selected
this configuration in order to reduce the sources of noise, as for this preliminary study the
114
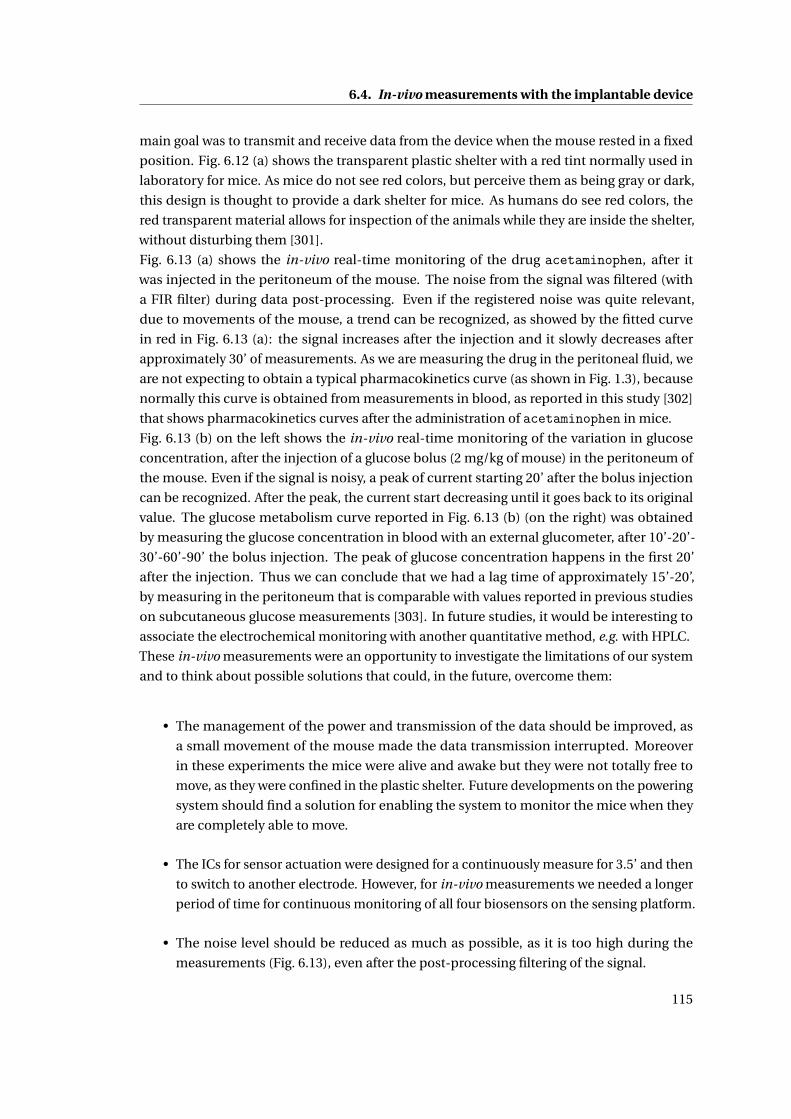
6.4. In-vivo measurements with the implantable device
main goal was to transmit and receive data from the device when the mouse rested in a fixed
position. Fig. 6.12 (a) shows the transparent plastic shelter with a red tint normally used in
laboratory for mice. As mice do not see red colors, but perceive them as being gray or dark,
this design is thought to provide a dark shelter for mice. As humans do see red colors, the
red transparent material allows for inspection of the animals while they are inside the shelter,
without disturbing them [301].
Fig. 6.13 (a) shows the in-vivo real-time monitoring of the drug acetaminophen, after it
was injected in the peritoneum of the mouse. The noise from the signal was filtered (with
a FIR filter) during data post-processing. Even if the registered noise was quite relevant,
due to movements of the mouse, a trend can be recognized, as showed by the fitted curve
in red in Fig. 6.13 (a): the signal increases after the injection and it slowly decreases after
approximately 30’ of measurements. As we are measuring the drug in the peritoneal fluid, we
are not expecting to obtain a typical pharmacokinetics curve (as shown in Fig. 1.3), because
normally this curve is obtained from measurements in blood, as reported in this study [302]
that shows pharmacokinetics curves after the administration of acetaminophen in mice.
Fig. 6.13 (b) on the left shows the in-vivo real-time monitoring of the variation in glucose
concentration, after the injection of a glucose bolus (2 mg/kg of mouse) in the peritoneum of
the mouse. Even if the signal is noisy, a peak of current starting 20’ after the bolus injection
can be recognized. After the peak, the current start decreasing until it goes back to its original
value. The glucose metabolism curve reported in Fig. 6.13 (b) (on the right) was obtained
by measuring the glucose concentration in blood with an external glucometer, after 10’-20’-
30’-60’-90’ the bolus injection. The peak of glucose concentration happens in the first 20’
after the injection. Thus we can conclude that we had a lag time of approximately 15’-20’,
by measuring in the peritoneum that is comparable with values reported in previous studies
on subcutaneous glucose measurements [303]. In future studies, it would be interesting to
associate the electrochemical monitoring with another quantitative method, e.g. with HPLC.
These in-vivo measurements were an opportunity to investigate the limitations of our system
and to think about possible solutions that could, in the future, overcome them:
• The management of the power and transmission of the data should be improved, as
a small movement of the mouse made the data transmission interrupted. Moreover
in these experiments the mice were alive and awake but they were not totally free to
move, as they were confined in the plastic shelter. Future developments on the powering
system should find a solution for enabling the system to monitor the mice when they
are completely able to move.
• The ICs for sensor actuation were designed for a continuously measure for 3.5’ and then
to switch to another electrode. However, for in-vivo measurements we needed a longer
period of time for continuous monitoring of all four biosensors on the sensing platform.
• The noise level should be reduced as much as possible, as it is too high during the
measurements (Fig. 6.13), even after the post-processing filtering of the signal.
115
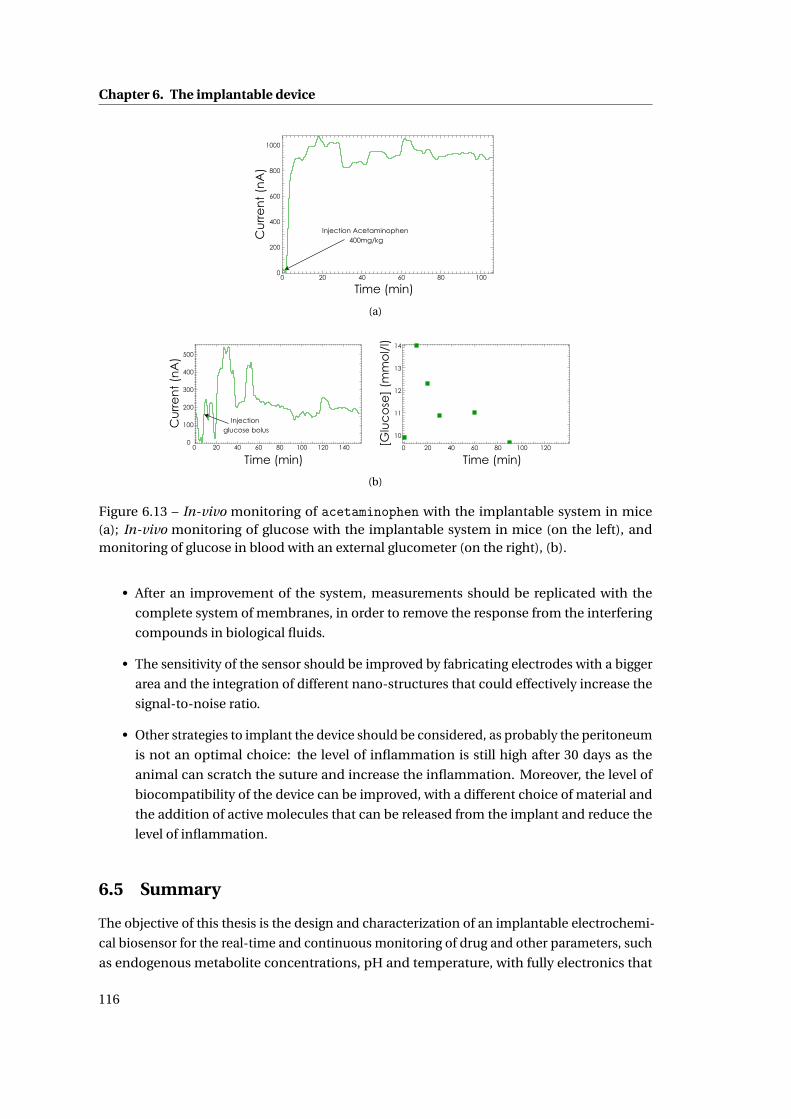
Chapter 6. The implantable device
Cu
rre
nt
(nA
)
Time (min)
Injection Acetaminophen 400mg/kg
1000
800
600
400
200
0100806040200
(a)
Cu
rre
nt
(nA
)
Time (min)
Injection glucose bolus
500
400
300
200
100
0140120100806040200
14
13
12
11
10
[Glu
co
se]
(mm
ol/
l)
120100806040200
Time (min)
(b)
Figure 6.13 – In-vivo monitoring of acetaminophen with the implantable system in mice(a); In-vivo monitoring of glucose with the implantable system in mice (on the left), andmonitoring of glucose in blood with an external glucometer (on the right), (b).
• After an improvement of the system, measurements should be replicated with the
complete system of membranes, in order to remove the response from the interfering
compounds in biological fluids.
• The sensitivity of the sensor should be improved by fabricating electrodes with a bigger
area and the integration of different nano-structures that could effectively increase the
signal-to-noise ratio.
• Other strategies to implant the device should be considered, as probably the peritoneum
is not an optimal choice: the level of inflammation is still high after 30 days as the
animal can scratch the suture and increase the inflammation. Moreover, the level of
biocompatibility of the device can be improved, with a different choice of material and
the addition of active molecules that can be released from the implant and reduce the
level of inflammation.
6.5 Summary
The objective of this thesis is the design and characterization of an implantable electrochemi-
cal biosensor for the real-time and continuous monitoring of drug and other parameters, such
as endogenous metabolite concentrations, pH and temperature, with fully electronics that
116
6.5. Summary
could actuate the device, collect the data and transmit the data to an external user. The final
goal is to implant the system in mice that are used in research on animals.
The living conditions of these animals are of primary importance because the stress level
can affect the measurement results. This means that the animal must be in a comfortable
environment and capable to freely move. Therefore, the final aim of this project is to monitor
the animal in a living space, such as a cage, in order to minimize the human intervention. In
this chapter we integrated the sensing platform, ICs and the powering system into a working
system. The powering system was designed4 in a good balance between the need of a small
implant and the need to achieve an efficient power transfer to the implanted system that is
placed in a small animal. The readout electronics were realized with ICs that can be easily
miniaturized. ICs were designed5 to control and readout the sensors in both chronoamperom-
etry and cyclic voltammetry, with low power consumption. We showed that the system can be
autonomously powered, can effectively actuate the sensors that are located on the sensing
platform and can transmit the data to an external device, like a tablet, and displaying the
measurement in real-time6. My personal contribution to the experimental part reported in
this chapter was: the realization of the sensing platform, the integration of the platform with
the electronics and the coil into the implantable device, the realization of the biocompatible
packaging, the electrochemical measurements, post-processing of the data and statistics.
With the miniaturized device, we showed in-vitro measurements and calibration of glucose
and acetaminophen in the physiological ranges. At the end of the Chapter we showed some
promising in-vivo experiments in mice7, which demonstrated that our system can monitor in
real-time the metabolism of drugs (e.g. acetaminophen) and of endogenous metabolites (e.g.
glucose) in the peritoneal fluid. These results represent a starting point for future improve-
ments.
4by Enver Kilinc, Radio Frequency Integrated Circuit Group, EPFL.5by Sara Ghoreishizadeh, Integrated System Laboratory, EPFL.6thanks to the work of Stefano Riario and Francesca Stradolini, Integrated System Laboratory, EPFL.7in-vivo experiments were run in the Institute for Research in Biomedicine in Bellinzona, by Tanja Rezzonico-
Jost and Fabio Grassi.
117

7 Conclusions
The objective of this thesis was the design and characterization of an implantable electrochem-
ical biosensor for the real-time and continuous monitoring of drug and other parameters, such
as endogenous metabolite concentrations, pH and temperature, with autonomous electronics
that can actuate the device, collect the data and transmit the data to an external user. The
implantable device was intended to be implanted in mice used in research on animals, and
to monitor the animal in a living space in order to minimize the human intervention. The
device must be battery-free, autonomous in terms of power supply and readout electronics,
biocompatible, stable for long-term measurements, capable of monitoring multiple molecules,
and of generating a signal with a high signal-to-noise ratio.
With respect to the current state-of-the-art, that was presented in the first two Chapters, this
thesis presents innovative and advanced contributions on:
• Multiple drug detection. Selective detection of drugs and drug pairs has been achieved
with different strategies, which combined the electrode functionalization with nanoma-
terials and enzymes. Non-electroactive drugs were monitored with biosensors based on
MWCNTs and microsomal cytochrome P450 (P450) enzymes. As the present state-of-the-
art on P450 electrochemistry is not focused on the development of P450-biosensors as a
diagnostic tool, the results presented in this thesis represent a significant step forward
with respect to the state-of-the-art. We proved that MWCNTs significantly improve
sensor sensitivity and detection limit, as they provide a larger area, more favorable for
the P450 adsorption. With MWCNT-nanostructured electrodes we performed detection
of several drugs in their therapeutic range, and in complex solutions like human or
animal serum. With an investigation on the stability of the P450-biosensor in long-term
measurements, we proved that the enzyme is active and stable for 16 h, and that it can be
employed for the continuous monitoring of a drug. The 16-h limit for enzyme stability
is long enough for the study of the pharmacokinetics for many drugs, thus showing the
potential of the presented method as a valid alternative in therapeutic drug monitoring
practice.
• Monitoring of multiple parameters. The electrochemical platform was designed to host
119
Chapter 7. Conclusions
four independent biosensors, for the monitoring of drugs and endogenous metabolites,
a pH sensor, and a temperature sensor. The sensing platform was designed and realized
considering biocompatibility, performances and the constraints given by the integration
with the electronics and by the final application. Carbon-nanotubes are integrated
on working electrodes to improve the sensitivity and the chitosan is employed to en-
trap them on the electrode surface, providing a biocompatible coating. With various
functionalization of the working electrodes, we performed calibration of glucose and
lactate, and of different drugs: acetaminophen, etoposide, and mitoxantrone. Cali-
bration of a pH sensor based on the Iridium oxide film technology and the calibration
of the temperature sensor were also presented. The design of a sensing platform for
electrochemical measurement, combined with the presence of a pH and a temperature
sensor, is a strategy to optimize the sensing performance in different physiological
conditions, since changes in pH and temperature can affect the sensor specificity, and it
still represents a complete novelty.
• Innovative system of membranes, nano-materials and enzyme. In this thesis we investi-
gated the complex integration of micro-fabricated sensors, namomaterials, enzymes, a
system of membranes and an external packaging, to ensure at the same time measure-
ments with high signal-to-noise ratio, biocompatibility and selectivity against possible
interfering molecules in biological fluids. We presented a complete in-vitro charac-
terization of a system of membranes that consist of: an ”inner” permselective layer,
designed to filter the signal generated by the oxidation of interfering substances present
in biological fluids, such as ascorbic acid and uric acid; an ”outer” layer made by an
epoxy-enhanced polyurethane film, that regulates the passage of glucose and oxygen to
the electrode surface and provides a biocompatible layer for a correct integration with
the surrounding tissue. This system of membrane was employed in a glucose sensor and
it successfully monitored glucose in both the human and mice physiological range, in
normal buffer solution and in human serum at 37°C. The sensor showed good stability
for 30 days at room temperature, and the permselective membrane effectively filtered
out ascorbic acid and uric acid. Moreover, with the same system of membrane we
developed a biosensor for the detection of the anti-inflammatory drug acetaminophen.
• System design, fabrication, characterization, integration, biocompatibility and in-vivo
tests. The present research was focused on the complete design and fabrication of the
sensing platform and its integration with a customized electronics and an intelligent
powering system for the real-time monitoring of molecules in small animals. In the
final chapter we showed the integration of the different components and an in-vitro
characterization of a working prototype. The external packaging was tested to assess
the in-vivo biocompatibility by implanting the device in mice for 30 days. The tests
proved that the material used for the fabrication of the device and the external packaging
generated an inflammation level comparable to a commercial implantable chip, thus
proving that the device, after 30 days, is well tolerated by the host. We showed that
the system can be autonomously powered, can effectively actuate the sensors that are
120
located on the sensing platform and can transmit the data to an external device, like
a tablet, and showing in real-time the measurement. With the miniaturized device
we showed in-vitro measurements and calibration of glucose and acetaminophen in
the physiological ranges. Finally, we presented some promising preliminary in-vivo
experiments in mice that proved that our system can follow in real-time the metabolism
of glucose and of the drug acetaminophen after its administration in the peritoneal
fluid.
The results achieved in this thesis are promising, but they can be further improved by ad-
ditional research. For instance, a more detailed investigation on the P450 electrochemistry
could offer new insights on the P450 behavior, that can be used to optimize the P450 immo-
bilization to achieve improved sensing performances and enzyme stability. Recent studies
[127, 128] revealed that a non-controlled P450 immobilization on the electrode may induce
conformational changes in the P450 proteins that result in the formation of its inactive form,
the cytochrome P420. Moreover, even in the absence of any substrate, the P450 active site may
go though abortive reactions or ”shunts” that lead the production of intermediary products,
e.g hydrogen peroxide, which can generate misleading signals.
After the fabrication of a sensing platform we investigated the immobilization of msP450s
and MWCNTs. While for MWCNTs we found some solutions, as presented in Chapter 4,
for the immobilization of msP450 we faced some limitations. We increased five times the
concentration of the P450s in the microsomes: the msP450 solution was centrifuged until
separation of the protein component from the solvent; the protein component was extracted;
the protein components from 5 aliquots were merged in one solution. After the electrode
functionalization with MWCNTs, three layers of msP450 were adsorbed on the surface of
the electrode, according to the procedure previously explained in Section 3.1.1. With cyclic
voltammetry, we could identify the reduction peaks of msP450, however we registered high
instabilities in current, for all reduction peaks. The peak current level was not stable between
sequential cycles. And this current variation was in the same order of magnitude of the current
variation due to the addition of drug in the solution, thus making impossible to detect the
presence of drugs. The main reasons of these instabilities are the low concentration of the
P450 component in the microsomes, and the small size of the electrodes, which reduces the
current levels. Small electrodes are necessary for the platform miniaturization. Moreover, a
further increase in the P450 concentration with the centrifuge method, would have make the
approach not convenient in terms of costs.
Nevertheless, we can envisage solutions that could be investigated in future projects, i.e. the
use of a recombinant P450 with additional domains that could improve P450 functionalities,
or the use of a more concentrated microsomal P450. Moreover, an additional extensive study
of P450 electrochemistry, which is out-of-topic for the present work, could offer new insights
on P450 behavior to optimize the P450 immobilization for improved sensing performances. In
case of multiple drug detection with P450 enzymes, a detailed study on the atypical kinetics of
P450s should be associated with the electrochemical behavior of P450 in presence of two or
more drug compounds. Furthermore, the long-term stability study presented in Chapter III
121
Chapter 7. Conclusions
indicates that, at the current stage, our P450-biosensor can be exploited as a disposable sensor,
but not for long-term implantable applications. Thus, new strategies based on nano-particles,
to improve the P450 stability, are currently under investigation in our group for long-term
applications.
The sensing platform may be employed for measurements of several molecules in parallel:
with an appropriate instruments will be interesting to monitor e.g. the glucose and lactate
variation in a cell medium and to simultaneously monitor the changes in pH and temperature.
Another interesting application is the simultaneous monitoring of different drugs in a blood
sample. Strategies as a microfluidic device, in combination with membranes, can be envis-
ages to reduce or even eliminate the problem of interferences in case of multiple molecules
detection with the same sensing platform.
The pH sensor based on the deposition of the Iridium oxide film should be improved in terms
of stability of the measured potential, with the employment of a miniaturized external or an
integrated stable reference electrode, and with a study over the stability of the Iridium oxide
film.
Concerning the biocompatibility issues, the external packaging and the system of membranes
must be further tested to check if they promote an adequate vascularization around the im-
plant to enable the diffusion of the analyte to the sensors, and if they reduce the formation
of the fibrotic capsule, caused by the foreign body reaction process. Many strategies can
be investigated to ensure a long term biocompatibility: the dimension of the device can be
reduced; innovative materials, e.g organic an polymers, can be used instead of Silicon or other
metals, for the fabrication of the sensing platform but also of the electronics; the release of
active molecules (e.g anti-inflammatory drugs or factors that stimulate the angiogenesis), can
be associated with the use of biocompatible membranes to enhance the integration of the
implanted device with the host tissue. Moreover, according to the ISO10993 standards, before
the final device can be declared safe for implantation, several additional tests are required, e.g.
hemocompatibility, sensitization and systemic toxicity analysis, or multiple cytotoxicity tests.
We finally showed the integration of the sensing platform in an autonomous implantable de-
vice with customized electronics and powering system, and in-vitro and in-vivo experiments.
The device was able to transmit power, actuate the sensor and receive data once the device was
implanted in a mouse that was awake but confined in a small space to reduce its movements.
The electronic part can be also improved both at hardware and software levels, in order to
increase the signal-to-noise ratio and to enable the monitoring for long-time of the mouse
that is free to move in the cage. Moreover, the design of more complex integrated circuits
should be implemented, for the real-time monitoring of other molecules and parameter in
parallel.
This thesis demonstrated that with a close collaboration among researchers with different
competencies and the optimization of each single part respect to the others, we succeeded
in realizing a first working prototype, which represents a significant step forward the present
state-of-the-art and a rich source of information for future improvements.
122
A Appendix: Methods for analysis ofcalibration curves
The final aim of a biosensor is to detect the analyte of interest in a sample with an unknown
concentration. Before that, it is necessary to calibrate the sensor: measure the sensor response
(in most of the cases a current), at increasing analyte concentrations; build a calibration curve,
i.e. the plot sensor response vs. analyte concentration; measure the sensor response for the
unknown sample; estimate the sample concentration from the calibration curve. Therefore,
the calibration curve is the principal result of the biosensor characterization and optimization.
The biosensor performance is usually experimentally evaluated based on its sensitivity, limit
of detection (LOD), linear range, precision of the response, selectivity and its response to
interferences. The two main parameter used to evaluate the quality of a calibration curve are
the sensitivity and the limit of detection (LOD). The sensitivity is the slope of the calibration
curve, while the LOD can be generally defined as the lowest concentration that can be detected.
This section reports the summary of the methods used in this thesis to carry out statistical
analysis on data to obtain the calibration functions, evaluate them and report the main
important parameters. The following citations refer to the literature used as reference for this
section: [304, 305, 306, 307].
A.1 Experiment planning
The minimum number of calibration standards was fixed to 5. The concentration of each
of the calibration standard was chosen in order to make the calibration matches with the
physiological range of the analyte of interest, thus to obtain a value of LOD equal or smaller
that the lower limit of the physiological range. Each calibration was repeated at least three
times, by measuring one replicate at each concentration.
A.2 Regression analysis
After the plot of the sensor response vs. analyte concentration, the linear regression was
computed. The aim of the linear regression is to establish the equation that best describes
123
Appendix A. Appendix: Methods for analysis of calibration curves
the linear relationship between instrument response y and analyte concentration x. The
relationship is described by the equation of the line, i.e., y = mx + c, where m is the slope
of the line and c is its intercept with the y-axis. The ”least squares regression” was used as
regression method, to find the line that gives the smallest sum of the squared residuals and
that best represents the linear relationship between the x and y variables.
The main assumption made for the linear regression analysis were: the error in the x values
was considered insignificant compared with that of the y values; the error associated with
the y values is normally distributed; since the magnitude of the error in the y values is not
always constant across the range of interest, a weighted regression, which takes account of the
variability in the y values, was used.
A.3 Evaluate the regression analysis
Regression statistics and analysis of variance (ANOVA) statistics were computed for a confi-
dence interval of 95%. To define the best linear range for that particular sensor, the following
criteria were used: a correlation coefficient square (R2) possibly bigger than 0.99, a large value
of the sum of squares terms (SS in the ANOVA table) for the regression compared to the residu-
als; a large F value and small p-value (smaller than 0.05).
The regression coefficient table was used to obtain the value for the sensitivity (the slope)
and its error. The error on the sensitivity was calculated as the difference between the upper
confidence limit (95%) associated to the value of the slope, and the nominal value of the
sensitivity. The error can be also calculated from the t-statistic for n–2 degrees of freedom,
as e = t sm , where t is the 2-tailed Student’s value for n-2 degrees of freedom (where n is the
number of calibration points), and sm is the standard error for the slope.
A.4 Calculate the LOD
A very general definition of LOD is the ”smallest signal that can be distinguished from the
background noise associated with the instrumental measurement”. Formally, the Limit-of-
Detection is defined as the concentration of analyte required to give a signal equal to the
background (blank) plus three times the standard deviation of the blank. The limit of detection
in terms of current (yLOD ), was calculated as the minimum detectable signal, from the IUPAC
definition:
yLOD = yB +k ·σB (A.1)
where yB is the mean value of replicates of blank measurements, σB is the standard deviation
of the blank signal (that can be substituted with the residual standard error), and k = 3 ensures,
with a confidence level of 99.86%, that the LOD signal is equal or bigger than the background
(blank) plus three times the standard deviation of the blank signal. In case of background-
subtracted data (corrected by the same blank value), the standard deviation (or the standard
124
A.5. Reproducibility or precision of the response
error) should be corrected by multiplying for a factor (√
1n + 1
nB) that depends on the number
of replicate observations (n) and the number of blank measurements (nB ). The LOD in terms
of concentration is then calculated from the equation of the regression line (y = mx +q). In
case of background subtraction and when the value of the intercept (q) does not significantly
differ from the mean blank value (yB ), the LOD can be calculated with the equation:
LOD = k · σB
m(A.2)
where m is the slope of the regression line (the sensitivity).
To evaluate the error associated with the LOD, we consider the LOD as a derived measurement,
as shown in equation A.2. Therefore, its relative error is obtained as the sum of the relative
error on the blank signal and the relative error on the slope:
εLOD = εyB +εm (A.3)
A.5 Reproducibility or precision of the response
In some studies the repeatability of the biosensing process was evaluated by measuring the
responses of freshly prepared biosensor to a fix analyte concentration within the first 6 h of
preparation at 1 h time interval, or, in alternative, by comparing three consecutive calibrations
curve. e.i. by comparing the sensitivities. In some other studies the storage stability of the
biosensor was investigated by measuring the sensor response to a fix analyte concentration
after 12 h, 24 h, 2 days, 4 days and 1 week or storage. In other studies the long-term stability of
the sensors was evaluated, by calibrating the sensor at a certain time interval up to 30 or 50
days. In all these cases, a relative standard deviation (R.S.D.) value (in %) was calculated.
A.6 Selectivity and its response to interferences
For the investigation of the permselective membrane against interfering compounds, the
sensor response was measured in the presence of the interferences (e.g. uric acid or ascorbic
acid) and this value was expressed as a percentage of the sensor response to the analyte
concentration (e.g. glucose).
125

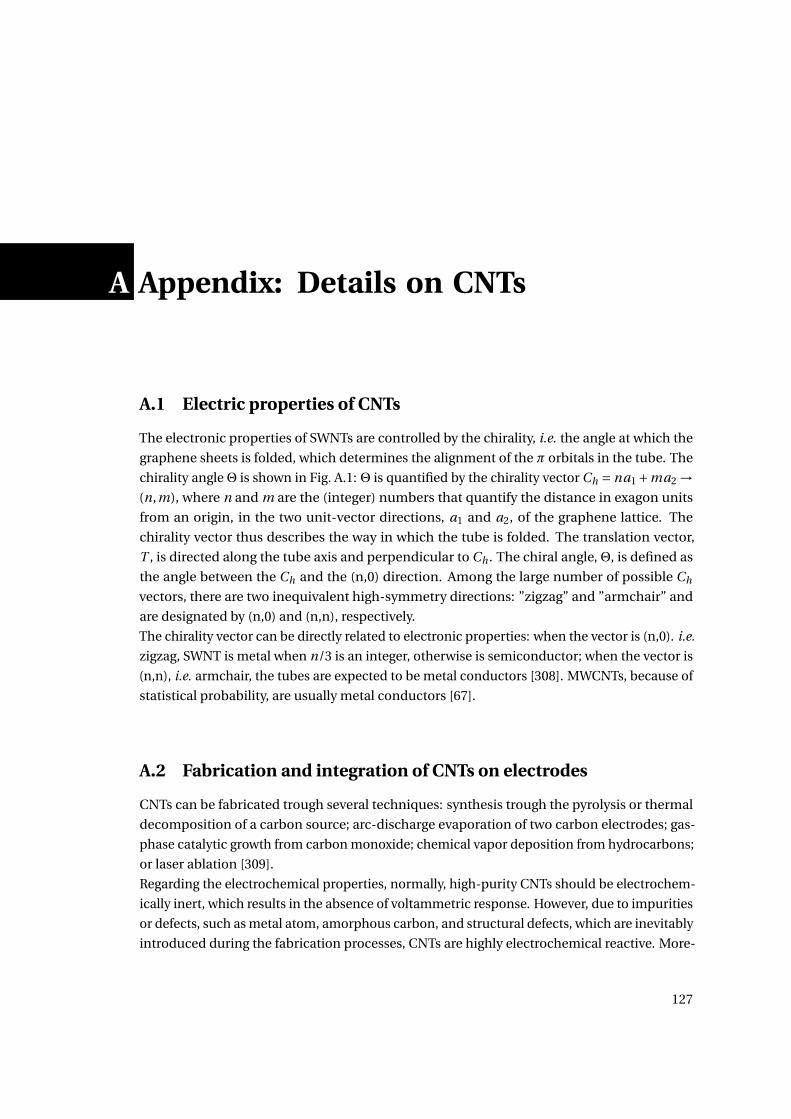
A Appendix: Details on CNTs
A.1 Electric properties of CNTs
The electronic properties of SWNTs are controlled by the chirality, i.e. the angle at which the
graphene sheets is folded, which determines the alignment of the π orbitals in the tube. The
chirality angleΘ is shown in Fig. A.1: Θ is quantified by the chirality vector Ch = na1 +ma2 →(n,m), where n and m are the (integer) numbers that quantify the distance in exagon units
from an origin, in the two unit-vector directions, a1 and a2, of the graphene lattice. The
chirality vector thus describes the way in which the tube is folded. The translation vector,
T , is directed along the tube axis and perpendicular to Ch . The chiral angle,Θ, is defined as
the angle between the Ch and the (n,0) direction. Among the large number of possible Ch
vectors, there are two inequivalent high-symmetry directions: ”zigzag” and ”armchair” and
are designated by (n,0) and (n,n), respectively.
The chirality vector can be directly related to electronic properties: when the vector is (n,0). i.e.
zigzag, SWNT is metal when n/3 is an integer, otherwise is semiconductor; when the vector is
(n,n), i.e. armchair, the tubes are expected to be metal conductors [308]. MWCNTs, because of
statistical probability, are usually metal conductors [67].
A.2 Fabrication and integration of CNTs on electrodes
CNTs can be fabricated trough several techniques: synthesis trough the pyrolysis or thermal
decomposition of a carbon source; arc-discharge evaporation of two carbon electrodes; gas-
phase catalytic growth from carbon monoxide; chemical vapor deposition from hydrocarbons;
or laser ablation [309].
Regarding the electrochemical properties, normally, high-purity CNTs should be electrochem-
ically inert, which results in the absence of voltammetric response. However, due to impurities
or defects, such as metal atom, amorphous carbon, and structural defects, which are inevitably
introduced during the fabrication processes, CNTs are highly electrochemical reactive. More-
127
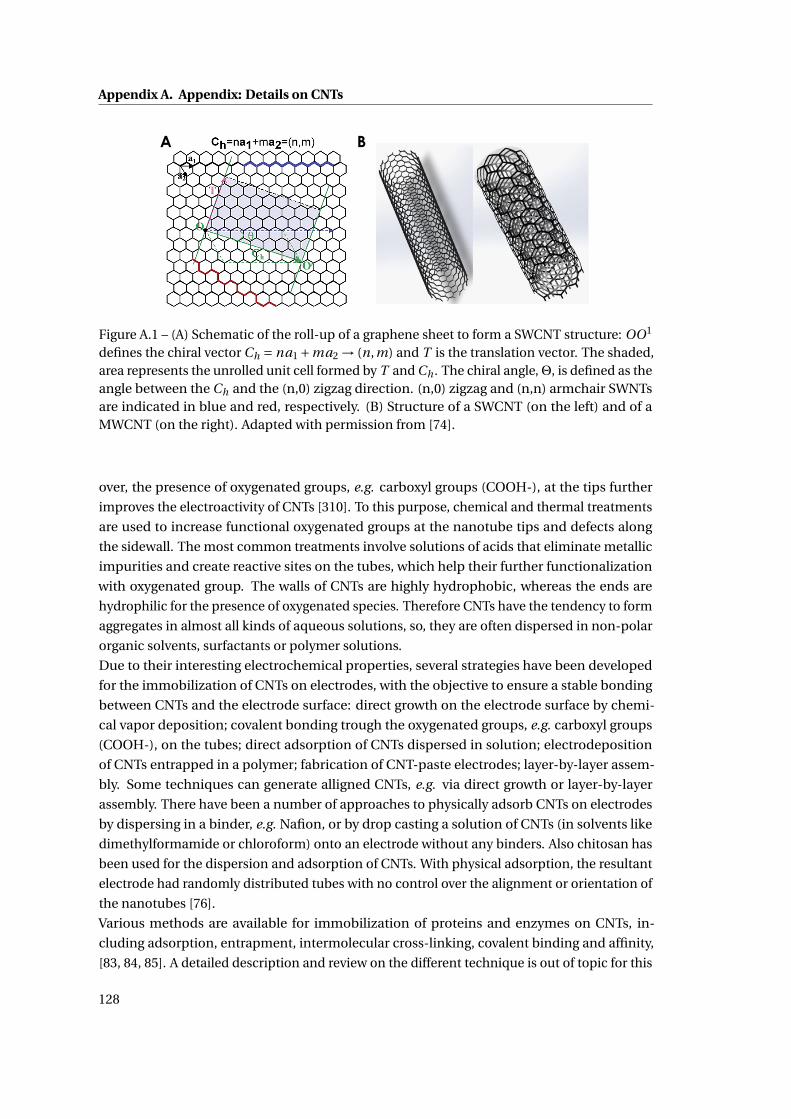
Appendix A. Appendix: Details on CNTs
A B
Figure A.1 – (A) Schematic of the roll-up of a graphene sheet to form a SWCNT structure: OO1
defines the chiral vector Ch = na1 +ma2 → (n,m) and T is the translation vector. The shaded,area represents the unrolled unit cell formed by T and Ch . The chiral angle,Θ, is defined as theangle between the Ch and the (n,0) zigzag direction. (n,0) zigzag and (n,n) armchair SWNTsare indicated in blue and red, respectively. (B) Structure of a SWCNT (on the left) and of aMWCNT (on the right). Adapted with permission from [74].
over, the presence of oxygenated groups, e.g. carboxyl groups (COOH-), at the tips further
improves the electroactivity of CNTs [310]. To this purpose, chemical and thermal treatments
are used to increase functional oxygenated groups at the nanotube tips and defects along
the sidewall. The most common treatments involve solutions of acids that eliminate metallic
impurities and create reactive sites on the tubes, which help their further functionalization
with oxygenated group. The walls of CNTs are highly hydrophobic, whereas the ends are
hydrophilic for the presence of oxygenated species. Therefore CNTs have the tendency to form
aggregates in almost all kinds of aqueous solutions, so, they are often dispersed in non-polar
organic solvents, surfactants or polymer solutions.
Due to their interesting electrochemical properties, several strategies have been developed
for the immobilization of CNTs on electrodes, with the objective to ensure a stable bonding
between CNTs and the electrode surface: direct growth on the electrode surface by chemi-
cal vapor deposition; covalent bonding trough the oxygenated groups, e.g. carboxyl groups
(COOH-), on the tubes; direct adsorption of CNTs dispersed in solution; electrodeposition
of CNTs entrapped in a polymer; fabrication of CNT-paste electrodes; layer-by-layer assem-
bly. Some techniques can generate alligned CNTs, e.g. via direct growth or layer-by-layer
assembly. There have been a number of approaches to physically adsorb CNTs on electrodes
by dispersing in a binder, e.g. Nafion, or by drop casting a solution of CNTs (in solvents like
dimethylformamide or chloroform) onto an electrode without any binders. Also chitosan has
been used for the dispersion and adsorption of CNTs. With physical adsorption, the resultant
electrode had randomly distributed tubes with no control over the alignment or orientation of
the nanotubes [76].
Various methods are available for immobilization of proteins and enzymes on CNTs, in-
cluding adsorption, entrapment, intermolecular cross-linking, covalent binding and affinity,
[83, 84, 85]. A detailed description and review on the different technique is out of topic for this
128
A.2. Fabrication and integration of CNTs on electrodes
work, but we recently reviewed the main techniques for enzyme immobilization for biosensors
in this review paper [66].
129

Bibliography
[1] Guillermo Gervasini, Julio Benítez, and Juan Antonio Carrillo. Pharmacogenetic testing
and therapeutic drug monitoring are complementary tools for optimal individualization
of drug therapy. European journal of clinical pharmacology, 66(8):755–774, 2010.
[2] Magnus Ingelman-Sundberg. Human drug metabolising cytochrome p450 enzymes:
properties and polymorphisms. Naunyn-Schmiedeberg’s archives of pharmacology,
369(1):89–104, 2004.
[3] Paving the way for personalized medicine. Technical report, U.S. Department of Health
and Human Services, U.S. Food and Drug Administration, October, 2013.
[4] Wolfgang Sadee and Zunyan Dai. Pharmacogenetics/genomics and personalized
medicine. Human Molecular Genetics, 14(suppl 2):R207–R214, 2005.
[5] Brian B Spear, Margo Heath-Chiozzi, and Jeffrey Huff. Clinical application of pharmaco-
genetics. Trends in Molecular Medicine, 7(5):201–204, 5 2001.
[6] Agency for Healthcare Research and MD. Quality, Rockville. Reducing and preventing
adverse drug events to decrease hospital costs: Research in action, issue 1. march 2001.
http://www.ahrq.gov/research/findings/factsheets/errors-safety/aderia/index.html.
[7] Balthasar L Hug, Carol Keohane, Diane L Seger, Catherine Yoon, and David W Bates.
The costs of adverse drug events in community hospitals. Joint Commission Journal on
Quality and Patient Safety, 38(3):120–126, 2012.
[8] M. Anne Smith Bruce C. Carleton. Drug safety: Side effects and mistakes or adverse re-
actions and deadly errors? British Columbia Medical Journal, 48(7):329–333, September
2006.
[9] Daniel W. Nebert and Elliot S. Vesell. Can personalized drug therapy be achieved? a
closer look at pharmaco-metabonomics. Trends in Pharmacological Sciences, 27(11):580–
586, 11 2006.
[10] Jennifer L Fackler and Amy L McGuire. Paving the way to personalized genomic
medicine: steps to successful implementation. Current pharmacogenomics and person-
alized medicine, 7(2):125, 2009.
131
Bibliography
[11] Tufts Center for the Study of Drug Development (2010). Tufts csdd impact report, 12(6).
[12] Mara G Aspinall and Richard G Hamermesh. Realizing the promise of personalized
medicine. Harvard business review, 85(10):108, 2007.
[13] Stephen Naylor and Toby Cole. Overview of companion diagnostics in the pharmaceuti-
cal industry. Drug Discovery World, 11:67–79, 2010.
[14] Malorye Allison. Is personalized medicine finally arriving? Nat Biotech, 26(5):509–517,
05 2008.
[15] Jose de Leon, Margaret T Susce, and Elaina Murray-Carmichael. The amplichip™cyp450
genotyping test. Molecular diagnosis & therapy, 10(3):135–151, 2006.
[16] U.S. Food and Drug Administration. Table of pharmacogenomic biomarkers in drug
labeling.
[17] U.S. Food and Drug Administration. List of cleared or approved companion diagnostic
devices (in vitro and imaging tools).
[18] R. Shimazawa and M. Ikeda. Approval gap of pharmacogenomic biomarkers and in
vitro companion diagnostics between the united states and japan. Journal of Clinical
Pharmacy and Therapeutics, 39(2):210–214, 2014.
[19] Daniel W Nebert and David W Russell. Clinical importance of the cytochromes p450.
The Lancet, 360(9340):1155–1162, 2002.
[20] Zhengwen Jiang, Nadine Dragin, Lucia F Jorge-Nebert, Martha V Martin, F Peter Guen-
gerich, Eleni Aklillu, Magnus Ingelman-Sundberg, George J Hammons, Beverly D Lyn-
Cook, and Fred F Kadlubar. Search for an association between the human cyp1a2
genotype and cyp1a2 metabolic phenotype. Pharmacogenetics and genomics, 16(5):359–
367, 2006.
[21] Royston Goodacre. Metabolomics–the way forward. Metabolomics, 1(1):1–2, 2005.
[22] K R Crews, J K Hicks, C-H Pui, M V Relling, and W E Evans. Pharmacogenomics and indi-
vidualized medicine: Translating science into practice. Clin Pharmacol Ther, 92(4):467–
475, 10 2012.
[23] S. Clancy. (2008) dna transcription. nature education 1(1):41.
[24] Qiang Tian, Nathan D Price, and Leroy Hood. Systems cancer medicine: towards
realization of predictive, preventive, personalized and participatory (p4) medicine.
Journal of internal medicine, 271(2):111–121, 2012.
[25] Wim Verhaegh, Henk van Ooijen, Márcia A Inda, Pantelis Hatzis, Rogier Versteeg, Marcel
Smid, John Martens, John Foekens, Paul van de Wiel, and Hans Clevers. Selection
of personalized patient therapy through the use of knowledge-based computational
132
Bibliography
models that identify tumor-driving signal transduction pathways. Cancer research,
74(11):2936–2945, 2014.
[26] J-m Lee and EC Kohn. Proteomics as a guiding tool for more effective personalized
therapy. Annals of Oncology, 21(suppl 7):vii205–vii210, 2010.
[27] Donal J Brennan, Darran P O’Connor, Elton Rexhepaj, Fredrik Ponten, and William M
Gallagher. Antibody-based proteomics: fast-tracking molecular diagnostics in oncology.
Nature Reviews Cancer, 10(9):605–617, 2010.
[28] Giuseppe Corona, Flavio Rizzolio, Antonio Giordano, and Giuseppe Toffoli. Pharmaco-
metabolomics: An emerging ”omics”tool for the personalization of anticancer treat-
ments and identification of new valuable therapeutic targets. Journal of cellular physiol-
ogy, 227(7):2827–2831, 2012.
[29] Svante Wold. Chemometrics; what do we mean with it, and what do we want from it?
Chemometrics and Intelligent Laboratory Systems, 30(1):109–115, 1995.
[30] T Andrew Clayton, David Baker, John C Lindon, Jeremy R Everett, and Jeremy K Nichol-
son. Pharmacometabonomic identification of a significant host-microbiome metabolic
interaction affecting human drug metabolism. Proceedings of the National Academy of
Sciences, 106(34):14728–14733, 2009.
[31] Jeremy K Nicholson and Ian D Wilson. Understanding’global’systems biology: metabo-
nomics and the continuum of metabolism. Nature Reviews Drug Discovery, 2(8):668–676,
2003.
[32] PB Phapale, SD Kim, HW Lee, M Lim, DD Kale, YL Kim, JH Cho, D Hwang, and YR Yoon.
An integrative approach for identifying a metabolic phenotype predictive of individual-
ized pharmacokinetics of tacrolimus. Clinical Pharmacology & Therapeutics, 87(4):426–
436, 2010.
[33] Christoph Hiemke. Clinical utility of drug measurement and pharmacokinetics–
therapeutic drug monitoring in psychiatry. European journal of clinical pharmacology,
64(2):159–166, 2008.
[34] Annette S Gross. Best practice in therapeutic drug monitoring. British journal of clinical
pharmacology, 52(S1):5–9, 2001.
[35] Clark Michelle A. Finkel Richard Rey Jose A. Whalen Karen. Harvey, Richard A. Phar-
macology (Lippincott’s Illustrated Reviews). Lippincott Williams & Wilkins, 5th edition,
2011.
[36] N Mehrotra, M Gupta, A Kovar, and B Meibohm. The role of pharmacokinetics and
pharmacodynamics in phosphodiesterase-5 inhibitor therapy. Int J Impot Res, 19(3):253–
264, 09 2006.
133
Bibliography
[37] Samir D. Undevia, Gonzalo Gomez-Abuin, and Mark J. Ratain. Pharmacokinetic vari-
ability of anticancer agents. Nat Rev Cancer, 5(6):447–458, 06 2005.
[38] Siemens. Therapeutic drug monitoring (tdm) therapeutic drug monitoring - an educa-
tional guide, 2014.
[39] Abbott Diagnostics. Therapeutic drug monitoring - interactive guide, 2014.
[40] Brandon Bailey. Apple, google, vcs invest in health technology, 2014.
[41] Rafael Vargas-Bernal, Gabriel Herrera-Pérez, and Esmeralda Rodríguez-
Miranda. Evolution and Expectations of Enzymatic Biosensors for Pesticides.
books/export/citation/ReferenceManager/pesticides-advances-in-chemical-and-
botanical-pesticides/evolution-and-expectations-of-enzymatic-biosensors-for-
pesticides 2012-07-25 N1 37959 UR http:.
[42] Saraju P Mohanty and Elias Kougianos. Biosensors: a tutorial review. Potentials, IEEE,
25(2):35–40, 2006.
[43] Paul D’Orazio. Biosensors in clinical chemistry—2011 update. Clinica Chimica Acta,
412(19):1749–1761, 2011.
[44] Scott P. Nichols, Ahyeon Koh, Wesley L. Storm, Jae Ho Shin, and Mark H. Schoenfisch.
Biocompatible materials for continuous glucose monitoring devices. Chemical Reviews,
113(4):2528–2549, 2013. PMID: 23387395.
[45] Nelly Mauras, Larry Fox, Kimberly Englert, and Roy W Beck. Continuous glucose moni-
toring in type 1 diabetes. Endocrine, 43(1):41–50, 2013.
[46] GlySens Incorporated. Glysens’s icgmtm glucose monitoring products.
[47] David A Gough, Lucas S Kumosa, Timothy L Routh, Joe T Lin, and Joseph Y Lucisano.
Function of an implanted tissue glucose sensor for more than 1 year in animals. Science
Translational Medicine, 2(42):42ra53–42ra53, 2010.
[48] Mark Mortellaro and Andrew DeHennis. Performance characterization of an abiotic
and fluorescent-based continuous glucose monitoring system in patients with type 1
diabetes. Biosensors and Bioelectronics, 61(0):227–231, 11 2014.
[49] SenseonicsTM. Senseonics sensor.
[50] Jane Ellen Phillips, Stuart Bogema, Paul Fu, Wieslaw Furmaga, Alan HB Wu, Vlasta Zic,
and Catherine Hammett-Stabler. Signify®er drug screen test evaluation: comparison
to triage®drug of abuse panel plus tricyclic antidepressants. Clinica chimica acta,
328(1):31–38, 2003.
[51] Michelle R Peace, Lisa D Tarnai, and Alphonse Poklis. Performance evaluation of four
on-site drug-testing devices for detection of drugs of abuse in urine. Journal of analytical
toxicology, 24(7):589–594, 2000.
134
Bibliography
[52] AlereTM. Aleretm toxicology system, 2014.
[53] You Wang, Hui Xu, Jianming Zhang, and Guang Li. Electrochemical sensors for clinic
analysis. Sensors, 8(4):2043–2081, 2008.
[54] Niina J Ronkainen, H Brian Halsall, and William R Heineman. Electrochemical biosen-
sors. Chemical Society Reviews, 39(5):1747–1763, 2010.
[55] Joseph Wang. Electrochemical biosensors: Towards point-of-care cancer diagnostics.
Biosensors and Bioelectronics, 21(10):1887–1892, 4 2006.
[56] Allen J Bard and LR Faulkner. Electrochemical methods: principles and applications.
Electrochemical Methods: Principles and Applications, 2001.
[57] Peter T Kissinger and William R Heineman. Cyclic voltammetry. Journal of Chemical
Education, 60(9):702, 1983.
[58] Janet G. Osteryoung and Robert A. Osteryoung. Square wave voltammetry. Analytical
Chemistry, 57(1):101A–110A, 2014/10/22 1985.
[59] Louis Ramaley and Matthew S. Krause. Theory of square wave voltammetry. Analytical
Chemistry, 41(11):1362–1365, 2014/10/23 1969.
[60] Kagan Kerman, Masato Saito, Eiichi Tamiya, Shohei Yamamura, and Yuzuru Takamura.
Nanomaterial-based electrochemical biosensors for medical applications. TrAC Trends
in Analytical Chemistry, 27(7):585–592, 2008.
[61] Aicheng Chen and Sanghamitra Chatterjee. Nanomaterials based electrochemical
sensors for biomedical applications. Chemical Society Reviews, 42(12):5425–5438, 2013.
[62] Lourdes Agüí, Paloma Yáñez-Sedeño, and JoséM Pingarrón. Role of carbon nanotubes
in electroanalytical chemistry: a review. Analytica chimica acta, 622(1):11–47, 2008.
[63] Katja Habermüller, Marcus Mosbach, and Wolfgang Schuhmann. Electron-transfer
mechanisms in amperometric biosensors. Fresenius’ journal of analytical chemistry,
366(6-7):560–568, 2000.
[64] Shakeel Ahmed Ansari and Qayyum Husain. Potential applications of enzymes immobi-
lized on/in nano materials: A review. Biotechnology Advances, 30(3):512–523, 2012/6//
2012.
[65] Joseph Wang. Electrochemical glucose biosensors. Chemical reviews, 108(2):814–825,
2008.
[66] Sandro Carrara, Sara Ghoreishizadeh, Jacopo Olivo, Irene Taurino, Camilla Baj-Rossi,
Andrea Cavallini, Maaike Op de Beeck, Catherine Dehollain, Wayne Burleson, and
Francis Gabriel Moussy. Fully integrated biochip platforms for advanced healthcare.
Sensors, 12(8):11013–11060, 2012.
135
Bibliography
[67] Wenrong Yang, Kyle R Ratinac, Simon P Ringer, Pall Thordarson, J Justin Gooding,
and Filip Braet. Carbon nanomaterials in biosensors: should you use nanotubes or
graphene? Angewandte Chemie International Edition, 49(12):2114–2138, 2010.
[68] Aihua Liu. Towards development of chemosensors and biosensors with metal-oxide-
based nanowires or nanotubes. Biosensors and Bioelectronics, 24(2):167–177, 2008.
[69] Umasankar Yogeswaran and Shen-Ming Chen. A review on the electrochemical sensors
and biosensors composed of nanowires as sensing material. Sensors, 8(1):290–313, 2008.
[70] Weena Siangproh, Wijitar Dungchai, Poomrat Rattanarat, and Orawon Chailapakul.
Nanoparticle-based electrochemical detection in conventional and miniaturized sys-
tems and their bioanalytical applications: A review. Analytica Chimica Acta, 690(1):10–
25, 3 2011.
[71] Bansi D Malhotra, Asha Chaubey, and SP Singh. Prospects of conducting polymers in
biosensors. Analytica Chimica Acta, 578(1):59–74, 2006.
[72] Lin Xia, Zhixiang Wei, and Meixiang Wan. Conducting polymer nanostructures and
their application in biosensors. Journal of Colloid and Interface Science, 341(1):1–11, 1
2010.
[73] Tapas Kuila, Saswata Bose, Partha Khanra, Ananta Kumar Mishra, Nam Hoon Kim,
and Joong Hee Lee. Recent advances in graphene-based biosensors. Biosensors and
Bioelectronics, 26(12):4637–4648, 8 2011.
[74] Min Ouyang, Jin-Lin Huang, and Charles M. Lieber. Fundamental electronic properties
and applications of single-walled carbon nanotubes. Accounts of Chemical Research,
35(12):1018–1025, 2014/10/27 2002.
[75] Kannan Balasubramanian and Marko Burghard. Biosensors based on carbon nanotubes.
Analytical and bioanalytical chemistry, 385(3):452–468, 2006.
[76] Joseph Wang. Carbon nanotube based electrochemical biosensors: A review. Electro-
analysis, 17(1):7–14, 2005.
[77] Christopher B. Jacobs, M. Jennifer Peairs, and B. Jill Venton. Review: Carbon nanotube
based electrochemical sensors for biomolecules. Analytica Chimica Acta, 662(2):105–
127, 3 2010.
[78] Sandeep Kumar Vashist, Dan Zheng, Khalid Al-Rubeaan, John H. T. Luong, and Fwu-
Shan Sheu. Advances in carbon nanotube based electrochemical sensors for bioanalyti-
cal applications. Biotechnology Advances, 29(2):169–188, 2011/4// 2011.
[79] J. Justin Gooding. Nanostructuring electrodes with carbon nanotubes: A review on
electrochemistry and applications for sensing. Electrochimica Acta, 50(15):3049–3060, 5
2005.
136
Bibliography
[80] Anthony Guiseppi-Elie, Chenghong Lei, and Ray H Baughman. Direct electron transfer
of glucose oxidase on carbon nanotubes. Nanotechnology, 13(5):559, 2002.
[81] Chenxin Cai and Jing Chen. Direct electron transfer of glucose oxidase promoted by
carbon nanotubes. Analytical biochemistry, 332(1):75–83, 2004.
[82] Sandro Carrara, Camilla Baj-Rossi, Cristina Boero, and Giovanni De Micheli. Do carbon
nanotubes contribute to electrochemical biosensing? Electrochimica Acta, 128(0):102–
112, 5 2014.
[83] Gustavo A. Rivas, María D. Rubianes, Marcela C. Rodríguez, Nancy F. Ferreyra, Guiller-
mina L. Luque, María L. Pedano, Silvia A. Miscoria, and Concepción Parrado. Carbon
nanotubes for electrochemical biosensing. Talanta, 74(3):291–307, 12 2007.
[84] Wei Feng and Peijun Ji. Enzymes immobilized on carbon nanotubes. Biotechnology
Advances, 29(6):889–895, 2011/12// 2011.
[85] Audrey Sassolas, Loïc J. Blum, and Béatrice D. Leca-Bouvier. Immobilization strategies
to develop enzymatic biosensors. Biotechnology Advances, 30(3):489–511, 2012/6//
2012.
[86] Po Chiao Lin, Dirk Weinrich, and Herbert Waldmann. Protein biochips: oriented surface
immobilization of proteins. Macromolecular Chemistry and Physics, 211(2):136–144,
2010.
[87] D Nematollahi, H Shayani-Jam, M Alimoradi, and S Niroomand. Electrochemical
oxidation of acetaminophen in aqueous solutions: kinetic evaluation of hydrolysis,
hydroxylation and dimerization processes. Electrochimica Acta, 54(28):7407–7415, 2009.
[88] Nagwa Abo El-Maali. Voltammetric analysis of drugs. Bioelectrochemistry, 64(1):99–107,
2004.
[89] Sibel A Özkan, Bengi Uslu, and Hassan Y Aboul-Enein. Analysis of pharmaceuticals
and biological fluids using modern electroanalytical techniques. Critical reviews in
analytical chemistry, 33(3):155–181, 2003.
[90] Mehmet Gumustas and Sibel A Ozkan. The role of and the place of method validation
in drug analysis using electroanalytical techniques. Open Anal. Chem. J, 5:1–21, 2011.
[91] Vinod K Gupta, Rajeev Jain, Keisham Radhapyari, Nimisha Jadon, and Shilpi Agarwal.
Voltammetric techniques for the assay of pharmaceuticals—a review. Analytical bio-
chemistry, 408(2):179–196, 2011.
[92] Neeta Thapliyal, Rajshekhar V. Karpoormath, and Rajendra N. Goyal. Electroanalysis of
antitubercular drugs in pharmaceutical dosage forms and biological fluids: A review.
Analytica Chimica Acta, (0):–, 2014.
137
Bibliography
[93] Ali Mokhtari, Hassan Karimi-Maleh, Ali A. Ensafi, and Hadi Beitollahi. Application of
modified multiwall carbon nanotubes paste electrode for simultaneous voltammetric
determination of morphine and diclofenac in biological and pharmaceutical samples.
Sensors and Actuators B: Chemical, 169(0):96–105, 7 2012.
[94] Celia Reguera, M. Cruz Ortiz, and M. Julia Arcos. Differential pulse voltammetric
simultaneous determination of four anti-inflammatory drugs by using soft modelling.
Electroanalysis, 14(24):1699–1706, 2002.
[95] Fatemeh Ghorbani-Bidkorbeh, Saeed Shahrokhian, Ali Mohammadi, and Rassoul Di-
narvand. Simultaneous voltammetric determination of tramadol and acetaminophen
using carbon nanoparticles modified glassy carbon electrode. Electrochimica Acta,
55(8):2752–2759, 3 2010.
[96] Yongnian Ni, Li Wang, and Serge Kokot. Voltammetric determination of chlorpromazine
hydrochloride and promethazine hydrochloride with the use of multivariate calibration.
Analytica Chimica Acta, 439(1):159–168, 7 2001.
[97] Abbas Afkhami, Hosein Khoshsafar, Hasan Bagheri, and Tayyebeh Madrakian. Facile
simultaneous electrochemical determination of codeine and acetaminophen in phar-
maceutical samples and biological fluids by graphene–cofe2o4 nancomposite modified
carbon paste electrode. Sensors and Actuators B: Chemical, 203(0):909–918, 11 2014.
[98] Aso Navaee, Abdollah Salimi, and Hazhir Teymourian. Graphene nanosheets modified
glassy carbon electrode for simultaneous detection of heroine, morphine and noscapine.
Biosensors and Bioelectronics, 31(1):205–211, 1 2012.
[99] Mohammad Mazloum-Ardakani, Mohammad Ali Sheikh-Mohseni, Mohammad
Abdollahi-Alibeik, and Ali Benvidi. Electrochemical sensor for simultaneous determina-
tion of norepinephrine, paracetamol and folic acid by a nanostructured mesoporous
material. Sensors and Actuators B: Chemical, 171–172(0):380–386, 2012/9// 2012.
[100] Abdollah Salimi, Mohadeseh Izadi, Rahman Hallaj, and Manochehr Rashidi. Simultane-
ous determination of ranitidine and metronidazole at glassy carbon electrode modified
with single wall carbon nanotubes. Electroanalysis, 19(16):1668–1676, 2007.
[101] Chen Yi and Miklós Gratzl. Continuous in situ electrochemical monitoring of dox-
orubicin efflux from sensitive and drug-resistant cancer cells. Biophysical journal,
75(5):2255–2261, 1998.
[102] Parviz Norouzi, Mohammad Reza Ganjali, and Parandis Daneshgar. A novel method for
fast determination of ranitidine in its pharmaceutical formulations by fast continuous
cyclic voltammetry. Journal of pharmacological and toxicological methods, 55(3):289–
296, 2007.
[103] Sandro Carrara. Bio/CMOS interfaces and co-design. Springer, 2012.
138
Bibliography
[104] Joseph Wang. Glucose biosensors: 40 years of advances and challenges. Electroanalysis,
13(12):983, 2001.
[105] Liza Rassaei, Wouter Olthuis, Seiya Tsujimura, Ernst JR Sudhölter, and Albert van den
Berg. Lactate biosensors: current status and outlook. Analytical and bioanalytical
chemistry, 406(1):123–137, 2014.
[106] Guosong Lai, Feng Yan, and Huangxian Ju. Dual signal amplification of glucose oxidase-
functionalized nanocomposites as a trace label for ultrasensitive simultaneous multi-
plexed electrochemical detection of tumor markers. Analytical Chemistry, 81(23):9730–
9736, 2014/11/03 2009.
[107] F. Rizzi, R. Centonze, and P. G. Zambonin. Simultaneous monitoring of glucose and
lactate by an interference and cross-talk free dual electrode amperometric biosensor
based on electropolymerized thin films. Biosensors and Bioelectronics, 15(9–10):531–539,
11 2000.
[108] Fang Lu, Joseph Wang, and Xueji Zhang. Microsensors for glucose and insulin monitor-
ing, 05 2005.
[109] Yuqing Lin, Ping Yu, Jie Hao, Yuexiang Wang, Takeo Ohsaka, and Lanqun Mao. Continu-
ous and simultaneous electrochemical measurements of glucose, lactate, and ascorbate
in rat brain following brain ischemia. Analytical Chemistry, 86(8):3895–3901, 2014/11/03
2014.
[110] C. A. Cordeiro, M. G. de Vries, W. Ngabi, P. E. Oomen, T. I. F. H. Cremers, and B. H. C. West-
erink. In vivo continuous and simultaneous monitoring of brain energy substrates with a
multiplex amperometric enzyme-based biosensor device. Biosensors and Bioelectronics,
(0):–, 2014.
[111] Ivan S. Kucherenko, Daria Yu. Didukh, Oleksandr O. Soldatkin, and Alexei P. Soldatkin.
Amperometric biosensor system for simultaneous determination of adenosine-5’-
triphosphate and glucose. Analytical Chemistry, 86(11):5455–5462, 2014/11/03 2014.
[112] M. U. Anu Prathap and Rajendra Srivastava. Tailoring properties of polyaniline for
simultaneous determination of a quaternary mixture of ascorbic acid, dopamine, uric
acid, and tryptophan. Sensors and Actuators B: Chemical, 177(0):239–250, 2 2013.
[113] Isabella Moser, Gerhard Jobst, and Gerald A. Urban. Biosensor arrays for simultaneous
measurement of glucose, lactate, glutamate, and glutamine. Biosensors and Bioelectron-
ics, 17(4):297–302, 4 2002.
[114] Michael D Coleman. Human drug metabolism: an introduction. John Wiley & Sons, 2nd
edition, 2010.
[115] F Peter Guengerich. Cytochrome p450 and chemical toxicology. Chemical research in
toxicology, 21(1):70–83, 2007.
139
Bibliography
[116] Ilia G Denisov, Thomas M Makris, Stephen G Sligar, and Ilme Schlichting. Structure and
chemistry of cytochrome p450. Chemical reviews, 105(6):2253–2278, 2005.
[117] Masanori Sono, Mark P Roach, Eric D Coulter, and John H Dawson. Heme-containing
oxygenases. Chemical Reviews, 96(7):2841–2888, 1996.
[118] William M Atkins. Non-michaelis-menten kinetics in cytochrome p450-catalyzed reac-
tions. Annu. Rev. Pharmacol. Toxicol., 45:291–310, 2005.
[119] J Brian Houston and Aleksandra Galetin. Modelling atypical cyp3a4 kinetics: principles
and pragmatism. Archives of biochemistry and biophysics, 433(2):351–360, 2005.
[120] Paul R Ortiz De Montellano. Cytochrome P450: structure, mechanism, and biochemistry.
Springer, 2005.
[121] Ningwu Huang, Vishal Agrawal, Kathleen M Giacomini, and Walter L Miller. Genetics
of p450 oxidoreductase: sequence variation in 842 individuals of four ethnicities and
activities of 15 missense mutations. Proceedings of the National Academy of Sciences,
105(5):1733–1738, 2008.
[122] Nikitas Bistolas, Ulla Wollenberger, Christiane Jung, and Frieder W Scheller. Cytochrome
p450 biosensors—a review. Biosensors and Bioelectronics, 20(12):2408–2423, 2005.
[123] Ronald W Estabrook, Kevin M Faulkner, Manjunath S Shet, and Charles W Fisher. Appli-
cation of electrochemistry for p450-catalyzed reactions. Methods in enzymology, 272:44,
1996.
[124] Victoria V Shumyantseva, Tatiana V Bulko, Till T Bachmann, Ursula Bilitewski, Rolf D
Schmid, and Alexander I Archakov. Electrochemical reduction of flavocytochromes 2b4
and 1a2 and their catalytic activity. Archives of biochemistry and biophysics, 377(1):43–48,
2000.
[125] Victoria V Shumyantseva, Tatiana V Bulko, Sergei A Usanov, Rolf D Schmid, Claudio
Nicolini, and Alexander I Archakov. Construction and characterization of bioelec-
trocatalytic sensors based on cytochromes p450. Journal of inorganic biochemistry,
87(4):185–190, 2001.
[126] Andrea Fantuzzi, Michael Fairhead, and Gianfranco Gilardi. Direct electrochemistry of
immobilized human cytochrome p450 2e1. Journal of the American Chemical Society,
126(16):5040–5041, 2004.
[127] Sheila J Sadeghi, Andrea Fantuzzi, and Gianfranco Gilardi. Breakthrough in p450 bio-
electrochemistry and future perspectives. Biochimica et Biophysica Acta (BBA)-Proteins
and Proteomics, 1814(1):237–248, 2011.
[128] Elizabeth Schneider and Douglas S Clark. Cytochrome p450 (cyp) enzymes and the
development of cyp biosensors. Biosensors and Bioelectronics, 39(1):1–13, 2013.
140
Bibliography
[129] Camilla Baj-Rossi, Giovanni De Micheli, and Sandro Carrara. P-450-based nanobiosen-
sors for personalized medicine. Biosensors for Health, Environment and Biosecurity,
InTech Publisher, Vienna, Austria, pages 448–482, 2011.
[130] Vikash R Dodhia, Carlo Sassone, Andrea Fantuzzi, Giovanna Di Nardo, Sheila J Sadeghi,
and Gianfranco Gilardi. Modulating the coupling efficiency of human cytochrome p450
cyp3a4 at electrode surfaces through protein engineering. Electrochemistry Communi-
cations, 10(11):1744–1747, 2008.
[131] Nasreen Sultana, John B Schenkman, and James F Rusling. Protein film electrochem-
istry of microsomes genetically enriched in human cytochrome p450 monooxygenases.
Journal of the American Chemical Society, 127(39):13460–13461, 2005.
[132] Yasuhiro Mie, Masaaki Suzuki, and Yasuo Komatsu. Electrochemically driven drug
metabolism by membranes containing human cytochrome p450. Journal of the Ameri-
can Chemical Society, 131(19):6646–6647, 2009.
[133] Victoria V Shumyantseva, Yuri D Ivanov, Nikitas Bistolas, Frieder W Scheller, Alexander I
Archakov, and Ulla Wollenberger. Direct electron transfer of cytochrome p450 2b4 at
electrodes modified with nonionic detergent and colloidal clay nanoparticles. Analytical
chemistry, 76(20):6046–6052, 2004.
[134] Fraser A Armstrong, Hendrik A Heering, and Judy Hirst. Reaction of complex metallo-
proteins studied by protein-film voltammetry. Chem. Soc. Rev., 26(3):169–179, 1997.
[135] Sadagopan Krishnan, Amila Abeykoon, John B Schenkman, and James F Rusling. Control
of electrochemical and ferryloxy formation kinetics of cyt p450s in polyion films by
heme iron spin state and secondary structure. Journal of the American Chemical Society,
131(44):16215–16224, 2009.
[136] M Antonini, P Ghisellini, L Pastorino, C Paternolli, and C Nicolini. Preliminary electro-
chemical characterisation of cytochrome p4501a2-clozapine interaction. volume 150,
pages 31–34. IET, 2003.
[137] Cristina Paternolli, Mirco Antonini, Paola Ghisellini, and Claudio Nicolini. Recombinant
cytochrome p450 immobilization for biosensor applications. Langmuir, 20(26):11706–
11712, 2004.
[138] Carmelita Estavillo, Zhongqing Lu, Ingela Jansson, John B Schenkman, and James F
Rusling. Epoxidation of styrene by human cyt p450 1a2 by thin film electrolysis and
peroxide activation compared to solution reactions. Biophysical chemistry, 104(1):291–
296, 2003.
[139] VV Shumyantseva, TV Bulko, Yu O Rudakov, GP Kuznetsova, NF Samenkova, AV Lisitsa,
II Karuzina, and AI Archakov. Nanoelectrochemistry of cytochrome p450s: Direct
electron transfer and electrocatalysis. Biochemistry (Moscow) Supplement Series B:
Biomedical Chemistry, 1(4):327–333, 2007.
141
Bibliography
[140] Camilla Baj-Rossi, Tanja Rezzonico Jost, Andrea Cavallini, Fabio Grassi, Giovanni
De Micheli, and Sandro Carrara. Continuous monitoring of naproxen by a cytochrome
p450-based electrochemical sensor. Biosensors and Bioelectronics, 53:283–287, 2014.
[141] VV Shumyantseva, TV Bulko, GP Kuznetsova, NF Samenkova, and AI Archakov. Electro-
chemistry of cytochromes p450: Analysis of current-voltage characteristics of electrodes
with immobilized cytochromes p450 for the screening of substrates and inhibitors.
Biochemistry (Moscow), 74(4):438–444, 2009.
[142] Shiba Joseph, James F Rusling, Yuri M Lvov, Thomas Friedberg, and Uwe Fuhr. An
amperometric biosensor with human cyp3a4 as a novel drug screening tool. Biochemical
pharmacology, 65(11):1817–1826, 2003.
[143] A Ignaszak, N Hendricks, T Waryo, E Songa, N Jahed, R Ngece, A Al-Ahmed, B Kgarebe,
P Baker, and EI Iwuoha. Novel therapeutic biosensor for indinavir—a protease inhibitor
antiretroviral drug. Journal of pharmaceutical and biomedical analysis, 49(2):498–501,
2009.
[144] Nicolette R Hendricks, Tesfaye T Waryo, Omotayo Arotiba, Nazeem Jahed, Priscilla GL
Baker, and Emmanuel I Iwuoha. Microsomal cytochrome p450-3a4 (cyp3a4)
nanobiosensor for the determination of 2, 4-dichlorophenol—an endocrine disruptor
compound. Electrochimica Acta, 54(7):1925–1931, 2009.
[145] Peter M Ndangili, Abongile M Jijana, Priscilla GL Baker, and Emmanuel I Iwuoha. 3-
mercaptopropionic acid capped znse quantum dot-cytochrome p450 3a4 enzyme bio-
transducer for 17β-estradiol. Journal of Electroanalytical Chemistry, 653(1):67–74, 2011.
[146] DL Johnson, BC Lewis, DJ Elliot, JO Miners, and LL Martin. Electrochemical characteri-
sation of the human cytochrome p450 cyp2c9. Biochemical pharmacology, 69(10):1533–
1541, 2005.
[147] George S. Wilson and Raeann Gifford. Biosensors for real-time in vivo measurements.
Biosensors and Bioelectronics, 20(12):2388–2403, 6 2005.
[148] Amina S Khan and Adrian C Michael. Invasive consequences of using micro-electrodes
and microdialysis probes in the brain. TrAC Trends in Analytical Chemistry, 22(8):503–
508, 2003.
[149] Jan Bert Gramsbergen, Gea Leegsma-Vogt, Kor Venema, Jens Noraberg, and Jakob Korf.
Quantitative on-line monitoring of hippocampus glucose and lactate metabolism in
organotypic cultures using biosensor technology. Journal of neurochemistry, 85(2):399–
408, 2003.
[150] David W Grainger. All charged up about implanted biomaterials. Nature Biotechnology,
31(6):507–509, 06 2013.
142
Bibliography
[151] Robert G Chapman, Emanuele Ostuni, Shuichi Takayama, R Erik Holmlin, Lin Yan, and
George M Whitesides. Surveying for surfaces that resist the adsorption of proteins.
Journal of the American Chemical Society, 122(34):8303–8304, 2000.
[152] W Kenneth Ward, Emily P Slobodzian, Kenneth L Tiekotter, and Michael D Wood. The
effect of microgeometry, implant thickness and polyurethane chemistry on the foreign
body response to subcutaneous implants. Biomaterials, 23(21):4185–4192, 2002.
[153] Bazhang Yu, Nathan Long, Yvonne Moussy, and Francis Moussy. A long-term flexi-
ble minimally-invasive implantable glucose biosensor based on an epoxy-enhanced
polyurethane membrane. Biosensors and Bioelectronics, 21(12):2275–2282, 2006.
[154] Tony G Van Tienen, Ralf GJC Heijkants, Pieter Buma, Jacqueline H de Groot, Albert J
Pennings, and Rene PH Veth. Tissue ingrowth and degradation of two biodegradable
porous polymers with different porosities and pore sizes. Biomaterials, 23(8):1731–1738,
2002.
[155] M Gerritsen, JA Jansen, and JA Lutterman. Performance of subcutaneously implanted
glucose sensors for continuous monitoring. The Netherlands journal of medicine,
54(4):167–179, 1999.
[156] Francis Moussy. Implantable glucose sensor: progress and problems. volume 1, pages
270–273. IEEE, 2002.
[157] Upkar Bhardwaj, Radhakrishna Sura, Fotios Papadimitrakopoulos, and Diane J
Burgess. Controlling acute inflammation with fast releasing dexamethasone-plga mi-
crosphere/pva hydrogel composites for implantable devices. Journal of diabetes science
and technology, 1(1):8–17, 2007.
[158] Evan M Hetrick and Mark H Schoenfisch. Reducing implant-related infections: active
release strategies. Chemical Society Reviews, 35(9):780–789, 2006.
[159] Evan M Hetrick, Heather L Prichard, Bruce Klitzman, and Mark H Schoenfisch. Reduced
foreign body response at nitric oxide-releasing subcutaneous implants. Biomaterials,
28(31):4571–4580, 2007.
[160] Juan Ren, Wentao Shi, Kai Li, and Zhanfang Ma. Ultrasensitive platinum nanocubes
enhanced amperometric glucose biosensor based on chitosan and nafion film. Sensors
and Actuators B: Chemical, 163(1):115–120, 2012.
[161] G Piechotta, J Albers, and R Hintsche. Novel micromachined silicon sensor for continu-
ous glucose monitoring. Biosensors and Bioelectronics, 21(5):802–808, 2005.
[162] James H Brauker, Mark C Shults, and Mark A Tapsak. Membrane for use with implantable
devices, 03 2004.
[163] Robert Boock and Monica Rixman. Silicone based membranes for use in implantable
glucose sensors. US Patent 8,543,184, 09 2013.
143
Bibliography
[164] Ritesh Tipnis, SanthiSagar Vaddiraju, Faquir Jain, Diane J Burgess, and Fotios Papadimi-
trakopoulos. Layer-by-layer assembled semipermeable membrane for amperometric
glucose sensors. Journal of diabetes science and technology, 1(2):193–200, 2007.
[165] Wen-Zhi Jia, Kang Wang, and Xing-Hua Xia. Elimination of electrochemical interfer-
ences in glucose biosensors. TrAC Trends in Analytical Chemistry, 29(4):306–318, 2010.
[166] Jun-ichi Anzai, Hiroki Takeshita, Yuka Kobayashi, Tetsuo Osa, and Tomonori Hoshi.
Layer-by-layer construction of enzyme multilayers on an electrode for the preparation
of glucose and lactate sensors: Elimination of ascorbate interference by means of an
ascorbate oxidase multilayer. Analytical Chemistry, 70(4):811–817, 2014/11/05 1998.
[167] Jing-Juan Xu, Xi-Liang Luo, Ying Du, and Hong-Yuan Chen. Application of mno2
nanoparticles as an eliminator of ascorbate interference to amperometric glucose
biosensors. Electrochemistry Communications, 6(11):1169–1173, 11 2004.
[168] Xiliang Luo, Aoife Morrin, Anthony J. Killard, and Malcolm R. Smyth. Application of
nanoparticles in electrochemical sensors and biosensors. Electroanalysis, 18(4):319–326,
2006.
[169] Yi-Qing Dai, Dong-Mei Zhou, and Kwok-Keung Shiu. Permeability and permselectivity
of polyphenylenediamine films synthesized at a palladium disk electrode. Electrochim-
ica Acta, 52(1):297–303, 10 2006.
[170] Xiaohong Chen, Yibai Hu, and George S Wilson. Glucose microbiosensor based on
alumina sol-gel matrix/electropolymerized composite membrane. Biosensors and
Bioelectronics, 17(11):1005–1013, 2002.
[171] Dawei Pan, Jinhua Chen, Shouzhuo Yao, Wenyan Tao, and Lihua Nie. An amperometric
glucose biosensor based on glucose oxidase immobilized in electropolymerized poly
(o-aminophenol) and carbon nanotubes composite film on a gold electrode. Analytical
Sciences, 21(4):367–372, 2005.
[172] Lindy J Murphy. Reduction of interference response at a hydrogen peroxide detect-
ing electrode using electropolymerized films of substituted naphthalenes. Analytical
Chemistry, 70(14):2928–2935, 1998.
[173] Hitoshi Muguruma, Atsunori Hiratsuka, and Isao Karube. Thin-film glucose biosensor
based on plasma-polymerized film: simple design for mass production. Analytical
chemistry, 72(11):2671–2675, 2000.
[174] Robert Sternberg, Dilbir S Bindra, George S Wilson, and Daniel R Thevenot. Covalent
enzyme coupling on cellulose acetate membranes for glucose sensor development.
Analytical Chemistry, 60(24):2781–2786, 1988.
[175] Marcela C. Rodríguez and Gustavo A. Rivas. Assembly of glucose oxidase and different
polyelectrolytes by means of electrostatic layer-by-layer adsorption on thiolated gold
surface. Electroanalysis, 16(20):1717–1722, 2004.
144
Bibliography
[176] Yanan Zhang, Yibai Hu, George S Wilson, Dinah Moatti-Sirat, Vincent Poitout, and
Gerard Reach. Elimination of the acetaminophen interference in an implantable glucose
sensor. Analytical Chemistry, 66(7):1183–1188, 1994.
[177] Dilbir S Bindra, Yanan Zhang, George S Wilson, Robert Sternberg, Daniel R Thevenot,
Dinah Moatti, and Gerard Reach. Design and in vitro studies of a needle-type glucose
sensor for subcutaneous monitoring. Analytical Chemistry, 63(17):1692–1696, 1991.
[178] B Aussedat, M Dupire-Angel, R Gifford, JC Klein, GS Wilson, and G Reach. Intersti-
tial glucose concentration and glycemia: implications for continuous subcutaneous
glucose monitoring. American Journal of Physiology-Endocrinology And Metabolism,
278(4):E716–E728, 2000.
[179] Francis Moussy, D Jed Harrison, Darryl W O’Brien, and Ray V Rajotte. Performance
of subcutaneously implanted needle-type glucose sensors employing a novel trilayer
coating. Analytical Chemistry, 65(15):2072–2077, 1993.
[180] Hitoshi Ohnuki, Takafumi Saiki, Akira Kusakari, Hideaki Endo, Masaki Ichihara, and
Mitsuru Izumi. Incorporation of glucose oxidase into langmuir-blodgett films based on
prussian blue applied to amperometric glucose biosensor. Langmuir, 23(8):4675–4681,
2007.
[181] Joseph Wang, Fang Lu, Lucio Angnes, Jie Liu, Henning Sakslund, Qiang Chen, Maria
Pedrero, Liang Chen, and Ole Hammerich. Remarkably selective metallized-carbon
amperometric biosensors. Analytica chimica acta, 305(1):3–7, 1995.
[182] Liande Zhu, Ruilan Yang, Jiangli Zhai, and Chunyuan Tian. Bienzymatic glucose biosen-
sor based on co-immobilization of peroxidase and glucose oxidase on a carbon nan-
otubes electrode. Biosensors and Bioelectronics, 23(4):528–535, 2007.
[183] Soichi Yabuki, Fumio Mizutani, and Yoshiki Hirata. Hydrogen peroxide determination
based on a glassy carbon electrode covered with polyion complex membrane containing
peroxidase and mediator. Sensors and Actuators B: Chemical, 65(1):49–51, 2000.
[184] Golam Faruque Khan, Masaki Ohwa, and Wolfgang Wernet. Design of a stable charge
transfer complex electrode for a third-generation amperometric glucose sensor. Analyt-
ical chemistry, 68(17):2939–2945, 1996.
[185] Yan-Li Yao and Kwok-Keung Shiu. Low potential detection of glucose at carbon nan-
otube modified glassy carbon electrode with electropolymerized poly (toluidine blue o)
film. Electrochimica Acta, 53(2):278–284, 2007.
[186] Adam Heller and Ben Feldman. Electrochemical glucose sensors and their applications
in diabetes management. Chemical reviews, 108(7):2482–2505, 2008.
[187] Pius HS Tse and David A Gough. Time-dependent inactivation of immobilized glucose
oxidase and catalase. Biotechnology and bioengineering, 29(6):705–713, 1987.
145
Bibliography
[188] C Choleau, JC Klein, G Reach, B Aussedat, V Demaria-Pesce, GS Wilson, R Gifford, and
WK Ward. Calibration of a subcutaneous amperometric glucose sensor: Part 1. effect of
measurement uncertainties on the determination of sensor sensitivity and background
current. Biosensors and Bioelectronics, 17(8):641–646, 2002.
[189] C Choleau, JC Klein, G Reach, B Aussedat, V Demaria-Pesce, GS Wilson, R Gifford, and
WK Ward. Calibration of a subcutaneous amperometric glucose sensor implanted for
7 days in diabetic patients: Part 2. superiority of the one-point calibration method.
Biosensors and Bioelectronics, 17(8):647–654, 2002.
[190] Kyungsik Eom, Joonsoo Jeong, Tae Hyung Lee, Jinhyung Kim, Junghoon Kim, Sung Eun
Lee, and Sung June Kim. A wireless power transmission system for implantable devices
in freely moving rodents. Medical & biological engineering & computing, 52(8):639–651,
2014.
[191] David Fan, Dylan Rich, Tahl Holtzman, Patrick Ruther, Jeffrey W Dalley, Alberto Lopez,
Mark A Rossi, Joseph W Barter, Daniel Salas-Meza, and Stanislav Herwik. A wireless
multi-channel recording system for freely behaving mice and rats. PloS one, 6(7):e22033,
2011.
[192] William Sanchez, Charles Sodini, and Joel L Dawson. An energy management ic for
bio-implants using ultracapacitors for energy storage. pages 63–64. IEEE, 2010.
[193] Chuizhou Meng, Oren Z Gall, and Pedro P Irazoqui. A flexible super-capacitive solid-
state power supply for miniature implantable medical devices. Biomedical microdevices,
15(6):973–983, 2013.
[194] Mark A Hanson, Harry C Powell Jr, Adam T Barth, Kyle Ringgenberg, Benton H Calhoun,
James H Aylor, and John Lach. Body area sensor networks: Challenges and opportunities.
Computer, 42(1):58, 2009.
[195] Stewart J Thomas, Reid R Harrison, Anthony Leonardo, and Matthew S Reynolds.
A battery-free multichannel digital neural/emg telemetry system for flying insects.
Biomedical Circuits and Systems, IEEE Transactions on, 6(5):424–436, 2012.
[196] Peng Cong, Wen H Ko, and Darrin J Young. Wireless batteryless implantable blood
pressure monitoring microsystem for small laboratory animals. Sensors Journal, IEEE,
10(2):243–254, 2010.
[197] Guoxing Wang, Wentai Liu, Mohanasankar Sivaprakasam, and Gurhan Alper Kendir.
Design and analysis of an adaptive transcutaneous power telemetry for biomedical
implants. Circuits and Systems I: Regular Papers, IEEE Transactions on, 52(10):2109–
2117, 2005.
[198] Mohammad M Ahmadi and Graham A Jullien. Current-mirror-based potentiostats for
three-electrode amperometric electrochemical sensors. Circuits and Systems I: Regular
Papers, IEEE Transactions on, 56(7):1339–1348, 2009.
146
Bibliography
[199] Mohammad R Haider, Syed K Islam, Salwa Mostafa, Mo Zhang, and Taeho Oh. Low-
power low-voltage current readout circuit for inductively powered implant system.
Biomedical Circuits and Systems, IEEE Transactions on, 4(4):205–213, 2010.
[200] Yu-Te Liao, Huanfen Yao, Andrew Lingley, Babak Parviz, and Brian P Otis. A 3-cmos
glucose sensor for wireless contact-lens tear glucose monitoring. Solid-State Circuits,
IEEE Journal of, 47(1):335–344, 2012.
[201] Arjang Hassibi and Thomas H Lee. A programmable 0.18-cmos electrochemical sensor
microarray for biomolecular detection. Sensors Journal, IEEE, 6(6):1380–1388, 2006.
[202] Hamed Mazhab Jafari and Roman Genov. Chopper-stabilized bidirectional current
acquisition circuits for electrochemical amperometric biosensors. Circuits and Systems
I: Regular Papers, IEEE Transactions on, 60(5):1149–1157, 2013.
[203] Peter M Levine, Ping Gong, Rastislav Levicky, and Kenneth L Shepard. Active cmos
sensor array for electrochemical biomolecular detection. Solid-State Circuits, IEEE
Journal of, 43(8):1859–1871, 2008.
[204] Lin Li, Xiaowen Liu, Waqar A Qureshi, and Andrew J Mason. Cmos amperometric
instrumentation and packaging for biosensor array applications. Biomedical Circuits
and Systems, IEEE Transactions on, 5(5):439–448, 2011.
[205] Camilla Baj-Rossi, Christian Müller, Ursula von Mandach, Giovanni De Micheli, and San-
dro Carrara. Faradic peaks enhanced by carbon nanotubes in microsomal cytochrome
p450 electrodes. Electroanalysis, 27(6):1507–1515, 2015.
[206] Jiri Novotny, Robert E Bruccoleri, and Frederick A Saul. On the attribution of binding
energy in antigen-antibody complexes mcpc 603, d1. 3, and hyhel-5. Biochemistry,
28(11):4735–4749, 1989.
[207] Kurumbail G Ravichandran, Sekhar S Boddupalli, CA Hasermann, Julian A Peterson,
and Johann Deisenhofer. Crystal structure of hemoprotein domain of p450bm-3, a
prototype for microsomal p450’s. Science, 261(5122):731–736, 1993.
[208] KW Kenneth, NK Emma, and H Allen O áHill. A scanning tunnelling study of immo-
bilised cytochrome p450 cam. Faraday discussions, 116:15–22, 2000.
[209] Camilla Baj-Rossi, Giovanni De Micheli, and Sandro Carrara. Electrochemical detec-
tion of anti-breast-cancer agents in human serum by cytochrome p450-coated carbon
nanotubes. Sensors, 12(5):6520–6537, 2012.
[210] Laura Rivas, Daniel H Murgida, and Peter Hildebrandt. Conformational and redox
equilibria and dynamics of cytochrome c immobilized on electrodes via hydrophobic
interactions. The Journal of Physical Chemistry B, 106(18):4823–4830, 2002.
147
Bibliography
[211] PA Williams, J Cosme, V Sridhar, EF Johnson, and DE McRee. Microsomal cytochrome
p450 2c5: comparison to microbial p450s and unique features. Journal of inorganic
biochemistry, 81(3):183–190, 2000.
[212] Daniel H Murgida and Peter Hildebrandt. Electron-transfer processes of cytochrome c at
interfaces. new insights by surface-enhanced resonance raman spectroscopy. Accounts
of chemical research, 37(11):854–861, 2004.
[213] F Peter Guengerich. Human cytochrome P450 enzymes, pages 377–530. Springer, 2005.
[214] PA Boudreau and SP Perone. Quantitative resolution of overlapped peaks in pro-
grammed potential-step voltammetry. Analytical Chemistry, 51(7):811–817, 1979.
[215] Jeffrey J Toman and SD Brown. Peak resolution by semiderivative voltammetry. Analyti-
cal Chemistry, 53(9):1497–1504, 1981.
[216] SV Romanenko, AG Stromberg, and TN Pushkareva. Modeling of analytical peaks: Peaks
properties and basic peak functions. Analytica chimica acta, 580(1):99–106, 2006.
[217] Sandro Carrara, Andrea Cavallini, Victor Erokhin, and Giovanni De Micheli. Multi-panel
drugs detection in human serum for personalized therapy. Biosensors and Bioelectronics,
26(9):3914–3919, 2011.
[218] Alka Shukla, Elizabeth MJ Gillam, and Paul V Bernhardt. Direct electrochemistry of
human and rat nadph cytochrome p450 reductase. Electrochemistry communications,
8(12):1845–1849, 2006.
[219] Liyun Zhao, Hongyun Liu, and Naifei Hu. Electroactive films of heme protein-coated
multiwalled carbon nanotubes. Journal of colloid and interface science, 296(1):204–211,
2006.
[220] Marc Wirtz, Vaheh Oganesyan, Xuejun Zhang, Joe Studer, and Mario Rivera. Modulation
of redox potential in electron transfer proteins: Effects of complex formation on the
active site microenvironment of cytochrome b 5. Faraday discussions, 116:221–234,
2000.
[221] Chenxin Cai and Jing Chen. Direct electron transfer and bioelectrocatalysis of
hemoglobin at a carbon nanotube electrode. Analytical biochemistry, 325(2):285–292,
2004.
[222] Hongyun Liu and Naifei Hu. Heme protein-gluten films: voltammetric studies and their
electrocatalytic properties. Analytica chimica acta, 481(1):91–99, 2003.
[223] Sandro Carrara, Victoria V Shumyantseva, Alexander I Archakov, and Bruno Samorì.
Screen-printed electrodes based on carbon nanotubes and cytochrome p450scc for
highly sensitive cholesterol biosensors. Biosensors and Bioelectronics, 24(1):148–150,
2008.
148
Bibliography
[224] Songqin Liu, Lei Peng, Xiaodi Yang, Yafeng Wu, and Lin He. Electrochemistry of cy-
tochrome p450 enzyme on nanoparticle-containing membrane-coated electrode and
its applications for drug sensing. Analytical biochemistry, 375(2):209–216, 2008.
[225] E Iwuoha, R Ngece, M Klink, and P Baker. Amperometric responses of cyp2d6 drug
metabolism nanobiosensor for sertraline: a selective serotonin reuptake inhibitor. IET
Nanobiotechnology, 1(4):62–67, 2007.
[226] Camilla Baj-Rossi, Giovanni De Micheli, and Sandro Carrara. A linear approach to
multi-panel sensing in personalized therapy for cancer treatment. IEEE Sensors Journal,
13:4860–4865, 2013.
[227] Emmanuel I. Iwuoha, Stephen Kane, Conchita Ovin Ania, Malcolm R. Smyth, Paul R.
Ortiz de Montellano, and Uwe Fuhr. Reactivities of organic phase biosensors 3: Electro-
chemical study of cytochrome p450cam immobilized in a methyltriethoxysilane sol-gel.
Electroanalysis, 12(12):980–986, 2000.
[228] Diego Millo, Maria-Eirini Pandelia, Tillmann Utesch, Nattawadee Wisitruangsakul,
Maria A Mroginski, Wolfgang Lubitz, Peter Hildebrandt, and Ingo Zebger. Spectroelec-
trochemical study of the [nife] hydrogenase from desulfovibrio vulgaris miyazaki f in
solution and immobilized on biocompatible gold surfaces. The Journal of Physical
Chemistry B, 113(46):15344–15351, 2009.
[229] JJM Holthuis, WJ Van Oort, FMGM Römkens, J Renema, and P Zuman. Electrochemistry
of podophyllotoxin derivatives: part i. oxidation mechanism of etoposide (vp 16–213).
Journal of Electroanalytical Chemistry and Interfacial Electrochemistry, 184(2):317–329,
1985.
[230] Kenneth R Hande, Peter J Wedlund, Richard M Noone, Grant R Wilkinson, F Anthony
Greco, and Steven N Wolff. Pharmacokinetics of high-dose etoposide (vp-16-213)
administered to cancer patients. Cancer research, 44(1):379–382, 1984.
[231] Camilla Baj-Rossi, Enver G Kilinc, Sara S Ghoreishizadeh, Daniele Casarino, Tanja Rez-
zonico Jost, Catherine Dehollain, Fabio Grassi, Laura Pastorino, Giovanni De Micheli,
and Sandro Carrara. Full fabrication and packaging of an implantable multi-panel
device for monitoring of metabolites in small animals. Biomedical Circuits and Systems,
IEEE Transactions on, 8(5):636–647, 2014.
[232] Alison Cowley and Brian Woodward. A healthy future: platinum in medical applications.
Platinum Metals Review, 55(2):98–107, 2011.
[233] Jilin Xia, Fang Chen, Jinghong Li, and Nongjian Tao. Measurement of the quantum
capacitance of graphene. Nat Nano, 4(8):505–509, 08 2009.
[234] Alan M. Bond and Peter A. Lay. Cyclic voltammetry at microelectrodes in the absence of
added electrolyte using a platinum quasi-reference electrode. Journal of Electroanalyti-
cal Chemistry and Interfacial Electrochemistry, 199(2):285–295, 3 1986.
149
Bibliography
[235] Bryan Smith Ronald Overholser. Aluminum oxide coated implants and components.
US PATENT US 20070078521 A1, 2012.
[236] Evin Gultepe, Dattatri Nagesha, Srinivas Sridhar, and Mansoor Amiji. Nanoporous
inorganic membranes or coatings for sustained drug delivery in implantable devices.
Advanced Drug Delivery Reviews, 62(3):305–315, 3 2010.
[237] Andrea Cavallini, Camilla Baj-Rossi, Sara Ghoreishizadeh, Giovanni De Micheli, and
Sandro Carrara. Design, fabrication, and test of a sensor array for perspective biosensing
in chronic pathologies. Number EPFL-CONF-182530, 2012.
[238] Igor A Ges, Borislav L Ivanov, David K Schaffer, Eduardo A Lima, Andreas A Werdich,
and Franz J Baudenbacher. Thin-film irox ph microelectrode for microfluidic-based
microsystems. Biosensors and Bioelectronics, 21(2):248–256, 2005.
[239] Irene Taurino, Arnaud Magrez, Federico Matteini, László Forró, Giovanni De Micheli,
and Sandro Carrara. Direct growth of nanotubes and graphene nanoflowers on electro-
chemical platinum electrodes. Nanoscale, 5(24):12448–12455, 2013.
[240] Cristina Boero, Jacopo Olivo, Giovanni De Micheli, and Sandro Carrara. New approaches
for carbon nanotubes-based biosensors and their application to cell culture monitoring.
Biomedical Circuits and Systems, IEEE Transactions on, 6(5):479–485, 2012.
[241] San Hua Lim, Ji Wei, Jianyi Lin, Qiutian Li, and Jin KuaYou. A glucose biosensor based
on electrodeposition of palladium nanoparticles and glucose oxidase onto nafion-
solubilized carbon nanotube electrode. Biosensors and Bioelectronics, 20(11):2341–2346,
2005.
[242] Qingmei Zhou, Qingji Xie, Yingchun Fu, Zhaohong Su, Xue’en Jia, and Shouzhuo Yao.
Electrodeposition of carbon nanotubes-chitosan-glucose oxidase biosensing compos-
ite films triggered by reduction of p-benzoquinone or h2o2. The Journal of Physical
Chemistry B, 111(38):11276–11284, 2007.
[243] Xi-Liang Luo, Jing-Juan Xu, Jin-Li Wang, and Hong-Yuan Chen. Electrochemically
deposited nanocomposite of chitosan and carbon nanotubes for biosensor application.
Chem. Commun., (16):2169–2171, 2005.
[244] Sudheesh K Shukla, Ajay K Mishra, Omotayo A Arotiba, and Bhekie B Mamba. Chitosan-
based nanomaterials: A state-of-the-art review. International journal of biological
macromolecules, 59:46–58, 2013.
[245] Li-Qun Wu, Anand P Gadre, Hyunmin Yi, Mark J Kastantin, Gary W Rubloff, William E
Bentley, Gregory F Payne, and Reza Ghodssi. Voltage-dependent assembly of the polysac-
charide chitosan onto an electrode surface. Langmuir, 18(22):8620–8625, 2002.
[246] Rohan Fernandes, Li-Qun Wu, Tianhong Chen, Hyunmin Yi, Gary W Rubloff, Reza
Ghodssi, William E Bentley, and Gregory F Payne. Electrochemically induced deposition
150
Bibliography
of a polysaccharide hydrogel onto a patterned surface. Langmuir, 19(10):4058–4062,
2003.
[247] Lei Qian and Xiurong Yang. Composite film of carbon nanotubes and chitosan for
preparation of amperometric hydrogen peroxide biosensor. Talanta, 68(3):721–727, 1
2006.
[248] Andrea Cavallini, Giovanni De Micheli, and Sandro Carrara. Comparison of three meth-
ods of biocompatible multi-walled carbon nanotubes confinement for the development
of implantable amperometric adenosine-5’-triphosphate biosensors. Sensor Letters,
9(5):1838–1844, 2011.
[249] Camilla Baj-Rossi, Giovanni De Micheli, and Sandro Carrara. Electrochemical biochip
for applications to wireless and batteryless monitoring of free-moving mice. In Engineer-
ing in Medicine and Biology Society (EMBC), 2014 36th Annual International Conference
of the IEEE, pages 2020–2023. IEEE, 2014.
[250] Vanessa H Routh. Glucose-sensing neurons: are they physiologically relevant? Physiol-
ogy & behavior, 76(3):403–413, 2002.
[251] AM Oliveira Brett, TRA Macedo, D Raimundo, MH Marques, and SHP Serrano. Elec-
trochemical oxidation of mitoxantrone at a glassy carbon electrode. Analytica chimica
acta, 385(1):401–408, 1999.
[252] MD Rawlins, DB Henderson, and AR Hijab. Pharmacokinetics of paracetamol (ac-
etaminophen) after intravenous and oral administration. European journal of clinical
pharmacology, 11(4):283–286, 1977.
[253] Kenneth L Muldrew, Laura P James, Leslie Coop, Sandra S McCullough, Howard P
Hendrickson, Jack A Hinson, and Philip R Mayeux. Determination of acetaminophen-
protein adducts in mouse liver and serum and human serum after hepatotoxic doses of
acetaminophen using high-performance liquid chromatography with electrochemical
detection. Drug Metabolism and Disposition, 30(4):446–451, 2002.
[254] Mary M. Walczak, Deborah A. Dryer, Dana D. Jacobson, Michele G. Foss, and Nolan T.
Flynn. ph dependent redox couple: An illustration of the nernst equation. Journal of
Chemical Education, 74(10):1195, 2014/11/02 1997.
[255] P Duroux, C Emde, P Bauerfeind, C Francis, A Grisel, L Thybaud, D Arstrong, C De-
peursinge, and A L Blum. The ion sensitive field effect transistor (isfet) ph electrode: a
new sensor for long term ambulatory ph monitoring. Gut, 32(3):240–245, 03 1991.
[256] Gerald Gerlach, Margarita Guenther, Joerg Sorber, Gunnar Suchaneck, Karl-Friedrich
Arndt, and Andreas Richter. Chemical and ph sensors based on the swelling behavior of
hydrogels. Sensors and Actuators B: Chemical, 111:555–561, 2005.
151
Bibliography
[257] Afsaneh Safavi and Mozhgan Bagheri. Novel optical ph sensor for high and low ph
values. Sensors and Actuators B: Chemical, 90(1):143–150, 2003.
[258] Patrick J Kinlen, John E Heider, and David E Hubbard. A solid-state ph sensor based on
a nafion-coated iridium oxide indicator electrode and a polymer-based silver chloride
reference electrode. Sensors and Actuators B: Chemical, 22(1):13–25, 1994.
[259] Wen-Ding Huang, Hung Cao, Sanchali Deb, Mu Chiao, and J. C. Chiao. A flexible ph
sensor based on the iridium oxide sensing film. Sensors and Actuators A: Physical,
169(1):1–11, 9 2011.
[260] Jongmin Noh, Sejin Park, Hankil Boo, Hee Chan Kim, and Taek Dong Chung.
Nanoporous platinum solid-state reference electrode with layer-by-layer polyelectrolyte
junction for ph sensing chip. Lab on a Chip, 11(4):664–671, 2011.
[261] Sayed AM Marzouk, Stefan Ufer, Richard P Buck, Timothy A Johnson, Larry A Dun-
lap, and Wayne E Cascio. Electrodeposited iridium oxide ph electrode for measure-
ment of extracellular myocardial acidosis during acute ischemia. Analytical chemistry,
70(23):5054–5061, 1998.
[262] Elisabet Prats-Alfonso, Llibertat Abad, Nieves Casañ-Pastor, Javier Gonzalo-Ruiz, and
Eva Baldrich. Iridium oxide ph sensor for biomedical applications. case urea–urease in
real urine samples. Biosensors and Bioelectronics, 39(1):163–169, 2013.
[263] JD Klein, SL Clauson, and SF Cogan. Morphology and charge capacity of sputtered
iridium oxide films. Journal of Vacuum Science & Technology A, 7(5):3043–3047, 1989.
[264] Sayed AM Marzouk. Improved electrodeposited iridium oxide ph sensor fabricated on
etched titanium substrates. Analytical chemistry, 75(6):1258–1266, 2003.
[265] I. D. Belova, T. V. Varlamova, B. Sh. Galyamov, Yu. E. Roginskaya, R. R. Shifrina, S. G.
Prutchenko, G. I. Kaplan, and M. A. Sevostyanov. The composition, structure and
electronic properties of thermally prepared iridium dioxide films. Materials Chemistry
and Physics, 20(1):39–64, 8 1988.
[266] Min Wang, Sheng Yao, and Marc Madou. A long-term stable iridium oxide ph electrode.
Sensors and Actuators B: Chemical, 81(2–3):313–315, 1 2002.
[267] Olga Korostynska, Khalil Arshak, Edric Gill, and Arousian Arshak. Review paper: ma-
terials and techniques for in vivo ph monitoring. Sensors Journal, IEEE, 8(1):20–28,
2008.
[268] Igor A Ges, Borislav L Ivanov, Andreas A Werdich, and Franz J Baudenbacher. Differential
ph measurements of metabolic cellular activity in nl culture volumes using microfabri-
cated iridium oxide electrodes. Biosensors and Bioelectronics, 22(7):1303–1310, 2007.
152
Bibliography
[269] Atanu Das, Danny Hsu Ko, Chia-Hsin Chen, Liann-Be Chang, Chao-Sung Lai, Fu-Chuan
Chu, Lee Chow, and Ray-Ming Lin. Highly sensitive palladium oxide thin film extended
gate fets as ph sensor. Sensors and Actuators B: Chemical, 205(0):199–205, 12 2014.
[270] Anette Simonis, Hans Lüth, Joseph Wang, and J Schöning. Strategies of miniaturised
reference electrodes integrated in a silicon based “one chip”ph sensor. Sensors, 3(9):330–
339, 2003.
[271] PRN Childs, JR Greenwood, and CA Long. Review of temperature measurement. Review
of scientific instruments, 71(8):2959–2978, 2000.
[272] Haixiao Liu, Weiqiang Sun, Qing Chen, and Shengyong Xu. Thin-film thermocou-
ple array for time-resolved local temperature mapping. Electron Device Letters, IEEE,
32(11):1606–1608, 2011.
[273] Jong-Jin Park and Minoru Taya. Design of micro-temperature sensor array with thin
film thermocouples. Journal of Electronic Packaging, 127(3):286–289, 2005.
[274] F. Grassi and T. Rezzonico Jost. Private communication. Technical report, Institute for
Research in Biomedicine (IRB), Bellinzona, 2014.
[275] Jack A Hinson, Sherryll L Pike, Neil R Pumford, and Philip R Mayeux. Nitrotyrosine-
protein adducts in hepatic centrilobular areas following toxic doses of acetaminophen
in mice. Chemical research in toxicology, 11(6):604–607, 1998.
[276] Yasuhiro Masubuchi, Chieko Suda, and Toshiharu Horie. Involvement of mitochondrial
permeability transition in acetaminophen-induced liver injury in mice. Journal of
hepatology, 42(1):110–116, 2005.
[277] Handani Winarta, Xiaohua Cai, Fung Seto, and Chung Chang Young. Disposable sensor
and method of making, 09 2001.
[278] Chuanxin He, Jianhong Liu, Qianling Zhang, and Chi Wu. A novel stable ampero-
metric glucose biosensor based on the adsorption of glucose oxidase on poly(methyl
methacrylate)–bovine serum albumin core–shell nanoparticles. Sensors and Actuators
B: Chemical, 166–167(0):802–808, 5 2012.
[279] Cristina Boero, Sandro Carrara, and Giovanni De Micheli. Long-term biosensors for
metabolite monitoring by using carbon nanotubes. Sensors & Transducers Journal,
125(EPFL-ARTICLE-183116):229–237, 2011.
[280] Peng Si, Palanisamy Kannan, Longhua Guo, Hungsun Son, and Dong-Hwan Kim. Highly
stable and sensitive glucose biosensor based on covalently assembled high density au
nanostructures. Biosensors and Bioelectronics, 26(9):3845–3851, 5 2011.
[281] Mehmet Senel and Cevdet Nergiz. Novel amperometric glucose biosensor based on
covalent immobilization of glucose oxidase on poly(pyrrole propylic acid)/au nanocom-
posite. Current Applied Physics, 12(4):1118–1124, 7 2012.
153
Bibliography
[282] Lu Fang, Bo Liang, Guang Yang, Yichuan Hu, Qin Zhu, and Xuesong Ye. Study of
glucose biosensor lifetime improvement in 37 c serum based on pani enzyme
immobilization and plga biodegradable membrane. Biosensors and Bioelectronics,
56(0):91–96, 6 2014.
[283] Andrea Cavallini, T Rezzonico Jost, S Ghoreishizadeh, Jacopo Olivo, M Op de Beeck, Ben-
jamin Gorissen, Fabio Grassi, Giovanni De Micheli, and Sandro Carrara. A subcutaneous
biochip for remote monitoring of human metabolism: packaging and biocompatibility
assessment. 2014.
[284] Santhisagar Vaddiraju, Ioannis Tomazos, Diane J Burgess, Faquir C Jain, and Fotios
Papadimitrakopoulos. Emerging synergy between nanotechnology and implantable
biosensors: a review. Biosensors and Bioelectronics, 25(7):1553–1565, 2010.
[285] EG Kilinc and C Dehollain. Intelligent remote powering. EPO Patent, 12180919, 2013.
[286] E Kilinc, Gilbert Conus, Chloe Weber, Basile Kawkabani, Franco Maloberti, and Cather-
ine Dehollain. A system for wireless power transfer of micro-systems in-vivo implantable
in freely moving animals. IEEE Sensors Journal, 2014.
[287] E. Kilinc, C. Baj-Rossi, S. Ghoreishizadeh, S. Riario, F. Stradolini, C. Boero, G. De Micheli,
F. Maloberti, S. Carrara, and C. Dehollain. A system for wireless power transfer and data
communication of implantable bio-sensors in small laboratory animals. IEEE Sensors
Journal, Submitted, 2015.
[288] Enver G Kilinc, Catherine Dehollain, and Franco Maloberti. Design and optimization of
inductive power transmission for implantable sensor system. Proc. SM2ACD’10, pages
1–5, 2010.
[289] Sara S Ghoreishizadeh, Camilla Baj-Rossi, Andrea Cavallini, Sandro Carrara, and Gio-
vanni De Micheli. An integrated control and readout circuit for implantable multi-target
electrochemical biosensing. IEEE Transaction on Biomedical Circuits and Systems,
Accepted for publication, 2014.
[290] Sara S Ghoreishizadeh, Sandro Carrara, and Giovanni De Micheli. A configurable ic to
contol, readout, and calibrate an array of biosensors. pages 1–4. IEEE, 2013.
[291] Jaeyoung Jung, Siqi Zhu, Peng Liu, Yi-Jan Chen, and Deukhyoun Heo. 22-pj/bit energy-
efficient 2.4-ghz implantable ook transmitter for wireless biotelemetry systems: In vitro
experiments using rat skin-mimic. Microwave Theory and Techniques, IEEE Transactions
on, 58(12):4102–4111, 2010.
[292] EG Kilinc, F Maloberti, and C Dehollain. Remotely powered telemetry system with
dynamic power-adaptation for freely moving animals. IEEE BioCAS 2012, pages 260–263,
2012.
154
Bibliography
[293] Enver G Kilinc, Mehrdad A Ghanad, Franco Maloberti, and Catherine Dehollain. Short
range remote powering of implanted electronics for freely moving animals. pages 1–4.
Ieee, 2013.
[294] Peng Cong, Wen H Ko, and Darrin J Young. Wireless batteryless implantable blood
pressure monitoring microsystem for small laboratory animals. Sensors Journal, IEEE,
10(2):243–254, 2010.
[295] I-Te Hsieh, Cheryl Ching-Hsiu Yang, Chun-Yu Chen, Guo-She Lee, Fu-Jen Kao, Kuan-
Liang Kuo, and Terry Bo-Jau Kuo. Uninterrupted wireless long-term recording of sleep
patterns and autonomic function in freely moving rats. Journal of Medical and Biological
Engineering, 33(1):79–86, 2013.
[296] S Mirbozorgi, H Bahrami, M Sawan, and B Gosselin. A smart multicoil inductively-
coupled array for wireless power transmission. IEEE Transaction on Industrial Electron-
ics, 61:6061 – 6070, 2014.
[297] S. Carrara, C. Baj-Rossi, S. Ghoreishizadeh, S. Riario, G. Surrel, F. Stradolini, C. Boero,
G. De Micheli, E. Kilinc, and C. Dehollain. Full system for translational studies of
personalized full system for translational studies of personalized medicine with free-
moving mice. In In Proceedings of the International Symposium on Circuits and Systems
(ISCAS), 2015.
[298] Jacopo Olivo, Lorenzo Foglia, Maria Antonietta Casulli, Cristina Boero, Sandro Carrara,
and Giovanni De Micheli. Glucose and lactate monitoring in cell cultures with a wireless
android interface. pages 400–403. IEEE, 2014.
[299] Sara Ghoreishizadeh, Enver G Kilinc, Camilla Baj-Rossi, Catherine Dehollain, Sandro
Carrara, and Giovanni De Micheli. An implantable bio-micro-system for drug monitor-
ing. pages 218–221. IEEE, 2013.
[300] Sandro Carrara, Camilla Baj-Rossi, Seyedeh Sara Ghoreishizadeh, Stefano Riario, Gré-
goire Surrel, Francesca Stradolini, Cristina Boero, Giovanni De Micheli, Enver G Kilinç,
and Catherine Dehollain. Full system for translational studies of personalized medicine
with free-moving mice. Number EPFL-CONF-204653, 2015.
[301] Dorte Bratbo Sørensen, Marianne Ravn Møller, and Laura Rønnow Larsen. The use of the
techniplast mouse house®in four strains of mice. Scandinavian Journal of Laboratory
Animal Science, 36(2):179–183, 2009.
[302] Muireann Coen, Eva M Lenz, Jeremy K Nicholson, Ian D Wilson, Francois Pognan, and
John C Lindon. An integrated metabonomic investigation of acetaminophen toxicity
in the mouse using nmr spectroscopy. Chemical research in toxicology, 16(3):295–303,
2003.
[303] Eda Cengiz and William V Tamborlane. A tale of two compartments: interstitial versus
blood glucose monitoring. Diabetes technology & therapeutics, 11(S1):S–11, 2009.
155
Bibliography
[304] J Mocak, AM Bond, S Mitchell, and G Scollary. A statistical overview of standard (iupac
and acs) and new procedures for determining the limits of detection and quantification:
application to voltammetric and stripping techniques. Pure and Applied Chemistry,
69(2):297–328, 1997.
[305] James N Miller and Jane Charlotte Miller. Statistics and chemometrics for analytical
chemistry. Pearson Education, sixth edition, 2005.
[306] A Gustavo González and M Ángeles Herrador. A practical guide to analytical method
validation, including measurement uncertainty and accuracy profiles. TrAC Trends in
Analytical Chemistry, 26(3):227–238, 2007.
[307] Gary L Long and James D Winefordner. Limit of detection. a closer look at the iupac
definition. Analytical Chemistry, 55(7):712A–724A, 1983.
[308] Teri Wang Odom, Jin-Lin Huang, Philip Kim, and Charles M. Lieber. Atomic structure
and electronic properties of single-walled carbon nanotubes. Nature, 391(6662):62–64,
01 1998.
[309] Erik T Thostenson, Zhifeng Ren, and Tsu-Wei Chou. Advances in the science and
technology of carbon nanotubes and their composites: a review. Composites Science
and Technology, 61(13):1899–1912, 10 2001.
[310] J JustináGooding. Demonstration of the importance of oxygenated species at the ends
of carbon nanotubes for their favourable electrochemical properties. Chemical commu-
nications, (7):842–844, 2005.
156

Camilla Baj-Rossi
Experience
Education Biomedical Engineering – Bachelor and Master degree
Politecnico di Torino
Italy
2005 – 2008 (B.Sc.) 2008 – 2010 (M.Sc.)
M.Sc. Grade: 110, summa cum laude (top grade in Italian universities)
Expertise: Biomaterials, Biomechanics, Nanobiotechnology
1 award: Optime Award for the "Best Young Graduates of the Year" provided by the Turin Industrial Society, September 2011
Ph.D. in Biosensors and Bioengineering Research Engineer
Innovation: In my thesis I designed and developed an innovative implantable chip for real-time drug monitoring in small animals. I optimized the combination of enzymes and nano-materials, to realize a new and low-cost working device. I realized an optimized biocompatible packaging with multiple functionalities. As a member of a multi-disciplinary team, comprising electronics and biologists, I contributed to the final realization and testing of the implantable chip.
Biomedical engineer
École Polytechnique Fédérale de Lausanne EPFL
Switzerland
February 2011 – August 2015 (expected)
Internship Research and Development Engineer
DI.PRO. s.a.s., San Mauro Torinese,
Italy
April 2008 – July 2008
Identify the surface modification techniques applicable to the polymeric film of an incisional hernia prosthesis to improve the biocompatibility. The research was applied to a new prototype of prosthesis to reduce the complications after the surgery.
Internship Research Trainee
Center for Biomedical Engineering, Harvard
Medical School
USA
February 2015 – May 2015
Development of a novel biosensor for the real-time monitoring of drugs and metabolites used for in-vitro toxicology tests on cell cultures.
Route De Chavannes 68 – 1007 Lausanne (CH)
+41 76 278 2134
Nationality: Italian Born: 1986
Residence permit (CH): B
i i
157

Technical Handling various chemical products: acid solutions, solvents, polymers, nanomaterials, metallic materials for electrochemistry, hazardous substance, biological materials
Chemical modification of surfaces: adsorption, electrodeposition and covalent binding of proteins, nanoparticles and DNA
Electrochemistry analysis techniques: amperometry and voltammetry
Signal processing, fitting and statistics of the electrochemical data
Experience in the basic microfabrication techniques in clean-room CAD design of implantable electrodes and polymeric molds (PDMS, Plexiglas)
Laboratory and electronic measurement instruments
Skills
Additional information • Strong experience in public presentations developed in several international
conferences and workshops.
• Skills in project management and team-leading, improved by attending different courses (team management, leadership, human resource management, finance and accounting), and by actively participating to the “Venture Challenge” course organized by Venturelab and EPFL “College of Management of Technology”. During this course I attended seminars, prepared business pitches and wrote a business plan that was positively evaluated by experts in entrepreneurship.
• I have been a committee member of the IEEE Student Branch at EPFL, helping in organizing several activities for students, related to technology and scientific events.
• In my free time I enjoy trying new sport activities, to challenge my endurance and be in peace with myself. I love tennis, skiing, swimming and dancing salsa.I have been playing volleyball at professional level for more than 15 years.
Software Programming Languages: C/C++
Tools: Matlab (numerical environment) – Comsol (numerical simulation) - Altair Hyperworks (finite elements simulator) - SolidWorks (CAD for 3D-design) - L-EDIT and K-layout (CAD) - Mathematica (Data analysis) - Igor Pro (data fitting)
Analysis – Nova, Versastudio
Graphic Tools: Image J – Adobe Illustrator
Linguistic Italian English French German
Mother tongue C1 B2 A1
i
158
Journals
Publications
S. Carrara, C. Baj-Rossi, S. S. Ghoreishizadeh, S. Riario, G. Surrel, F. Stradolini, C. Boero, G. De Micheli, E. Kilinc, C. Dehollain, Full System for Translational Studies of Personalized Medicine with Free-Moving Mice, In Proceedings of the International Symposium on Circuits and Systems (ISCAS), 2015
S.S. Ghoreishizadeh, C. Boero, A. Pullini, C. Baj-Rossi, S. Carrara, G. De Micheli, Sub-mW reconfigurable interface IC for electrochemical sensing, In Biomedical Circuits and Systems Conference (BioCAS), 2014 IEEE , vol., no., pp.232,235, Lausanne, Switzerland, October 2014
C. Baj-Rossi, G. De Micheli and S. Carrara, Electrochemical Biochip for Applications to Wireless and Batteryless Monitoring of Free-Moving Mice, 36th Annual International Conference of the IEEE Engineering in Medicine and Biology Society, pp. 2020-2023, August 2014
C. Baj-Rossi, E. G. Kilinc, S. S. Ghoreishizadeh, D. Casarino, T. Rezzonico Jost, C. Dehollain, F. Grassi, L. Pastorino, G. De Micheli and S. Carrara, Fabrication and Packaging of a Fully Implantable Biosensor Array, In Biomedical Circuits and Systems Conference (BioCAS), (pp. 218-221), IEEE, Rotterdam, The Netherlands, October 2013
S.S. Ghoreishizadeh, E.G. Kilinc, C. Baj-Rossi, C. Dehollain, S. Carrara, G. De Micheli, An implantable bio-micro-system for drug monitoring, In Biomedical Circuits and Systems Conference (BioCAS), (pp. 218-221), IEEE, Rotterdam, The Netherlands, October 2013
A. Cavallini, C. Baj-Rossi, S.S. Ghoreishizadeh, G. De Micheli, S. Carrara, Design, fabrication, and test of a sensor array for perspective biosensing in chronic pathologies, In Biomedical Circuits and Systems Conference (BioCAS), 2012 IEEE (pp. 124-127). IEEE, Hsinchu, Taiwan, Dicember 2012
C. Baj-Rossi, C. Müller, U. von Mandach, G. De Micheli and S. Carrara, Faradic peaks enhanced by carbon nanotubes in microsomal cytochrome P450 electrodes, Electroanalysis, accepted for publication, 2015
C. Baj-Rossi, E. G. Kilinc, S. S. Ghoreishizadeh, D. Casarino, T. Rezzonico Jost, C. Dehollain, F. Grassi, L. Pastorino, G. De Micheli and S. Carrara, Full Fabrication and Packaging of an Implantable Multi-Panel Device for Monitoring of Metabolites in Small Animals, IEEE Transaction on Biomedical Circuits and Systems, vol. 8, no. 5, October 2014
C. Baj-Rossi , T. Rezzonico Jost, A. Cavallini, F. Grassi, G. De Micheli, and S. Carrara, Continuous monitoring of Naproxen by a cytochrome P450-based electrochemical sensor, Biosensors and Bioelectronics, vol. 53, p. 283-287, 2014
S. S. Ghoreishizadeh, C. Baj-Rossi , A. Cavallini, S. Carrara, and G. De Micheli, An Integrated Control and Readout Circuit for Implantable Multi-Target Electrochemical Biosensing , IEEE Transaction on Biomedical Circuits and Systems, vol. 8, num. 6, p. 891-898, 2014
S. Carrara, C. Baj-Rossi , C. Boero and G. De Micheli, Does Carbon Nanotube contribute to Electrochemical Bio-Sensing? , Electrochimica Acta vol. 128, p. 102-112, 2014
F. Puppo, A. Dave, M.A. Doucey, D. Sacchetto, C. Baj-Rossi, Y. Leblebici, G. De Micheli, S. Carrara, Memristive biosensors under varying humidity conditions, NanoBioscience, IEEE Transactions on, 13 (1), 19-30, 2014
C. Baj-Rossi , G. De Micheli and S. Carrara, A Linear Approach to Multi-Panel Sensing in Personalized Therapy for Cancer Treatment, IEEE Sensors Journal, vol. 13, num. 12, p. 4860-4865, 2013
C. Baj-Rossi , G. De Micheli and S. Carrara, Electrochemical Detection of Anti-Breast-Cancer Agents in Human Serum by Cytochrome P450-Coated Carbon Nanotubes, Sensors, vol. 12, num. 5, p. 6520-6537, 2012
S. Carrara, D. Sacchetto, M.A. Doucey, C. Baj-Rossi, G. De Micheli, Y. Leblebici, Memristive-biosensors: A new detection method by using nanofabricated memristors, Sensors and Actuators B: Chemical, 171, 449-457, 2012
Conferences
159

C. Baj-Rossi, G. De Micheli and S. Carrara, P450-Based Nano-Bio-Sensors for Personalized Medicine, Published in: Biosensors for Health, Environment and Biosecurity / Book 1 (ISBN: 978-953-307-328-6), Intech , 2011
Book chapter
Oral presentations and seminars “Implantable Device for Monitoring Drugs and Metabolites in Small Animals for Applications in Personalized Medicine”, Research Centre and Polystim Neurotech Lab, Polytechnique Montreal, April 13th 2015
“Implantable Device for Monitoring Drugs and Metabolites in Small Animals for Applications in Personalized Medicine”, University of Massachusetts Amherst, April 24th 2015 ”Electrochemical platform based on cytochrome P450 for diagnostic applications in personalized medicine”, Nano-Bio Technologies for Lab-on-Chip Workshop, April 25th 2013, EPFL, Integrated System Center
”Fabrication and Packaging of a Fully Implantable Biosensor Array”, Nano-Bio Technologies for Lab-on-Chip Workshop , October 30th – November 2nd 2013, IEEE Biomedical Circuits and Systems Conference (BioCAS 2013), Rotterdam, The Netherlands
”Fabrication and Packaging of an Implantable Biosensor Array for Drug Monitoring”, Microsystems and Microelectronics Doctoral School Research Day , EPFL, December 3rd 2013
”P450 Based Nano-chip platform for Diagnostic Applications in Personalized Therapy”, Surface Treatments and Biochip Sensors Workshop , July 1st 2011, EPFL, Integrated System Center
Teaching Teaching assistant: Master Course “Bio-nano-chip design”, Electrical and Electronics Engineering, 2014-2015, Master Semester 1
S.S. Ghoreishizadeh, C. Baj-Rossi, S. Carrara, G. Micheli, Nano-sensor and circuit design for anti-cancer drug detection, In Life Science Systems and Applications Workshop (LiSSA), 2011 IEEE/NIH (pp. 28-33, IEEE, April 2011
160