the 1919-1920eruption of mauna iki, kilauea · the 1919-1920eruption of mauna iki, kilauea:...
TRANSCRIPT
Bull Volcanol (1993) 55: 190-203
Volcanology© Springer-Verlag 1993
The 1919-1920 eruption of Mauna Iki, Kilauea:chronology, geologic mapping, and magma transport mechanismsScott K Rowland and Duncan C Munro
Planetary Geosciences, Dept. of Geology and Geophysics, School of Ocean and Earth Science and Technology,2525 Correa Rd. Honolulu, Hawaii 96822
Received November 11, 1991/Accepted July 9,1992
Abstract. Utilizing historical accounts, field mapping,and photogeology, this paper presents a chronology of,and an analysis of magma transport during, the December 1919 to August 1920 satellitic shield eruption ofMauna Iki on the SW rift zone of Kilauea Volcano, Hawaii. The eruption can be divided into four stages basedon the nature of the eruptive activity. Stage 1 consistedof the shallow injection of a dike from the summit region to the eventual eruption site - 10 km downrift.During stage 2, a low ridge of pahoehoe formed in thevent area; later a large a'a flow broke out of this ridgeand flowed - 8.5 km SWat an average flow front velocity of 0.5 km/day. The eruption continued until midAugust producing almost exclusively pahoehoe, first asgas-rich overflows from a lava pond (stage 3), and lateras denser tube-fed lava (stage 4) that reached almost8 km from the vent at an average flow-front velocity of0.1 km/day. Magma transport during the Mauna Ikieruption is examined using three criteria: (1) eruptioncharacteristics and volumetric flow rates; (2) changes inthe surface height of the Halemaumau lava lake; and (3)tilt measurements made at the summit of Kilauea. Wefind good correlation between Halemaumau lake activity and the eruptive stages. Additionally, the E-W component of summit tilt tended to mimic the lake activity.The N-S component, however, did not. Multiple storagezones in the shallow summit region probably accountedfor the decoupling of E-W and N-S tilt components.Analysis of these criteria shows that at different timesduring the eruption, magma was either emplaced intothe volcano without eruption, hydraulically drainedfrom Halemaumau to Mauna Iki, or fed at steady-stateconditions from summit storage to Mauna Iki. Volumecalculations indicate that the supply rate to Kilauea during the eruption was around 3 m 3Is, similar to that calculated during the Mauna Ulu and Kupaianaha shieldbuilding eruptions, and consistent with previously determined values of long-term supply to Kilauea.
Key words: Lava lakes - dikes - plumbing - tilt - eruptive characteristics - gas codent - satellitic shield
Introduction
Satellitic shield eruptions on Kilauea contribute significantly to the growth of the volcano and they are closelyassociated with lava tube systems and long-durationeruptions; > 65070 of the present Kilauea surface is covered with tube-fed pahoehoe (Holcomb 1987). Of the 15satellitic shields found on Kilauea (Holcomb 1987),three formed in post-contact times: (1) Mauna Iki in1919-1920 (e.g. Jaggar 1919c, 1920a-f; Finch 1920a-c);(2) Mauna Ulu in 1969-1974 (e.g. Swanson et al. 1979;Tilling et al. 1987); and (3) Kupaianaha in 1986-1992(e.g. Ulrich et al. 1987; Heliker and Wright 1991a,1991b). In general, the three eruptions can be characterized by a brief a'a-producing stage at their outset followed by a longer-duration (months to years) tube-fedpahoehoe-producing stage. However, in detail eacheruption differs with regard to the relative volumes ofa'a and pahoehoe and the nature of their eruption, aswell as the overall eruption duration.
Near-surface transport of magma at Hawaiian volcanoes has been the subject of intense study (e.g. reviewby Peterson and Moore 1987). At Kilauea, the frequent,readily observable activity and high degree of instrumentation have resulted in the determination of the location of major magma conduits and storage regions,and the ability of real-time tracking of magma movement. Geophysical modelling, theoretical considerations, and in particular seismic data (e.g. Ryan et al.1981; Hill and Zucca 1987; Rubin and Pollard 1987;Klein et al. 1987; Wilson and Head 1988; Delaney et al.1990) all provided contraints on the depths and locations of sub-surface magma storage and transport features.
These studies have shown that there are two maincomponents of magma storage and transport at Kilauea.A central magma chamber extends from - 2 to - 9 kmbelow the summit with a near-vertical conduit connecting it with the upper mantle (e.g. Fig. 6 of Ryan et al.1981; Klein et al. 1987). The chamber is probably a series of smaller interconnected spaces rather than a singlelarge void (Fiske and Kinoshita 1969). Two rift zones ex-
------PUU.KOU
tend from the magma chamber to the E and SW. Theseare the preferred directions of sub-horizontal magma excursions (dike propagation) that result in intrusionsand/or eruptions. Magma may also travel verticallyfrom the magma chamber to erupt at the summit. TheMauna Iki eruption took place near the end of (at least)96 years of sustained activity in the summit caldera (e.g.Jaggar 1947).
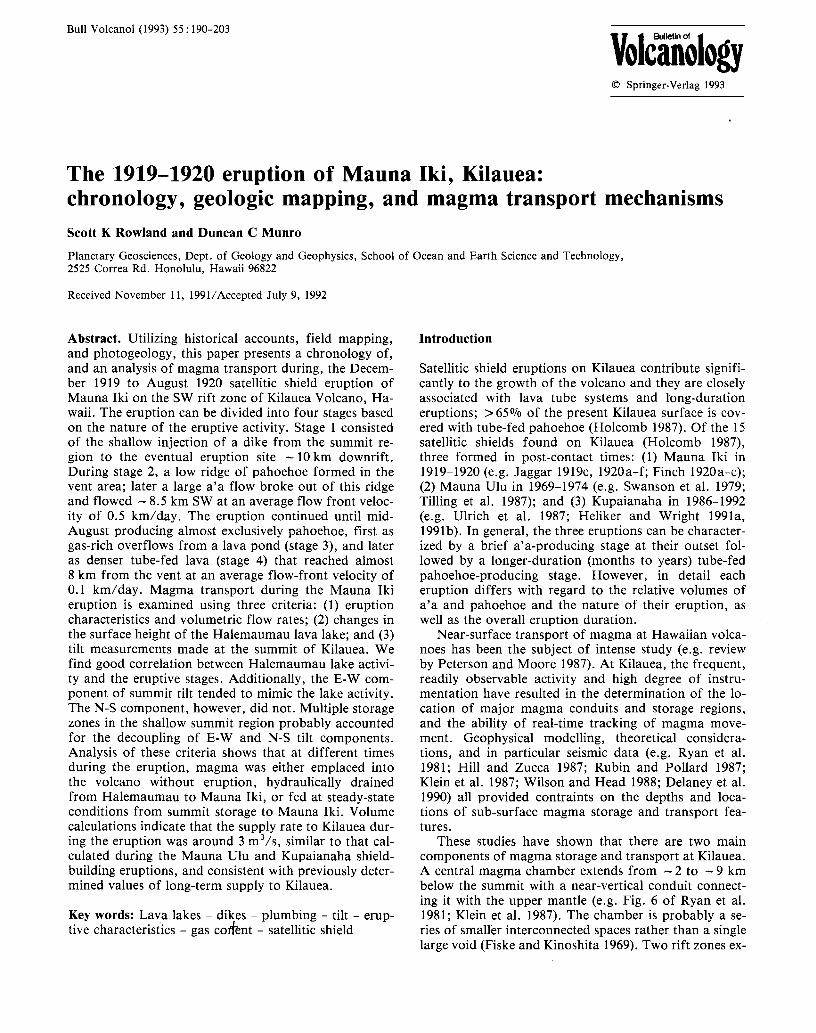
Halemaumau is a circular pit crater - 1 km across located in the SW part of Kilauea caldera (Fig. 1). A lavalake in Halemaumau was first observed by Westernersin 1823 (e.g. Peterson and Moore 1987). Until late 1919,the lake maintained a relatively stable level a few tens ofmeters below the rim of Halemaumau (Jaggar 1947).For long periods of time the lake would be perched afew meters above the surrounding caldera floor, con-
191
Fig. 1. Location map showing theproducts of the Mauna Iki eruptionas well as geographical features mentioned in the chronology. Flow outlines are from Holcomb (1987) and CNeal, personal communication(1992). Contour interval 40 m U andW indicate locations of Uwekahunaand Whitney vaults (see text). Insetshows the location of Mauna Iki onKilauea volcano (rift zones dashed;contour interval 500 m)
tained by levees constructed of overflows. Very detailedobservations of the Halemaumau lake were made byThomas Jaggar once he had established the HawaiianVolcano Observatory in 1912, including measurementsof the fluctuations in lake level, the forming of subsidiary pools and the motions of the 'crags' that separatedthem, as well as observations of the amount and natureof fume being emitted. Observations of the relationshipbetween activity at the summit of Kilauea and downriftat Mauna Iki provided much of the qualitative supportfor early ideas of hydraulic connections between thesummit and rift zones of Kilauea (e.g. Jaggar 1920b).Jaggar also made many inferences about how the activity ofthe Halemaumau lake responded to eruptive activity at Mauna Loa. We will not discuss these here, exceptto note that any proposed shallow fluid connection be-
192
tween Mauna Loa and Kilauea is not consistent withchemical (Wright 1971) or seismic (Klein et al. 1987)data (but see Rhodes 1989 for evidence of a possible prehistoric, deep connection).
Eruptive products and features
The Mauna Iki eruption (Fig. I) produced a small flowfield of vesicular pahoehoe in the SW portion of the Kilauea caldera, a set of fissures extending discontinuouslyfrom the caldera 13 km down the SW rift, a small patchof lava 7 km down the rift, the main Mauna Iki shield(centered 9.5 km from the caldera rim) and associatedflows, a smaller shield (here termed the downrift shield)
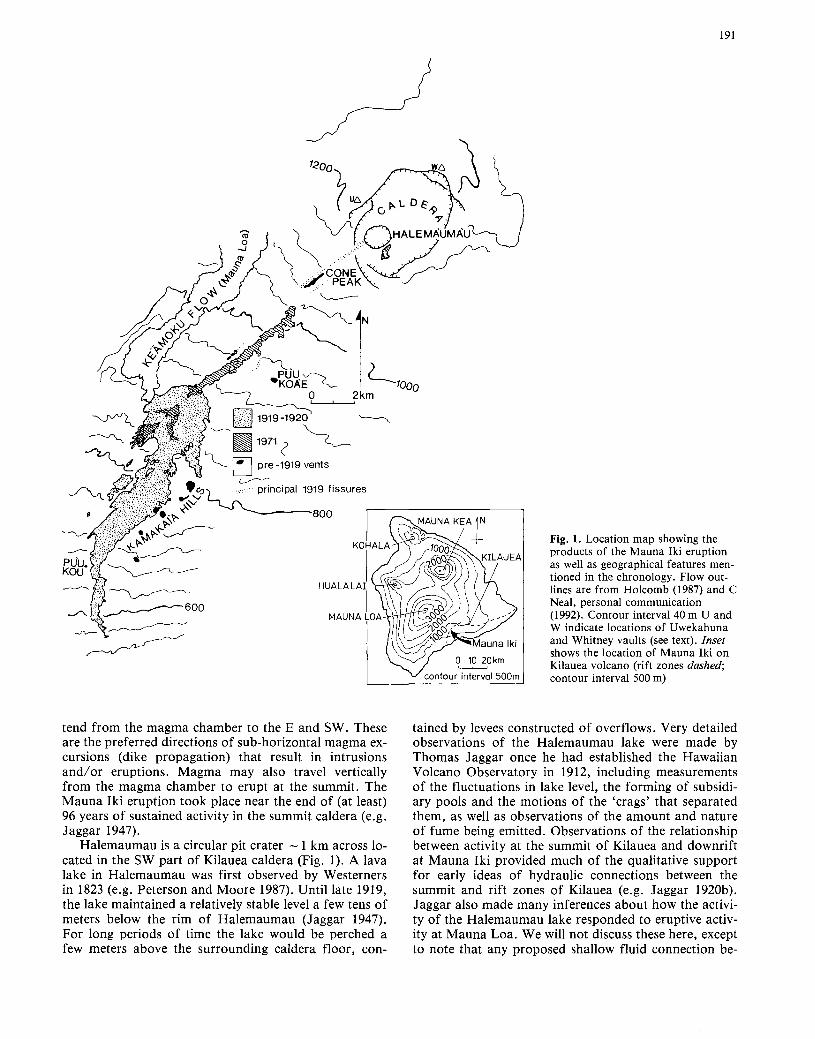
3 km farther to the SW, and three smaller patches of pahoehoe (C Neal, personal communication) between 11and 15 km down the rift zone. Most of the intra-calderalava was buried by eruptions in 1921 (Peterson 1967;Walker 1967; Holcomb 1987). The Mauna Iki shield(Figs. 2 and 3) is about 3 km long in a SW-NE (alongrift) direction, and 2 km wide. The NE end of the shieldis the highest part at 36 m above the surrounding area. Ithas a relatively flat surface of vesicular pahoehoe, collapse pits, and lava tube skylights.
Small flows of a'a and toothpaste lava (e.g. Rowlandand Walker 1987) are also found on the main shield.The largest of these flowed down the W flank, and is- 1 km long by 300 m wide. A second such flow camefrom an area of uplifted blocks near the summit of the
Fig. 2. Mosaic of air photographs showing the Mauna Iki shield and lava flows. (Agricultural Stabilization and Conservation Servicephotos EKL-500-39 to 44, taken 29 December 1964)
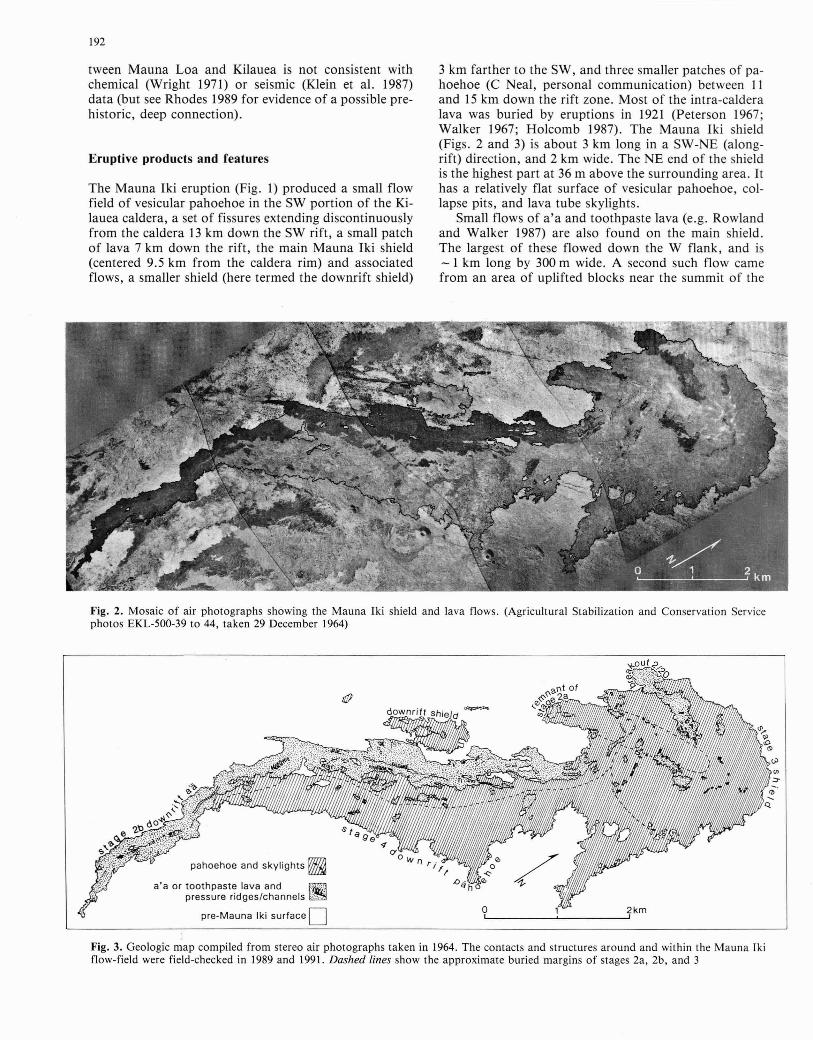
pahoehoe and skylights~
a'a or toothpaste lava and ~
pressure ridges/channels~
pre-Mauna Iki surface 0 o 2kmL..I ~ ...J'
en::r
Fig. 3. Geologic map compiled from stereo air photographs taken in 1964. The contacts and structures around and within the Mauna Ikiflow-field were field-checked in 1989 and 1991. Dashed lines show the approximate buried margins of stages 2a, 2b, and 3
shield, and flowed to the S. These were breakouts oflava that had been stored in pockets within the shieldand had cooled and lost gas during this storage (Jaggar1920a). A'a flows such as these were observed on bothMauna VIu (Peterson and Tilling 1980) and Kupaianaha(Heliker and Wright 1991b).
Issuing from near the SW edge of the shield is thedownrift a'a flow (Figs. 2 and 3). This flow began forming shortly after the onset of eruptive activity at theMauna Iki site and was active for a period of -18 days.The downrift pahoehoe flow was fed by lava tubes thatdeveloped during the final stage of the Mauna Iki eruption. Active tube skylights were observed only near thesummit of the Mauna Iki shield, and these skylights arepreserved today as elongate rubble-filled depressions 3050 m long by - 20 m wide (Figs. 2 and 3). The pahoehoeflow parallels and overlaps the E margin of the downrifta'a flow for a distance of about 8 km.
Tilt data
Most of our inferences about sub-surface magma transport come from an analysis of summit tilt measurementspresented in Jaggar and Finch (1929; see Appendix) andrecently replotted by the Hawaiian Volcano Observatory(courtesy of John Dvorak). The seismometer location atthe Whitney vault (Fig. 1) meant that Halemaumau wasat an azimuth of 2300
• NS changes in tilt were considered by Jaggar and Finch (1929) to be due to the rise andfall of lava in Halemaumau and EW tilt changes to activity of Mauna Loa, the summit of which is 35 kmaway at an azimuth of 285 0
• It is now known that theamount of inflation at Mauna Loa required to affect tiltat Kilauea is too large to be reasonable (J Dvorak and AOkamura, personal communication).
Fiske and Kinoshita (1969) attributed migrating centers of deformation to the sequential filling or emptyingof interconnected voids that constitute the shallow storage system beneath the Kilauea summit. During theMauna Iki eruption EW tilt usually mimicked activity atHalemaumau (inflation during rise in lake level and viceversa), whereas NS tilt usually did not. We propose thatthis decoupling of tilt responses occurred because therewere (at least) two voids acting as centers of deformation during the Mauna Iki eruption. Because EW tiltand Halemaumau activity were often in concert, we suggest that one of these voids was located roughly due Wfrom the Whitney vault, that it was directly connected tothe lake, and that it was shallow(?). We further suggestthat the NS tilt component was instead dominated bychanges to a (deeper?) storage zone less-directly connected to Halemaumau, and S of the Whitney vault.The 'shallow' and 'deep' terms for these two storagezones are very poorly constrained; both are proposed tobe parts of the summit magma chamber system 2-9 kmbelow the caldera.
Volumes of lava flowing into or out of the summitmagma chamber system have been estimated from thecomparison of erupted lava volumes and summit tiltmeasurements. Conversion factors range from 0.33 to
193
0.45 X 10⁶ m 3 of magma per microradian of tilt for datafrom the Uwekahuna vault (Dzurisin et al. 1984; Dvorak and Okamura 1987, respectively). Dvorak (1992)presents a conversion factor of 1x 10⁶ m 3 of magmalmicroradian for Whitney vault tilt data, and we have adopted this value for our volume calculations (see Appendix). We made these calculations only for the NS component of tilt which, as noted above, we suggest was responding to a deformation center less affected by surface activity. Without knowing exactly where it was, wehave no basis for making any angular corrections hencethe tilt-derived volumes are constraints only.
Tilt data have also been used to calculate long-termsupply rates from the mantle (e.g. Dzurisin et al. 1980;Duffield et al. 1982; Dvorak and Okamura 1987). Riftzone eruptions at Kilauea have either been at high-discharge rates (30-400 m 3Is) associated with rapid tilt response indicating deflation of the summit magma chamber system, or at low and constant discharge rates (25 m 3 Is) associated with no clear tilt response. In the latter case, input and output to and from the summit magma chamber system are essentially equal (e.g Swanson1972; Swanson et al. 1979; Tilling et al. 1987) or possibly the summit magma chamber system is bypassed altogether (Ryan et al. 1981).
We have adopted the commonly accepted value of25070 vesicularity of erupted lava compared to sub-surface magma (e.g. Wolfe et al. 1987). Beyond this, themargin of error in the various volume calculations (seeAppendix) is difficult to determine. We estimate thatthey are accurate to within ± 10% for the lava flows and± 20% for those determined from tilt measurements.
Eruption chronology
We divided the eruption into stages based on the natureof the surface eruptive activity, and in the chronologythat follows, we describe that activity along with Halemaumau lake depth changes and summit tilt measurements prior to, during, and after the Mauna Iki eruptionto try and characterize both the surface and sub-surfaceactivity. Two additional techniques routinely used tocharacterize an ongoing eruption are seismology andchemical analysis of the lavas. There was one seismometer operating during the Mauna Iki eruption (at theWhitney vault) and we have dealt with the data onlyqualitatively. A few chemical analyses of Mauna Iki lavas collected well after the eruption show essentially nochemical variation between samples (Wright 1971) eventhough they consist of products of different stages.
Accounts of the eruption and Halemaumau lake leveldata come from the monthly Bulletins of the HawaiianVolcano Observatory for November 1919 through September 1920 (Jaggar 1919b, 1920a-f; Finch 1920a-c;Bevens et al. 1988 v. II pp. 1045-1216). Brief summariesof the eruption can be found in Jaggar (1930, 1947). Theoriginal descriptions are rich in detail; this paper attempts to collect them into a single account of surfaceand sub-surface· activity, and present maps of featuresassociated with the eruption. Aspects of the chronology
194
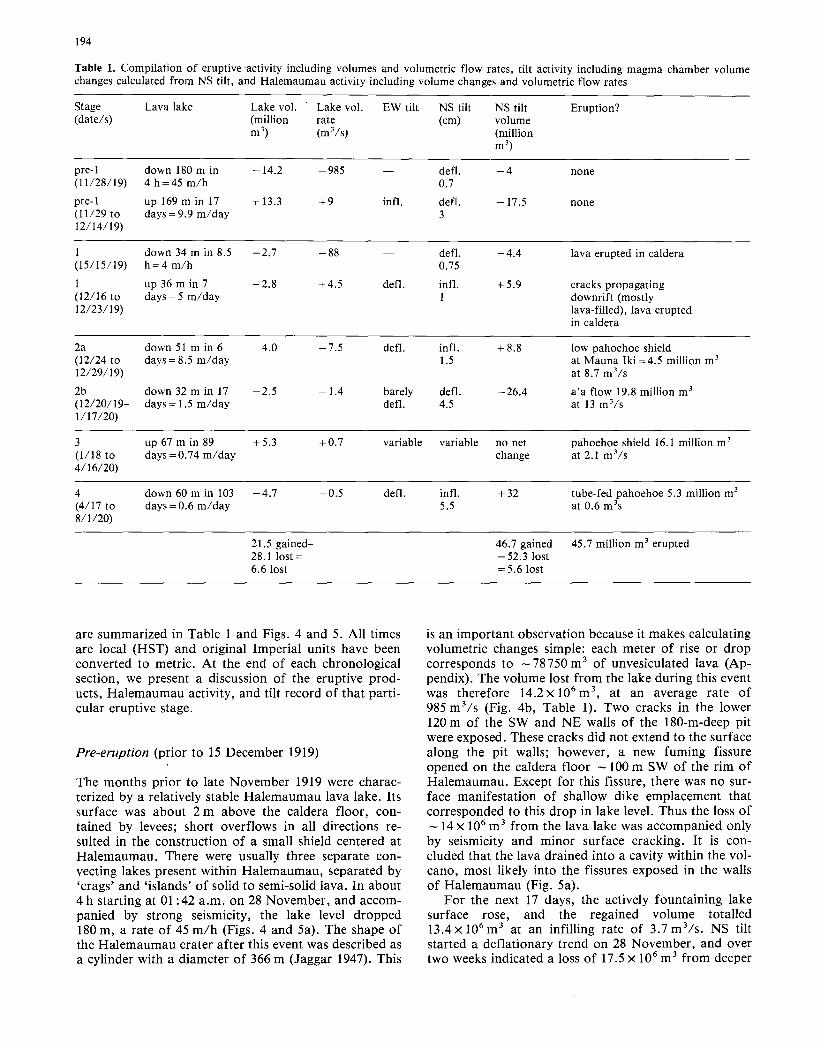
Table 1. Compilation of eruptive 'activity including volumes and volumetric flow rates, tilt activity including magma chamber volumechanges calculated from NS tilt, and Halemaumau activity including volume changes and volumetric flow rates
Stage Lava lake Lake vol. Lake vol. EW tilt NS tilt NS tilt Eruption?(date/s) (million rate (cm) volume
m 3) (m 3/s) (million
m 3)
pre-l down 180 m in -14.2 -985 defl. -4 none(11/28/19) 4 h=45 m/h 0.7
pre-l up169min17 + 13.3 +9 infl. defl. -17.5 none(11/29 to days = 9.9 m/day 312/14/19)
1 down 34 m in 8.5 -2.7 -88 defl. -4.4 lava erupted in caldera(15/15/19) h=4 m/h 0.75
1 up 36 m in 7 +2.8 +4.5 defl. infl. +5.9 cracks propagating(12/16 to days = 5 m/day 1 downrift (mostly12/23/19) lava-filled), lava erupted
in caldera
2a down 51 min 6 -4.0 -7.5 defl. infl. +8.8 low pahoehoe shield(12/24 to days = 8.5 m/day 1.5 at Mauna Iki = 4.5 million m 3
12/29/19) at 8.7 m 3/s
2b down 32 m in 17 -2.5 -1.4 barely defl. -26.4 a'a flow 19.8 million m 3
(12/20/19- days = 1.5 m/day defl. 4.5 at 13 m 3/s1/17/20)
3 up 67 m in 89 +5.3 +0.7 variable variable no net pahoehoe shield 16.1 million m 3
(1/18 to days =0.74 m/day change at 2.1 m 3/s4/16/20)
4 down 60 m in 103 -4.7 -0.5 defl. infl. +32 tube-fed pahoehoe 5.3 million m3
(4/17 to days = 0.6 m/day 5.5 at 0.6 m 3s8/1/20)
21.5 gained- 46.7 gained 45.7 million m 3 erupted28.1 lost = -52.3 lost6.6 lost = 5.6 lost
are summarized in Table 1 and Figs. 4 and 5. All timesare local (HST) and original Imperial units have beenconverted to metric. At the end of each chronologicalsection, we present a discussion of the eruptive products, Halemaumau activity, and tilt record of that particular eruptive stage.
Pre-eruption (prior to 15 December 1919)
The months prior to late November 1919 were characterized by a relatively stable Halemaumau lava lake. Itssurface was about 2 m above the caldera floor, contained by levees; short overflows in all directions resulted in the construction of a small shield centered atHalemaumau. There were usually three separate convecting lakes present within Halemaumau, separated by'crags' and 'islands' of solid to semi-solid lava. In about4 h starting at 01 :42 a.m. on 28 November, and accompanied by strong seismicity, the lake level dropped180 m, a rate of 45 m/h (Figs. 4 and 5a). The shape ofthe Halemaumau crater after this event was described asa cylinder with a diameter of 366 m (Jaggar 1947). This
is an important observation because it makes calculatingvolumetric changes simple: each meter of rise or dropcorresponds to -78750 m 3 of unvesiculated lava (Appendix). The volume lost from the lake during this eventwas therefore 14.2 x 10⁶ m 3, at an average rate of985 m 3/s (Fig. 4b, Table 1). Two cracks in the lower120 m of the SW and NE walls of the 180-m-deep pitwere exposed. These cracks did not extend to the surfacealong the pit walls; however, a new fuming fissureopened on the caldera floor -100 m SW of the rim ofHalemaumau. Except for this fissure, there was no surface manifestation of shallow dike emplacement thatcorresponded to this drop in lake level. Thus the loss of- 14 x 106 m 3 from the lava lake was accompanied onlyby seismicity and minor surface cracking. It is concluded that the lava drained into a cavity within the volcano, most likely into the fissures exposed in the wallsof Halemaumau (Fig. 5a).
For the next 17 days, the actively fountaining lakesurface rose, and the regained volume totalled13.4 x 106 m 3 at an infilling rate of 3.7m 3/s. NS tiltstarted a deflationary trend on 28 November, and overtwo weeks indicated a loss of 17.5 x 10⁶ m 3 from deeper
6 16 26 4 14 24 3 13 23 5 15 25 4 14 24 4 14 24 3 13 23 3 13 23 12 22
E-100g.J::.
0.Q)
0_150
195
b....{:, 645
+45.7x10
35
ME
25<D
gQ)Ol 15cCl 3 4.J::.LlQ) 5
E E::J
~ 0> -5
t= Q)
.~
0~ -15::Ju
-25
-35
c.Q:§:s
·IE• W
' ..tN5 c
.Qo~o
jIAUGIJUL
-. -.: ...., •• ,. -4 ••
3
Of ::"',.' ,.,,-50 .. ::
Pre- I
erupt. 1~2b.20
MI-'I
19191
1920
-200 DEC JAN
a
E
E'C:
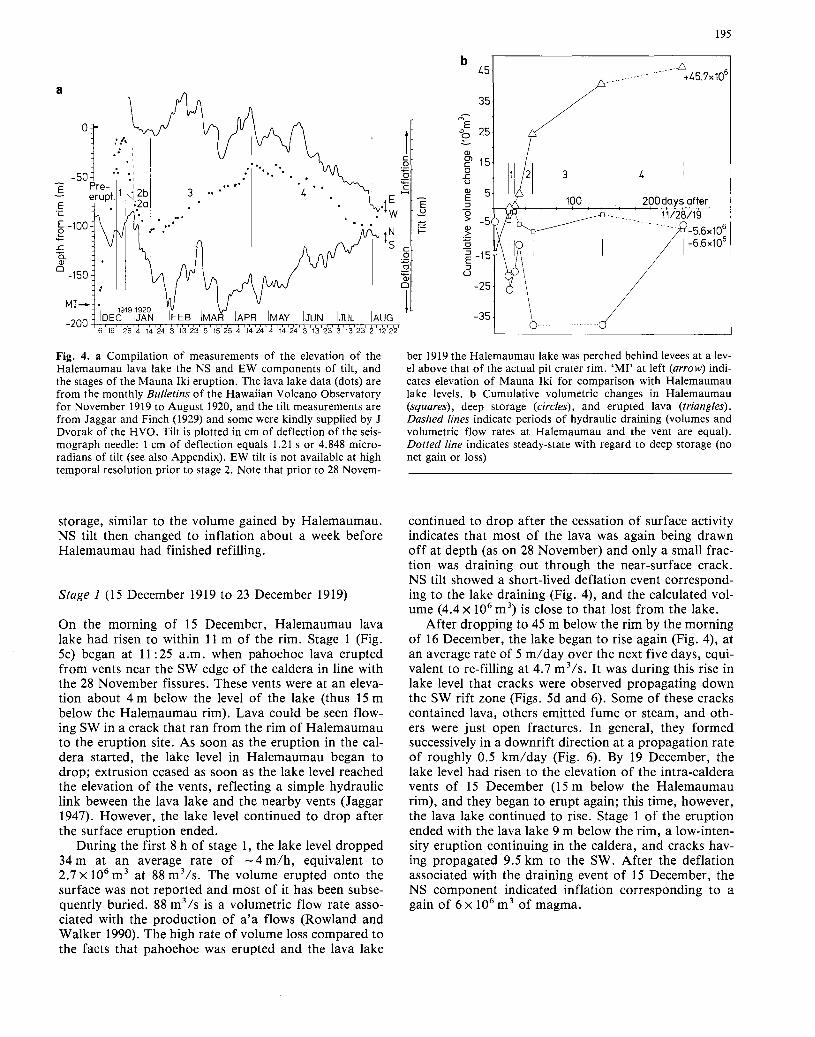
Fig. 4. a Compilation of measurements of the elevation of theHalemaumau lava lake the NS and EW components of tilt, andthe stages of the Mauna Iki eruption. The lava lake data (dots) arefrom the monthly Bulletins of the Hawaiian Volcano Observatoryfor November 1919 to August 1920, and the tilt measurements arefrom Jaggar and Finch (1929) and some were kindly supplied by JDvorak of the HVO. Tilt is plotted in cm of deflection of the seismograph needle: 1 cm of deflection equals 1.21 s or 4.848 microradians of tilt (see also Appendix). EW tilt is not available at hightemporal resolution prior to stage 2. Note that prior to 28 Novem-
ber 1919 the Halemaumau lake was perched behind levees at a level above that of the actual pit crater rim. 'MI' at left (arrow) indicates elevation of Mauna Iki for comparison with Halemaumaulake levels. b Cumulative volumetric changes in Halemaumau(squares), deep storage (circles), and erupted lava (triangles).Dashed lines indicate periods of hydraulic draining (volumes andvolumetric flow rates at Halemaumau and the vent are equal).Dotted line indicates steady-state with regard to deep storage (nonet gain or loss)
storage, similar to the volume gained by Halemaumau.NS tilt then changed to inflation about a week beforeHalemaumau had finished refilling.
Stage 1 (15 December 1919 to 23 December 1919)
On the morning of 15 December, Halemaumau lavalake had risen to within 11 m of the rim. Stage 1 (Fig.5c) began at 11:25 a.m. when pahoehoe lava eruptedfrom vents near the SW edge of the caldera in line withthe 28 November fissures. These vents were at an elevation about 4 m below the level of the lake (thus 15 mbelow the Halemaumau rim). Lava could be seen flowing SW in a crack that ran from the rim of Halemaumauto the eruption site. As soon as the eruption in the caldera started, the lake level in Halemaumau began todrop; extrusion ceased as soon as the lake level reachedthe elevation of the vents, reflecting a simple hydrauliclink beween the lava lake and the nearby vents (Jaggar1947). However, the lake level continued to drop afterthe surface eruption ended.
During the first 8 h of stage 1, the lake level dropped34 m at an average rate of - 4 mlh, equivalent to2.7 x 106 m 3 at 88 m 3Is. The volume erupted onto thesurface was not reported and most of it has been subsequently buried. 88 m3Is is a volumetric flow rate associated with the production of a'a flows (Rowland andWalker 1990). The high rate of volume loss compared tothe facts that pahoehoe was erupted and the lava lake
continued to drop after the cessation of surface activityindicates that most of the lava was again being drawnoff at depth (as on 28 November) and only a small fraction was draining out through the near-surface crack.NS tilt showed a short-lived deflation event corresponding to the lake draining (Fig. 4), and the calculated volume (4.4 x 10⁶ m 3) is close to that lost from the lake.
After dropping to 45 m below the rim by the morningof 16 December, the lake began to rise again (Fig. 4), atan average rate of 5 mlday over the next five days, equivalent to re-filling at 4.7 m 3/s. It was during this rise inlake level that cracks were observed propagating downthe SW rift zone (Figs. 5d and 6). Some of these crackscontained lava, others emitted fume or steam, and others were just open fractures. In general, they formedsuccessively in a downrift direction at a propagation rateof roughly 0.5 kmlday (Fig. 6). By 19 December, thelake level had risen to the elevation of the intra-calderavents of 15 December (15 m below the Halemaumaurim), and they began to erupt again; this time, however,the lava lake continued to rise. Stage 1 of the eruptionended with the lava lake 9 m below the rim, a low-intensity eruption continuing in the caldera, and cracks having propagated 9.5 km to the SW. After the deflationassociated with the draining event of 15 December, theNS component indicated inflation corresponding to again of 6 x 10⁶ m 3 of magma.
post-eruption
a
d
g
pre-eruption11/28/19
late stage 112/16 to 12/23/19
:J
'"E:J
'"E(l)
iiiI
stage 31/18 to 4/16/20
b
e
h
:J
'"E:J
'"E(l)
iiiI
pre-eruption11/29 to 12/14/19
stage 44/17 to 8/3/20
c
f
:J
'"E:J
'"E(l)
iiiI
early stage 112/15/19
stage 2b12/30/19 to 1/17/20
197
Stage 2a (24 December 1919 to 29 December 1919)
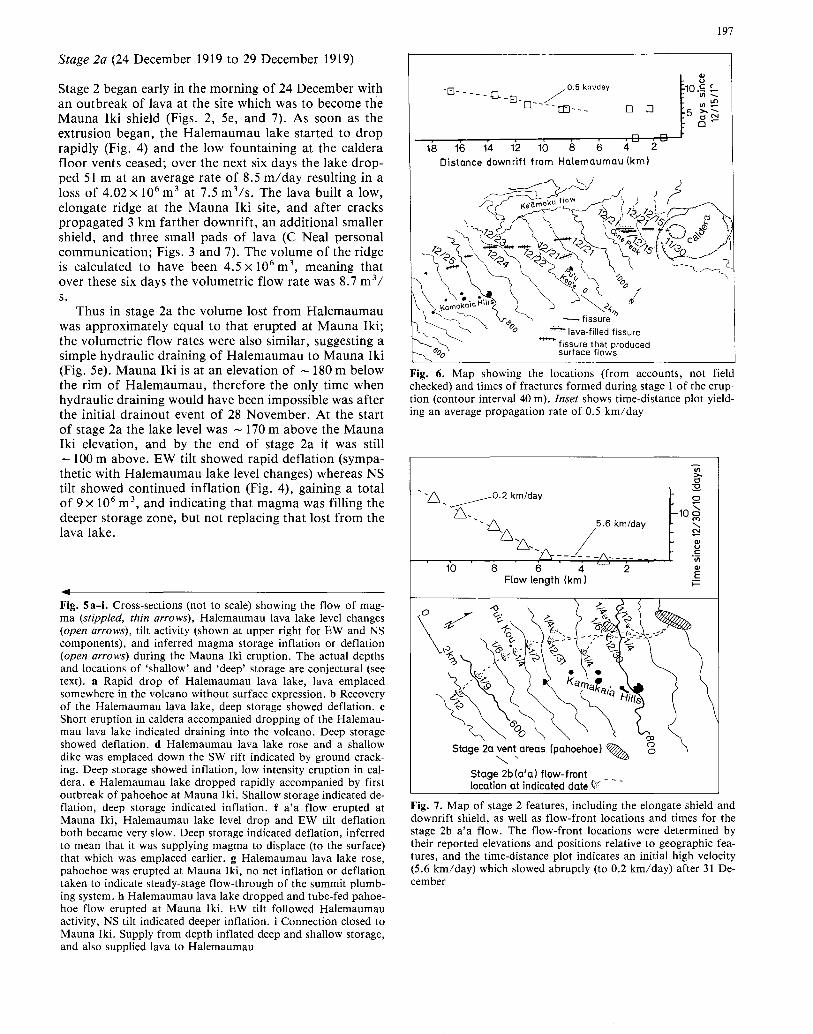
Fig. 6. Map showing the locations (from accounts, not fieldchecked) and times of fractures formed during stage 1 of the eruption (contour interval 40 m). Inset shows time-distance plot yielding an average propagation rate of 0.5 km/day
Fig. 7. Map of stage 2 features, including the elongate shield anddownrift shield, as well as flow-front locations and times for thestage 2b a'a flow. The flow-front locations were determined bytheir reported elevations and positions relative to geographic features, and the time-distance plot indicates an initial high velocity(5.6 km/day) which slowed abruptly (to 0.2 km/day) after 31 December
OJu
10.<: ~Ul_
Ul~5 »ONo~
(Xloo
2
~ lava-filled fissure
-- fissure that producedsurface flows
Stage 2a vent areas (pahoehoe)~"'-..' "%2;
Stage 2b(a'a) flow-front __location at indicated date V -
10 8 6 4Flow length (km)
'E)- _ _ _ /0.5 km/day-D.-El _ /'
D---- m -__ D D
18 16 14 12 10 8 6 4 2Distance down rift from Halemaumau (km)
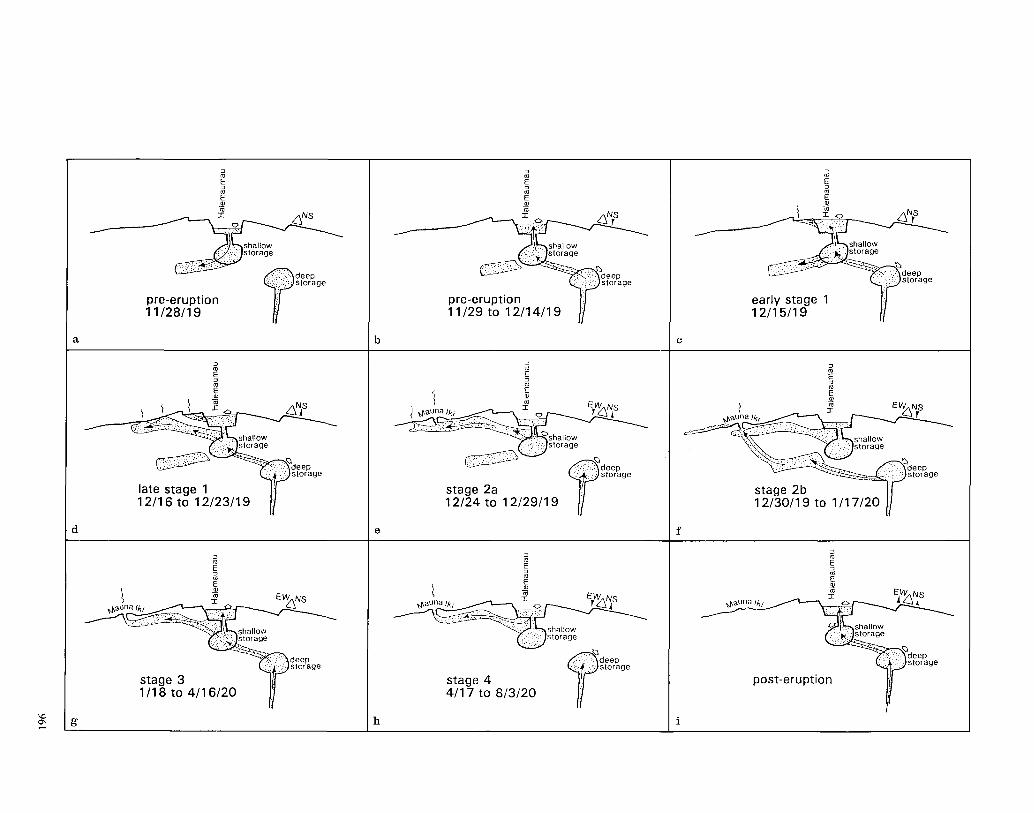
Fig. Sa-i. Cross-sections (not to scale) showing the flow of magma (stipp/ed, thin arrows), Halemaumau lava lake level changes(open arrows), tilt activity (shown at upper right for EW and NScomponents), and inferred magma storage inflation or deflation(open arrows) during the Mauna Iki eruption. The actual depthsand locations of 'shallow' and 'deep' storage are conjectural (seetext). a Rapid drop of Halemaumau lava lake, lava emplacedsomewhere in the volcano without surface expression. b Recoveryof the Halemaumau lava lake, deep storage showed deflation. cShort eruption in caldera accompanied dropping of the Halemaumau lava lake indicated draining into the volcano. Deep storageshowed deflation. d Halemaumau lava lake rose and a shallowdike was emplaced down the SW rift indicated by ground cracking. Deep storage showed inflation, low intensity eruption in caldera. e Halemaumau lake dropped rapidly accompanied by firstoutbreak of pahoehoe at Mauna Iki. Shallow storage indicated deflation, deep storage indicated inflation. f a'a flow erupted atMauna Iki, Halemaumau lake level drop and EW tilt deflationboth became very slow. Deep storage indicated deflation, inferredto mean that it was supplying magma to displace (to the surface)that which was emplaced earlier. g Halemaumau lava lake rose,pahoehoe was erupted at Mauna Iki, no net inflation or deflationtaken to indicate steady-stage flow-through of the summit plumbing system. h Halemaumau lava lake dropped and tube-fed pahoehoe flow erupted at Mauna Iki. EW tilt followed Halemaumauactivity, NS tilt indicated deeper inflation. i Connection closed toMauna Iki. Supply from depth inflated deep and shallow storage,and also supplied lava to Halemaumau
..
Stage 2 began early in the morning of 24 December withan outbreak of lava at the site which was to become theMauna Iki shield (Figs. 2, 5e, and 7). As soon as theextrusion began, the Halemaumau lake started to droprapidly (Fig. 4) and the low fountaining at the calderafloor vents ceased; over the next six days the lake dropped 51 m at an average rate of 8.5 m/day resulting in aloss of 4.02 x 10⁶ m 3 at 7.5 m 3/s. The lava built a low,elongate ridge at the Mauna Iki site, and after crackspropagated 3 km farther downrift, an additional smallershield, and three small pads of lava (C Neal personalcommunication; Figs. 3 and 7). The volume of the ridgeis calculated to have been 4.5 x 10⁶ m 3, meaning thatover these six days the volumetric flow rate was 8.7 m 3 /
s.Thus in stage 2a the volume lost from Halemaumau
was approximately equal to that erupted at Mauna Iki;the volumetric flow rates were also similar, suggesting asimple hydraulic draining of Halemaumau to Mauna Iki(Fig. 5e). Mauna Iki is at an elevation of -180 m belowthe rim of Halemaumau, therefore the only time whenhydraulic draining would have been impossible was afterthe initial drainout event of 28 November. At the startof stage 2a the lake level was - 170 m above the MaunaIki elevation, and by the end of stage 2a it was still- 100 m above. EW tilt showed rapid deflation (sympathetic with Halemaumau lake level changes) whereas NStilt showed continued inflation (Fig. 4), gaining a totalof 9 x 10⁶ m 3
, and indicating that magma was filling thedeeper storage zone, but not replacing that lost from thelava lake.
198
Stage 2b (30 December 1919 to 17 January 1920)
After six days of building the elongate shield, the activity at Mauna Iki changed abruptly on the morning of 30December. The low fountaining along the crest of theshield ceased and out of the E flank, halfway betweenits Nand S ends (Fig. 7), a channel-fed flow issuedquietly out from under a pahoehoe carapace and flowedto the SW. The lava made the transition from pahoehoeto a'a a few hundred meters from its origin. The flowfront velocity for the first two days was almost 5.6 km/day, after which it slowed to -0.2 km/day (Fig. 7). Thetotal volume was 19.8 x 10⁶ m3 (Appendix), and its average volumetric flow rate was 13 m 3/s, a 50% increaseover that which had formed the low shield during stage2a. At the same time (Jaggar 1919c), the rate of lowering of the Halemaumau lava lake decreased (Fig. 4)from 8.5 m/day (7.5 m 3/s) to 1.5 m/day (1.4 m 3/s).Thus at the vent site the volumetric flow rate increasedand the lava became more gas-poor (fountaining ceasedand a'a replaced vesicular pahoehoe), while simultaneously the rate of draining of the summit lava lake decreased by > 50070.The volume lost from Halemaumauduring stage 2b was only 14% of the volume erupted asa'a. A 'feeble' earthquake was the only seismicity recorded at the onset of stage 2b.
The EW component of tilt reacted to the start ofstage 2b by reducing its deflation rate (mimicking theHalemaumau activity). At the same time, the NS component changed from inflation to deflation, losing26 x 106 m 3 of magma over the duration of stage 2b(Fig. 4; Jaggar 1919c, 1920a). One possible explanationof these events could be the opening of a direct linkfrom the deeper magma reservoir directly to Mauna Iki,mostly bypassing Halemaumau. However, the a'a flowwas described specifically as being gas-poor and erupting very quietly (Jaggar 1920a), an observation that isinconsistent with a direct influx of presumably gas-richmagma from depth.
We suggest that magma did bypass Halemaumau andinvade the rift zone; however, instead of erupting itmerely displaced magma that had been stored since theHalemaumau drain-out events of November and December (Fig. 5f). This magma would have been stored inthe rift for up to 32 days and thus would have cooledand degassed. This physically evolved magma waspushed out by more gas-rich magma that didn't reachthe surface and led to the change in eruptive style.Some magma probably also reached Halemaumau andslowed the net draining rate. Chemically, the a'a differslittle from Mauna Iki pahoehoe samples (Wright 1971).This mechanism of displacing previously stored magmato the surface has also been proposed for the first partof the 1960 Kapoho eruption (Macdonald 1962), for the1955 eruption (Ho and Garcia 1988), and for episode 1of the Puu 00 eruption (Garcia et al. 1989).
During the 18 days that the a'a flow was active, theHalemaumau lake surface continued to drop, eventuallyreaching 105 m below the rim. When the a'a flow became inactive on 17 January, eruption of pahoehoe resumed at the N end of the Mauna Iki shield. At the same
time, the lake in Halemaumau began to rise, EW tiltchanged to inflation, and stage 2 was over. A 'very feeble' earthquake was registered the morning of 17 January.
Eruptive products of stage 2 were the elongate shield,the downrift shield, and the a'a flow (Figs. 2 and 3).The downrift shield has been largely buried by windblown sand since 1919 (Fig. 2). Only the SW-most endof the elongate shield from stage 2a survived the growthof the main shield during stage 3 (Fig. 2). It was alsolargely covered by 1971 lavas. The surviving portion is alow mound 400 m wide and 800 m long protruding SWout from under the stage 3 shield. A flat collapsed(?)area is found along the crest of this mound, and a'a/toothpaste lava breakouts emanate from its SW end.
The principal product of stage 2 was the downrift a'aflow (Figs. 2 and 3). Its E margin was partially buriedby the tube-fed flows of stage 4 but it is otherwise wellpreserved. Its source at the time of formation was at themiddle of the elongate shield, but because the stage 3activity extended the shield farther N, it now appears toemanate from near the S end. The upflow end of the a'ais a SE-trending depressed area of broken pahoehoeplates which marks the collapsed pahoehoe carapace described by Jaggar (l920a).
The transition to a'a takes place over a distance ofabout 250 m, and is manifested by a rapid decrease inthe proportion of foundered pahoehoe blocks relative tosurrounding a'a. By 800 m from the source the 'rafts' ofpahoehoe become much less numerous, and the flow isessentially all a'a. The flow makes a turn from SE toSW about 600 m from its origin, and maintains thisdownrift direction for about 5 km, being partially confined by SW rift zone graben, as evidenced by straightsections of the W margin. Four arms a few hundred meters long trend towards the W; E-trending arms were buried by the pahoehoe of stage 4. Beyond the first fewhundred meters, there are no well-defined channels orremnants of pahoehoe overflows (Fig. 2); however,poorly defined channels can be identified in the air photos. The a'a flow averages 3-5 m thick along its W margin and is of the proximal type (vesicular with a thincover of clinker and few dense surface blocks; Rowlandand Walker 1987); 6 km from its source the flow wasfluid enough to consist largely of toothpaste lava.
Stage 3 (18 January 1920 to 16 April 1920)
Stage 3 was characterized at Mauna Iki by numeroussmall gas-rich pahoehoe overflows from a lava pondthat developed at what was the N end of the stage 2ashield. During stage 3 the pond was described as ' ... acircular well 40 feet in diameter, covered with crust inthe middle .. .' (Finch 1920a). The pahoehoe flowseither overflowed the rim of the pond or escapedthrough shallow tubes in the walls. This activity built theshield to its present size (Figs. 2, 3, and 5g). Duringstage 3 there were numerous instances of degassed lavabreaking out of the shield flanks to form a'a and toothpaste lava flows. The volume of lava erupted duringstage 3 was 16.1 x 10⁶ m 3 (see Appendix), at an average
\
output rate of 2.1 m 3Is (Table 1). At the onset of stage3, the Halemaumau lake began to rise (Fig. 4). This continued throughout stage 3 at an average rate of 0.74 mlday, which converts to 5.2 X 10⁶ m 3 at an inflow rate of0.7m 3 /s.
The start of stage 3 was also marked by changes inthe tilt record (Fig. 4). The EW component showed achange from deflation to inflation, mimicking thechanges at Halemaumau. The NS component, however,continued the rapid deflationary trend of late stage 2 (at-15 m 3 /s), and since the combined surface eruptionrate at Mauna Iki and Ha1emaumau during stage 3 wasonly 2.8 m 3Is, magma was apparently being emplacedelsewhere within the volcano from the deeper storage.About three weeks into stage 3, the NS tilt changed toindicate summit inflation, after which the two components acted in phase. There was a deflationary excursionfrom 15 March until the beginning of April, when inflation resumed. The lake level at Halemaumau rose constantly, showing no such fluctuations, meaning that during stage 3 magma was able to move into and out of theshallower storage zone (shown by EW tilt changes) without affecting the lava lake. This contrasted with stage 2(and stage 4 later) during which EW tilt acted in concertwith Halemaumau.
Overall, the tilt record during stage 3 shows no netinflation or deflation. It therefore appears that duringthis period steady-state conditions existed, and overallinput from the magma source region was balanced bysupply to the lava lake and Mauna Iki. The combinedvolume of lava erupted at Mauna Iki plus the volumegained by Halemaumau yields a supply rate to the surface of 2.8 m 3Is during stage 3. This value is close to thelong-term supply rates to the Kilauea magma chambercalculated by Swanson (3.5 m 3Is; 1972), Dzurisin et al.(2.3-5 m 3 /s; 1980), Dzurisin et al. (2.8 m 3 /s; 1984), andimplied by Rowland and Walker (5 m3 /s; 1990). However, the short-term input rates required to supply some ofthe inflationary fluctuations of stage 3 are much higher(i.e. up to 30 m 3Is).
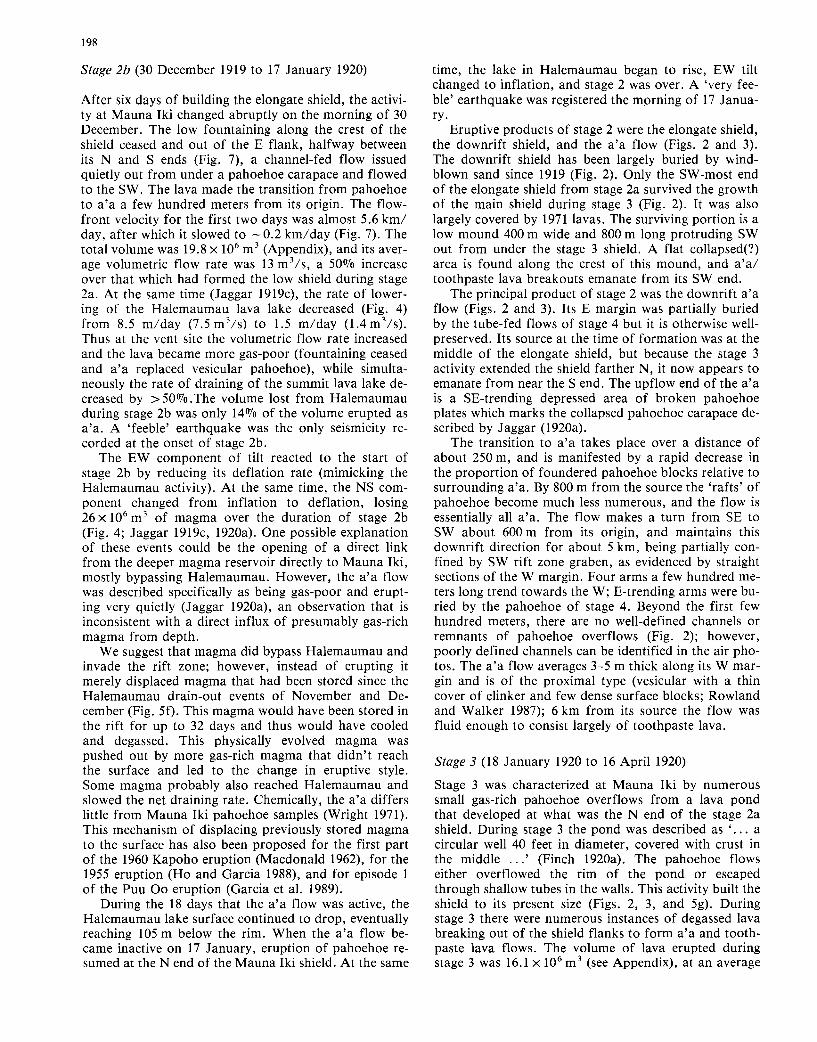
Pahoeoe surface flows as well as some of the a'a andtoothpaste lava breakouts from stage 3 are well preserved at Mauna Iki (Figs. 2 and 3). The largest breakout flowed towards the N, consists of broken and rotated blocks of shield lavas up to 10 m across and resembles a landslide with a scarp at its head and a toe 2-4 mhigh (Jaggar 1920b). The lava pond that was a prominent feature during stage 3 has been preserved as a relatively circular collapsed pit 10-15 m deep and - 50 macross (Fig. 8). Its W wall is 15 m high, and on its E sideslabs of pahoehoe tilt inward to form a trapdoor-likesurface. Many of the glassy surfaces of the lava aroundthe summit of the shield have been oxidized by escapinggases to an orange-brown color, and show up as lightpatches on the stereo photos (Fig. 2).
Stage 4 (17 April 1920 to 3 August 1920)
The first reported observation of the majority of lavaflowing in tubes was made on 17 April 1920, and wepick this as the start of stage 4. These tubes facilitated
199
Fig. 8. Photograph of the now-collapsed lava pond at the summitof Mauna Iki. View is to the SE, and note that the far rim (wherefigure'rs standing) is - 20 m lower than the near rim. Lava at bottom of pond erupted 2-3 weeks after cessation of flow-field activity (Jaggar 1920e)
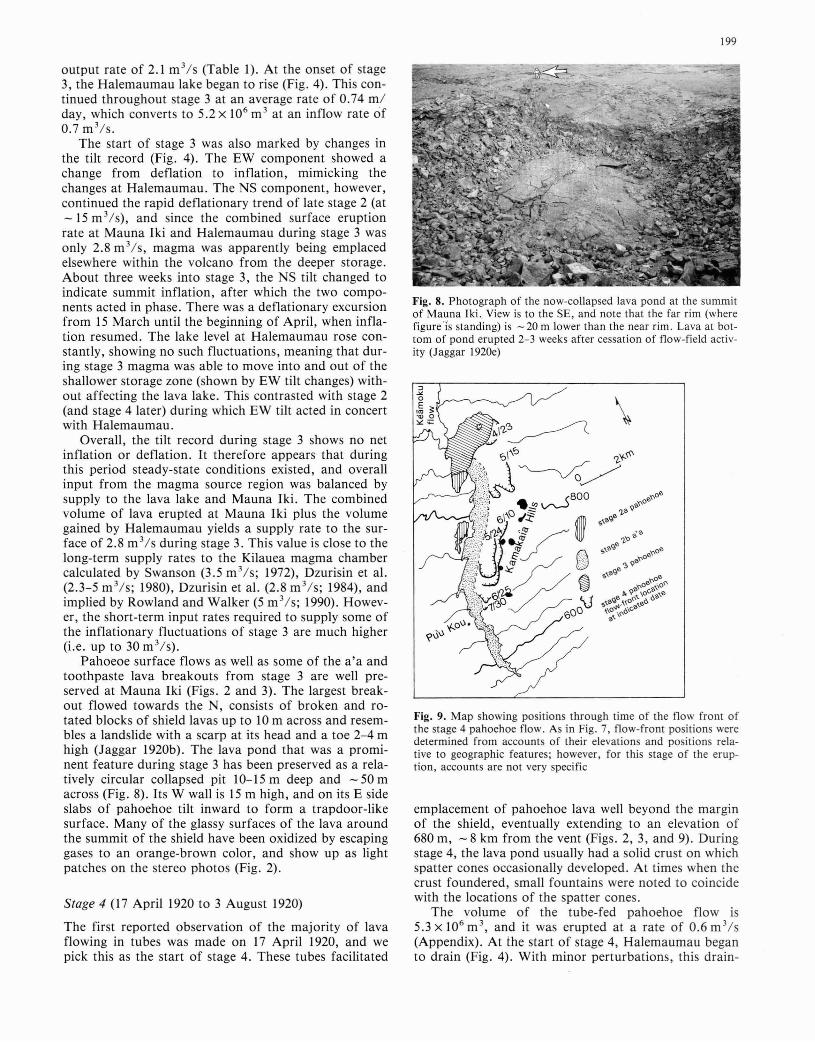
Fig. 9. Map showing positions through time of the flow front ofthe stage 4 pahoehoe flow. As in Fig. 7, flow-front positions weredetermined from accounts of their elevations and positions relative to geographic features; however, for this stage of the eruption, accounts are not very specific
emplacement of pahoehoe lava well beyond the marginof the shield, eventually extending to an elevation of680 m, - 8 km from the vent (Figs. 2, 3, and 9). Duringstage 4, the lava pond usually had a solid crust on whichspatter cones occasionally developed. At times when thecrust foundered, small fountains were noted to coincidewith the locations of the spatter cones.
The volume of the tube-fed pahoehoe flow is5.3xI06 m 3
, and it was erupted at a rate of 0.6m 3 /s(Appendix). At the start of stage 4, Halemaumau beganto drain (Fig. 4). With minor perturbations, this drain-
200
ing continued throughout stage 4 at an average rate of0.6 m/day, corresponding to a total of 4.7xI06 m 3
drained at an average rate of 0.5 m 3/s .. At the onset ofstage 4, the EW tilt component began a deflationarytrend while the NS component started an inflationarytrend (Fig. 4). These persisted throughout stage 4.Again, the EW component mimicked the Halemaumaulake level while the NS component did not.
During stage 4, the volume loss and outflow rate atHalemaumau essentially equalled the lava volume anderuption rate, respectively, at Mauna Iki. This suggeststhat like stage 2a, stage 4 involved a direct hydraulicdraining of lava from Halemaumau to Mauna Iki. This,combined with the change to inflation of the deeperstorage indicated by the NS tilt, suggests that supply toHalemaumau from the deeper storage was disrupted(Fig. 5h). The relatively gas-poor nature of the stage 4lava at Mauna Iki supports the idea that there was nofresh magma being supplied to the eruption site. If weassume that the connection from deeper storage to Halemaumau had been temporarily blocked, we can estimatea supply rate to the volcano from the NS tilt. The volume gained by NS tilt during stage 4 was 32 x 106 m 3, ata supply rate of 3.6 m 3/s, very similar to that calculatedfor stage 3 (2.8 m 3/s).
The main tube-fed pahoehoe flow of stage 4 is wellpreserved except where buried by windblown sand (Figs.2 and 3). The flow had nearly reached its final length of- 8 km by 25 June (Fig. 9), yielding an average flowfront velocity of 0.1 km/day. Except for the skylights inthe summit region that were observed during the eruption (now rubble-filled), they are otherwise exceedinglyrare on the downrift pahoehoe flow. Only one wasfound off the shield in this study. It is located - 2 kmfrom the vent and exposes a tube 1.5-2 m in diameter.
The end of the eruption. The lava pond at Mauna Ikibegan to subside during late July, and the tube-fed pahoehoe flow became barely active. By 3 August, onlyvery hot cracks could be found on the Mauna Iki shield.The Halemaumau lake level began to rise on 28 July,and EW tilt changed from deflation to inflation (Figs. 4and 5i). A slight perturbation in the inflation recordedby NS tilt accompanied the end of the eruption, but after a week it returned to the long-term inflation started atthe end of stage 3.
We suggest that decreasing magma pressure at Halemaumau became unable to maintain an open pathwaydownrift, and the eruption ceased. No distinctive seismicity accompanied the end of the eruption even thoughit involved the closing of the conduit between Halemaumau and Mauna Iki. Magma from deeper storage immediately began to fill both Halemaumau and shallow storage even though there was no change in the inflationrate registered by NS tilt.
Discussion
Reconstruction of the eruption chronology, lake-levelchanges, and tilt records allows us to analyze characteristics of this shield-building eruption, including lava-
flow mechanisms, storage and magma transport withinthe rift zone, the nature of magma ascent from depth,and magma supply rates.
Lava flows
The Mauna Iki eruption produced both a'a and pahoehoe, with the majority of the a'a erupted early on. Thispattern is similar to the Mauna Ulu and Kupaianaha/Puu 0'0 eruptions; however, the details are very different. At both Mauna Ulu and Puu 0'0 (= early Kupaianaha), the a'a flows were produced during high fountaining episodes at volumetric flow rates of 20-300 m 3/S
(Ulrich 1986; see compilation in Rowland and Walker1990) and accompanied by rapid subsidence at the summit of Kilauea (e.g. Swanson et al. 1979; Wolfe et al.1987, 1988). These lavas were gas-rich and the summitsubsidence indicated that there was a direct hydraulicconnection between the vent and summit storage.
At Mauna Iki, however, the early a'a stage was notaccompanied by high fountaining. Rather, the low fountaining that had been occurring at the Mauna Iki shield(stage 2a) ceased at the start of the a'a activity, and thea'a flow is described specifically as having issued quietlyfrom its source bocca (Jaggar 1920a). The slowing of therate of Halemaumau draining and the decrease in therate of EW deflation suggest that downrift supply inshallow conduits decreased corresponding to the onsetof a'a activity. At the same time, NS tilt indicated relatively rapid subsidence (similar to the Mauna Ulu andPuu 0'0 examples) suggesting that there was a deep connection to the vent that bypassed Halemaumau. The distinctly gas-poor nature of the stage 2b eruption is themajor difference from the Mauna Ulu and Puu 00cases, and indicates that although a hydraulic linkexisted between the deep storage reservoir and MaunaIki, fresh magma only displaced cooler degassed magmaupwards and did not itself erupt.
The volumetric flow rate of the tube-fed pahoehoe atMauna Iki was -1 m 3/s. The average volumetric flowrates of the tube-fed pahoehoe stages of Mauna Ulu andKupaianaha were 3-5 m 3/s (Swanson et al. 1979; C Heliker, personal communication). Thus the Mauna Iki pahoehoe flows are at the low end of the volumetric flowrate and flow-front velocity spectrum. As noted above,volume calculations suggest that the tube-fed stage ofMauna Iki was driven solely by draining of Halemaumau. The lower supply rate was not able to establish athermally efficient conduit capable of sustaining theeruption for a long period of time, and additionally, thedriving pressure decreased as the Halemaumau lake leveldropped. Except near the vent, significant lava tubeswere unable to form, and the one skylight found exposesa relatively small tube.
Magma storage and transport during the Mauna Ikieruption stages
The interplay between tilt components, the Halemaumau lake, and the Mauna Iki vent illustrates the complex nature of shallow magma storage and transport the
SW rift zone. The two large~volume Halemaumaudraining events that took place in late 1919 without significant surface eruption or seismicity indicated thatthere was sufficient space within the volcano to inelastically accommodate large volumes of magma. It has beensuggested that SW rift eruptions on Kilauea occur onlywhen the rift zone has been propped open by numerousmagma excursions into the (better-developed) E rift, orwhen pressure across the rift zone has been released byan eruption on Mauna Loa's SW rift zone (Duffield etal. 1982). There was such an eruption of Mauna Loa between 29 September and 11 October 1919 (e.g. Jaggar1919a-c, 1947; Macdonald et al. 1983), so according tothis model the SW rift zone of Kilauea was primed foractivity in late 1919.
Stage 1 of the Mauna Iki eruption consisted of shallow propagation of a dike from the vicinity of Halemaumau down the SW rift. Magma was observed flowingSW in some of the fissures that opened during this stageshowing that at least the top of the dike was near thesurface along its entire course. This contrasts with therapid Halemaumau drain-out events during which therewas no surface evidence of dike intrusion. The existenceof both deep and shallow conduits (at about 3 and 8 kmbelow the surface, respectively) wthin the SW rift is suggested by seismic data (Klein et al. 1987 Fig. 43.12). Thedrainouts of 28 November and 15 December may havefed lava to the deeper conduit whereas the stage 1 dike(16-23 December) utilized the shallow conduit. Duringthe propagation of this shallow dike, the Halemaumaulake rose and NS tilt indicated inflation meaning thatmagma was entering the volcano at a high rate, able tosimultaneously propagate a shallow dike downrift, fillthe Halemaumau lake, and fill deeper storage.
The onset of eruption at Mauna Iki (stage 2a) wasaccompanied by rapid draining of Halemaumau and deflation of EW tilt. As already noted, volume calculations illustrate a simple draining mechanism. The continued inflation shown by the NS tilt shows that magmawas lost only from the shallow rift zone plumbing during stage 2a. This changed with the onset of stage 2b; adirect connection through deeper plumbing bypassedHalemaumau.
If the magma involved in the rapid drainout events oflate 1919 went to deep (inelastic) storage, it would bealikely candidate for that pushed out through the deepconduit during stage 2b. The time interval between the28 November Halemaumau draining event and the onsetof stage 2b was 32 days. Bruce and Huppert (1989)showed that to avoid solidifying for 32 days, a flowingdike would have to be at least 1.3 m wide if the surrounding country rock was at a temperature of 1000 C.The scenario presented here is different in that we suggest that the dike was emplaced and remained static before being displaced by a subsequent intrusion. Walker(1987) found an average dike width of 0.73 m for dikesof Koolau volcano. Thomas (1987) presented temperature-depth profiles for geothermal drill holes on the Erift zone of Kilauea in the range of 375 0 C at a depth of- 2 km. These temperatures could be extrapolated to- 4000 C at 3 km (Thomas, personal communication),
201
but might be somewhat lower in the less-active SW riftzone. Kauahikaua et al. (1986) used resistivity measurements to determine that at a depth of 5 km, the temperature is around 10000 C in the near-summit region. Given these constraints, and the evidence that batches ofmagma can remain fluid for years in the E rift zone (e.g.Macdonald 1962; Ho and Garcia 1988; Garcia et al.1989), a dike emplaced early in the Mauna Iki eruptioncould probably have remained fluid for at least amonth.
Stage 3, during which there was no net change in NStilt, is the first indication in the Mauna Iki eruption ofthe establishment of a steady-state magma source-tovent connection. Such a connection has been inferredfrom tilt and long-duration low output-rate lava production for stages of the Mauna Vlu (e.g. Swanson et al.1979; Tilling et al. 1987) and Kupaianaha eruptions.Combining the volume erupted at Mauna Iki with thatgained by Halemaumau, and averaging it over the duration of stage 3 yields 2.8 m 3Is, a rate similar to the estimates made for Mauna Vlu and Kupaianaha which havebeen considered to be long-term supply rates to the Kilauea (e.g. Swanson 1972). They are also essentially thesame as those of historic tube-fed pahoehoe eruptionson Mauna Loa (Rowland and Walker 1990). If 3-5 m 3Isis indeed the long-term supply rate to Kilauea, based onthe total volume erupted historically (Macdonald et al.1983) it means that the ratio of intrusion to extrusion ispossibly as high as 15: 1. Previous estimates of this ratiowere 2: 1 (Dzurisin et al. 1984) and 5: 1 (Walker 1987;for the subaerial part of Koolau volcano). The data ofFurumoto (1978) can be converted to indicate that dikesmake up 95-100070 of Kilauea's E rift zone at a depth of-3km.
Stage 4 indicated a return to hydraulic draining ofmagma from Halemaumau downrift, and at the sametime deeper storage (as indicated by NS tilt) showed inflation. The volume flow rate of this inflation (supply tothe volcano) was 3.7 m 3/s, again similar to that determined during the steady-state stage 3.
Volume comparisons (Table 1) allow us to place further constraints on rift zone and summit plumbing. Thetotal volume erupted at Mauna Iki was 46 x 106 m 3, andthe total drained from Halemaumau was 28 x 106 m 3 sothere had to have been 18 x 106 m 3 of magma suppliedto Mauna Iki that did not show up as a change in lakelevel at Halemaumau. The total volume of deep storageloss was 52.3 x 10⁶ m 3 and the total volume gained during rising events at Halemaumau accounts for only21.5 X 106 m 3 of this, leaving an excess 30.8 x 10⁶ m3
• Ifthe 18 x 106 m 3 needed to make up the Mauna Iki volume is taken from this excess, there is still 12.8 x 10⁶ m3
remaining that was lost from deep storage and not accounted for at Mauna Iki or Halemaumau. It probablycontributed to rift-zone storage. Deep storage onlygained 46.7 x 10⁶ m 3 while losing the 52.3 x 10⁶ m 3 toMauna Iki + Halemaumau + storage, for a net loss of5.6 x 106 m 3. This net loss may not be significant giventhe uncertainty of our numbers.
The decoupling of NS and EW tilt (as discussedabove) forms the basis of our hypothesis of separated
202
E'"
Appendix
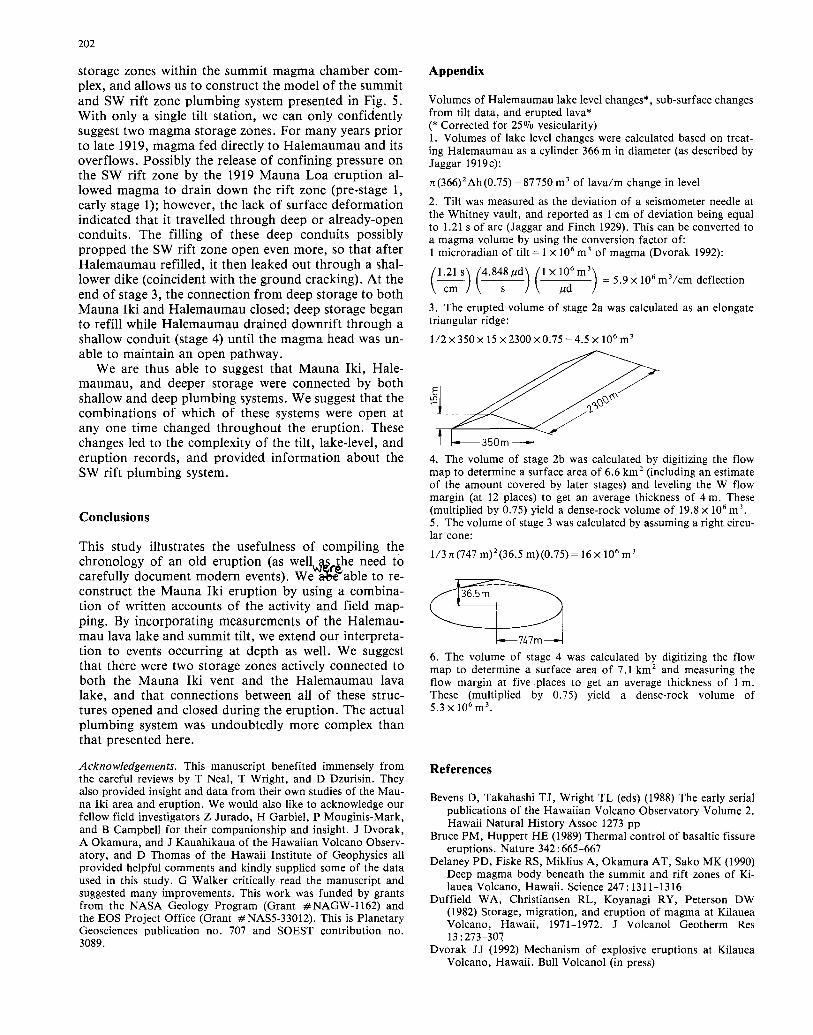
6. The volume of stage 4 was calculated by digitizing the flowmap to determine a surface area of 7.1 km 2 and measuring theflow margin at five places to get an average thickness of 1 m.These (multiplied by 0.75) yield a dense-rock volume of5.3 x 106 m 3
•
350m
4. The volume of stage 2b was calculated by digitizing the flowmap to determine a surface area of 6.6 km 2 (including an estimateof the amount covered by later stages) and leveling the W flowmargin (at 12 places) to get an average thickness of 4 m. These(multiplied by 0.75) yield a dense-rock volume of 19.8 x 10⁶ m 3
•
5. The volume of stage 3 was calculated by assuming a right circular cone:
1/3 n(747 m)2(36.5 m)(O.75) = 16 x 106 m 3
Volumes of Halemaumau lake level changes*, sub-surface changesfrom tilt data, and erupted lava*(* Corrected for 25% vesicularity)1. Volumes of lake level changes were calculated based on treating Halemaumau as a cylinder 366 m in diameter (as described byJaggar 1919c):
n(366)211h(0.75) = 87750 m 3 of lava/m change in level
2. Tilt was measured as the deviation of a seismometer needle atthe Whitney vault, and reported as 1 cm of deviation being equalto 1.21 s of arc (Jaggar and Finch 1929). This can be converted toa magma volume by using the conversion factor of:1 microradian of tilt = 1 X 10⁶ m 3 of magma (Dvorak 1992):
(\~ s) (4.84s8 ,LId) Cx ~~ m 3) = 5.9 X 10⁶m3/cm deflection
3. The erupted volume of stage 2a was calculated as an elongatetriangular ridge:
112x350x 15 x2300xO.75 =4.5 x 10⁶ m 3
Conclusions
This study illustrates the usefulness of compiling thechronology of an old eruption (as well,,"~f~he need tocarefully document modern events). We'a:ee able to reconstruct the Mauna Iki eruption by using a combination of written accounts of the activity and field mapping. By incorporating measurements of the Halemaumau lava lake and summit tilt, we extend our interpretation to events occurring at depth as well. We suggestthat there were two storage zones actively connected toboth the Mauna Iki vent and the Halemaumau lavalake, and that connections between all of these structures opened and closed during the eruption. The actualplumbing system was undoubtedly more complex thanthat presented here.
storage zones within the summit magma chamber complex, and allows us to construct the model of the summitand SW rift zone plumbing system presented in Fig. 5.With only a single tilt station, we can only confidentlysuggest two magma storage zones. For many years priorto late 1919, magma fed directly to Halemaumau and itsoverflows. Possibly the release of confining pressure onthe SW rift zone by the 1919 Mauna Loa eruption allowed magma to drain down the rift zone (pre-stage 1,early stage 1); however, the lack of surface deformationindicated that it travelled through deep or already-openconduits. The filling of these deep conduits possiblypropped the SW rift zone open even more, so that afterHalemaumau refilled, it then leaked out through a shallower dike (coincident with the ground cracking). At theend of stage 3, the connection from deep storage to bothMauna Iki and Halemaumau closed; deep storage beganto refill while Halemaumau drained downrift through ashallow conduit (stage 4) until the magma head was unable to maintain an open pathway.
Weare thus able to suggest that Mauna Iki, Halemaumau, and deeper storage were connected by bothshallow and deep plumbing systems. We suggest that thecombinations of which of these systems were open atanyone time changed throughout the eruption. Thesechanges led to the complexity of the tilt, lake-level, anderuption records, and provided information about theSW rift plumbing system.
Acknowledgements. This manuscript benefited immensely fromthe careful reviews by T Neal, T Wright, and D Dzurisin. Theyalso provided insight and data from their own studies of the Mauna Iki area and eruption. We would also like to acknowledge ourfellow field investigators Z Jurado, H Garbiel, P Mouginis-Mark,and B Campbell for their companionship and insight. J Dvorak,A Okamura, and J Kauahikaua of the Hawaiian Volcano Observatory, and D Thomas of the Hawaii Institute of Geophysics allprovided helpful comments and kindly supplied some of the dataused in this study. G Walker critically read the manuscript andsuggested many improvements. This work was funded by grantsfrom the NASA Geology Program (Grant #NAGW-1162) andthe EOS Project Office (Grant # NAS5-33012). This is PlanetaryGeosciences publication no. 707 and SOEST contribution no.3089.
References
Bevens D, Takahashi TJ, Wright TL (eds) (1988) The early serialpublications of the Hawaiian Volcano Observatory Volume 2.Hawaii Natural History Assoc 1273 pp
Bruce PM, Huppert HE (1989) Thermal control of basaltic fissureeruptions. Nature 342: 665-667
Delaney PD, Fiske RS, Miklius A, Okamura AT, Sako MK (1990)Deep magma body beneath the summit and rift zones of Kilauea Volcano, Hawaii. Science 247: 1311-1316
Duffield WA, Christiansen RL, Koyanagi RY, Peterson DW(1982) Storage, migration, and eruption of magma at KilaueaVolcano, Hawaii, 1971-1972. J VolcanoI Geotherm Res13 :273-307
Dvorak 11 (1992) Mechanism of explosive eruptions at KilaueaVolcano, Hawaii. Bull Volcanol (in press)
Dvorak JJ, Okamura AT (1987) A hydraulic model to explain variations in summit tilt rate at Kilauea and Mauna Loa volcanoes. US Geol Surv Prof Pap 1350: 1281-1296
Dzurisin D, Anderson SA, Eaton GP, Koyanagi RY, Lipman PW,Lockwood JP, Okamura RT, Puniwai GS, Sako MK, Yamashita KM (1980) Geophysical observations of Kilauea Volcano,Hawaii, 2. Constraints on the magma supply during November1975-September 1977. J Volcanol Geotherm Res 7: 169-241
Dzurisin D, Koyanagi RY, English TT (1984) Magma supply andstorage at Kilauea Volcano, Hawaii, 1956-1983. J VolcanolGeotherm Res 21: 177-206
Finch RH (1920a) Monthly bulletin of the Hawaiian Volcano Observatory. 8, 3: 33-49
Finch RH (1920b) Monthly bulletin of the Hawaiian Volcano Observatory. 8, 4:51-57
Finch RH (1920c) Monthly bulletin of the Hawaiian Volcano Observatory. 8, 5: 59-67
Fiske RS, Kinoshita WT (1969) Inflation of Kilauea Volcano priorto its 1967-1968 eruption. Science 165 :341-349
Furumoto AS (1978) Nature of the magma conduit under the eastrift zone of Kilauea volcano, Hawaii. Bull Volcanol 41: 435453
Garcia MO, Ho RA, Rhodes JM, Wolfe EW (1989) Petrologicconstraints on rift-zone processes. Bull Volcanol 52:81-96
Heliker CC, Wright TL (1991a) Lava flow hazards from Kilauea'scurrent eruption. Geotimes 36, 5: 16-19
Heliker CC, Wright TL (1991b) The Puu Oo-Kupaianaha eruptionof Kilauea. EOS 72: 521-530
Hill DP, Zucca JJ (1987) Geophysical constraints on the structureof Kilauea and Mauna Loa volcanoes and some implicationsfor seismomagmatic processes. US Geol Surv Prof Pap1350:903-918
Ho RA, Garcia MO (1988) Origin of differentiated lavas at Kilauea Volcano, Hawaii: implications from the 1955 eruption.Bull Volcanol 50: 35-46
Holcomb RT (1987) Eruptive history and long-term behavior ofKilauea Volcano. US Geol Surv Prof Pap 1350:261-350
Jaggar TA (1919a) Monthly bulletin of the Hawaiian Volcano Observatory. 7,10: 127-159
Jaggar TA (1919b) Monthly bulletin of the Hawaiian Volcano Observatory. 7, 11: 161-173
Jaggar TA (1919c) Monthly bulletin of the Hawaiian Volcano Observatory. 7, 12: 175-199
Jaggar TA (1920a) Monthly bulletin of the Hawaiian Volcano Observatory. 8, I: 1-14
Jaggar TA (1920b) Monthly bulletin of the Hawaiian Volcano Observatory. 8, 2: 17-30
Jaggar TA (1920c) Monthly bulletin of the Hawaiian Volcano Observatory. 8, 6: 96-77
Jaggar TA (1920d) Monthly bulletin of the Hawaiian Volcano Observatory. 8, 7: 79-85
Jaggar TA (1920e) Monthly bulletin of the Hawaiian Volcano Observatory. 8, 8: 89-95
Jaggar TA (1920f) Monthly bulletin of the Hawaiian Volcano Observatory. 8,9:97-110
Jaggar TA (1930) When Kilauea Mountain broke open 1920. Volcano Letter 282: 1-3
Jaggar TA (1947) Origin and development of craters. Geol SocAm Mem 21 : 508 pp
Jaggar TA, Finch RY (1929) Tilt records for thirteen years at theHawaiian Volcano Observatory. Seism Soc Am Bull 19:3851
Kauahikaua J, Jackson DB, Zablocki CJ (1986) Resistivity structure to a depth of 5 km beneath Kilauea Volcano, Hawaii fromlarge-loop-source electromagnetic measurements (0.04-8 Hz) JGeophys Res 91: 8267-8283
Klein FW, Koyanagi RY, Nakata JS, Tanigawa WR (1987) The
203
seismicity of Kilauea's magma system. US Geol Surv Prof Pap1350: 1019-1185
Macdonald GA (1962) The 1959 and 1960 eruptions of Kilaueavolcano, Hawaii, and the construction of walls to restrict thespread of the lava flows. Bull Volcanol 24: 249-294
Macdonald GA, Abbot AT, Peterson FL (1983) Volcanoes in thesea the geology of Hawaii. University of Hawaii Press, Honolulu. 517 pp
Peterson DW (1967) Geologic map of the Kilauea Crater quadrangle, Hawaii: US Geol Surv Geol Quad Map GQ-667(I: 24000)
Peterson DW, Moore JG (1987) Geologic history and evolution ofgeologic concepts, island of Hawaii. US Geol Surv Prof Pap1350: 149-189
Peterson DW, Tilling RI (1980) Transition of basaltic lava frompahoehoe to a'a, Kilauea Volcano, Hawaii: field observationsand key factors. J Volcanol Geotherm Res 7: 271-293
Rhodes JM, Wenz KP, Neal CA, Sparks JW, Lockwood JP(1989) Geochemical evidence for invasion of Kilauea's plumbing system by Mauna Loa magma. Nature 337: 257-260
Rowland SK, Walker GPL (1987) Toothpaste lava: characteristicsand origin of a lava structural type transitional between pahoehoe and a'a. Bull VolcanoI49:631-641
Rowland SK, Walker GPL (1990) Pahoehoe and a'a in Hawaii:volumetric flow rate controls the lava structure. Bull Volcanol52:615-628
Rubin AM, Pollard DD (1987) Origins of blade-like dikes in volcanic rift zones. US Geol Surv Prof Pap 1350: 1449-1470
Ryan MP, Koyanagi RY, Fiske RS (1981) Modeling the threedimensional structure of macroscopic magma transport systems: application to Kilauea Volcano, Hawaii. J Geophys Res86:7111-7129
Swanson DA (1972) Magma supply rate at Kilauea Volcano,1952-1971. Science 175: 160-170
Swanson DA, Duffield WA, Jackson DB, Peterson DW (1979)Chronological narrative of the 1969-71 Mauna Ulu eruption ofKilauea Volcano, Hawaii. US Geol Surv Prof Pap 1056: 55pp
Thomas D (1987) A geochemical model of the Kilauea east riftzone. US Geol Surv Prof Pap 1350: 1507-1525
Tilling RI, Christiansen RL, Duffield WA, Endo ET, HolcombRT, Koyanagi RY, Peterson DA, Unger JD (1987) The 19721974 Mauna Ulu eruption, Kilauea Volcano: an example ofquasi-steady-state magma transfer. US Geol Surv Prof Pap1350: 405-469
Ulrich GE (1986) Geology section of Hawaiian Volcano Observatory monthly report for December 1986
Ulrich GE, Wolfe EW, Heliker CC, Neal CA (1987) Puu 00 IV:evolution of a plumbing system. Hawaii Symposium on HowVolcanoes Work abstract vol p 259
Walker GPL (1987) The dike complex of Koolau volcano, Oahu:internal structure of a Hawaiian rift zone. US Geol Surv ProfPap 1350:961-996
Walker GW (1967) Geologic map of the Kau Desert quadrangle,Hawaii. US Geol Surv Geol Quad Map GQ-827 (1 :24000)
Wilson L, Head JW III (1988) Nature of local magma storagezones and geometry of conduit systems below basaltic eruptionsites: Puu 00, Kilauea east rift, Hawaii, example. J GeophysRes 93: 14785-14792
Wolfe EW, Garcia MO, Jackson DB, Koyanagi RY, Neal CA,Okamura AT (1987) The Puu 00 eruption of Kilauea Volcano,episodes 1-20, January 1983-June 1984. US Geol Surv ProfPap 1350:471-508
Wright TL (1971) Chemistry of Kilauea and Mauna Loa lava inspace and time. US Geol Surv Prof Pap 735: 40 pp
Editorial responsibility: D. Dzurisin