the adequacy of comparison group designs for evaluations ... designs for evaluations of...
TRANSCRIPT

The Adequacy of Comparison Group Designs for Evaluations of Employment-Related Programs
Thomas Fraker and Rebecca Maynard
ABSTRACT
This study investigates empirically the strengths and limitations of using experimental versus nonexperimental designs for evaluating employment and training programs. The assessment involves com-
paring results from an experimental-design study-the National
Supported Work Demonstration-with the estimated impacts of Supported Work based on analyses using comparison groups con- structed from the Current Population Surveys. The results indicate that nonexperimental designs cannot be relied on to estimate the
effectiveness of employment programs. Impact estimates tend to be sensitive both to the comparison group construction methodology and to the analytic model used. There is currently no way a priori to ensure that the results of comparison group studies will be valid indicators of the program impacts.
I. Introduction
The strengths and limitations of experimental versus nonex- perimental designs for evaluations of social and economic policy interven- tions have been discussed at great length during the past 20 years.1 However, the relative merits of experimental and nonexperimental designs has per-
1. Boruch (1976) presents probably the most comprehensive survey of empirical evidence in support of the alternative strategies.
Fraker is a senior economist and Maynard is vice president of Mathematica Policy Research, Inc. They are grateful to Robinson Hollister and an anonymous referee for very helpful comments on an earlier version of this paper. This paper is based, in part, on research funded under U.S. Department of Labor contract number 20-11-82-15. However, this paper does not necessarily represent the official opinion or policy of the Department of Labor. THE JOURNAL OF HUMAN RESOURCES * XXII * 2
This content downloaded from 128.95.155.147 on Mon, 28 Jul 2014 19:09:26 PMAll use subject to JSTOR Terms and Conditions
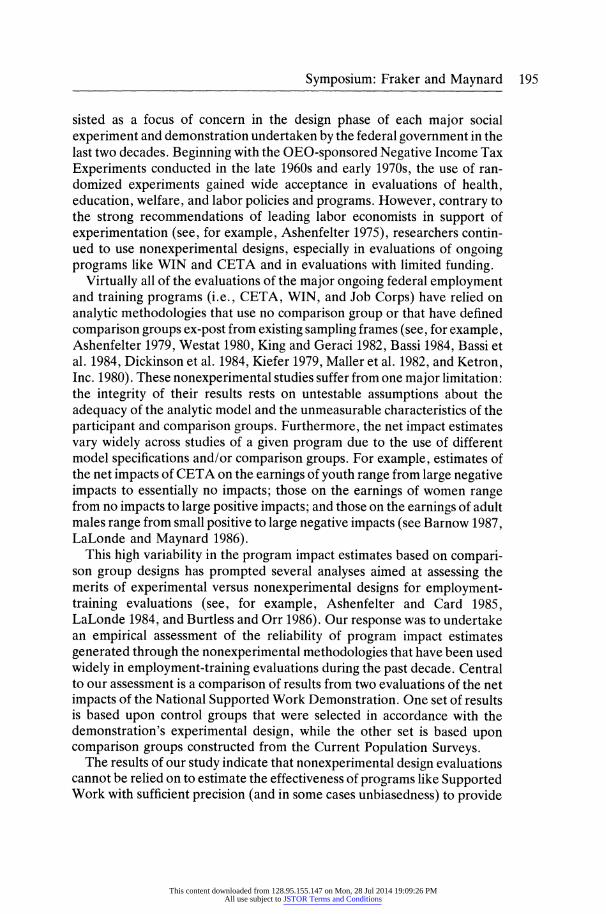
Symposium: Fraker and Maynard 195
sisted as a focus of concern in the design phase of each major social experiment and demonstration undertaken by the federal government in the last two decades. Beginning with the OEO-sponsored Negative Income Tax Experiments conducted in the late 1960s and early 1970s, the use of ran- domized experiments gained wide acceptance in evaluations of health, education, welfare, and labor policies and programs. However, contrary to the strong recommendations of leading labor economists in support of experimentation (see, for example, Ashenfelter 1975), researchers contin- ued to use nonexperimental designs, especially in evaluations of ongoing programs like WIN and CETA and in evaluations with limited funding.
Virtually all of the evaluations of the major ongoing federal employment and training programs (i.e., CETA, WIN, and Job Corps) have relied on analytic methodologies that use no comparison group or that have defined comparison groups ex-post from existing sampling frames (see, for example, Ashenfelter 1979, Westat 1980, King and Geraci 1982, Bassi 1984, Bassi et al. 1984, Dickinson et al. 1984, Kiefer 1979, Maller et al. 1982, and Ketron, Inc. 1980). These nonexperimental studies suffer from one major limitation: the integrity of their results rests on untestable assumptions about the adequacy of the analytic model and the unmeasurable characteristics of the participant and comparison groups. Furthermore, the net impact estimates vary widely across studies of a given program due to the use of different model specifications and/or comparison groups. For example, estimates of the net impacts of CETA on the earnings of youth range from large negative impacts to essentially no impacts; those on the earnings of women range from no impacts to large positive impacts; and those on the earnings of adult males range from small positive to large negative impacts (see Barnow 1987, LaLonde and Maynard 1986).
This high variability in the program impact estimates based on compari- son group designs has prompted several analyses aimed at assessing the merits of experimental versus nonexperimental designs for employment- training evaluations (see, for example, Ashenfelter and Card 1985, LaLonde 1984, and Burtless and Orr 1986). Our response was to undertake an empirical assessment of the reliability of program impact estimates generated through the nonexperimental methodologies that have been used widely in employment-training evaluations during the past decade. Central to our assessment is a comparison of results from two evaluations of the net impacts of the National Supported Work Demonstration. One set of results is based upon control groups that were selected in accordance with the demonstration's experimental design, while the other set is based upon comparison groups constructed from the Current Population Surveys.
The results of our study indicate that nonexperimental design evaluations cannot be relied on to estimate the effectiveness of programs like Supported Work with sufficient precision (and in some cases unbiasedness) to provide
This content downloaded from 128.95.155.147 on Mon, 28 Jul 2014 19:09:26 PMAll use subject to JSTOR Terms and Conditions

196 The Journal of Human Resources
policymakers with adequate information to guide decisions such as those
regarding resource allocation, targeting, and program design.2 We demon- strate that program impact estimates may differ substantially between those
generated using randomly selected control groups and those generated using comparison groups. We also observe that the impact estimates tend to be sensitive to both the method used to construct comparison groups and the
specification of the analytic model.3 Most importantly, currently there are no objective means to judge a priori the merits of different comparison groups and analytic model specifications.
II. Sample and Data
The success of a study to assess alternative comparison-group methodologies for evaluating employment-training programs depends criti- cally on the available data. To allow "true" program impacts to be esti- mated, the data should include a program participant group that is repre- sentative of participants in the employment-training program that is to be evaluated and a randomly selected control group of eligible program appli- cants. Furthermore, it is important that the data base from which compari- son groups are to be drawn is comparable in terms of outcome measures and measures of personal characteristics to the data base for the program partici- pant group.
In conducting this study, we have taken advantage of a unique opportu- nity provided by a major national experiment, the National Supported Work Demonstration, to explore the adequacy of nonexperimental study designs for evaluating employment and training programs. The National Supported Work Demonstration, conducted between 1975 and 1979, was a field test of the effectiveness of a highly structured work experience program in mitigating the employment problems of four groups of persons with severe employment disabilities: young school dropouts, AFDC recipients, ex-drug addicts, and ex-offenders. Based on a control-group methodology, Supported Work was found to have increased significantly the employment and earnings of all four target groups during the period of program partici- pation (see Hollister et al. 1984). However, only the AFDC recipients showed evidence of postprogram earnings gains. These longer-term impacts
2. This conclusion is also supported by the results of a parallel research effort undertaken by LaLonde (1984). LaLonde also uses the Supported Work data base, but he employs different analytic models, uses different comparison groups, and a different source of the outcome measures than we used. This study is discussed further in Section V. 3. LaLonde (1984 and 1986) also found evidence of the sensitivity of impact results to the analytical model specification.
This content downloaded from 128.95.155.147 on Mon, 28 Jul 2014 19:09:26 PMAll use subject to JSTOR Terms and Conditions

Symposium: Fraker and Maynard 197
for the AFDC recipients were in the range of 5 to 10 percentage point increases in employment rates and $50 to $80 increases in average monthly earnings.
Our study of the sensitivity of net impact estimates to the evaluation design methodology focuses on the Supported Work Demonstration for three reasons. First, the intervention was similar to the work experience treatments within other employment-training programs. Second, the Sup- ported Work data are sufficiently similar to those used in the previous MDTA and CETA evaluations to permit us to replicate the nonexperimen- tal methodologies used in those prior studies, while offering us the advan- tage of the control group that can be used to obtain unbiased impact estimates for use as the assessment criteria. Third, there is substantial overlap in the target populations that were served by the Supported Work Demonstration, MDTA, CETA, and currently are served by JTPA.
We further focused our assessment on only two of the four Supported Work target groups: AFDC recipients and youth. These two groups are similar in important respects to youth and adult female participants in MDTA, CETA, and JTPA, and nominally similar individuals can be iden- tified in data sets from which comparison groups might be selected. In contrast, data on the defining attributes of the Supported Work ex-offender and ex-addict target groups-their criminal histories and their drug use- are not available on the data bases that are potential sources of comparison groups.
A. The Supported Work Sample and Data
The Supported Work sample includes 1,244 school dropouts (566 ex- perimentals and 678 controls) ages 17 to 20 years and 1,602 female long-term recipients of AFDC, none of whom had a child younger than age 6 (800 experimentals and 802 controls).
The characteristics of the youth sample mirror the Supported Work youth eligibility criteria. About 60 percent were younger than age 19, nearly three-quarters had completed fewer than eleven years of schooling, and more than 40 percent had not been employed in the year prior to enroll- ment. In addition, over 85 percent of the youth were males, and over 70 percent were black (see Maynard 1984).
The typical person in the AFDC sample was 34 years old, was black, had ten years of schooling, had two dependents, and had a youngest child between the ages of six and twelve. The average welfare payment was about $280 per month, with an additional average food stamp bonus value of about $70. The women had received welfare for almost nine years on average, and the average length of time since the last regular job for those with some prior work experience was nearly four years (see Masters and Maynard 1984).
This content downloaded from 128.95.155.147 on Mon, 28 Jul 2014 19:09:26 PMAll use subject to JSTOR Terms and Conditions

198 The Journal of Human Resources
The initial Supported Work evaluation relied on data from interviews conducted at baseline and at nine-month intervals for between 18 and 36 months after sample enrollment.4 The baseline interview obtained informa- tion on demographic characteristics, employment history, welfare depend- ence, and household composition as of the time of enrollment in the sample. Program outcome measures such as employment, earnings, and welfare
dependence, were obtained in the follow-up surveys. We augmented the Supported Work interview data with Social Security
records of annual earnings for the years 1972 through 1981. Through the addition of these data, we were able to have measures of earnings for
Supported Work experimentals and controls that were comparable to earn-
ings measures for the comparison groups we were to construct. However, it is important to note that the Social Security records of earnings for the
Supported Work sample were made available to us in the form of mean annual earnings for groups of seven to ten sample members,5 where we had
pre-assigned sample members to cells on the basis of (1) target group (AFDC or youth), (2) experimental status, (3) date of enrollment (prior to or not prior to April 1976), (4) whether they were employed in the year prior to enrollment, and (5) site.6 The resulting analysis sample for AFDC indi- viduals consists of 1,602 observations-800 experimentals grouped into 110 Social Security cells and 802 controls grouped into 107 cells. The sample for
youth consists of 1,241 observations-566 experimentals grouped into 69 cells and 678 controls grouped into 87 cells.7
The majority of our descriptive and analytic work utilized individual-level data. However, of necessity, the final impact estimates were obtained from
grouped data. This use of grouped data complicates the analysis slightly and reduces the efficiency of the program impact estimates. However, it does not bias the impact estimates.
4. Those enrolled in the sample prior to April 1976 were to have generated 36 months of follow-up data; those enrolled between April and December 1976 were to have generated 27 months of follow-up data; and those enrolled during 1977 were to have generated only 18 months of follow-up data. 5. The restriction on access to individual-specific data was imposed by the Social Security Administration in response to provisions of the Privacy Act. 6. This cell grouping was based on the prior judgments that neither members of different target groups nor experimentals and controls should be combined in the same cell. Other cell identifiers were selected on the basis of the results of the strength of their relative predictive power in an earnings equation (determined using the Automatic Interaction Detector, AID III, Software). See Appendix A for further details of the cell grouping procedure. 7. The average cell size was 7.38 among the AFDC target group and 7.97 among the youth sample. Appendix A describes how observations were combined into groups.
This content downloaded from 128.95.155.147 on Mon, 28 Jul 2014 19:09:26 PMAll use subject to JSTOR Terms and Conditions

Symposium: Fraker and Maynard 199
2. Comparison Group Samples
The Current Population Survey has most often been used as the source of comparison samples in prior evaluations of employment and training pro- grams. Therefore, it was appropriate for our purposes. In the two Current Populations Surveys (March 1976 and March 1977) from which we con- structed comparison samples, there were 14,084 youth, 2,368 of whom had dropped out of school prior to completing high school, and 1,995 AFDC recipients, 909 of whom had no young children.
The March CPS collects detailed data on current employment status and work experience during the previous year, as well as basic demographic and background data.8 Furthermore, individual-specific Social Security earnings data for 1951 through 1979 have been appended to the CPS files.9 Once the comparison samples were selected, the observations were grouped together in a manner comparable to that used to group the Supported Work ex- perimental and control observations (see Appendix A). Group mean Social Security earnings for the experimental, control, and comparison samples were used in conducting the impact analyses.
III. Experimental versus Nonexperimental Estimates of Program Impacts
The reliability of program impact estimates depends critically on obtaining good estimates of what the outcomes for the participant group would have been had this group not received program services. The best way to obtain such estimates is through the use of an experimental design whereby a random subset of the eligible program applicants is assigned to a no-treatment control group.10 The availability of such a control group is one of the unique features of the National Supported Work Demonstration. In this demonstration, program impacts can be measured quite simply by comparing the mean values of the outcomes for experimentals and controls. However, as noted above, most employment-training evaluations have not had the benefit of a control group and, therefore, have relied on comparison groups constructed from nonprogram data bases. Since the comparison
8. To some extent, the Supported Work interviews were modeled after the CPS surveys and, thus, the baseline data for the two samples are reasonably similar. 9. This was done for Westat, Inc., as part of its efforts to develop public-use tapes for the Continuous Longitudinal Manpower Survey of CETA participants (see Westat, July 1981). 10. See for example, Ashenfelter's (1975) strong push for the use of experimental designs in employment-training evaluations. Also, see a more recent article by Burtless and Orr (1986).
This content downloaded from 128.95.155.147 on Mon, 28 Jul 2014 19:09:26 PMAll use subject to JSTOR Terms and Conditions
200 The Journal of Human Resources
group samples generally differ in some important respects from the partici- pant samples, evaluators have tended to estimate program impacts using multivariate models that control statistically for such differences.
In this section, we discuss estimates of Supported Work impacts that we obtained by using comparison group construction procedures and analytic models similar to those used in the many recent assessments of the CETA program. We assess the reliability of these estimates by contrasting them with those generated using the control group. Sections IV and V, respec- tively, probe our understanding of these basic results by examining the sensitivity of nonexperimental impact estimates to the particular compari- son group construction procedure and to the analytic model specification used.
A. The "Basic" Comparison Groups
We constructed a "basic" comparison group for both the Supported Work Youth and AFDC samples using cell matching procedures similar to those used in much of the prior CLMS research (see, for example, Westat 1980 and Dickinson et al. 1984). Essentially, we selected cases from the CPS that met the key target group eligibility criteria (age 16 to 20 and school drop-out for youth, and AFDC recipient and no child younger than six for AFDC recipients). Second, we divided the individual observations in both the Supported Work experimental samples and the CPS samples into cells defined by characteristics that predict preprogram earnings. For youth, these cells were defined by gender, preprogram earnings, change in pre- program earnings, race/ethnicity, education, and age. For AFDC recip- ients, the cells were defined by changes in preprogram earnings, age, pre- program employment experience, preprogram earning, and race/ethnicity." Once sample members were assigned to cells, three steps were taken: (1) small cells were combined; (2) CPS cases in cells for which there are no Supported Work sample members were eliminated; and (3) weights were assigned to the sample members' records such that the weighted pro- portional distributions of experimental and comparison group observations across cells are equal. The resulting "basic" comparison samples include 1,120 youth and 554 AFDC recipients.
B. The "Basic" Analytic Models
Although the control and comparison groups have been defined such that their preprogram characteristics (weighted) are similar, their postprogram earnings paths tend to differ, especially for the youth samples. As seen in
11. See Fraker and Maynard (1984) for a more detailed specification of the cell definitions.
This content downloaded from 128.95.155.147 on Mon, 28 Jul 2014 19:09:26 PMAll use subject to JSTOR Terms and Conditions

Symposium: Fraker and Maynard 201
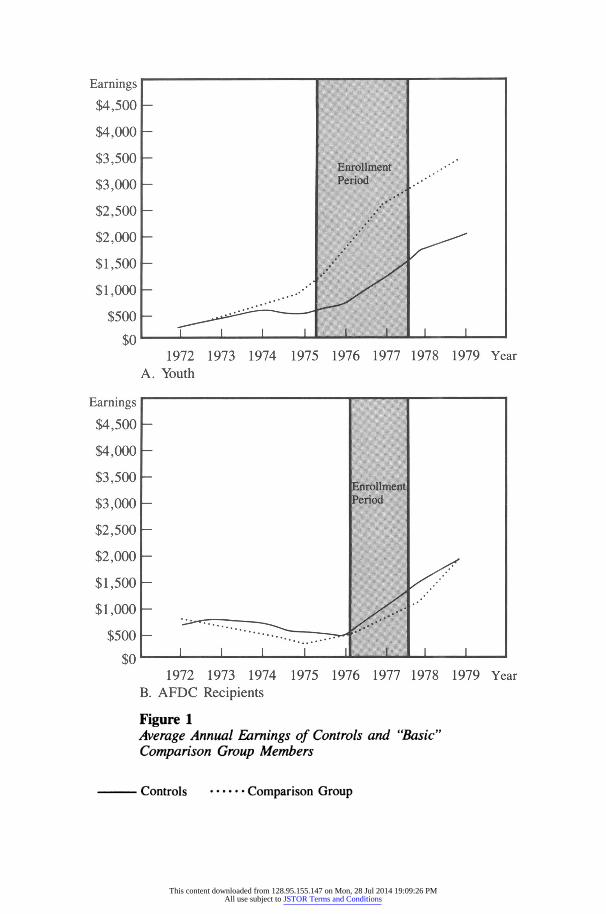
Figure 1A, the earnings of the control and comparison group youth are very similar and show small annual increases during the preprogram period (1972 through 1974). However, the earnings paths diverge significantly during the enrollment years (1975 through early 1977) and the follow-up period (1978, 1979), with the comparison group exhibiting a much steeper age-earnings profile than the control group. For the AFDC control group, Figure 1B shows fairly constant earnings levels during the preenrollment period, with larger annual increases beginning near the middle of the enrollment period. In general, the earnings of the "basic" comparison sample follow a similar trend, but increase at a somewhat slower rate during the enrollment and follow-up periods than is the case for the control group members.
In an effort to control statistically for factors that account for this postpro- gram divergence between the earnings of controls and comparison group members, we estimated program impacts using a "basic" regression model similar to those commonly used in other employment-training evaluations. The basic model assumes that earnings are a function of prior earnings, personal characteristics, and environmental factors,'2 as well as program participation. Program impacts are measured by the estimated coefficient on the program participation variable. Underlying this model are two criti- cal assumptions: (1) that the control variables fully account for factors that are correlated with both program participation and the outcome of interest (earnings, in our case); and (2) that the underlying behavioral models of the determinants of earnings are similar for the participant and comparison groups.
C. The Findings
We estimated program impacts on annual earnings in each of the three years, 1977 through 1979, from the "basic" analytic model described above using both the control and the "basic" comparison samples.l3 The results, summarized in Table 1, indicate that, had we been constrained to use comparison group methods for the original Supported Work evaluation and
12. The particular factors controlled for include prior earnings, age, education, gender (youth only), race/ethnicity, work experience, family income, AFDC receipt, experimental status, and enrollment date. See Appendix Table B1. 13. As has been pointed out by Dickinson et al. (1984), the 1979 Social Security earnings data for the CPS sample include some zero values that should be positive. For this reason, mean earnings of the sample are biased downward, causing a downward bias in net program impact estimates.
Participants in the Supported Work Demonstration were enrolled between April 1975 and July 1977 for up to 18 months of work experience. Thus, the earnings reported by this group for the years 1977, 1978, and 1979 include some in-program earnings. However, the proportion of participants who had some in-program earnings declines sharply across the three years and is negligible in 1979.
This content downloaded from 128.95.155.147 on Mon, 28 Jul 2014 19:09:26 PMAll use subject to JSTOR Terms and Conditions
Earnings
$4,500
$4,000
$3,500
$3,000
$2,500
$2,000
$1,500
$1,000
$500
I$0 I I I II II I $0 1972 1973 1974 1975 1976 1977 1978 1979 Year
A. Youth
Earnings
$4,500
$4,000
$3,500
$3,000
$2,500
$2,000
$1,500
$1,000
$500
$0 L II I I ii i I _1 1
1972 1973 1974 1975 1976 1977 1978 1979 Year B. AFDC Recipients
Figure 1 Average Annual Earnings of Controls and "Basic" Comparison Group Members
- Controls ..* Comparison Group
0
0
0
00. *
I
I
I
I
???
??? ??? ??? ??? ??
This content downloaded from 128.95.155.147 on Mon, 28 Jul 2014 19:09:26 PMAll use subject to JSTOR Terms and Conditions

Symposium: Fraker and Maynard 203
Table 1 Experimental versus Nonexperimental Estimates of Program-Induced Annual Earnings Effects: "Basic" Comparison Group and Analytic Model (standard errors are in parentheses)
Youth AFDC Recipients
Control Comparison Control Comparison Year Group Group Group Group
1977 313* -668* 1,423** 1,560* (134) (310) (162) (400)
1978 -28 -1,191** 505** 537 (135) (373) (137) (335)
1979 -18 -1,179** 351* 257 (166) (375) (174) (465)
Number of Individual Observations Experimentals 566 566 800 800 Controls/Comparisons 678 2,368 802 909
Number of Grouped Observations Experimentals 69 69 110 110 Controls/Comparisons 87 112 107 73
Note: These results were estimated on the grouped observations using weighted least squares. *Statistically significant at the 5 percent level.
**Statistically significant at the 1 percent level.
had we chosen the "basic" comparison-group construction procedure and analytic model, we would have arrived at qualitatively similar conclusions to the experimental study findings for AFDC recipients-that the program had relatively large positive effects. However, comparison group methods would have led to quite misleading conclusions about the effects of Sup- ported Work on youth. In essence, while Supported Work led to significant short-run increases in earnings of youth as a result of the program jobs (the 1977 results) and no long-run effect (the 1978 and 1979 results), we would have concluded that Supported Work had significant, large negative effects on the earnings of youth, both during their Supported Work employment period and subsequently.
Prior to drawing any generalized conclusions regarding the policy implica- tions of these findings, we must ask the following question: To what extent are these particular results due to the comparison group construction proce- dure and analytic model used? This question is important for two reasons. First, the high variability in the net impact estimates of CETA across studies
This content downloaded from 128.95.155.147 on Mon, 28 Jul 2014 19:09:26 PMAll use subject to JSTOR Terms and Conditions

204 The Journal of Human Resources
that have used slightly different comparison groups and/or analytic models indicates that these analytic decisions are important. Second, pursuit of the answers to this question could provide important insights into criteria for judging nonexperimental analytic strategies.
IV. Alternative Comparison Group Construction Procedures
To test the sensitivity of the impact estimates to the compari- son group, we constructed five alternatives to the "basic" CPS comparison samples discussed above for both the Supported Work youth and AFDC samples: two were random samples satisfying certain program eligibility criteria; one was constructed using the cell matching techniques but with a more limited list of cell identifiers than was used in constructing the "basic" comparison samples described above; and two were constructed using statis- tical matching procedures. Table 2 summarizes the basic approach and the resulting sample size for each comparison sample, including those used in the central analysis discussed above.4
The random comparison samples were the simplest to construct, since we simply identified CPS cases meeting the specified Supported Work eligibility criteria; one variation was based upon more comprehensive eligibility criteria than was the other. The alternative cell match comparison samples were constructed using only those few characteristics determined to be predictors of preprogram earnings (age, sex, and race/ethnicity for youth, and education and race/ethnicity for AFDC recipients).
The statistical match comparison groups were constructed by selecting CPS cases for each supported work case on the basis of the closeness of predicted scores on a predetermined outcome criteria. In previous statistical match applications, two contrasting approaches have predominated: one where the scoring algorithm emphasizes a closeness-of-fit on the predicted outcome, and one where it emphasizes a closeness-of-fit on characteristics correlated with the outcome of interest. Our initial approach "matched" CPS and Supported Work cases on predicted earnings measures, where these measures were calculated using coefficients from 1979 earnings equa- tions estimated on the individual-specific data for the CPS samples of young school dropouts and of AFDC recipients with no young children. In our alternative approach, we first assigned individual CPS and Supported Work
14. In constructing all comparison samples, only CPS cases with valid Social Security numbers and reasonable matches on identifying information in the CPS and Social Security data bases were considered.
This content downloaded from 128.95.155.147 on Mon, 28 Jul 2014 19:09:26 PMAll use subject to JSTOR Terms and Conditions

Symposium: Fraker and Maynard 205
cases to cells defined by key sample characteristics and then matched on predicted earnings. More detail on the matching procedures is provided in Fraker and Maynard (1984).
A. Characteristics and Behavior of Comparison versus Control Samples
Not surprisingly, the less narrowly defined random samples of youth and AFDC recipients from the CPS (Stage 1 samples) did not match the pro- gram-participant samples well along most measurable characteristics. Fur- thermore, although the comparability of the participant and comparison samples was substantially improved by limiting the comparison samples to CPS observations that met the more comprehensive Supported Work eligi- bility criteria for youth and AFDC recipients (Stage 2 random samples and the initial statistical match samples), large differences persisted. Most no- tably, minorities are greatly underrepresented in both the random compari- son and initial statistical match samples, undoubtedly due to the urban focus of the Supported Work Demonstration.
Among the youth Stage 2 random sample and initial statistical match sample, both females and married youth are overrepresented, since the Supported Work Demonstration attracted predominately unmarried minority males. The CPS random sample of AFDC recipients with no young children (Stage 2) differs from the Supported Work AFDC sample with respect to its higher average age and higher rate of employment in the base year. The initial statistical match sample for AFDC recipients provides a good match between CPS and Supported Work cases on base year employ- ment, but the age discrepancy persists.
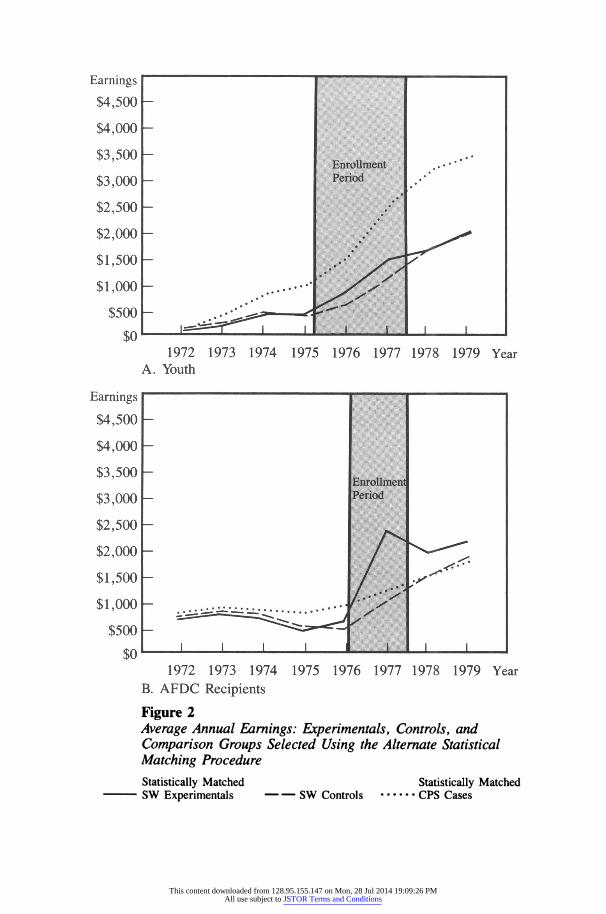
Only the samples obtained by matching on predicted earnings within cells-the alternate statistical matching procedure-were reasonably com- parable in their characteristics to the program participant groups. Yet, Figure 2A shows that, despite the reasonably close match on background characteristics, the earnings profiles of the youth control and comparison groups are strikingly different; the profile for the comparison group is consistently much steeper than that of the control group. In contrast, as seen in Figure 2B the earnings profiles of the AFDC control and comparison groups generated through this procedure are reasonably similar to one another.
Tests of the comparability of the earnings models of the comparison and control samples failed for nearly half of the comparison sample/control sample combinations-an expected outcome in view of the pervasive differ- ences in the characteristics of the participant and comparison samples and the observed differences in the earnings trends over time, especially for youth. These results suggest the importance of careful model specification and examination of the comparability of behavioral relationships for com-
This content downloaded from 128.95.155.147 on Mon, 28 Jul 2014 19:09:26 PMAll use subject to JSTOR Terms and Conditions

Table 2 Summary of Comparison Group Methodologies and Sample Sizes
Youth AFDC Recipients
Sample Number Sample Number Construction of Construction of Procedures Cases Procedures Cases
Basic Comparison Groupa (Long List Cell Match)
Random Sampling Stage 1 screens
Stage 2 screens
16 to 20-year-old dropouts that match Supported Work cases on:
(1) Sex, (2) Prior earnings, (3) Change in prior earnings, (4) Race, (5) Education, and (6) Age
10 percent of cases Age 16 to 20
All 16 to 20-year-old school dropouts
871 to
1,120
Female AFDC recipients with no young children who match Supported Work cases on:
(1) Change in earnings, (2) Age, (3) Prior employment, (4) Prior earnings, and (5) Race
1,424 All female AFDC recipients
2,368 All female AFDC recipients with no young children
k)
D
O
0 0
-t C)
C) Cl
?O 0
c
c/s
554
1,995
909
This content downloaded from 128.95.155.147 on Mon, 28 Jul 2014 19:09:26 PMAll use subject to JSTOR Terms and Conditions

Alternative Cell Match (Short List)
Statistical Match
Initial match
Statistical match within strata
16 to 20-year-old dropouts that match Supported Work cases on:
(1) Age, (2) Sex, and (3) Race
16 to 20-year-old youth who most closely match Sup- ported Work cases on pre- dicted earnings:
One-to-one match with a max- imum difference of $500 in
predicted earnings Closest match within strata de-
fined by sex and race. Penal- ties imposed for previous se- lection into the sample and for nonurban residence. Maximum difference of $500 in predicted earnings.
Female AFDC recipients with no young children who match Supported Work cases on:
2,365 (1) Education and (2) Race
Female AFDC recipients with no young children who most closely match Sup- ported Work cases on predicted earn- ings:
558 One-to-one match with a maximum dif- ference of $500 in predicted earnings
557b Closest match within strata defined by age and race. Penalties imposed for previous selection and for nonurban residence. Maximum difference of $500 in predicted earnings.
Note: See Fraker and Maynard (1984) for a complete description of the sample construction procedures. a. These are the comparison groups used in the analysis discussed in Section III. b. These cases were matched with replacement: 269 different cases were matched a total of 557 times. c. These cases were matched with replacement; 336 different cases were matched a total of 786 times.
909
582
786c
-t
-t
: .
s
CD c)t
P:
k<
CL
This content downloaded from 128.95.155.147 on Mon, 28 Jul 2014 19:09:26 PMAll use subject to JSTOR Terms and Conditions
Earnings
$4,500
$4,000
$3,500
$3,000
$2,500
$2,000
$1,500
$1,000
$500
Wv
1972 1973 1974 1975 1976 1977 A. Youth
Earnings
$4,500
$4,000
$3,500
$3,000
$2,500
$2,000
$1,500
$1,000
$500 ?tn
I I9
1978 1979 Year
I I I I
ear
hed
q>U
1972 1973 1974 1975 1976 1977 1978 1979 Ye B. AFDC Recipients
Figure 2 Average Annual Earnings: Experimentals, Controls, and Comparison Groups Selected Using the Alternate Statistical Matching Procedure
Statistically Matched Statistically Matcl SW Experimentals -- SW Controls ......CPS Cases
I.e Ie 1 1
I I
This content downloaded from 128.95.155.147 on Mon, 28 Jul 2014 19:09:26 PMAll use subject to JSTOR Terms and Conditions

Symposium: Fraker and Maynard 209
parison and program participant groups prior to launching a nonexperimen- tal impact evaluation.
B. Sensitivity of Program Impact Estimates
The results presented in Table 3 demonstrate quite clearly the sensitivity of impact estimates to the methodology used to construct the comparison group. For example, with the "basic" analytic model specification, dis- cussed above, the program impact estimates vary substantially depending on the comparison group used.
The results are especially striking for youth: not only do the magnitude of the net-impact estimates from analyses using the control group differ sub- stantially from those based on all of the comparison groups but also, for many of the estimates, the qualitative judgments about the impacts of the demonstration differ among the comparison groups estimates. For example, reading across the top row in Table 3, we see that, relying on the ex- perimental design, the estimated impact on 1977 earnings is a statistically significant increase of $313. The point estimate of the impact is $166 (not statistically significant) using the random sample of youth in the CPS, and the point estimates range from - $388 to - $774 for the other comparison groups, with two of these negative estimates being statistically significant. Based on the two statistical match comparison groups, we would conclude that Supported Work had no effects for any time period; with the long-list cell match sample, we would conclude that the program had negative impacts in all time periods; and with all of the other comparison groups, we would conclude that it had negative impacts in most time periods and no effects in others.
For the AFDC sample, the qualitative conclusions one would draw are roughly comparable across the estimates based on the various comparison samples. In each case, the weight of the evidence is that the program had large impacts on earnings during the in-program period and that, although the size of the impacts diminished over time, they were still relatively large as late as 1979. However, the nonexperimental estimates range from 73 percent smaller to 129 percent larger than the experimental estimates in the latter two years and, more often than not, the comparison group estimates are not statistically significant, whereas all of the experimental estimates are statistically significant. The swings in the numbers can affect substantially judgments as to the cost-effectiveness of the program, and the variability in the statistical significance undoubtedly affects the usefulness of the findings to policymakers.
This content downloaded from 128.95.155.147 on Mon, 28 Jul 2014 19:09:26 PMAll use subject to JSTOR Terms and Conditions

Table 3 Estimated Impacts of Supported Work on the Annual Earnings of Youth and AFDC Recipients: Alternative Comparison Groups
Supported Random Samples Short Statistical Work "Basic" Cell Match Samples
Target Group and Control Comparison Stage 1 Stage 2 Match Outcome Measure Group Groups Screens Screens List Initial Alternate
Youth 1977 Earnings 313* -668* 166 -624* -388 -511 -774 1978 Earnings -28 -1,191** -789 -939** -699* -408 -873 1979 Earnings -18 -1,179** -1,937** -890 -687* -339 -1,146 Number of Grouped Observationsa Experimentals 69 9 69 69 6 9 69 69 69 Controls/Comparisons 87 112 158 321 320 71 71
AFDC Recipients 1977 Earnings 1,423** 1,560** 1,568** 1,543** 1,696** 1,266** 1,256** 1978 Earnings 505** 537 872** 472 782** 515 345 1979 Earnings 351* 257 710* 584 806** 683 723* Number of Grouped Observationsa Experimentals 110 110 110 110 110 110 110 Controls/Comparisons 107 73 266 117 117 74 74
Note: Standard deviations of the program impact estimates are presented in Appendix Tables D.1 and E.11 of Fraker and Maynard (1984). These results were estimated from the "basic" analytic model described above. The regression coefficients for the models underlying these results for 1977 and 1979 are presented in Appendix Tables C.3 through C.6 of Fraker and Maynard (1984). a. The number of observations pertains to the number of groups of seven to ten individuals for whom mean SSA-reported earnings data were obtained (experimentals and controls) or computed ex-post (comparison groups). *Statistically significant at 5 percent level, two-tailed test.
**Statistically significant at 1 percent level, two-tailed test.
CD
C- 0 c_
0
f_ El
o
CD
CA
This content downloaded from 128.95.155.147 on Mon, 28 Jul 2014 19:09:26 PMAll use subject to JSTOR Terms and Conditions
Symposium: Fraker and Maynard 211
V. Alternative Analytic Models
In addition to the "basic" earnings model described in Section II above, we also estimated program impacts using two other models: a simple earnings-gains model, which was commonly used in the early evalua- tions of the MDTA program;'5 and fixed effects estimates which were commonly used in both the MDTA and CETA evaluations.6 The basic formulation and underlying assumptions of these alternative analytic mod- els can be summarized briefly as follows:
* Simple Earnings-Gains Model. This model is a special case of the fixed-effects model, in which the expected earnings gain from the preprogram to the postprogram period is assumed to be constant (but not necessarily the same) for the participant and for the control/ comparison group. The impact of the program is measured by the difference between the mean earnings gain for experimentals and the control/comparison group.
* Fixed-Effect Estimator. This model assumes that the change in earn- ings between pre- and postprogram periods can be explained by changes in personal characteristics and environmental conditions during the intervening period and by program participation. This model essentially assumes that any unobserved and uncontrolled-for factors that are correlated with program participant status and earn- ings are constant over time and, thus, that any bias in the impact estimates due to unobserved differences between the participant and comparison groups can be controlled for by "differencing" a base- year and outcome-year earnings equation. The model also assumes that the earnings structures are similar for the participant- and comparison-group members and that the basic models are similar across time periods.
In estimating the fixed-effects model, we used essentially the same set of control variables for both the youth and AFDC samples that were used in the "basic" earnings model described in Section B above. The ultimate choice of variables was based on several considerations: (1) the basic theory of labor supply, applied to these samples of young school dropouts and female welfare recipients, (2) consistency with the models used by Westat (1980), Dickinson et al. (1984), and Bassi et al. (1984) in their analyses of CETA net impacts, to the extent that we found such consistency feasible and practical given the differences in the samples, analytic models, and the data
15. See, for example, Perry et al. (1975). 16. See, for example, Ashenfelter (1979), Bassi (1984), Geraci (1984), and Bassi et al. (1984).
This content downloaded from 128.95.155.147 on Mon, 28 Jul 2014 19:09:26 PMAll use subject to JSTOR Terms and Conditions

212 The Journal of Human Resources
bases being used, and (3) data constraints. Appendix B describes the "basic" model and these two alternatives in more detail, and Appendix Table B1 defines the control variables used in each of the three analytic models.
A. Sensitivity of Results to the Analytic Model Specification
The results presented in Table 4 demonstrate some sensitivity of the impact estimates to the particular analytic model used. However, these results tend to vary less than do those based on different comparison groups. As ex-
pected, the estimates based on the control group design are not very sensi- tive to model specification, taking account of the correspondence between calendar years 1977, 1978, and 1979 used in the simple differences of means and the basic earnings models and the program years used in the fixed effects model.17 Similarly, when the comparison groups are utilized, there is a fair
degree of correspondence between the estimated impacts based on simple differences in earning gains and those estimated from the basic earnings model. However, the fixed-effects estimates based upon the comparison groups tend to differ substantially from the estimates generated by the other two analytic models.18 A comparison of estimates based on the comparison group methodology to estimates based on the control group methodology does not clearly show whether one analytic model consistently leads to better impact estimates than the others.
Regardless of the analytic model, the performance of comparison group methods for youth is overwhelmingly poor. Possible explanations are that the earnings models are simply misspecified and/or that the underlying behavioral models differ between the participant and comparison groups in ways that cannot be controlled for statistically. Although using an F-test we could reject the similarity of the underlying models for the youth compari- son and control samples in only a few instances, it is notable that the coefficients differ considerably both across samples and over time, suggest- ing that the models may nevertheless differ (also, refer to Figure 2 above and Fraker and Maynard 1984).
B. Sensitivity to Other Analytic Assumptions
In addition to varying the analytic models used in estimating net program impacts, we also pursued the question of the importance of several other
17. Essentially, the "primary entry year" is the calendar year during which most sample members in a group enrolled (1975, 1976, or 1977); and "primary year plus n" represents the nth calendar year after the primary entry year. 18. The impact estimates for 1977 correspond roughly to a weighted average of the "Primary Entry Year" and "Primary Entry Year + 1" results, for example.
This content downloaded from 128.95.155.147 on Mon, 28 Jul 2014 19:09:26 PMAll use subject to JSTOR Terms and Conditions

Symposium: Fraker and Maynard 213
Table 4 Estimated Net Impacts of Supported Work on Annual Earnings of Youth and AFDC Recipients: Alternative Analytic Models
Youth AFDC Recipients
Control Comparison Control Comparison Analytic Model Group Group Group Group
Basic Earnings Modela 1977 earnings 313* -668* 1,423** 1,560** 1978 earnings -28 - 1,191** 505** 537 1979 earnings -18 -1,179** 351* 257
Simple Difference in Earnings Gains
1977 earnings 326* -794** 1,421** 1,525** 1978 earnings -66 -1,018** 431** 695** 1979 earnings -7 -1,154** 285 184
Fixed Effects Model Primary entry year 557** -259 1,243** 1,330** Primary entry year + 1 110 -902** 746** 851** Primary entry year + 2 -35 -1,088** 349** 438* Primary entry year + 3 -82 - 1,547** 485 594
Number of Grouped Observationsb Experimentals 69 69 110 110 Controls/Comparisons 87 112 107 73
Note: These results are based on the "basic" comparison groups described in Section B above. Standard deviations of the program impact estimates are presented in Appendix Tables D.1 and E.11 of Fraker and Maynard (1984). a. The full sets of regression coefficients for the models underlying these results for 1977 and 1979 are presented in Appendix Tables C.3 through C.6 of Fraker and Maynard (1984). b. The number of observations pertains to the number of groups of seven to ten indi- viduals for whom mean SSA-reported earnings data were obtained (experimentals and controls) or computed ex-post (comparison groups). *Statistically significant at 5 percent level, two-tailed test.
**Statistically significant at 1 percent level, two-tailed test.
analytic factors. The nature of and conclusions from these investigations can be summarized as follows:
* Use of Grouped Data. As discussed above, due to confidentiality constraints, all of the impact estimates are based on analysis of grouped data. Comparisons of analytic models based on grouped and ungrouped data, using interview earnings for the Supported
This content downloaded from 128.95.155.147 on Mon, 28 Jul 2014 19:09:26 PMAll use subject to JSTOR Terms and Conditions

214 The Journal of Human Resources
Work experimental and control samples and using only Social Secur- ity earnings for the CPS sample, suggest that impact estimates are not sensitive to the use of grouped as opposed to individual-level data.
* Weighting. Two types of weights were used in this study: a correction for the heteroscedasticity introduced in a regression model by the use of grouped data, and a weight on individual observations gener- ated by the cell match procedures. The overall conclusion based on comparisons of net impact estimates generated using each of the four possible combinations of weights (no weights, only the heteroscedas- ticity weight, only the grouped data weight, and both weights)19 indicates that weighting had only minor effects on the results.20
* Other Tests for Youth. For youth, where the comparison samples yielded qualitatively and quantitatively different impact estimates than were obtained with the control group, we conducted impact analyses on sample subgroups in an effort to determine whether the greater flexibility this introduced into the analytic model would lead to improved estimates, at least for some subgroups of youth.21 In no case were the net-impact estimates noticeably more reliable for any of these subgroups of youth than were the results for the overall youth population.
We also experimented with including a few additional control variables and variables that represent interactions of selected control variables in the youth equations. Again, however, the net-impact
19. The cell match weights for individual observations were calculated as follows:
NE/NC
where NE denotes number of experimental observations; Nc denotes the number of control observations and j denotes the cell. For each grouped-observation, the cell match weight was then calculated as the sum over all individuals in the group of the cell match weight, Cj. The heteroscedasticity weight for grouping the data was computed as 1/VNj where Nj is the number of observations in each group. Finally, the combined weight for each grouped observation was specified as follows:
WT j-= Cij
See Appendix F of Fraker and Maynard (1984) for the derivation of these weights. 20. This finding is consistent with a finding reported by Dickinson et al. (1984). 21. Among the sample stratifications experimented with were those based on interview earn- ings in the base year (none or some); social security records of earnings in the base year (low, medium, or high); years of school completed (fewer than ten versus ten or more); percent of time employed in the base year; central-city or noncentral-city residence; and gender.
This content downloaded from 128.95.155.147 on Mon, 28 Jul 2014 19:09:26 PMAll use subject to JSTOR Terms and Conditions

Symposium: Fraker and Maynard 215
estimates tended to be insensitive to such changes in the model specification.
*Other Tests for AFDC Recipients. For the AFDC sample, we con- ducted tests that entailed (1) excluding noncentral-city residents from the comparison sample, (2) stratifying the samples by earnings in the base year, and (3) using a slightly different set of control variables. As was the case with the youth sample, we found that these changes in the samples and models had no effect on the overall conclusions about the quality of the nonexperimental impact esti- mates.
One puzzling result is the consistently better performance of the compari- son group methods for AFDC recipients as compared with their perform- ance for youth. One factor that undoubtedly contributes to this differential in performance is the greater heterogeneity among the youth sample, as evidenced by higher variances of earnings in the preprogram period and the higher rate of increase in the variability of earnings over time among youth as compared to AFDC recipients, in general. This implies that there is much more room for biased selection into the program and, hence, the task of defining a comparison group and an analytic model to compensate for the biased selection is more challenging. A second factor that might contribute to the differential in the results between the two groups is the predictability of the time paths of earnings growths between the two groups. We speculate that pre-enrollment earnings are a more powerful predictor of future earn- ings for the AFDC sample than for the youth sample. If true, this may explain why for the AFDC cases we were able to select better comparison groups and specify analytic models that better control for differences in earnings potential between comparison and experimental cases.
C. Corroborative Evidence
In an independent analysis, LaLonde (1984 and 1986) undertook an ex- amination of the quality of impact estimates generated from comparison group methodologies also using the Supported Work Demonstration data. LaLonde defined comparison groups for two subsets of the Supported Work sample-the AFDC target group and males who enrolled in the youth, ex-addict, or ex-offender target groups-by taking random subsets of AFDC recipients and males, respectively, in the 1976 CPS sample who were in the labor force in March 1976 and whose nominal income in 1975 was less than $20,000 (household income was less than $30,000).22 Using these com-
22. LaLonde also constructed comparison groups from the PSID using a similar methodology. However, those comparison groups tended to perform worse than did the CPS groups.
This content downloaded from 128.95.155.147 on Mon, 28 Jul 2014 19:09:26 PMAll use subject to JSTOR Terms and Conditions

216 The Journal of Human Resources
parison groups and the Supported Work control group, LaLonde estimated program impacts on annual earnings based on several analytic models: a simple earnings gains model; a difference between postprogram earnings, controlling for preprogram earnings; a model similar to the "basic" earnings model described above, controlling for preprogram earnings and many other observed characteristics; and a "basic" earnings-type of model that includes a participation selection-bias correction factor.23 LaLonde's results corroborate several of the findings from our study. First, he found that when using the control group, the analytic models and econometric methods used have little effect on program impact estimates; but when using the compari- son samples, the analytic models affect significantly the impact results. Second, he found that comparison groups work better for AFDC recipients than they do for males. However, it is important to note that he came close to replicating the experimental results for AFDC recipients only with the analysis model that controlled explicitly for the participation decision. LaLonde's results also demonstrate two other important points. First, they show that controlling for preprogram earnings differences is very important and, second, they show that including a nonlinear control for the program participation decision will tend to reduce bias relative to other model specifications.
VI. Conclusions and Implications for Future Research
The overwhelming conclusion from this study is that compari- son group study designs should be avoided when reliable estimates of program impacts are an important study objective. This analysis demon- strated that results may be severely biased depending on the target popula- tion, the comparison group selected, and/or the analytic model used. More importantly, there is at present no way to determine a priori whether comparison group results will yield valid indicators of the program impacts.
For several reasons, we believe that the results of this study apply more
23. In addition to the focus on males rather than youth (most of whom are males) and the variation in the analytic models used, LaLonde also used different measures of earnings for the Supported Work sample than we did. LaLonde used interview earnings for the Supported Work sample and Social Security earnings for the companions, whereas we used Social Security earnings records for both groups. The advantage of LaLonde's approach is that he avoided using grouped-data for his analysis. The disadvantages are (1) that differential measurement error in the outcome measures may account for some differences in impact estimates using the control and comparison groups and (2) that the number of Supported Work observations was reduced substantially due to frequent lack of interview earnings data for complete calendar years.
This content downloaded from 128.95.155.147 on Mon, 28 Jul 2014 19:09:26 PMAll use subject to JSTOR Terms and Conditions

Symposium: Fraker and Maynard 217
generally to other program evaluations that must rely on comparison group designs, especially evaluations of programs such as WIN, Work/Welfare, CETA, and JTPA. First, as was discussed above, individuals in the Sup- ported Work youth and AFDC samples are similar to participants in these other programs in that they tend to have experienced severe employment problems. They differ in that both samples have less attachment to the work force than the typical participant in these larger-scale programs and in that a higher proportion of the Supported Work youth sample exhibits characteris- tics that are associated with exceptionally low levels of employment and earnings-minority ethnic/racial composition, low educational levels, and limited employment experience.24 Second, the key element of the Supported Work treatment (supervised employment) is similar in many respects to that of CETA on-the-job-training, work-experience, and public-service- employment positions. Third, and perhaps most notable, the range of net impact estimates generated for Supported Work using the various compari- son groups generally spans the range of estimates from other evaluations using comparison group designs of employment programs targeted on simi- lar segments of the population (youth and disadvantaged women). For example, as seen in Table 5, the program impacts estimated for youth groups (including the Supported Work youth) using comparison group methodologies applied to CPS data are generally large, negative, and often statistically significant; those for welfare recipients are uniformly positive but range widely in magnitude.25 Yet, we have strong evidence based on the control group that Supported Work had no long-term impact for youth and modest positive impacts for welfare recipients.26
There is substantial overlap in the characteristics of the client populations served by the Supported Work Demonstration and other employment- training programs. For this reason, the CPS is also expected to be an inadequate source of comparison samples for at least certain segments of participants in these other programs. Lending support to this argument is the fact that the ranges of estimates of CETA net impacts for youth and for women reported in the literature are qualitatively, and often quantitatively,
24. However, the focus on disadvantaged populations has increased under JTPA, the major national employment-training program. 25. Dickinson et al. (1984) do report a negative impact estimate for one cohort of female CETA participants. LaLonde (1984) reports comparison group results for the Supported Work samples that have much greater variances than those estimated in our study. 26. It is also notable that we observe large discrepancies between estimates of earnings gains for the AFDC group in 1979 based on interview and Social Security Administration (SSA) earnings data. Based on interview earnings, these gains were in the neighborhood of $680 per year (Hollister et al. 1984), as contrasted with $351 estimated using SSA data. This difference is probably a result of the relatively high uncovered earnings among this population and the greater incidence of uncovered earnings among the participant group (see Masters 1979).
This content downloaded from 128.95.155.147 on Mon, 28 Jul 2014 19:09:26 PMAll use subject to JSTOR Terms and Conditions

218 The Journal of Human Resources
Table 5 Net Impact Estimates for the Supported Work Demonstration and the CETA Program, Based on Alternative Comparison Groups and Estimation Techniques (dollars per year)
Participant Group
Youth Women
Supported Work (1979 earnings) Control group methodology -18 351*
Comparison group methodologya -339 to -1,179** 257 to 911**
CETA (1978 earnings) Westatb 500** to 600**
SRIc Westat comparison group -122d 488** SRI comparison group - 524* * *d 246*
Urban Institutee -515** to -1,303** 556*** to 949***f Geracig - 944 *
Note: Supported Work participants tended to enroll in the program slightly later than did the CETA participants included in the CETA net impact studies. For this reason, 1979 outcome measures for the Supported Work samples are most nearly comparable to the 1978 outcomes for the CETA participant groups studied. a. Excludes results based on the random CPS samples meeting the Stage 1 screens. b. See Westat (1980, Table 3-6). c. See Dickinson et al. (1984, Table V.3). Results reported pertain to enrollees during the first half of 1976. Negative impacts were reported for women who enrolled in CETA dur- ing the latter half of 1976. d. These figures pertain to male youth only. Data in the report did not permit the calcula- tion of an overall impact for youth. However, only 12 percent of the Supported Work youth were female. e. See Bassi et al. (1983), Tables 3 and 22. f. These figures pertain to female welfare recipients. Similarly large positive impacts were also estimated for all economically disadvantaged women. g. See Geraci (1984, Table 1). This estimate is the effect on average earnings from 1977- 79.
*Statistically significant at the 10 percent level, two-tailed test. **Statistically significant at the 5 percent level, two-tailed test.
***Statistically significant at the 1 percent level, two-tailed test.
This content downloaded from 128.95.155.147 on Mon, 28 Jul 2014 19:09:26 PMAll use subject to JSTOR Terms and Conditions
Symposium: Fraker and Maynard 219
similar to those we estimated for the Supported Work Youth and AFDC samples using our comparison groups: CETA net impact estimates tend to be large and negative for youth ( - 122 to - 1,303 dollars per year), and large and positive for AFDC recipients (246 to 949 dollars per year). In view of both the consistency in the patterns of negative estimated net impacts for Supported Work and CETA youth generated from these independently constructed comparison samples and the implausibility that either CETA or Supported Work really had large negative impacts on youth, it seems reasonable to conclude that the basic results from this study for youth also generalize to CETA or JTPA youth.
For AFDC recipients, it appears that any of the comparison group con- struction procedures will yield reliable indicators of the sign of net impacts. However, the size of the point estimates will be sensitive to the comparison group construction and analytic methodology.
Based on these results, our overall conclusion is that one should use comparison-group methodologies with extreme caution. With respect to youth, we have observed evidence not only of strong bias in impact esti- mates obtained on the basis of comparison groups, but also that the earnings model changes over time (as the individuals grow older), that models differ substantially across subgroups of the youth population, and that measurable differences among youth and differences in their earnings models do not account fully for the observed differences in the age-earnings profiles of the program control group and the comparison samples drawn from the CPS.
For the AFDC sample, and perhaps generalizing to other disadvantaged women, we observe surprisingly similar age-earnings profiles for the control and comparison samples, as well as a relatively consistent pattern of zero to positive program impacts.27 However, even here, the sensitivity of the estimates to the comparison-group method chosen leads us to caution against using comparison groups without conducting a substantial degree of sensitivity testing.
In part, the failing of the comparison-group methodology for evaluating employment programs can be attributed to limitations of the CPS, which includes relatively few observations on individuals who match the partici- pant groups along key objective characteristics. However, especially with respect to youth, these failings also seem to be due in part to unmeasured characteristics of the individuals or their local labor markets that signifi- cantly affect age-earnings profiles.
Three actions could be taken to improve the future prospects for using comparison group methods in evaluating employment and training pro- grams. The first is to pursue aggressively research to improve our analytic
27. Dickinson et al. (1984) estimated an overall impact of zero for women enrolled over all of 1976. The large positive impacts pertained only to those enrolled during the first half of 1976.
This content downloaded from 128.95.155.147 on Mon, 28 Jul 2014 19:09:26 PMAll use subject to JSTOR Terms and Conditions

220 The Journal of Human Resources
approaches to using comparison groups and to provide tests of the adequacy of particular comparison groups and analytic models. A second is to develop a data base of potential comparison cases that includes a larger number of disadvantaged workers. The third is to ensure that basic employment pro- gram eligibility criteria and participation data are measured in surveys that are potential sources of comparison samples.
For the time being, the safest evaluation strategy involves the use of a true control group since, even with larger samples and better screening data, important unmeasured differences between the program participants and nonparticipants may persist and lead to nonrepresentative comparison sam- ples. In cases where the use of a true nontreatment control group is not feasible, one might consider adopting a "weak treatment" control group or even a combination "weak treatment" control group and comparison group strategy, where the "weak treatment" control group would be used to generate estimates that would be the basis for calibrating the impact esti- mates generated using the comparison group.
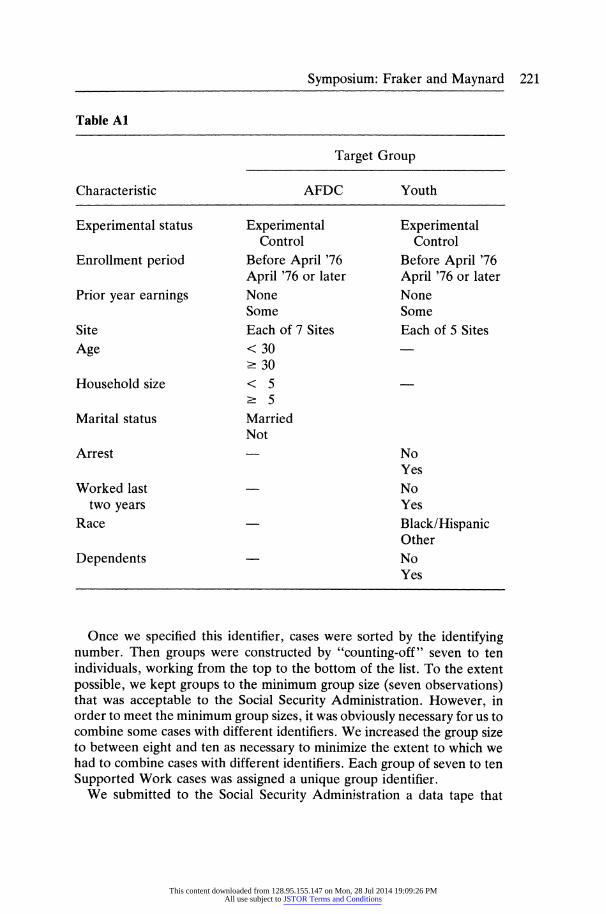
Appendix A Grouping the Supported Work and Comparison Samples In order to protect the confidentiality of data, the Social Security Adminis- tration agreed to provide us with Social Security Administrative records of annual earnings of Supported Work sample members only in the form of averages for groups of seven to ten sample members. We were, however, permitted to define how the Supported Work observations were to be grouped.
In an effort to minimize the variance within groups and thus the precision loss due to grouping the observations, we used the Automatic Interaction Detector program (AID III) to determine which of a limited set of categori- cal variables would minimize the within-group earnings variance. The result of this analysis led us to define groups for the AFDC and youth samples on the following characteristics, in order of their importance:
Operationally, we defined an "n-digit" identifier for each Supported Work sample member. Each digit in the identifier described the observation with respect to one of the characteristics to be used in defining the groups; the left-most digit represented the characteristic of greatest importance in terms of minimizing the within-group variance in earnings, the second digit represented the second most important characteristic, and so forth. For example, for AFDC recipients, the left most digit indicated experimental status, the second indicated enrollment period, the third indicated prior year earnings, the fourth indicated site, and so forth.
This content downloaded from 128.95.155.147 on Mon, 28 Jul 2014 19:09:26 PMAll use subject to JSTOR Terms and Conditions
Symposium: Fraker and Maynard 221
Table Al
Target Group
Characteristic AFDC Youth
Experimental status
Enrollment period
Prior year earnings
Site
Age
Household size
Marital status
Experimental Control
Before April '76 April '76 or later None Some Each of 7 Sites < 30 > 30 < 5 - 5
Married Not
Experimental Control
Before April '76 April '76 or later None Some Each of 5 Sites
No Yes No Yes
Black/Hispanic Other No Yes
Once we specified this identifier, cases were sorted by the identifying number. Then groups were constructed by "counting-off" seven to ten individuals, working from the top to the bottom of the list. To the extent possible, we kept groups to the minimum group size (seven observations) that was acceptable to the Social Security Administration. However, in order to meet the minimum group sizes, it was obviously necessary for us to combine some cases with different identifiers. We increased the group size to between eight and ten as necessary to minimize the extent to which we had to combine cases with different identifiers. Each group of seven to ten Supported Work cases was assigned a unique group identifier.
We submitted to the Social Security Administration a data tape that
Arrest
Worked last two years
Race
Dependents
This content downloaded from 128.95.155.147 on Mon, 28 Jul 2014 19:09:26 PMAll use subject to JSTOR Terms and Conditions

222 The Journal of Human Resources
included identifying information and a group identifier for each Supported Work observation. They then matched the Supported Work sample iden- tifiers with the SSA identifiers and extracted and appended to the Supported Work file individual-level earnings data. From these earnings data, they constructed mean earnings variables for each group and replaced the indi- vidual with the group means. Thus, the data base we used consists of individual-specific data for all variables except Social Security Administra- tion records of earnings and the group identifier.
In the analysis, we relied on the individual-level data for generating descriptive statistics and for constructing comparison groups through cell matching and statistical matching. However, in estimating program im- pacts, which were measured by Social Security Administration earnings data, we necessarily relied on the grouped data. In these impact analyses, we also constructed and used group means for all control variables. Fur- thermore, it was necessary to include weights to correct for heteroscedastic- ity introduced by the weighting; these weights equaled 1/i/Ng where Ng is the number of observations in the group.
Because the Supported Work outcome data were grouped, it was also necessary for us to group the comparison group observations prior to conducting the impact analysis. This was done by replicating as nearly as feasible the procedures used for the Supported Work sample. In particular, we split the comparison observations by CPS cohort (1976 or 1977) rather than enrollment date, and we could not split youth by their arrest history, since the CPS does not contain arrest information.
Appendix B Summary of Analytical Models
1. Basic Earnings Equation.
The basic model used an earnings equation of the following form:
(1) Yl- = al + Pi/ + Zi8 + Ei,
where
Y denotes annual SSA earnings in the specified outcome year, P is a binary variable denoting participant or control/comparison-
group status,
e is a random error term,
a and B are the coefficients to be estimated, i denotes the observation,
This content downloaded from 128.95.155.147 on Mon, 28 Jul 2014 19:09:26 PMAll use subject to JSTOR Terms and Conditions

Symposium: Fraker and Maynard 223
Z represents a vector of control variables measuring factors be- lieved to affect earnings (see Appendix Table B1), and
8 is a vector of coefficients on the control variables.
In this model, the net program impacts are measured by the estimated coefficients on the binary participation-status variable, 3l. This type of model is sometimes applied as a cross-sectional model and is estimated by ordinary least squares techniques. It is also sometimes expanded to include (1) longitudinal observations on the sample members and (2) the corre- sponding time-specific and individual-specific error terms and is estimated by generalized least squares techniques. For our purposes, we adopted the simpler cross-sectional model, for which we sacrificed only some efficiency in our estimates.
2. Simple Earnings-Gains Model
The simple earnings-gains model used can be expressed as:
(2) (Y - Yoi) = o2 + 2Pi + Ei,
where
Yo denotes annual SSA earnings in the base year,
and all other variables are defined similarly to their counterparts in the "Basic" earnings equation (1). In this case, the impact of the program on annual earnings is measured by the estimate of P2.
3. Fixed-Effect Estimator
The third type of analytic model used is a fixed-effect estimator, which can be expressed as follows:
(3) (Yti - Yoi) = 3 + P3 + (Zt - Zoi) 83 + eti,
where
P* is a vector of time and program status indicators,
Zo is a vector of base-period measures of the control variables,
Zt is a vector of current-period measures of the control variables,
et* has both a time-specific component (et - EO) and an individual- specific component (eti - eoi)
This model essentially assumes that any unobserved and uncontrolled for factors that are correlated with program-participation status and earnings
This content downloaded from 128.95.155.147 on Mon, 28 Jul 2014 19:09:26 PMAll use subject to JSTOR Terms and Conditions

224 The Journal of Human Resources
Table Bl
Definitions of Control Variables Used in the Analysis
Analytic Model Sample
Earn- Basic Fixed AFDC ings Earning Effects Recip-
Mneumonic Description Gains Equation Modela Youth ients
CPS76/77 Enrolled/Interviewed March 1976 or earlier
EXPERIM Participant status AGE Age in years AGESQ Age in years squared AGESCU Age in years cubed TARGYTH Younger than 19 BLKFLG Black, Non-Hispanic HISFLG Hispanic ANYWORK Any work, base year WRKDUM2 Worked 2 months pre WRKDUM34 Worked 3 to 4 months pre WKSWORK Weeks worked,
base year WKSLOOK Weeks unemployed,
base year HOURS Hours worked per week,
base year SALECLER Prior occupation, sales
or clerical SERVICE Prior occupation-
service PROFESS Prior occupation-
professional MISSOCC Prior occupation-
code missing SSDELTA Change in earnings pre-
base year to base year SSPRI2 Earnings prebase year SSPRI3 Earnings 2 years prior
to base year PERCPYMI Per capita family income
base year-middle third PERCPYHI Per capita family income
base year-upper third EDDUM1 Less than 10 years
of education EDDUM2 10-11 years of education AFDCRCP AFDC receipt base year MARFLAG Married
X X X
X X
X X X X X
X X X X X X
X X X X
X X X
X X X
X X X
X X
X X X
X X X X
X X X X
X X X X
X X X X
X X X X
X X X X
X X X X X X X X
X X X X
X X X X
X X X X
X X X X
X X
X
X X
This content downloaded from 128.95.155.147 on Mon, 28 Jul 2014 19:09:26 PMAll use subject to JSTOR Terms and Conditions

Symposium: Fraker and Maynard
Table B1 (Continued)
Analytic Model Sample
Earn- Basic Fixed AFDC ings Earning Effects Recip-
Mneumonic Description Gains Equation Modela Youth ients
NEWSEX Male X X LT12 No dependent younger
than 12 X X X START First year any sample
members were enrolled X X X MAIN Main enrollment year
for sample X X X POST1 Main enrollment year
plus 1 X X X POST2 Main enrollment year
plus 2 X X X POST3 Main enrollment year
plus 3 X X X T Year (1 = 1974, ...
6 =1979) X X X TSQ Year squared (see above) X X X
a. A more limited list of variables was included in one variant of the fixed-effects model. This more restrictive set of variables included only those variables that change over time.
are constant over time and, thus, that any bias in the net-impact estimates due to unobserved differences between the participant and comparison groups can be controlled for by "differencing" a base-year and outcome- year earnings equation.
References
Ashenfelter, 0. 1975. "The Effects of Manpower Training on Earnings: Preliminary Results." Proceedings of the 27th Annual Industrial Relations Research Association.
. 1979. "Estimating the Effect of Training Programs on Earnings." In Research in Labor Economics, ed. F. Bloch. Greenwich, Conn.: JAI Press.
Ashenfelter, 0., and D. Card. 1985. "Using the Longitudinal Structure of Earnings to Estimate the Effect of Training Programs." Review of Economics and Statistics 67(4):648-60.
Barnow, B. 1987. "The Impact of CETA Programs on Earnings: A Review of the Literature." Journal of Human Resources 22(2).
225
This content downloaded from 128.95.155.147 on Mon, 28 Jul 2014 19:09:26 PMAll use subject to JSTOR Terms and Conditions

226 The Journal of Human Resources
Bassi, L. 1984. "Estimating the Effects of Training Programs with Nonrandom Selection." Review of Economics and Statistics 66(1):36-43.
Bassi, L., M. Simms, L. Burbidge, and C. Betsey. 1984. "Measuring the Effect of CETA on Youth and the Economically Disadvantaged." Report prepared under U.S. Department of Labor Contract No. 20-11-82-19, 1984. Washington, D.C.: The Urban Institute.
Boruch, R. 1976. "On Common Contentions about Randomized Field Tests." In Evaluation Studies Review Annual, ed. G. V. Glass, 158-94. Beverly Hills, Calif.: Sage.
Burtless, G., and L. Orr. 1986. "Are Classical Experiments Needed for Manpower Policy?" Journal of Human Resources 21(4):606-39.
Dickinson, K., T. Johnson, and R. West. 1984. "An Analysis of the Impact of CETA Programs on Participants' Earnings." Report prepared under U.S. Department of Labor Contract No. 20-06-82-21. Menlo Park, Calif.: SRI.
Fraker, T., and R. Maynard, with L. Nelson. 1984. "An Assessment of Alternative Comparison Group Methodologies for Evaluating Employment and Training Programs." Report prepared under U.S. Department of Labor Contract No. 20-11-82-15, 1984. Princeton, N.J.: Mathematica Policy Research, Inc.
Geraci, V. 1984. "Short-Term Indicators of Job Training Program Effects on Long-Term Participant Outcomes." Austin, Texas: University of Texas.
Heckman, J., and R. Robb. 1985. "Alternative Methods for Evaluating the Impact of Interventions." In Longitudinal Analysis of Labor Market Data, ed. J. Heckman and B. Singer. Cambridge: Cambridge University Press.
Hollister, R., P. Kemper, and R. Maynard. 1984. The National Supported Work Demonstration. Madison, Wis.: University of Wisconsin Press.
Ketron, Inc. 1980. "The Long-Term Impact of WIN II: A Longitudinal Evaluation of the Employment Experiences of Participants in the Work Incentive Program." Wayne, Penn.: Ketron, Inc.
Kiefer, N. 1979. "The Economic Benefits of Four Manpower Training Programs." In Research in Labor Economics, ed. F. Bloch. Greenwich, Conn.: JAI Press.
King, T., and V. Geraci. 1982. "Short-Term Indicators of Job Training Program Performance: Policy Issues, Past Studies, and Research Agenda." Austin, Texas: Report funded by U.S. Department of Labor, Employment, and Training Administration.
LaLonde, R. 1984. "Evaluating the Economic Evaluations of Training Programs with Experimental Data." Working Paper No. 183. Princeton, N.J.: Princeton University, Industrial Relations Section.
. 1986. "Evaluating the Econometric Evaluations of Training Programs with Experimental Data." American Economic Review 76(4):604-20.
LaLonde, R., and R. Maynard. 1986. "How Precise are Evaluations of Employment and Training Programs: Evidence from a Field Experiment." Mimeo.
Mallar, C. et al. 1982. "The Evaluation of the Economic Impact of Job Corps: Third Follow-up Report." Princeton, N.J.: Mathematica Policy Research, Inc.
This content downloaded from 128.95.155.147 on Mon, 28 Jul 2014 19:09:26 PMAll use subject to JSTOR Terms and Conditions

Symposium: Fraker and Maynard 227
Masters, S. 1979. "Using Social-Security Data to Check for Possible Bias in the Earnings Effects of Supported Work, as Estimated with Interview Data." Madison, Wis.: Institute for Research on Poverty, University of Wisconsin.
Masters, S., and R. Maynard. 1984. "The Impacts of Supported Work on AFDC Recipients." In The National Supported Work Demonstration, ed. R. Hollister, P. Kemper, and R. Maynard. Madison, Wis.: University of Wisconsin Press.
Maynard, R. 1984. "The Impacts of Supported Work on Youth," in The National Supported Work Demonstration, ed. R. Hollister, P. Kemper, and R. Maynard. Madison, Wis.: University of Wisconsin Press.
Ohls, J., and G. Carcagno. 1978. "Second Year Evaluation of the Private Employment Agency Job Counselor Project." Princeton, N.J.: Mathematica Policy Research.
Perry, C., et al. 1975. The Impact of Government Manpower Programs. Philadelphia, Penn.: University of Pennsylvania.
Westat. 1980. Impact on 1977 Earnings of New FY 1976 CETA Enrollees in Selected Program Activities. Rockville, Md.: Westat, Inc.
This content downloaded from 128.95.155.147 on Mon, 28 Jul 2014 19:09:26 PMAll use subject to JSTOR Terms and Conditions