the advisors inner circle fund the rice hall james funds
TRANSCRIPT
The Rice Hall James FundsSemi-Annual Report
The Advisors’ Inner Circle Fund
Rice Hall James & Associates, LLC
April 30, 2021
Investment Adviser:
Rice Hall James Small Cap Portfolio
Rice Hall James Micro Cap Portfolio
THE ADVISORS’ INNER CIRCLE FUND RHJ FUNDSApril 30, 2021
TABLE OF CONTENTSSchedules of Investments
Small Cap Portfolio ��������������������������������������������������������������������������������������������������������������������� 1
Micro Cap Portfolio ��������������������������������������������������������������������������������������������������������������������5
Statements of Assets and Liabilities ��������������������������������������������������������������������������������������������9
Statements of Operations �������������������������������������������������������������������������������������������������������������10
Statements of Changes in Net Assets
Small Cap Portfolio ��������������������������������������������������������������������������������������������������������������������11
Micro Cap Portfolio �������������������������������������������������������������������������������������������������������������������12
Financial Highlights
Small Cap Portfolio �������������������������������������������������������������������������������������������������������������������13
Micro Cap Portfolio �������������������������������������������������������������������������������������������������������������������14
Notes to Financial Statements �����������������������������������������������������������������������������������������������������15
Disclosure of Fund Expenses ������������������������������������������������������������������������������������������������������25
The Funds file their complete schedules of investments with the Securities and Exchange
Commission (“SEC”) for the first and third quarters of each fiscal year as an exhibit to their
reports on Form N-PORT (Form N-Q for filings prior to March 31, 2020)� The Funds’ Forms N-Q
and N-PORT are available on the SEC’s website at http://www�sec�gov, and may be reviewed and
copied at the SEC’s Public Reference Room in Washington, DC� Information on the operation of
the Public Reference Room may be obtained by calling 1-800-SEC-0330�
A description of the policies and procedures that the Funds use to determine how to vote
proxies relating to fund securities, as well as information relating to how a Fund voted proxies
relating to fund securities during the most recent 12-month period ended June 30, is available
(i) without charge, upon request, by calling 1-866-474-5669; and (ii) on the SEC’s website at
http://www�sec�gov�
THE ADVISORS’ INNER CIRCLE FUND RHJ SMALL CAP PORTFOLIOApril 30, 2021 (Unaudited)
The accompanying notes are an integral part of the financial statements.
1
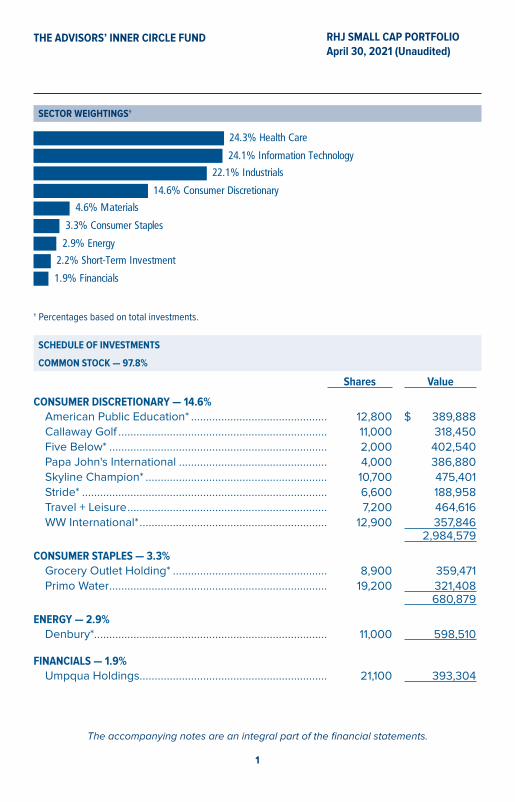
SECTOR WEIGHTINGS†
1.9% Financials
2.2% Short-Term Investment
2.9% Energy
3.3% Consumer Staples
4.6% Materials
14.6% Consumer Discretionary
22.1% Industrials
24.1% Information Technology
24.3% Health Care
† Percentages based on total investments.
SCHEDULE OF INVESTMENTS
COMMON STOCK — 97.8%
Shares Value
CONSUMER DISCRETIONARY — 14.6%American Public Education* ��������������������������������������������� 12,800 $ 389,888
Callaway Golf ��������������������������������������������������������������������� 11,000 318,450
Five Below* ������������������������������������������������������������������������ 2,000 402,540
Papa John's International ������������������������������������������������� 4,000 386,880
Skyline Champion* ������������������������������������������������������������ 10,700 475,401
Stride* ��������������������������������������������������������������������������������� 6,600 188,958
Travel + Leisure ������������������������������������������������������������������ 7,200 464,616
WW International* �������������������������������������������������������������� 12,900 357,846 2,984,579
CONSUMER STAPLES — 3.3%Grocery Outlet Holding* ��������������������������������������������������� 8,900 359,471
Primo Water ������������������������������������������������������������������������ 19,200 321,408 680,879
ENERGY — 2.9%Denbury*����������������������������������������������������������������������������� 11,000 598,510
FINANCIALS — 1.9%Umpqua Holdings �������������������������������������������������������������� 21,100 393,304
THE ADVISORS’ INNER CIRCLE FUND RHJ SMALL CAP PORTFOLIOApril 30, 2021 (Unaudited)
The accompanying notes are an integral part of the financial statements.
2
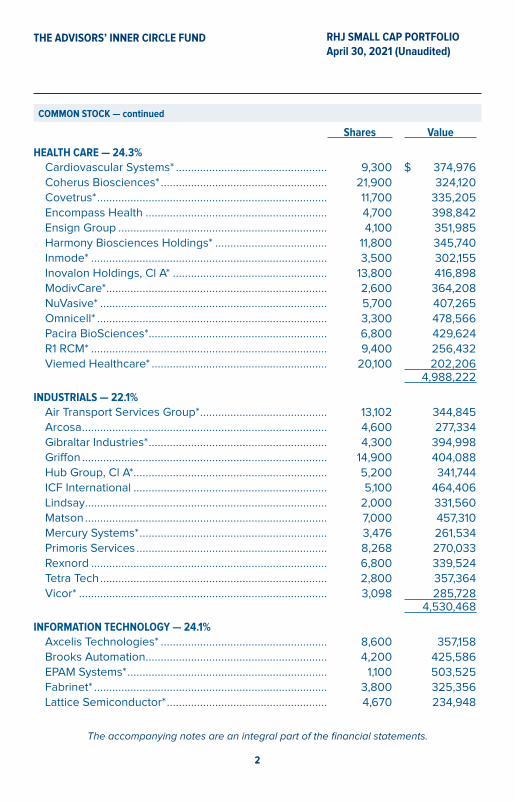
COMMON STOCK — continued
Shares Value
HEALTH CARE — 24.3%Cardiovascular Systems* �������������������������������������������������� 9,300 $ 374,976
Coherus Biosciences* ������������������������������������������������������� 21,900 324,120
Covetrus* ���������������������������������������������������������������������������� 11,700 335,205
Encompass Health ������������������������������������������������������������ 4,700 398,842
Ensign Group ��������������������������������������������������������������������� 4,100 351,985
Harmony Biosciences Holdings* ������������������������������������� 11,800 345,740
Inmode* ������������������������������������������������������������������������������ 3,500 302,155
Inovalon Holdings, Cl A* ��������������������������������������������������� 13,800 416,898
ModivCare* ������������������������������������������������������������������������� 2,600 364,208
NuVasive* ��������������������������������������������������������������������������� 5,700 407,265
Omnicell* ���������������������������������������������������������������������������� 3,300 478,566
Pacira BioSciences* ����������������������������������������������������������� 6,800 429,624
R1 RCM* ������������������������������������������������������������������������������ 9,400 256,432
Viemed Healthcare* ���������������������������������������������������������� 20,100 202,206 4,988,222
INDUSTRIALS — 22.1%Air Transport Services Group* ������������������������������������������ 13,102 344,845
Arcosa ��������������������������������������������������������������������������������� 4,600 277,334
Gibraltar Industries* ����������������������������������������������������������� 4,300 394,998
Griffon ��������������������������������������������������������������������������������� 14,900 404,088
Hub Group, Cl A* ���������������������������������������������������������������� 5,200 341,744
ICF International ���������������������������������������������������������������� 5,100 464,406
Lindsay �������������������������������������������������������������������������������� 2,000 331,560
Matson �������������������������������������������������������������������������������� 7,000 457,310
Mercury Systems* �������������������������������������������������������������� 3,476 261,534
Primoris Services ��������������������������������������������������������������� 8,268 270,033
Rexnord ������������������������������������������������������������������������������ 6,800 339,524
Tetra Tech ��������������������������������������������������������������������������� 2,800 357,364
Vicor* ���������������������������������������������������������������������������������� 3,098 285,728 4,530,468
INFORMATION TECHNOLOGY — 24.1%Axcelis Technologies* ������������������������������������������������������� 8,600 357,158
Brooks Automation ������������������������������������������������������������ 4,200 425,586
EPAM Systems* ������������������������������������������������������������������ 1,100 503,525
Fabrinet* ����������������������������������������������������������������������������� 3,800 325,356
Lattice Semiconductor* ����������������������������������������������������� 4,670 234,948
THE ADVISORS’ INNER CIRCLE FUND RHJ SMALL CAP PORTFOLIOApril 30, 2021 (Unaudited)
The accompanying notes are an integral part of the financial statements.
3
COMMON STOCK — continued
Shares Value
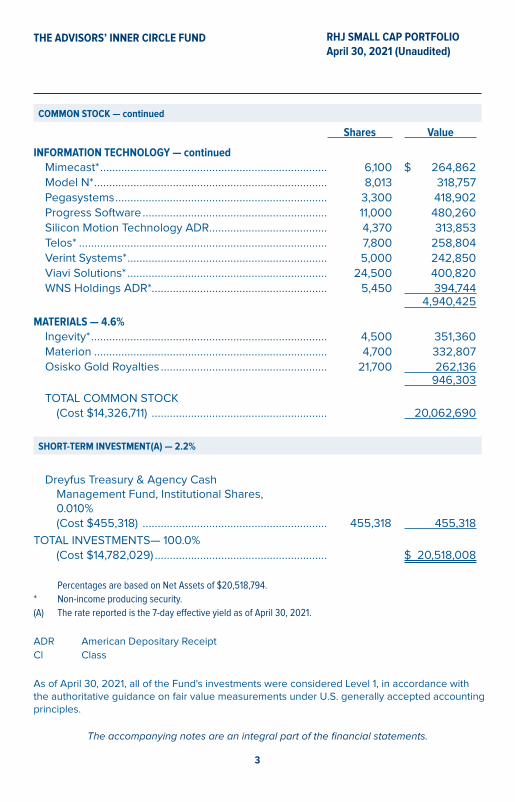
INFORMATION TECHNOLOGY — continued Mimecast* ��������������������������������������������������������������������������� 6,100 $ 264,862
Model N* ����������������������������������������������������������������������������� 8,013 318,757
Pegasystems ���������������������������������������������������������������������� 3,300 418,902
Progress Software ������������������������������������������������������������� 11,000 480,260
Silicon Motion Technology ADR ��������������������������������������� 4,370 313,853
Telos* ���������������������������������������������������������������������������������� 7,800 258,804
Verint Systems* ������������������������������������������������������������������ 5,000 242,850
Viavi Solutions* ������������������������������������������������������������������ 24,500 400,820
WNS Holdings ADR* ���������������������������������������������������������� 5,450 394,744 4,940,425
MATERIALS — 4.6%Ingevity* ������������������������������������������������������������������������������ 4,500 351,360
Materion ����������������������������������������������������������������������������� 4,700 332,807
Osisko Gold Royalties ������������������������������������������������������� 21,700 262,136 946,303
TOTAL COMMON STOCK (Cost $14,326,711) ���������������������������������������������������������� 20,062,690
SHORT-TERM INVESTMENT(A) — 2.2%
Dreyfus Treasury & Agency Cash Management Fund, Institutional Shares, 0�010% (Cost $455,318) ������������������������������������������������������������� 455,318 455,318
TOTAL INVESTMENTS— 100�0%(Cost $14,782,029) ��������������������������������������������������������� $ 20,518,008
Percentages are based on Net Assets of $20,518,794.* Non-income producing security.(A) The rate reported is the 7-day effective yield as of April 30, 2021.
ADR American Depositary Receipt
Cl Class
As of April 30, 2021, all of the Fund's investments were considered Level 1, in accordance with the authoritative guidance on fair value measurements under U�S� generally accepted accounting principles�

THE ADVISORS’ INNER CIRCLE FUND RHJ SMALL CAP PORTFOLIOApril 30, 2021 (Unaudited)
The accompanying notes are an integral part of the financial statements.
4
For the period ended April 30, 2021, there were no transfers in or out of Level 3� For more information on valuation inputs, see Note 2 in the Notes to Financial Statements�
THE ADVISORS’ INNER CIRCLE FUND RHJ MICRO CAP PORTFOLIOApril 30, 2021 (Unaudited)
The accompanying notes are an integral part of the financial statements.
5
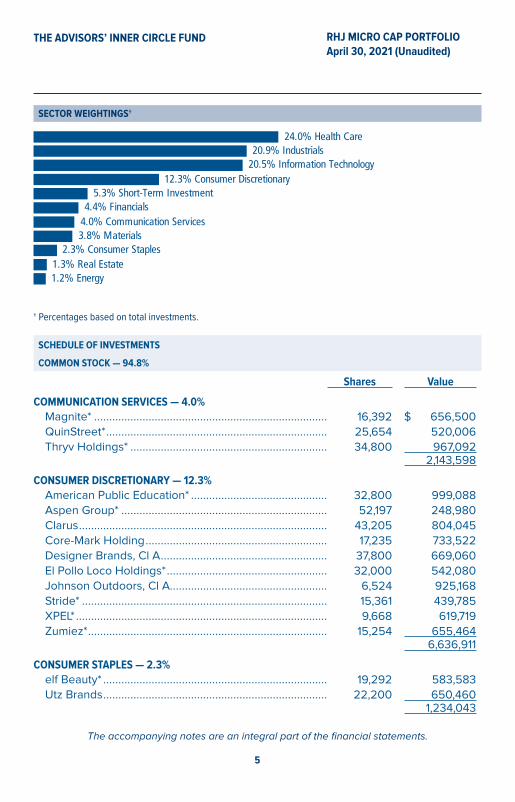
SECTOR WEIGHTINGS†
1.2% Energy1.3% Real Estate
2.3% Consumer Staples3.8% Materials4.0% Communication Services4.4% Financials
5.3% Short-Term Investment12.3% Consumer Discretionary
20.5% Information Technology20.9% Industrials
24.0% Health Care
† Percentages based on total investments.
SCHEDULE OF INVESTMENTS
COMMON STOCK — 94.8%
Shares Value
COMMUNICATION SERVICES — 4.0%Magnite* ����������������������������������������������������������������������������� 16,392 $ 656,500
QuinStreet* ������������������������������������������������������������������������� 25,654 520,006
Thryv Holdings* ����������������������������������������������������������������� 34,800 967,092 2,143,598
CONSUMER DISCRETIONARY — 12.3%American Public Education* ��������������������������������������������� 32,800 999,088
Aspen Group* �������������������������������������������������������������������� 52,197 248,980
Clarus ���������������������������������������������������������������������������������� 43,205 804,045
Core-Mark Holding ������������������������������������������������������������ 17,235 733,522
Designer Brands, Cl A ������������������������������������������������������� 37,800 669,060
El Pollo Loco Holdings* ����������������������������������������������������� 32,000 542,080
Johnson Outdoors, Cl A���������������������������������������������������� 6,524 925,168
Stride* ��������������������������������������������������������������������������������� 15,361 439,785
XPEL* ����������������������������������������������������������������������������������� 9,668 619,719
Zumiez* ������������������������������������������������������������������������������� 15,254 655,464 6,636,911
CONSUMER STAPLES — 2.3%elf Beauty* �������������������������������������������������������������������������� 19,292 583,583
Utz Brands �������������������������������������������������������������������������� 22,200 650,460 1,234,043
THE ADVISORS’ INNER CIRCLE FUND RHJ MICRO CAP PORTFOLIOApril 30, 2021 (Unaudited)
The accompanying notes are an integral part of the financial statements.
6
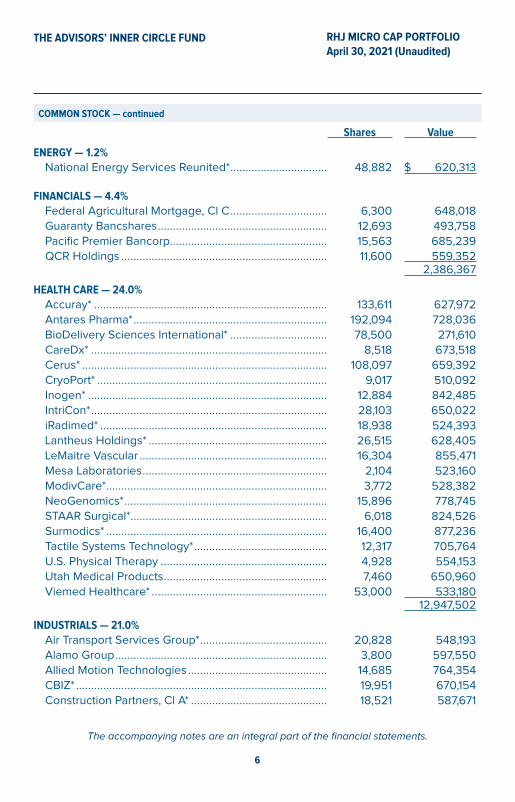
COMMON STOCK — continued
Shares Value
ENERGY — 1.2%National Energy Services Reunited* �������������������������������� 48,882 $ 620,313
FINANCIALS — 4.4%Federal Agricultural Mortgage, Cl C �������������������������������� 6,300 648,018
Guaranty Bancshares �������������������������������������������������������� 12,693 493,758
Pacific Premier Bancorp���������������������������������������������������� 15,563 685,239
QCR Holdings �������������������������������������������������������������������� 11,600 559,352 2,386,367
HEALTH CARE — 24.0%Accuray* ����������������������������������������������������������������������������� 133,611 627,972
Antares Pharma* ���������������������������������������������������������������� 192,094 728,036
BioDelivery Sciences International* �������������������������������� 78,500 271,610
CareDx* ������������������������������������������������������������������������������ 8,518 673,518
Cerus* ��������������������������������������������������������������������������������� 108,097 659,392
CryoPort* ���������������������������������������������������������������������������� 9,017 510,092
Inogen* ������������������������������������������������������������������������������� 12,884 842,485
IntriCon* ������������������������������������������������������������������������������ 28,103 650,022
iRadimed* ��������������������������������������������������������������������������� 18,938 524,393
Lantheus Holdings* ����������������������������������������������������������� 26,515 628,405
LeMaitre Vascular �������������������������������������������������������������� 16,304 855,471
Mesa Laboratories ������������������������������������������������������������� 2,104 523,160
ModivCare* ������������������������������������������������������������������������� 3,772 528,382
NeoGenomics* ������������������������������������������������������������������� 15,896 778,745
STAAR Surgical* ����������������������������������������������������������������� 6,018 824,526
Surmodics* ������������������������������������������������������������������������� 16,400 877,236
Tactile Systems Technology* �������������������������������������������� 12,317 705,764
U�S� Physical Therapy ������������������������������������������������������� 4,928 554,153
Utah Medical Products ������������������������������������������������������ 7,460 650,960
Viemed Healthcare* ���������������������������������������������������������� 53,000 533,180 12,947,502
INDUSTRIALS — 21.0%Air Transport Services Group* ������������������������������������������ 20,828 548,193
Alamo Group ���������������������������������������������������������������������� 3,800 597,550
Allied Motion Technologies ���������������������������������������������� 14,685 764,354
CBIZ* ����������������������������������������������������������������������������������� 19,951 670,154
Construction Partners, Cl A* ��������������������������������������������� 18,521 587,671
THE ADVISORS’ INNER CIRCLE FUND RHJ MICRO CAP PORTFOLIOApril 30, 2021 (Unaudited)
The accompanying notes are an integral part of the financial statements.
7
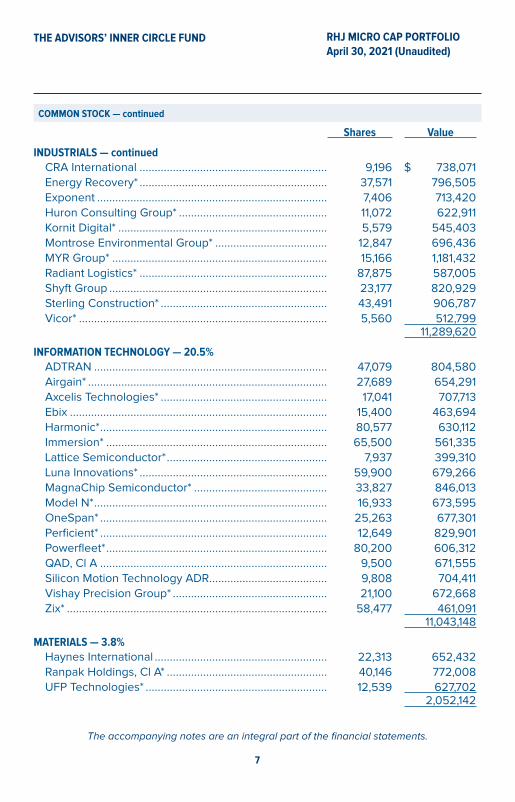
COMMON STOCK — continued
Shares Value
INDUSTRIALS — continued CRA International �������������������������������������������������������������� 9,196 $ 738,071
Energy Recovery* �������������������������������������������������������������� 37,571 796,505
Exponent ���������������������������������������������������������������������������� 7,406 713,420
Huron Consulting Group* ������������������������������������������������� 11,072 622,911
Kornit Digital* ��������������������������������������������������������������������� 5,579 545,403
Montrose Environmental Group* ������������������������������������� 12,847 696,436
MYR Group* ����������������������������������������������������������������������� 15,166 1,181,432
Radiant Logistics* �������������������������������������������������������������� 87,875 587,005
Shyft Group ������������������������������������������������������������������������ 23,177 820,929
Sterling Construction* ������������������������������������������������������� 43,491 906,787
Vicor* ���������������������������������������������������������������������������������� 5,560 512,799 11,289,620
INFORMATION TECHNOLOGY — 20.5%ADTRAN ����������������������������������������������������������������������������� 47,079 804,580
Airgain* ������������������������������������������������������������������������������� 27,689 654,291
Axcelis Technologies* ������������������������������������������������������� 17,041 707,713
Ebix ������������������������������������������������������������������������������������� 15,400 463,694
Harmonic* ��������������������������������������������������������������������������� 80,577 630,112
Immersion* ������������������������������������������������������������������������� 65,500 561,335
Lattice Semiconductor* ����������������������������������������������������� 7,937 399,310
Luna Innovations* �������������������������������������������������������������� 59,900 679,266
MagnaChip Semiconductor* �������������������������������������������� 33,827 846,013
Model N* ����������������������������������������������������������������������������� 16,933 673,595
OneSpan* ��������������������������������������������������������������������������� 25,263 677,301
Perficient* ��������������������������������������������������������������������������� 12,649 829,901
Powerfleet* ������������������������������������������������������������������������� 80,200 606,312
QAD, Cl A ��������������������������������������������������������������������������� 9,500 671,555
Silicon Motion Technology ADR ��������������������������������������� 9,808 704,411
Vishay Precision Group* ��������������������������������������������������� 21,100 672,668
Zix* �������������������������������������������������������������������������������������� 58,477 461,091 11,043,148
MATERIALS — 3.8%Haynes International ��������������������������������������������������������� 22,313 652,432
Ranpak Holdings, Cl A* ����������������������������������������������������� 40,146 772,008
UFP Technologies* ������������������������������������������������������������ 12,539 627,702 2,052,142
THE ADVISORS’ INNER CIRCLE FUND RHJ MICRO CAP PORTFOLIOApril 30, 2021 (Unaudited)
The accompanying notes are an integral part of the financial statements.
8
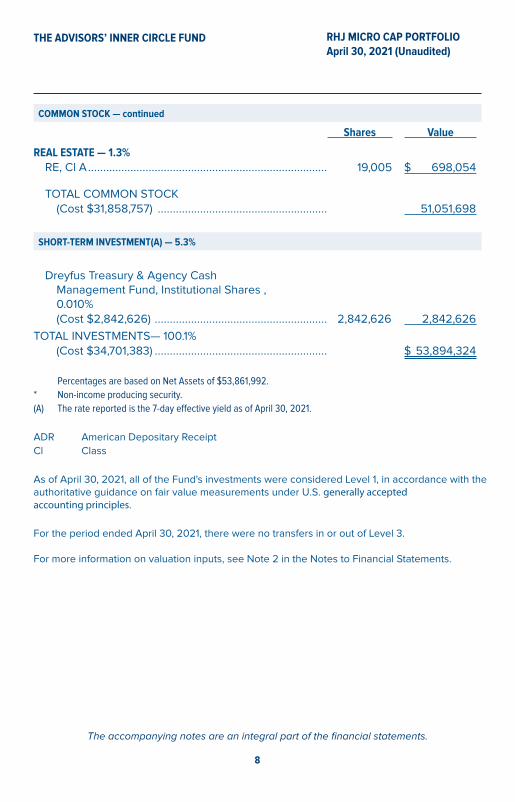
COMMON STOCK — continued
Shares Value
REAL ESTATE — 1.3%RE, Cl A ������������������������������������������������������������������������������� 19,005 $ 698,054
TOTAL COMMON STOCK (Cost $31,858,757) �������������������������������������������������������� 51,051,698
SHORT-TERM INVESTMENT(A) — 5.3%
Dreyfus Treasury & Agency Cash Management Fund, Institutional Shares , 0�010% (Cost $2,842,626) ��������������������������������������������������������� 2,842,626 2,842,626
TOTAL INVESTMENTS— 100�1%(Cost $34,701,383) ��������������������������������������������������������� $ 53,894,324
Percentages are based on Net Assets of $53,861,992.* Non-income producing security.(A) The rate reported is the 7-day effective yield as of April 30, 2021.
ADR American Depositary Receipt
Cl Class
As of April 30, 2021, all of the Fund's investments were considered Level 1, in accordance with the authoritative guidance on fair value measurements under U�S� generally acceptedaccounting principles�
For the period ended April 30, 2021, there were no transfers in or out of Level 3� For more information on valuation inputs, see Note 2 in the Notes to Financial Statements�
The accompanying notes are an integral part of the financial statements.
9
THE ADVISORS’ INNER CIRCLE FUND RHJ FUNDSApril 30, 2021 (Unaudited)
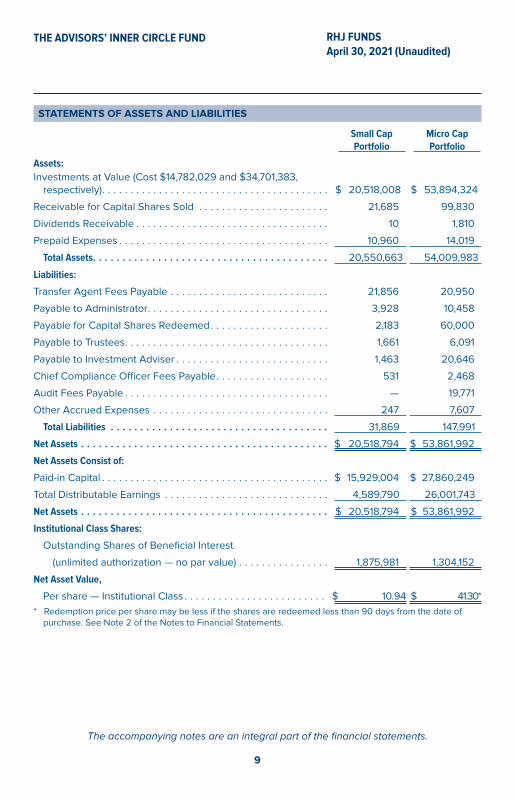
STATEMENTS OF ASSETS AND LIABILITIES
Small Cap Portfolio
Micro Cap Portfolio
Assets:Investments at Value (Cost $14,782,029 and $34,701,383,
respectively) � � � � � � � � � � � � � � � � � � � � � � � � � � � � � � � � � � � � � � � � $ 20,518,008 $ 53,894,324
Receivable for Capital Shares Sold � � � � � � � � � � � � � � � � � � � � � � � 21,685 99,830
Dividends Receivable � � � � � � � � � � � � � � � � � � � � � � � � � � � � � � � � � � 10 1,810
Prepaid Expenses � � � � � � � � � � � � � � � � � � � � � � � � � � � � � � � � � � � � � 10,960 14,019
Total Assets . . . . . . . . . . . . . . . . . . . . . . . . . . . . . . . . . . . . . . . . 20,550,663 54,009,983
Liabilities:
Transfer Agent Fees Payable � � � � � � � � � � � � � � � � � � � � � � � � � � � � 21,856 20,950
Payable to Administrator � � � � � � � � � � � � � � � � � � � � � � � � � � � � � � � � 3,928 10,458
Payable for Capital Shares Redeemed � � � � � � � � � � � � � � � � � � � � � 2,183 60,000
Payable to Trustees � � � � � � � � � � � � � � � � � � � � � � � � � � � � � � � � � � � � 1,661 6,091
Payable to Investment Adviser � � � � � � � � � � � � � � � � � � � � � � � � � � � 1,463 20,646
Chief Compliance Officer Fees Payable � � � � � � � � � � � � � � � � � � � � 531 2,468
Audit Fees Payable � � � � � � � � � � � � � � � � � � � � � � � � � � � � � � � � � � � � — 19,771
Other Accrued Expenses � � � � � � � � � � � � � � � � � � � � � � � � � � � � � � � 247 7,607
Total Liabilities . . . . . . . . . . . . . . . . . . . . . . . . . . . . . . . . . . . . . 31,869 147,991
Net Assets . . . . . . . . . . . . . . . . . . . . . . . . . . . . . . . . . . . . . . . . . . $ 20,518,794 $ 53,861,992
Net Assets Consist of:
Paid-in Capital � � � � � � � � � � � � � � � � � � � � � � � � � � � � � � � � � � � � � � � � $ 15,929,004 $ 27,860,249
Total Distributable Earnings � � � � � � � � � � � � � � � � � � � � � � � � � � � � � 4,589,790 26,001,743
Net Assets . . . . . . . . . . . . . . . . . . . . . . . . . . . . . . . . . . . . . . . . . . $ 20,518,794 $ 53,861,992
Institutional Class Shares:
Outstanding Shares of Beneficial Interest
(unlimited authorization — no par value) � � � � � � � � � � � � � � � � 1,875,981 1,304,152
Net Asset Value,
Per share — Institutional Class � � � � � � � � � � � � � � � � � � � � � � � � � $ 10�94 $ 41�30*
* Redemption price per share may be less if the shares are redeemed less than 90 days from the date of purchase� See Note 2 of the Notes to Financial Statements�
The accompanying notes are an integral part of the financial statements.
10
THE ADVISORS’ INNER CIRCLE FUND RHJ FUNDSFor the six months endedApril 30, 2021 (Unaudited)
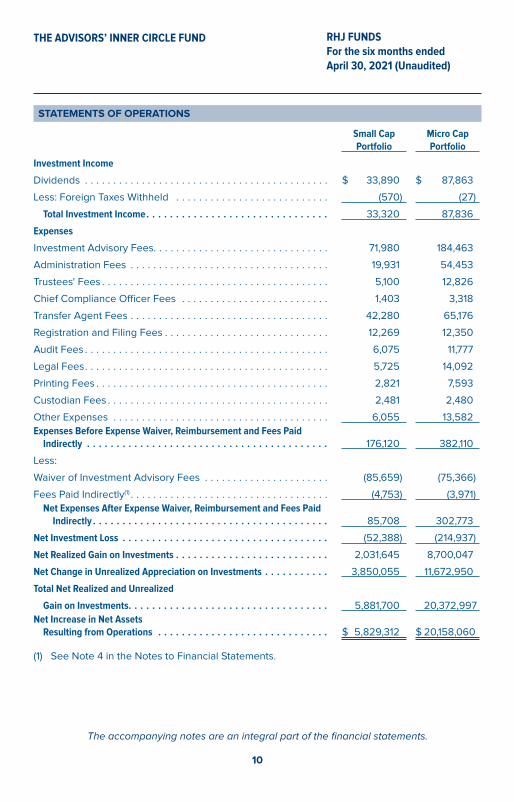
STATEMENTS OF OPERATIONS
Small Cap Portfolio
Micro Cap Portfolio
Investment Income
Dividends � � � � � � � � � � � � � � � � � � � � � � � � � � � � � � � � � � � � � � � � � � � $ 33,890 $ 87,863
Less: Foreign Taxes Withheld � � � � � � � � � � � � � � � � � � � � � � � � � � � (570) (27)
Total Investment Income . . . . . . . . . . . . . . . . . . . . . . . . . . . . . . . 33,320 87,836
Expenses
Investment Advisory Fees� � � � � � � � � � � � � � � � � � � � � � � � � � � � � � � 71,980 184,463
Administration Fees � � � � � � � � � � � � � � � � � � � � � � � � � � � � � � � � � � � 19,931 54,453
Trustees' Fees � � � � � � � � � � � � � � � � � � � � � � � � � � � � � � � � � � � � � � � � 5,100 12,826
Chief Compliance Officer Fees � � � � � � � � � � � � � � � � � � � � � � � � � � 1,403 3,318
Transfer Agent Fees � � � � � � � � � � � � � � � � � � � � � � � � � � � � � � � � � � � 42,280 65,176
Registration and Filing Fees � � � � � � � � � � � � � � � � � � � � � � � � � � � � � 12,269 12,350
Audit Fees � � � � � � � � � � � � � � � � � � � � � � � � � � � � � � � � � � � � � � � � � � � 6,075 11,777
Legal Fees � � � � � � � � � � � � � � � � � � � � � � � � � � � � � � � � � � � � � � � � � � � 5,725 14,092
Printing Fees � � � � � � � � � � � � � � � � � � � � � � � � � � � � � � � � � � � � � � � � � 2,821 7,593
Custodian Fees � � � � � � � � � � � � � � � � � � � � � � � � � � � � � � � � � � � � � � � 2,481 2,480
Other Expenses � � � � � � � � � � � � � � � � � � � � � � � � � � � � � � � � � � � � � � 6,055 13,582
Expenses Before Expense Waiver, Reimbursement and Fees Paid Indirectly . . . . . . . . . . . . . . . . . . . . . . . . . . . . . . . . . . . . . . . . . 176,120 382,110
Less:
Waiver of Investment Advisory Fees � � � � � � � � � � � � � � � � � � � � � � (85,659) (75,366)
Fees Paid Indirectly(1) � � � � � � � � � � � � � � � � � � � � � � � � � � � � � � � � � � � (4,753) (3,971)
Net Expenses After Expense Waiver, Reimbursement and Fees Paid Indirectly . . . . . . . . . . . . . . . . . . . . . . . . . . . . . . . . . . . . . . . . 85,708 302,773
Net Investment Loss . . . . . . . . . . . . . . . . . . . . . . . . . . . . . . . . . . . (52,388) (214,937)
Net Realized Gain on Investments . . . . . . . . . . . . . . . . . . . . . . . . . . 2,031,645 8,700,047
Net Change in Unrealized Appreciation on Investments . . . . . . . . . . . 3,850,055 11,672,950
Total Net Realized and Unrealized
Gain on Investments. . . . . . . . . . . . . . . . . . . . . . . . . . . . . . . . . . 5,881,700 20,372,997
Net Increase in Net Assets Resulting from Operations . . . . . . . . . . . . . . . . . . . . . . . . . . . . . $ 5,829,312 $ 20,158,060
(1) See Note 4 in the Notes to Financial Statements�
THE ADVISORS’ INNER CIRCLE FUND RHJ SMALL CAP PORTFOLIO
The accompanying notes are an integral part of the financial statements.
11
Six Months Ended April
30, 2021 (Unaudited)
Year Ended October 31,
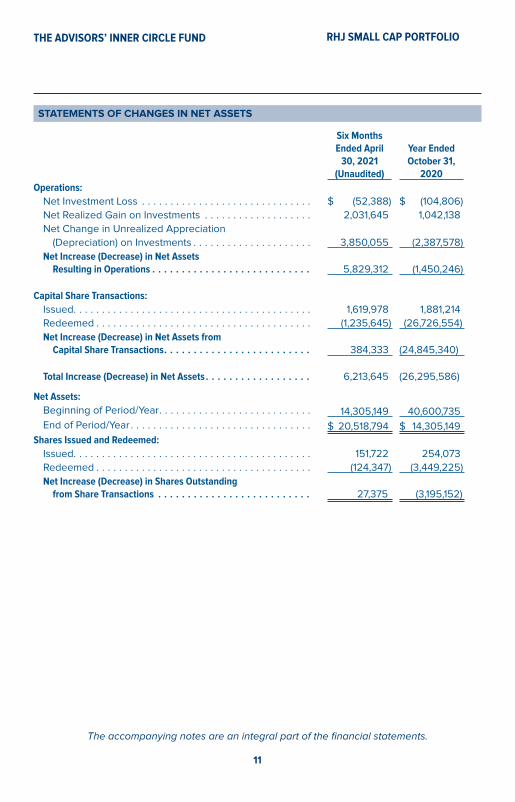
2020Operations:
Net Investment Loss � � � � � � � � � � � � � � � � � � � � � � � � � � � � � � $ (52,388) $ (104,806)
Net Realized Gain on Investments � � � � � � � � � � � � � � � � � � � 2,031,645 1,042,138
Net Change in Unrealized Appreciation
(Depreciation) on Investments � � � � � � � � � � � � � � � � � � � � � 3,850,055 (2,387,578)
Net Increase (Decrease) in Net Assets Resulting in Operations . . . . . . . . . . . . . . . . . . . . . . . . . . . 5,829,312 (1,450,246)
Capital Share Transactions:Issued � � � � � � � � � � � � � � � � � � � � � � � � � � � � � � � � � � � � � � � � � � 1,619,978 1,881,214
Redeemed � � � � � � � � � � � � � � � � � � � � � � � � � � � � � � � � � � � � � � (1,235,645) (26,726,554)
Net Increase (Decrease) in Net Assets from Capital Share Transactions . . . . . . . . . . . . . . . . . . . . . . . . . 384,333
(24,845,340)
Total Increase (Decrease) in Net Assets . . . . . . . . . . . . . . . . . . 6,213,645 (26,295,586)
Net Assets:Beginning of Period/Year � � � � � � � � � � � � � � � � � � � � � � � � � � � 14,305,149 40,600,735
End of Period/Year � � � � � � � � � � � � � � � � � � � � � � � � � � � � � � � � $ 20,518,794 $ 14,305,149
Shares Issued and Redeemed:Issued � � � � � � � � � � � � � � � � � � � � � � � � � � � � � � � � � � � � � � � � � � 151,722 254,073
Redeemed � � � � � � � � � � � � � � � � � � � � � � � � � � � � � � � � � � � � � � (124,347) (3,449,225)
Net Increase (Decrease) in Shares Outstanding from Share Transactions . . . . . . . . . . . . . . . . . . . . . . . . . . 27,375 (3,195,152)
STATEMENTS OF CHANGES IN NET ASSETS
The accompanying notes are an integral part of the financial statements.
12
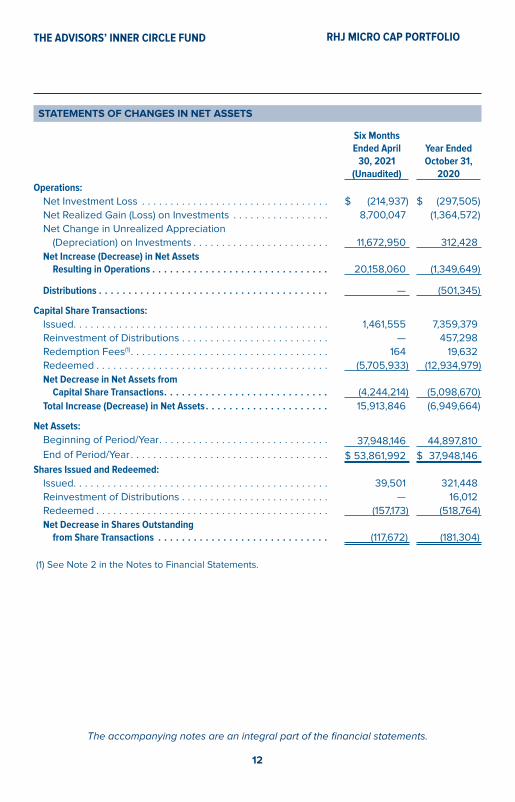
STATEMENTS OF CHANGES IN NET ASSETS
THE ADVISORS’ INNER CIRCLE FUND RHJ MICRO CAP PORTFOLIO
Six Months Ended April
30, 2021 (Unaudited)
Year Ended October 31,
2020Operations:
Net Investment Loss � � � � � � � � � � � � � � � � � � � � � � � � � � � � � � � � � $ (214,937) $ (297,505)
Net Realized Gain (Loss) on Investments � � � � � � � � � � � � � � � � � 8,700,047 (1,364,572)
Net Change in Unrealized Appreciation
(Depreciation) on Investments � � � � � � � � � � � � � � � � � � � � � � � � 11,672,950 312,428
Net Increase (Decrease) in Net Assets Resulting in Operations . . . . . . . . . . . . . . . . . . . . . . . . . . . . . . 20,158,060 (1,349,649)
Distributions . . . . . . . . . . . . . . . . . . . . . . . . . . . . . . . . . . . . . . . — (501,345)
Capital Share Transactions:Issued � � � � � � � � � � � � � � � � � � � � � � � � � � � � � � � � � � � � � � � � � � � � � 1,461,555 7,359,379
Reinvestment of Distributions � � � � � � � � � � � � � � � � � � � � � � � � � � — 457,298
Redemption Fees(1) � � � � � � � � � � � � � � � � � � � � � � � � � � � � � � � � � � � 164 19,632
Redeemed � � � � � � � � � � � � � � � � � � � � � � � � � � � � � � � � � � � � � � � � � (5,705,933) (12,934,979)
Net Decrease in Net Assets from Capital Share Transactions . . . . . . . . . . . . . . . . . . . . . . . . . . . . (4,244,214) (5,098,670)
Total Increase (Decrease) in Net Assets . . . . . . . . . . . . . . . . . . . . . 15,913,846 (6,949,664)
Net Assets:Beginning of Period/Year � � � � � � � � � � � � � � � � � � � � � � � � � � � � � � 37,948,146 44,897,810
End of Period/Year � � � � � � � � � � � � � � � � � � � � � � � � � � � � � � � � � � � $ 53,861,992 $ 37,948,146
Shares Issued and Redeemed:Issued � � � � � � � � � � � � � � � � � � � � � � � � � � � � � � � � � � � � � � � � � � � � � 39,501 321,448
Reinvestment of Distributions � � � � � � � � � � � � � � � � � � � � � � � � � � — 16,012
Redeemed � � � � � � � � � � � � � � � � � � � � � � � � � � � � � � � � � � � � � � � � � (157,173) (518,764)
Net Decrease in Shares Outstanding from Share Transactions . . . . . . . . . . . . . . . . . . . . . . . . . . . . . (117,672) (181,304)
(1) See Note 2 in the Notes to Financial Statements�
The accompanying notes are an integral part of the financial statements.
13
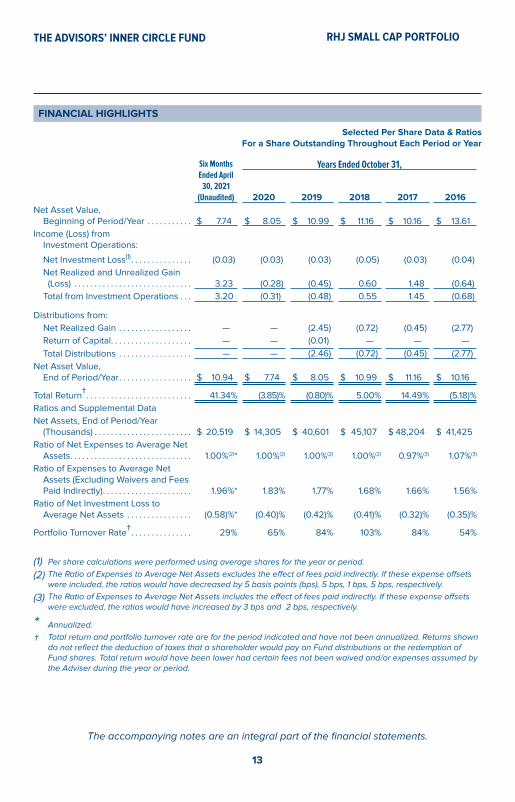
THE ADVISORS’ INNER CIRCLE FUND RHJ SMALL CAP PORTFOLIO
FINANCIAL HIGHLIGHTS
Selected Per Share Data & RatiosFor a Share Outstanding Throughout Each Period or Year
Six Months Ended April
30, 2021 (Unaudited)
Years Ended October 31,
2020 2019 2018 2017 2016
Net Asset Value, Beginning of Period/Year � � � � � � � � � � � $ 7�74 $ 8�05 $ 10�99 $ 11�16 $ 10�16 $ 13�61
Income (Loss) from Investment Operations:
Net Investment Loss(1) � � � � � � � � � � � � � � � (0�03) (0�03) (0�03) (0�05) (0�03) (0�04)
Net Realized and Unrealized Gain (Loss) � � � � � � � � � � � � � � � � � � � � � � � � � � � � � 3�23 (0�28) (0�45) 0�60 1�48 (0�64)
Total from Investment Operations � � � 3�20 (0�31) (0�48) 0�55 1�45 (0�68)
Distributions from:
Net Realized Gain � � � � � � � � � � � � � � � � � � — — (2�45) (0�72) (0�45) (2�77)
Return of Capital � � � � � � � � � � � � � � � � � � � � — — (0�01) — — —
Total Distributions � � � � � � � � � � � � � � � � � � — — (2�46) (0�72) (0�45) (2�77)
Net Asset Value, End of Period/Year � � � � � � � � � � � � � � � � � � $ 10�94 $ 7�74 $ 8�05 $ 10�99 $ 11�16 $ 10�16
Total Return† � � � � � � � � � � � � � � � � � � � � � � � � � � 41�34% (3�85)% (0�80)% 5�00% 14�49% (5�18)%
Ratios and Supplemental Data
Net Assets, End of Period/Year (Thousands) � � � � � � � � � � � � � � � � � � � � � � � � $ 20,519 $ 14,305 $ 40,601 $ 45,107 $ 48,204 $ 41,425
Ratio of Net Expenses to Average Net Assets � � � � � � � � � � � � � � � � � � � � � � � � � � � � � � 1�00%(2)* 1�00%(2) 1�00%(2) 1�00%(2) 0�97%(3) 1�07%(3)
Ratio of Expenses to Average Net Assets (Excluding Waivers and Fees Paid Indirectly) � � � � � � � � � � � � � � � � � � � � � � 1�96%* 1�83% 1�77% 1�68% 1�66% 1�56%
Ratio of Net Investment Loss to Average Net Assets � � � � � � � � � � � � � � � � (0�58)%* (0�40)% (0�42)% (0�41)% (0�32)% (0�35)%
Portfolio Turnover Rate† � � � � � � � � � � � � � � � 29% 65% 84% 103% 84% 54%
(1) Per share calculations were performed using average shares for the year or period.
(2) The Ratio of Expenses to Average Net Assets excludes the effect of fees paid indirectly. If these expense offsets were included, the ratios would have decreased by 5 basis points (bps), 5 bps, 1 bps, 5 bps, respectively.
(3) The Ratio of Expenses to Average Net Assets includes the effect of fees paid indirectly. If these expense offsets were excluded, the ratios would have increased by 3 bps and 2 bps, respectively.
* Annualized.
† Total return and portfolio turnover rate are for the period indicated and have not been annualized. Returns shown do not reflect the deduction of taxes that a shareholder would pay on Fund distributions or the redemption of Fund shares. Total return would have been lower had certain fees not been waived and/or expenses assumed by the Adviser during the year or period.
The accompanying notes are an integral part of the financial statements.
14
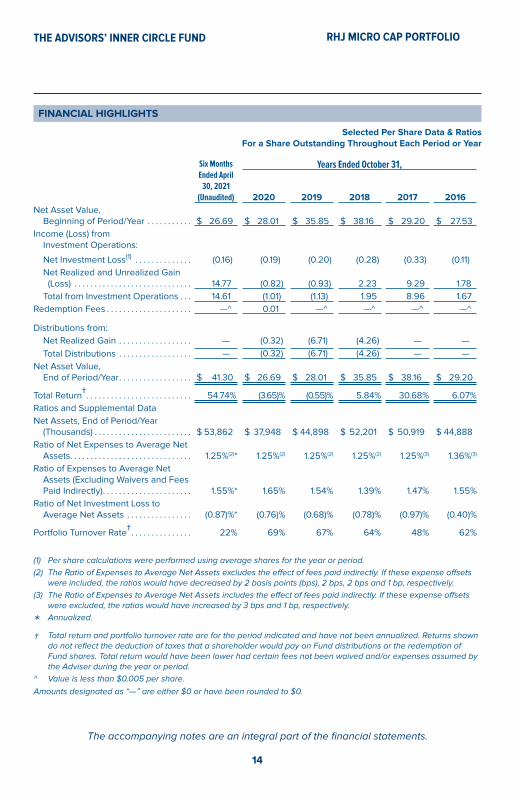
FINANCIAL HIGHLIGHTS
THE ADVISORS’ INNER CIRCLE FUND RHJ MICRO CAP PORTFOLIO
Selected Per Share Data & RatiosFor a Share Outstanding Throughout Each Period or Year
Six Months Ended April
30, 2021 (Unaudited)
Years Ended October 31,
2020 2019 2018 2017 2016
Net Asset Value, Beginning of Period/Year � � � � � � � � � � � $ 26�69 $ 28�01 $ 35�85 $ 38�16 $ 29�20 $ 27�53
Income (Loss) from Investment Operations:
Net Investment Loss(1) � � � � � � � � � � � � � � (0�16) (0�19) (0�20) (0�28) (0�33) (0�11)
Net Realized and Unrealized Gain (Loss) � � � � � � � � � � � � � � � � � � � � � � � � � � � � � 14�77 (0�82) (0�93) 2�23 9�29 1�78
Total from Investment Operations � � � 14�61 (1�01) (1�13) 1�95 8�96 1�67
Redemption Fees � � � � � � � � � � � � � � � � � � � � � —^ 0�01 —^ —^ —^ —^
Distributions from:
Net Realized Gain � � � � � � � � � � � � � � � � � � — (0�32) (6�71) (4�26) — —
Total Distributions � � � � � � � � � � � � � � � � � � — (0�32) (6�71) (4�26) — —
Net Asset Value, End of Period/Year � � � � � � � � � � � � � � � � � � $ 41�30 $ 26�69 $ 28�01 $ 35�85 $ 38�16 $ 29�20
Total Return† � � � � � � � � � � � � � � � � � � � � � � � � � � 54�74% (3�65)% (0�55)% 5�84% 30�68% 6�07%
Ratios and Supplemental Data
Net Assets, End of Period/Year (Thousands) � � � � � � � � � � � � � � � � � � � � � � � � $ 53,862 $ 37,948 $ 44,898 $ 52,201 $ 50,919 $ 44,888
Ratio of Net Expenses to Average Net Assets � � � � � � � � � � � � � � � � � � � � � � � � � � � � � � 1�25%(2)* 1�25%(2) 1�25%(2) 1�25%(2) 1�25%(3) 1�36%(3)
Ratio of Expenses to Average Net Assets (Excluding Waivers and Fees Paid Indirectly) � � � � � � � � � � � � � � � � � � � � � � 1�55%* 1�65% 1�54% 1�39% 1�47% 1�55%
Ratio of Net Investment Loss to Average Net Assets � � � � � � � � � � � � � � � � (0�87)%* (0�76)% (0�68)% (0�78)% (0�97)% (0�40)%
Portfolio Turnover Rate† � � � � � � � � � � � � � � � 22% 69% 67% 64% 48% 62%
(1) Per share calculations were performed using average shares for the year or period.
(2) The Ratio of Expenses to Average Net Assets excludes the effect of fees paid indirectly. If these expense offsets were included, the ratios would have decreased by 2 basis points (bps), 2 bps, 2 bps and 1 bp, respectively.
(3) The Ratio of Expenses to Average Net Assets includes the effect of fees paid indirectly. If these expense offsets were excluded, the ratios would have increased by 3 bps and 1 bp, respectively.
* Annualized.
† Total return and portfolio turnover rate are for the period indicated and have not been annualized. Returns shown do not reflect the deduction of taxes that a shareholder would pay on Fund distributions or the redemption of Fund shares. Total return would have been lower had certain fees not been waived and/or expenses assumed by the Adviser during the year or period.
^ Value is less than $0.005 per share.
Amounts designated as “—” are either $0 or have been rounded to $0.
15
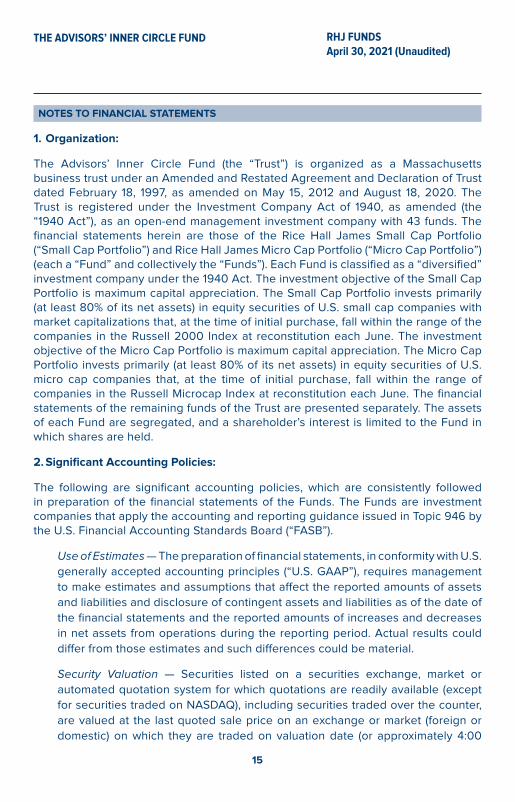
THE ADVISORS’ INNER CIRCLE FUND RHJ FUNDSApril 30, 2021 (Unaudited)
NOTES TO FINANCIAL STATEMENTS
1. Organization:
The Advisors’ Inner Circle Fund (the “Trust”) is organized as a Massachusetts business trust under an Amended and Restated Agreement and Declaration of Trust dated February 18, 1997, as amended on May 15, 2012 and August 18, 2020� The Trust is registered under the Investment Company Act of 1940, as amended (the “1940 Act”), as an open-end management investment company with 43 funds� The financial statements herein are those of the Rice Hall James Small Cap Portfolio (“Small Cap Portfolio”) and Rice Hall James Micro Cap Portfolio (“Micro Cap Portfolio”) (each a “Fund” and collectively the “Funds”)� Each Fund is classified as a “diversified” investment company under the 1940 Act� The investment objective of the Small Cap Portfolio is maximum capital appreciation� The Small Cap Portfolio invests primarily (at least 80% of its net assets) in equity securities of U�S� small cap companies with market capitalizations that, at the time of initial purchase, fall within the range of the companies in the Russell 2000 Index at reconstitution each June� The investment objective of the Micro Cap Portfolio is maximum capital appreciation� The Micro Cap Portfolio invests primarily (at least 80% of its net assets) in equity securities of U�S� micro cap companies that, at the time of initial purchase, fall within the range of companies in the Russell Microcap Index at reconstitution each June� The financial statements of the remaining funds of the Trust are presented separately� The assets of each Fund are segregated, and a shareholder’s interest is limited to the Fund in which shares are held�
2. Significant Accounting Policies:
The following are significant accounting policies, which are consistently followed in preparation of the financial statements of the Funds� The Funds are investment companies that apply the accounting and reporting guidance issued in Topic 946 by the U�S� Financial Accounting Standards Board (“FASB”)�
Use of Estimates — The preparation of financial statements, in conformity with U�S�
generally accepted accounting principles (“U�S� GAAP”), requires management
to make estimates and assumptions that affect the reported amounts of assets
and liabilities and disclosure of contingent assets and liabilities as of the date of
the financial statements and the reported amounts of increases and decreases
in net assets from operations during the reporting period� Actual results could
differ from those estimates and such differences could be material�
Security Valuation — Securities listed on a securities exchange, market or
automated quotation system for which quotations are readily available (except
for securities traded on NASDAQ), including securities traded over the counter,
are valued at the last quoted sale price on an exchange or market (foreign or
domestic) on which they are traded on valuation date (or approximately 4:00
16
THE ADVISORS’ INNER CIRCLE FUND RHJ FUNDSApril 30, 2021 (Unaudited)
pm ET if a security’s primary exchange is normally open at that time), or, if there
is no such reported sale on the valuation date, at the most recent quoted bid
price� For securities traded on NASDAQ, the NASDAQ Official Closing Price will
be used� Values of debt securities are generally reported at the last sales price if
the security is actively traded� If a debt security is not actively traded, it is valued
at an evaluated bid price by employing methodologies that utilize actual market
transactions, broker-supplied valuations, or other methodologies designed to
identify the market value for such securities� Debt obligations with remaining
maturities of sixty days or less may be valued at their amortized cost, which
approximates market value� The prices of foreign securities are reported in local
currency and converted to U�S� dollars using currency exchange rates�
Securities for which market prices are not “readily available” are valued in
accordance with fair value procedures established by the Funds’ Board of
Trustees (the “Board”)� The Funds’ fair value procedures are implemented
through a fair value pricing committee (the “Committee”) designated by the
Board� Some of the more common reasons that may necessitate that a security
be valued using fair value procedures include: the security’s trading has been
halted or suspended; the security has been de-listed from a national exchange;
the security’s primary trading market is temporarily closed at a time when
under normal conditions it would be open; the security has not been traded
for an extended period of time; the security’s primary pricing source is not
able or willing to provide a price; or trading of the security is subject to local
government-imposed restrictions� When a security is valued in accordance with
the fair value procedures, the Committee will determine the value after taking
into consideration relevant information reasonably available to the Committee�
As of April 30, 2021, there were no securities valued in accordance with the fair
value procedures�
Investments in open-end and closed-end registered investment companies
that do not trade on an exchange are valued at the end-of-day net asset value
per share� Investments in open-end and closed-end registered investment
companies that trade on an exchange are valued at the last sales price or official
closing price as of the close of the customary trading session of the exchange
on which the security is principally traded�
In accordance with the authoritative guidance on fair value measurement under
U�S� GAAP, the Funds disclose fair value of their investments in a hierarchy
that prioritizes the inputs to valuation techniques used to measure the fair
value� The objective of a fair value measurement is to determine the price that
would be received to sell an asset or paid to transfer a liability in an orderly
transaction between market participants at the measurement date (an exit price)�
Accordingly, the fair value hierarchy gives the highest priority to quoted prices
17
THE ADVISORS’ INNER CIRCLE FUND RHJ FUNDSApril 30, 2021 (Unaudited)
(unadjusted) in active markets for identical assets or liabilities (Level 1) and the
lowest priority to unobservable inputs (Level 3)� The three levels of the fair value
hierarchy are described below:
• Level 1 — Unadjusted quoted prices in active markets for identical, unrestricted
assets or liabilities that the Funds have the ability to access at the measurement
date;
• Level 2 — Other significant observable inputs (includes quoted prices for
similar securities, interest rates, prepayment speed, credit risk, referenced
indices, quoted prices in inactive markets, adjusted quoted prices in active
markets, etc�); and
• Level 3 — Prices, inputs or exotic modeling techniques that are both significant
to the fair value measurement and unobservable (supported by little or no
market activity)�
The inputs or methodology used for valuing securities are not necessarily an
indicator of the risk associated with investing in these securities�
Investments are classified within the level of the lowest significant input
considered in determining fair value� Investments classified within Level 3 whose
fair value measurement considers several inputs may include Level 1 or Level 2
inputs as components of the overall fair value measurement�
For the six months ended April 30, 2021, there have been no significant changes
to the Funds’ fair value methodologies�
Federal Income Taxes — It is the Funds’ intention to continue to qualify as
regulated investment companies for Federal income tax purposes by complying
with the appropriate provisions of Subchapter M of the Internal Revenue Code
of 1986, as amended� Accordingly, no provisions for Federal income taxes have
been made in the financial statements�
The Funds evaluate tax positions taken or expected to be taken in the course of
preparing the Funds’ tax returns to determine whether it is “more likely than not”
(i�e�, a greater than 50% probability) that each tax position will be sustained upon
examination by a taxing authority based on the technical merits of the position�
Tax positions not deemed to meet the more likely than not threshold are recorded
as a tax benefit or expense in the current year� The Funds did not record any tax
provision in the current period� However, management’s conclusions regarding
tax positions taken may be subject to review and adjustment at a later date
based on factors including, but not limited to, examination by tax authorities (i�e�,
18
THE ADVISORS’ INNER CIRCLE FUND RHJ FUNDSApril 30, 2021 (Unaudited)
the last 3 open tax year ends, as applicable), on-going analysis of and changes
to tax laws, regulations and interpretations thereof�
As of and during the six months ended April 30, 2021, the Funds did not have
a liability for any unrecognized tax benefits� The Funds recognize interest and
penalties, if any, related to unrecognized tax benefits as income tax expense in
the Statements of Operations� During the six months ended April 30, 2021, the
Funds did not incur any significant interest or penalties�
Security Transactions and Investment Income — Security transactions are
accounted for on trade date� Costs used in determining realized gains or losses
on the sale of investment securities are based on the specific identification
method� Dividend income is recorded on the ex-dividend date�
Expenses — Most expenses of the Trust can be directly attributed to a particular
fund� Certain expenses are apportioned among the Trust based on the number
of funds and/or relative net assets�
Dividends and Distributions to Shareholders — Each Fund distributes
substantially all of its net investment income, if any, quarterly� Any net realized
capital gains are distributed at least annually� All distributions are recorded on
ex-dividend date�
Cash — Idle cash may be swept into various time deposit accounts and is classified
as cash on the Statements of Assets and Liabilities� Each fund maintains cash
in bank deposit accounts which, at times, may exceed United States federally
insured limits� Amounts invested are available on the same business day�
Redemption Fees — The Micro Cap Portfolio imposes a 2�00% redemption fee
on the value of Institutional Class shares redeemed fewer than 90 days from
the date of purchase� The redemption fee is recorded as an increase to paid-in
capital� The Micro Cap Portfolio imposed redemption fees of $164 and $19,632
for the six months ended April 30, 2021 and the year ended October 31, 2020,
respectively�
3. Transactions with Affiliates:
Certain officers of the Trust are also employees of SEI Investments Global Funds Services (the “Administrator”), a wholly owned subsidiary of SEI Investments Company, and/or SEI Investments Distribution Co� (the “Distributor”)� Such officers are paid no fees by the Trust, other than the Chief Compliance Officer (“CCO”) as described below, for serving as officers of the Trust�
A portion of the services provided by the CCO and his staff, who are employees of the Administrator, are paid for by the Trust as incurred� The services include
19
THE ADVISORS’ INNER CIRCLE FUND RHJ FUNDSApril 30, 2021 (Unaudited)
regulatory oversight of the Trust’s Advisors and service providers as required by SEC regulations� The CCO’s services have been approved by and are reviewed by the Board�
4. Administration, Distribution, Commission Recapture, Shareholder Servicing, Transfer Agent and Custodian Agreements:
The Funds and the Administrator are parties to an Administration Agreement, under which the Administrator provides management and administrative services to the Funds� For these services, the Administrator is paid an asset-based fee, which will vary depending on the number of share classes and the average daily net assets of the Funds� For the six months ended April 30, 2021, the Small Cap Portfolio and Micro Cap Portfolio paid $19,931 and $54,453, respectively, for these services�
The Funds direct, via a network of executing brokers, certain fund trades to the Distributor, who pays a portion of the Funds’ expenses� Under this arrangement, the Small Cap Portfolio and the Micro Cap Portfolio had expenses reduced by $4,636 and $3,840, respectively, savings that were used to pay administrative expenses� These amounts are included in “Fees Paid Indirectly” on the Statements of Operations�
Certain brokers, dealers, banks, trust companies and other financial representatives received compensation from the Funds for providing a variety of services, including record keeping and transaction processing� Such fees are based on the assets of the Funds that are serviced by the financial representative� Such fees are paid by the Funds to the extent that the number of accounts serviced by the financial representative multiplied by the account fee charged by the Funds’ transfer agent would not exceed the amount that would have been charged had the accounts serviced by the financial representative been registered directly through the transfer agent� All fees in excess of this calculated amount are paid by Rice Hall James & Associates, LLC (the “Adviser”)� These fees are disclosed on the Statements of Operations as Shareholder Servicing fees�
DST Systems, Inc� serves as the transfer agent and dividend-disbursing agent for the Funds under a transfer agency agreement with the Trust�
The Funds may earn cash management credits that can be used to offset transfer agent expenses� During the six months ended April 30, 2021, the Small Cap Portfolio and the Micro Cap Portfolio earned credits of $117 and $131, respectively, which were used to offset transfer agent expenses� These amounts are included in “Fees Paid Indirectly” on the Statements of Operations�
MUFG Union Bank, N�A� acts as custodian (the “Custodian”) for the Funds� The Custodian plays no role in determining the investment policies of the Funds or which securities are to be purchased or sold by the Funds�
20
THE ADVISORS’ INNER CIRCLE FUND RHJ FUNDSApril 30, 2021 (Unaudited)
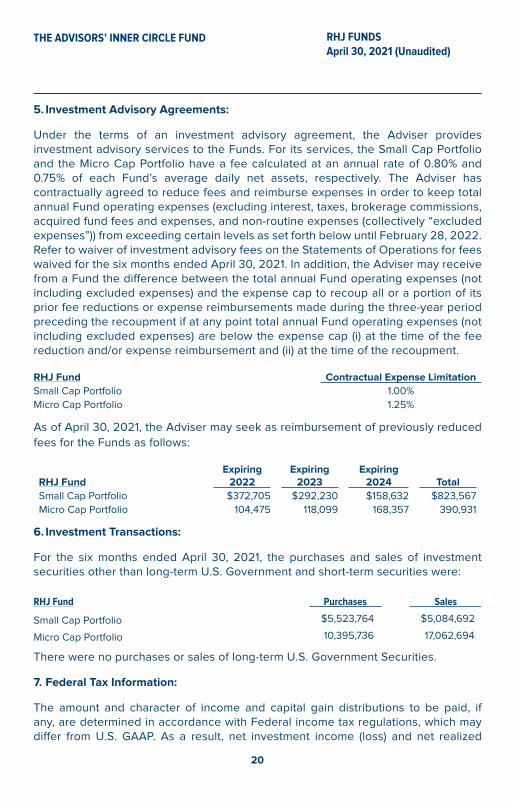
5. Investment Advisory Agreements:
Under the terms of an investment advisory agreement, the Adviser provides investment advisory services to the Funds� For its services, the Small Cap Portfolio and the Micro Cap Portfolio have a fee calculated at an annual rate of 0�80% and 0�75% of each Fund’s average daily net assets, respectively� The Adviser has contractually agreed to reduce fees and reimburse expenses in order to keep total annual Fund operating expenses (excluding interest, taxes, brokerage commissions, acquired fund fees and expenses, and non-routine expenses (collectively “excluded expenses”)) from exceeding certain levels as set forth below until February 28, 2022� Refer to waiver of investment advisory fees on the Statements of Operations for fees waived for the six months ended April 30, 2021� In addition, the Adviser may receive from a Fund the difference between the total annual Fund operating expenses (not including excluded expenses) and the expense cap to recoup all or a portion of its prior fee reductions or expense reimbursements made during the three-year period preceding the recoupment if at any point total annual Fund operating expenses (not including excluded expenses) are below the expense cap (i) at the time of the fee reduction and/or expense reimbursement and (ii) at the time of the recoupment�
RHJ Fund Contractual Expense Limitation
Small Cap Portfolio 1�00%
Micro Cap Portfolio 1�25%
As of April 30, 2021, the Adviser may seek as reimbursement of previously reduced
fees for the Funds as follows:
RHJ Fund
Expiring 2022
Expiring 2023
Expiring 2024
Total
Small Cap Portfolio $372,705 $292,230 $158,632 $823,567
Micro Cap Portfolio 104,475 118,099 168,357 390,931
6. Investment Transactions:
For the six months ended April 30, 2021, the purchases and sales of investment securities other than long-term U�S� Government and short-term securities were:
RHJ Fund Purchases Sales
Small Cap Portfolio $5,523,764 $5,084,692
Micro Cap Portfolio 10,395,736 17,062,694
There were no purchases or sales of long-term U�S� Government Securities�
7. Federal Tax Information:
The amount and character of income and capital gain distributions to be paid, if any, are determined in accordance with Federal income tax regulations, which may differ from U�S� GAAP� As a result, net investment income (loss) and net realized

21
THE ADVISORS’ INNER CIRCLE FUND RHJ FUNDSApril 30, 2021 (Unaudited)
gain (loss) on investment transactions for a reporting period may differ significantly from distributions during the year� The book/tax differences may be temporary or permanent�
The tax character of dividends and distributions declared during the last two fiscal years was as follows:
RHJ Fund Ordinary Income Long-Term Capital Gains Return of Capital Total
Small Cap Portfolio
2020 $ - $ - $ - $ - 2019 1,474,205 8,345,097 40,146 9,859,448 Micro Cap Portfolio
2020 - 501,345 - 501,345 2019 785,181 8,807,437 - 9,592,618 As of October 31, 2020, the components of distributable earnings (accumulated losses) on a tax basis were as follows:
RHJ FundCapital Loss Carry
Forward - Short-TermLate-Year Loss
DeferralUnrealized
Appreciation
Total Distributable Earnings
(Accumulated Losses)Small Cap Portfolio $ (2,713,884) $ (89,246) $ 1,563,608 $ (1,239,522)
Micro Cap Portfolio (1,329,377) (253,098) 7,426,158 5,843,683
For Federal income tax purposes, capital losses incurred may be carried forward and applied against future capital gains� Net capital losses earned may be carried forward indefinitely and retain their character as either short-term or long-term capital losses� During the year ended October 31, 2020, Small Cap Portfolio utilized $1,228,744 in capital loss carryforwards to offset capital gain�
Late-year loss deferrals represent ordinary losses realized on investment transactions from January 1, 2020 through October 31, 2020, that, in accordance with Federal income tax regulations, the Fund defers and treats as having arisen in the following fiscal year�
For Federal income tax purposes, the difference between Federal tax cost and book cost is due to wash sales, which cannot be used for Federal income tax purposes in the current year and have been deferred for use in future years�
22
THE ADVISORS’ INNER CIRCLE FUND RHJ FUNDSApril 30, 2021 (Unaudited)
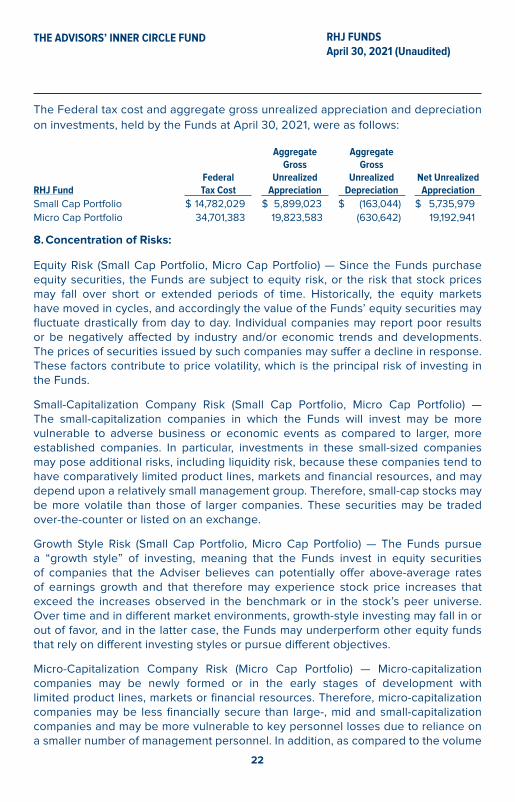
The Federal tax cost and aggregate gross unrealized appreciation and depreciation
on investments, held by the Funds at April 30, 2021, were as follows:
RHJ FundFederal Tax Cost
Aggregate Gross
Unrealized Appreciation
Aggregate Gross
Unrealized Depreciation
Net Unrealized Appreciation
Small Cap Portfolio $ 14,782,029 $ 5,899,023 $ (163,044) $ 5,735,979
Micro Cap Portfolio 34,701,383 19,823,583 (630,642) 19,192,941
8. Concentration of Risks:
Equity Risk (Small Cap Portfolio, Micro Cap Portfolio) — Since the Funds purchase equity securities, the Funds are subject to equity risk, or the risk that stock prices may fall over short or extended periods of time� Historically, the equity markets have moved in cycles, and accordingly the value of the Funds’ equity securities may fluctuate drastically from day to day� Individual companies may report poor results or be negatively affected by industry and/or economic trends and developments� The prices of securities issued by such companies may suffer a decline in response� These factors contribute to price volatility, which is the principal risk of investing in the Funds�
Small-Capitalization Company Risk (Small Cap Portfolio, Micro Cap Portfolio) — The small-capitalization companies in which the Funds will invest may be more vulnerable to adverse business or economic events as compared to larger, more established companies� In particular, investments in these small-sized companies may pose additional risks, including liquidity risk, because these companies tend to have comparatively limited product lines, markets and financial resources, and may depend upon a relatively small management group� Therefore, small-cap stocks may be more volatile than those of larger companies� These securities may be traded over-the-counter or listed on an exchange�
Growth Style Risk (Small Cap Portfolio, Micro Cap Portfolio) — The Funds pursue a “growth style” of investing, meaning that the Funds invest in equity securities of companies that the Adviser believes can potentially offer above-average rates of earnings growth and that therefore may experience stock price increases that exceed the increases observed in the benchmark or in the stock’s peer universe� Over time and in different market environments, growth-style investing may fall in or out of favor, and in the latter case, the Funds may underperform other equity funds that rely on different investing styles or pursue different objectives�
Micro-Capitalization Company Risk (Micro Cap Portfolio) — Micro-capitalization companies may be newly formed or in the early stages of development with limited product lines, markets or financial resources� Therefore, micro-capitalization companies may be less financially secure than large-, mid and small-capitalization companies and may be more vulnerable to key personnel losses due to reliance on a smaller number of management personnel� In addition, as compared to the volume
23
THE ADVISORS’ INNER CIRCLE FUND RHJ FUNDSApril 30, 2021 (Unaudited)
of information available about larger peers, there may be less public information available about these companies� Micro-capitalization stock prices may be more volatile than stock prices corresponding to large-, mid- and small-capitalization companies, and such stocks may be more thinly traded and thus difficult for the Fund to buy and sell in the market�
Market Risk (Small Cap Portfolio, Micro Cap Portfolio) — The risk that the market value of an investment may move up and down, sometimes rapidly and unpredictably� Markets for securities in which the Funds invest may decline significantly in response to adverse issuer, political, regulatory, market, economic or other developments that may cause broad changes in market value, public perceptions concerning these developments, and adverse investor sentiment or publicity� Similarly, the impact of any epidemic, pandemic or natural disaster, or widespread fear that such events may occur, could negatively affect the global economy, as well as the economies of individual countries, the financial performance of individual companies and sectors, and the markets in general in significant and unforeseen ways� Any such impact could adversely affect the prices and liquidity of the securities and other instruments in which the Funds invest, which in turn could negatively impact the Funds’ performance and cause losses on your investment in the Funds�
The foregoing is not intended to be a complete discussion of the risks associated with investing in the Funds� A more complete description of risks associated with the Funds is included in the prospectus and statement of additional information�
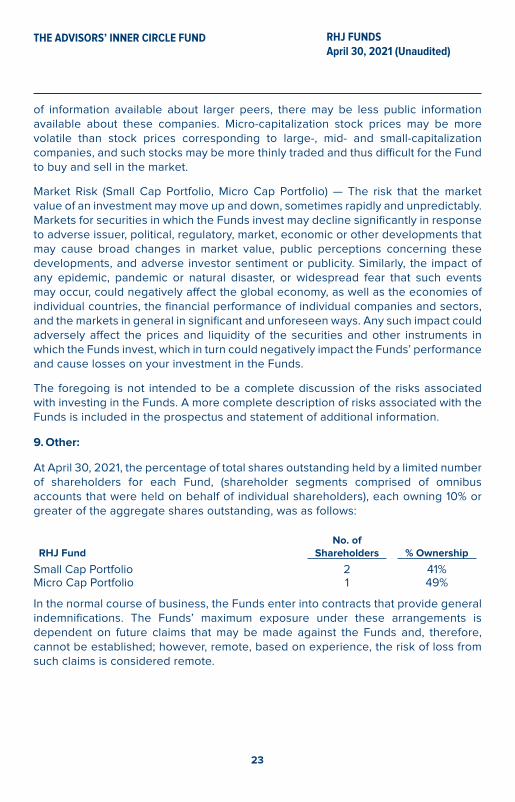
9. Other:
At April 30, 2021, the percentage of total shares outstanding held by a limited number of shareholders for each Fund, (shareholder segments comprised of omnibus accounts that were held on behalf of individual shareholders), each owning 10% or greater of the aggregate shares outstanding, was as follows:
RHJ FundNo. of
Shareholders % Ownership
Small Cap Portfolio 2 41%Micro Cap Portfolio 1 49%
In the normal course of business, the Funds enter into contracts that provide general indemnifications� The Funds’ maximum exposure under these arrangements is dependent on future claims that may be made against the Funds and, therefore, cannot be established; however, remote, based on experience, the risk of loss from such claims is considered remote�

24
THE ADVISORS’ INNER CIRCLE FUND RHJ FUNDSApril 30, 2021 (Unaudited)
10. Subsequent Events:
The Funds have evaluated the need for additional disclosures and/or adjustments resulting from subsequent events through the date the financial statements were issued� Based on this evaluation, no additional disclosures and/or adjustments to the financial statements were required�
25
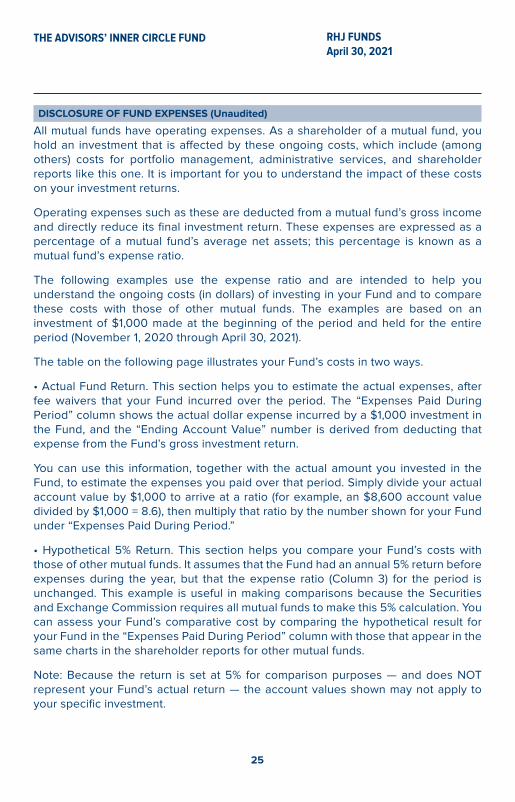
DISCLOSURE OF FUND EXPENSES (Unaudited)
THE ADVISORS’ INNER CIRCLE FUND RHJ FUNDSApril 30, 2021
All mutual funds have operating expenses� As a shareholder of a mutual fund, you hold an investment that is affected by these ongoing costs, which include (among others) costs for portfolio management, administrative services, and shareholder reports like this one� It is important for you to understand the impact of these costs on your investment returns�
Operating expenses such as these are deducted from a mutual fund’s gross income and directly reduce its final investment return� These expenses are expressed as a percentage of a mutual fund’s average net assets; this percentage is known as a mutual fund’s expense ratio�
The following examples use the expense ratio and are intended to help you understand the ongoing costs (in dollars) of investing in your Fund and to compare these costs with those of other mutual funds� The examples are based on an investment of $1,000 made at the beginning of the period and held for the entire period (November 1, 2020 through April 30, 2021)�
The table on the following page illustrates your Fund’s costs in two ways�
• Actual Fund Return� This section helps you to estimate the actual expenses, after fee waivers that your Fund incurred over the period� The “Expenses Paid During Period” column shows the actual dollar expense incurred by a $1,000 investment in the Fund, and the “Ending Account Value” number is derived from deducting that expense from the Fund’s gross investment return�
You can use this information, together with the actual amount you invested in the Fund, to estimate the expenses you paid over that period� Simply divide your actual account value by $1,000 to arrive at a ratio (for example, an $8,600 account value divided by $1,000 = 8�6), then multiply that ratio by the number shown for your Fund under “Expenses Paid During Period�”
• Hypothetical 5% Return� This section helps you compare your Fund’s costs with those of other mutual funds� It assumes that the Fund had an annual 5% return before expenses during the year, but that the expense ratio (Column 3) for the period is unchanged� This example is useful in making comparisons because the Securities and Exchange Commission requires all mutual funds to make this 5% calculation� You can assess your Fund’s comparative cost by comparing the hypothetical result for your Fund in the “Expenses Paid During Period” column with those that appear in the same charts in the shareholder reports for other mutual funds�
Note: Because the return is set at 5% for comparison purposes — and does NOT represent your Fund’s actual return — the account values shown may not apply to your specific investment�
26
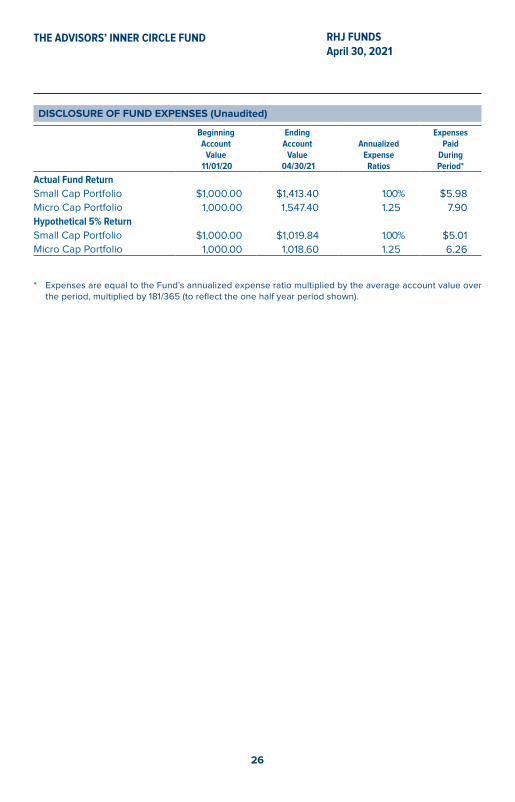
DISCLOSURE OF FUND EXPENSES (Unaudited)
THE ADVISORS’ INNER CIRCLE FUND RHJ FUNDSApril 30, 2021
Beginning Account
Value 11/01/20
Ending Account
Value 04/30/21
Annualized Expense
Ratios
Expenses Paid
During Period*
Actual Fund ReturnSmall Cap Portfolio $1,000�00 $1,413�40 1�00% $5�98
Micro Cap Portfolio 1,000�00 1,547�40 1�25 7�90
Hypothetical 5% ReturnSmall Cap Portfolio $1,000�00 $1,019�84 1�00% $5�01
Micro Cap Portfolio 1,000�00 1,018�60 1�25 6�26
* Expenses are equal to the Fund’s annualized expense ratio multiplied by the average account value over the period, multiplied by 181/365 (to reflect the one half year period shown)�

This page intentionally left blank.

This page intentionally left blank.

This page intentionally left blank.

RHJ-SA-001-2000
This information must be preceded or accompanied by a current
prospectus for the Funds described.
The Rice Hall James Funds
P�O� Box 219009
Kansas City, MO 64121
866-474-5669
www�rhjfunds�com
Adviser:
Rice Hall James & Associates, LLC
600 West Broadway, Suite 1000
San Diego, CA 92101
Distributor:
SEI Investments Distribution Co�
One Freedom Valley Drive
Oaks, PA 19456
Administrator:
SEI Investments Global Funds Services
One Freedom Valley Drive
Oaks, PA 19456
Legal Counsel:
Morgan, Lewis & Bockius LLP
1701 Market Street
Philadelphia, PA 19103