the agulhas return current - bcre · agulhas return current to extend as far east as 728e, ......
TRANSCRIPT

Ž .Journal of Marine Systems 30 2001 115–138www.elsevier.comrlocaterjmarsys
The Agulhas Return Current
J.R.E. Lutjeharms), I.J. AnsorgeDepartment of Oceanography, UniÕersity of Cape Town, 7700 Rondebosch, South Africa
Received 4 April 2000; accepted 5 March 2001
Abstract
The Agulhas Return Current constitutes the intense flow along the Subtropical Convergence south of Africa. It forms theconnecting link between the generically similar South Atlantic Current and the South Indian Ocean Current, thuscontributing to the water exchange between these two basins. This general along-front flow is, however, substantiallymodified south of Africa by contributions from the Agulhas Current.
We have carried out a first study of the hydrography and dynamics of the Agulhas Return Current along its full lengthusing a collection of available modern hydrographic data. It is shown that on average the current lies at a latitude of 39830XSsouth of Africa, increasing slowly downstream to a latitude of 44830XS at 608E, except where it crosses a number ofmeridional ridges where northward shifts of up to 2830X are occasionally observed. Geostrophic speeds relative to 1500 mdemonstrate a gradual eastward decrease in the velocity of the current from an average of 75 cmrs at the Agulhasretroflection to 13 cmrs at 768E. Volume transports are similarly reduced from 54=106 m3rs in the retroflection region to15=106 m3rs at 768E. Temperaturersalinity properties show water mass characteristics of the Agulhas Current to extendto at least 618E.
Based on these results, we suggest that the Agulhas Return Current is zonally continuous and terminates between 668Eand 708E. We therefore propose that the name South Indian Ocean Current be retained for the flow east of here only. q 2001Elsevier Science B.V. All rights reserved.
Keywords: Agulhas Return Current; Geostrophic speed; Volume transport
1. Introduction
The greater Agulhas Current system forms theintensified western component of the subtropical gyre
Žof the South Indian Ocean Stramma and Lutje-.harms, 1997 . The Agulhas Current is supplied with
Indian Ocean Tropical Surface Water of lower salin-Ž . Žity 34.8–35.1 from the tropics Gordon et al.,. Ž .1987 and with more saline )35.4 South Indian
) Corresponding author. Tel.: q27-21-650-3279; fax: q27-21-650-3979.
Ž .E-mail address: [email protected] J.R.E. Lutjeharms .
Subtropical Surface Water by the South West IndianŽ .Ocean subgyre Wyrtki, 1971 . The Agulhas Current
follows the continental shelf break of south-easternŽ .Africa closely Grundlingh, 1983 until it reaches the¨
southern tip of Africa. Here the Agulhas Currentterminates, with its water flowing into both adjacentocean basins.
Estimates of the ratio of Agulhas Current waterthat enters the South Atlantic Ocean against thatwhich flows back into the South Indian Ocean havevaried enormously ever since the very first calcula-
Žtions of this kind were made Lutjeharms et al.,.1992 . It is now recognised that the Agulhas Current
0924-7963r01r$ - see front matter q 2001 Elsevier Science B.V. All rights reserved.Ž .PII: S0924-7963 01 00041-0

( )J.R.E. Lutjeharms, I.J. AnsorgerJournal of Marine Systems 30 2001 115–138116
retroflects almost completely south of AfricaŽGordon, 1985; Gordon et al., 1987; Lutjeharms and
.van Ballegooyen, 1988 , and that the leakage ofAgulhas water between the South Indian and SouthAtlantic Oceans is by way of large Agulhas ringsŽ .van Ballegooyen et al., 1994 and to a lesser extent
Ž .by Agulhas filaments Lutjeharms and Cooper, 1996 .The remainder of the waters of the Agulhas Currentflows back into the South Indian Ocean as the
Ž .Agulhas Return Current see Fig. 1 .The trajectory of the Agulhas Return Current has
not, to date, been determined with any degree ofreliability and may in fact be very variable. Drifting
Žbuoys have shown Grundlingh, 1978; Daniault and¨.Menard, 1985; Hoffman, 1985 that its general mo-´
tion is zonal, with extensive meridional excursionsthat may be related to changes in the bottom topog-
Žraphy Darbyshire, 1972; Lutjeharms and van Balle-.gooyen, 1984 along its path. The region is one of
Žextreme mesoscale variability, e.g. Cheney et al.,. Ž1983 as a result of recurrent eddy generation e.g.
.Lutjeharms and Valentine, 1988 but also to shiftsand time-varying meanders in the path of the Agul-has Return Current along the Subtropical Conver-gence.
The Subtropical Convergence is a weak front inŽ .the South Atlantic e.g. Lutjeharms et al., 1993 .
ŽThe classical term Subtropical Convergence will beused throughout, instead of the more trendy Subtrop-ical Front, since no argument has to date been forth-coming that contradicts the findings that this front is
.indeed a convergence . South of Africa the frontalcharacteristics of the Subtropical Convergence aregreatly strengthened by the adjacent warm, salty
water of the Agulhas Return Current. Here the Agul-has Return Current tends to follow the SubtropicalConvergence, but is sometimes separate from itŽ .Lutjeharms, 1985 . Then a distinct Agulhas Front inaddition to the Subtropical Convergence proper can
Ž .be observed Belkin and Gordon, 1996 .The Agulhas water returned to the South Indian
Ocean in the Agulhas Return Current may undergomodification by mixing with adjacent water masses,as well as by air–sea interaction. Mean heat losses of
2 Žup to 200 Wrm at the Agulhas retroflection Mey.and Walker, 1990 and an excess of evaporation over
precipitation change the temperaturersalinity charac-teristics of the upper layers in this region here.Downstream losses of water from the Agulhas Re-turn Current to the interior flow of the subtropicalgyre have, furthermore, been thought to reduce the
Žflow of this current on its way eastward Harris,.1970 .
Ž .Belkin and Gordon 1996 have considered theAgulhas Return Current to extend as far east as 728E,since they found that water of Agulhas Currentorigin was clearly evident over the South-east Indian
Ž .Ridge at 788E. Park et al. 1991, 1993 have come tothe same conclusion based on investigations in theCrozet Basin. They have found that the current,having undiminished Agulhas Current characteristicsat 608E, has dissipated totally by 758E. OthersŽVeronis, 1973; Stramma, 1992; Stramma and Lutje-
.harms, 1997 have suggested such a large degree ofbranching northward of Agulhas water along theeastward flow path, that the Agulhas Return Currentwould already be utterly exhausted much farther tothe west.
ŽFig. 1. A conceptual portrayal of the Agulhas Return Current as a component of the greater Agulhas Current system modified from.Lutjeharms and van Ballegooyen, 1988; Stramma and Lutjeharms, 1997 .

( )J.R.E. Lutjeharms, I.J. AnsorgerJournal of Marine Systems 30 2001 115–138 117
It is therefore as yet unclear how rapidly theAgulhas Return Current dissipates or how coherent itremains downstream. A thorough along-stream ana-lysis of its changing hydrographic characteristics hasyet to be undertaken. We therefore present here theresults of such an analysis of the mass flux, velocityand TrS characteristics of the Agulhas Return Cur-rent along its full length to determine its zonalcoherence and its rate of downstream modification.
2. Data and methods
Two data sets have been employed for this inves-Žtigation: a collection of CTD conductivity–tempera-
.ture–depth station data from six modern cruises andŽ .a collection of XBT expendable bathythermograph
data from a further six cruises that fill gaps betweenŽ .the CTD station lines vide Fig. 2 . CTD data sets
were selected geographically to cover the AgulhasReturn Current and to overlap with the upstreamSouth Atlantic Current as well as with the down-
Ž .stream South Indian Ocean Current Fig. 2 . To beconsidered for inclusion in this data set, the stationspacing along these cruise lines could not exceed 75
Ž .km mostly ranges between 20 and 60 km in orderto allow accurate determinations of the geostrophicvelocity, the volume transport and the hydrographiccharacteristics of the currents. Data were collectedover a period of about 20 years, with most of thedata having been collected during the austral sum-mer. CTD data were all collected between 1983 and1991. No statistically reliable evidence on eitherinter- or intra-annual variations can therefore beexpected to be gained from this data set.
The resultant geographic coverage, extending overŽ .768 longitude, is not ideal Fig. 2 . Station spacing
differs between cruises. In general, cruise lines arerelatively wide apart except in the region south ofAfrica where the Agulhas Return Current originates.In this important genesis region, data coverage isample, allowing the current to be investigated inconsiderable detail. Information on each cruise is setout in Table 1. Full accounts of the data collecting
Fig. 2. The geographic distribution of cruise lines and stations that constitute the hydrographic data set used for this investigation. CTDŽ .conductivity–temperature–depth stations are indicated by symbols; solid lines show cruise lines on which closely spaced XBTŽ .expendable bathythermograph measurements were made. Details on each of these individual cruises is given in Table 1.

( )J.R.E. Lutjeharms, I.J. AnsorgerJournal of Marine Systems 30 2001 115–138118
Table 1Origin and characteristics of hydrographic data used in this analysis
Cruise Data Period Vessel Reference
Ž .AJAX CTD Oct 1983–Jan 1984 Knorr Whitworth and Nowlin, 1987Ž .SCARC CTD Feb–Mar 1987 S.A. Agulhas Valentine et al., 1988Ž .ARC CTD Nov–Dec 1983 Knorr Camp et al., 1986Ž .Marathon CTD Feb–Mar 1985 Thomas Washington Bennett, 1988Ž .Discovery 164 CTD Dec 1986–Jan 1987 Discovery Pollard et al., 1987Ž .SUZIL CTD Apr–May 1992 M. Dufresne Park et al., 1993
Ž . Ž .A. Shirshov AS CTD 5 Nov 1970 Akademik Shirshov Belkin and Gordon, 1996Ž . Ž .Y.M. Shokalskii 33 S CTD July 1976 Yu. M. Shokalskii Belkin and Gordon, 1996
Ž . Ž .Vitayaz 4 V CTD Jan 1983 Vitayaz Belkin and Gordon, 1996Ž . Ž .Marion 83 M83 XBT Nov 1983 S.A. Agulhas Lutjeharms and Gordon, 1987Ž . Ž .Marion 86 M86 XBT May 1986 S.A. Agulhas Lutjeharms and Matthysen, in preparation
Ž . Ž .FIBEX F XBT Feb–Mar 1981 S.A. Agulhas Lutjeharms, 1985Ž . Ž .Gallieni 72 G XBT 1972 Gallieni Park et al., 1991
Brackets denote the prime papers on a cruise for which data in electronic form were made available.
procedures, instrument calibration, data processing,and thus the resultant accuracy to be expected, arefound in the references given in this table. Thisinformation is not repeated here. Suffice to say thatall these data are of high quality and considerablymore accurate than any previously available.
From these data vertical sections for temperature,salinity and dissolved oxygen have been drawn and,where appropriate, curves of potential temperaturer
Ž .salinity QrS and potential temperaturerdissolvedŽ .oxygen QrO relationships for individual stations2
and for groups of stations constructed to characterizevarious water masses. Geostrophic velocities and thevolume transport between adjacent stations for eachcruise line have been calculated at every 20-db pres-sure level in the upper 500 m and either every 50 dbor every 100 db in the rest of the water columnmeasured. The 1500 m is the deepest common depthfor all full hydrographic stations of this data set;3000 m is the deepest common depth for the stationsoccupied as part of the SUZIL and the Discovery164 cruises.
3. Geographic location of the Agulhas ReturnCurrent
In order to establish a reliable baseline for thezonal flow along the Subtropical Convergence with-out the presence of the Agulhas Return Current, a
meridional line of stations was selected at the Green-Ž .wich meridian Whitworth and Nowlin, 1987 . The
farthest westward extent of the Agulhas retroflectionloop, and its products, that has been reported to dateŽ .Lutjeharms, 1988 is 58E. This line of stations shouldtherefore be well upstream of the influence of theAgulhas Current. On this cruise line the SubtropicalConvergence and the attendant South Atlantic Cur-
X Ž .rent were found at about 37830 S latitude Fig. 3 .The temperature change across the front was from14.3 to 12.1 8C and the salinities from 35.17 to 34.63at the sea surface. Both these surface gradients areweak in comparison to those observed south of
Ž .Africa Lutjeharms and Valentine, 1984 and in moreŽwestern parts of the South Atlantic e.g. Stramma
.and Peterson, 1990; Lutjeharms et al., 1993 . TheŽ .middle temperature is also slightly lower 13 8C
than the average found over a more extensive zoneŽ .14.2 8C; Lutjeharms and Valentine, 1984 . Theseresults are, however, in substantial agreement with
Žsubsequent observations made here Le Groupe.CITHER-3, 1996 . In general, the salinity seems a
more reliable indicator of the meridional terminationŽ .of the subtropical surface regime Fig. 3c than the
Ž .temperature Fig. 3b .This section upstream of the influence of the
Agulhas Current gives a good representation of theSubtropical Convergence in its unenhanced state.Further eastwards this frontal expression becomesconsiderably more complex and it will be moredifficult to distinguish the Subtropical Convergence

( )J.R.E. Lutjeharms, I.J. AnsorgerJournal of Marine Systems 30 2001 115–138 119
Ž . Ž .Fig. 3. a The geographic location of an AJAX cruise line and the stations between which the South Atlantic Current was located circled ;Ž . Ž .b the vertical temperature section to 1500-m depth along this line showing the location of the South Atlantic Current; and c the verticalsalinity section for the same line. Note that for clarity some isotherms have been omitted.
Ž .from the Agulhas Front Belkin and Gordon, 1996 .No objective definition of frontal characteristics willsuffice to make this distinction entirely unambigu-
Žous. Downstream of the Agulhas retroflection Fig..1 any enhancement of the Subtropical Convergence
in the South Atlantic has therefore been deemed torepresent the presence of the Agulhas Return Cur-
rent; any secondary front to the north, the AgulhasFront.
By contrast, the gradients south of Africa areŽ .much stronger Fig. 4 and the frontal and current
portrayal much more complicated. This is evident inboth the temperature, salinity and the dissolved oxy-gen sections shown in Fig. 4. From an abundance of

( )J.R.E. Lutjeharms, I.J. AnsorgerJournal of Marine Systems 30 2001 115–138120
Ž .Fig. 4. a The geographic location of an ARC cruise line with the stations between which the Agulhas Return Current was located shownŽ . Ž .by triangles; b the vertical temperature section to 1500-m depth along this line showing the location of the Agulhas Return Current; c the
Ž .vertical salinity section; and d the vertical oxygen for the same line.
Ž .station lines from this region vide Fig. 2 , thisparticular one was selected for inclusion here for itsnear-meridional nature and its good coverage of the
Agulhas Return Current. All other sections wereŽ .used to locate the current Fig. 8 , but are for the
sake of brevity not reproduced here. In the represen-

( )J.R.E. Lutjeharms, I.J. AnsorgerJournal of Marine Systems 30 2001 115–138 121
tative section portrayed in Fig. 4, the Agulhas ReturnCurrent is found to lie between 40840XS and 39820XS.At a 200-db level, a depth thought best to representthe location of the core of the Agulhas CurrentŽ .Grundlingh, 1983 and therefore also the Agulhas¨Return Current, the temperature range at the southernfront of this current was from 18 to 11 8C, salinityfrom 35.57 to 34.80 and oxygen values from 5.1 to5.3 mlrl. The current may be considered to havebeen adjacent to the Subtropical Convergence at thistime, but its flow is complicated by a westward flowlying slightly to the north and a possible warm eddyto the south.
Ž .An XBT section Marion 83, Table 1, Fig. 2 ,taken shortly before, located front and current atmore or less the same latitude, but with a simpler,singular, current portrayal. The general location andthermohaline nature of the Agulhas Return Currentat this time may be considered quite representativeŽ .Lutjeharms, 1990 . It is important to note that thevertical disturbance caused in the thermohaline fieldby the presence of the Agulhas Return Current ex-
Ž .tends to depths exceeding 1500 m Fig. 4 . On thisŽoccasion, it was not evident below 2000 m not
.shown here . The oxygen distribution demonstratesŽ .Fig. 4c that at 200-m depth, the Agulhas ReturnCurrent had a core of oxygen lower than its immedi-ate surroundings. At a depth of 500 m there is, bycontrast, a core of higher oxygen. The subsurfacecore of slightly higher oxygen values is also evidentin a section lying farther to the east, but still part of
Ž .the collection of stations south of Africa Fig. 5 .The water mass distribution in the roughly merid-
ional section shown in Fig. 5 is in many waysconsiderably less complicated than that of Fig. 4. Itresolves the inflow of the Agulhas Current off the
Ž .coast of Africa stations 277–280, Fig. 5b,c that isexemplified by the strong downward thermohalinegradient in a southerly direction. As a near-mirrorimage, the Agulhas Return Current was found furthersouth at about 398S with a width of only about 70km. This can in many ways be considered as repre-senting the outflow of the Agulhas Return Current
Ž .from the Agulhas retroflection region vide Fig. 5 .A comparison of the two currents across this sectionshows that all the surface water with temperatures inexcess of 22 8C in the Agulhas Current inflow haddisappeared in the Agulhas Return Current outflow,
probably due to cooling by interaction with theatmosphere. This modification of surface waters ex-tended to a depth of at least 150 m. The subsurfacesalinity maximum, representing South Indian Sub-tropical Surface Water, is nevertheless still clearlyevident in the outflow.
The location of the Agulhas Return Current onthis section was considerably farther to the norththan that of the section shown in Fig. 4. This wasmost probably due to an extensive meander in thecurrent deflecting it northwards around the AgulhasPlateau that is found at this longitude. This conclu-sion is supported by the results of the two XBT
Ž .sections carried out through this region vide Fig. 2 .These temperature sections also show the core of theAgulhas Return Current lying to the north of theAgulhas Plateau. During the Marathon cruise, onwhich the section in Fig. 5 is based, the core of thecurrent—as exemplified by the place at which the 158C isotherm cuts the 200-m depth horizon—lies over
Ža depth of 2700 m. In previous surveys e.g. Gordon.et al., 1987; Harris and Bang, 1974 , this contour
was found over a water depth of 4200 m. One maytherefore assume that the Agulhas Return Currenttends to meander northwards around the AgulhasPlateau, but that the extent and location of thismeander is very variable in time. East of here, anypossible meanders in the path of the Agulhas ReturnCurrent that are due to bottom obstructions may beconsiderably less severe, but this perception may be
Ždue in part to the dearth of data for this region vide.Fig. 2 .
The first good hydrographic section downstreamof the region south of Africa is found at about 408EŽ .Fig. 6 and shows the Agulhas Return Currentdistinctly separate from the Subtropical Conver-gence, lying 160 km north of this front. The thermaldisturbances associated with these two features were
Žobserved to a depth of at least 3000 m here Read.and Pollard, 1993 , in substantial agreement with
Žthose of previous studies in the region e.g. Jacobs.and Georgi, 1977 . The distinctive current features
evident in this section are in contrast to what isfound in the farthest eastern section of this hydro-graphic data set, at 758E, shown in Fig. 7.
Here, there is no longer any evidence of a sepa-rate Agulhas Return Current. The possible remnantof a feeble Agulhas Front tentatively indicated in

( )J.R.E. Lutjeharms, I.J. AnsorgerJournal of Marine Systems 30 2001 115–138122
Ž .Fig. 5. a The geographic location of a Marathon cruise line and the stations along this line between which the Agulhas Return Current wasŽ . Ž .located indicated by diamonds ; b the vertical temperature section to 1500-m depth along this line showing the location of the Agulhas
Ž . Ž .Return Current; c the vertical salinity section; and d the vertical oxygen section for the same line.
Fig. 7 does not penetrate below 2000-m depth. Al-though the frontal thermohaline characteristics of theSubtropical Convergence were well developed dur-
ing this crossing, there no longer is any evidenceŽ .vide Fig. 7c for high salinity water associated withAgulhas water, the highest values being only 35.2

( )J.R.E. Lutjeharms, I.J. AnsorgerJournal of Marine Systems 30 2001 115–138 123
Ž .Fig. 6. a The geographic location of a Discovery 164 cruise line and the stations shown by circles along this line between which theŽ .Agulhas Return Current was located; b the vertical temperature section to 1500-m depth along this line showing the location of the
Ž .Agulhas Return Current and the Subtropical Convergence; and c the vertical salinity section for the same line.
Ž .instead of 35.6 Fig. 5 . In this respect, this sectionshows a close resemblance to that portrayed in Fig.3, i.e. upstream of the influence of the Agulhas
Current. It is, however, noteworthy that the Subtropi-cal Convergence is more distinct here, in the centralIndian Ocean, than in the far eastern South Atlantic.

( )J.R.E. Lutjeharms, I.J. AnsorgerJournal of Marine Systems 30 2001 115–138124
Ž .Fig. 7. a The geographic location of a SUZIL cruise line and the triangular stations along this line between which possible remnants of theŽ . Ž .Agulhas Return Current were located diamonds ; b the vertical temperature section to 1500-m depth along this line showing the location
Ž .of a doubtful Agulhas Front and the Subtropical Convergence; and c the vertical salinity section for the same line.
The salinity of surface water in the South IndianOcean Current, along the Subtropical Convergencein Fig. 7c, is lower than at about 200-m depth, or
further north. This suggests an overflow of lowsalinity, Subantarctic Surface Water from the southŽ .Park et al., 1993 .

( )J.R.E. Lutjeharms, I.J. AnsorgerJournal of Marine Systems 30 2001 115–138 125
Using the sections portrayed in Figs. 3–7 as wellas the results of all other sections for which thegeographic locations are given in Fig. 2 but that havenot been portrayed in the figures, the geographiclocation of the Agulhas Return Current emerges asgiven in Fig. 8. The first clear evidence for thepresence of the Agulhas Return Current has beenfound at about 168E. Between here and 308E, it liesin a broadish band. The width of this band may bedue to temporal variability elucidated by the densedata coverage south of Africa. An extensive merid-ional meander is due to the influence of the AgulhasPlateau at about 258E. East of here, the AgulhasReturn Current exhibits a tendency to lie increas-
Ž .ingly farther to the south Fig. 8 . Any time-depen-dent motion of the current cannot be resolved heredue to a lack of appropriate data. From about 668Ethe current becomes increasingly hard to distinguish.By 708E longitude, it may be considered to be nolonger present in any recognisable form. An inspec-tion of the detail of the hydrographic characteristicsof the water masses involved may shed some addi-tional light on the changing downstream character-istics of the Agulhas Return Current and the locationof its termination.
4. Hydrographic characteristics
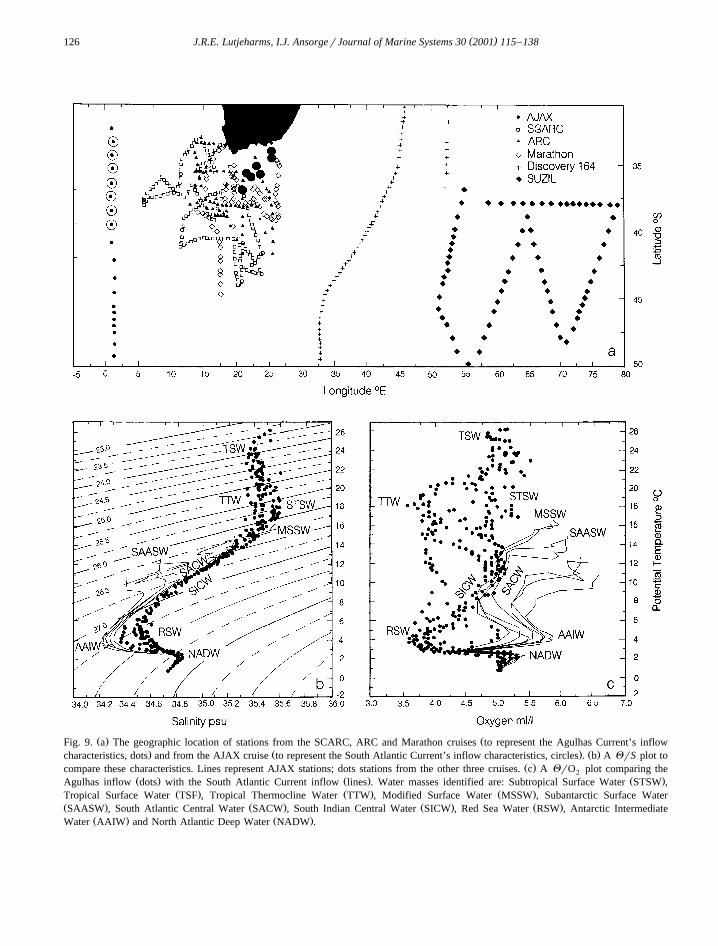
Two components of the hydrographic data setused for this investigation are potentially of consid-erable utility in establishing the nature of the inflowinto the Agulhas Retroflection region. The first con-sists of those stations that typify the inflow from theSouth Atlantic Current, and the second those thatcover the inflow from the Agulhas Current properŽ .Fig. 9 . These two water mass contributions arequite distinct and characteristic.
The salinity minimum typifying the Antarctic In-termediate Water is much sharper in the South At-
Žlantic since it is unaffected by Red Sea Water Shan-.non and Hunter, 1988 . Red Sea Water penetrates far
Ž .into the South Indian Ocean Grundlingh, 1985 , is¨Žcarried southwards by the Agulhas Current Gordon
.et al., 1987 and forms a not inconsiderable compo-nent of the intermediate water mass characteristic of
Žthe Agulhas retroflection region Valentine et al.,.1993 . The influence of Red Sea Water at intermedi-
ate depths in the Agulhas system is particularlyŽ .noticeable in the oxygen content Fig. 9c . Unadul-
terated Antarctic Intermediate Water in the SouthAtlantic presents as an oxygen maximum; in the
Fig. 8. The geographic location of the Agulhas Return Current based on all the full hydrographic sections as well as the XBT lines used forthis study.
( )J.R.E. Lutjeharms, I.J. AnsorgerJournal of Marine Systems 30 2001 115–138126
Ž . ŽFig. 9. a The geographic location of stations from the SCARC, ARC and Marathon cruises to represent the Agulhas Current’s inflow. Ž . Ž .characteristics, dots and from the AJAX cruise to represent the South Atlantic Current’s inflow characteristics, circles . b A QrS plot to
Ž .compare these characteristics. Lines represent AJAX stations; dots stations from the other three cruises. c A QrO plot comparing the2Ž . Ž . Ž .Agulhas inflow dots with the South Atlantic Current inflow lines . Water masses identified are: Subtropical Surface Water STSW ,
Ž . Ž . Ž .Tropical Surface Water TSF , Tropical Thermocline Water TTW , Modified Surface Water MSSW , Subantarctic Surface WaterŽ . Ž . Ž . Ž .SAASW , South Atlantic Central Water SACW , South Indian Central Water SICW , Red Sea Water RSW , Antarctic Intermediate
Ž . Ž .Water AAIW and North Atlantic Deep Water NADW .

( )J.R.E. Lutjeharms, I.J. AnsorgerJournal of Marine Systems 30 2001 115–138 127
South Indian, mixed with Red Sea Water, as anoxygen minimum. These distinct differences in theintermediate waters have a noticeable influence onthe central waters that extend upward to the surface
Ž .waters Fig. 9 .The stations along the 08 meridian extend into the
Subantarctic, therefore showing the low salinitycharacteristics of the Subantarctic Surface Water,whereas the selection of stations for the AgulhasCurrent do not reach so far south. The Central Watermasses of the South Indian and South Atlantic sub-tropical gyres show some distinctly different charac-
Ž .teristic Fig. 9b,c . South Atlantic Central Water isslightly less saline and considerably better oxy-
Žgenated than its South Indian counterpart Chapman.et al., 1987 . In the temperature range 8–13 8C, the
two central water masses are the closest akin. Thismay be due to an exchange of water masses between
Ž .the two basins at this level Gordon, 1981, 1985 .ŽThe surface waters in the Agulhas Current Fig.
.9 are dominated by South Indian Subtropical Sur-face Water, Tropical Surface Water and TropicalThermocline Water. The Tropical Surface Water de-rives from the South Equatorial Current at 108 to
Ž .158S Fig. 1 , where the excess of precipitation overevaporation and the inflow of fresher tropical water
Ž .from the Pacific Warren, 1981 make this watertype relatively fresh. It is thought to reach the Agul-
Žhas Current through the Mozambique Channel Har-.ris, 1972 and is found in the upper layers of the
Žcurrent, predominantly on the inshore side Gordon.et al., 1987 . This upper layer is only about 100 to
150 m thick. Directly below it lies the considerablymore saline Subtropical Surface Water.
This water forms a distinct salinity and oxygenŽ .maximum Fig. 9b and originates in the subtropical
Ž .gyre of the South Indian Ocean Wyrtki, 1971 ,where there is an excess of evaporation over precipi-tation. Water with a lower salinity value at the samedepths, Tropical Thermocline Water, is thought to beSubtropical Surface Water contaminated by Sub-antarctic Surface Water in the Agulhas retroflectionregion. On first reflection this seems unlikely, sinceSubantarctic Surface Water has an oxygen maximumŽ .Fig. 9c and Tropical Thermocline Water has anoxygen content lower than 3.5 mlrl. This oxygenminimum, at a depth of 200 m, is associated with anutrient maximum and is formed by the oxidation of
Ž .sinking detritus Warren, 1981 . Waters forming thisoxygen minimum are transported southward by theAgulhas Current into the retroflection zone where it
Žhas been used as a tracer for Agulhas water Chap-.man, 1988 .
These three water masses, Tropical Surface Wa-ter, Subtropical Surface Water and Tropical Thermo-cline Water, are characteristic of the inflow onlyfrom the Indian Ocean into the source region of theAgulhas Return Current and have no South Atlantic
Ž .counterparts Fig. 9 . Atlantic water from the sub-tropics with a somewhat comparable salinity, Modi-
Ž .fied Subtropical Surface Water Fig. 9b , is thoughtto come about due to increased evaporation in theSoutheastern Atlantic.
The inflowing water masses meet in the AgulhasŽretroflection Gordon et al., 1987; Gordon et al.,
.1992 where a melange of water mass characteristicsŽ .results Valentine et al., 1993 and are subjected to
further modifications by cooling and evaporation inthis region. The changes that are thus brought aboutare evident when the Agulhas Return Current out-flow from the Agulhas retroflection is compared to
Ž .the inflow discussed above Fig. 10 .The most obvious difference between the QrS
characteristics of the in- and outflow of the Agulhasretroflection is the total absence of Tropical SurfaceWater in the station data representing the AgulhasReturn Current. This has already been noted in thehydrographic sections displayed in Fig. 5 where thecharacteristics of the Agulhas and Agulhas ReturnCurrents may be directly compared. One may there-fore assume that by a process of lateral mixingandror atmospheric interaction this water type isremoved in the Agulhas retroflection region. Theheat loss to the atmosphere may penetrate as deep as
Ž .the Subtropical Surface Water Fig. 10 , but a degreeof freshening may also be due to mixing with fresherSouth Atlantic water masses in the retroflection re-
Ž .gion Fine et al., 1988 .Central water in the Agulhas Return Current may
have been similarly influenced, since it shows amuch reduced effect of those Tropical ThermoclineWater characteristics that normally are typical of
Ž .South-Indian Waters Fig. 10c . In three of the fourstations used to define the waters of the AgulhasReturn Current, the subsurface oxygen minimumusually associated with Tropical Thermocline Water

( )J.R.E. Lutjeharms, I.J. AnsorgerJournal of Marine Systems 30 2001 115–138128
Ž . ŽFig. 10. a The geographic location of stations from the SCARC, ARC and Marathon cruises representing the hydrographic characteristics. Žof the Agulhas Current inflow, dots and from the ARC and Marathon cruises circles, representing the hydrographic characteristics of the
. Ž .Agulhas Return Current outflow from the Agulhas retroflection . b A QrS plot to compare these characteristics. Dots are inflow values,Ž . Ž . Žcircles outflow stations. c A QrO plot comparing the Agulhas inflow dots with the Agulhas Return Current outflow circles, connected2
. Ž . Ž .by lines . Water masses identified are: Subtropical Surface Water STSW , Tropical Thermocline Water TTW , South Indian Central WaterŽ . Ž . Ž . Ž .SICW , Red Sea Water RSW , Antarctic Intermediate Water AAIW and North Atlantic Deep Water NADW .

( )J.R.E. Lutjeharms, I.J. AnsorgerJournal of Marine Systems 30 2001 115–138 129
Ž . ŽFig. 11. a The geographic location of stations from the ARC and Marathon cruises dots, representing the initial stages of the Agulhas. Ž . Ž .Return Current and of stations from the SUZIL cruise circles, representing the far downstream stages of the Agulhas Return Current . b
A QrS plot to compare the early and later characteristics of water of the Agulhas Return Current. Dots represent upstream stations, circlesŽ .connected by lines the downstream stations. c A QrO plot for the same stations. Water masses identified here are: Subtropical Surface2
Ž . Ž . Ž . Ž .Water STSW , Subantarctic Surface Water SAASW , Mode Water MW , South Indian Central Water SICW , Antarctic IntermediateŽ . Ž . Ž . Ž .Water AAIW , Indian Deep Water IDW , Upper Circumpolar Deep Water UCDW and Antarctic Bottom Water ABW .
( )J.R.E. Lutjeharms, I.J. AnsorgerJournal of Marine Systems 30 2001 115–138130
had been almost totally eroded. The effect of RedSea Water is also considerably reduced, the AgulhasReturn Current emerging from the Agulhas retroflec-tion with much clearer Antarctic Intermediate Watercharacteristics than those found in the Agulhas Cur-
Ž .rent proper Fig. 10b,c . Since the South AtlanticIntermediate Water has a more recent history of
Ž .ventilation Fine et al., 1988 , these waters should benoticeably purer than those in the South Indian, even
Ž .without any Red Sea Water influence Fig. 9 . Gor-Ž .don et al., 1992 have in fact estimated that 50% of
the thermocline water of the South Atlantic Currentflows into the South Indian Ocean, there, presum-ably, to join the alongfront flow.
The final disposition of the water masses thatcharacterise the Agulhas Return Current at its outsetcan be demonstrated by comparing it with stations
Ž .selected to lie in its assumed core vide Fig. 8Ž .between 508 and 808E longitude Fig. 11 . The
downstream changes over this zone are substantialŽ . ŽPark et al., 1993 . At the first section CTD 7, Fig..11 , the characteristics of Subtropical Surface Water
is indistinguishable from that in the Agulhas ReturnCurrent south of Africa. There is a steady eastwardreduction in the presence of this water, so that by the
Ž .last section CTD 54, Fig. 11 all evidence forSubtropical Surface Water has disappeared. Sincethis water has traversed the same distance at a
Ž .comparable latitude Fig. 8 before reaching theSUZIL station network, one may assume that thisdisappearance within the SUZIL network is largelydue to incorporation of the Agulhas Return Currentflow into the interior of the subtropical subgyre of
Žthe South West Indian Ocean Park et al., 1993;.Stramma and Lutjeharms, 1997 and not due to more
intense air–sea exchanges. The flow along the Sub-tropical Convergence is increasingly typified by Sub-
Ž .antarctic Surface Water vide Fig. 7 .Below the surface water, at a depth of 200 to 600
Ž .m at a s t surface of 26.5 Fig. 11b , there isconsiderable evidence for the presence of Mode Wa-ter. This water type is formed by deep winter con-vection in the area immediately north of the Antarc-
tic Circumpolar Current and is characterised by aŽpycnostad with a subsurface oxygen maximum Fig.
. Ž .11c . Park et al. 1993 have noted that the winteroverturning of Agulhas water with a subtropical
Ž .origin at CTD stations 7 and 27, Fig. 11b producesŽwarmer and more saline Mode Water McCartney,
.1977 than further downstream. Substantial differ-ences are also evident in the central, intermediateand deep waters.
Central waters show a freshening and higher oxy-genation downstream in the SUZIL station network.This may be due to mixing with purer Antarctic
Ž .Intermediate Water from below Fig. 11b . It hasŽ .been demonstrated Park and Gamberoni, 1997 that´
there are unprecedentedly strong, cross-frontal injec-tions of newly formed Antarctic Intermediate Waterin this region. It is possible that the northwardrecirculation of water from the Agulhas Return Cur-rent in the Crozet Basin, where the SUZIL stationswere located, may be a major carrier of this injectedAntarctic Intermediate Water into the subtropicalgyre of the South Indian Ocean. This would confirm
Ž .the suggestion made by Molinelli 1981 that thisregion is a prime source for Antarctic IntermediateWater in the Indian Ocean.
The distribution of the water characteristics of theAgulhas Return Current thus shows that it emergesfrom the Agulhas retroflection region with substan-tially modified water masses compared to the Agul-has Current. This is due to considerable admixture ofSouth Atlantic water at the retroflection and from theSouth Atlantic Current, as well as loss of surfacecharacteristics by intense air–sea exchange. Fromhere to the Crozet Basin the water characteristicsremain remarkably intact, but over the Crozet Basinthis changes dramatically so that between 668 and758E, all hydrographic evidence for the AgulhasReturn Current has been removed. Evidence for thepresence of Agulhas water does not de facto implythat the Agulhas Return Current is still a distinguish-able current entity. To establish this, the velocity andthe volume transport of the current have to be inves-tigated.
Ž .Fig. 12. a The geographic location of two hydrographic crossings of the flow along the Subtropical Convergence south of Africa, oneŽ .upstream of and one across the Agulhas Return Current; b the geostrophic velocities across these sections, referenced to 1500 db, with
Ž .eastward flow shown as positive; and, c the volume transport for the same sections.

( )J.R.E. Lutjeharms, I.J. AnsorgerJournal of Marine Systems 30 2001 115–138 131

( )J.R.E. Lutjeharms, I.J. AnsorgerJournal of Marine Systems 30 2001 115–138132
5. Velocities and volume transports
Geostrophic velocities and volume transports werecalculated in the manner described above using 1500db as a reference level. This level was selected tofacilitate the accommodation of as many hydro-graphic sections as possible. The central goal of thecurrent investigation is to establish the relativechanges to the downstream flow of the AgulhasReturn Current and not to determine absolute veloc-ity or transport values. To this end a choice of a1500-db reference level therefore seems adequate.Calculations were made for all CTD sections form-ing part of this data set and shown in Fig. 2. Onlythose corresponding to the sections shown in Figs.
Ž .3–7 are reproduced here Figs. 12 and 13 .Ž .The first section Fig. 12b is upstream of the
Ž .Agulhas retroflection at 08E cf. Fig. 3 and shows ageostrophic flow eastward with a weak maximum,not exceeding 12 cmrs, at 368 and 388S, the south-ern maximum corresponding to the location of theSouth Atlantic Current. The calculated geostrophicvelocity is comparable to those observed here with
Ž .drifters e.g. Daniault and Menard, 1985 . The maxi-´mum volume transport between any two stations wasabout 3=106 m3rs. The total transport calculatedfor the full Subtropical Convergence zone was 19=106 m3rs. This may be compared to the flow be-haviour south of Africa.
The geostrophic speed to 1500 db calculated forŽ .the Agulhas Current not shown here was 110 cmrs,
which compares favourably with drifter speeds ofŽ .90–119 cmrs Grundlingh, 1978 for this current as¨
well as ADCP observations of 100–130 cmrsŽ .Rouault et al., 1995 . The volume transport at thesame section was 49=106 m3rs that may be ex-trapolated coastwards to include a full 70=106 m3rs
Ž .for the Agulhas Current Gordon et al., 1987 . Thismay be compared to the section across the AgulhasReturn Current at 218E undertaken during the same
Ž .cruise Fig. 12 .A maximum geostrophic speed of 75 cmrs was
calculated, corresponding to the main peak at about
40830XS in Fig. 12b. This constitutes a substantialreduction in speed from the Agulhas Current itself.The volume transport over the full width of theeastward flow that is part of the Agulhas ReturnCurrent was 54=106 m3rs, i.e. at least 16=106
m3rs less than the Agulhas Current itself. As maybe expected for a region exhibiting a large variabil-ity, other sections across the Agulhas Return Currentshow a range of speed and transport estimates, ofwhich the one presented here is roughly a middlevalue. On proceeding downstream, the speeds andtransports decrease.
Ž .At 408E Fig. 13, cf. Fig. 6, there were twodistinct eastward flows, the major one being theAgulhas Return Current with the minor, separate,flow along the Subtropical Convergence. The maxi-mum speed of the Agulhas Return Current was 72cmrs, which may be compared to drifter speeds of
Ž .between 73 and 84 cmrs Grundlingh, 1978 . The¨flow along the Subtropical Convergence was only 24cmrs, comparable to the average drifter speeds of 26
Ž .cmrs reported by Hoffman 1985 . Volume trans-ports were 42=106 and 13=106 m3rs, respec-tively. At the last section used for this study, thisreduction has gone even further.
Ž .At 768E Fig. 13 , the major flow is concentratedŽ .at the Subtropical Convergence cf. Fig. 7 with a
calculated surface speed of 53 cmrs relative to 1500db. A weak and minor front was found to the north
Ž .at about 428S Fig. 7 . Here, there is a maximumgeostrophic speed of only 13 cmrs and total east-ward transport of 15=106 m3rs. The transportalong the Subtropical Convergence, by contrast, was42=106 m3rs. The ineluctable decrease in bothspeed and volume flux of the Agulhas Return Cur-rent along its eastward course, is summarised andshown graphically in Fig. 14.
For this portrayal, all appropriate sections in thedata set have been employed, not only those pre-sented in Figs. 12 and 13. No attempt has been madehere to define the meridional extent of the AgulhasReturn Current and to integrate the full volume fluxalong each meridional section, since such a defini-
Ž . Ž .Fig. 13. a The geographic location of two hydrographic sections across the central and terminal regions of the Agulhas Return Current; bŽ .the geostrophic velocities across these sections, referenced to 1500 db, with eastward flow shown as positive; and, c the volume transport
across the same sections.

( )J.R.E. Lutjeharms, I.J. AnsorgerJournal of Marine Systems 30 2001 115–138 133

( )J.R.E. Lutjeharms, I.J. AnsorgerJournal of Marine Systems 30 2001 115–138134
Ž .Fig. 14. a The calculated geostrophic velocities at the sea surface referenced to 1500 db for all stations located within the Agulhas ReturnŽ . Ž 6 3 .Current for the six cruises indicated, from 18E to 768E longitude. b The calculated volume transport in Sv 10 m rs to the same
reference level for the same stations.
tion would be fraught with difficulties. Giving anabsolute value for the volume transport when stationspacing along the individual sections was not uni-form would present additional problems. We havetherefore elected to represent only the peak volumetransport between any two adjacent stations alongeach section. Wherever the Agulhas Return Currentwas crossed more than once during the same cruise,all peak values of volume transport are indicated. In
Ž .some cases e.g. the ARC , this leads to a range ofvalues, indicating the variability to be expected.Three important facts are immediately apparent fromthe results portrayed in Figs. 12 and 13.
First, the low speeds and volume transports alongthe Subtropical Convergence in the South East At-lantic Ocean are more or less replicated by the flowalong this front at 768E in the South Indian Ocean.Second, the enhancing influence of the Agulhas Re-

( )J.R.E. Lutjeharms, I.J. AnsorgerJournal of Marine Systems 30 2001 115–138 135
turn Current on this eastward flow is to be foundbetween 208E and about 708E only. Third, the varia-tions in geostrophic speeds and geostrophic volumetransports south of Africa are large. This may be dueto the known high variability in this region and dueto the fact that this is the only location where thedata availability allows numerous estimates to bemade. In so far as the present data set allows suchconclusions, it would seem that the eastward declinein volume transport is evenly spaced from 258 to768E.
6. Conclusions
Based on an eclectic, modern, hydrographic dataset assembled for an otherwise undersampled region,a number of new conclusions on the location, hydro-graphic characteristics, and flow patterns of the Ag-
ulhas Return Current along its full length may beŽ .made Fig. 15 .
The characteristics of the Agulhas Return Current,as it emerges from the Agulhas retroflection, areconsiderably changed from that of the Agulhas Cur-rent proper. Its velocity has decreased from about110 to 75 cmrs; the volume transport from 70=106
to at least 54=106 m3rs. The assumption on whichthese comparisons rest is that the vertical structure ofthe two currents are similar and that the selection ofthe 1500-m reference level is therefore appropriate
Žfor both currents. This may not be the case Y.-H..Park, personal communication . The assumption that
the vertical structure of the Agulhas Return Currentis less variant along its path may turn out to be moresecure.
The characteristics of the water in the AgulhasReturn Current also show distinct modifications fromthat in the Agulhas Current itself. All signs of IndianTropical Surface Water are removed in the retroflec-
Fig. 15. The volume transport of the Agulhas Return Current system in 106 m3rs along its full length, suggesting the locations of majorleakage from the current. These locations are inferred from the reduced volume transport values between adjacent sections.

( )J.R.E. Lutjeharms, I.J. AnsorgerJournal of Marine Systems 30 2001 115–138136
tion region, while a degree of freshening for centralwater masses shows the admixture of Atlantic watersat these depths. These modified waters of the Agul-has Return Current execute an equatorward meanderof variable extent over the Agulhas Plateau beforeproceeding eastward.
The general location of the trajectory of the Agul-has Return Current lies ever farther south on pro-ceeding eastward, starting at 39830XS south of Africa
X Žand ending at 44830 S. Note that the differencebetween the location of the Agulhas retroflection inFigs. 8 and 15 comes about from the incorporation of
.XBT data in Fig. 8, but not in Fig. 15. Leakagesoccur somewhere between sections shown in Fig. 15.Both velocity and volume transport steadily declinewhile the QrS characteristics stay remarkably un-changed. Over the Crozet Basin this decline removesthe last remnants of the Agulhas Return Current.Characteristic South Indian Subtropical Surface Wa-ter is not found east of 618E and a distinct velocitycore disappears between 668E and 708E, the speedand volume flux along the Subtropical Convergencedropping back to that found in the South East At-lantic Ocean.
Based on the characteristic hydrographic variablesof the water masses constituting the Agulhas ReturnCurrent, as well as the flow intensities, it is apparentthat this current has a clear, although variable, geo-graphical point of genesis as well as of termination.We therefore suggest that the flow parallel to theSubtropical Convergence in the South Indian Oceanbe called the Agulhas Return Current, from theAgulhas retroflection region to the Crozet Basin, andthat the name South Indian Ocean Current be usedfor this flow east of the Crozet Basin only.
It is remarkable that the extent and location of theAgulhas Return Current, typified in this way, corre-sponds almost exactly with one of the largest con-tiguous regions of high mesoscale variability in the
Žworld ocean Cheney et al., 1983; Wakker et al.,1990; Feron et al., 1992; Wunsch and Stammer,
.1995; Park and Gamberoni, 1995 . All these altime-´ter results show a tongue of very high mesoscaleturbulence starting at the Agulhas retroflection andextending eastward along the path of the AgulhasReturn Current, as described here, to terminate overthe Crozet Basin. The dimensions and geographicallocation of this band of high current variability is
seen in many other data sets as well, e.g. driftingŽ .buoys Daniault and Menard, 1985 and sea surface´
Žtemperatures Lutjeharms and van Ballegooyen,.1984 . It is therefore a notably persistent characteris-
tic of global ocean circulation. Since it is so wellcorrelated with the course of the Agulhas ReturnCurrent, it is most probably due to enhanced levelsof meandering and eddy shedding along the Subtrop-ical Convergence, where the Agulhas Return Cur-rent’s presence causes increased horizontal shear andinstability. This needs further investigation.
ŽIt has been inferred by some Park et al., 1993;.Stramma and Lutjeharms, 1997 that substantial parts
of the Agulhas Return Current peel off equatorwardŽ .viz Fig. 15 specifically over ridge systems that arecrossed along its eastward path. The meagre hydro-graphic data cover leaves this an open question.Drifter tracks give no unequivocal answer either.Furthermore, the lack of data in the region precludesa definitive answer about the representativeness ofthe results we have put forward here. The highvariability along the course of the Agulhas ReturnCurrent, shown by satellite altimetry and other datasets, suggests a high level of variation in all flowparameters of this current along its full length.
Acknowledgements
We thank Mr R.C. van Ballegooyen for advice.We would also like to thank the following: Dr S. L.Bennett for the Marathon dataset, Dr A.L. Gordonfor the ARC data, Dr Y.-H. Park for the SUZIL datareport, Dr R.T. Pollard for the Discovery 164 cruisedata report and Dr T. Whitworth for the AJAX data.The financial support of the South African Founda-tion for Research Development and the Departmentof Environmental Affairs and Tourism, through itsAntarctic Programme, is gratefully acknowledged.The first author thanks the Nederlandsche Or-ganisatie voor Wetenschappelijk Onderzoek for avisitor’s bursary to complete this work at the Rijk-suniversiteit Utrecht in the Netherlands. We are par-ticularly beholden to an anonymous referee whowent to extraordinary lengths to suggest improve-ments to the paper that have considerably increasedits correctness.

( )J.R.E. Lutjeharms, I.J. AnsorgerJournal of Marine Systems 30 2001 115–138 137
References
Belkin, I.M., Gordon, A.L., 1996. Southern Ocean fronts from theGreenwich meridian to Tasmania. J. Geophys. Res. 101,3675–3696.
Bennett, S.L., 1988. Where three oceans meet: the AgulhasRetroflection region. PhD dissertation, Woods Hole Oceano-graphic Institute, 367 pp.
Camp, D.B., Haines, W.E., Huber, W.F., Rennie, S.E., Gordon,Ž .A.L., 1986. Agulhas Retroflection Cruise, Hydrographic CTD
data, Final technical report, Lamont-Doherty Geological Ob-servatory of Columbia University, Palisades, New York,LDGO-86-1.
Chapman, P., 1988. On the occurrence of oxygen-depleted watersouth of Africa and its implications for Agulhas-Atlanticmixing. S. Afr. J. Mar. Sci. 7, 767–794.
Chapman, P., Duncombe Rae, C.M., Allanson, B.R., 1987. Nutri-ents, chlorophyll and oxygen relationships in the surface layersat the Agulhas retroflection. Deep-Sea Res. 34, 1399–1416.
Cheney, R.E., Marsh, J.G., Beckley, B.D., 1983. Global mesoscalevariability from colinear tracks of SEASAT altimeter data. J.Geophys. Res. 88, 4343–4354.
Daniault, N., Menard, Y., 1985. Eddy kinetic energy distribution´in the Southern Ocean from altimetry and FGGE driftingbuoys. J. Geophys. Res. 90, 11877–11889.
Darbyshire, J., 1972. The effect of bottom topography on theAgulhas Current. Pure Appl. Geophys. 101, 208–220.
Feron, R.C.V., de Ruijter, W.P.M., Oskam, D., 1992. Ring shed-ding process in the Agulhas Current system. J. Geophys. Res.97, 9467–9477.
Fine, R.A., Warner, M.J., Weiss, R.F., 1988. Water mass modifi-cation at the Agulhas retroflection: chlorofluoromethane stud-ies. Deep-Sea Res. 35, 311–332.
Gordon, A.L., 1981. South Atlantic thermocline ventilation. Deep-Sea Res. 28, 1239–1264.
Gordon, A.L., 1985. Indian–Atlantic transfer of thermocline waterat the Agulhas retroflection. Science 227, 1030–1033.
Gordon, A.L., Lutjeharms, J.R.E., Grundlingh, M.L., 1987. Strati-¨fication and circulation at the Agulhas retroflection. Deep-SeaRes. 34, 565–599.
Gordon, A.L., Weiss, R.F., Smethie, W.M., Warner, M.J., 1992.Thermocline and intermediate water communication betweenthe South Atlantic and Indian Ocean. J. Geophys. Res. 97,7223–7240.
Grundlingh, M.L., 1978. Drift of a satellite-tracked buoy in the¨Southern Agulhas Current and Agulhas Return Current. Deep-Sea Res. 25, 1209–1224.
Grundlingh, M.L., 1983. On the course of the Agulhas Current. S.¨Afr. Geogr. J. 65, 49–57.
Grundlingh, M.L., 1985. Occurrence of Red Sea water in the¨southwestern Indian Ocean. J. Phys. Oceanogr. 15, 207–212.
Harris, T.F.W., 1970. Planetary type waves in the South WestIndian Ocean. Nature 227, 1043–1044.
Harris, T.F.W., 1972. Sources of the Agulhas Current in thespring of 1964. Deep-Sea Res. 19, 633–650.
Harris, T.F.W., Bang, N.D., 1974. Topographic Rossby waves inthe Agulhas Current. S. Afr. J. Sci. 70, 212–214.
Hoffman, E.E., 1985. The large-scale horizontal structure of the
Antarctic Circumpolar Current from FGGE drifters. J. Geo-phys. Res. 7, 245–270.
Jacobs, S.S., Georgi, D.T., 1977. Observations on the southwestŽ .IndianrAntarctic Ocean. In: Angel, M. Ed. , A Voyage of
Discovery. George Deacon 70th Anniversary Volume, Perga-mon, Oxford, pp. 43–84, supplement to Deep-Sea Res.
Le Groupe CITHER-3, 1996. Campagne CITHER-3; NrOŽ .L’ATALANTE 11 janvier–2 avril 1995 . Recueil de donnees.´
Volume 2: CTD-0 . Laboratoire de Physique des Oceans,´2
CNRSrIFREMERrUniversite de Bretagne Occidentale, Rap-´Ž .port Interne LPO 96-05 , 47 pp.qtables.
Lutjeharms, J.R.E., 1985. Location of frontal systems betweenAfrica and Antarctica; some preliminary results. Deep-SeaRes. 32, 1499–1509.
Lutjeharms, J.R.E., 1988. Examples of extreme circulation eventsat the Agulhas retroflection. S. Afr. J. Sci. 84, 584–586.
Lutjeharms, J.R.E., 1990. Temperatuurstruktuur van die oseaanbo-laag tussen Kaapstad en Marion-eiland. S. Afr. J. Antarct. Res.20, 21–32.
Lutjeharms, J.R.E., Cooper, J., 1996. Interbasin leakage throughAgulhas filaments. Deep-Sea Res. 43, 213–238.
Lutjeharms, J.R.E., Gordon, A.L., 1987. Shedding of an Agulhasring observed at sea. Nature 325, 138–140.
Lutjeharms, J.R.E., Matthysen, C.P., in preparation. Thermal de-tail of the Southern Ocean fronts south of Africa. J. Mar Sys.
Lutjeharms, J.R.E., Valentine, H.R., 1984. Southern Ocean ther-mal fronts south of Africa. Deep-Sea Res. 31, 1461–1475.
Lutjeharms, J.R.E., Valentine, H.R., 1988. Eddies at the Sub-Tropical Convergence south of Africa. J. Phys. Oceanogr. 18,761–774.
Lutjeharms, J.R.E., van Ballegooyen, R.C., 1984. Topographiccontrol in the Agulhas Current system. Deep-Sea Res. 31,1321–1337.
Lutjeharms, J.R.E., van Ballegooyen, R.C., 1988. The retroflec-tion of the Agulhas Current. J. Phys. Oceanogr. 18, 1570–1583.
Lutjeharms, J.R.E., de Ruijter, W.P.M., Peterson, R.G., 1992.Interbasin exchange and the Agulhas retroflection; the devel-opment of some oceanographic concepts. Deep-Sea Res. 39,1791–1807.
Lutjeharms, J.R.E., Valentine, H.R., van Ballegooyen, R.C., 1993.On the Subtropical Convergence in the South Atlantic Ocean.S. Afr. J. Sci. 89, 552–559.
McCartney, M.S., 1977. Subantarctic mode water. In: Angel, M.Ž .Ed. , A Voyage of Discovery. George Deacon 70th Anniver-sary Volume, Pergamon, Oxford, pp. 103–119, supplement toDeep-Sea Res.
Mey, R.D., Walker, N.D., 1990. Surface heat fluxes and marineboundary layer modification in the Agulhas retroflection re-gion. J. Geophys. Res. 95, 15997–16015.
Molinelli, E.J., 1981. The Antarctic influence on Antarctic Inter-mediate Water. J. Mar. Res. 39, 267–293.
Park, Y.-H., Gamberoni, L., 1995. Large-scale circulation and its´variability in the South Indian Ocean from TOPEXrPOSEI-DON altimetry. J. Geophys. Res. 100, 24911–24929.
Park, Y.-H., Gamberoni, L., 1997. Cross-frontal exchanges of´Antarctic Intermediate Water and Antarctic Bottom Water inthe Crozet Basin. Deep-Sea Res. 44, 963–986.
Park, Y.-H., Gamberoni, L., Charriaud, E., 1991. Frontal structure´

( )J.R.E. Lutjeharms, I.J. AnsorgerJournal of Marine Systems 30 2001 115–138138
and transport of the Antarctic Circumpolar Current in thesouth Indian Ocean sector, 40–808E. Mar. Chem. 35, 45–62.
Park, Y.-H., Gamberoni, L., Charriaud, E., 1993. Frontal struc-´ture, water masses and circulation in the Crozet Basin. J.Geophys. Res. 98, 12361–12385.
Pollard, R.T., Read, J.F., Smithers, J., 1987. CTD sections acrossthe southwest Indian Ocean and Antarctic Circumpolar Cur-rent in southern summer 1986r7. Institute of OceanographicSciences, Deacon Laboratory, Report Number 23, 161 pp.
Read, J.F., Pollard, R.T., 1993. Structure and transport of theAntarctic Circumpolar Current and Agulhas Return Current at408E. J. Geophys. Res. 98, 12281–12295.
Rouault, M., Lee-Thorp, A.M., Ansorge, I.J., Lutjeharms, J.R.E.,1995. The Agulhas Current air–sea interaction experimentŽ .ACASEX . S. Afr. J. Sci. 91, 493–496.
Shannon, L.V., Hunter, D., 1988. Notes on Antarctic intermediatewater around Southern Africa. S. Afr. J. Mar. Sci. 6, 107–117.
Stramma, L., 1992. The South Indian Ocean Current. J. Phys.Oceanogr. 22, 421–430.
Stramma, L., Lutjeharms, J.R.E., 1997. The flow field of thesubtropical gyre in the South Indian Ocean. J. Geophys. Res.102, 5513–5530.
Stramma, L., Peterson, R.G., 1990. The South Atlantic Current. J.Phys. Oceanogr. 20, 846–859.
Valentine, H.R., Duncombe Rae, C.M., van Ballegooyen, R.C.,Lutjeharms, J.R.E., 1988. The Subtropical Convergence and
Ž .Agulhas retroflection cruise SCARC data report. CSIR Re-port TrSEA 8804, 258 pp.
Valentine, H.R., Lutjeharms, J.R.E., Brundrit, G.B., 1993. Thewater masses and volumetry of the southern Agulhas Currentregion. Deep-Sea Res. 40, 1285–1305.
Van Ballegooyen, R.C., Grundlingh, M.L., Lutjeharms, J.R.E.,¨1994. Eddy fluxes of heat and salt from the southwest IndianOcean into the southeast Atlantic Ocean: a case study. J.Geophys. Res. 99, 14053–14070.
Veronis, G., 1973. Model of world circulation, 1, wind driven,two layer. J. Mar. Res. 31, 228–288.
Wakker, K.F., Zandbergen, R.C.A., Naeije, M.C., Ambrosius,B.A.C., 1990. Geosat altimeter data analysis for the oceansaround South Africa. J. Geophys. Res. 95, 2991–3006.
Warren, B.A., 1981. Deep circulation of the world ocean. In:Ž .Warren, B.A., Wunsch, C. Eds. , Evolution of Physical
Oceanography; Scientific Surveys in Honour of Henry Stom-mel. MIT Press, Cambridge, MA, pp. 6–41.
Whitworth, T., Nowlin, W.D., 1987. Water masses and currents ofthe Southern Ocean at the Greenwich Meridian. J. Geophys.Res. 92, 6462–6476.
Wunsch, C., Stammer, D., 1995. The global frequency–wavenum-ber spectrum of oceanic variability estimated fromTOPEXrPOSEIDON altimetric measurements. J. Geophys.Res. 100, 24895–24910.
Wyrtki, K., 1971. Oceanographic Atlas of the International IndianOcean Expedition. National Science Foundation, Washington,D.C, 531 pp.