the “b” book guide to single plane balancingbalmacinc.com/downloads/bbooksingle.pdfthe “b”...
TRANSCRIPT

THE “B” BOOK GUIDE TO SINGLE PLANE BALANCING
HOW TO SINGLE-PLANE BALANCE WITH A MODEL 216-D VIBRATION
ANALYZER/BALANCER
Page 2 MODEL 216-D
How to Dynamically Single PlaneBalance a Fan using the 216-D
NOTE: ROTATING MACHINERY has potentially dangerousmoving parts and should be guarded in accordance withapplicable OSHA and Safety Regulations. Balmac drawingsand photographs in this material show guards removed forillustration purposes.
WARNING: ROTATING MACHINERY HAS POTENTIALLYDANGEROUS MOVING PARTS AND SHOULD BE GUARDED INACCORDANCE WITH APPLICABLE SAFETY REGULATIONS.Potential hazards to the operator or the surrounding area mayexist. The user should evaluate his rotors, the balancingspeeds, and the unbalance correction methods used toestimate the characteristics of the fragments and parts thatmight fly off the rotors or machine during balancing, andshould calculate a worst-case potential for each fragment andpart, and then select the best protection all personnel beforethe machinery is operated.
Connections
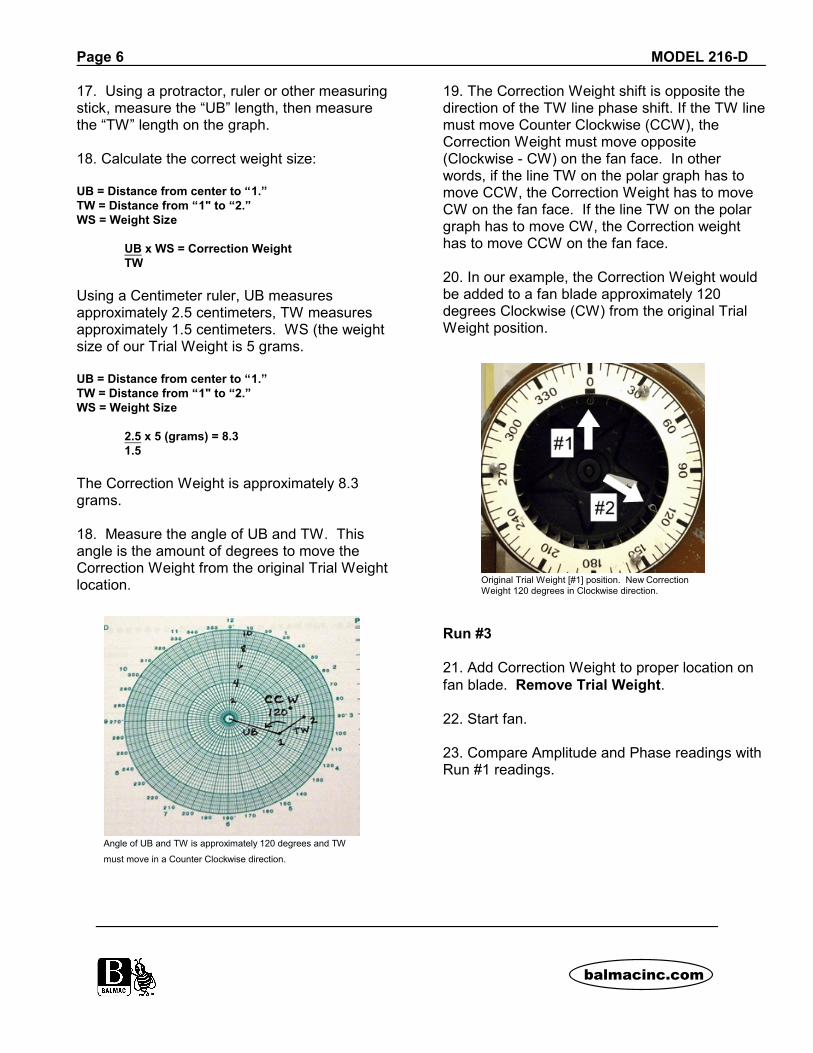
1. Thread the Model 055 Magnetic Base on tothe Model 158 Pickup and connect the PickupCable. Connect the Pickup Cable to Input #1 onthe side of the 216-D.
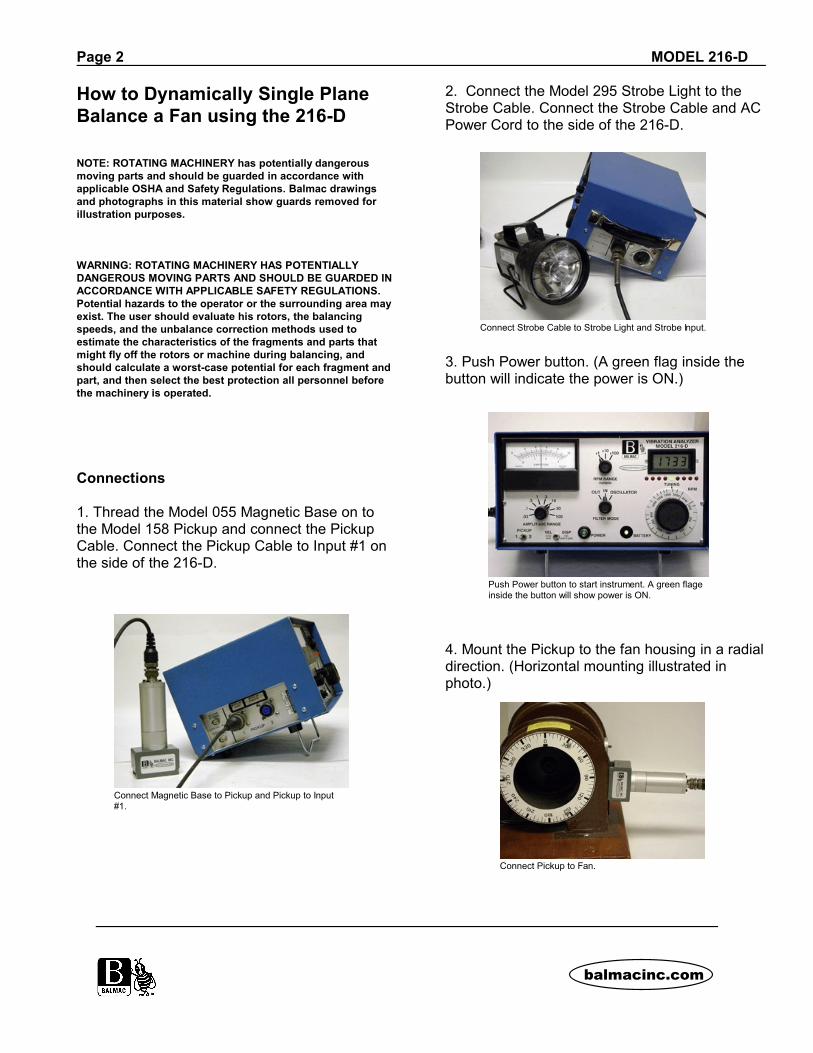
2. Connect the Model 295 Strobe Light to theStrobe Cable. Connect the Strobe Cable and ACPower Cord to the side of the 216-D.
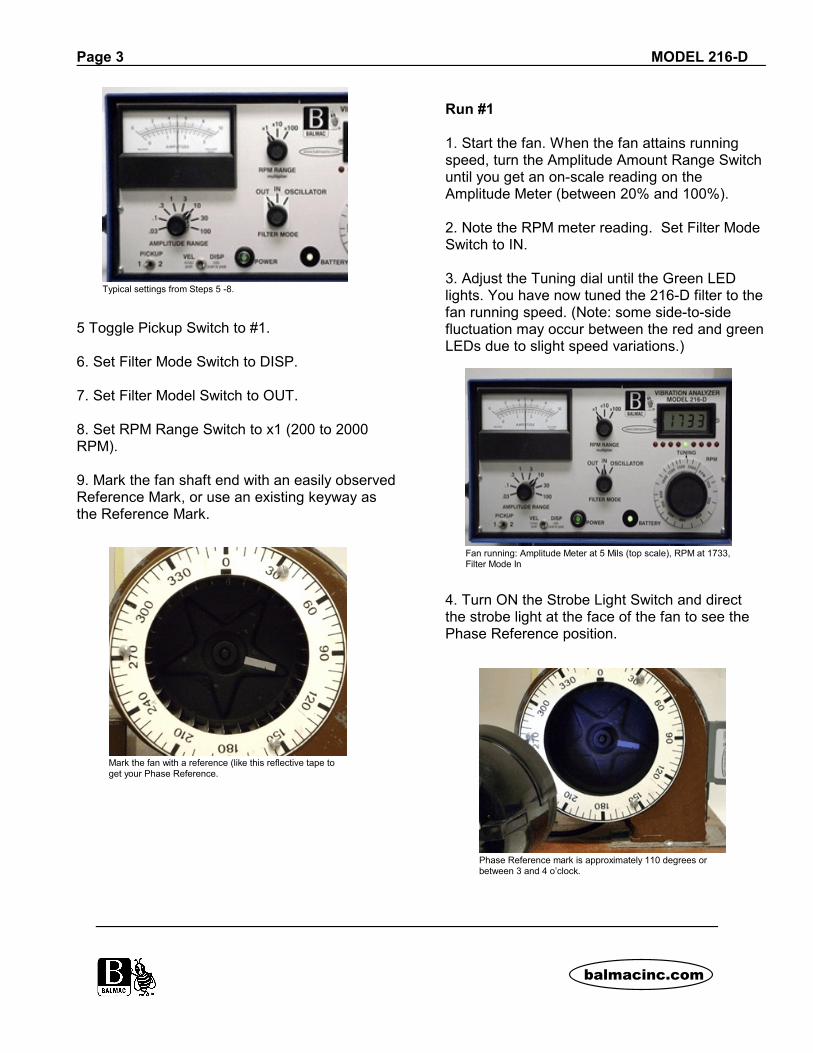
3. Push Power button. (A green flag inside thebutton will indicate the power is ON.)
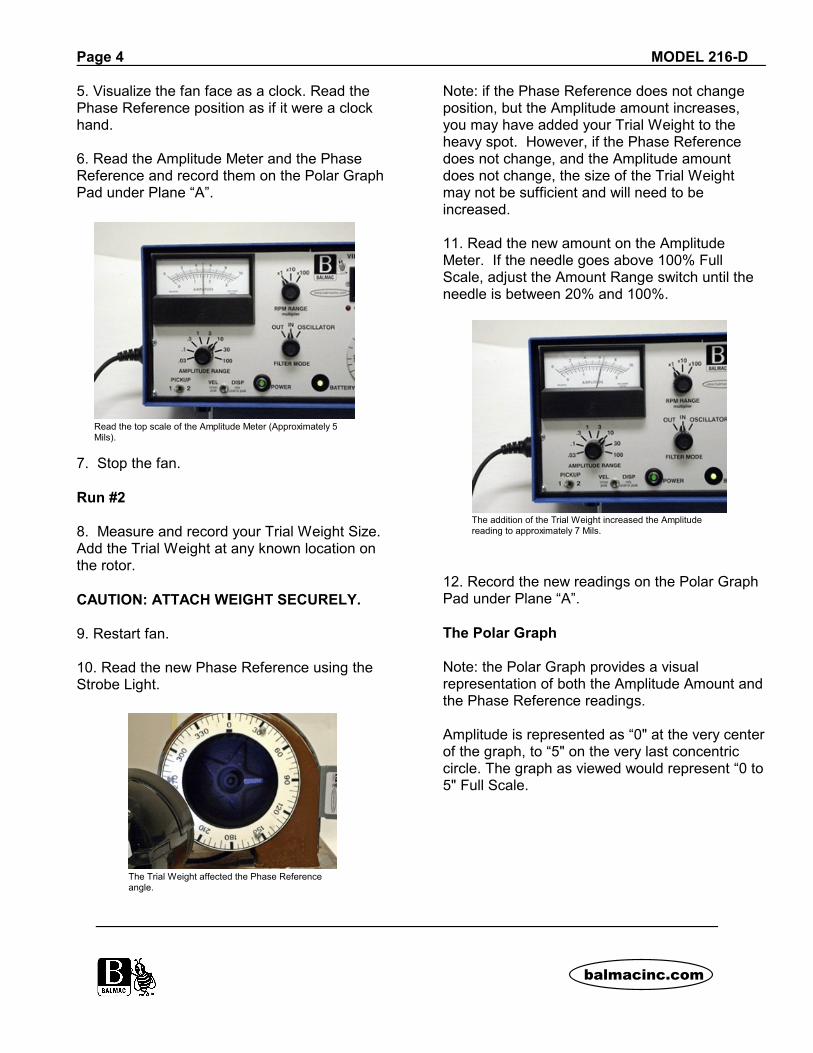
4. Mount the Pickup to the fan housing in a radialdirection. (Horizontal mounting illustrated inphoto.)
Connect Magnetic Base to Pickup and Pickup to Input#1.
Connect Strobe Cable to Strobe Light and Strobe Input.
Push Power button to start instrument. A green flageinside the button will show power is ON.
Connect Pickup to Fan.
Page 3 MODEL 216-D
5 Toggle Pickup Switch to #1.
6. Set Filter Mode Switch to DISP.
7. Set Filter Model Switch to OUT.
8. Set RPM Range Switch to x1 (200 to 2000RPM).
9. Mark the fan shaft end with an easily observedReference Mark, or use an existing keyway asthe Reference Mark.
Run #1
1. Start the fan. When the fan attains runningspeed, turn the Amplitude Amount Range Switchuntil you get an on-scale reading on theAmplitude Meter (between 20% and 100%).
2. Note the RPM meter reading. Set Filter ModeSwitch to IN.
3. Adjust the Tuning dial until the Green LEDlights. You have now tuned the 216-D filter to thefan running speed. (Note: some side-to-sidefluctuation may occur between the red and greenLEDs due to slight speed variations.)
4. Turn ON the Strobe Light Switch and directthe strobe light at the face of the fan to see thePhase Reference position.
Typical settings from Steps 5 -8.
Mark the fan with a reference (like this reflective tape toget your Phase Reference.
Fan running: Amplitude Meter at 5 Mils (top scale), RPM at 1733,Filter Mode In
Phase Reference mark is approximately 110 degrees orbetween 3 and 4 o’clock.
Page 4 MODEL 216-D
5. Visualize the fan face as a clock. Read thePhase Reference position as if it were a clockhand.
6. Read the Amplitude Meter and the PhaseReference and record them on the Polar GraphPad under Plane “A”.
7. Stop the fan.
Run #2
8. Measure and record your Trial Weight Size. Add the Trial Weight at any known location onthe rotor.
CAUTION: ATTACH WEIGHT SECURELY.
9. Restart fan.
10. Read the new Phase Reference using theStrobe Light.
Note: if the Phase Reference does not changeposition, but the Amplitude amount increases,you may have added your Trial Weight to theheavy spot. However, if the Phase Referencedoes not change, and the Amplitude amountdoes not change, the size of the Trial Weightmay not be sufficient and will need to beincreased.
11. Read the new amount on the AmplitudeMeter. If the needle goes above 100% FullScale, adjust the Amount Range switch until theneedle is between 20% and 100%.
12. Record the new readings on the Polar GraphPad under Plane “A”. The Polar Graph
Note: the Polar Graph provides a visualrepresentation of both the Amplitude Amount andthe Phase Reference readings.
Amplitude is represented as “0" at the very centerof the graph, to “5" on the very last concentriccircle. The graph as viewed would represent “0 to5" Full Scale.
Read the top scale of the Amplitude Meter (Approximately 5Mils).
The Trial Weight affected the Phase Referenceangle.
The addition of the Trial Weight increased the Amplitudereading to approximately 7 Mils.

Page 5 MODEL 216-D
If your highest readings are above “5" Full Scale,you can designate each concentric circle torepresent “2" and the entire graph wouldrepresent “0 to 10" Full Scale.
If your highest readings are above “10" FullScale, you can designate each concentric circleto represent “3" or “4" or “5" and the entire graphwould represent “0 to 15" or “0 to 20" or “0 to 25"Full Scale.
The radii on the graph each represent 10degrees as on a Compass Rose. The clocknumbers mentioned earlier are also printedaround the outside of the graph.
Plotting the Vectors
13. Plot/draw Run #1 Amplitude and Phaseposition on the circular graph and label it “1.”
14. Plot/draw Run #2 Amplitude and Phaseposition on the circular graph and label it “2.”
15. Draw a line from the graph center to number“1.” Label it “UB” for “Un Balance.”
16. Draw a line from “1" to “2.” Label it “TW” for“Trial Weight.”
An example of a Polar Graph chart with a Full Scale of 0 to10 and each concentric circle representing 2.
Each radii represents 10 degrees and numbers from 1 to 12represent numbers on a clock face.
Find 110 degrees on the Polar Graph and mark apoint at 5 and label it 1.
Find 90 degrees on the Polar Graph and mark apoint at 7 and label it 2.
Add Lines and Labels to graph.
Page 6 MODEL 216-D
17. Using a protractor, ruler or other measuringstick, measure the “UB” length, then measurethe “TW” length on the graph.
18. Calculate the correct weight size:
UB = Distance from center to “1.”TW = Distance from “1" to “2.”WS = Weight Size
UB x WS = Correction WeightTW
Using a Centimeter ruler, UB measuresapproximately 2.5 centimeters, TW measuresapproximately 1.5 centimeters. WS (the weightsize of our Trial Weight is 5 grams.
UB = Distance from center to “1.”TW = Distance from “1" to “2.”WS = Weight Size
2.5 x 5 (grams) = 8.3 1.5
The Correction Weight is approximately 8.3grams.
18. Measure the angle of UB and TW. Thisangle is the amount of degrees to move theCorrection Weight from the original Trial Weightlocation.
19. The Correction Weight shift is opposite thedirection of the TW line phase shift. If the TW linemust move Counter Clockwise (CCW), theCorrection Weight must move opposite(Clockwise - CW) on the fan face. In otherwords, if the line TW on the polar graph has tomove CCW, the Correction Weight has to moveCW on the fan face. If the line TW on the polargraph has to move CW, the Correction weighthas to move CCW on the fan face.
20. In our example, the Correction Weight wouldbe added to a fan blade approximately 120degrees Clockwise (CW) from the original TrialWeight position.
Run #3
21. Add Correction Weight to proper location onfan blade. Remove Trial Weight.
22. Start fan.
23. Compare Amplitude and Phase readings withRun #1 readings.
Angle of UB and TW is approximately 120 degrees and TW
must move in a Counter Clockwise direction.
Original Trial Weight [#1] position. New CorrectionWeight 120 degrees in Clockwise direction.

Page 7 MODEL 216-D
24. Record new Amplitude and Phase readings. Use the Balmac Vibration Severity Chart todetermine if the new Amplitude reading isacceptable.
25. Possible additional runs:
Move and/or adjust the size, location, or both ofthe correction weight.
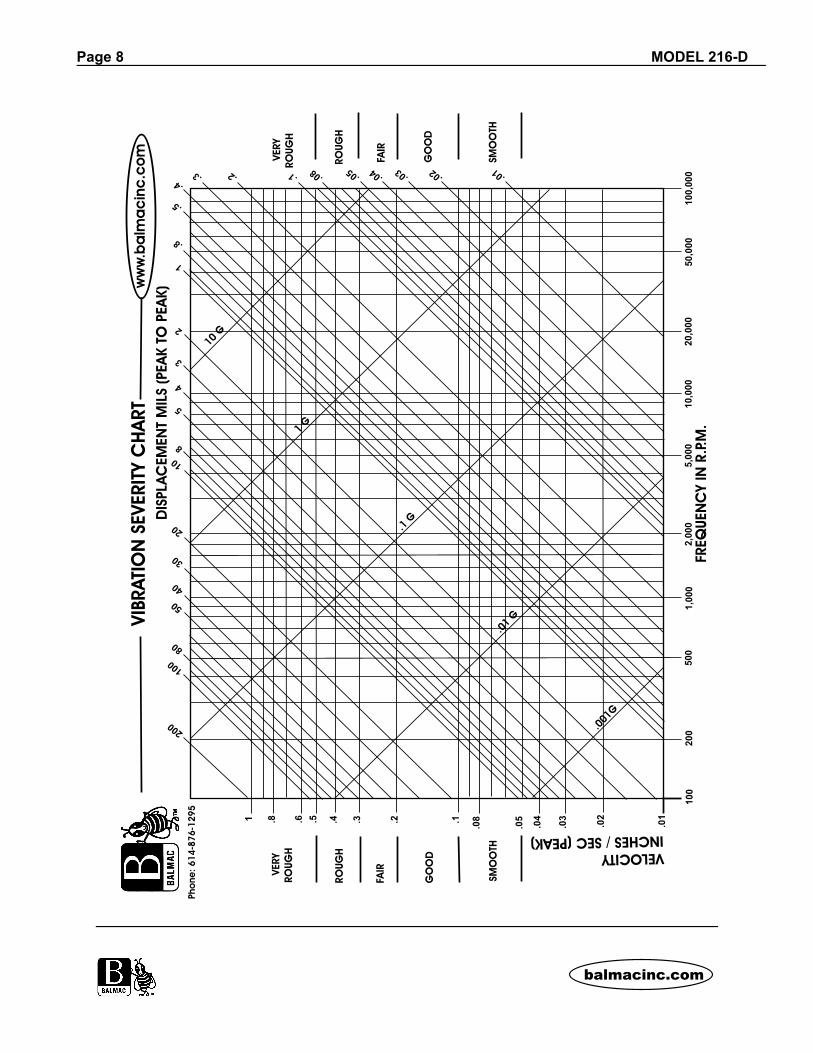
Section 9 - How To Use the VibrationSeverity Chart
The Model 216-D allows operators to readvibration amplitude in Velocity or inDisplacement. Operators can compare theirrecorded readings with numbers on the VibrationSeverity Chart to determine whether theirreadings fall in the Smooth, Good, Fair or Roughranges.
Velocity measurements are in Inches Per Second(ips) Peak. Velocity measurements begin at thebottom left corner of the chart with .01 and runvertically up the left side until they reach 2 (ips) atthe top. Velocity measurements are independentof speed (RPMs). A Velocity reading of 0.1 (ips)is SMOOTH at 100 RPMs or at 100,000 RPMs.
Example: to find a reading of .25 in Velocity, startat the bottom left side of the Severity Chart andread up vertically until you find .2. .25 is halfwaybetween .2 and .3 and is in the Fair zone.
Displacement measurements are in Mils (Peak-to-Peak). Displacement measurements begin atthe bottom right corner of the chart with .01 andrun vertically up the right side and horizontallyacross the top until they reach 200. Displacement measurements are dependent onspeed (RPMs). A measurement of 1 Mil at 2,000RPM is SMOOTH (follow the diagonal line from 1Mil down the page until it intersects with thevertical line at 2,000 RPM). However, ameasurement of 1 Mil at 5000 RPMs is only FAIRand a 1 Mil measurement at 10,000 RPMs isROUGH.
After adjusting Amplitude Range switch down to 1 Full Scale, thenew amplitude reading is .54 Mils - 10 times below the original 5 Milsat the start of the balancing procedure.
New Vector plot [3] on chart shows fan balanced to 10times below original 5 Mils at start of balancing procedure.
Page 8 MODEL 216-D

102013
For complete Warranty and ServiceInformation and Terms of Sale,
please see our website atwww.balmacinc.com