the australian guide to fixed income - fiig securities
TRANSCRIPT

© 2015 FIIG Securities Limited | ABN 68 085 661 632 | AFS Licence No. 22465
The Australian Guide to Fixed Income
Foreword by Ian Macfarlane ACFormer Governor of the Reserve Bank of Australia
1996 - 2006
Section 1 FNL.indd 1 1/04/2015 2:18 pm
Foreword
Volatility in financial markets over recent years has caused many investors to reappraise the level of risk in their investment portfolios and has led to heightened interest in prudent asset allocation and hence fixed income investments.
Direct investment in the fixed income asset class such as corporate bonds remains underdeveloped in Australia compared to other developed countries. Over recent years, governments, regulators, political and business leaders, economists, financial commentators and the media have all called for greater effort to be put into the development of the corporate bond market in Australia. This would provide greater opportunities for companies seeking additional means of raising capital as well as for investors seeking lower risk investments.
Investment in fixed income such as corporate bonds is designed mainly to conserve capital and provide income. Generally, fixed income investments exhibit both lower volatility and more certain returns than equities over long periods and, because returns from fixed income and other asset classes are not highly correlated, incorporating bonds into a balanced investment portfolio can reduce expected risk for a given rate of return.
Ian Macfarlane AC Former Governor of the Reserve Bank of Australia 1996 - 2006

Investors new to the fixed income asset class can sometimes feel inundated with new terms and calculations. In response to this, in 2009 FIIG published The Australian Guide to Fixed Income as a reference book to demystify fixed income investments and to provide information about how to access fixed income financial products. In this Second Edition, as well as updating the entire book, important additions have been included. PricewaterhouseCoopers has contributed a chapter on tax which most investors will find useful. Also there are new chapters on hybrids, inflation linked bonds, an introduction to credit analysis, and investment and trading strategies.
Education is a vital element for developing corporate bond investment and issuance in Australia. The Second Edition of The Australian Guide to Fixed Income is a welcome addition to the information available to investors, issuers, legal and accounting professionals, financial and wealth advisors, educators, students and anyone interested in understanding the fixed income asset class in Australia.
I recommend The Australian Guide to Fixed Income to people interested in expanding their financial literacy on this most important topic and commend FIIG for producing this excellent reference work.
Ian Macfarlane AC

© FIIG Securities Limited
© FIIG Securities Limited 2013. All rights reserved. No part of this publication may be reproduced, stored in a retrieval system, or transmitted in any form or by any means, electronic, mechanical, photocopying, recording, or otherwise, without written permission of the publisher.
Publisher This guide has been published by FIIG Securities Limited
ABN 68 085 661 632 AFSL 224659 ISBN 978-0-9922738-0-4
Editor Elizabeth Moran
Editor’s Assistant Daria Pakina
Sub Editors Douglas Bates Cameron Coleman
Foreword Ian Macfarlane AC
External Editors Melanie Clark Virginia Stirling
Contributors William Arnold Bianca Burt Mark Dodds James Finlay Emma Jenkin Jon Lechte Gavin Madson Elizabeth Marriott Justin McCarthy Dr Stephen Nash Tony Perkins Ryan Poth Henry Stewart Marita Sweeney
PwC Contributors Ernest Chang Rosalind Myint
The Australian G
uide to Fixed Incom
e
10 © FIIG Securities Limited
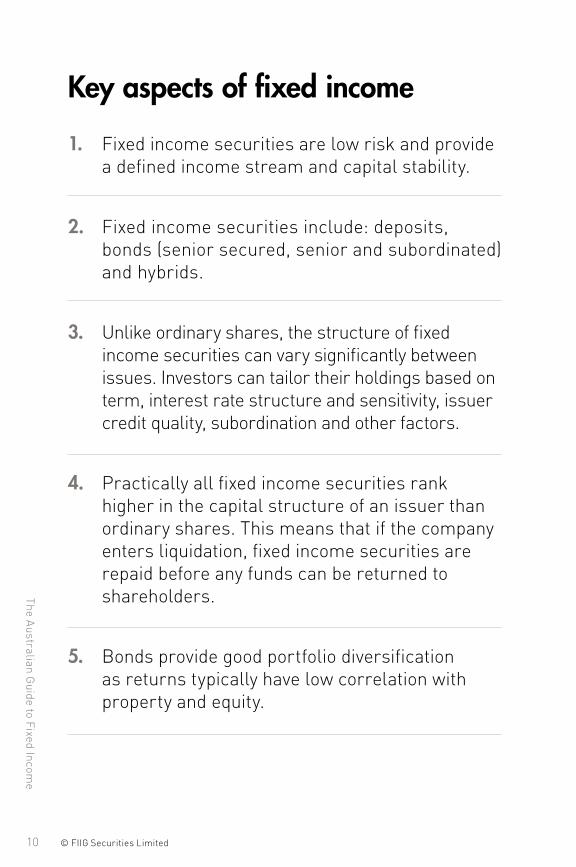
Key aspects of fixed income1. Fixed income securities are low risk and provide
a defined income stream and capital stability.
2. Fixed income securities include: deposits,bonds (senior secured, senior and subordinated)and hybrids.
3. Unlike ordinary shares, the structure of fixedincome securities can vary significantly betweenissues. Investors can tailor their holdings based onterm, interest rate structure and sensitivity, issuercredit quality, subordination and other factors.
4. Practically all fixed income securities rankhigher in the capital structure of an issuer thanordinary shares. This means that if the companyenters liquidation, fixed income securities arerepaid before any funds can be returned toshareholders.
5. Bonds provide good portfolio diversificationas returns typically have low correlation withproperty and equity.
1
© FIIG Securities Limited
Key aspects of fixed incom
e
11
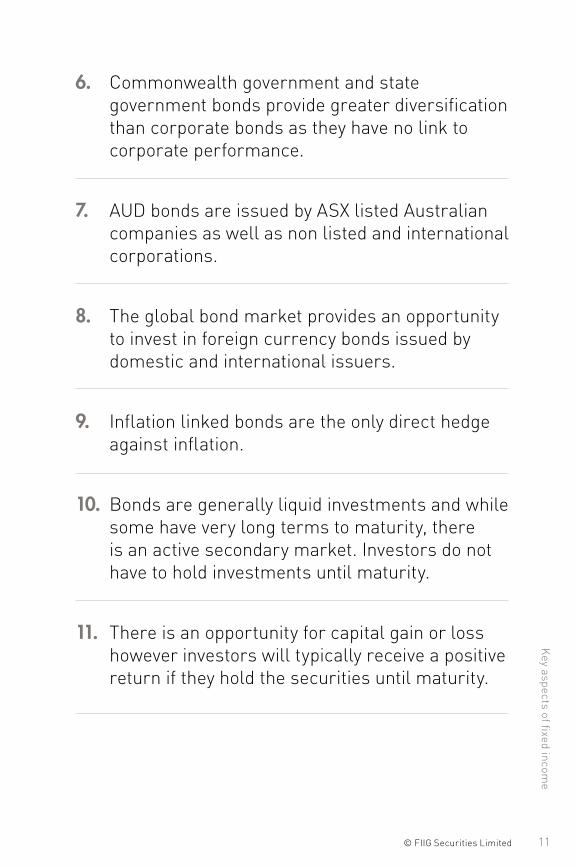
6. Commonwealth government and stategovernment bonds provide greater diversificationthan corporate bonds as they have no link tocorporate performance.
7. AUD bonds are issued by ASX listed Australiancompanies as well as non listed and internationalcorporations.
8. The global bond market provides an opportunityto invest in foreign currency bonds issued bydomestic and international issuers.
9. Inflation linked bonds are the only direct hedgeagainst inflation.
10. Bonds are generally liquid investments and whilesome have very long terms to maturity, thereis an active secondary market. Investors do nothave to hold investments until maturity.
11. There is an opportunity for capital gain or losshowever investors will typically receive a positivereturn if they hold the securities until maturity.
© FIIG Securities Limited12
The Australian G
uide to Fixed Incom
e
Fixed income – a definition
Fixed income refers to debt securities that pay a defined distribution (the interest) for a given period of time (the term) and repay the face value of the security at maturity. A fixed income security or bond is a loan from an investor to the issuer of the security. Issuers of fixed income securities in Australia include the Commonwealth Government, state governments, banks and corporations. The specific structure of a fixed income security can vary significantly depending on the issuer, term and maturity, coupon type and level of subordination.
Section 1.
The fundamentals
Chapter 1. Why fixed income?
Chapter 2. Features of fixed income - what you need to know
Chapter 3. Fixed income products
Chapter 4. Capital structure
Chapter 5. Risk versus reward continuum
Chapter 6. Asset allocation
Chapter 7. Building a fixed income portfolio
Chapter 8. Regulators of the Australian fixed income market
15© FIIG Securities Limited
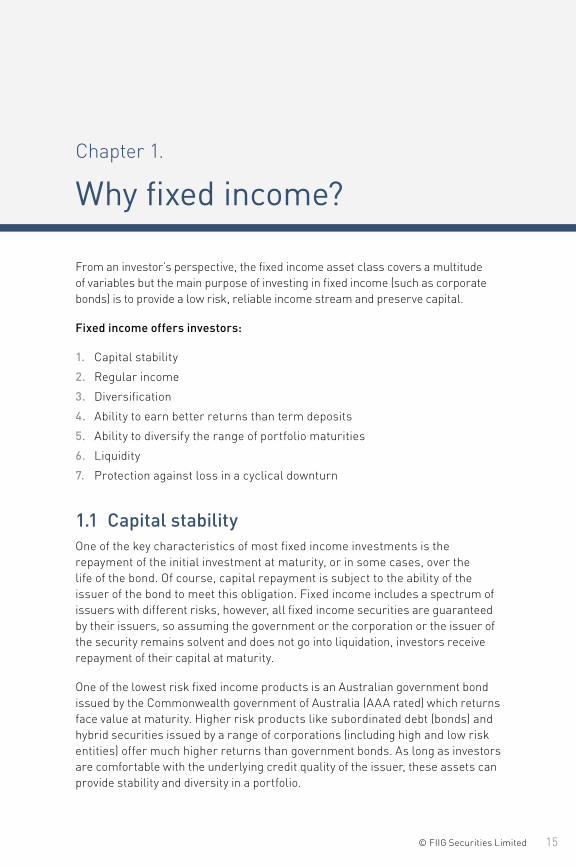
From an investor’s perspective, the fixed income asset class covers a multitude of variables but the main purpose of investing in fixed income (such as corporate bonds) is to provide a low risk, reliable income stream and preserve capital.
Fixed income offers investors:
1. Capital stability
2. Regular income
3. Diversification
4. Ability to earn better returns than term deposits
5. Ability to diversify the range of portfolio maturities
6. Liquidity
7. Protection against loss in a cyclical downturn
1.1 Capital stabilityOne of the key characteristics of most fixed income investments is the repayment of the initial investment at maturity, or in some cases, over the life of the bond. Of course, capital repayment is subject to the ability of the issuer of the bond to meet this obligation. Fixed income includes a spectrum of issuers with different risks, however, all fixed income securities are guaranteed by their issuers, so assuming the government or the corporation or the issuer of the security remains solvent and does not go into liquidation, investors receive repayment of their capital at maturity.
One of the lowest risk fixed income products is an Australian government bond issued by the Commonwealth government of Australia (AAA rated) which returns face value at maturity. Higher risk products like subordinated debt (bonds) and hybrid securities issued by a range of corporations (including high and low risk entities) offer much higher returns than government bonds. As long as investors are comfortable with the underlying credit quality of the issuer, these assets can provide stability and diversity in a portfolio.
Chapter 1.
Why fixed income?
The Australian G
uide to Fixed Incom
e
16
1
© FIIG Securities Limited
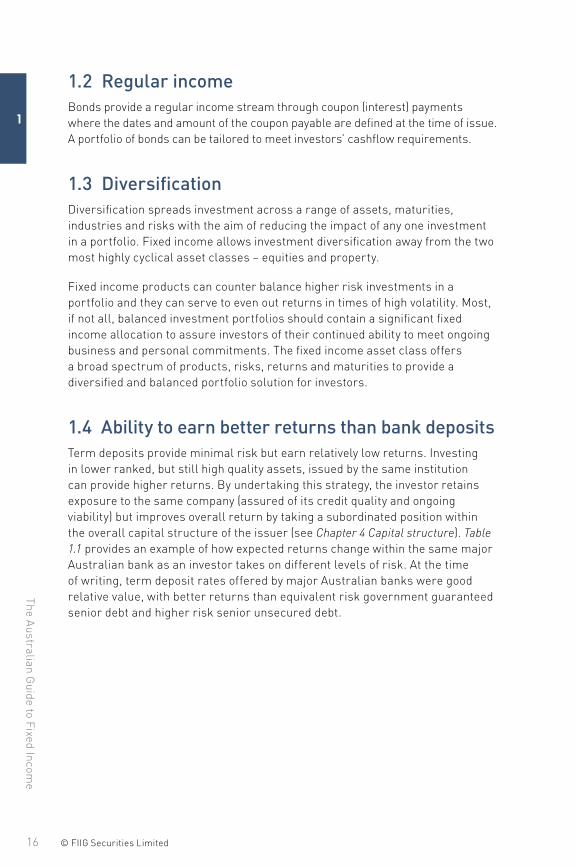
1.2 Regular incomeBonds provide a regular income stream through coupon (interest) payments where the dates and amount of the coupon payable are defined at the time of issue. A portfolio of bonds can be tailored to meet investors’ cashflow requirements.
1.3 DiversificationDiversification spreads investment across a range of assets, maturities, industries and risks with the aim of reducing the impact of any one investment in a portfolio. Fixed income allows investment diversification away from the two most highly cyclical asset classes – equities and property.
Fixed income products can counter balance higher risk investments in a portfolio and they can serve to even out returns in times of high volatility. Most, if not all, balanced investment portfolios should contain a significant fixed income allocation to assure investors of their continued ability to meet ongoing business and personal commitments. The fixed income asset class offers a broad spectrum of products, risks, returns and maturities to provide a diversified and balanced portfolio solution for investors.
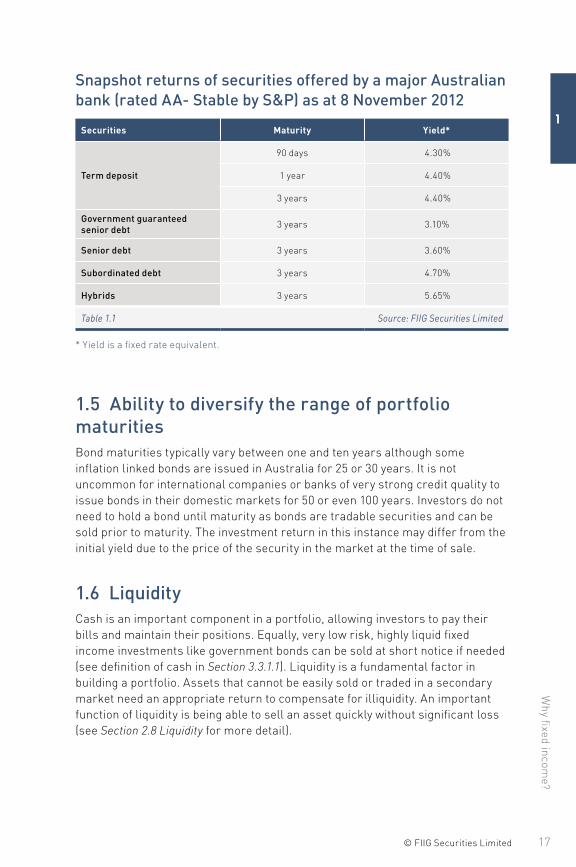
1.4 Ability to earn better returns than bank depositsTerm deposits provide minimal risk but earn relatively low returns. Investing in lower ranked, but still high quality assets, issued by the same institution can provide higher returns. By undertaking this strategy, the investor retains exposure to the same company (assured of its credit quality and ongoing viability) but improves overall return by taking a subordinated position within the overall capital structure of the issuer (see Chapter 4 Capital structure). Table 1.1 provides an example of how expected returns change within the same major Australian bank as an investor takes on different levels of risk. At the time of writing, term deposit rates offered by major Australian banks were good relative value, with better returns than equivalent risk government guaranteed senior debt and higher risk senior unsecured debt.
Why fixed incom
e?
17
1
© FIIG Securities Limited
Snapshot returns of securities offered by a major Australian bank (rated AA- Stable by S&P) as at 8 November 2012
Securities Maturity Yield*
Term deposit
90 days 4.30%
1 year 4.40%
3 years 4.40%
Government guaranteed senior debt 3 years 3.10%
Senior debt 3 years 3.60%
Subordinated debt 3 years 4.70%
Hybrids 3 years 5.65%
Table 1.1 Source: FIIG Securities Limited
* Yield is a fixed rate equivalent.
1.5 Ability to diversify the range of portfolio maturitiesBond maturities typically vary between one and ten years although some inflation linked bonds are issued in Australia for 25 or 30 years. It is not uncommon for international companies or banks of very strong credit quality to issue bonds in their domestic markets for 50 or even 100 years. Investors do not need to hold a bond until maturity as bonds are tradable securities and can be sold prior to maturity. The investment return in this instance may differ from the initial yield due to the price of the security in the market at the time of sale.
1.6 LiquidityCash is an important component in a portfolio, allowing investors to pay their bills and maintain their positions. Equally, very low risk, highly liquid fixed income investments like government bonds can be sold at short notice if needed (see definition of cash in Section 3.3.1.1). Liquidity is a fundamental factor in building a portfolio. Assets that cannot be easily sold or traded in a secondary market need an appropriate return to compensate for illiquidity. An important function of liquidity is being able to sell an asset quickly without significant loss (see Section 2.8 Liquidity for more detail).

The Australian G
uide to Fixed Incom
e
18
1
© FIIG Securities Limited
1.7 Protection against loss in a cyclical downturnGenerally, a fixed income allocation in your portfolio will act to protect it during a cyclical downturn. A greater allocation will provide greater protection. Setting your asset allocation and regularly rebalancing your portfolio, assuming a set fixed income allocation, should provide ongoing protection (see Section 6.3 Fixed income in a balanced portfolio and 6.4 Rebalancing a fixed income portfolio).

19© FIIG Securities Limited
2.1 Interest ratesAn interest rate is defined by The Economist’s Dictionary of Economics as:
“The price a borrower has to pay to enjoy the use of cash which he does not own, and the return a lender enjoys for parting with liquidity.”
Interest rates are important in pricing all market securities as they are used to assess the time value of money and the levels at which future cashflows are discounted. The present value of a security is the sum of the future stream of cashflows discounted at the appropriate interest rate or rates.
In relation to debt securities, a large range of factors such as the credit quality of the issuer, the maturity date of the debt, the coupon paid (income stream) and the currency in which it is issued in will influence an investment’s discount rate (see Chapter 20 Glossary, for basic descriptions of these factors).
Interest rates are also important to companies since most investment decisions are based on evaluations of alternative opportunities and the cost of capital.
2.1.1 Reserve Bank of Australia’s influence over market interest ratesInvestment decisions are not made in a vacuum. A decision to make an investment should represent a determination that a particular investment is a better use of capital than any alternative. Accordingly, an investment should be compared to the universe of alternative investments.
The interest rate that entices an investor to invest will also depend on the interest rates being offered on alternatives.
For this reason it is important to review how the Reserve Bank of Australia (RBA), through its implementation of monetary policy, can influence the absolute level of
Chapter 2.
Features of fixed income – what you need to know
The Australian G
uide to Fixed Incom
e
20 © FIIG Securities Limited
2
return required for certain investments (specifically, the rate banks charge each other to lend on an unsecured basis, overnight).
Because the required return on any investment is relative to the return on all other investments, this effectively sets a benchmark against which all other investment returns must be considered.
When people discuss interest rates, they’re generally referring to nominal interest rates. A nominal interest rate is one where there is no allowance for the effect of inflation. However changes in the nominal interest rate often move with changes in the inflation rate, as lenders not only have to be compensated for delaying their consumption (that is by saving and being willing to lend those funds), but they must also be compensated for the fact that a dollar will not buy as much a year from now as it will today.
The RBA is responsible for formulating and implementing monetary policy. The objectives of the RBA’s obligations in respect to monetary policy are set out in Section 10(2) of the Reserve Bank Act 1959 and are as follows:
“It is the duty of the Reserve Bank Board, within the limits of its powers, to ensure that the monetary and banking policy of the Bank is directed to the greatest advantage of the people of Australia and that the powers of the Bank ... are exercised in such a manner as, in the option of the Reserve Bank Board, will best contribute to the:
a) stability of the currency of Australia,b) maintenance of full employment in Australia andc) economic prosperity and welfare of the people of Australia.
Since 1993, these objectives have found practical expression in a target for consumer price inflation, of 2-3% per annum. Monetary policy aims to achieve this over the medium term and, subject to that, to encourage strong and sustainable growth in the economy. Controlling inflation preserves the value of money. In the long run, this is the principal way in which monetary policy can help to form a sound basis for long term growth in the economy.”
Source: www.rba.gov.au
The RBA’s primary medium term objective is to achieve an average rate of inflation of between 2–3% over the economic cycle. This is a rate that is sufficiently low enough not to materially distort economic decisions and acts as a nominal target that provides a degree of transparency and accountability for the bank. Whilst the target inflation rate has numerical simplicity, the RBA’s implementation of monetary policy is a discretionary framework as opposed to a mechanically strict regime. This allows for the inevitable uncertainties that are involved in forecasting, and lags in the effects of monetary policy on the economy, as well as flexibility to account for a range of other macroeconomic variables such as growth and employment.
21© FIIG Securities Limited
Features of fixed income – w
hat you need to know
2
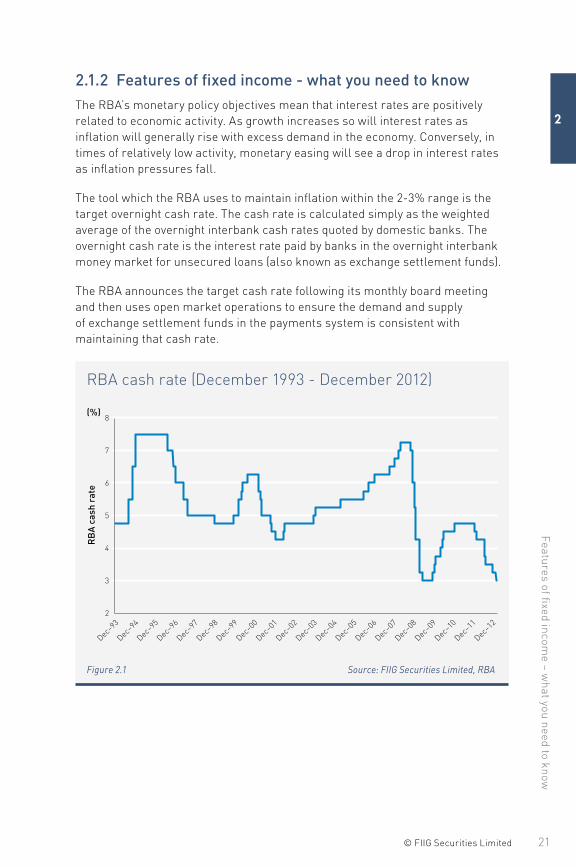
2.1.2 Features of fixed income - what you need to knowThe RBA’s monetary policy objectives mean that interest rates are positively related to economic activity. As growth increases so will interest rates as inflation will generally rise with excess demand in the economy. Conversely, in times of relatively low activity, monetary easing will see a drop in interest rates as inflation pressures fall.
The tool which the RBA uses to maintain inflation within the 2-3% range is the target overnight cash rate. The cash rate is calculated simply as the weighted average of the overnight interbank cash rates quoted by domestic banks. The overnight cash rate is the interest rate paid by banks in the overnight interbank money market for unsecured loans (also known as exchange settlement funds).
The RBA announces the target cash rate following its monthly board meeting and then uses open market operations to ensure the demand and supply of exchange settlement funds in the payments system is consistent with maintaining that cash rate.
RBA cash rate (December 1993 - December 2012)
RB
A c
ash
rate
Dec–9
3
Dec–9
4
Dec–9
5
Dec–9
6
Dec–9
7
Dec–9
8
Dec–9
9
Dec–0
0
Dec–0
1
Dec–0
2
Dec–0
3
Dec–0
4
Dec–0
5
Dec–0
6
Dec–0
7
Dec–0
8
Dec–0
9
Dec–1
0
Dec–1
1
Dec–1
2
(%)
2
3
4
5
6
7
8
Figure 2.1 Source: FIIG Securities Limited, RBA
The Australian G
uide to Fixed Incom
e
22 © FIIG Securities Limited
2
If the RBA wishes to raise the overnight cash rate it will simply sell bonds on the interbank market and reduce the supply of exchange settlement funds. By selling bonds the RBA will receive the cash proceeds of the bonds and those funds will leave the market to be held by the RBA. Conversely, if it aims to lower the rate it will buy bonds on the market, effectively raising the supply of exchange settlement funds on the interbank money market. The cash rate, which resulted from the Reserve Bank’s market operations, is shown in Figure 2.1.
There is typically little variation between the actual cash rate and the target rate reflecting the strength of the RBA’s communication of the target rate and its ability to manage short term rate pressures through market operations.
Figure 2.1 shows that current interest rates are at extremely low levels. This is a product of the RBA using monetary policy as a means of economic stimulus for the Australian economy. Lower interest rates are more likely to increase investment when inflationary risks are lowered by a general decline in aggregate demand.
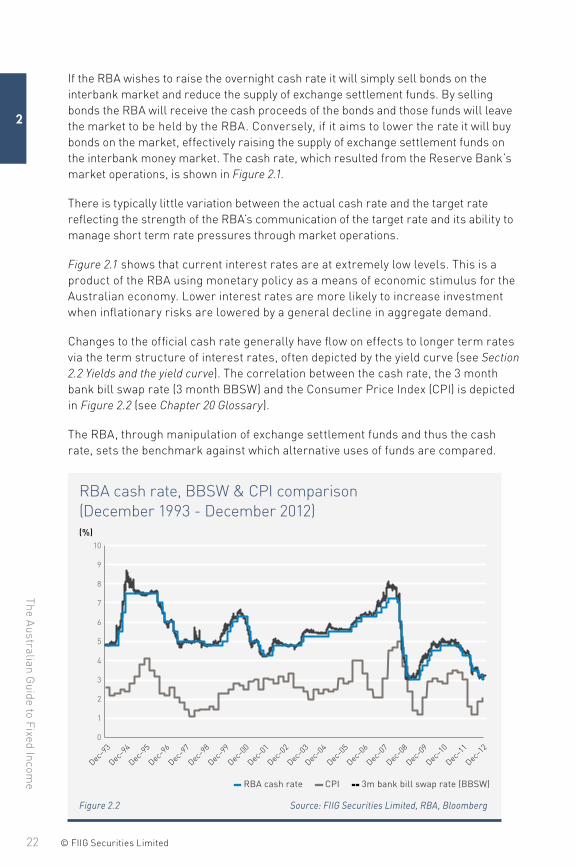
Changes to the official cash rate generally have flow on effects to longer term rates via the term structure of interest rates, often depicted by the yield curve (see Section 2.2 Yields and the yield curve). The correlation between the cash rate, the 3 month bank bill swap rate (3 month BBSW) and the Consumer Price Index (CPI) is depicted in Figure 2.2 (see Chapter 20 Glossary).
The RBA, through manipulation of exchange settlement funds and thus the cash rate, sets the benchmark against which alternative uses of funds are compared.
RBA cash rate, BBSW & CPI comparison (December 1993 - December 2012)
-- RBA cash rate -- CPI -- 3m bank bill swap rate (BBSW)
0
1
2
3
4
5
6
7
8
9
10
Dec–9
3
Dec–9
4
Dec–9
5
Dec–9
6
Dec–9
7
Dec–9
8
Dec–9
9
Dec–0
0
Dec–0
1
Dec–0
2
Dec–0
3
Dec–0
4
Dec–0
5
Dec–0
6
Dec–0
7
Dec–0
8
Dec–0
9
Dec–1
0
Dec–1
1
Dec–1
2
(%)
Figure 2.2 Source: FIIG Securities Limited, RBA, Bloomberg
23© FIIG Securities Limited
Features of fixed income – w
hat you need to know
2
2.2 Yields and the yield curve
2.2.1 YieldThe yield is the expected return on an investment. The yield or rate of return can be described in a number of ways.
2.2.1.1 The coupon
The coupon is the rate of interest paid on a fixed income investment or bond. The coupon does not change throughout the life of the security.
Coupon = ( annual dollar interest paid
face value) * 100
Coupon payments are made at regular intervals by the issuer to the investor, normally expressed as a percentage per annum. Coupons can be fixed or floating. This means they have either a set or fixed interest rate determined at the time of issue, or a variable interest rate anchored to some form of floating benchmark, normally the bank bill swap rate (BBSW). Coupons are normally paid on either a quarterly, semi annual or annual basis.
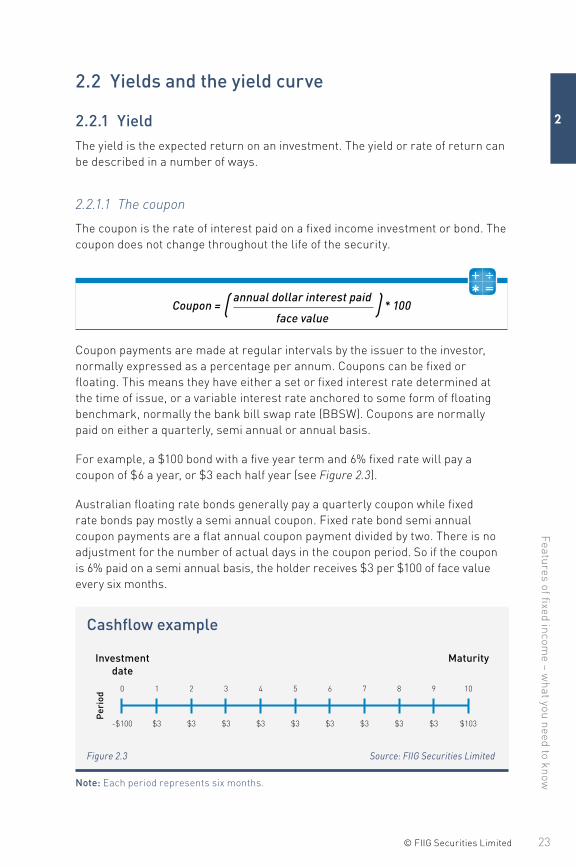
For example, a $100 bond with a five year term and 6% fixed rate will pay a coupon of $6 a year, or $3 each half year (see Figure 2.3).
Australian floating rate bonds generally pay a quarterly coupon while fixed rate bonds pay mostly a semi annual coupon. Fixed rate bond semi annual coupon payments are a flat annual coupon payment divided by two. There is no adjustment for the number of actual days in the coupon period. So if the coupon is 6% paid on a semi annual basis, the holder receives $3 per $100 of face value every six months.
Cashflow example
Investmentdate
Maturity
Per
iod
$103$3$3$3$3$3$3$3$3$3-$100
109876543210
Figure 2.3 Source: FIIG Securities Limited
Note: Each period represents six months.
The Australian G
uide to Fixed Incom
e
24 © FIIG Securities Limited
2
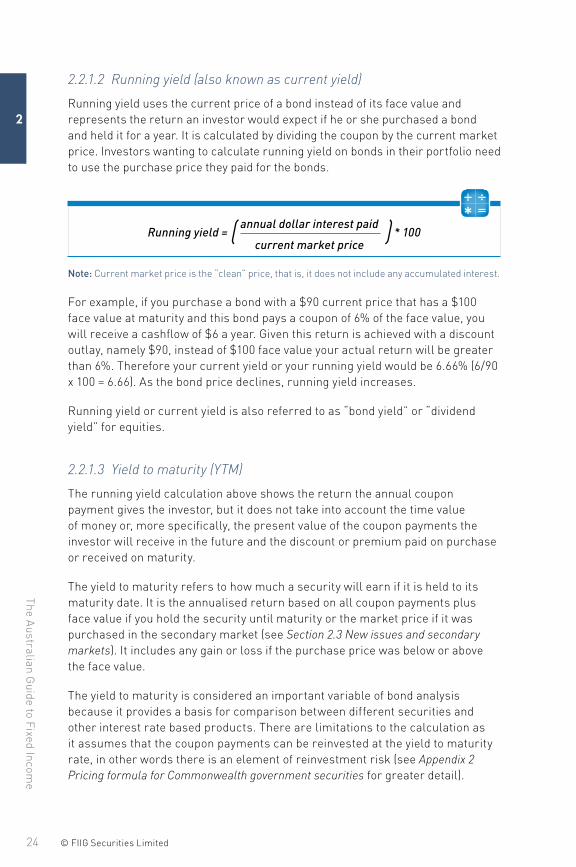
2.2.1.2 Running yield (also known as current yield)
Running yield uses the current price of a bond instead of its face value and represents the return an investor would expect if he or she purchased a bond and held it for a year. It is calculated by dividing the coupon by the current market price. Investors wanting to calculate running yield on bonds in their portfolio need to use the purchase price they paid for the bonds.
Running yield = ( annual dollar interest paid
current market price ) * 100
Note: Current market price is the “clean” price, that is, it does not include any accumulated interest.
For example, if you purchase a bond with a $90 current price that has a $100 face value at maturity and this bond pays a coupon of 6% of the face value, you will receive a cashflow of $6 a year. Given this return is achieved with a discount outlay, namely $90, instead of $100 face value your actual return will be greater than 6%. Therefore your current yield or your running yield would be 6.66% (6/90 x 100 = 6.66). As the bond price declines, running yield increases.
Running yield or current yield is also referred to as “bond yield” or “dividend yield” for equities.
2.2.1.3 Yield to maturity (YTM)
The running yield calculation above shows the return the annual coupon payment gives the investor, but it does not take into account the time value of money or, more specifically, the present value of the coupon payments the investor will receive in the future and the discount or premium paid on purchase or received on maturity.
The yield to maturity refers to how much a security will earn if it is held to its maturity date. It is the annualised return based on all coupon payments plus face value if you hold the security until maturity or the market price if it was purchased in the secondary market (see Section 2.3 New issues and secondary markets). It includes any gain or loss if the purchase price was below or above the face value.
The yield to maturity is considered an important variable of bond analysis because it provides a basis for comparison between different securities and other interest rate based products. There are limitations to the calculation as it assumes that the coupon payments can be reinvested at the yield to maturity rate, in other words there is an element of reinvestment risk (see Appendix 2 Pricing formula for Commonwealth government securities for greater detail).
25© FIIG Securities Limited
Features of fixed income – w
hat you need to know
2
2.2.2 The yield curveThe yield curve, also called the term structure of interest rates, shows the relationship between interest rates and term to maturity. Graphically, it plots interest rates on the y-axis with the term to maturity (in years) on the x-axis (as shown in Figures 2.4 & 2.5). When constructing a yield curve it is important to use interest rates for the same currency and credit quality as these other factors also effect interest rates at different maturities. The most frequently referenced yield curves are the Commonwealth bond curve which plots yields for risk free Commonwealth government bonds versus maturity and the swap curve which plots yield for current coupon interest rate swaps versus maturity (see Chapter 20 Glossary). Given there is not a continuous series of observable bonds or yields for a particular class of securities, the yield curve is constructed by taking market observable yields for discrete maturities and then interpolating between these maturities to create a smooth yield curve. The resulting continuous yield curve can then be used to value cashflows occurring at various future dates, a principal behind the valuation of fixed income securities.
The yield curve is the market’s current view of interest rates for various terms to maturity. However, the yield curve can also be used to determine the market’s current view of future interest rates. For example, by observing the current yields for one year and two year government bonds an investor can determine the market’s current view of the one year government bond rate in a years time. Importantly, this is not the actual one year government bond rate in a years time but the market’s current forecast of the one year government bond yield in a years time. As the current yield curve changes so too does the implied one year government bond yield in a years time. By extending this methodology for other maturities an investor can create a yield curve that shows the expected rates for various maturities in a years time. This is called the forward curve, or in this case, the one year forward curve. It shows the expected yields for various maturities in one years time, based on today’s current yield curve.
The Australian G
uide to Fixed Incom
e
26 © FIIG Securities Limited
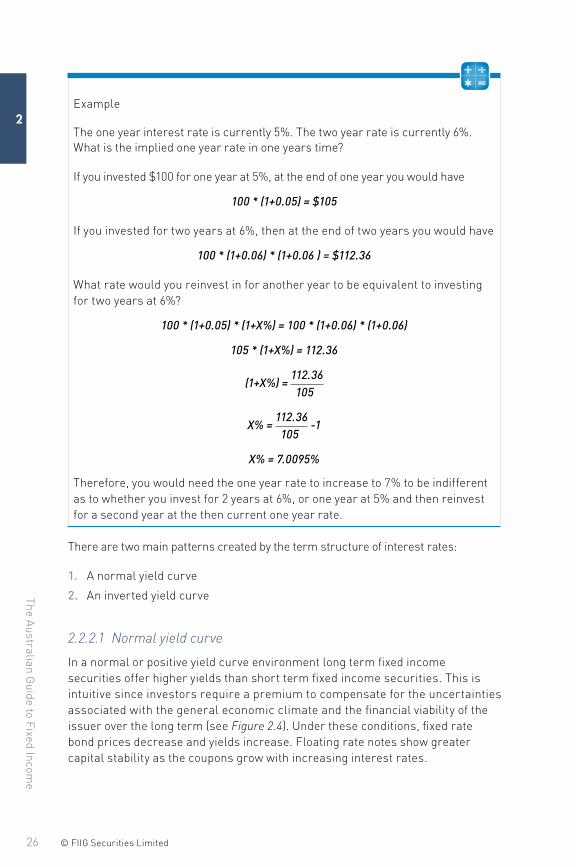
2Example
The one year interest rate is currently 5%. The two year rate is currently 6%. What is the implied one year rate in one years time?
If you invested $100 for one year at 5%, at the end of one year you would have
100 * (1+0.05) = $105
If you invested for two years at 6%, then at the end of two years you would have
100 * (1+0.06) * (1+0.06 ) = $112.36
What rate would you reinvest in for another year to be equivalent to investing for two years at 6%?
100 * (1+0.05) * (1+X%) = 100 * (1+0.06) * (1+0.06)
105 * (1+X%) = 112.36
(1+X%) = 112.36
105
X% = 112.36
-1
105
X% = 7.0095%
Therefore, you would need the one year rate to increase to 7% to be indifferent as to whether you invest for 2 years at 6%, or one year at 5% and then reinvest for a second year at the then current one year rate.
There are two main patterns created by the term structure of interest rates:
1. A normal yield curve
2. An inverted yield curve
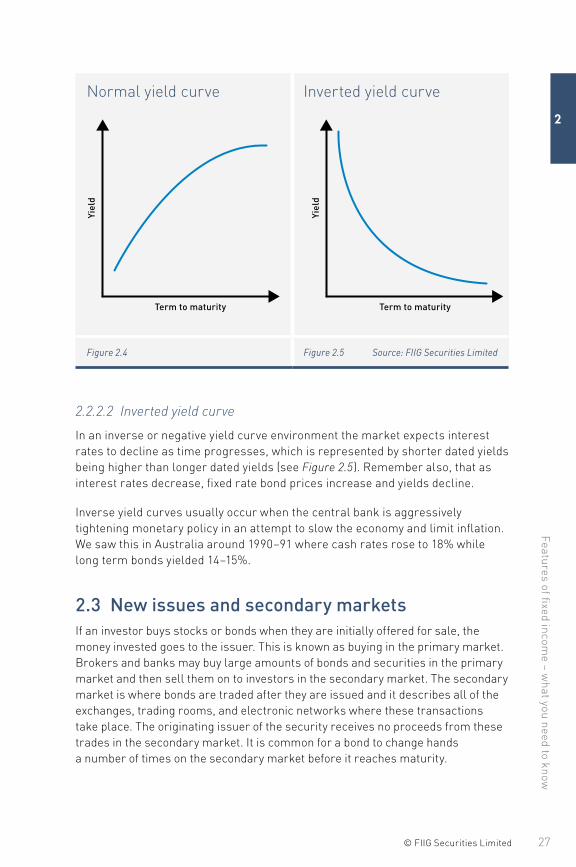
2.2.2.1 Normal yield curve
In a normal or positive yield curve environment long term fixed income securities offer higher yields than short term fixed income securities. This is intuitive since investors require a premium to compensate for the uncertainties associated with the general economic climate and the financial viability of the issuer over the long term (see Figure 2.4). Under these conditions, fixed rate bond prices decrease and yields increase. Floating rate notes show greater capital stability as the coupons grow with increasing interest rates.
27© FIIG Securities Limited
Features of fixed income – w
hat you need to know
2
Normal yield curve Inverted yield curve
Term to maturity Term to maturity
Yiel
d
Yiel
dTerm to maturity Term to maturity
Yiel
d
Yiel
d
Figure 2.4 Figure 2.5 Source: FIIG Securities Limited
2.2.2.2 Inverted yield curve
In an inverse or negative yield curve environment the market expects interest rates to decline as time progresses, which is represented by shorter dated yields being higher than longer dated yields (see Figure 2.5). Remember also, that as interest rates decrease, fixed rate bond prices increase and yields decline.
Inverse yield curves usually occur when the central bank is aggressively tightening monetary policy in an attempt to slow the economy and limit inflation. We saw this in Australia around 1990–91 where cash rates rose to 18% while long term bonds yielded 14–15%.
2.3 New issues and secondary marketsIf an investor buys stocks or bonds when they are initially offered for sale, the money invested goes to the issuer. This is known as buying in the primary market. Brokers and banks may buy large amounts of bonds and securities in the primary market and then sell them on to investors in the secondary market. The secondary market is where bonds are traded after they are issued and it describes all of the exchanges, trading rooms, and electronic networks where these transactions take place. The originating issuer of the security receives no proceeds from these trades in the secondary market. It is common for a bond to change hands a number of times on the secondary market before it reaches maturity.
The Australian G
uide to Fixed Incom
e
28 © FIIG Securities Limited
2
Interest rate securities have traditionally been traded in the over the counter (OTC) market by institutional investors. The OTC market comprises securities firms, banks and investors that trade bonds by phone or electronic means. Some are dealers that keep an inventory of bonds and buy and sell these for their own account; others act as brokers or agents and buy from or sell to other dealers in response to specific requests from customers (see Chapter 16 Buying and selling bonds and other fixed income products).
The Australia Securities Exchange (ASX) trades a limited number of interest rate securities on its exchange as do other global exchanges. Over the last ten years the number of ASX listed debt securities has increased although the securities have been dominated by corporate hybrid and subordinated debt issues rather than lower risk senior debt (see Chapter 9 Hybrids).
2.4 Discounts and premiumsBonds can be priced at a premium, discount or par (equal to face value). Face value is typically $100.
If a bond’s coupon rate is higher than current prevailing yields, the bond’s price will be higher than its face value and it will trade at a premium.
If the bond’s price is lower than its face value, the bond is said to trade at a discount and current yields available in the market will be higher than the bond‘s coupon rate.
Required yield or required rate of return is the interest rate that a security needs to offer in order to encourage investors to purchase it. When you calculate the price of a bond, you are calculating the price you would want to pay for the bond, given the bond’s yield in comparison to the current yield investors would receive in the market for an investment of the same maturity and credit quality.
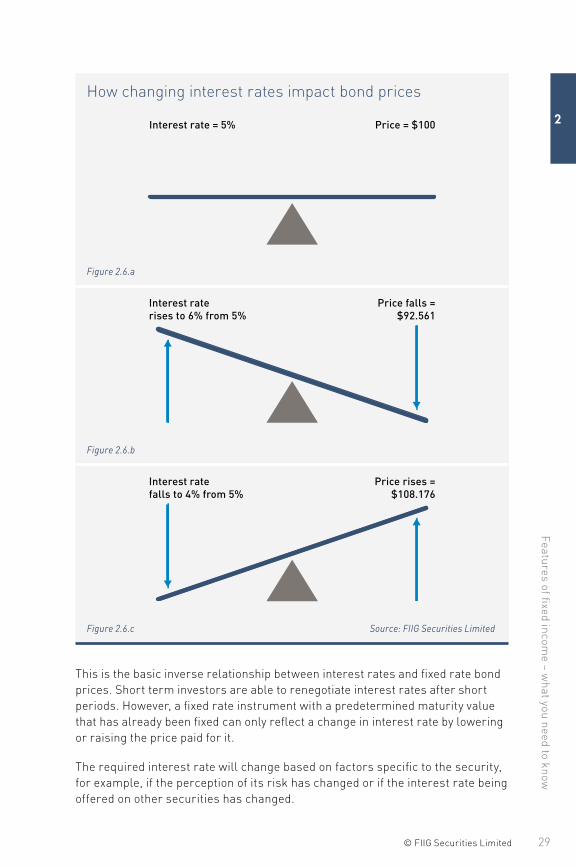
2.5 How changing interest rates impact bond pricesWhen interest rates rise, fixed rate bond prices generally fall. Conversely when interest rates fall, bond prices rise. Put simply, think of a seesaw in perfect balance. Assume you buy a $100 bond with 10 years to maturity which pays a 5% coupon delivering a required yield of 5% and this is the starting point. A rise in interest rates to 6% means that for the bond to have the same initial return of 5%, the face value must reduce proportionally to $92.56 so that the seesaw remains balanced. The reverse is also true. If interest rates fall to 4%, then the bond price must increase to $108.18 to maintain the initial 5% return (see Figures 2.6.a, b and c).
29© FIIG Securities Limited
Features of fixed income – w
hat you need to know
2
How changing interest rates impact bond prices
Interest rate = 5% Price = $100
Figure 2.6.a
Interest raterises to 6% from 5%
Price falls =$92.561
Figure 2.6.b
Interest ratefalls to 4% from 5%
Price rises =$108.176
Figure 2.6.c Source: FIIG Securities Limited
This is the basic inverse relationship between interest rates and fixed rate bond prices. Short term investors are able to renegotiate interest rates after short periods. However, a fixed rate instrument with a predetermined maturity value that has already been fixed can only reflect a change in interest rate by lowering or raising the price paid for it.
The required interest rate will change based on factors specific to the security, for example, if the perception of its risk has changed or if the interest rate being offered on other securities has changed.
The Australian G
uide to Fixed Incom
e
30 © FIIG Securities Limited
2
Therefore, a change in underlying interest rates as a result of RBA activity will have an impact on the price of fixed rate bonds.
Bonds perform two actions within a portfolio: they provide income and the potential for capital gain or loss. Most people tend to concentrate only on any potential income, but bonds may provide a capital gain that can be equally important as an insulation function for your portfolio (see Section 3.4.1 Fixed rate bonds and Chapter 6 Asset allocation). For this reason, fixed rate bonds are an essential part of a balanced portfolio as they help to reduce the volatility of returns in divergent growth scenarios.
Investors can choose to invest in variable rate bonds (for example floating rate notes or FRNs) so that interest payments (known as coupons) reflect changes to market interest rate levels. These bonds are more capital stable in that the coupons they pay rise and fall with interest rates and the bond price is not impacted to the same degree as a fixed rate bond when interest rate expectations change. FRN coupons are tied to an underlying benchmark such as the bank bill swap rate (BBSW) and usually have a fixed margin over and above the benchmark. These bonds are more attractive in a rising rate environment. The fixed income asset class caters for all types of investors.
2.6 DurationA bond’s maturity gives little indication of how much of its return is paid out during its life or the timing and size of its cashflows. For example, a zero coupon bond has no coupon payments during the life of the bond and returns face value at maturity. In contrast, a typical fixed rate bond pays a coupon twice a year as well as returning face value at maturity. Maturity alone is thus inadequate as an indicator of the bond’s sensitivity to moves in market interest rates.
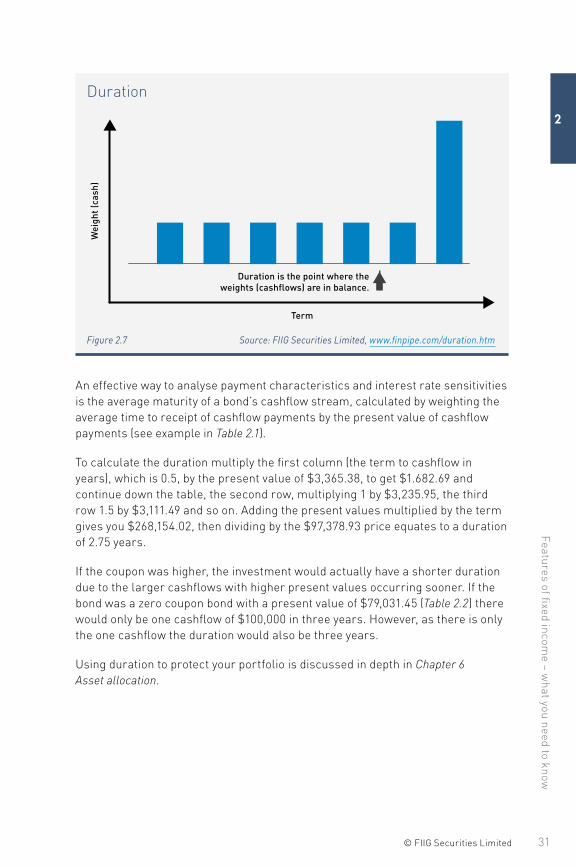
Consider two bonds with the same term to maturity but different coupons; the higher coupon bond generates a larger proportion of its return in the form of coupon payments than a lower coupon bond and so it pays out its return at a faster rate. Due to this, the higher coupon bond’s price is theoretically less sensitive to interest rate fluctuations. Duration (sometimes called Macaulay duration) is the weighted average period of a bond’s cashflow. Graphically it can be thought of as the point where a bond’s cashflows are in balance (see Figure 2.7).
31© FIIG Securities Limited
Features of fixed income – w
hat you need to know
2
Duration
Term
Duration is the point where theweights (cashflows) are in balance.
Wei
ght (
cash
)
Figure 2.7 Source: FIIG Securities Limited, www.finpipe.com/duration.htm
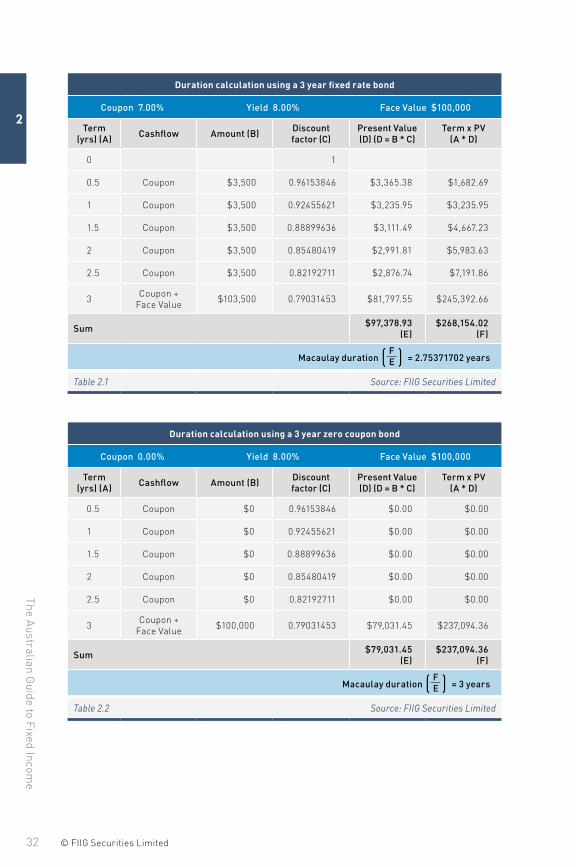
An effective way to analyse payment characteristics and interest rate sensitivities is the average maturity of a bond’s cashflow stream, calculated by weighting the average time to receipt of cashflow payments by the present value of cashflow payments (see example in Table 2.1).
To calculate the duration multiply the first column (the term to cashflow in years), which is 0.5, by the present value of $3,365.38, to get $1.682.69 and continue down the table, the second row, multiplying 1 by $3,235.95, the third row 1.5 by $3,111.49 and so on. Adding the present values multiplied by the term gives you $268,154.02, then dividing by the $97,378.93 price equates to a duration of 2.75 years.
If the coupon was higher, the investment would actually have a shorter duration due to the larger cashflows with higher present values occurring sooner. If the bond was a zero coupon bond with a present value of $79,031.45 (Table 2.2) there would only be one cashflow of $100,000 in three years. However, as there is only the one cashflow the duration would also be three years.
Using duration to protect your portfolio is discussed in depth in Chapter 6 Asset allocation.
The Australian G
uide to Fixed Incom
e
32 © FIIG Securities Limited
2
Duration calculation using a 3 year fixed rate bond
Coupon 7.00% Yield 8.00% Face Value $100,000
Term (yrs) (A) Cashflow Amount (B) Discount
factor (C)Present Value (D) (D = B * C)
Term x PV (A * D)
0 1
0.5 Coupon $3,500 0.96153846 $3,365.38 $1,682.69
1 Coupon $3,500 0.92455621 $3,235.95 $3,235.95
1.5 Coupon $3,500 0.88899636 $3,111.49 $4,667.23
2 Coupon $3,500 0.85480419 $2,991.81 $5,983.63
2.5 Coupon $3,500 0.82192711 $2,876.74 $7,191.86
3 Coupon + Face Value $103,500 0.79031453 $81,797.55 $245,392.66
Sum $97,378.93 (E)
$268,154.02 (F)
Macaulay duration ( F E ) = 2.75371702 years
Table 2.1 Source: FIIG Securities Limited
Duration calculation using a 3 year zero coupon bond
Coupon 0.00% Yield 8.00% Face Value $100,000
Term (yrs) (A) Cashflow Amount (B) Discount
factor (C)Present Value (D) (D = B * C)
Term x PV (A * D)
0.5 Coupon $0 0.96153846 $0.00 $0.00
1 Coupon $0 0.92455621 $0.00 $0.00
1.5 Coupon $0 0.88899636 $0.00 $0.00
2 Coupon $0 0.85480419 $0.00 $0.00
2.5 Coupon $0 0.82192711 $0.00 $0.00
3 Coupon + Face Value $100,000 0.79031453 $79,031.45 $237,094.36
Sum $79,031.45 (E)
$237,094.36 (F)
Macaulay duration ( F E ) = 3 years
Table 2.2 Source: FIIG Securities Limited
33© FIIG Securities Limited
Features of fixed income – w
hat you need to know
2
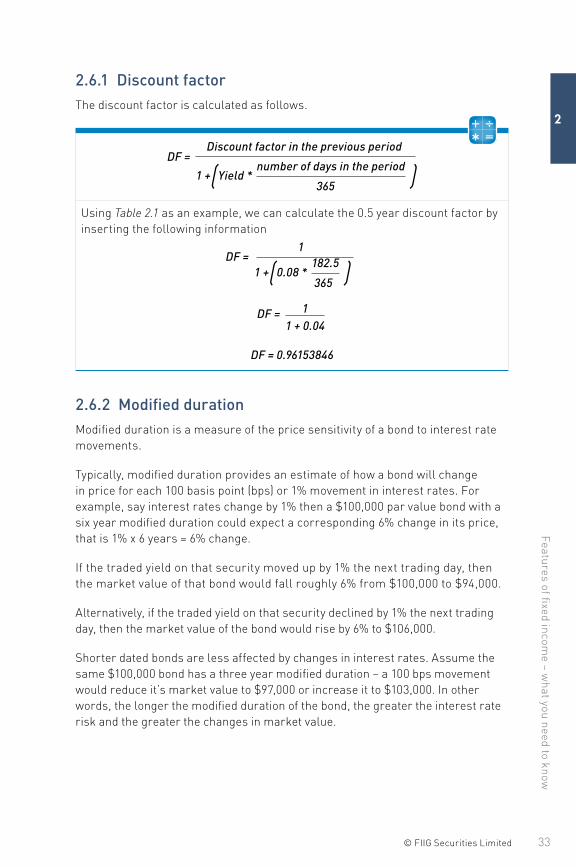
2.6.1 Discount factorThe discount factor is calculated as follows.
DF = Discount factor in the previous period
1 +(Yield * number of days in the period
)
365
Using Table 2.1 as an example, we can calculate the 0.5 year discount factor by inserting the following information
DF = 1
1 +(0.08 * 182.5
)
365
DF = 11 + 0.04
DF = 0.96153846
2.6.2 Modified durationModified duration is a measure of the price sensitivity of a bond to interest rate movements.
Typically, modified duration provides an estimate of how a bond will change in price for each 100 basis point (bps) or 1% movement in interest rates. For example, say interest rates change by 1% then a $100,000 par value bond with a six year modified duration could expect a corresponding 6% change in its price, that is 1% x 6 years = 6% change.
If the traded yield on that security moved up by 1% the next trading day, then the market value of that bond would fall roughly 6% from $100,000 to $94,000.
Alternatively, if the traded yield on that security declined by 1% the next trading day, then the market value of the bond would rise by 6% to $106,000.
Shorter dated bonds are less affected by changes in interest rates. Assume the same $100,000 bond has a three year modified duration – a 100 bps movement would reduce it’s market value to $97,000 or increase it to $103,000. In other words, the longer the modified duration of the bond, the greater the interest rate risk and the greater the changes in market value.
The Australian G
uide to Fixed Incom
e
34 © FIIG Securities Limited
2
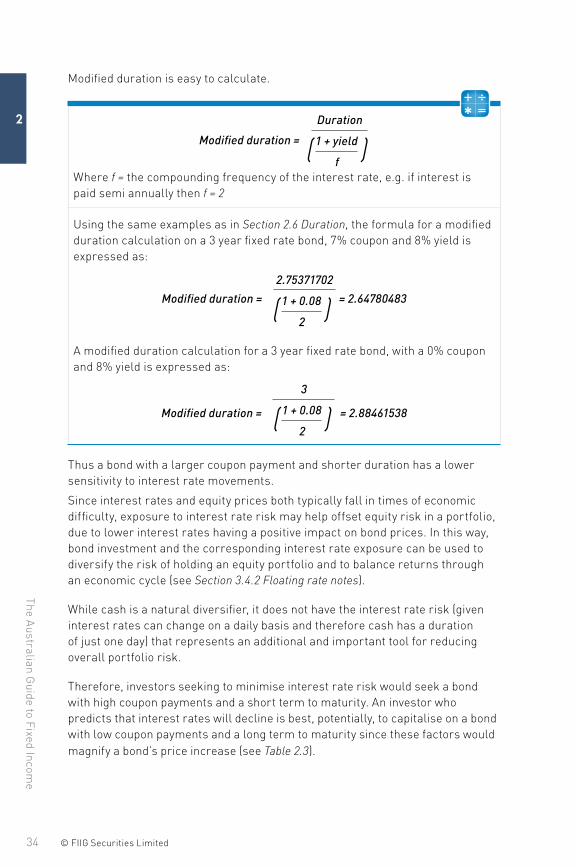
Modified duration is easy to calculate.
Modified duration =
Duration
( 1 + yield )fWhere f = the compounding frequency of the interest rate, e.g. if interest is paid semi annually then f = 2
Using the same examples as in Section 2.6 Duration, the formula for a modified duration calculation on a 3 year fixed rate bond, 7% coupon and 8% yield is expressed as:
Modified duration =
2.75371702
( 1 + 0.08 )2
= 2.64780483
A modified duration calculation for a 3 year fixed rate bond, with a 0% coupon and 8% yield is expressed as:
Modified duration =
3
( 1 + 0.08 )2
= 2.88461538
Thus a bond with a larger coupon payment and shorter duration has a lower sensitivity to interest rate movements.
Since interest rates and equity prices both typically fall in times of economic difficulty, exposure to interest rate risk may help offset equity risk in a portfolio, due to lower interest rates having a positive impact on bond prices. In this way, bond investment and the corresponding interest rate exposure can be used to diversify the risk of holding an equity portfolio and to balance returns through an economic cycle (see Section 3.4.2 Floating rate notes).
While cash is a natural diversifier, it does not have the interest rate risk (given interest rates can change on a daily basis and therefore cash has a duration of just one day) that represents an additional and important tool for reducing overall portfolio risk.
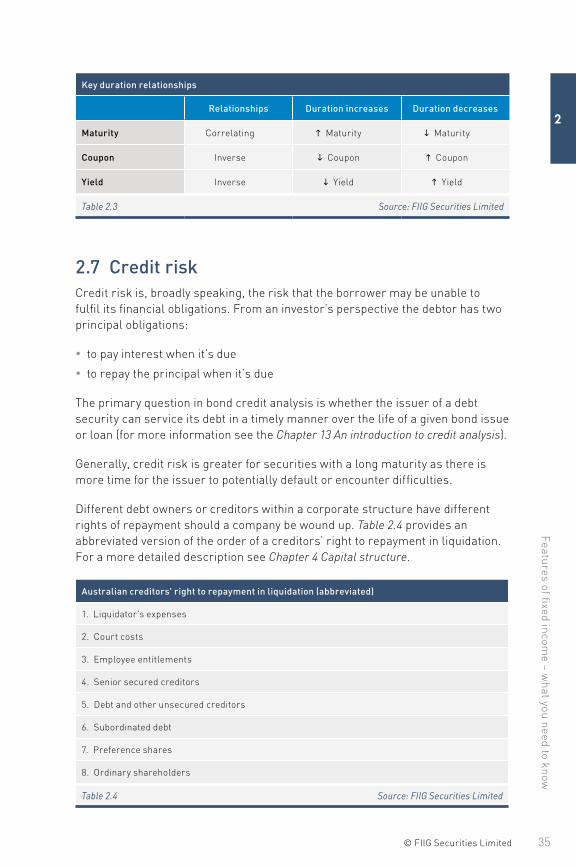
Therefore, investors seeking to minimise interest rate risk would seek a bond with high coupon payments and a short term to maturity. An investor who predicts that interest rates will decline is best, potentially, to capitalise on a bond with low coupon payments and a long term to maturity since these factors would magnify a bond’s price increase (see Table 2.3).
35© FIIG Securities Limited
Features of fixed income – w
hat you need to know
2
Key duration relationships
Relationships Duration increases Duration decreases
Maturity Correlating h Maturity i Maturity
Coupon Inverse i Coupon h Coupon
Yield Inverse i Yield h Yield
Table 2.3 Source: FIIG Securities Limited
2.7 Credit riskCredit risk is, broadly speaking, the risk that the borrower may be unable to fulfil its financial obligations. From an investor’s perspective the debtor has two principal obligations:
• to pay interest when it’s due
• to repay the principal when it’s due
The primary question in bond credit analysis is whether the issuer of a debt security can service its debt in a timely manner over the life of a given bond issue or loan (for more information see the Chapter 13 An introduction to credit analysis).
Generally, credit risk is greater for securities with a long maturity as there is more time for the issuer to potentially default or encounter difficulties.
Different debt owners or creditors within a corporate structure have different rights of repayment should a company be wound up. Table 2.4 provides an abbreviated version of the order of a creditors’ right to repayment in liquidation. For a more detailed description see Chapter 4 Capital structure.
Australian creditors' right to repayment in liquidation (abbreviated)
1. Liquidator's expenses
2. Court costs
3. Employee entitlements
4. Senior secured creditors
5. Debt and other unsecured creditors
6. Subordinated debt
7. Preference shares
8. Ordinary shareholders
Table 2.4 Source: FIIG Securities Limited
The Australian G
uide to Fixed Incom
e
36 © FIIG Securities Limited
2
Compared to other investment opportunities in a typical company, bonds are considered a relatively low risk asset class as:
• they represent a legal commitment to make interest and principal payments
• they have a maturity date (excluding perpetuals) at which time the borrower has an obligation to return all outstanding principal
• their place in the capital structure means that in the event of a company winding up, bondholders are relatively senior in the creditors queue, although they may be subordinate to secured creditors (see Chapter 4 Capital structure)
Four main factors influence the relative credit risk of a bond:
1. The level of subordination of a bond will affect its risk profile. The more subordinated the bond to the other creditors of the company, the higher the risk of that bond.
2. Time to maturity or duration. The longer the bond, the greater the risk for two main reasons:
a. A change in the yield will cause greater movements to a longer bond’s price than a shorter term equivalent bond (see Sections 2.6 Duration and 6.3 Fixed income in a balanced portfolio).
b. The longer the bond the greater chance of an issuer defaulting. Clearly, economies go through cycles, products are invented while others become obsolete. The longer the bond is in circulation, the longer its term to maturity and the greater the chance that something will happen to that company, their industry, or the product they make or sell, that will cause them to default. Bear in mind that the risk of investment grade companies (see Section 2.9 Credit ratings) defaulting is very low.
3. The existence of any issuer call options (see to Chapter 9 Hybrids and Chapter 20 Glossary) increases the risk of the bond. For example, a typical subordinated bank issued bond in Australia gives the issuer the option to choose not to repay principal at the call date, but delay it until final legal maturity at a specified future time, usually ten years from first issue. Options allow the issuer to refinance when it suits them but this is unlikely to suit the investor at the same time.
4. Anything that lowers the credit quality of a bond will increase its risk. This may include changes in the broader economy, the financial position of the issuer or decisions that potentially impact profit.
Analysing credit worthiness of debt issuers is a complex task. FIIG has a specialist Research Team devoted to analysing risks associated with bond issuers from a fixed income perspective, as debt and equity investors’ interests are often different. What may be negative for equity holders can be a positive development for bondholders. For example, a cut in dividend is negative from a shareholder’s perspective (and for a large company this will be widely reported in the media),
37© FIIG Securities Limited
Features of fixed income – w
hat you need to know
2
but it may mean the company is retaining cash within the business, ultimately supporting bondholders by providing additional subordination (see Chapter 13 An introduction to credit analysis).
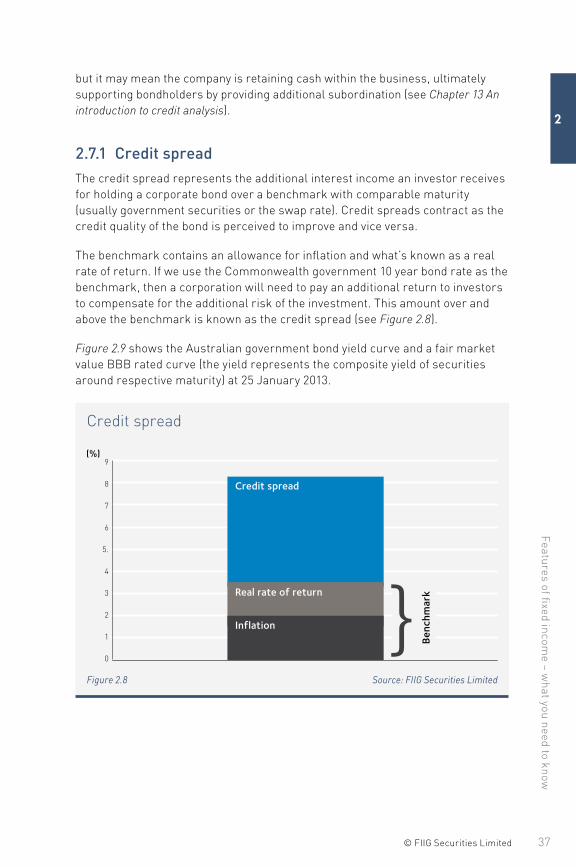
2.7.1 Credit spreadThe credit spread represents the additional interest income an investor receives for holding a corporate bond over a benchmark with comparable maturity (usually government securities or the swap rate). Credit spreads contract as the credit quality of the bond is perceived to improve and vice versa.
The benchmark contains an allowance for inflation and what’s known as a real rate of return. If we use the Commonwealth government 10 year bond rate as the benchmark, then a corporation will need to pay an additional return to investors to compensate for the additional risk of the investment. This amount over and above the benchmark is known as the credit spread (see Figure 2.8).
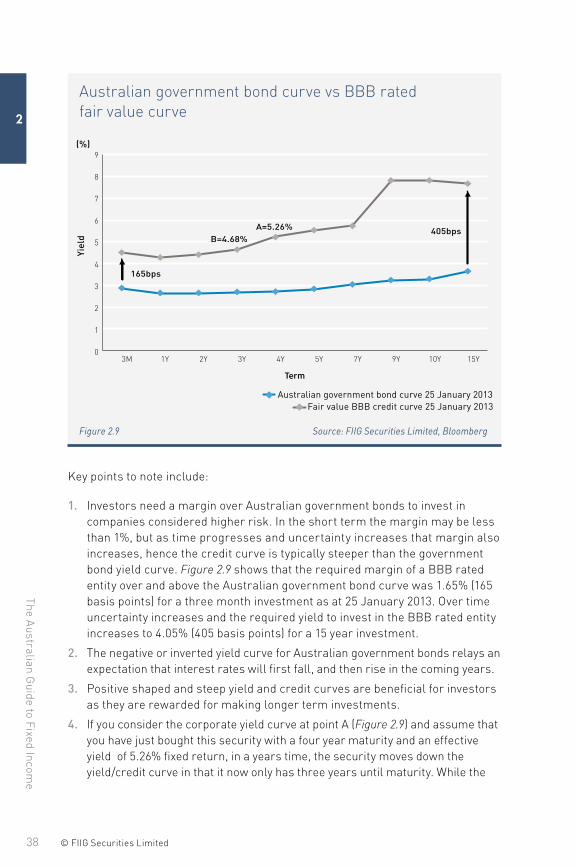
Figure 2.9 shows the Australian government bond yield curve and a fair market value BBB rated curve (the yield represents the composite yield of securities around respective maturity) at 25 January 2013.
Credit spread
0
1
2
3
4
5.
6
8
9
7
Credit spread
Real rate of return
Inf lation }
(%)
Benc
hmar
k
Figure 2.8 Source: FIIG Securities Limited
The Australian G
uide to Fixed Incom
e
38 © FIIG Securities Limited
2
Australian government bond curve vs BBB rated fair value curve
Australian government bond curve 25 January 2013Fair value BBB credit curve 25 January 2013
165bps
B=4.68%A=5.26% 405bps
0
1
2
3
4
5
6
7
8
9
3M 1Y 2Y 3Y 4Y 5Y 7Y 9Y 10Y 15Y
Yiel
d
Term
(%)
Figure 2.9 Source: FIIG Securities Limited, Bloomberg
Key points to note include:
1. Investors need a margin over Australian government bonds to invest in companies considered higher risk. In the short term the margin may be less than 1%, but as time progresses and uncertainty increases that margin also increases, hence the credit curve is typically steeper than the government bond yield curve. Figure 2.9 shows that the required margin of a BBB rated entity over and above the Australian government bond curve was 1.65% (165 basis points) for a three month investment as at 25 January 2013. Over time uncertainty increases and the required yield to invest in the BBB rated entity increases to 4.05% (405 basis points) for a 15 year investment.
2. The negative or inverted yield curve for Australian government bonds relays an expectation that interest rates will first fall, and then rise in the coming years.
3. Positive shaped and steep yield and credit curves are beneficial for investors as they are rewarded for making longer term investments.
4. If you consider the corporate yield curve at point A (Figure 2.9) and assume that you have just bought this security with a four year maturity and an effective yield of 5.26% fixed return, in a years time, the security moves down the yield/credit curve in that it now only has three years until maturity. While the
39© FIIG Securities Limited
Features of fixed income – w
hat you need to know
2
security is yielding 5.26%, investors considering purchasing the bond are now content with a lower return hurdle of 4.68% due to a reduction in uncertainty as the maturity date draws closer. In that way the positive yield curve provides 0.58% buffer against increased credit spreads over the coming year.
5. The slope of a yield curve can change, that is either steepen or flatten significantly over time.
2.8 Liquidity riskThe liquidity or marketability of an asset is a function of the difference between the bid (the price at which the market is willing to buy the security) and the offer (the price at which the market is willing to sell the security). It is more commonly known as the bid offer spread. If a market is liquid it will have many participants competing to buy or sell the assets at any given time, resulting in a narrow spread. If a market is not liquid it becomes very difficult to buy or sell the asset without significantly adjusting the capital price of that asset, creating a wide bid offer spread. Of course the other factor that defines liquidity is the volume which can be transacted at a particular price or bid offer spread.
Generally speaking, most of Australia’s benchmark government and semi government bond issues are extremely liquid issues. Average traded daily volume typically exceeds AUD6bn for Commonwealth government bonds alone and bid offer spreads in the wholesale market for a parcel of $10m or more can be as low as 1 basis point (bps) or 0.01% in terms of yield (a very narrow bid offer spread). Investment grade corporate bonds are more liquid than non investment grade bonds as they have greater investor acceptance (see Section 2.9.1.1 Investment grade). Liquidity varies day to day and can change very quickly.
Bonds can have many variables reducing the number of suitable buyers. Many investors have an inflexible charter or investment grade mandate requiring them to consider only investment grade bonds or certain types of securities. Companies with sub investment grade ratings operate in markets with fewer buyers, reducing liquidity. Another variable is whether the security is secured or unsecured which may also play a part in its ability to trade in the secondary market, otherwise impacting its liquidity. The issuer and its underlying credit quality play an important role in providing liquidity to the asset. The size of the issue also plays a role.
2.9 Credit ratingsCredit ratings are an indication of the underlying credit worthiness of issuers and specific securities, prepared by organisations that attempt to rate all securities in a comparable fashion. Specifically, they rate the ability to meet all obligations (both principal and interest) in full and on time. Ratings help investors compare
The Australian G
uide to Fixed Incom
e
40 © FIIG Securities Limited
2
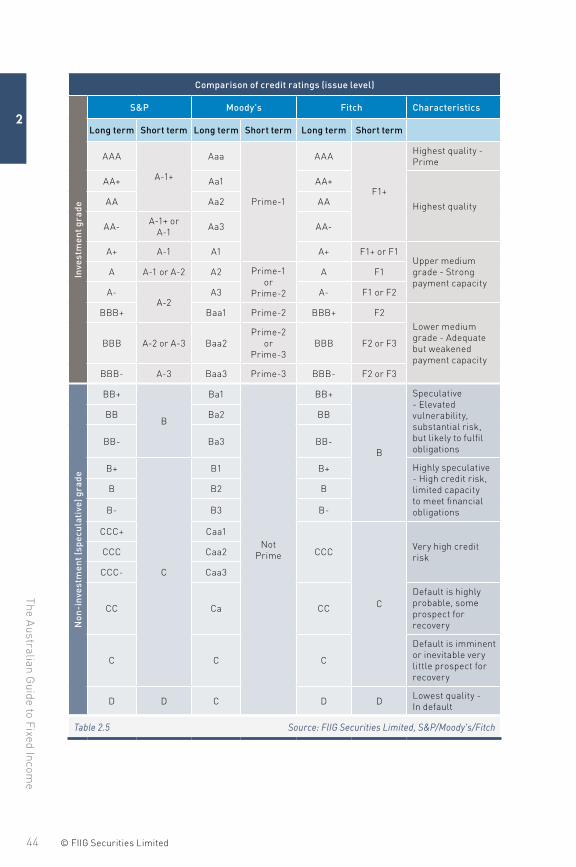
the relative risks of investing in a bond. There are many companies and systems that try to quantify risk but the three major international rating agencies currently engaged in this practice are Standard & Poor’s (S&P), Moody’s and Fitch. Table 2.5 compares the ratings scales of these three agencies.
Credit rating agency models are both quantitative (based on historical and forecast financial results) and qualitative (that is, without numerical basis). Qualitative measures are subject to interpretation, so there is room for judgment in the credit rating process.
Generally, as a bond’s rating decreases, the price a company pays for its debt will increase. Investors need to be compensated via a higher return for an increase in investment risk. Investors should also remember that ratings can change over the life of an interest rate security. Any change in the rating of a company would normally have a direct impact on the market price of its securities. However a company can be unrated and this does not necessarily mean that its bonds are high risk. FIIG recommends gathering information from as many sources as possible before making an investment decision. Credit ratings should never be used as the sole credit assessment tool. Under Information Sheet 99, ASIC docs not permit bond issuers to disclose credit ratings to retail investors if that disclosure is intended to influence an investment decision. See www.asic.gov.au.
FIIG publishes information on many Australian and international banks and corporations, providing a distinct advantage to investors. In every case investors should only invest in securities where they have established the underlying risk of the issuer and are comfortable the securities’ return accurately reflects the risk involved.
Credit ratings can be categorised into long term or short term indices and are provided both for issuers and for specific securities. It is important to note that long term credit ratings are quoted more frequently. Standard and Poor’s (S&P) is the dominant rating agency in Australia. For more information see www.standardandpoors.com.
2.9.1 Credit rating definitions (S&P)Long term credit ratings are forward looking assessments, over a two to three year credit horizon, designed to remain stable over the course of normal business cycles. Long term S&P ratings range from “AAA” for the highest quality obligations to ‘D’ for default. Ratings from ‘AA’ to ‘CCC’ may be modified by the addition of a “+” or “-” sign to distinguish relative credit strength within each rating category.
41© FIIG Securities Limited
Features of fixed income – w
hat you need to know
2
S&P also assigns an outlook to its long term ratings, which is an assessment of the potential rating direction typically over the next six months to two years. These are: positive, negative, stable, developing and N.M. (not meaningful).
Under certain circumstances, short and long term ratings can also be placed on CreditWatch – a special surveillance by analytical staff.
As noted above, S&P indicates that:
“Credit ratings do not measure performance factors, such as market value or price fluctuations, and they do not address, explicitly or implicitly, whether:• investors should buy, sell, or hold rated securities• a particular rated security is suitable for a particular investor or group
of investors• a security is appropriate for an investor’s risk tolerance• the expected return of a particular investment is adequate compensation
for the risk it poses• the price of a security is appropriate given its credit quality• there is, or will be, a ready liquid market in which the security may be
bought or sold• the market value of the security will remain stable over timeWhile credit quality is an important consideration in evaluating an investment, it cannot serve as the sole indicator of investment merit.”
The rating categories below refer to the creditworthiness of the obligator with respect to a specific financial obligation, a specific class of financial obligations, or a specific financial program (e.g. medium term note and commercial paper programs).
2.9.1.1 Investment grade
• AAA Highest possible rating. The obligations/obligator’s capacity to meet its financial commitment on the obligation is extremely strong
• AA The obligations/obligator’s capacity to meet its financial commitment on the obligation is very strong
• A The obligation/obligator is somewhat more susceptible to the adverse effects of changes in circumstances and economic conditions than obligations in higher rating categories. The obligator’s capacity to meet its financial commitment on the obligation is strong
• BBB An obligation/obligor exhibits adequate protection parameters, however, adverse economic conditions or changing circumstances are more likely to lead to a weakened capacity of the obligor to meet its financial commitment on the obligation
The Australian G
uide to Fixed Incom
e
42 © FIIG Securities Limited
2
2.9.1.2 Non investment grade – (speculative or junk)
S&P describes the obligations with non investment grade ratings as having speculative characteristics, and while these obligations might have some quality and protective characteristics, the chances are they may be outweighed by uncertainties and/or major exposures to negative conditions.
• BB Less vulnerable to non performance than other speculative issues
• B More vulnerable, but the obligator currently has the capacity to meet its financial commitments. Major adverse conditions are likely to impair an obligor’s facilities to meet these obligations
• CCC Currently vulnerable. Major adverse conditions will impact the business, thus the obligor is likely not to have capacity to meet its financial obligations
• CC Currently highly vulnerable
• C Highly vulnerable to non payment, payment is currently in arrears in such a way that the issuer is vulnerable to a bankruptcy petition or similar action, but has not yet experienced a payment default
• D In payment default, when payments on obligations have not been made. Also used upon the filing of bankruptcy petition if payments are jeopardised
• NR No rating. The rating has not been requested, or the information is insufficient to determine the rating, or S&P does not rate a particular obligation
S&P also assigns short term ratings to short term obligations in relevant markets. These are: A-1 (highest category with the possibility of awarding a “+” to certain obligations) to A-3, B to B-3, C and D.
S&P assigns issuer credit ratings to reflect an obligor’s overall capacity to meet its financial obligations. These also include counterparty credit ratings and sovereign credit ratings. Similarly to issue specific ratings, S&P assigns long term ratings ranging from “AAA” (highest possible) to “CC”, with the possibility the addition of a “+” or “-” sign to distinguish relative credit strength within each rating category for “AA” to “CCC” categories. Additionally, S&P can assign a rating of:
R An obligator is under regulatory supervision
SD Selective default (SD) where the obligor has defaulted on some specific issues or class of obligations, but will continue to pay on other issues or classes of obligations
43© FIIG Securities Limited
Features of fixed income – w
hat you need to know
2
D S&P believes that the issuer has defaulted and will not pay all or almost all of financial obligations when they come due
For other definitions of S&P’s credit ratings and a full list of rating types see: http://img.en25.com/Web/StandardandPoors/S_P_Ratings_Definitions.pdf.
Other major and widely used credit rating agencies are Moody’s and Fitch.
Moody’s uses an “Aaa” (highest) to “C” ratings scale for long term ratings. The numerical modifiers 1, 2 and 3 are applied to each generic rating classification between “Aa” and “Caa” to distinguish credit strength within each category. Ratings Prime-1, Prime-2, Prime-3 and Not Prime are applied to short term obligations. For more information, see http://www.moodys.com/researchdocumentcontentpage.aspx?docid=PBC_79004.
Fitch assigns long term credit ratings using a scale between “AAA” and “D”, with obligations below “BBB-” considered as speculative grade. Modifiers “+” and “-” may be added to the ratings between “AA” and “B” to further denote credit status within a category. “RD” (restricted default) is also used by Fitch as a long term issuer credit rating category. “RD” refers to an uncured payment default on a financial obligation (the earliest failure to pay a regular instalment of principal and/or interest when due) but where the issuer has not yet entered into bankruptcy filings (i.e. somewhat equal to selective default). Short term ratings include: F1, F2, F3, B, C, RD and D. For more information see: http://www.fitchratings.com/web_content/ratings/fitch_ratings_definitions_and_scales.pdf.
The Australian G
uide to Fixed Incom
e
44 © FIIG Securities Limited
2
Comparison of credit ratings (issue level)In
vest
men
t gra
de
S&P Moody's Fitch Characteristics
Long term Short term Long term Short term Long term Short term
AAA
A-1+
Aaa
Prime-1
AAA
F1+
Highest quality - Prime
AA+ Aa1 AA+
Highest qualityAA Aa2 AA
AA- A-1+ or A-1 Aa3 AA-
A+ A-1 A1 A+ F1+ or F1Upper medium grade - Strong payment capacity
A A-1 or A-2 A2 Prime-1 or
Prime-2
A F1
A-A-2
A3 A- F1 or F2
BBB+ Baa1 Prime-2 BBB+ F2Lower medium grade - Adequate but weakened payment capacity
BBB A-2 or A-3 Baa2Prime-2
or Prime-3
BBB F2 or F3
BBB- A-3 Baa3 Prime-3 BBB- F2 or F3
Non
-inv
estm
ent (
spec
ulat
ive)
gra
de
BB+
B
Ba1
Not Prime
BB+
B
Speculative - Elevated vulnerability, substantial risk, but likely to fulfil obligations
BB Ba2 BB
BB- Ba3 BB-
B+
C
B1 B+ Highly speculative - High credit risk, limited capacity to meet financial obligations
B B2 B
B- B3 B-
CCC+ Caa1
CCC
C
Very high credit riskCCC Caa2
CCC- Caa3
CC Ca CC
Default is highly probable, some prospect for recovery
C C C
Default is imminent or inevitable very little prospect for recovery
D D C D D Lowest quality - In default
Table 2.5 Source: FIIG Securities Limited, S&P/Moody's/Fitch
45© FIIG Securities Limited
Features of fixed income – w
hat you need to know
2
2.10 Bond market indicesA bond index, like an equity index, attempts to provide a benchmark for assessing the performance of a universe of fixed income securities. Bond indices are usually total return indices which include all coupon income, unrealised capital gains and losses. They also reinvest the interest received and the maturities (see Chapter 20 Glossary).
There are a number of factors that need to be considered when constructing an index and a number of conventions that need to be followed.
The index should provide an accurate representation of the market it is attempting to cover. It should be a replicable index, which means that an investor should be able to purchase all of the securities in the index or very closely track and replicate the returns from the index. The index should also be characterised by fully available and accessible information so that an investor can tailor and adjust their index according to their individual requirements or preferences. Finally, it is important that the index be transparent. That is, available data can be used to verify calculated returns and values to ensure the credibility of the index.
There are a few steps involved in calculating the value of an index:
1. Identify the securities that comprise the index.
2. Obtain the current market value (the current market price) of each security.
3. Multiply each bond’s issue price by its volume to get a market value on issue. The market value of the bond is the weight attributed to each bond in the index.
4. Sum all these values to calculate the total value of all the bonds in the index at the end of the business day.
5. The percentage change in the value of this portfolio from yesterday to today is the return of the market for the day.
Portfolio risk statistics must also be calculated. This is achieved by:
• calculating the risk statistic for each individual bond in the portfolio by calculating the duration, modified duration and convexity for each bond in the index (see Sections 2.6 Duration and 6.1 How exposure to interest rate risk (duration) helps portfolios hedge against the volatility of higher risk assets)
• each bond’s statistics are then weighted by their value (or its proportion in the portfolio) to get the portfolio risk statistic
There are a number of bond indices available in the Australian bond market. The most commonly used index in Australia is the Composite Bond Index produced by UBS Australia. The indices and reports on the indices are published every day. The reports include details on returns and risk statistics such as the duration, modified duration and the sector weightings.
The Australian G
uide to Fixed Incom
e
46 © FIIG Securities Limited
2
For bonds to be included in the UBS Composite Bond Index they must meet certain criteria. The following list briefly summarises some of the selection criteria for inclusion in the Index. The bonds must:
• have defined cashflows (i.e. be standard nominal bonds)
• be fixed rate (fixed coupon)
• be governed by Australian law
• have a minimum of $100m on issue
• have a minimum rating of BBB-/ Baa3 (S&P or Moody’s) if they are non government securities
2.11 CalculationsBond market mathematics are complex. Most market participants use software to perform standard calculations.
For those seeking greater detail please refer to Appendix 2, Pricing formula for Commonwealth government securities and additional reading noted in References and Further Reading.
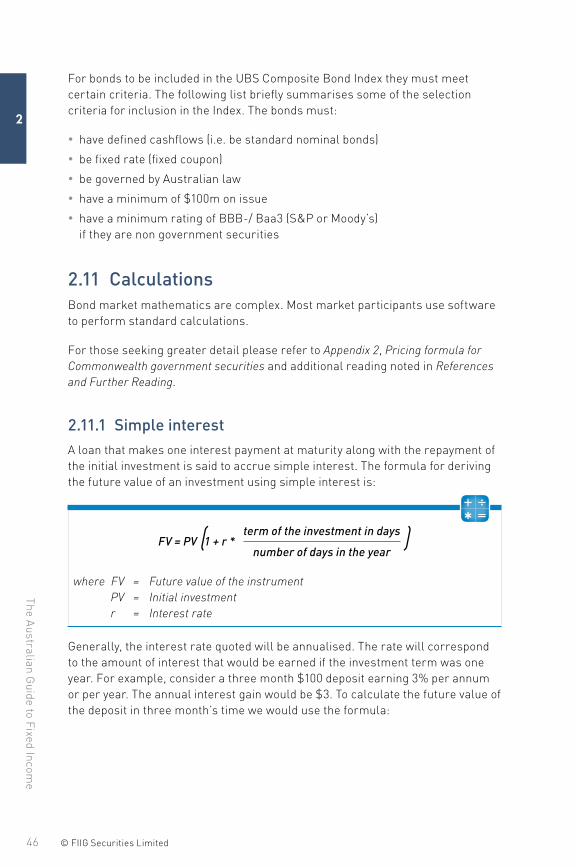
2.11.1 Simple interestA loan that makes one interest payment at maturity along with the repayment of the initial investment is said to accrue simple interest. The formula for deriving the future value of an investment using simple interest is:
FV = PV (1 + r *
term of the investment in days
number of days in the year)
where FV = Future value of the instrument PV = Initial investment r = Interest rate
Generally, the interest rate quoted will be annualised. The rate will correspond to the amount of interest that would be earned if the investment term was one year. For example, consider a three month $100 deposit earning 3% per annum or per year. The annual interest gain would be $3. To calculate the future value of the deposit in three month’s time we would use the formula:
47© FIIG Securities Limited
Features of fixed income – w
hat you need to know
2FV = PV (1 + r *
term of the investment in days
number of days in the year)
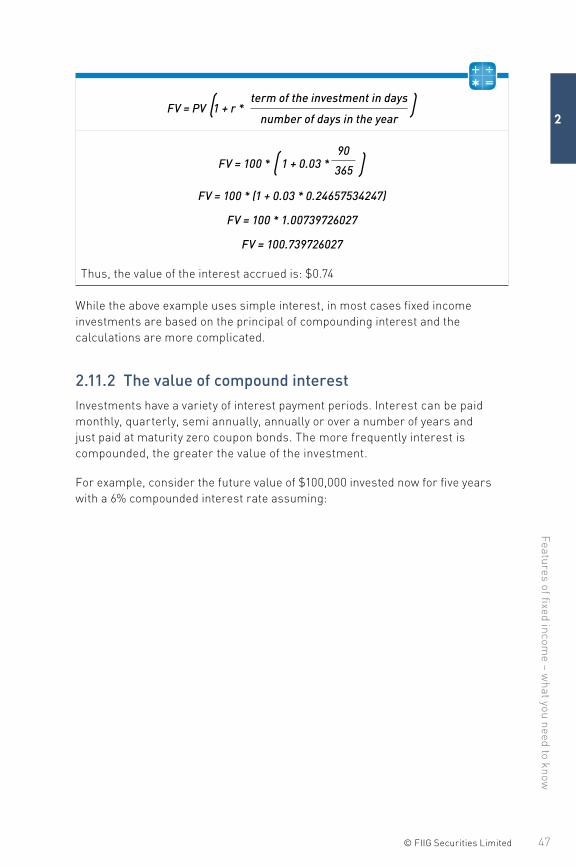
FV = 100 * ( 1 + 0.03 * 90
365 )FV = 100 * (1 + 0.03 * 0.24657534247)
FV = 100 * 1.00739726027
FV = 100.739726027
Thus, the value of the interest accrued is: $0.74
While the above example uses simple interest, in most cases fixed income investments are based on the principal of compounding interest and the calculations are more complicated.
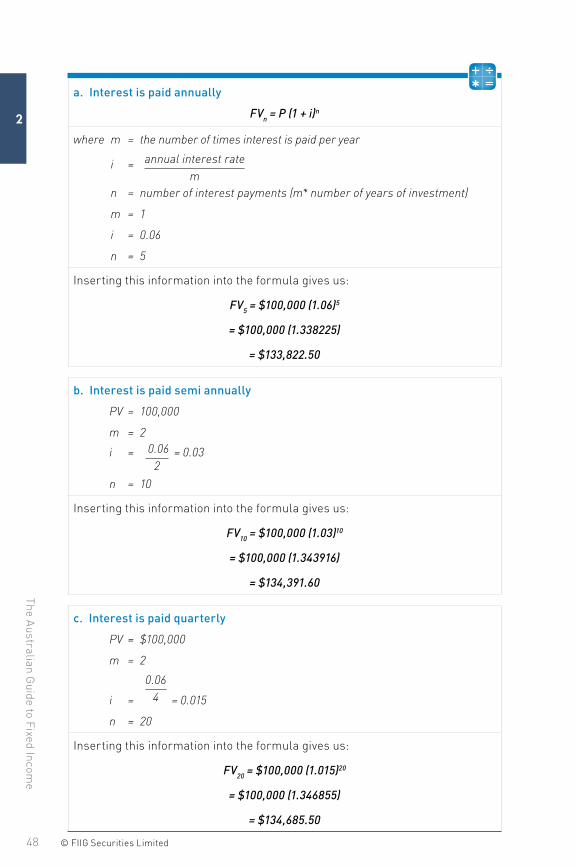
2.11.2 The value of compound interest Investments have a variety of interest payment periods. Interest can be paid monthly, quarterly, semi annually, annually or over a number of years and just paid at maturity zero coupon bonds. The more frequently interest is compounded, the greater the value of the investment.
For example, consider the future value of $100,000 invested now for five years with a 6% compounded interest rate assuming:
The Australian G
uide to Fixed Incom
e
48 © FIIG Securities Limited
2
a. Interest is paid annually
FVn = P (1 + i)n
where m = the number of times interest is paid per year
i = annual interest ratem
n = number of interest payments (m* number of years of investment)
m = 1
i = 0.06
n = 5
Inserting this information into the formula gives us:
FV5 = $100,000 (1.06)5
= $100,000 (1.338225)
= $133,822.50
b. Interest is paid semi annually
PV = 100,000
m = 2
i =
0.06
2= 0.03
n = 10
Inserting this information into the formula gives us:
FV10 = $100,000 (1.03)10
= $100,000 (1.343916)
= $134,391.60
c. Interest is paid quarterly
PV = $100,000
m = 2
i =
0.064 = 0.015
n = 20
Inserting this information into the formula gives us:
FV20 = $100,000 (1.015)20
= $100,000 (1.346855)
= $134,685.50
49© FIIG Securities Limited
Chapter 3.
Fixed income products
3.1 Why companies issue fixed income productsThere are two fundamental types of capital available to companies to fund their operations: debt capital and equity capital. The main differences between debt and equity relate to risk and return.
From an investor’s perspective, an investment in the equity or ordinary shares of a company represents a higher risk than an investment in the debt of a company. At one end of the spectrum, ordinary shares have the potential to deliver high or unlimited returns to an investor through capital gains and dividends. Yet they also have the potential to deliver total loss to an investor as they are the “owners” of the business.
While a company could in theory have only equity capital, in practice companies combine debt with equity to create a more efficient capital structure. The debt leverages the equity and the potential return to shareholders but also provides flexibility for working capital and greater financial efficiency as debt is typically tax deductible.
Debt can take various forms on the balance sheet of a company. A company may have a short term (less than 365 days) revolving bank facility that provides funds to meet day to day or seasonal cash flows. A company may also have a long term (say five year) debt facility from a bank that has provided funds to be used for capital equipment.
While bank borrowings typically make up a large proportion of a company’s debt obligations, companies may also issue debt securities to investors. These might include short term debt (such as commercial paper) or long term debt (such as corporate bonds). Additionally, companies may issue subordinated debt and hybrids that sit between equity and other debt securities (see Chapter 4 Capital structure and Appendix 1 Typical capital structure for an Australian bank). Debt can be cheaper to issue than equity or a bank loan and provides diversification of funding sources thereby improving a company’s capital management.
The Australian G
uide to Fixed Incom
e
50 © FIIG Securities Limited
3
This section of the guide provides a description of the types of debt securities available in the market, their advantages and disadvantages, as well as suggestions as to the types of investors that might use them in their portfolios.
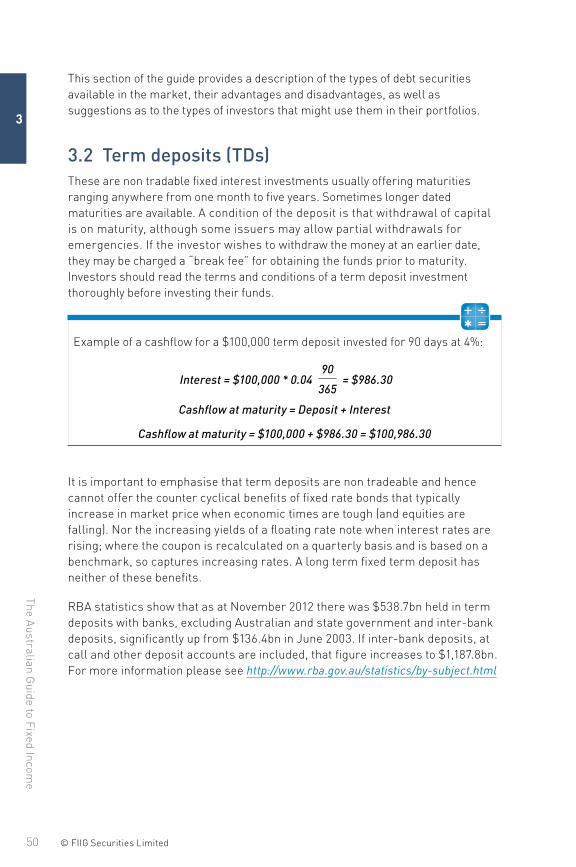
3.2 Term deposits (TDs)These are non tradable fixed interest investments usually offering maturities ranging anywhere from one month to five years. Sometimes longer dated maturities are available. A condition of the deposit is that withdrawal of capital is on maturity, although some issuers may allow partial withdrawals for emergencies. If the investor wishes to withdraw the money at an earlier date, they may be charged a “break fee” for obtaining the funds prior to maturity. Investors should read the terms and conditions of a term deposit investment thoroughly before investing their funds.
Example of a cashflow for a $100,000 term deposit invested for 90 days at 4%:
Interest = $100,000 * 0.0490
365= $986.30
Cashflow at maturity = Deposit + Interest
Cashflow at maturity = $100,000 + $986.30 = $100,986.30
It is important to emphasise that term deposits are non tradeable and hence cannot offer the counter cyclical benefits of fixed rate bonds that typically increase in market price when economic times are tough (and equities are falling). Nor the increasing yields of a floating rate note when interest rates are rising; where the coupon is recalculated on a quarterly basis and is based on a benchmark, so captures increasing rates. A long term fixed term deposit has neither of these benefits.
RBA statistics show that as at November 2012 there was $538.7bn held in term deposits with banks, excluding Australian and state government and inter-bank deposits, significantly up from $136.4bn in June 2003. If inter-bank deposits, at call and other deposit accounts are included, that figure increases to $1,187.8bn. For more information please see http://www.rba.gov.au/statistics/by-subject.html
51© FIIG Securities Limited
Fixed incom
e products
3
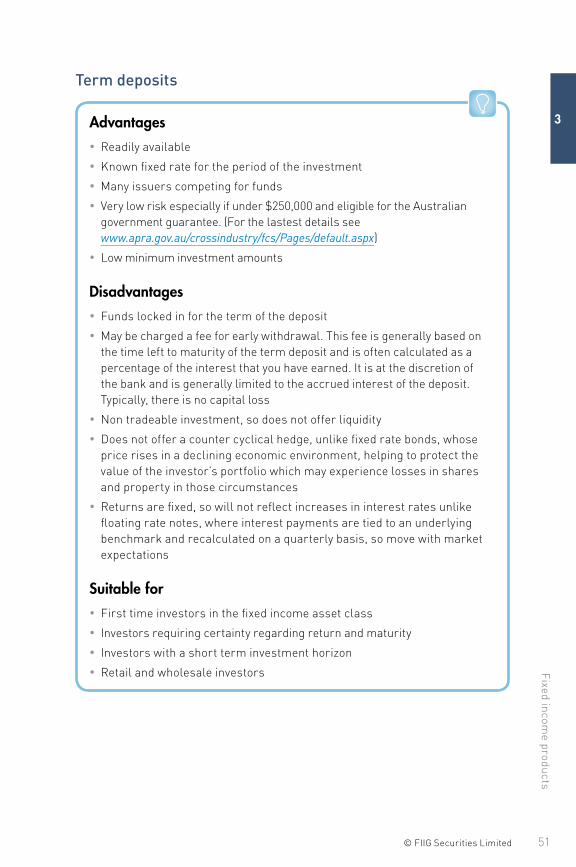
Term deposits
Advantages • Readily available
• Known fixed rate for the period of the investment
• Many issuers competing for funds
• Very low risk especially if under $250,000 and eligible for the Australian government guarantee. (For the lastest details see www.apra.gov.au/crossindustry/fcs/Pages/default.aspx)
• Low minimum investment amounts
Disadvantages • Funds locked in for the term of the deposit
• May be charged a fee for early withdrawal. This fee is generally based on the time left to maturity of the term deposit and is often calculated as a percentage of the interest that you have earned. It is at the discretion of the bank and is generally limited to the accrued interest of the deposit. Typically, there is no capital loss
• Non tradeable investment, so does not offer liquidity
• Does not offer a counter cyclical hedge, unlike fixed rate bonds, whose price rises in a declining economic environment, helping to protect the value of the investor’s portfolio which may experience losses in shares and property in those circumstances
• Returns are fixed, so will not reflect increases in interest rates unlike floating rate notes, where interest payments are tied to an underlying benchmark and recalculated on a quarterly basis, so move with market expectations
Suitable for • First time investors in the fixed income asset class
• Investors requiring certainty regarding return and maturity
• Investors with a short term investment horizon
• Retail and wholesale investors
The Australian G
uide to Fixed Incom
e
52 © FIIG Securities Limited
3
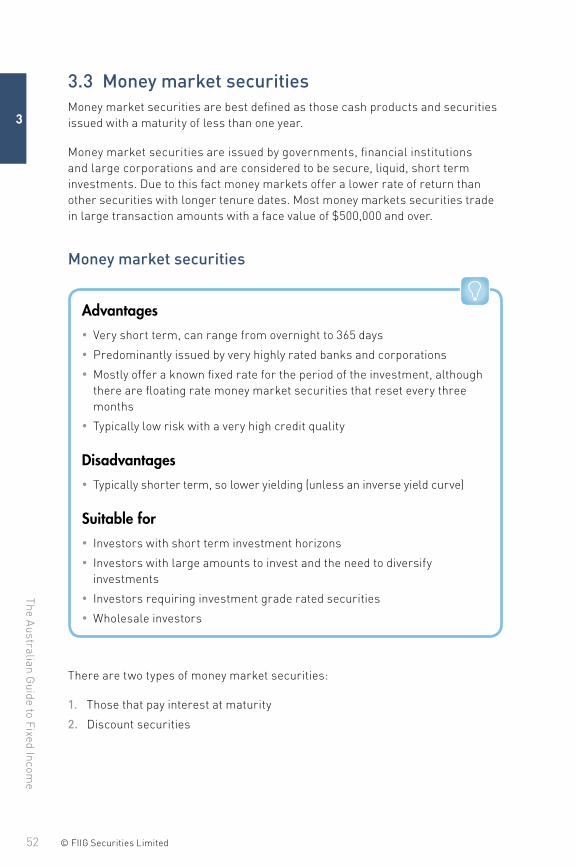
3.3 Money market securitiesMoney market securities are best defined as those cash products and securities issued with a maturity of less than one year.
Money market securities are issued by governments, financial institutions and large corporations and are considered to be secure, liquid, short term investments. Due to this fact money markets offer a lower rate of return than other securities with longer tenure dates. Most money markets securities trade in large transaction amounts with a face value of $500,000 and over.
Money market securities
Advantages • Very short term, can range from overnight to 365 days
• Predominantly issued by very highly rated banks and corporations
• Mostly offer a known fixed rate for the period of the investment, although there are floating rate money market securities that reset every three months
• Typically low risk with a very high credit quality
Disadvantages • Typically shorter term, so lower yielding (unless an inverse yield curve)
Suitable for • Investors with short term investment horizons
• Investors with large amounts to invest and the need to diversify investments
• Investors requiring investment grade rated securities
• Wholesale investors
There are two types of money market securities:
1. Those that pay interest at maturity
2. Discount securities
53© FIIG Securities Limited
Fixed incom
e products
3
3.3.1 Those that pay interest at maturity
3.3.1.1 Cash
When referring to cash we are usually referring to an “At Call” deposit with a bank or a short term deposit up to one week. This may be an ‘11am cash account’, ‘24 hour call deposit’ or a very short term deposit.
An 11am cash account makes funds available for withdrawal on the same day if notification is made prior to 11am. A 24 hour call deposit has its interest rate fixed for the first seven days after which the investor can redeem or either party can renegotiate the interest with 24 hours notice. All of these categories are bundled up and referred to as cash. The interest on cash is generally calculated using a simple interest formula and interest is paid at the end of each month based on daily balances, or at the maturity or withdrawal of the investment.
3.3.2 Discount securitiesThe most common discount securities include treasury notes, bank bills, certificates of deposit (CDs), negotiable certificates of deposit (NCDs) and commercial paper (CP). Discount securities, of which there are a number of types, are negotiable securities issued at a discount to face value.
The term negotiable is used to describe an ability to trade or resell the instrument. Discount securities are issued at a discount to their face value using a discount formula. The full face value of a discount security is paid out on its maturity and the difference between the initial investment and the face value (the discount) is the return to the investor.
If you sell a discount security before the maturity date, you receive the price in the market based on the market yield at the time for the remaining term to maturity. This means that there is potential for a gain or loss. You should compare this with a term deposit where the loss is generally limited to the accrued interest if terminated early. However you will not benefit from the possibility of a capital gain if interest rates fall.
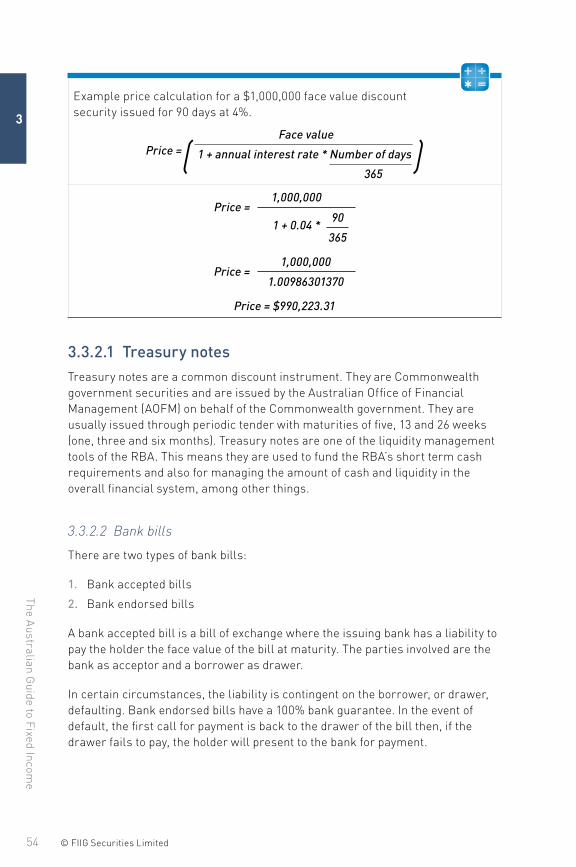
The Australian G
uide to Fixed Incom
e
54 © FIIG Securities Limited
3
Example price calculation for a $1,000,000 face value discount security issued for 90 days at 4%.
Price =( Face value
1 + annual interest rate * Number of days
365 )
1,000,000
1 + 0.04 *
Price =90
365
1,000,000
1.00986301370Price =
Price = $990,223.31
3.3.2.1 Treasury notesTreasury notes are a common discount instrument. They are Commonwealth government securities and are issued by the Australian Office of Financial Management (AOFM) on behalf of the Commonwealth government. They are usually issued through periodic tender with maturities of five, 13 and 26 weeks (one, three and six months). Treasury notes are one of the liquidity management tools of the RBA. This means they are used to fund the RBA’s short term cash requirements and also for managing the amount of cash and liquidity in the overall financial system, among other things.
3.3.2.2 Bank bills
There are two types of bank bills:
1. Bank accepted bills
2. Bank endorsed bills
A bank accepted bill is a bill of exchange where the issuing bank has a liability to pay the holder the face value of the bill at maturity. The parties involved are the bank as acceptor and a borrower as drawer.
In certain circumstances, the liability is contingent on the borrower, or drawer, defaulting. Bank endorsed bills have a 100% bank guarantee. In the event of default, the first call for payment is back to the drawer of the bill then, if the drawer fails to pay, the holder will present to the bank for payment.
55© FIIG Securities Limited
Fixed incom
e products
3
3.3.2.3 Negotiable certificate of deposit (NCD)
A negotiable certificate of deposit is similar to a bank deposit but instead of the ownership being recorded in a deposit account by the bank, the loan is evidenced by a transferable certificate. In practice, a certificate is not issued but rather the holder’s details are maintained on a register. The NCD is negotiable and can be bought and sold during its life while whoever holds the certificate owns the claim on the cashflow at maturity.
The main advantage of NCDs is their relative safety and the ability to know your return ahead of time. Investors generally earn more with a NCD when compared with a savings account depending on the shape of the yield curve (see Section 2.2.2 The yield curve).
These days most NCDs are issued in an electronic format and held in Exigo (previously known as Austraclear); as such they have become Electronic Certificates of Deposit (ECD).
3.3.2.4 Commercial paper (CP) (also known as promissory notes)
“Commercial paper is a short term unsecured discount security issued by corporations and foreign governments. For many large, creditworthy issuers, CP is a low cost alternative to bank loans. Issuers are able to efficiently raise large amounts of funds quickly and without expensive registration by selling paper, either directly or through independent dealers, to a large and varied pool of institutional buyers.”
Source: http://www.asx.com.au/documents/professionals/austraclear_clearing_settlement_industry_glossary.pdf
Maturities on commercial paper are usually no longer than nine months, with maturities of between one and two months being most common in Australia.
Typically only companies with high credit ratings and credit worthiness issue commercial paper. For the most part, CP investments are very safe because the financial situation of a company can be easily predicted over a few months. Over the past 40 years there have only been a handful of cases where corporations have defaulted on their CP obligations.
Commercial paper is usually issued in denominations of $100,000 face value or more.
The Australian G
uide to Fixed Incom
e
56 © FIIG Securities Limited
3
3.4 BondsA bond is a security that pays a defined distribution (the coupon) for a given period of time (the term) and repays the face value of the security at maturity. A bond is a loan from an investor to the issuer of the bond. It is a legally binding agreement and the issuer must pay the investor interest and principal as set out in the bond documentation. In effect the investor acts like the banker (see Figure 3.1). Repayment of interest and principal is guaranteed by the issuer. The only time investors would not receive their expected payments would be if the issuer defaults, which is a precursor to winding up or liquidation. In contrast, equity holders invest funds without any guarantee of dividend payments (as dividends are resolved to be made by the board of the company) or return of investment (in order to recoup capital the investor must sell the shares and the price at that future point in time will be unknown).
Bonds are issued with a coupon rate and yield. The coupon rate does not change for a fixed rate bond during the investment and represents the interest payments that are made during the term of the investment. The yield reflects market rates and the yield at the time that you buy the bond is the actual rate of return you will earn if you hold the bond to maturity. If the coupon rate is higher than the yield, then you will pay more than $100 for a $100 face value bond to reflect that you will be receiving higher coupon payments during the term of the investment. Conversely, if the coupon rate is lower than the yield, then you will pay less than $100 for a $100 face value bond to reflect lower coupon payments during the term of the investment.
Floating rate notes pay a variable coupon rate (see Section 3.4.2 Floating rate notes).
If you sell a bond before maturity then the actual yield of the investment may be higher or lower than the yield at which you purchased the bond to reflect the capital gain/loss that would arise when you sell the bond at the market price (see Appendix 2 Pricing formulae for Commonwealth government securities).
There are many types of bonds including fixed, floating, inflation linked, amortising and annuities. Bonds can be issued as senior secured, senior unsecured and subordinated debt. Each of these three debt classes has varying risk and reward attributes which are also influenced by the issuing entity’s credit worthiness (for a more detailed explanation of levels of debt see Chapter 4 Capital structure). When purchasing bonds, it is very important to understand where the bond sits within the capital structure as it has relevance in relation to risk and reward.
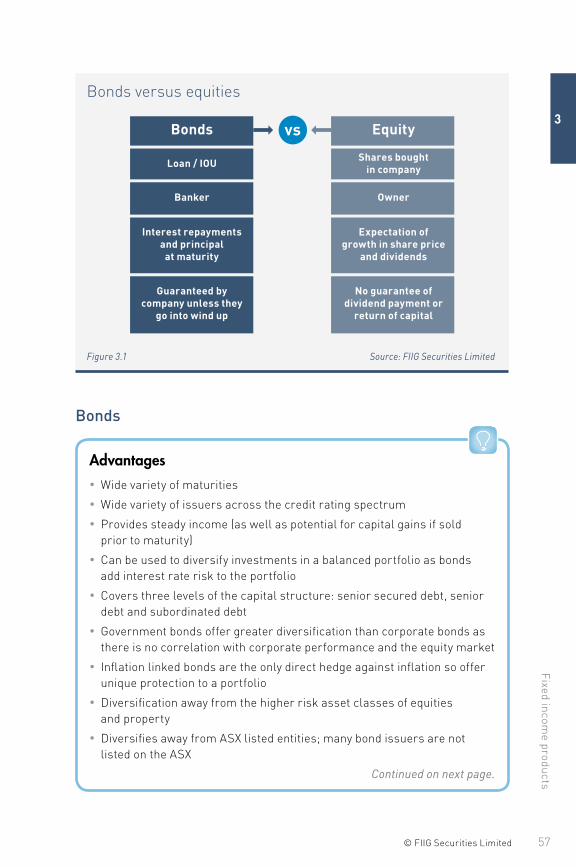
57© FIIG Securities Limited
Fixed incom
e products
3
Bonds versus equities
Bonds
Loan / IOU
Banker
Interest repayments and principal
at maturity
Guaranteed by company unless they
go into wind up
Equity
Shares bought in company
Owner
Expectation of growth in share price
and dividends
No guarantee of dividend payment or
return of capital
vs
Figure 3.1 Source: FIIG Securities Limited
Bonds
Advantages • Wide variety of maturities
• Wide variety of issuers across the credit rating spectrum
• Provides steady income (as well as potential for capital gains if sold prior to maturity)
• Can be used to diversify investments in a balanced portfolio as bonds add interest rate risk to the portfolio
• Covers three levels of the capital structure: senior secured debt, senior debt and subordinated debt
• Government bonds offer greater diversification than corporate bonds as there is no correlation with corporate performance and the equity market
• Inflation linked bonds are the only direct hedge against inflation so offer unique protection to a portfolio
• Diversification away from the higher risk asset classes of equities and property
• Diversifies away from ASX listed entities; many bond issuers are not listed on the ASX
Continued on next page.
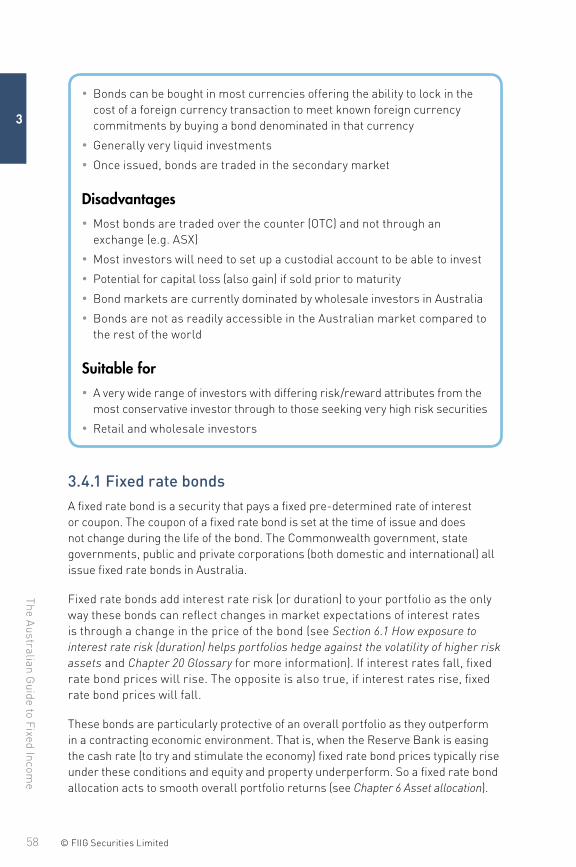
The Australian G
uide to Fixed Incom
e
58 © FIIG Securities Limited
3
• Bonds can be bought in most currencies offering the ability to lock in the cost of a foreign currency transaction to meet known foreign currency commitments by buying a bond denominated in that currency
• Generally very liquid investments
• Once issued, bonds are traded in the secondary market
Disadvantages • Most bonds are traded over the counter (OTC) and not through an exchange (e.g. ASX)
• Most investors will need to set up a custodial account to be able to invest
• Potential for capital loss (also gain) if sold prior to maturity
• Bond markets are currently dominated by wholesale investors in Australia
• Bonds are not as readily accessible in the Australian market compared to the rest of the world
Suitable for • A very wide range of investors with differing risk/reward attributes from the most conservative investor through to those seeking very high risk securities
• Retail and wholesale investors
3.4.1 Fixed rate bonds A fixed rate bond is a security that pays a fixed pre-determined rate of interest or coupon. The coupon of a fixed rate bond is set at the time of issue and does not change during the life of the bond. The Commonwealth government, state governments, public and private corporations (both domestic and international) all issue fixed rate bonds in Australia.
Fixed rate bonds add interest rate risk (or duration) to your portfolio as the only way these bonds can reflect changes in market expectations of interest rates is through a change in the price of the bond (see Section 6.1 How exposure to interest rate risk (duration) helps portfolios hedge against the volatility of higher risk assets and Chapter 20 Glossary for more information). If interest rates fall, fixed rate bond prices will rise. The opposite is also true, if interest rates rise, fixed rate bond prices will fall.
These bonds are particularly protective of an overall portfolio as they outperform in a contracting economic environment. That is, when the Reserve Bank is easing the cash rate (to try and stimulate the economy) fixed rate bond prices typically rise under these conditions and equity and property underperform. So a fixed rate bond allocation acts to smooth overall portfolio returns (see Chapter 6 Asset allocation).
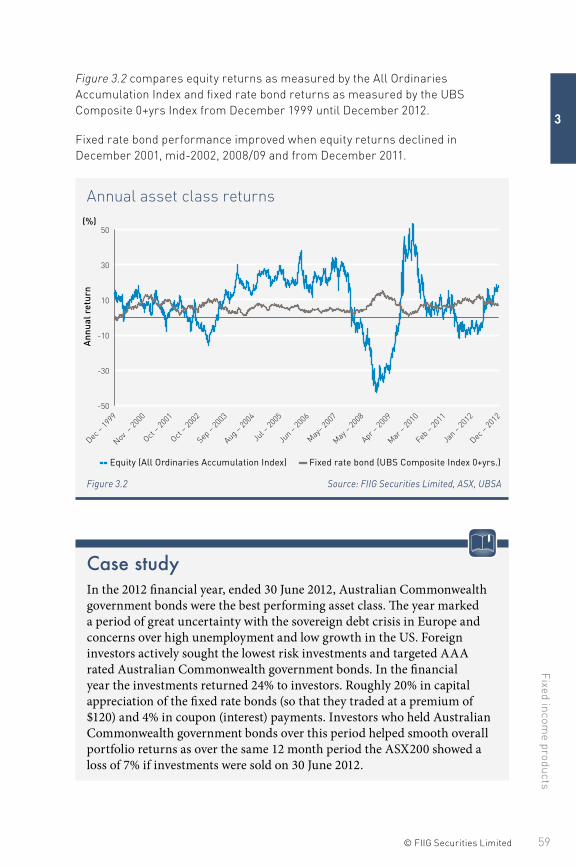
59© FIIG Securities Limited
Fixed incom
e products
3
Figure 3.2 compares equity returns as measured by the All Ordinaries Accumulation Index and fixed rate bond returns as measured by the UBS Composite 0+yrs Index from December 1999 until December 2012.
Fixed rate bond performance improved when equity returns declined in December 2001, mid-2002, 2008/09 and from December 2011.
Annual asset class returns
-50
-30
-10
10
30
50
Ann
ual r
etur
n
Dec –
1999
Nov –
2000
Oct – 2
001
Oct – 2
002
Sep –
2003
Aug – 20
04
Jul –
2005
Jun –
2006
May– 2
007
May –
2008
Apr – 20
09
Mar –
2010
Feb –
2011
Jan –
2012
Dec –
2012
-- Equity (All Ordinaries Accumulation Index) -- Fixed rate bond (UBS Composite Index 0+yrs.)
(%)
Figure 3.2 Source: FIIG Securities Limited, ASX, UBSA
Case studyIn the 2012 financial year, ended 30 June 2012, Australian Commonwealth government bonds were the best performing asset class. The year marked a period of great uncertainty with the sovereign debt crisis in Europe and concerns over high unemployment and low growth in the US. Foreign investors actively sought the lowest risk investments and targeted AAA rated Australian Commonwealth government bonds. In the financial year the investments returned 24% to investors. Roughly 20% in capital appreciation of the fixed rate bonds (so that they traded at a premium of $120) and 4% in coupon (interest) payments. Investors who held Australian Commonwealth government bonds over this period helped smooth overall portfolio returns as over the same 12 month period the ASX200 showed a loss of 7% if investments were sold on 30 June 2012.
The Australian G
uide to Fixed Incom
e
60 © FIIG Securities Limited
3
3.4.2 Floating rate notes (FRN)A floating rate note (FRN) is a security that pays interest or a coupon linked to a variable benchmark. In Australia, most FRNs pay a coupon set at a margin above the bank bill swap rate (BBSW) which is the market benchmark rate for the underlying coupon. The actual coupon for an interest period will be determined at the start of that period by applying the margin to the underlying benchmark on the first day of the coupon period, for example, the three month BBSW. The underlying benchmark rate will rise and fall over time based on prevailing interest rates. The margin over and above the relevant benchmark is usually fixed and will be set at the time of issue.
FRNs, because of the way they are structured, typically protect a portfolio when interest rates are rising. That is, as the Reserve Bank increases the cash rate to try to slow growth in an economy FRN coupons will also increase to reflect market expectations of higher interest rates. Typically FRNs outperform fixed rate investments such as term deposits and fixed rate bonds.
The main issuers of floating rate notes in Australia are domestic and international corporations. The Australian Commonwealth government and states and territories predominantly issue fixed rate bonds, although they also issue inflation linked bonds.
Floating rate notes can also be issued with a step up rate in the event that subordinated debt or hybrids are not called or there is a trigger event such as a rating downgrade (see Chapter 9 Hybrids).
3.4.2.1 Key features of floating rate notes
3.4.2.1.1 Coupon margin
The coupon margin, sometimes known as the issue margin, represents the spread above the variable benchmark (typically 3 month BBSW) paid by the issuer on the FRN. So that if an FRN pays BBSW plus 120 basis points each quarter, then 1.20% (or 120 basis points) is what we refer to as the coupon margin. It is the rate which, when added to the BBSW benchmark, determines the coupon for that period.
3.4.2.1.2 Traded margin (also known as discount margin, credit margin or credit spread)
The traded margin is the margin above the BBSW benchmark rate where the FRN is trading in the secondary market. The traded margin is the effective margin over and above the BBSW benchmark at which an investor purchases an FRN. The secondary market determines the trading margin that is different

61© FIIG Securities Limited
Fixed incom
e products
3
from the coupon margin. The traded margin is the actual effective margin you will receive on that FRN if you buy it at the current price and hold it to maturity. The trading margin is a reflection of the creditworthiness and will rise as perceived credit risk increases and fall as creditworthiness improves, all other things being equal.
3.4.2.1.3 Four factors that cause the price of an FRN to fluctuate
1. Accrued interest: As a note gets closer to the coupon payment date it builds up more accrued interest and its price (all other things being equal) will rise. When the interest is paid the price will fall by the amount of the payment and will again start to accrue interest on a daily basis until it is paid on the next coupon payment date. (The same is true of fixed rate bonds and as the coupon period is generally six months the accrued interest impact can be material).
2. Short term rate movements: Due to the reset mechanism on coupon payment dates, FRNs pay a fixed rate until the next coupon reset date. Therefore an investor is locked in at the current rate until the next reset date.
3. Traded margin: The most important factor that will cause fundamental changes to the price of an FRN is the movement in the traded margin or spread movement. That is the extent to which the traded margin diverges from the coupon margin. It is a reflection of perceived creditworthiness.
4. Long term swap rates: The long term swap rate is used to calculate the present values (PV) of the spread between the trading margin and the issue margin.
3.4.3 Types of bonds
3.4.3.1 Government and semi government bonds
A medium to long term debt security in which either the Commonwealth government (government bond) or one of the state governments or territories (semi government) promises to repay a debt on a certain date (see Chapter 19 Issuers of Australian fixed income securities for a list of government issuers). Government fixed rate bonds have maturities ranging from one year to 25 years while longer dated maturities are available for inflation linked bonds, both of which can be bought and sold in the secondary market. See Figure 3.3 which shows the federal and state government bonds on issue as at 31 December 2012.
3.4.3.2 Eurobonds
A Eurobond is a bond issued by a borrower in a market outside the domicile of the currency of issue. For example, an Australian dollar Eurobond is a bond issued in Australian dollars which is issued and sold outside Australia. There are limitations on the sale of Eurobonds in some jurisdictions.
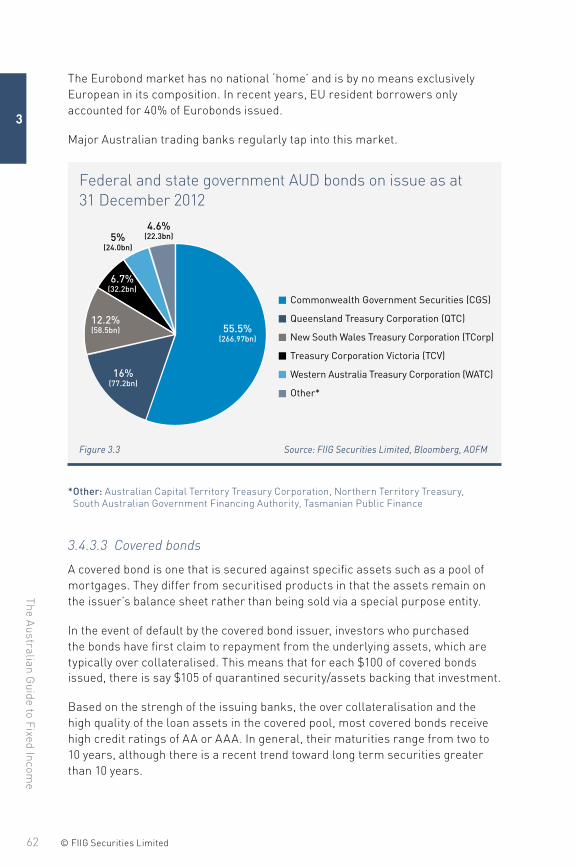
The Australian G
uide to Fixed Incom
e
62 © FIIG Securities Limited
3
The Eurobond market has no national ‘home’ and is by no means exclusively European in its composition. In recent years, EU resident borrowers only accounted for 40% of Eurobonds issued.
Major Australian trading banks regularly tap into this market.
Federal and state government AUD bonds on issue as at 31 December 2012
Commonwealth Government Securities (CGS)
Queensland Treasury Corporation (QTC)
New South Wales Treasury Corporation (TCorp)
Treasury Corporation Victoria (TCV)
Western Australia Treasury Corporation (WATC)
Other*
55.5%(266.97bn)
16%(77.2bn)
12.2%(58.5bn)
6.7%(32.2bn)
5%(24.0bn)
4.6%(22.3bn)
Figure 3.3 Source: FIIG Securities Limited, Bloomberg, AOFM
* Other: Australian Capital Territory Treasury Corporation, Northern Territory Treasury, South Australian Government Financing Authority, Tasmanian Public Finance
3.4.3.3 Covered bonds
A covered bond is one that is secured against specific assets such as a pool of mortgages. They differ from securitised products in that the assets remain on the issuer’s balance sheet rather than being sold via a special purpose entity.
In the event of default by the covered bond issuer, investors who purchased the bonds have first claim to repayment from the underlying assets, which are typically over collateralised. This means that for each $100 of covered bonds issued, there is say $105 of quarantined security/assets backing that investment.
Based on the strengh of the issuing banks, the over collateralisation and the high quality of the loan assets in the covered pool, most covered bonds receive high credit ratings of AA or AAA. In general, their maturities range from two to 10 years, although there is a recent trend toward long term securities greater than 10 years.
63© FIIG Securities Limited
Fixed incom
e products
3
Legislation limits covered bond issuance for Australian banks to 8% of total loans. Assets that can be used to cover the debt include: first mortgages over residential and commercial property, cash, government debt and hedging instruments. The pool limit for government debt can vary. Typically, the residential loan to valuation ratio (LVR) is 80% and commercial loans are 60%.
The asset pool is dynamic, that is if loans default, the issuer must replenish the loan pool, resulting in a very low risk of default by the issuer, hence the high credit rating and the very low probability of default.
3.4.3.4 Inflation linked bonds (ILBs)
There are two major types of inflation linked bonds:
1. Capital indexed bonds (CIBs)
2. Index annuity bonds (IABs)
An ILB is the only security (fixed income or otherwise) that provides a direct hedge against inflation and therefore should feature in most investment portfolios. Major issuance in Australia is through the Commonwealth government and state government programs as well as a number of banks and corporations. The majority of these are structured using the CIB model, however, there are a small number of government and particularly infrastructure private public partnership IABs in existence. For more information, please see Chapter 11 Inflation linked bonds.
3.4.3.4.1 Capital indexed bonds (CIBs)
The indexing of this bond occurs quarterly on the capital or principal amount of the bond, which is repaid at maturity. The indexation factor is usually based on the rate of inflation represented by the Australian Bureau of Statistics’ Consumer Price Index (CPI). Interest is payable, generally quarterly, on the then current indexed capital amount at a fixed coupon rate. As indexation increases the principal value of the security over time, the amount due at maturity becomes greater.
The indexation of outstanding principal is based on lagged movements in the CPI. For example, the indexation of a coupon in November, under the Reserve Bank of Australia formula, is based on the average quarterly increase of the March and June quarters.
During periods of negative inflation the coupon will be paid on a decreasing principal. However, under the terms of bonds issued by the Government to date, the minimum return of the original capital value is guaranteed (see Section 11.4.1 Capital index bond).
The Australian G
uide to Fixed Incom
e
64 © FIIG Securities Limited
3
3.4.3.4.2 Indexed annuity bonds (IABs)
Index annuity bonds (IABs) are a stream of principal and interest payments, so that principal is paid off gradually over the life of the bond. This can be contrasted to CIBs that pay an indexed capital amount at maturity.
Initially marketed as a tax effective ILB, these securities were readily embraced by semi government authorities as an alternative to CIBs for a number of years. Investors appreciated this structure not only for its liability matching capabilities but also for its tax benefits. The 1994 tax amendments, combined with an increased desire on the part of various state governments to reduce debt, have seen IABs fall out of favour with the state government authorities, however infrastructure companies are common issuers (see Section 11.4.2 Indexed annunity bond).
Inflation linked bonds
Advantages • The only investment available that is a direct hedge against inflation
• Very long dated securities (although shorter dated bonds also are available) that can help investors offset inflation linked expenditures with inflation linked income
• Can be very useful investments in a low growth economy given a fixed margin over inflation
• Wide variety of issuers across the credit rating spectrum
• Bonds can still trade at a premium or a discount, so there is an opportunity for capital gain if sold prior to maturity
Disadvantages • Varying liquidity
• Usually traded over the counter and not through an exchange so investors may need to arrange a custodial account
• Potential for capital loss if sold prior to maturity
Suitable for • A very wide range of investors with differing risk/ reward attributes
• Retail and wholesale investors, depending on the relevant bond documentation
65© FIIG Securities Limited
Fixed incom
e products
3
3.4.3.5 Corporate bonds
A corporate bond is simply a bond issued by a company. In Australia, there are some very well known companies that issue bonds such as Origin Energy, Wesfarmers, Telstra and Woolworths (see Chapter 19 Issuers of Australian fixed income securities).
3.4.3.6 Retail bonds
A retail bond is an interest bearing debt security issued by a government or a corporation where the security can be sold to a retail client as defined in the Corporations Act 2001. The bondholder receives a specific amount of interest for a specified time, usually several years, and then receives the face value of the bond on the maturity date.
Retail bonds, listed on the ASX, have re-emerged due to the perceived attractive returns availble and the market being a cheap option for issers. As the equity market experienced severe losses during the 2008/09 economic downturn, the bond market (with its certainty of income and payment of capital at maturity) became more attractive to investors wanting to diversify their portfolio with a more conservative asset allocation.
In 2012, ASX listed retail bonds issued include: NAB and Westpac’s subordinated bonds. These bonds are structured like bank subordinated debt (see Section 4.2.1 Debt - senior secured, senior and subordinated). Heritage Bank issued a listed plain “vanilla” style senior unsecured bond. It means the bond was issued to investors for a set time after which they will be repaid.
A number of corporations issued retail ASX listed hybrids in 2012. The hybrids offered higher rates of return for investors in a low interest rate environment but the terms and the conditions of the hybrids have become increasingly “equity like” with the investor taking on more equity risk, that is, the possibility of loss of income and possible conversion to equity in the case of a wind up (see Chapter 9 Hybrids).
3.4.3.7 Zero coupon bonds
Zero coupon bonds are bonds that do not pay interest during the life of the bond. Instead, investors buy zero coupon bonds at a deep discount from their face value, which is the amount a bond will be worth when it matures. These are not as popular as standard bonds as no interest payments are made during the life of the investment.
The Australian G
uide to Fixed Incom
e
66 © FIIG Securities Limited
3
3.4.3.8 High yield bonds
A bond with a high yield, predominantly due to the issuer’s sub investment grade rating that is anything below BBB- or equivalent credit rating grade. These bonds sometimes known as junk bonds pay relatively high yields, reflective of the high risk involved. For example, in 2012 Greek government sovereign bonds would have been deemed as high yield.
There is no recognised high yield bond market in Australia.
3.5 HybridsHybrids are a broad classification for a group of securities that combine both debt and equity characteristics. They are used by a variety of companies to raise money. Hybrid securities pay a pre-determined (fixed or floating) rate of return or distribution until a certain date. At that date, the issuer may have a number of options including converting the securities into the underlying ordinary shares, redeeming for cash or leaving outstanding. Therefore, unlike a share, the holder has a “known” cashflow and, unlike a fixed interest security, there may be an option to convert to the underlying equity.
This may allow the issuer to classify the issue as equity for credit rating agency or regulatory purposes but also claim tax benefits of issuing debt (see Chapter 9 Hybrids).
Common hybrid examples include mandatory convertible and converting preference shares. It is important to note that every hybrid security is structured differently which allows more flexibility as some securities behave more like fixed income securities whilst others behave more like the underlying shares into which they convert.
To be regarded as equity, hybrids must be perpetual in nature, that is, have no maturity date or have a very long maturity date. So while many such securities have clauses whereby they can be redeemed at the issuer’s, not the investor’s, option, the maturity date is not set and depends on both the issuer’s ability to refinance and regulatory requirements at the time.
Perpetual hybrids have specific characteristics that set them apart from being valued purely as an equity security:
• hybrids typically rank higher in liquidation and priority of payment of dividends than ordinary equity (shares)
• the coupons (if paid) are pre-determined (although discretionary) as either a fixed rate or a margin over BBSW unlike ordinary share dividends where payments can vary significantly
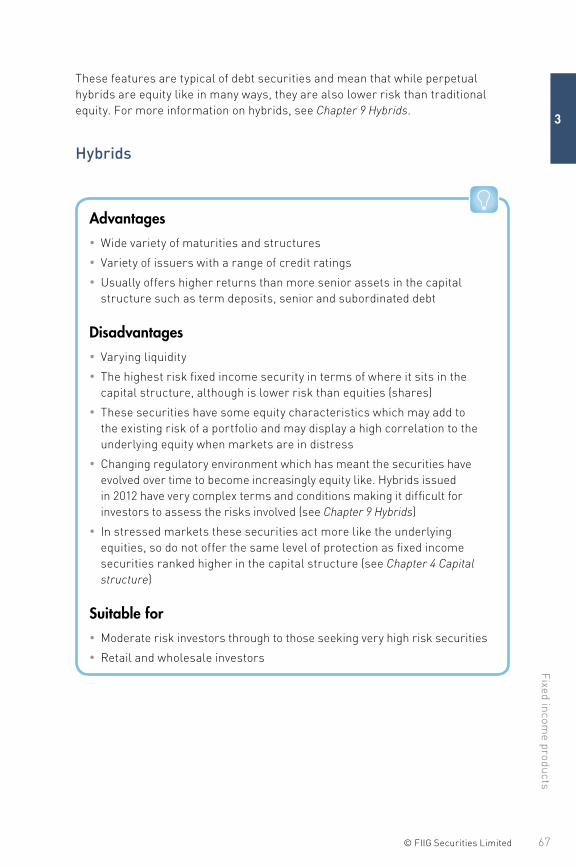
67© FIIG Securities Limited
Fixed incom
e products
3
These features are typical of debt securities and mean that while perpetual hybrids are equity like in many ways, they are also lower risk than traditional equity. For more information on hybrids, see Chapter 9 Hybrids.
Hybrids
Advantages • Wide variety of maturities and structures
• Variety of issuers with a range of credit ratings
• Usually offers higher returns than more senior assets in the capital structure such as term deposits, senior and subordinated debt
Disadvantages • Varying liquidity
• The highest risk fixed income security in terms of where it sits in the capital structure, although is lower risk than equities (shares)
• These securities have some equity characteristics which may add to the existing risk of a portfolio and may display a high correlation to the underlying equity when markets are in distress
• Changing regulatory environment which has meant the securities have evolved over time to become increasingly equity like. Hybrids issued in 2012 have very complex terms and conditions making it difficult for investors to assess the risks involved (see Chapter 9 Hybrids)
• In stressed markets these securities act more like the underlying equities, so do not offer the same level of protection as fixed income securities ranked higher in the capital structure (see Chapter 4 Capital structure)
Suitable for • Moderate risk investors through to those seeking very high risk securities
• Retail and wholesale investors
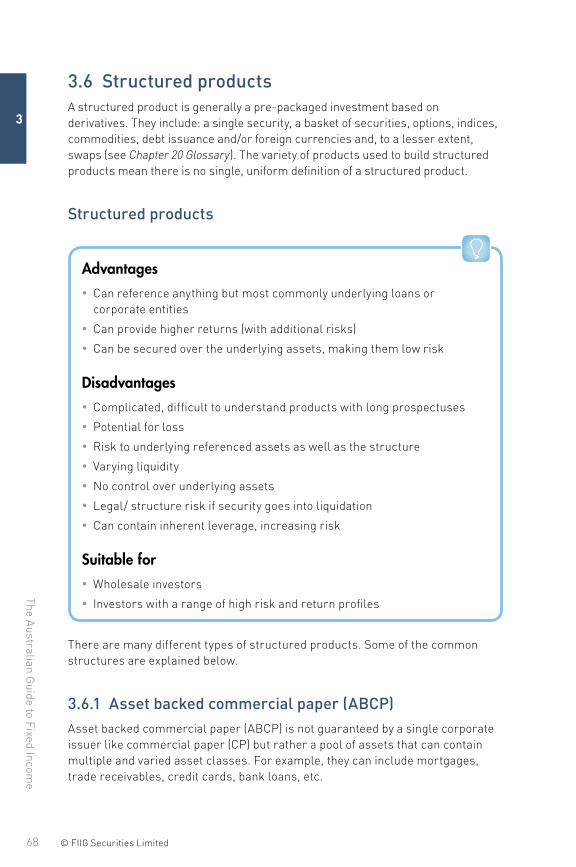
The Australian G
uide to Fixed Incom
e
68 © FIIG Securities Limited
3
3.6 Structured productsA structured product is generally a pre-packaged investment based on derivatives. They include: a single security, a basket of securities, options, indices, commodities, debt issuance and/or foreign currencies and, to a lesser extent, swaps (see Chapter 20 Glossary). The variety of products used to build structured products mean there is no single, uniform definition of a structured product.
Structured products
Advantages • Can reference anything but most commonly underlying loans or corporate entities
• Can provide higher returns (with additional risks)
• Can be secured over the underlying assets, making them low risk
Disadvantages • Complicated, difficult to understand products with long prospectuses
• Potential for loss
• Risk to underlying referenced assets as well as the structure
• Varying liquidity
• No control over underlying assets
• Legal/ structure risk if security goes into liquidation
• Can contain inherent leverage, increasing risk
Suitable for • Wholesale investors
• Investors with a range of high risk and return profiles
There are many different types of structured products. Some of the common structures are explained below.
3.6.1 Asset backed commercial paper (ABCP)Asset backed commercial paper (ABCP) is not guaranteed by a single corporate issuer like commercial paper (CP) but rather a pool of assets that can contain multiple and varied asset classes. For example, they can include mortgages, trade receivables, credit cards, bank loans, etc.
69© FIIG Securities Limited
Fixed incom
e products
3
The assets are typically contained in a special purpose vehicle (SPV) with issue specific credit enhancement. A liquidity support facility (like an overdraft) from a highly rated bank may also be provided to smooth any cash requirements.
The support lent to the ABCP programs typically aids credit ratings. A high credit rating will enhance the ABCP program and reduce the cost paid by the SPV to investors.
Unlike stand alone term securitisations, in a typical ABCP the issuer pays down maturing obligations with the proceeds of newly issued ABCP. Simultaneously the proceeds of collections from matured receivables are reinvested in newly generated receivables.
ABCP issuers can be classified according to involvement of single or multiple sellers. Single seller programs are established to benefit an individual asset originator by providing a way to finance its receivables pool. Multi seller programs acquire receivables from numerous asset originators and are typically sponsored by large commercial banks.
3.6.2 Asset backed securities (ABS)An ABS is a type of debt security based on a pool of underlying assets or collateralised by the cashflows from a specific pool of underlying assets. The asset pools can be constructed from many types of receivables including (but not limited to) credit card payments, auto loans and mortgages. Typically the underlying assets are illiquid and private in nature, but by combining them into a large and diversified pool and segmenting the securities into tranches they become marketable securities (see Chapter 20 Glossary).
The most common type of ABS is a residential mortgage backed security (RMBS). To learn more about RBMS see Chapter 12 Residential mortgage backed securities.
3.6.3 Collateralised debt obligations (CDOs)CDOs are normally floating rate structured debt securities that pay a higher return compared to similarly rated securities, in exchange for a higher risk profile. The tenor of CDO securities typically ranges from three to seven years.
They are complex structured products typically arranged by investment banks with a range of tranches that are independently rated by credit rating agencies. The performance of an investment in a CDO security is linked to the credit risk of an underlying portfolio of company debt or other securities. The degree to which exposure to this portfolio is leveraged, is determined by the subordination of the investment in the structure of the CDO amongst other things. If only a few of the underlying portfolios of securities default over the life of the CDO, investors will

The Australian G
uide to Fixed Incom
e
70 © FIIG Securities Limited
3
receive their capital back in full. If more than a handful default, investors’ capital may be at risk. The more companies that default, the greater the probability of investors losing capital.
Synthetic CDOs reference a portfolio of credit default swaps (i.e. synthetic credit exposure) as opposed to investing in corporate bonds. Instead of acquiring the physical portfolio of assets, credit default swaps are used to create a synthetic portfolio of assets and the investors’ cash is “parked” in highly rated (typically AAA rated) collateral.
There have been no CDOs issued since the onset of the GFC in 2008.
71© FIIG Securities Limited
Investors must be aware of where investments rank in the capital structure of a company to ensure that they know the level of risk of those investments and that they are earning appropriate returns.
Debt with higher risk should carry greater reward over lower risk or “more senior” instruments. Even more so for equities (shares) and property.
Investors understand the need to compare credit worthiness across alternative bonds, most commonly summarised by the credit rating assigned by Standard and Poor’s, Moody’s and/or Fitch. Generally speaking the lower the credit rating, the higher the risk and thus the higher the required return.
Extending the above concept, investors need to know where an investment ranks within an individual company’s capital structure. It is not uncommon for there to be six or so notches (ratings) difference between the credit rating of a bank or insurance company’s senior secured debt and the rating assigned to lower ranking Tier 1 instruments such as preference shares. Equity, which is never rated, is by default always the riskiest investment level in any given company.
Capital structure can be a complex issue, particularly for banks who must meet strict standards set by sovereign regulators. Further, while international guidelines are issued and banks often report under similar terms (for example Tier 1 capital) calculations vary by country.
4.1 FundingCompanies use many methods to fund their operations. Each method carries advantages and disadvantages to the company and the investor. This section seeks to identify, describe and outline each method, providing a guide to potential investors as to which investments would best suit their needs.
Basically, there are two forms of funding: debt and equity. Some of the key differences between debt and equity relate to risk and reward. From an investor’s point of view ordinary shares are riskier than debt (due to greater
Chapter 4.
Capital structure
The Australian G
uide to Fixed Incom
e
72 © FIIG Securities Limited
4
volatility, uncertainty of dividends and lowest repayment ranking in the case of liquidation) however the returns through dividends and capital gains are expected to be higher over the long term. This is not always the case.
From a company’s point of view, the reverse is true. Debt is often cheaper than equity partly because interest is tax deductible but it also comes with greater obligations due to the legal requirement for timely payment of interest and principal, versus equity which has no repayment date (i.e. is perpetual) and no legal requirement to pay dividends.
Decisions about funding are complex. Some structures are defensive and aim to limit the number of shareholders and the value of stock. Companies in several industries can sustain high levels of debt, for example regulated infrastructure companies, given the very stable nature of their business, while others involved in very cyclical industries may prefer lower debt levels and an overall higher level of equity. Banks and other financial institutions are subject to complex regulatory requirements. Below is a general discussion of capital structure.
4.2 Capital structure levelsFigure 4.1 describes the capital structure of a typical company from lowest to highest risk. A number of key principles of the capital structure are outlined in Figure 4.1:
1. Risk – ranging from senior secured debt as the least risky to equities (shares) as the riskiest.
2. Priority of payment in the case of liquidation – with senior secured debt to be paid out in full first, then all subordinated debt (senior then subordinated debt), then all hybrid debt and if any funds remain equity holders share the balance.
3. Application of losses – with equities to bear the first loss and the security of senior debtholders’ investments only threatened once all other junior capital sources have been exhausted.
4. In accordance with risk, the expected long term return should increase as you move down the capital structure.
A bank capital structure is significantly more complicated, due to the complex and authoritative standards imposed by sovereign regulators such as the Australian Prudential Regulation Authority (APRA – see Chapter 8 Regulators of the Australian fixed income market). Generally, bank capital structure includes deposits, which depending on the country of origin, can rank above debt, making them a very low risk investment. The least risky investment in a bank capital structure is covered bonds which are secured over a pool of mortgages.
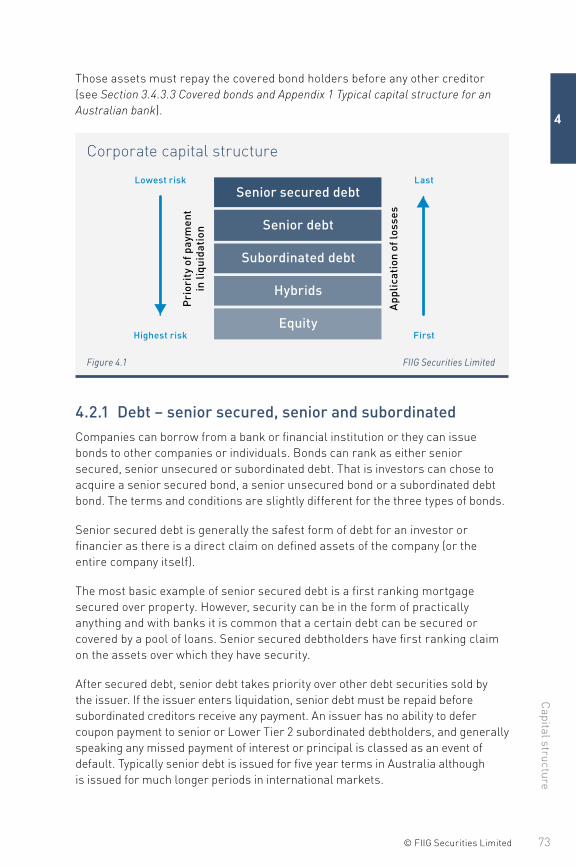
73© FIIG Securities Limited
Capital structure
4
Those assets must repay the covered bond holders before any other creditor (see Section 3.4.3.3 Covered bonds and Appendix 1 Typical capital structure for an Australian bank).
Corporate capital structure
Pri
orit
y of
pay
men
t in
liqu
idat
ion
App
lica
tion
of l
osse
s
Highest risk
Lowest risk
First
LastSenior secured debt
Senior debt
Subordinated debt
Hybrids
Equity
Figure 4.1 FIIG Securities Limited
4.2.1 Debt – senior secured, senior and subordinatedCompanies can borrow from a bank or financial institution or they can issue bonds to other companies or individuals. Bonds can rank as either senior secured, senior unsecured or subordinated debt. That is investors can chose to acquire a senior secured bond, a senior unsecured bond or a subordinated debt bond. The terms and conditions are slightly different for the three types of bonds.
Senior secured debt is generally the safest form of debt for an investor or financier as there is a direct claim on defined assets of the company (or the entire company itself).
The most basic example of senior secured debt is a first ranking mortgage secured over property. However, security can be in the form of practically anything and with banks it is common that a certain debt can be secured or covered by a pool of loans. Senior secured debtholders have first ranking claim on the assets over which they have security.
After secured debt, senior debt takes priority over other debt securities sold by the issuer. If the issuer enters liquidation, senior debt must be repaid before subordinated creditors receive any payment. An issuer has no ability to defer coupon payment to senior or Lower Tier 2 subordinated debtholders, and generally speaking any missed payment of interest or principal is classed as an event of default. Typically senior debt is issued for five year terms in Australia although is issued for much longer periods in international markets.
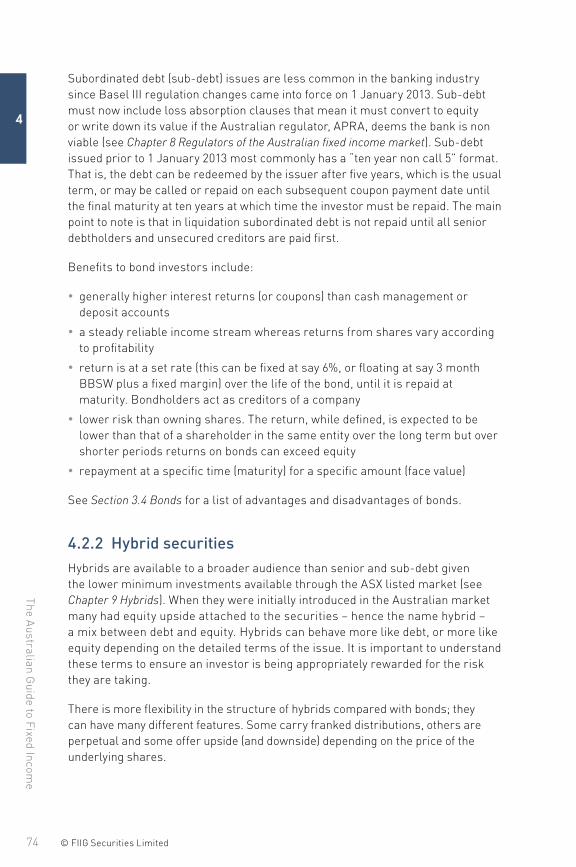
The Australian G
uide to Fixed Incom
e
74 © FIIG Securities Limited
4
Subordinated debt (sub-debt) issues are less common in the banking industry since Basel III regulation changes came into force on 1 January 2013. Sub-debt must now include loss absorption clauses that mean it must convert to equity or write down its value if the Australian regulator, APRA, deems the bank is non viable (see Chapter 8 Regulators of the Australian fixed income market). Sub-debt issued prior to 1 January 2013 most commonly has a “ten year non call 5” format. That is, the debt can be redeemed by the issuer after five years, which is the usual term, or may be called or repaid on each subsequent coupon payment date until the final maturity at ten years at which time the investor must be repaid. The main point to note is that in liquidation subordinated debt is not repaid until all senior debtholders and unsecured creditors are paid first.
Benefits to bond investors include:
• generally higher interest returns (or coupons) than cash management or deposit accounts
• a steady reliable income stream whereas returns from shares vary according to profitability
• return is at a set rate (this can be fixed at say 6%, or floating at say 3 month BBSW plus a fixed margin) over the life of the bond, until it is repaid at maturity. Bondholders act as creditors of a company
• lower risk than owning shares. The return, while defined, is expected to be lower than that of a shareholder in the same entity over the long term but over shorter periods returns on bonds can exceed equity
• repayment at a specific time (maturity) for a specific amount (face value)
See Section 3.4 Bonds for a list of advantages and disadvantages of bonds.
4.2.2 Hybrid securitiesHybrids are available to a broader audience than senior and sub-debt given the lower minimum investments available through the ASX listed market (see Chapter 9 Hybrids). When they were initially introduced in the Australian market many had equity upside attached to the securities – hence the name hybrid – a mix between debt and equity. Hybrids can behave more like debt, or more like equity depending on the detailed terms of the issue. It is important to understand these terms to ensure an investor is being appropriately rewarded for the risk they are taking.
There is more flexibility in the structure of hybrids compared with bonds; they can have many different features. Some carry franked distributions, others are perpetual and some offer upside (and downside) depending on the price of the underlying shares.
75© FIIG Securities Limited
Capital structure
4
Hybrids can be attractive because they provide retail investors with the opportunity to access a corporate credit exposure offering higher returns than most other fixed income products. However, as noted above, understanding the risks specific to each hybrid issue is important. Unlike most fixed income products, hybrids are issued both in the over the counter (OTC) market and listed on the ASX under a prospectus. The ability to trade on the ASX has increased the appeal of these investments to retail investors.
These features are countered by the fact that hybrids carry the highest risk of all of the above mentioned debt securities, as they sit below them in the capital structure; although they still rank ahead of equity. The other key difference between hybrids and the higher ranking senior and subordinated debt is that interest payments on hybrids can be deferred or in some cases missed completely. Deferring or missing an interest payment would in most cases not be considered a default by the company, so hybrid investors are often less protected than investors in other fixed income products.
For greater detail on hybrid securities, and a list of advantages and disadvantages see Chapter 9 Hybrids.
4.2.3 EquityA company issues shares to investors, who then own a percentage of the company. Shareholders generally have the right to vote at annual meetings to appoint directors and on issues that affect the ongoing management of the company. Ordinary shares have no maturity and are held until the investor decides to sell via an exchange like the ASX. A shareholder would expect to receive dividends, which are paid at the discretion of the board and at a level which is also dependent on board approval.
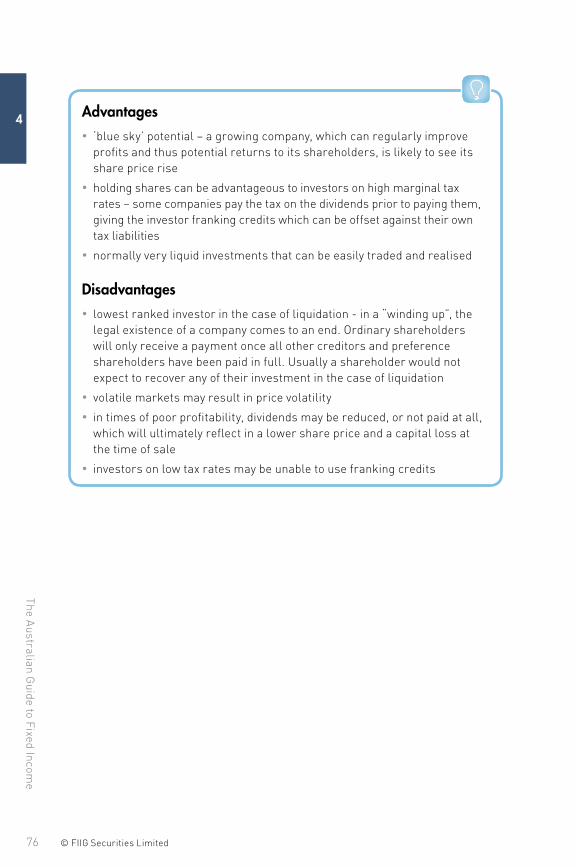
The Australian G
uide to Fixed Incom
e
76 © FIIG Securities Limited
4 Advantages • ‘blue sky’ potential – a growing company, which can regularly improve profits and thus potential returns to its shareholders, is likely to see its share price rise
• holding shares can be advantageous to investors on high marginal tax rates – some companies pay the tax on the dividends prior to paying them, giving the investor franking credits which can be offset against their own tax liabilities
• normally very liquid investments that can be easily traded and realised
Disadvantages • lowest ranked investor in the case of liquidation - in a “winding up”, the legal existence of a company comes to an end. Ordinary shareholders will only receive a payment once all other creditors and preference shareholders have been paid in full. Usually a shareholder would not expect to recover any of their investment in the case of liquidation
• volatile markets may result in price volatility
• in times of poor profitability, dividends may be reduced, or not paid at all, which will ultimately reflect in a lower share price and a capital loss at the time of sale
• investors on low tax rates may be unable to use franking credits
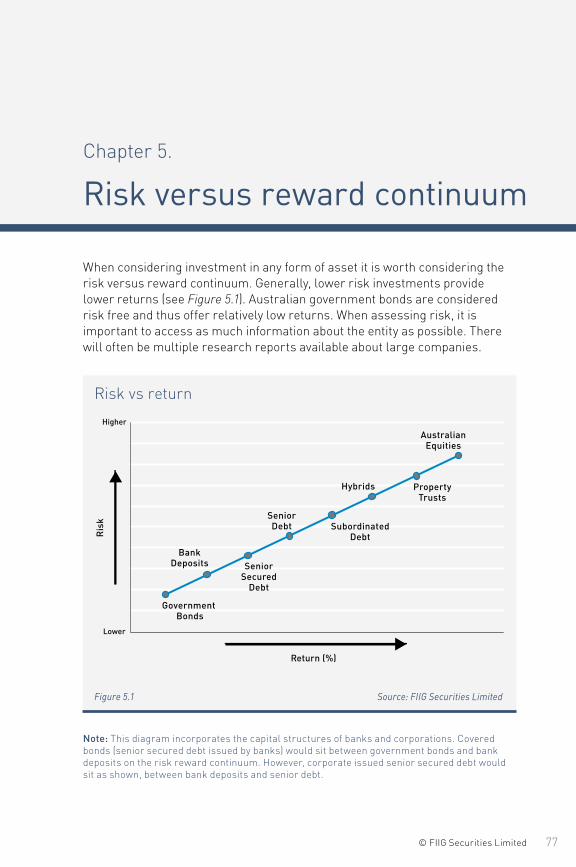
77© FIIG Securities Limited
Chapter 5.
Risk versus reward continuum
When considering investment in any form of asset it is worth considering the risk versus reward continuum. Generally, lower risk investments provide lower returns (see Figure 5.1). Australian government bonds are considered risk free and thus offer relatively low returns. When assessing risk, it is important to access as much information about the entity as possible. There will often be multiple research reports available about large companies.
Risk vs return
Lower
Higher
Ris
k
Bank Deposits Senior
SecuredDebt
Senior Debt Subordinated
Debt
Hybrids Property Trusts
Australian Equities
Government Bonds
Return (%)
Figure 5.1 Source: FIIG Securities Limited
Note: This diagram incorporates the capital structures of banks and corporations. Covered bonds (senior secured debt issued by banks) would sit between government bonds and bank deposits on the risk reward continuum. However, corporate issued senior secured debt would sit as shown, between bank deposits and senior debt.
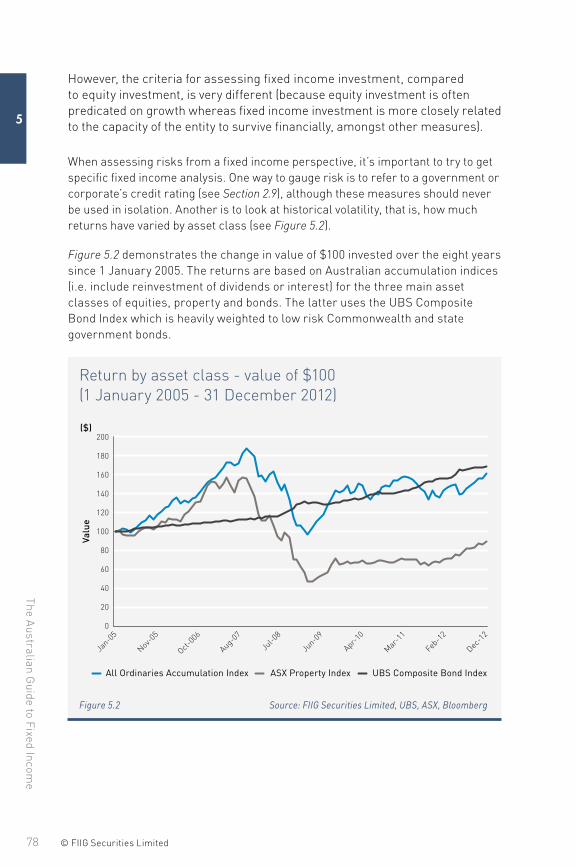
The Australian G
uide to Fixed Incom
e
78 © FIIG Securities Limited
5
However, the criteria for assessing fixed income investment, compared to equity investment, is very different (because equity investment is often predicated on growth whereas fixed income investment is more closely related to the capacity of the entity to survive financially, amongst other measures).
When assessing risks from a fixed income perspective, it’s important to try to get specific fixed income analysis. One way to gauge risk is to refer to a government or corporate’s credit rating (see Section 2.9), although these measures should never be used in isolation. Another is to look at historical volatility, that is, how much returns have varied by asset class (see Figure 5.2).
Figure 5.2 demonstrates the change in value of $100 invested over the eight years since 1 January 2005. The returns are based on Australian accumulation indices (i.e. include reinvestment of dividends or interest) for the three main asset classes of equities, property and bonds. The latter uses the UBS Composite Bond Index which is heavily weighted to low risk Commonwealth and state government bonds.
Return by asset class - value of $100 (1 January 2005 - 31 December 2012)
Valu
e
Jan-0
5
Nov-0
5
Oct-00
6
Aug-07
Jul-0
8
Jun-0
9
Apr-10
Mar-1
1
Feb-1
2
Dec-1
2
All Ordinaries Accumulation Index ASX Property Index UBS Composite Bond Index
0
20
40
60
80
100
120
140
160
180
200($)
Figure 5.2 Source: FIIG Securities Limited, UBS, ASX, Bloomberg
79© FIIG Securities Limited
Risk versus rew
ard continuum
5
The Bond Index demonstrates a steady upward appreciation with little volatility. However the equity and listed property indices show significant fluctuation and volatility over the same period emphasising the need for high returns to compensate for periods of poor performance.
Risk means different things to different investors. To some it means uncertainty or possible volatility in returns; to others it reflects the possibility or chance of losing money or unwinding a position at a loss. There are many risks, some of the more common ones are:
1. Interest rate risk – the risk associated with an interest bearing asset, such as a loan or a bond, due to variability of interest rates. This predominately affects fixed rate bonds (see Section 3.4.1 Fixed rate bonds).
2. Call risk – the risk faced by the holder of a callable bond that a bond issuer will not call the bond at the first opportunity and thereby extend maturity which would likely see the value of the bond fall on the secondary market (see Chapter 9 Hybrids).
3. Early redemption risk – the risk faced by the holder of a callable bond that a bond issuer will redeem the issue prior to maturity. This means the bondholder will receive payment on the value of the bond (typically at par) even if the bond was trading at a premium. In good economic times, there is also reinvestment risk that the investor may be reinvesting in a less favourable environment (one with a lower interest rate).
4. Credit or default risk – the risk that the issuer may be unable to meet the interest and/or principal repayments when due, and thus default on the loan. Generally, the higher the credit risk of the issuer, the higher the interest rate that investors expect in return.
5. Liquidity risk – the risk that a security cannot be easily sold at, or close to, its market value.
6. Exchange or currency risk – arises from moves in foreign currency rates. Can be divided into transaction risk where currency fluctuations impact the proceeds of specific transactions and translation risk which affects the value of assets and liabilities on the balance sheet.
7. Political or country risk – the risk of loss when investing in a given country caused by changes in a country’s political structure or policies such as tax laws, tariffs, expropriation of assets, or restrictions on repatriation of profits. Since the GFC, political and sovereign risk have been high. Sovereign risk is essentially the credit or default risk of a country but also results in heightened risk of political and regulatory changes.
8. Regulatory risk – the risk of regulatory changes on a business or industry. This is particularly relevant for financial institutions such as banks and insurers as regulatory changes may have material changes on the value and call risk of regulatory capital securities such as subordinated Tier 2 and hybrid Tier 1 securities.
The Australian G
uide to Fixed Incom
e
80 © FIIG Securities Limited
5
9. Event risk – risk due to unforeseen events, for example a company making a large acquisition.
An investor would expect the lowest return from senior debt and a higher return from Tier 1 hybrid securities. They would expect an even higher return from ordinary shares (known as equity) as they rank the highest in terms of risk (see Chapter 4 Capital structure). In volatile markets returns can be skewed and offer opportunities for higher rewards from lower risk assets. For example, if returns on subordinated debt are higher than Tier 1 hybrid securities in the same company, the market is distorted and the investor has an opportunity to take advantage of higher returns for lower risk.
It is important for investors to understand where their investments sit in the capital structure as this directly correlates to the risk involved. Investors should frequently reassess the return they are receiving and whether this is sufficient given ever-changing market expectations of credit risk, call risk and interest rates. Moreover, they should ensure that the additional return for moving down the capital structure compensates for any additional risk.
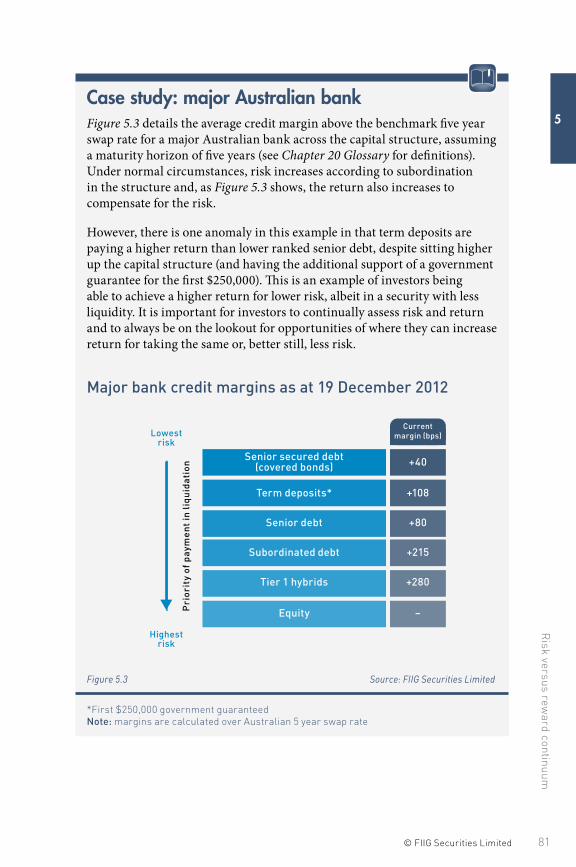
81© FIIG Securities Limited
Risk versus rew
ard continuum
5Case study: major Australian bankFigure 5.3 details the average credit margin above the benchmark five year swap rate for a major Australian bank across the capital structure, assuming a maturity horizon of five years (see Chapter 20 Glossary for definitions). Under normal circumstances, risk increases according to subordination in the structure and, as Figure 5.3 shows, the return also increases to compensate for the risk.
However, there is one anomaly in this example in that term deposits are paying a higher return than lower ranked senior debt, despite sitting higher up the capital structure (and having the additional support of a government guarantee for the first $250,000). This is an example of investors being able to achieve a higher return for lower risk, albeit in a security with less liquidity. It is important for investors to continually assess risk and return and to always be on the lookout for opportunities of where they can increase return for taking the same or, better still, less risk.
Major bank credit margins as at 19 December 2012
Pri
orit
y of
pay
men
t in
liq
uid
atio
n
Lowest risk
Highest risk
Senior secured debt (covered bonds) +40
+108
+80
+215
+280
–
Term deposits*
Senior debt
Subordinated debt
Tier 1 hybrids
Equity
Currentmargin (bps)
Figure 5.3 Source: FIIG Securities Limited
*First $250,000 government guaranteed Note: margins are calculated over Australian 5 year swap rate
83© FIIG Securities Limited
Chapter 6.
Asset allocation
Asset allocation involves constructing an investment portfolio with different asset classes such as cash, fixed income, residential and commercial property and domestic and international equities. Diversification between asset classes protects against significant loss from any one asset class.
Asset allocation depends on an investor’s ultimate goals and objectives. Financial markets are cyclical and there will be highs and lows. Typically younger investors want and can afford higher risk as they have longer to rebuild their portfolios after a cyclical low or recession. Investors who have specific requirements for a project, or retirement, should move to a lower risk portfolio to ensure capital preservation. Growth and higher returns, while attractive, are higher risk and expose portfolios to losses that may not be recoverable within the timeframe of the investment plan.
Ultimately allocations to different asset classes help diversify portfolios and assist investors meet their requirements. It is critical to understand asset class allocation to assess the appropriateness of a portfolio. Time to maturity also plays a part in assessment of risk. Assets that are long dated (this includes equity and property which have no fixed maturity or term) are much higher risk given that uncertainty increases with time.
The Organisation for Economic Co-operation and Development (OECD) publishes an annual review of trends in the financial performance of pension funds (by country), including their asset allocation. The paper published on 9 September 2012 indicated that Australia had the second lowest allocation to “bills and bonds” at 9% and the highest allocation to shares at 49.7% (see Figure 6.1). The average bond and bill allocation from the 29 member countries shown in Figure 6.1 was 53.2%, significantly higher than the 9% held by Australian pension and superannuation funds.
Two key determinants in assessing fixed income allocation are duration and credit (see Section 2.6 Duration and 6.1 How exposure to interest rate risk (duration) helps portfolios hedge against the volatility of higher risk assets).
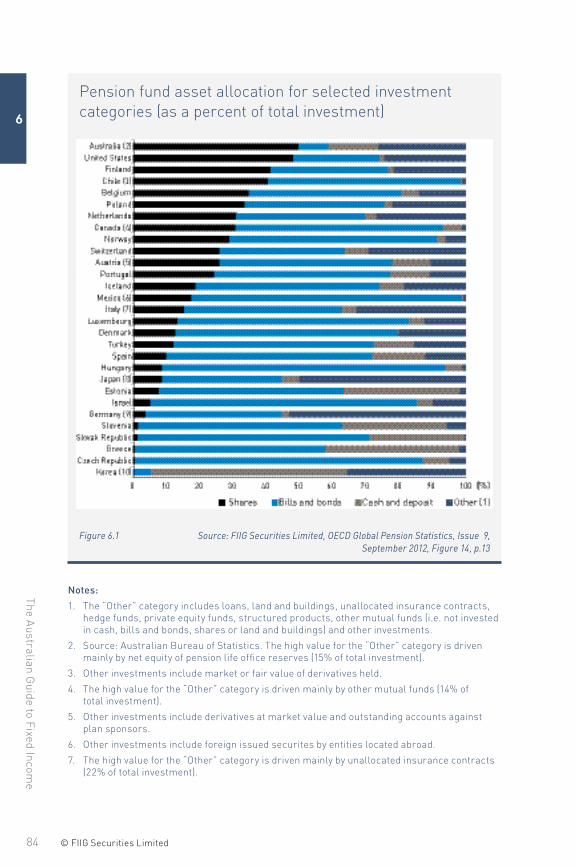
The Australian G
uide to Fixed Incom
e
84 © FIIG Securities Limited
6
Pension fund asset allocation for selected investment categories (as a percent of total investment)
Figure 6.1 Source: FIIG Securities Limited, OECD Global Pension Statistics, Issue 9, September 2012, Figure 14, p.13
Notes:
1. The “Other” category includes loans, land and buildings, unallocated insurance contracts, hedge funds, private equity funds, structured products, other mutual funds (i.e. not invested in cash, bills and bonds, shares or land and buildings) and other investments.
2. Source: Australian Bureau of Statistics. The high value for the “Other” category is driven mainly by net equity of pension life office reserves (15% of total investment).
3. Other investments include market or fair value of derivatives held.
4. The high value for the “Other” category is driven mainly by other mutual funds (14% of total investment).
5. Other investments include derivatives at market value and outstanding accounts against plan sponsors.
6. Other investments include foreign issued securites by entities located abroad.
7. The high value for the “Other” category is driven mainly by unallocated insurance contracts (22% of total investment).
85© FIIG Securities Limited
Asset allocation
6
8. Source: Bank of Japan. The high value for the “Other” category is driven mainly by accounts payable and receivable (25% of total investment) and outward investments in securities (20% of total investment).
9. The high value for the “Other” category is driven mainly by other mutual funds (18% of total investment).
10. The high value for the “Other” category is driven mainly by unallocated insurance contracts (31% of total investment).
6.1 How exposure to interest rate risk (duration) helps portfolios hedge against the volatility of higher risk assets Investors should have an exposure to interest rates in their portfolio through an allocation to fixed rate bonds. Fixed rate bonds pay a fixed coupon payment (interest) for the life of the bond. The only way these bonds can reflect market changes in required returns is through their price. So the price will fluctuate over the life of a bond. The following discussion centres on using fixed rate bonds and understanding their duration (see Section 2.6 Duration and Chapter 20 Glossary) to smooth returns, reduce volatility and increase certainty in uncertain economic times.
Buying longer duration fixed income investments (fixed rate securities with a longer term to maturity) when interest rates are high means that investors can benefit when interest rates fall. This outcome is usually associated with a slowdown in the underlying economy, which in turn usually results in underperformance from higher risk assets such as equities.
At the low point in the economic cycle, longer duration fixed income assets can be sold at a profit (their prices will rise as yields fall (see Section 2.5 How changing interest rates impact bond prices) which provides investors with a more balanced return on the overall portfolio by offsetting losses on other, more risky, assets. Alternatively, investors can benefit from the higher cashflow or running yield whilst underlying interest rates remain low. Over time, the overall duration of a portfolio will reduce, so duration needs to be monitored to ensure that it remains adequate to offset volatility from higher risk assets.
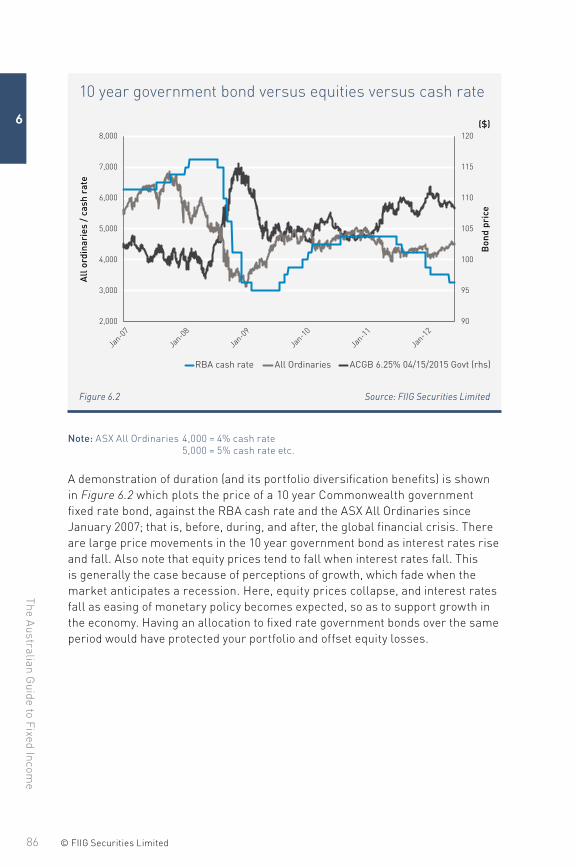
The Australian G
uide to Fixed Incom
e
86 © FIIG Securities Limited
6
10 year government bond versus equities versus cash rate
RBA cash rate All Ordinaries ACGB 6.25% 04/15/2015 Govt (rhs)
90
95
100
105
110
115
120
2,000
3,000
4,000
5,000
6,000
7,000
8,000
Jan-0
7
Jan-0
8
Jan-0
9
Jan-1
0
Jan-1
1
Jan-1
2
Bon
d pr
ice
All
ord
inar
ies
/ ca
sh r
ate
($)
Figure 6.2 Source: FIIG Securities Limited
Note: ASX All Ordinaries 4,000 = 4% cash rate 5,000 = 5% cash rate etc.
A demonstration of duration (and its portfolio diversification benefits) is shown in Figure 6.2 which plots the price of a 10 year Commonwealth government fixed rate bond, against the RBA cash rate and the ASX All Ordinaries since January 2007; that is, before, during, and after, the global financial crisis. There are large price movements in the 10 year government bond as interest rates rise and fall. Also note that equity prices tend to fall when interest rates fall. This is generally the case because of perceptions of growth, which fade when the market anticipates a recession. Here, equity prices collapse, and interest rates fall as easing of monetary policy becomes expected, so as to support growth in the economy. Having an allocation to fixed rate government bonds over the same period would have protected your portfolio and offset equity losses.
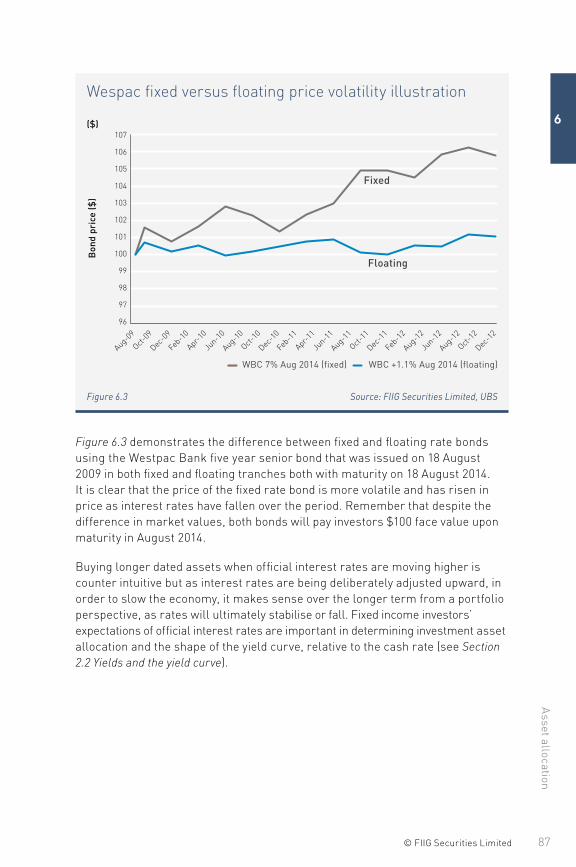
87© FIIG Securities Limited
Asset allocation
6
Wespac fixed versus floating price volatility illustration
Aug-09
Dec-0
9
Oct-09
Feb-1
0
Apr-1
0
Jun-1
0
Aug-10
Oct-10
Dec-1
0
Feb-1
1
Apr-1
1
Jun-1
1
Aug-11
Oct-11
Dec-1
1
Feb-1
2
Aug-12
Jun-1
2
Aug-12
Oct-12
Dec-1
2
WBC 7% Aug 2014 (fixed) WBC +1.1% Aug 2014 (floating)
Fixed
Floating
96
97
98
99
100
101
102
103
104
105
106
107
Bon
d pr
ice
($)
($)
Figure 6.3 Source: FIIG Securities Limited, UBS
Figure 6.3 demonstrates the difference between fixed and floating rate bonds using the Westpac Bank five year senior bond that was issued on 18 August 2009 in both fixed and floating tranches both with maturity on 18 August 2014. It is clear that the price of the fixed rate bond is more volatile and has risen in price as interest rates have fallen over the period. Remember that despite the difference in market values, both bonds will pay investors $100 face value upon maturity in August 2014.
Buying longer dated assets when official interest rates are moving higher is counter intuitive but as interest rates are being deliberately adjusted upward, in order to slow the economy, it makes sense over the longer term from a portfolio perspective, as rates will ultimately stabilise or fall. Fixed income investors’ expectations of official interest rates are important in determining investment asset allocation and the shape of the yield curve, relative to the cash rate (see Section 2.2 Yields and the yield curve).
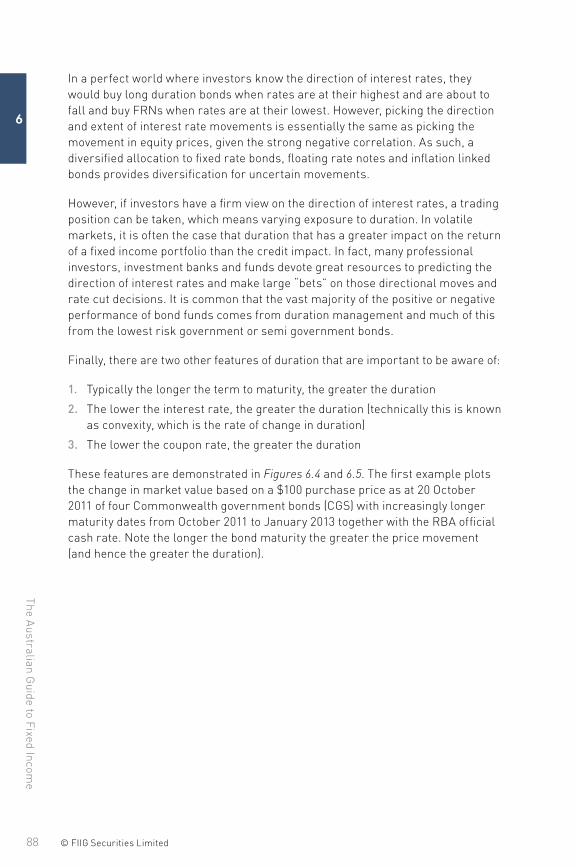
The Australian G
uide to Fixed Incom
e
88 © FIIG Securities Limited
6
In a perfect world where investors know the direction of interest rates, they would buy long duration bonds when rates are at their highest and are about to fall and buy FRNs when rates are at their lowest. However, picking the direction and extent of interest rate movements is essentially the same as picking the movement in equity prices, given the strong negative correlation. As such, a diversified allocation to fixed rate bonds, floating rate notes and inflation linked bonds provides diversification for uncertain movements.
However, if investors have a firm view on the direction of interest rates, a trading position can be taken, which means varying exposure to duration. In volatile markets, it is often the case that duration that has a greater impact on the return of a fixed income portfolio than the credit impact. In fact, many professional investors, investment banks and funds devote great resources to predicting the direction of interest rates and make large “bets” on those directional moves and rate cut decisions. It is common that the vast majority of the positive or negative performance of bond funds comes from duration management and much of this from the lowest risk government or semi government bonds.
Finally, there are two other features of duration that are important to be aware of:
1. Typically the longer the term to maturity, the greater the duration
2. The lower the interest rate, the greater the duration (technically this is known as convexity, which is the rate of change in duration)
3. The lower the coupon rate, the greater the duration
These features are demonstrated in Figures 6.4 and 6.5. The first example plots the change in market value based on a $100 purchase price as at 20 October 2011 of four Commonwealth government bonds (CGS) with increasingly longer maturity dates from October 2011 to January 2013 together with the RBA official cash rate. Note the longer the bond maturity the greater the price movement (and hence the greater the duration).
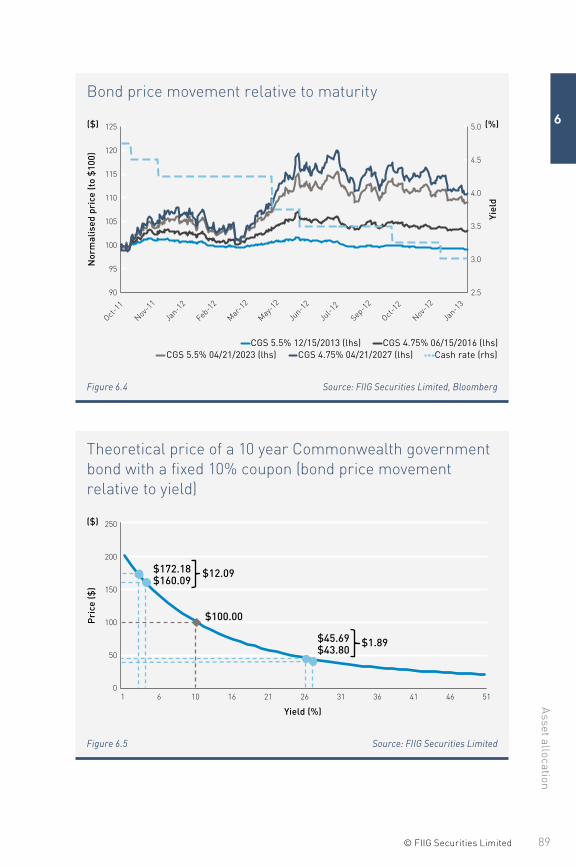
89© FIIG Securities Limited
Asset allocation
6
Bond price movement relative to maturityN
orm
alis
ed p
rice
(to
$10
0)
CGS 5.5% 12/15/2013 (lhs) CGS 4.75% 06/15/2016 (lhs)CGS 5.5% 04/21/2023 (lhs) CGS 4.75% 04/21/2027 (lhs) Cash rate (rhs)
Yiel
d
2.5
3.0
3.5
4.0
4.5
5.0
90
95
100
105
110
115
120
125
Oct-11
Nov-1
1
Jan-1
2
Feb-1
2
Mar-1
2
May-1
2
Jun-1
2
Jul-1
2
Sep-1
2
Oct-12
Nov-1
2
Jan-1
3
($) (%)
Figure 6.4 Source: FIIG Securities Limited, Bloomberg
Theoretical price of a 10 year Commonwealth government bond with a fixed 10% coupon (bond price movement relative to yield)
Pri
ce ($
)
0
50
100
150
200
250
Yield (%)
1 6 10 16 21 26 31 36 41 46 51
$100.00
$172.18$160.09
$12.09
$45.69$43.80
$1.89
($)
Figure 6.5 Source: FIIG Securities Limited
The Australian G
uide to Fixed Incom
e
90 © FIIG Securities Limited
6
Figure 6.5 looks at the theoretical price of a 10 year Commonwealth government bond with a fixed 10% coupon as yield to maturity increases. The price change for a 1% increase in yield is much larger when the starting yield to maturity is low compared to when the starting yield to maturity is high. For example, if the bond was yielding 2% and interest rates increased 1% (to 3%) the price would fall by $12.09. However, if the bond was yielding 25% and interest rates increased 1% (to 26%) the price would fall by just $1.89. This is technically known as convexity and measures the rate of change in duration.
6.2 CreditCredit risk is the likelihood of the issuer being able to repay interest and principal obligations associated with a debt on a timely basis. Depending on the weakness in the underlying economy, getting duration right does not necessarily work in isolation. This is where credit selection plays an important role. There is also a timing issue. In terms of a dramatic cyclical downturn, investors tend to remain in zero risk or government issued fixed income assets. This will ensure that investors can lock in gains when interest rates fall and maintain access to liquidity. As a general rule, the market’s interest rate expectations are firstly conveyed through the instrument with the greatest liquidity (Commonwealth government bonds in Australia), so the most liquid instruments move in front of less liquid, both up and down in yield.
In times of extreme stress, higher risk fixed income assets (anything but government and very high quality bonds) will fall in price as the perceived probability of default increases. In the reverse, when the economy is embracing a period of growth the more liquid government bond prices will fall, but the bond prices of higher risk credits will fall less than government bonds.
Just as it is difficult to invest in longer dated assets when interest rates are rising, it is difficult to consider investing in fixed income assets that have a credit risk associated with them, at a time when the economy is in a serious downturn. This is not a decision that needs to be rushed, but eventually lower interest rates and fiscal stimulus should restore calm to credit markets (see Chapter 13 An introduction to credit analysis).
6.3 Fixed income in a balanced portfolioFixed income assets, in particular bonds, serve a balanced portfolio by:
• reducing the volatility of portfolio returns
• providing a natural hedge to the economic cycle
• helping to match future expenses (liabilities) with asset maturity
91© FIIG Securities Limited
Asset allocation
6
Fixed income assets pay a fixed return over a defined period offering stability and certainty of income (or a fixed margin above a variable reference rate in the case of FRNs). Money market products such as term deposits, bank bills, negotiable certificates of deposit (NCDs) and commercial paper (CP) are the least risky and should form a relatively small amount of most investment portfolios, depending on the investor’s view of interest rates.
Bonds and higher risk fixed income securities (although significantly lower risk than equities) that provide income may also contain an element of capital gain or loss. Bonds are traded on secondary markets and their prices are constantly changing depending on many conditions (see Section 3.4 Bonds). A major factor influencing bond prices is interest rates, particularly for fixed rate bonds (as described in Section 2.6 Duration and 6.1 How exposure to interest rate risk (duration) helps portfolios hedge against the volatility of higher risk assets). However there are always opportunities in any cycle to find good relative value fixed income securities.
While the following discussion centres on fixed rate bonds, there is also a large selection of FRNs that are less susceptible to interest rate movements. The key determinant of price changes of FRNs are movements in credit spreads. Typically FRNs outperform in strong economic times and/or when interest rates are rising.
Credit spreads tend to be correlated with equity prices. Rising equity prices are often associated with falling credit spreads and hence rising FRN prices. However, this is not always the case as was seen in 2007 and early 2008 when credit spreads rose (as the bond market predicted trouble ahead) despite continued increases in global equity indices.
Remember that there is an inverse relationship between price and yield. This means that when interest rates rise, fixed rate bond prices fall and the reverse is also true when interest rates fall (see Section 2.5 How changing interest rates impact bond prices).
It is essential to understand that bonds have the potential for capital gain or loss, since most people tend to only concentrate on any potential income. Importantly, it is the capital gain or loss that performs an insulation function for your portfolio. For this reason, fixed rate bonds are an essential part of a balanced portfolio as they help to reduce the volatility of returns in divergent growth scenarios. While the idea is not new, it stems from the fact that, in most cases, the total returns from fixed rate bonds and equities move in opposite directions.
Some examples may help demonstrate these concepts.
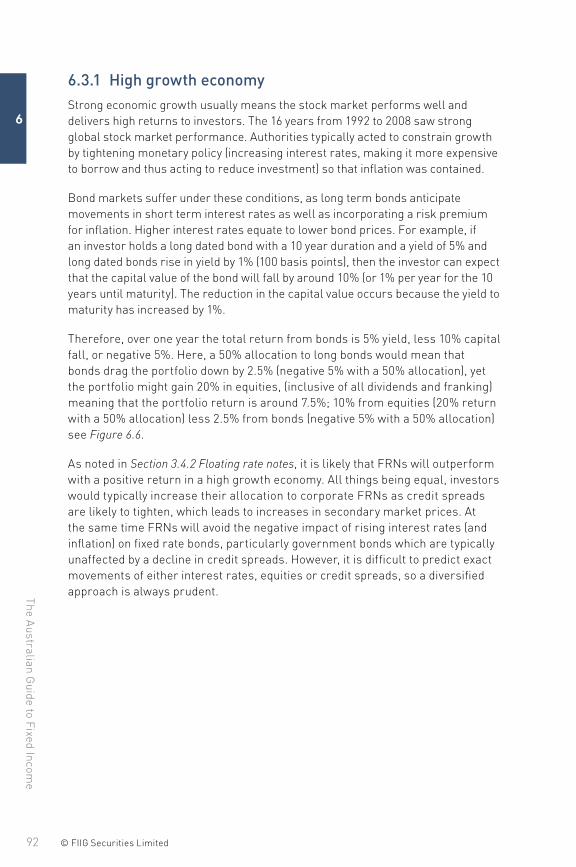
The Australian G
uide to Fixed Incom
e
92 © FIIG Securities Limited
6
6.3.1 High growth economyStrong economic growth usually means the stock market performs well and delivers high returns to investors. The 16 years from 1992 to 2008 saw strong global stock market performance. Authorities typically acted to constrain growth by tightening monetary policy (increasing interest rates, making it more expensive to borrow and thus acting to reduce investment) so that inflation was contained.
Bond markets suffer under these conditions, as long term bonds anticipate movements in short term interest rates as well as incorporating a risk premium for inflation. Higher interest rates equate to lower bond prices. For example, if an investor holds a long dated bond with a 10 year duration and a yield of 5% and long dated bonds rise in yield by 1% (100 basis points), then the investor can expect that the capital value of the bond will fall by around 10% (or 1% per year for the 10 years until maturity). The reduction in the capital value occurs because the yield to maturity has increased by 1%.
Therefore, over one year the total return from bonds is 5% yield, less 10% capital fall, or negative 5%. Here, a 50% allocation to long bonds would mean that bonds drag the portfolio down by 2.5% (negative 5% with a 50% allocation), yet the portfolio might gain 20% in equities, (inclusive of all dividends and franking) meaning that the portfolio return is around 7.5%; 10% from equities (20% return with a 50% allocation) less 2.5% from bonds (negative 5% with a 50% allocation) see Figure 6.6.
As noted in Section 3.4.2 Floating rate notes, it is likely that FRNs will outperform with a positive return in a high growth economy. All things being equal, investors would typically increase their allocation to corporate FRNs as credit spreads are likely to tighten, which leads to increases in secondary market prices. At the same time FRNs will avoid the negative impact of rising interest rates (and inflation) on fixed rate bonds, particularly government bonds which are typically unaffected by a decline in credit spreads. However, it is difficult to predict exact movements of either interest rates, equities or credit spreads, so a diversified approach is always prudent.
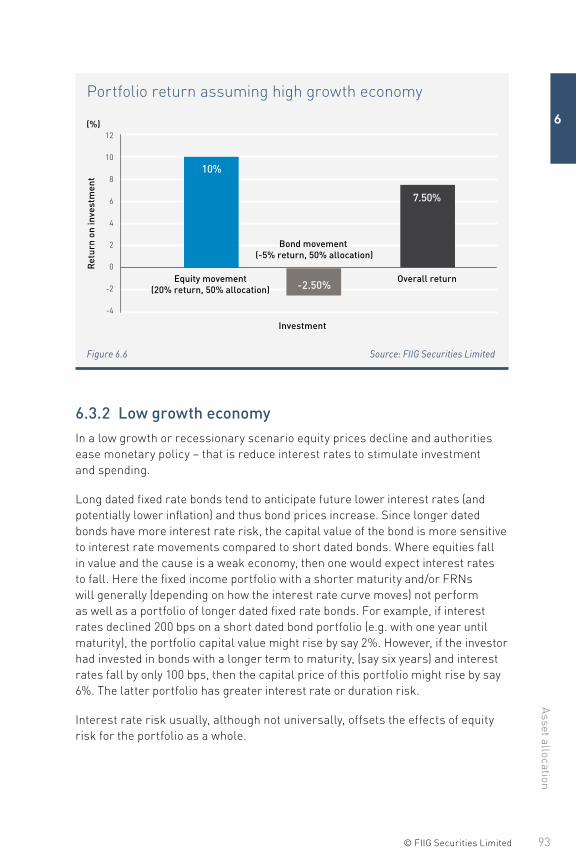
93© FIIG Securities Limited
Asset allocation
6
Portfolio return assuming high growth economy
-4
-2
0
2
4
6
8
10
12
Ret
urn
on in
vest
men
t
10%
-2.50%
7.50%
Equity movement (20% return, 50% allocation)
Overall return
Bond movement (-5% return, 50% allocation)
Investment
(%)
Figure 6.6 Source: FIIG Securities Limited
6.3.2 Low growth economyIn a low growth or recessionary scenario equity prices decline and authorities ease monetary policy – that is reduce interest rates to stimulate investment and spending.
Long dated fixed rate bonds tend to anticipate future lower interest rates (and potentially lower inflation) and thus bond prices increase. Since longer dated bonds have more interest rate risk, the capital value of the bond is more sensitive to interest rate movements compared to short dated bonds. Where equities fall in value and the cause is a weak economy, then one would expect interest rates to fall. Here the fixed income portfolio with a shorter maturity and/or FRNs will generally (depending on how the interest rate curve moves) not perform as well as a portfolio of longer dated fixed rate bonds. For example, if interest rates declined 200 bps on a short dated bond portfolio (e.g. with one year until maturity), the portfolio capital value might rise by say 2%. However, if the investor had invested in bonds with a longer term to maturity, (say six years) and interest rates fall by only 100 bps, then the capital price of this portfolio might rise by say 6%. The latter portfolio has greater interest rate or duration risk.
Interest rate risk usually, although not universally, offsets the effects of equity risk for the portfolio as a whole.
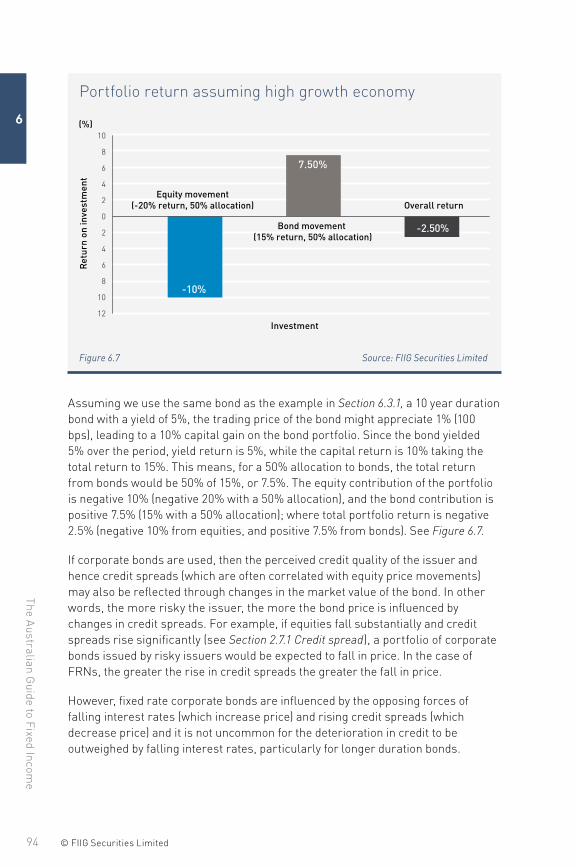
The Australian G
uide to Fixed Incom
e
94 © FIIG Securities Limited
6
Portfolio return assuming high growth economy
-10%
7.50%
-2.50%
Equity movement (-20% return, 50% allocation) Overall return
Bond movement (15% return, 50% allocation)
Ret
urn
on in
vest
men
t
12
10
8
6
4
2
0
2
4
6
8
10
Investment
(%)
Figure 6.7 Source: FIIG Securities Limited
Assuming we use the same bond as the example in Section 6.3.1, a 10 year duration bond with a yield of 5%, the trading price of the bond might appreciate 1% (100 bps), leading to a 10% capital gain on the bond portfolio. Since the bond yielded 5% over the period, yield return is 5%, while the capital return is 10% taking the total return to 15%. This means, for a 50% allocation to bonds, the total return from bonds would be 50% of 15%, or 7.5%. The equity contribution of the portfolio is negative 10% (negative 20% with a 50% allocation), and the bond contribution is positive 7.5% (15% with a 50% allocation); where total portfolio return is negative 2.5% (negative 10% from equities, and positive 7.5% from bonds). See Figure 6.7.
If corporate bonds are used, then the perceived credit quality of the issuer and hence credit spreads (which are often correlated with equity price movements) may also be reflected through changes in the market value of the bond. In other words, the more risky the issuer, the more the bond price is influenced by changes in credit spreads. For example, if equities fall substantially and credit spreads rise significantly (see Section 2.7.1 Credit spread), a portfolio of corporate bonds issued by risky issuers would be expected to fall in price. In the case of FRNs, the greater the rise in credit spreads the greater the fall in price.
However, fixed rate corporate bonds are influenced by the opposing forces of falling interest rates (which increase price) and rising credit spreads (which decrease price) and it is not uncommon for the deterioration in credit to be outweighed by falling interest rates, particularly for longer duration bonds.
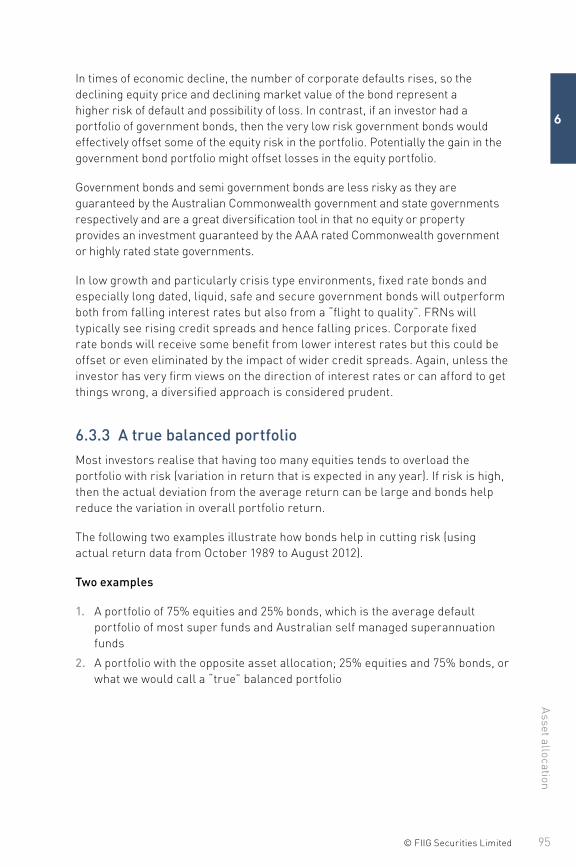
95© FIIG Securities Limited
Asset allocation
6
In times of economic decline, the number of corporate defaults rises, so the declining equity price and declining market value of the bond represent a higher risk of default and possibility of loss. In contrast, if an investor had a portfolio of government bonds, then the very low risk government bonds would effectively offset some of the equity risk in the portfolio. Potentially the gain in the government bond portfolio might offset losses in the equity portfolio.
Government bonds and semi government bonds are less risky as they are guaranteed by the Australian Commonwealth government and state governments respectively and are a great diversification tool in that no equity or property provides an investment guaranteed by the AAA rated Commonwealth government or highly rated state governments.
In low growth and particularly crisis type environments, fixed rate bonds and especially long dated, liquid, safe and secure government bonds will outperform both from falling interest rates but also from a “flight to quality”. FRNs will typically see rising credit spreads and hence falling prices. Corporate fixed rate bonds will receive some benefit from lower interest rates but this could be offset or even eliminated by the impact of wider credit spreads. Again, unless the investor has very firm views on the direction of interest rates or can afford to get things wrong, a diversified approach is considered prudent.
6.3.3 A true balanced portfolioMost investors realise that having too many equities tends to overload the portfolio with risk (variation in return that is expected in any year). If risk is high, then the actual deviation from the average return can be large and bonds help reduce the variation in overall portfolio return.
The following two examples illustrate how bonds help in cutting risk (using actual return data from October 1989 to August 2012).
Two examples
1. A portfolio of 75% equities and 25% bonds, which is the average default portfolio of most super funds and Australian self managed superannuation funds
2. A portfolio with the opposite asset allocation; 25% equities and 75% bonds, or what we would call a “true” balanced portfolio
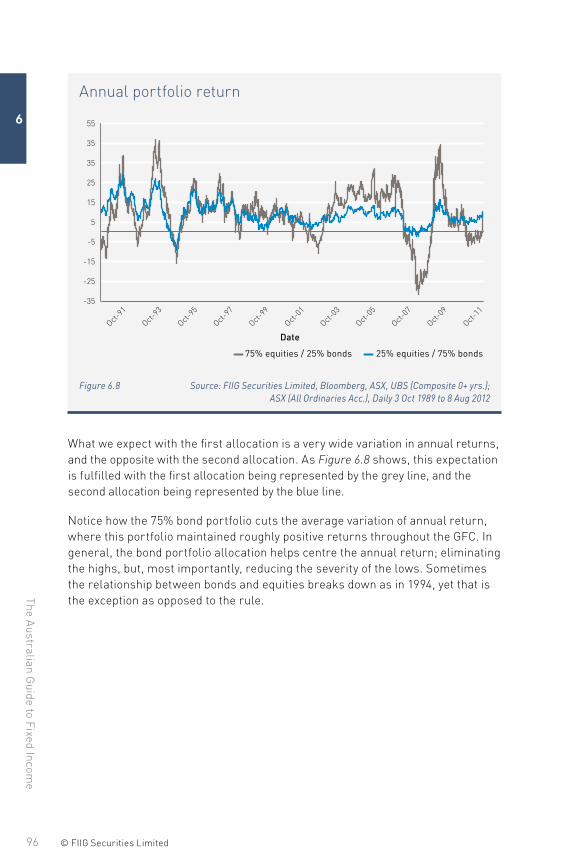
The Australian G
uide to Fixed Incom
e
96 © FIIG Securities Limited
6
Annual portfolio return
75% equities / 25% bonds 25% equities / 75% bonds
-35
-25
-15
-5
5
15
25
35
35
55
Oct-91
Oct-93
Oct-95
Oct-97
Oct-99
Oct-01
Oct-03
Oct-05
Oct-07
Oct-09
Oct-11
Date
Figure 6.8 Source: FIIG Securities Limited, Bloomberg, ASX, UBS (Composite 0+ yrs.); ASX (All Ordinaries Acc.), Daily 3 Oct 1989 to 8 Aug 2012
What we expect with the first allocation is a very wide variation in annual returns, and the opposite with the second allocation. As Figure 6.8 shows, this expectation is fulfilled with the first allocation being represented by the grey line, and the second allocation being represented by the blue line.
Notice how the 75% bond portfolio cuts the average variation of annual return, where this portfolio maintained roughly positive returns throughout the GFC. In general, the bond portfolio allocation helps centre the annual return; eliminating the highs, but, most importantly, reducing the severity of the lows. Sometimes the relationship between bonds and equities breaks down as in 1994, yet that is the exception as opposed to the rule.
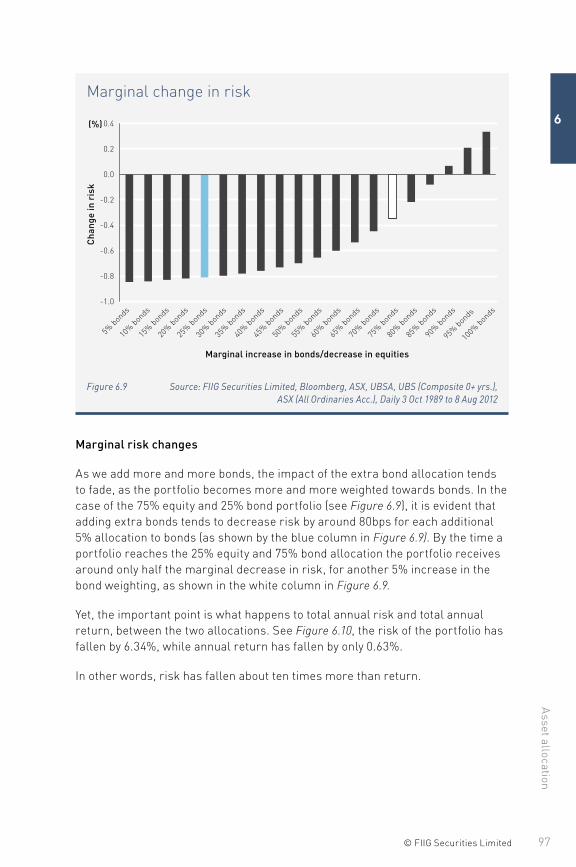
97© FIIG Securities Limited
Asset allocation
6
Marginal change in risk
-1.0
-0.8
-0.6
-0.4
-0.2
0.0
0.2
0.4
10% bon
ds
15% bon
ds
20% bon
ds
25% bon
ds
30% bon
ds
35% bon
ds
40% bon
ds
45% bon
ds
50% bon
ds
55% bon
ds
60% bon
ds
65% bon
ds
70% bon
ds
75% bon
ds
80% bon
ds
85% bon
ds
90% bon
ds
95% bon
ds
100%
bonds
Cha
nge
in r
isk
Marginal increase in bonds/decrease in equities
5% bon
ds
(%)
Figure 6.9 Source: FIIG Securities Limited, Bloomberg, ASX, UBSA, UBS (Composite 0+ yrs.), ASX (All Ordinaries Acc.), Daily 3 Oct 1989 to 8 Aug 2012
Marginal risk changes
As we add more and more bonds, the impact of the extra bond allocation tends to fade, as the portfolio becomes more and more weighted towards bonds. In the case of the 75% equity and 25% bond portfolio (see Figure 6.9), it is evident that adding extra bonds tends to decrease risk by around 80bps for each additional 5% allocation to bonds (as shown by the blue column in Figure 6.9). By the time a portfolio reaches the 25% equity and 75% bond allocation the portfolio receives around only half the marginal decrease in risk, for another 5% increase in the bond weighting, as shown in the white column in Figure 6.9.
Yet, the important point is what happens to total annual risk and total annual return, between the two allocations. See Figure 6.10, the risk of the portfolio has fallen by 6.34%, while annual return has fallen by only 0.63%.
In other words, risk has fallen about ten times more than return.
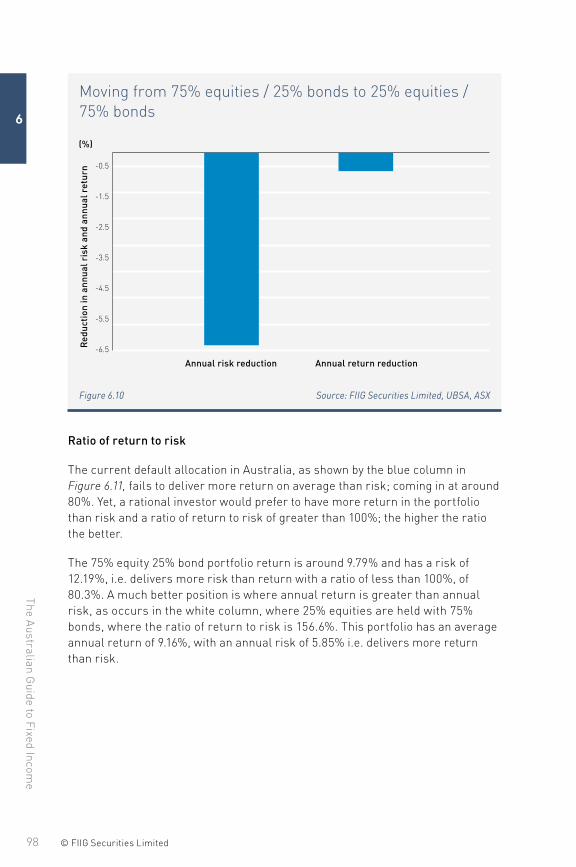
The Australian G
uide to Fixed Incom
e
98 © FIIG Securities Limited
6
Moving from 75% equities / 25% bonds to 25% equities / 75% bonds
Red
ucti
on in
ann
ual r
isk
and
annu
al r
etur
n
-6.5
-5.5
-4.5
-3.5
-2.5
-1.5
-0.5
Annual risk reduction Annual return reduction
(%)
Figure 6.10 Source: FIIG Securities Limited, UBSA, ASX
Ratio of return to risk
The current default allocation in Australia, as shown by the blue column in Figure 6.11, fails to deliver more return on average than risk; coming in at around 80%. Yet, a rational investor would prefer to have more return in the portfolio than risk and a ratio of return to risk of greater than 100%; the higher the ratio the better.
The 75% equity 25% bond portfolio return is around 9.79% and has a risk of 12.19%, i.e. delivers more risk than return with a ratio of less than 100%, of 80.3%. A much better position is where annual return is greater than annual risk, as occurs in the white column, where 25% equities are held with 75% bonds, where the ratio of return to risk is 156.6%. This portfolio has an average annual return of 9.16%, with an annual risk of 5.85% i.e. delivers more return than risk.
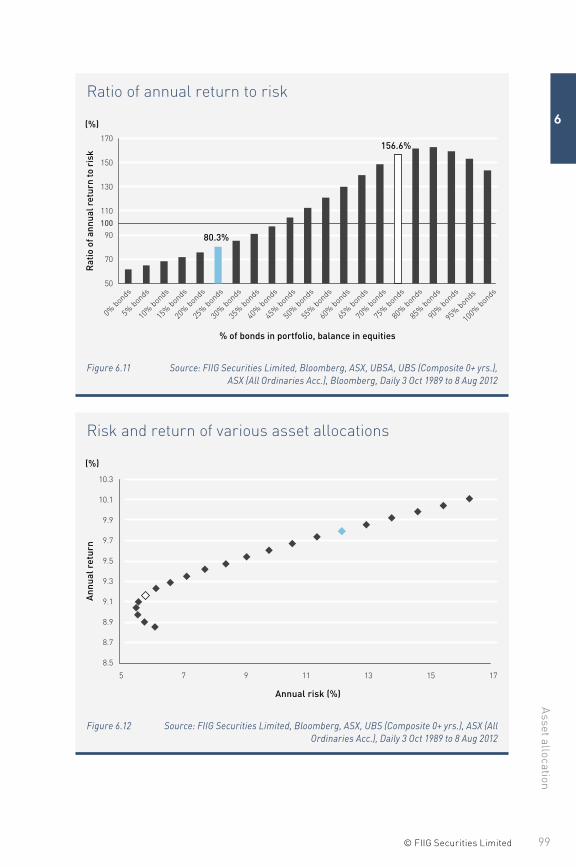
99© FIIG Securities Limited
Asset allocation
6
Ratio of annual return to riskR
atio
of a
nnua
l ret
urn
to r
isk
% of bonds in portfolio, balance in equities
50
70
90 100
110
130
150
170
0% bon
ds
5% bon
ds
10% bon
ds
15% bon
ds
20% bon
ds
25% bon
ds
30% bon
ds
35% bon
ds
40% bon
ds
45% bon
ds
50% bon
ds
55% bon
ds
60% bon
ds
65% bon
ds
70% bon
ds
75% bon
ds
80% bon
ds
85% bon
ds
90% bon
ds
95% bon
ds
100%
bonds
80.3%
156.6%
(%)
Figure 6.11 Source: FIIG Securities Limited, Bloomberg, ASX, UBSA, UBS (Composite 0+ yrs.), ASX (All Ordinaries Acc.), Bloomberg, Daily 3 Oct 1989 to 8 Aug 2012
Risk and return of various asset allocations
8.5
8.7
8.9
9.1
9.3
9.5
9.7
9.9
10.1
10.3
5 7 9 11 13 15 17
Annual risk (%)
Ann
ual r
etur
n
(%)
Figure 6.12 Source: FIIG Securities Limited, Bloomberg, ASX, UBS (Composite 0+ yrs.), ASX (All Ordinaries Acc.), Daily 3 Oct 1989 to 8 Aug 2012
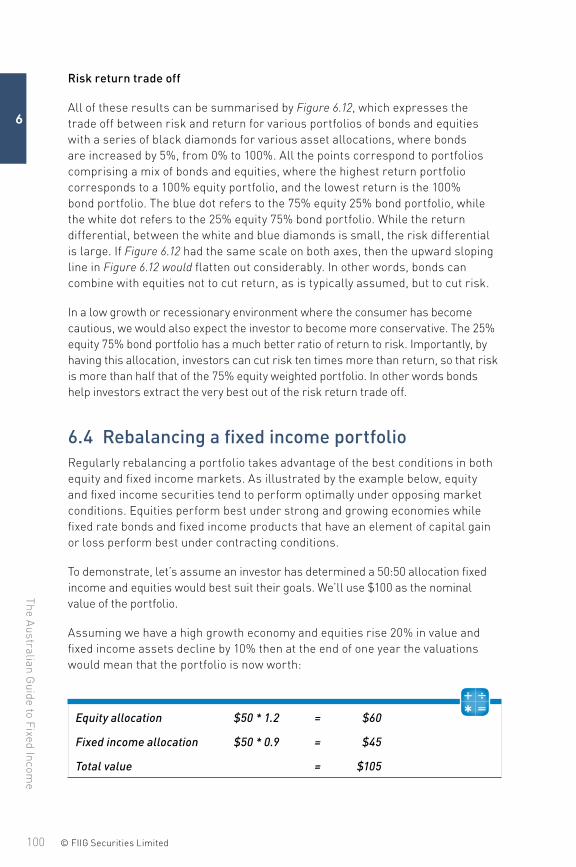
The Australian G
uide to Fixed Incom
e
100 © FIIG Securities Limited
6
Risk return trade off
All of these results can be summarised by Figure 6.12, which expresses the trade off between risk and return for various portfolios of bonds and equities with a series of black diamonds for various asset allocations, where bonds are increased by 5%, from 0% to 100%. All the points correspond to portfolios comprising a mix of bonds and equities, where the highest return portfolio corresponds to a 100% equity portfolio, and the lowest return is the 100% bond portfolio. The blue dot refers to the 75% equity 25% bond portfolio, while the white dot refers to the 25% equity 75% bond portfolio. While the return differential, between the white and blue diamonds is small, the risk differential is large. If Figure 6.12 had the same scale on both axes, then the upward sloping line in Figure 6.12 would flatten out considerably. In other words, bonds can combine with equities not to cut return, as is typically assumed, but to cut risk.
In a low growth or recessionary environment where the consumer has become cautious, we would also expect the investor to become more conservative. The 25% equity 75% bond portfolio has a much better ratio of return to risk. Importantly, by having this allocation, investors can cut risk ten times more than return, so that risk is more than half that of the 75% equity weighted portfolio. In other words bonds help investors extract the very best out of the risk return trade off.
6.4 Rebalancing a fixed income portfolioRegularly rebalancing a portfolio takes advantage of the best conditions in both equity and fixed income markets. As illustrated by the example below, equity and fixed income securities tend to perform optimally under opposing market conditions. Equities perform best under strong and growing economies while fixed rate bonds and fixed income products that have an element of capital gain or loss perform best under contracting conditions.
To demonstrate, let’s assume an investor has determined a 50:50 allocation fixed income and equities would best suit their goals. We’ll use $100 as the nominal value of the portfolio.
Assuming we have a high growth economy and equities rise 20% in value and fixed income assets decline by 10% then at the end of one year the valuations would mean that the portfolio is now worth:
Equity allocation $50 * 1.2 = $60
Fixed income allocation $50 * 0.9 = $45
Total value = $105
101© FIIG Securities Limited
Asset allocation
6
The new allocation is split equity 60/105 x 100 = 57.1% and fixed income 45/105 x 100 = 42.9%. To continue to meet the asset allocation objective: that is an equal split between fixed income and equities, a portion of the equity portfolio ($105 total value divided by 2, to get the 50:50 split = $52.5) $60 - $52.5 = $7.5 needs to be sold and reinvested in fixed income. When conditions change, profits are taken in rising equity markets and reinvested in cheaper fixed income markets to ensure returns from that allocation. Of course, the reverse is true when fixed income outperforms equities.
Rebalancing takes heed of the basic investment principle of selling in a high market and buying in a cheap one, maximising earnings potential over time.
6.5 Other considerations in asset allocationWhile the above discussion considers many aspects of asset allocation, there are many other personal considerations an investor should take into account. The following is a short list of questions an investor should also ask themselves when determining asset allocation as well as portfolio construction:
• age and desired retirement age FIIG would usually recommend investors own their age in bonds (e.g. if you are 60, then you would have 60% of your investment in bonds)
• risk appetite, including willingness and ability to sustain loss of capital
• goals such as return, annual income, desire to leave an inheritance to children, etc
• impact of inflation (see Chapter 11 Inflation linked bonds)
• existing investments and liabilities – for example if an investor has a large variable rate mortgage or margin loan, it may make sense to have a greater exposure to FRNs rather than fixed rate bonds
• investor’s exposure to economic, interest rate and equity cycles in other aspects such as employment (e.g. an equity broker or home builder), loan interest rates and repayments, etc
• diversity of investments across the asset classes, such as not having a large exposure to Commonwealth Bank of Australia (CBA) equities as well as CBA bonds or a large exposure to direct property and then equity or fixed income issued by property related companies
• diversity within asset classes and in particular a mix of fixed, floating and inflation linked bonds within the fixed income allocation given difficulties in predicting where markets will go
• liquidity and likelihood of needing to break or liquidate an investment prior to maturity
For more information see Chapter 7 Building a fixed income portfolio.
103© FIIG Securities Limited
Chapter 7.
Building a fixed income portfolio (including a sample)
Portfolio allocations very much depend on the investor, their aims, the amount they have to invest, the time span of the investment and whether access to funds is needed. There is a multitude of scenarios all with advantages and disadvantages. For a typical balanced portfolio with a five to ten year investment horizon FIIG would advocate a minimum allocation to fixed income of 30% with 5% in the least risky income producing, short term money market securities. For investors with specific objectives a much higher allocation to fixed income should be considered. For self funded retirees or those approaching retirement a fixed income allocation of 70% may be more appropriate. Not for profit associations including charities, hospitals, churches, schools and universities and local government councils may allocate 100% of their portfolios to fixed income.
Some simple ideas on allocating fixed income as part of your total investment portfolio are listed below:
1. The older and closer to retirement you are the more protective you should be of your savings and as such you should look to decrease exposure to high risk asset classes. Nearing retirement age is not the time for increasing risk even if investors haven’t saved enough.
2. Invest small amounts in high risk, large amounts in low risk.
3. Borrowing or gearing increases risk through exposure to interest rate movements.
4. One old “rule of thumb” for asset allocations is to own your age in fixed income. At age 40, the recommended portfolio allocation to fixed income would be 40% and 60% to equities and other higher risk assets, increasing as the investor nears retirement. Someone aged 70 would allocate 70% to fixed income and 30% to equities. Thus investors need to increase the percentage of fixed income assets as a percentage of their total portfolios as they age. Why? Because when you are younger, you have time to recover from any “dips” in equity markets as you maintain active earning power through your salary. When you are older, you often are solely dependent on your investments for your income. If equity markets dip, you do not have the same earning power to recover from any losses.
The Australian G
uide to Fixed Incom
e
104 © FIIG Securities Limited
7
5. Benjamin Graham, mentor to famous US investor Warren Buffet, advised splitting money equally between shares and bonds, in his classic book “The Intelligent Investor”. He added that the proportion in shares should never go below 25% (when you think shares are expensive and bonds are cheap), or above 75% (when shares seem cheap).
Investors in fixed income can also personalise their portfolio to better meet their needs or to allay their overall investment fears. Some basic examples of how this may be done include:
1. Investors requiring more certainty of income may include more fixed rate securities in their portfolio.
2. Investors concerned about longer term inflation would look to include more inflation linked bonds in their portfolio.
3. Investors looking to use their fixed income investments to work counter cyclically to their equity investments, i.e. to increase in value when equities decrease in value, should include more Commonwealth government securities.
4. Investors mostly concerned about preserving their capital should look to include more senior ranking bonds.
These are just a few examples of factors which may help drive a particular investment strategy in fixed income, (see Chapter 14 Investment and trading strategies).
FIIG has the resources to help establish diversified portfolios for customers. One such resource is FIIG’s portfolio construction tool, which helps to create a portfolio specific to each investor’s needs. A sample portfolio report can be seen in Table 7.1, 7.2 and Figure 7.1.
The portfolio report also provides summary statistics about the included fixed income investments: sector exposures as a percentage, capital structure exposures and key portfolio statistics which are weighted over the whole portfolio, based on the total value of the investment.
The portfolio is an illustration of the different types of securities available to investors, rather than a specifically recommended portfolio. It includes Commonwealth government, state government, financial institution, insurance company, corporate and infrastructure securities, from domestic and international issuers, offering fixed, floating and inflation linked bonds. It’s worth noting that there are many foreign currency bonds available and that Australian banks and some large Australian corporations issue debt securities in significant volume in foreign currencies. While foreign currency bonds have not been included in this sample they are worth considering especially if you have foreign currency sitting in foreign banks accounts earning low rates of return.
Investors need to be aware of the foreign exchange (FX) risk that exists when you own assets that are not denominated in AUD.
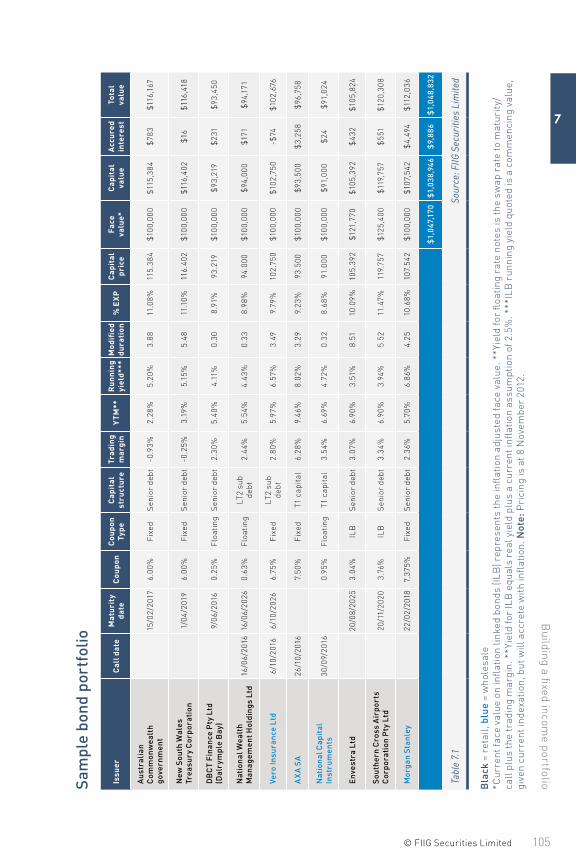
105© FIIG Securities Limited
Building a fixed incom
e portfolio
7
Sam
ple
bond
por
tfol
io
Issu
erC
all d
ate
Mat
urit
y da
teC
oupo
nC
oupo
n Ty
peC
apit
al
stru
ctur
eTr
adin
g m
argi
nY
TM**
Run
ning
yi
eld*
**M
odifi
ed
dura
tion
% E
XP
Cap
ital
pr
ice
Face
va
lue*
Cap
ital
valu
eA
ccur
ed
inte
rest
Tota
l va
lue
Aus
tral
ian
Com
mon
wea
lth
gove
rnm
ent
15/0
2/20
176.
00%
Fix
edS
enio
r de
bt-0
.93%
2.28
%5.
20%
3.88
11.0
8%11
5.38
4$1
00,0
00$1
15,3
84$
783
$116
,167
New
Sou
th W
ales
Tr
easu
ry C
orpo
rati
on1/
04/2
019
6.00
%F
ixed
Sen
ior
debt
-0.2
5%3.
19%
5.15
%5.
4811
.10%
116.
402
$100
,000
$116
,402
$16
$116
,418
DB
CT
Fin
ance
Pty
Ltd
(D
alry
mpl
e B
ay)
9/06
/201
60.
25%
Flo
atin
gS
enio
r de
bt2.
30%
5.40
%4.
11%
0.30
8.91
%93
.219
$100
,000
$93
,219
$23
1$
93,4
50
Nat
iona
l Wea
lth
Man
agem
ent H
oldi
ngs
Ltd
16/0
6/20
1616
/06/
2026
0.63
%F
loat
ing
LT2
sub
debt
2.44
%5.
54%
4.43
%0.
338.
98%
94.0
00$1
00,0
00$
94,0
00$1
71$
94,1
71
Vero
Insu
ranc
e Lt
d6/
10/2
016
6/10
/202
66.
75%
Fix
edLT
2 su
b de
bt2.
80%
5.97
%6.
57%
3.49
9.79
%10
2.75
0$1
00,0
00$1
02,7
50-$
74$1
02,6
76
AX
A S
A26
/10/
2016
7.50
%F
ixed
T1 c
apit
al6.
28%
9.46
%8.
02%
3.29
9.23
%93
.500
$100
,000
$93
,500
$3,
258
$96
,758
Nat
iona
l Cap
ital
In
stru
men
ts30
/09/
2016
0.95
%F
loat
ing
T1 c
apit
al3.
54%
6.69
%4.
72%
0.32
8.68
%91
.000
$100
,000
$91
,000
$24
$91
,024
Env
estr
a Lt
d20
/08/
2025
3.04
%IL
BS
enio
r de
bt3.
07%
6.90
%3.
51%
8.51
10.0
9%10
5.39
2$1
21,7
70$1
05,3
92$
432
$105
,824
Sou
ther
n C
ross
Air
port
s C
orpo
rati
on P
ty L
td20
/11/
2020
3.76
%IL
BS
enio
r de
bt3.
34%
6.90
%3.
94%
5.52
11.4
7%11
9.75
7$1
25,4
00$1
19,7
57$
551
$120
,308
Mor
gan
Sta
nley
22/0
2/20
187.
375%
Fix
edS
enio
r de
bt2.
36%
5.70
%6.
86%
4.25
10.6
8%10
7.54
2$1
00,0
00$1
07,5
42$
4,49
4$1
12,0
36
$1,0
47,1
70$1
,038
,946
$9,
886
$1,0
48,8
32
Tabl
e 7.
1So
urce
: FIIG
Sec
uriti
es L
imite
d
Bla
ck =
ret
ail,
blue
= w
hole
sale
*C
urre
nt fa
ce v
alue
on
infl
atio
n lin
ked
bond
s (IL
B) r
epre
sent
s th
e in
flat
ion
adju
sted
face
val
ue. *
*Yie
ld fo
r fl
oatin
g ra
te n
otes
is th
e sw
ap r
ate
to m
atur
ity/
call
plus
the
trad
ing
mar
gin.
**Y
ield
for
ILB
equ
als
real
yie
ld p
lus
a cu
rren
t infl
atio
n as
sum
ptio
n of
2.5
%. *
**IL
B r
unni
ng y
ield
quo
ted
is a
com
men
cing
val
ue,
give
n cu
rren
t ind
exat
ion,
but
will
acc
rete
wit
h in
flat
ion.
Not
e: P
rici
ng is
at 8
Nov
embe
r 20
12.
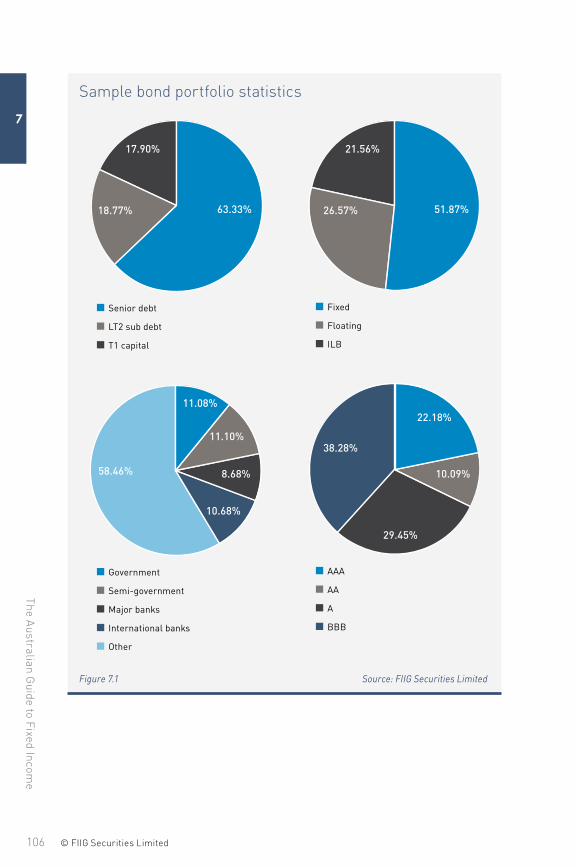
The Australian G
uide to Fixed Incom
e
106 © FIIG Securities Limited
7
Sample bond portfolio statistics
Senior debt
LT2 sub debt
T1 capital
Fixed
Floating
ILB
Government
Semi-government
Major banks
International banks
Other
AAA
AA
A
BBB
63.33%18.77%
17.90%
51.87%26.57%
21.56%
11.08%
11.10%
10.68%
58.46% 8.68% 10.09%
22.18%
38.28%
29.45%
Figure 7.1 Source: FIIG Securities Limited
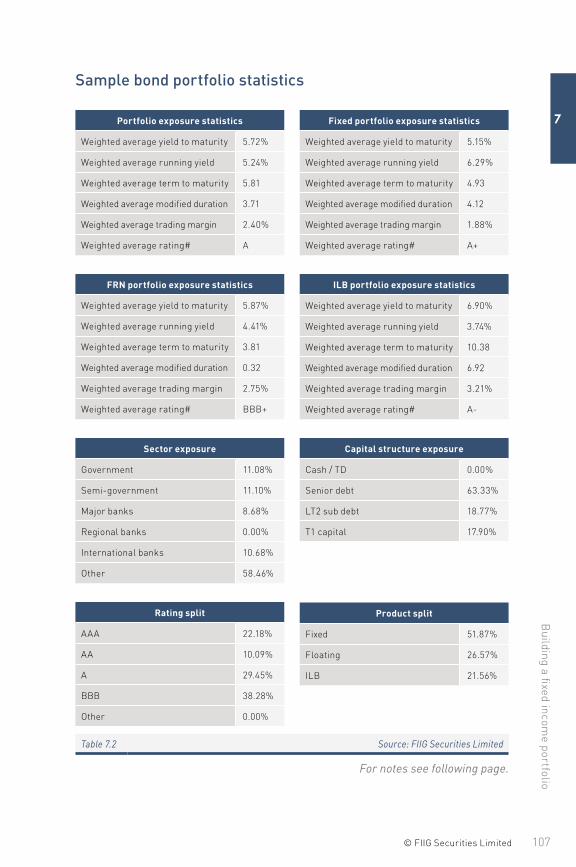
107© FIIG Securities Limited
Building a fixed incom
e portfolio
7
Sample bond portfolio statistics
Portfolio exposure statistics
Weighted average yield to maturity 5.72%
Weighted average running yield 5.24%
Weighted average term to maturity 5.81
Weighted average modified duration 3.71
Weighted average trading margin 2.40%
Weighted average rating# A
FRN portfolio exposure statistics
Weighted average yield to maturity 5.87%
Weighted average running yield 4.41%
Weighted average term to maturity 3.81
Weighted average modified duration 0.32
Weighted average trading margin 2.75%
Weighted average rating# BBB+
Sector exposure
Government 11.08%
Semi-government 11.10%
Major banks 8.68%
Regional banks 0.00%
International banks 10.68%
Other 58.46%
Rating split
AAA 22.18%
AA 10.09%
A 29.45%
BBB 38.28%
Other 0.00%
Table 7.2 Source: FIIG Securities Limited
Fixed portfolio exposure statistics
Weighted average yield to maturity 5.15%
Weighted average running yield 6.29%
Weighted average term to maturity 4.93
Weighted average modified duration 4.12
Weighted average trading margin 1.88%
Weighted average rating# A+
ILB portfolio exposure statistics
Weighted average yield to maturity 6.90%
Weighted average running yield 3.74%
Weighted average term to maturity 10.38
Weighted average modified duration 6.92
Weighted average trading margin 3.21%
Weighted average rating# A-
Capital structure exposure
Cash / TD 0.00%
Senior debt 63.33%
LT2 sub debt 18.77%
T1 capital 17.90%
Product split
Fixed 51.87%
Floating 26.57%
ILB 21.56%
For notes see following page.
The Australian G
uide to Fixed Incom
e
108 © FIIG Securities Limited
7
Notes: sample bond portfolio statistics#For weighted average rating calculation, short term ratings and long term Moodys ratings are converted into long term S&P Ratings.
The beneficial ownership of the client’s securities remains with the client, and are the client’s assets, at all times.
This report and the yields and prices of the securities are provided by FIIG based upon available yields and prices sourced from leading market makers and data services as well as any available market information and feedback when market volume and turnover is low or not transparent as at the reporting date.
Yields and prices are indicative only and there is no guarantee as to their accuracy. The yields and prices for the securities are an estimate based on the information available to FIIG as at the reporting date and do not necessarily represent the market price or a price at which FIIG or any other party will buy or sell the securities and may change without notice. If no yield or security is provided for any security, this is because there is insufficient information available to FIIG to provide a yield or price for the security.
The yields and prices will be impacted by transaction size, the issuer’s financial circumstances, market and economic conditions and the supply and demand dynamics prevailing at the time the client’s securities are bought and sold, amongst other things.
The historical yield, price or performance of the securities is no guarantee of their future performance.
The yields and prices are not an offer by FIIG to buy or sell the securities. Should the client wish to sell their securities prior to maturity, FIIG will use its best endeavours to assist the client to sell those securities. However, FIIG does not make a market in the securities.
The portfolio summary report shown in Table 7.1, 7.2 and Figure 7.1 includes key investment parameters of both individual securities and of the portfolio as a whole. Detailed descriptions of these may be found in Chapter 20 Glossary, however the key definitions are:
Issuer – the entity (or borrower) that issues the debt security to raise money from investors.
Call date – a date prior to maturity when the issuer has an option to redeem a callable security. The bond may be redeemed at par, or at a small premium, depending on the terms of the call option. Senior bonds do not have call dates. Where this column is left empty for a particular issue there is no call option and the bond will mature at the maturity date.
Maturity date – the date when the bond is due for repayment by the issuer. The principal plus any outstanding interest of the security (the coupon) will be repaid on this date. Where this column is left empty, if the security is not called, it then becomes perpetual, that it has no maturity date.
Coupon – is the interest paid and is set at first issue of the security. Payments are made at regular intervals by the issuer to the investor (annually, semi annually or quarterly). The coupon rate can be fixed and expressed as a percentage per annum, determined at the time of issue or floating and expressed as a fixed margin over benchmark (usually 90 day bank bill rate). The coupon is always based on the par value (usually $100) of the issue.
109© FIIG Securities Limited
Building a fixed incom
e portfolio
7
Coupon type – either fixed or floating coupon rate.
Capital structure – is where the issue ranks in a company’s capital structure with respect to application of losses and priority of payment upon the event of liquidation. See Chapter 4 Capital structure for a detailed description of company capital structure.
Trading margin – is a margin above a benchmark rate (such as BBSW or the Swap curve in the construction tool) that is added when discounting future cashflows of a bond to calculate the current market price. It is a risk measure and is useful when comparing fixed and floating rate investments.
Yield to maturity – is the return an investor receives if they buy a bond and hold the bond to maturity. Yield to maturity includes the return based on all the cashflows received. That is, it includes the returns of both the coupon payments, and any gain or loss arising from the difference in the purchase price and the face value returned at maturity.
Yield to maturity also assumes all coupon payments are reinvested at this yield. This is a global market convention.
Yield to maturity is a very useful indicator of value because it allows investors to directly compare different types of securities with various maturities and credit risk (note: FIIG assumes all issues are called on the first call date in the calculation of yield to maturity for callable securities). See Section 2.2.1.3 Yield to maturity and Appendix 2 Pricing formulae for Commonwealth government securities.
Running yield – is the interest rate of an investment expressed as a percentage of the capital invested and the amount an investor can expect to earn in the next year. For inflation linked bonds, running yield does not account for future coupon growth due to the capital indexation from inflation. See Section 2.2.1.2 Running yield and Appendix 2 Pricing formulae for Commonwealth government securities
Modified duration – is a measure of the price sensitivity of a bond to interest rate movements. Modified duration provides an estimate of how a bond price will change for every 1% change in interest rates. The longer the modified duration of a portfolio, the greater the exposure to changes in interest rates. FRNs tend to have low duration as coupon payments are reset quarterly (see Section 2.6.1 Modified duration).
% exposure – the amount invested in the security expressed as a percentage of total portfolio holdings. Percentage exposure is based on the total value of the portfolio.
Capital price – also referred to as “clean price” and does not include any accrued interest.

The Australian G
uide to Fixed Incom
e
110 © FIIG Securities Limited
7
Face value – is the capital value of the bond you are acquiring and the amount repaid to the bondholder at maturity.
Capital value – is the capital price multiplied by the face value of the bond.
Accrued interest - is a portion of the next interest payment that belongs to the seller of the bond for holding the bond from the previous coupon date through to the date of sale. The investor buying the bond effectively pays the accrued interest up until the date of purchase as part of the bond purchase consideration and the new owner receives the full coupon at the next coupon date.
Total value - is the capital value plus any accrued interest up to the date of purchase.
111© FIIG Securities Limited
Chapter 8.
Regulators of the Australian fixed income market
Banks around the world stumbled in the global financial crisis in 2008/09 but the Australian financial system regulated by APRA, ASIC, the ASX and various acts of parliament performed the job they were designed to do and protected the integrity of Australian financial markets. Australian Authorised Deposit-taking Institutions (ADIs) (see www.apra.gov.au/adi/pages/adilist.aspx) continued to function (despite reduced access to funding) throughout the crisis, while international competitors fought insolvency as investors lost confidence in financial systems and withdrew liquidity. Many international banks were forced to seek government support to ensure survival and their governments were forced to intervene to prevent a complete breakdown of their financial systems.
Australian regulation is generally effective and a basic understanding is necessary to ascertain how the system monitors and regulates risk. Effective regulation and a stable financial system is the foundation of investor confidence.
This section provides some basic information about the regulators and who they regulate in the Australian financial system. More detailed information can be obtained from the various regulators’ websites and publications.
8.1 The Australian Prudential Regulation Authority (APRA)APRA regulates and supervises banks, credit unions, building societies, general insurance and reinsurance companies, life insurance, friendly societies and most members of the superannuation industry. APRA is funded largely by the industries that it supervises. It was established on 1 July 1998 and supervises institutions holding approximately $4 trillion in assets for 23 million Australian depositors, policyholders and superannuation fund members.
APRA’s main role is to establish prudential standards and ensure a stable Australian financial framework, in effect ensuring that financial promises made by the institutions that APRA supervises are made within an efficient and competitive financial system. Some of APRA’s powers include:
The Australian G
uide to Fixed Incom
e
112 © FIIG Securities Limited
8
• the ability to request an ADI to increase its capital ratios
• requiring an ADI to increase its holding of high quality liquid assets (HQLA)
• requiring an ADI to obtain APRA’s written approval before making any planned reduction in its capital, for example, share buy backs or early redemption/ call of a subordinated debt or Tier 1 hybrid
APRA has extensive and prescriptive powers. For more information, go to its website www.apra.gov.au.
See Appendix 1 Typical capital structure for an Australian bank and the website www.fiig.com.au for further information.
8.1.1 Capital adequacyAPRA deems capital as a cornerstone of an ADI’s financial strength. Capital supports an ADI’s operations by providing a buffer to absorb unanticipated losses from its activities and enables the ADI to continue to operate in a sound and viable manner in the event of problems. An ADI must have in place an Internal Capital Adequacy Assessment Process (ICAAP) that includes at a minimum:
• adequate systems and procedures to identify, measure, monitor and manage the risks arising from the ADI’s activities on a continuous basis
• a capital management plan that includes a strategy for maintaining adequate capital and actions and procedures for monitoring compliance with requirements (including setting trigger ratios to alert management to potential breaches)
8.1.1.1 Basel III
Basel III is a global regulatory standard on bank capital adequacy, stress testing and market liquidity risk, agreed upon by the members of the Basel Committee on Banking Supervision in 2010–11 and is scheduled to be introduced from 2013 until 2018. APRA will oversee the new legislation in Australia (see Table 8.1). The third instalment of the Basel regulations, following Basel I (1988) and Basel II (2004), was developed in response to the deficiencies in financial regulation revealed by the global financial crisis of 2008/09.
The new rules take a more critical view of:
• leverage, in general
• risk “insurance”
• trading in debt between banks and other market participants
The rules ask ADIs to hold a larger “buffer” of capital, and more liquid assets.
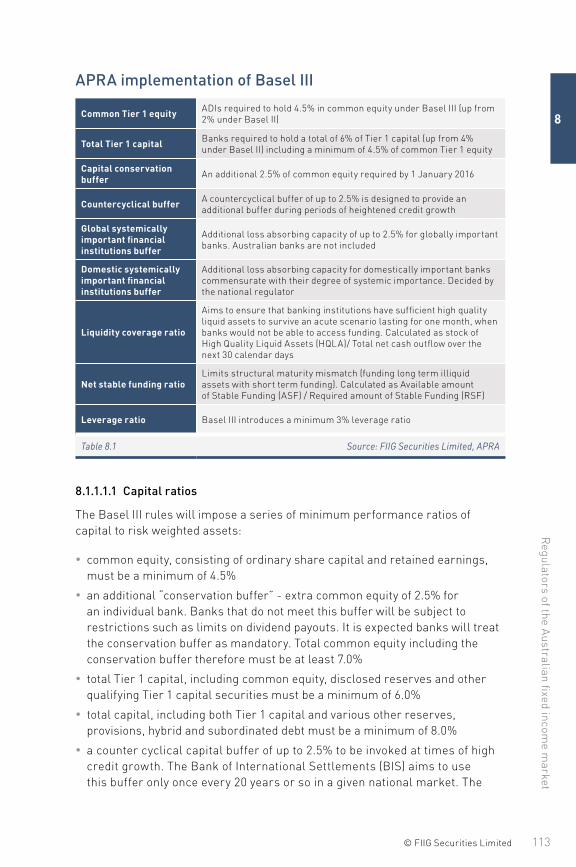
113© FIIG Securities Limited
Regulators of the A
ustralian fixed income m
arket
8
APRA implementation of Basel III
Common Tier 1 equity ADIs required to hold 4.5% in common equity under Basel III (up from 2% under Basel II)
Total Tier 1 capital Banks required to hold a total of 6% of Tier 1 capital (up from 4% under Basel II) including a minimum of 4.5% of common Tier 1 equity
Capital conservation buffer An additional 2.5% of common equity required by 1 January 2016
Countercyclical buffer A countercyclical buffer of up to 2.5% is designed to provide an additional buffer during periods of heightened credit growth
Global systemically important financial institutions buffer
Additional loss absorbing capacity of up to 2.5% for globally important banks. Australian banks are not included
Domestic systemically important financial institutions buffer
Additional loss absorbing capacity for domestically important banks commensurate with their degree of systemic importance. Decided by the national regulator
Liquidity coverage ratio
Aims to ensure that banking institutions have sufficient high quality liquid assets to survive an acute scenario lasting for one month, when banks would not be able to access funding. Calculated as stock of High Quality Liquid Assets (HQLA)/ Total net cash outflow over the next 30 calendar days
Net stable funding ratioLimits structural maturity mismatch (funding long term illiquid assets with short term funding). Calculated as Available amount of Stable Funding (ASF) / Required amount of Stable Funding (RSF)
Leverage ratio Basel III introduces a minimum 3% leverage ratio
Table 8.1 Source: FIIG Securities Limited, APRA
8.1.1.1.1 Capital ratios
The Basel III rules will impose a series of minimum performance ratios of capital to risk weighted assets:
• common equity, consisting of ordinary share capital and retained earnings, must be a minimum of 4.5%
• an additional “conservation buffer” - extra common equity of 2.5% for an individual bank. Banks that do not meet this buffer will be subject to restrictions such as limits on dividend payouts. It is expected banks will treat the conservation buffer as mandatory. Total common equity including the conservation buffer therefore must be at least 7.0%
• total Tier 1 capital, including common equity, disclosed reserves and other qualifying Tier 1 capital securities must be a minimum of 6.0%
• total capital, including both Tier 1 capital and various other reserves, provisions, hybrid and subordinated debt must be a minimum of 8.0%
• a counter cyclical capital buffer of up to 2.5% to be invoked at times of high credit growth. The Bank of International Settlements (BIS) aims to use this buffer only once every 20 years or so in a given national market. The
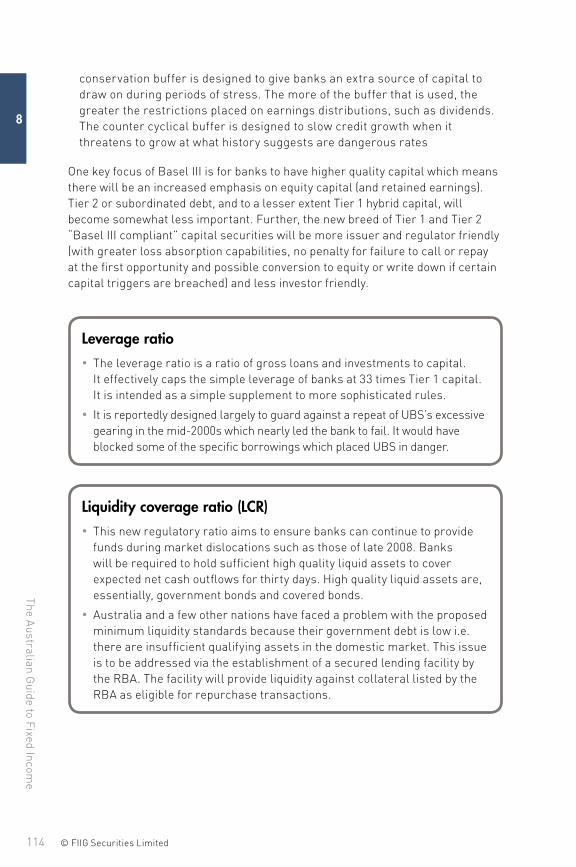
The Australian G
uide to Fixed Incom
e
114 © FIIG Securities Limited
8
conservation buffer is designed to give banks an extra source of capital to draw on during periods of stress. The more of the buffer that is used, the greater the restrictions placed on earnings distributions, such as dividends. The counter cyclical buffer is designed to slow credit growth when it threatens to grow at what history suggests are dangerous rates
One key focus of Basel III is for banks to have higher quality capital which means there will be an increased emphasis on equity capital (and retained earnings). Tier 2 or subordinated debt, and to a lesser extent Tier 1 hybrid capital, will become somewhat less important. Further, the new breed of Tier 1 and Tier 2 “Basel III compliant” capital securities will be more issuer and regulator friendly (with greater loss absorption capabilities, no penalty for failure to call or repay at the first opportunity and possible conversion to equity or write down if certain capital triggers are breached) and less investor friendly.
Leverage ratio • The leverage ratio is a ratio of gross loans and investments to capital. It effectively caps the simple leverage of banks at 33 times Tier 1 capital. It is intended as a simple supplement to more sophisticated rules.
• It is reportedly designed largely to guard against a repeat of UBS’s excessive gearing in the mid-2000s which nearly led the bank to fail. It would have blocked some of the specific borrowings which placed UBS in danger.
Liquidity coverage ratio (LCR) • This new regulatory ratio aims to ensure banks can continue to provide funds during market dislocations such as those of late 2008. Banks will be required to hold sufficient high quality liquid assets to cover expected net cash outflows for thirty days. High quality liquid assets are, essentially, government bonds and covered bonds.
• Australia and a few other nations have faced a problem with the proposed minimum liquidity standards because their government debt is low i.e. there are insufficient qualifying assets in the domestic market. This issue is to be addressed via the establishment of a secured lending facility by the RBA. The facility will provide liquidity against collateral listed by the RBA as eligible for repurchase transactions.

115© FIIG Securities Limited
Regulators of the A
ustralian fixed income m
arket
8
Net stable funding ratio (NSFR) • This new regulatory ratio aims to encourage banks to rely more on medium and long term funding and limits structural maturity mismatch (funding long term illiquid assets with short term funding). Calculated as Available amount of Stable Funding (ASF) / Required amount of Stable Funding (RSF)..
• Note that only the larger ADIs (defined as “scenario analysis” ADIs) will have to comply with LCR and NSFR. Smaller ADIs such as credit unions and building societies (defined as “minimum liquidity holding requirement” ADIs) will remain under the previous rules (with a number of amendments) in relation to liquidity.
8.1.1.1.2 Counterparty trading limits
Under Basel II, banks could reduce the regulatory risk weighting of a risk weighted asset by hedging it against credit derivatives (a security whose value is derived from the credit risk of an underlying bond, loan or any other financial asset). A bank could thus own a BBB security with a 100% weighting, but could hedge the investment with a counterparty to have it treated for regulatory purposes as a AAA rated security with a 20% risk weighting.
Basel III raises the Basel II requirements for risk weighted assets to support counterparty credit risk and introduces a new capital charge designed to reflect counterparty risk. There will now be different capital requirements for exchange traded derivatives (derivatives are instruments whose value is derived from an underlying asset), which carry low counterparty risk and riskier over the counter derivatives.
8.1.1.1.3 Key implications of Basel III
The main impetus of Basel III is to reduce the risk of banks and the banking system. The following is a list of the main implications:
1. Banks will generally be lower risk.
2. Banks will be required to hold more capital.
3. Banks will hold a greater proportion of higher quality capital such as common equity and retained earnings.
4. Less emphasis will be placed on Tier 2 subordinated debt.
5. Banks will be rewarded for raising “sticky” retail deposit funding and penalised for institutional and ADI deposit funding. The main implication being that retail depositors will receive significantly better deposit rates than larger institutional investors.
The Australian G
uide to Fixed Incom
e
116 © FIIG Securities Limited
8
6. New Tier 1 and Tier 2 securities will no longer have step up features. The incentive to call “old style” step up securities is high. In future, the decision to call or extend Tier 1 and Tier 2 securities will be far more economic in nature (i.e. “new style” capital securities have higher call risk).
7. Banks will be penalised for lending long term suggesting that three year bank lending may become the norm. It may also push longer term financing to the bond markets.
8. Banks will have to lengthen their funding profile meaning a greater proportion of longer dated bond and deposit funding.
9. Banks will be required to hold more HQLA and much of this will be low yielding Commonwealth government and state government bonds.
10. Banks will hold more capital and more liquidity, have less leverage, and take less risk. This will reduce profitability in terms of return on equity which is negative for shareholders but positive for debt holders, given the greater capital buffer and lower operational risk.
For more information, please see the Bank for International Settlements at www.bis.org/bcbs/basel3.htm.
8.1.1.2 Solvency II
Solvency II is a fundamental review of the capital adequacy regime for the European insurance industry. It aims to establish a revised set of European Union (EU) wide capital requirements and risk management standards that will replace the current solvency requirements. The directive aims to codify and harmonise EU insurance regulation. Primarily, it concerns the amount of capital that EU insurance companies must hold to reduce the risk of insolvency. Solvency II is often called ‘Basel for insurers’ as it is somewhat similar to the banking regulations of Basel III. Like Basel III regulation, the proposed Solvency II framework has three main pillars:
• Pillar 1 consists of the quantitative requirements (for example, the amount of capital an insurer should hold)
• Pillar 2 sets out requirements for the governance and risk management of insurers, as well as for the effective supervision of insurers
• Pillar 3 focuses on disclosure and transparency
Since the initial Solvency I Directive was introduced in 1973, more elaborate risk management systems have developed. Solvency II aims to reflect new risk management practices to define required capital and manage risk. While the Solvency I Directive was aimed at revising and updating the current EU Solvency regime, Solvency II has a much wider scope. A solvency capital requirement has the following purposes:
117© FIIG Securities Limited
Regulators of the A
ustralian fixed income m
arket
8
• to reduce the risk that an insurer would be unable to meet claims
• to reduce the losses suffered by policyholders in the event that a firm is unable to meet all claims fully
• to provide early warning to supervisors so that they can intervene promptly if capital falls below the required level
• to promote confidence in the financial stability of the insurance sector
Officially, Solvency II is due to be implemented at the start of 2014 however there have been repeated delays. The scheme is expected to have wide ranging implications for the assets that insurers hold and the business that they write. The implementation of a pan European regulatory scheme is very complicated with local regulators struggling to overcome significant differences between local insurance markets, which have their own sets of products and rules. It has been suggested that implementation may be delayed to or past 2016.
For more information, please see the Bank of England www.bankofengland.co.uk/pra/pages/solvency2/default.aspx.
8.2 The Australian Securities and Investments Commission (ASIC)ASIC is Australia’s corporate, markets and financial services regulator. ASIC contributes to Australia’s economic reputation and wellbeing by aiming to ensure that Australia’s financial markets are fair and transparent and supported by confident and informed investors and consumers.
ASIC is an independent Commonwealth government body, set up under the Australian Securities and Investments Commission Act (ASIC Act) and much of its regulatory role is concerned with the Corporations Act 2001. It regulates Australian companies, financial markets, financial services organisations and professionals who deal and advise in investments, superannuation, insurance, deposit taking and credit.
The specific operations that ASIC oversee include:
• company fund raising
• takeovers and schemes of arrangement
• audit and financial reporting
• market disclosure
• shareholder rights
• company administration and wind ups
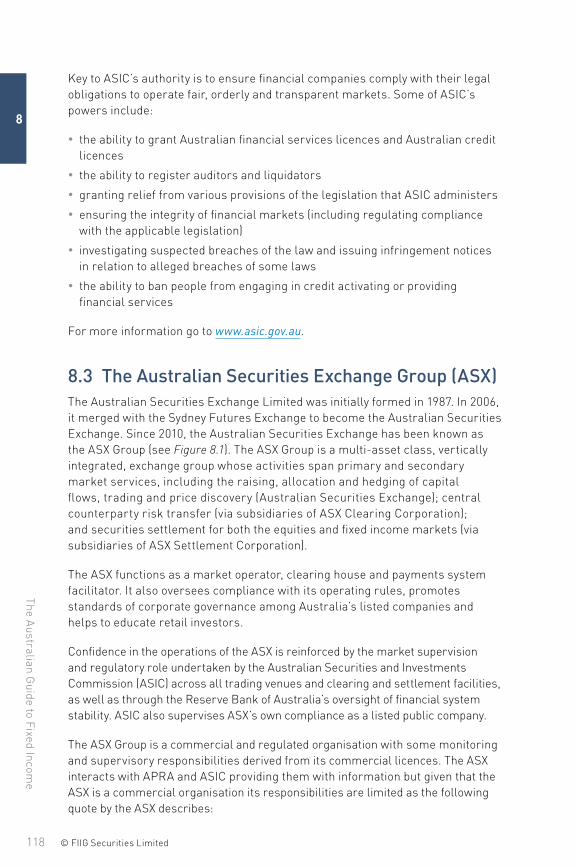
The Australian G
uide to Fixed Incom
e
118 © FIIG Securities Limited
8
Key to ASIC’s authority is to ensure financial companies comply with their legal obligations to operate fair, orderly and transparent markets. Some of ASIC’s powers include:
• the ability to grant Australian financial services licences and Australian credit licences
• the ability to register auditors and liquidators
• granting relief from various provisions of the legislation that ASIC administers
• ensuring the integrity of financial markets (including regulating compliance with the applicable legislation)
• investigating suspected breaches of the law and issuing infringement notices in relation to alleged breaches of some laws
• the ability to ban people from engaging in credit activating or providing financial services
For more information go to www.asic.gov.au.
8.3 The Australian Securities Exchange Group (ASX)The Australian Securities Exchange Limited was initially formed in 1987. In 2006, it merged with the Sydney Futures Exchange to become the Australian Securities Exchange. Since 2010, the Australian Securities Exchange has been known as the ASX Group (see Figure 8.1). The ASX Group is a multi-asset class, vertically integrated, exchange group whose activities span primary and secondary market services, including the raising, allocation and hedging of capital flows, trading and price discovery (Australian Securities Exchange); central counterparty risk transfer (via subsidiaries of ASX Clearing Corporation); and securities settlement for both the equities and fixed income markets (via subsidiaries of ASX Settlement Corporation).
The ASX functions as a market operator, clearing house and payments system facilitator. It also oversees compliance with its operating rules, promotes standards of corporate governance among Australia’s listed companies and helps to educate retail investors.
Confidence in the operations of the ASX is reinforced by the market supervision and regulatory role undertaken by the Australian Securities and Investments Commission (ASIC) across all trading venues and clearing and settlement facilities, as well as through the Reserve Bank of Australia’s oversight of financial system stability. ASIC also supervises ASX’s own compliance as a listed public company.
The ASX Group is a commercial and regulated organisation with some monitoring and supervisory responsibilities derived from its commercial licences. The ASX interacts with APRA and ASIC providing them with information but given that the ASX is a commercial organisation its responsibilities are limited as the following quote by the ASX describes:
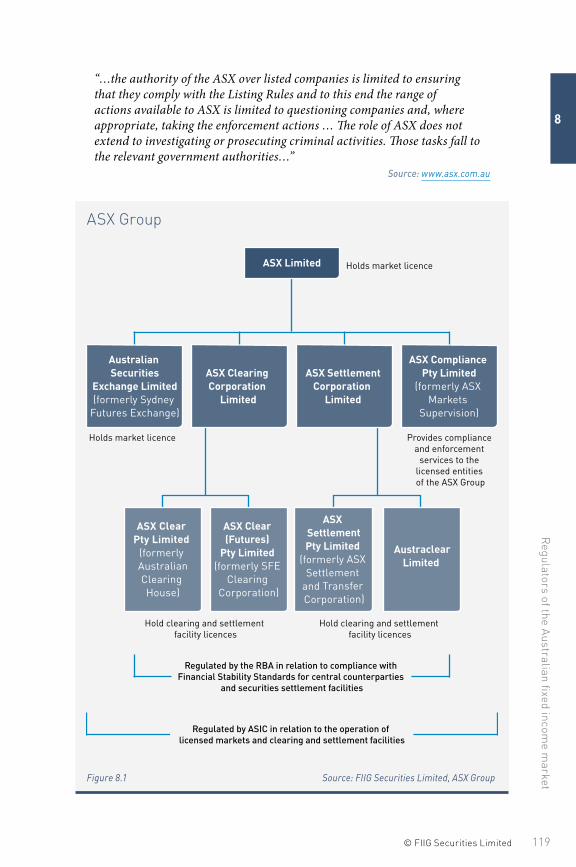
119© FIIG Securities Limited
Regulators of the A
ustralian fixed income m
arket
8
“…the authority of the ASX over listed companies is limited to ensuring that they comply with the Listing Rules and to this end the range of actions available to ASX is limited to questioning companies and, where appropriate, taking the enforcement actions … The role of ASX does not extend to investigating or prosecuting criminal activities. Those tasks fall to the relevant government authorities…”
Source: www.asx.com.au
ASX Group
ASX Limited Holds market licence
Regulated by the RBA in relation to compliance with Financial Stability Standards for central counterparties
and securities settlement facilities
Regulated by ASIC in relation to the operation of licensed markets and clearing and settlement facilities
ASX Clearing Corporation
Limited
ASX SettlementCorporation
Limited
Australian Securities
Exchange Limited(formerly Sydney
Futures Exchange)
ASX Compliance Pty Limited
(formerly ASX Markets
Supervision)
Holds market licence Provides compliance and enforcement
services to the licensed entities of the ASX Group
ASX Clear (Futures)
Pty Limited (formerly SFE
Clearing Corporation)
ASX Clear Pty Limited
(formerly AustralianClearing House)
AustraclearLimited
ASX SettlementPty Limited
(formerly ASX Settlement
and Transfer Corporation)
Hold clearing and settlement facility licences
Hold clearing and settlement facility licences
Figure 8.1 Source: FIIG Securities Limited, ASX Group
The Australian G
uide to Fixed Incom
e
120 © FIIG Securities Limited
8
As a licensed market operator and provider of clearing and settlement facilities, the ASX is obliged under the Corporations Act and under a Memorandum of Understanding with ASIC to notify ASIC of various matters, including any:
• suspected significant contraventions of the Corporations Act or of ASX’s listing rules or operating rules
• matters that may adversely affect the ability of a market participant to meet its obligations as a financial services licensee
• disciplinary action against a market, clearing or settlement participant for breaches of ASX’s operating rules
The executive office within ASX Compliance is responsible for bringing enforcement action against the market and clearing and settlement participants for breaches of ASX’s operating rules.
Currently, there are two enforcement processes in place, depending on when relevant events occurred:
• operating rule breaches that occurred prior to 1 August 2010 are brought before the Disciplinary Tribunal in accordance with the ASX Disciplinary and Appeals rulebook. A right to appeal is available from decisions of the Disciplinary Tribunal to the Appeal Tribunal
• operating rule breaches that occur on or after 1 August 2010 are brought before the ASX Chief Compliance Officer (CCO) in accordance with the ASX Enforcement and Appeals rulebook. A right to appeal decisions of the CCO to the Appeal Tribunal
For more information go to www.asx.com.au.
8.4 The Corporations Act 2001 and other legislationThe Australian financial markets, including the corporate bond market, are primarily governed by the Corporations Act 2001. The Corporations Act 2001 governs the activities of corporations as well as disclosure and other requirements for the issue of debt securities to investors. The Corporations Act 2001 makes a distinction between wholesale clients and retail clients with an emphasis on greater disclosure to the latter (see Chapter 20 Glossary).
ASIC administers the following legislation (or relevant parts):
• Corporations Act 2001
• Australian Securities and Investments Commission Act 2001
• Insurance Contracts Act 1984

121© FIIG Securities Limited
Regulators of the A
ustralian fixed income m
arket
8
• Superannuation (Resolution of Complaints) Act 1993
• Superannuation Industry (Supervision) Act 1993
• Retirement Savings Accounts Act 1997
• Life Insurance Act 1995
• Medical Indemnity (Prudential Supervision and Product Standards) Act 2003
Other regulators also administer some parts of these acts. For example, parts of the last four acts dealing with prudential regulation are administered by the Australian Prudential Regulation Authority (APRA).

Disclaimer
This publication is provided for general information purposes only and for educational guidance. It is not intended to be influential or advisory in terms of constituting financial advice or to assist in setting a personal investment strategy. FIIG has prepared this publication without consideration of the objectives, financial situation or needs of any individual investor. FIIG’s authors and all persons involved in the preparation and distribution of this publication are not thereby giving legal, accounting, fi nancial, taxation or other professional advice. Because of this, before acting on any text or information contained in this publication, investors should consider their individual objectives, financial situation and needs in light of the consequences of any decision they may make.
The information contained in this publication has been taken from sources believed to be reliable. The information contained in it is not necessarily complete and its accuracy cannot be guaranteed. Any opinions expressed in this book reflect the judgement of FIIG’s authors at the date of publication and are subject to change. Before acquiring a particular financial product, investors should obtain a disclosure document relating to the product and consider the information therein before making any decision about whether to acquire the product. Neither FIIG nor any of its directors, authorised representatives, employees or agents accept liability or responsibility arising in any way (including negligence) for errors in, or omissions from, this publication.
AG_001_ED280613