the business of evidence final - market research society · source: mrs/pwc (developedby steering...
TRANSCRIPT

The Business ofEvidence
A report prepared for theMarket Research Society
www.pwc.co.uk
An assessment ofthe size andimpact of the UKresearch andevidence market
Final report
October 2012

Contents
Executive summary i
Introduction 1
Towards an holistic estimate of the size and impact 4Towards an holistic estimate of the size and impactof the market
4
Conclusion 24
Appendices
Appendix 1: Interview topic guide 27
Appendix 2: Technical information 30
Appendix 3: Bibliography 37

Over recent decades, an unprecedented amount andquality of information has become available in real-time.This has encouraged and enabled an expansion of thetraditional ‘market research’ sector to the ‘business ofevidence’ sector. Opinion gatherers, researchers, dataanalysts and educationalists, collectively operate in the‘business of evidence’, defined for this report as:
“The collection and interpretation of customer, citizen orbusiness information for the purpose of informingcommercial and public policy decisions, improvingmanagement of customer or civic relationships, orimproving commercial or public management efficiency.”
Source: MRS/PwC (Developed by steering group for this project)
The MRS commissioned this study to:
• Identify the size and scale of the UK ‘business ofevidence’ market.
• Identify the market value and impact of the ‘businessof evidence’ market.
• Traditional providers account for around 40,000 FTEsand £1.8 billion in GVA.
• Non-traditional providers account for between 14,000and 19,500 full time equivalents (FTEs) and GVA ofbetween £800 million and £1.2 billion (with the rangedepending on the definitions and parameters ofidentifying this activities).
• The ‘business of evidence’ market accounts for 0.2% ofUK output making it comparable in size to the UKnewspaper publishing industry and the UK core filmindustry, larger than the UK music industry and morethan twice the size of the from UK radio industry.
• One-third of activity – £1 billion - is for foreign clientsand end users making the sector a substantial exporter,especially for London-based organisations.
• London and the South East account for 60% of sectoralemployment - 35,000 FTEs - and generating up to £1.8billion annually to the regional economy. The sector
Executive summary
of evidence’ market.
In addition to traditional market research providers,where data has already been captured by MRS, seven othertypes of ‘non-traditional providers’ from other sectors thatare involved in market, social and/or opinion researchwere identified, including:
• Other private sector organisations.• Higher education.• Data analytics.• Central Government.• Local Government.• Think tanks.• Charities.
The main findings from the report are:
• The UK ‘business of evidence’ market is substantiallylarger than previously estimated, employing up to59,000 people and generating £3 billion in annualgross value added (GVA).1
billion annually to the regional economy. The sectorgenerates GVA per worker substantially above theLondon and UK average. The sector in the rest of theUK produces up to an annual £1.2bn of GVA, rangingfrom around £196m in the North East to £27m inNorthern Ireland.
October 2012i
1Gross Value Added (GVA) is the value of goods and services the market generates minus the cost of the materials, and other inputsused to produce them. In this study, GVA mainly comprises employee earnings and profits generated.
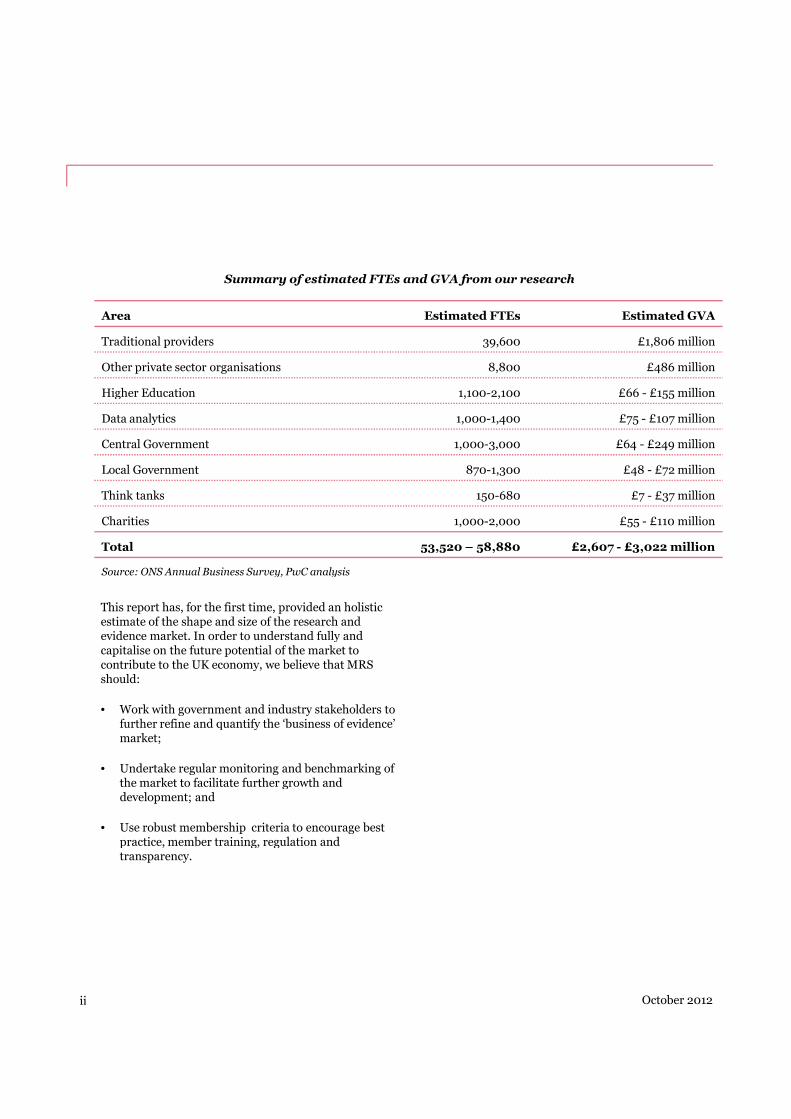
Area Estimated FTEs Estimated GVA
Traditional providers 39,600 £1,806 million
Other private sector organisations 8,800 £486 million
Higher Education 1,100-2,100 £66 - £155 million
Data analytics 1,000-1,400 £75 - £107 million
Central Government 1,000-3,000 £64 - £249 million
Local Government 870-1,300 £48 - £72 million
Think tanks 150-680 £7 - £37 million
Charities 1,000-2,000 £55 - £110 million
Total 53,520 – 58,880 £2,607 - £3,022 million
Summary of estimated FTEs and GVA from our research
This report has, for the first time, provided an holisticestimate of the shape and size of the research andevidence market. In order to understand fully andcapitalise on the future potential of the market tocontribute to the UK economy, we believe that MRSshould:
• Work with government and industry stakeholders tofurther refine and quantify the ‘business of evidence’market;
• Undertake regular monitoring and benchmarking ofthe market to facilitate further growth anddevelopment; and
• Use robust membership criteria to encourage bestpractice, member training, regulation andtransparency.
ii October 2012
Source: ONS Annual Business Survey, PwC analysis

“We help businesses understandbehaviours and attitudes. Thishelps them make betterdecisions.”Stakeholder consultation – traditional provider

BackgroundThe Market Research Society (MRS) is the world’s largestresearch association, representing organisations andprofessionals that provide or use market, social and/oropinion research. It also represents individuals andorganisations that are involved in providing businessintelligence, market analysis and customer insight.
MRS supports and encourages best practice by setting andensuring compliance to professional standards. Itenhances skills and knowledge by offering variousqualifications and membership grades. It also providestraining and professional development resources,through the provision of a wide range of publications,information services and conferences. Furtherinformation on MRS is available at www.mrs.org.uk.
Terms of referenceOver the past decade, an unprecedented level and quality
• Identify the market value and impact of the‘business of evidence’ market - this will involveexamining the direct contribution made by theresearch and evidence market in terms of revenuesand jobs, as well as a range of indirect benefits,including the impact of research on national andregional economic activity, including export-ledeconomic growth.
For the purposes of this project we are defining market,social and/or opinion research – the ‘business of evidence’- as:
“The collection and interpretation of customer, citizen orbusiness information for the purpose of informingcommercial and public policy decisions, improvingmanagement of customer or civic relationships, orimproving commercial or public managementefficiency.”
Source: MRS/PwC (Developed by steering group for this
Introduction
Over the past decade, an unprecedented level and qualityof global information has become available in real-timeand in high volumes. Facilitated by a combination ofcustomer loyalty schemes, online trading and exponentiallevels of internet and electronic activity, vast amounts ofpersonal and corporate data are now available to beanalysed and exploited by a wide variety of sectors forcommercial, academic, personal and government use.
Reflecting upon this change, MRS recognised the need tomeasure and connect with the entire market, not just thetraditional provider industry.
No longer can the industry simply be defined as ‘marketresearch’, as today’s opinion gatherers, researchers, dataanalysts and educationalists, comprise a tapestry oforganisations, collectively operating in the ‘business ofevidence.’
In response to the changes, MRS commissionedPricewaterhouseCoopers LLP (PwC) in December 2011 toexamine the scale and impact of the UK’s research andevidence market. The purpose of the study is to:
• Identify the size and scale of the UK ‘businessof evidence’ market - by identifying, in addition to‘traditional’ research providers, a range of otherproviders of market research, social research, dataanalysis and insight.
Source: MRS/PwC (Developed by steering group for thisproject)
ApproachThere were four key stages in our approach to this study:
• Desk-based research and initial consultations.This stage involved gathering intelligence on the sizeof the market research industry in the UK, building onthe information that MRS already gathered andprovided to PwC, and complementing this with aseries of initial consultations with the PwC networkand key market contacts to define and assess the widermarket.
• Interviews. We conducted 16 in-depth interviewswith representatives of leading organisations to fillinformation gaps and to ‘road test’ our initial thinkingand the emerging findings from the desk-basedresearch.
1 October 2012
• Review workshop. We held a workshop with MRS,the purpose of which was to share our findings, invitecomments and agree a timeline for production of thefinal report.
• Sector consultations. We shared findings withindividuals and organisations within the relevantsectors, and invited comment and feedback.
Given the absence of prior research and marketinformation, some outcomes of this report are high leveland qualitative. The key findings should be considered asindicative and, as befits new and primary research, theywill be elaborated upon and expanded on over timethrough more detailed stakeholder research andevaluation.
In order to map out the total size of the market, a widevariety of organisations were invited to participate in theresearch. In addition to traditional market research
Report structureThis report is structured into two main sections. Firstly,we estimate the size on the eight individual sub-sectors,and we then pull this information together to consider theoverall size and impact of the market and then weconsider the wider contribution of the market. Secondly,the conclusion summarises the key findings in the report,and sets out some preliminary recommendations.
In addition, the following appendices are included:
• Interview topic guide.• Technical information.• Bibliography.
research. In addition to traditional market researchproviders, seven other types of ‘non-traditional providers’from other sectors that are involved in market, socialand/or opinion research were identified. The sectorsconsidered were as follows:
• Other private sector organisations.• Higher education.• Data analytics.• Central Government.• Local Government.• Think tanks.• Charities.
In order to determine the overall contribution theresearch and evidence market makes to the UK, thisreport examined two main measures:
• Total employment.• Gross Value Added (GVA).
The detailed methodology used to estimate the scale andimpact of the ‘business of evidence’ market, including theestimates and sources for the above sectors and thecalculations comprising GVA and turnover, are outlined inAppendix 2.
2 October 2012

“We need to understand whatour customers want and,perhaps more importantly,why.”Stakeholder consultation – other private sectororganisations

IntroductionThe focus of this section is on defining the research andevidence market, and developing estimates ofemployment (FTEs) and GVA across the eight sectorsoutlined below. In this section, across the eight sectors,we set out the operating context, we estimate employmentand GVA, and finally we provide a case study in thatsector.
• Traditional providers.• Other private sector organisations.• Higher education.• Data analytics.• Central Government.• Local Government.• Think tanks.• Charities.
At the end of this section, we aggregate the eight sectors
Towards an holistic estimate of thesize and impact of the market
At the end of this section, we aggregate the eight sectorsto give an overall estimate of the UK market. We alsoprovide a preliminary assessment of the widercontribution of the market.
4 October 2012
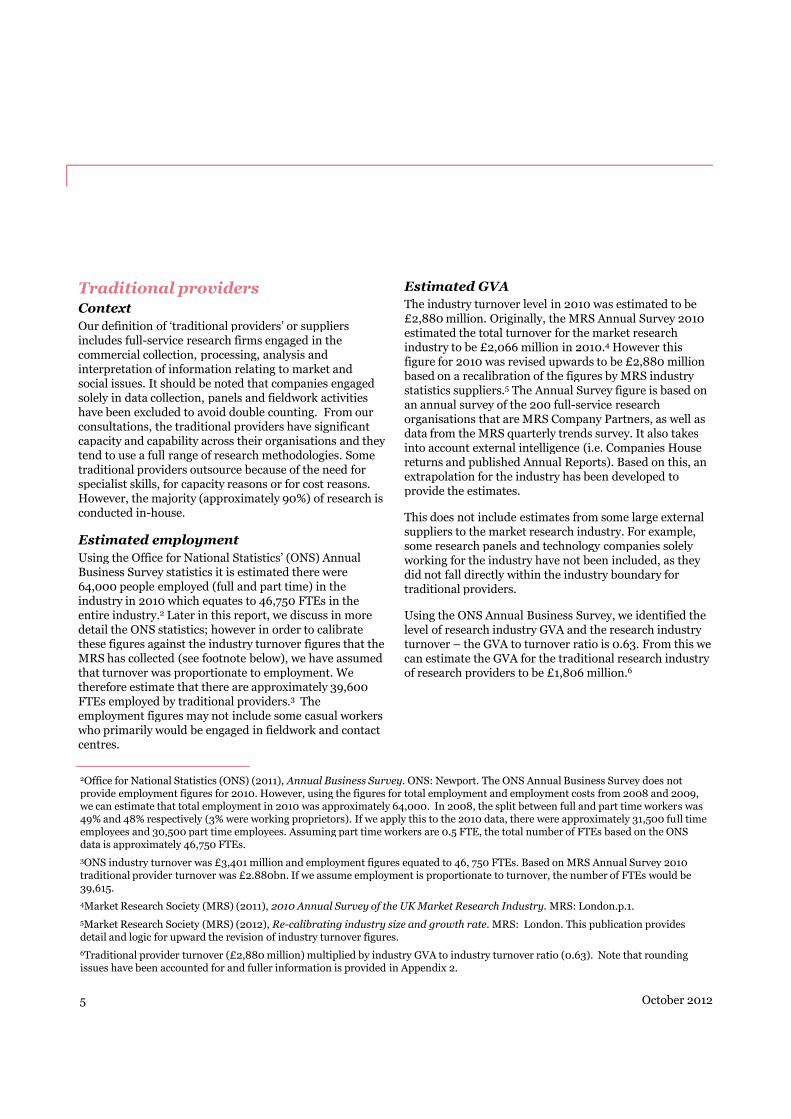
Traditional providersContext
Our definition of ‘traditional providers’ or suppliersincludes full-service research firms engaged in thecommercial collection, processing, analysis andinterpretation of information relating to market andsocial issues. It should be noted that companies engagedsolely in data collection, panels and fieldwork activitieshave been excluded to avoid double counting. From ourconsultations, the traditional providers have significantcapacity and capability across their organisations and theytend to use a full range of research methodologies. Sometraditional providers outsource because of the need forspecialist skills, for capacity reasons or for cost reasons.However, the majority (approximately 90%) of research isconducted in-house.
Estimated employment
Using the Office for National Statistics’ (ONS) Annual
Estimated GVA
The industry turnover level in 2010 was estimated to be£2,880 million. Originally, the MRS Annual Survey 2010estimated the total turnover for the market researchindustry to be £2,066 million in 2010.4 However thisfigure for 2010 was revised upwards to be £2,880 millionbased on a recalibration of the figures by MRS industrystatistics suppliers.5 The Annual Survey figure is based onan annual survey of the 200 full-service researchorganisations that are MRS Company Partners, as well asdata from the MRS quarterly trends survey. It also takesinto account external intelligence (i.e. Companies Housereturns and published Annual Reports). Based on this, anextrapolation for the industry has been developed toprovide the estimates.
This does not include estimates from some large externalsuppliers to the market research industry. For example,some research panels and technology companies solelyworking for the industry have not been included, as theyUsing the Office for National Statistics’ (ONS) Annual
Business Survey statistics it is estimated there were64,000 people employed (full and part time) in theindustry in 2010 which equates to 46,750 FTEs in theentire industry.2 Later in this report, we discuss in moredetail the ONS statistics; however in order to calibratethese figures against the industry turnover figures that theMRS has collected (see footnote below), we have assumedthat turnover was proportionate to employment. Wetherefore estimate that there are approximately 39,600FTEs employed by traditional providers.3 Theemployment figures may not include some casual workerswho primarily would be engaged in fieldwork and contactcentres.
working for the industry have not been included, as theydid not fall directly within the industry boundary fortraditional providers.
Using the ONS Annual Business Survey, we identified thelevel of research industry GVA and the research industryturnover – the GVA to turnover ratio is 0.63. From this wecan estimate the GVA for the traditional research industryof research providers to be £1,806 million.6
5
2Office for National Statistics (ONS) (2011), Annual Business Survey. ONS: Newport. The ONS Annual Business Survey does notprovide employment figures for 2010. However, using the figures for total employment and employment costs from 2008 and 2009,we can estimate that total employment in 2010 was approximately 64,000. In 2008, the split between full and part time workers was49% and 48% respectively (3% were working proprietors). If we apply this to the 2010 data, there were approximately 31,500 full timeemployees and 30,500 part time employees. Assuming part time workers are 0.5 FTE, the total number of FTEs based on the ONSdata is approximately 46,750 FTEs.
3ONS industry turnover was £3,401 million and employment figures equated to 46, 750 FTEs. Based on MRS Annual Survey 2010traditional provider turnover was £2.880bn. If we assume employment is proportionate to turnover, the number of FTEs would be39,615.
4Market Research Society (MRS) (2011), 2010 Annual Survey of the UK Market Research Industry. MRS: London.p.1.
5Market Research Society (MRS) (2012), Re-calibrating industry size and growth rate. MRS: London. This publication providesdetail and logic for upward the revision of industry turnover figures.
6Traditional provider turnover (£2,880 million) multiplied by industry GVA to industry turnover ratio (0.63). Note that roundingissues have been accounted for and fuller information is provided in Appendix 2.
October 2012

Summary
Traditional providers remain the bedrock of the industry.The MRS figures illustrate the extent and significance ofthe contribution to the industry, with almost 40,000FTEs.
Case study – traditional provider
Background
• Large global market research agency with UKturnover of £50m plus.
Size and positioning of research function
• Full-service market research agency withapproximately 1,000 employees in the UK.
• Primary research is the focus but there are increasingconsulting and data analytics elements. Serves a widerange of sectors, mainly focused on durable and fastmoving consumer goods.
Key focus/outcomes
• Commercially focused but methodologies based onacademic principles. The company prides itself oninnovative methodologies and technologies.
• Main research areas are customer choice andexperience. Choice - maps customer trends and used
Key metrics – traditional providers
Estimated employment (FTEs) 39,600
Estimated GVA £1,806 million
Source: PwC analysis
experience. Choice - maps customer trends and usedheavily in the retail and media sectors. Experience -more brand/attitude orientated and is used acrosssectors.
• Operate at strategic and tactical levels helping clientsunderstand behaviours and attitudes. Their clients areincreasingly focusing on Return on Investmentanalysis when making decisions and incommissioning research.
6
“We help businessesunderstand behaviours andattitudes. This helps themmake better decisions.”Stakeholder consultation – traditionalprovider
October 2012
Other private sector organisationsContext
Estimating the size of the in-house market researchfunctions in private sector companies was challenging,particularly as there has been limited research conductedpreviously in this area. As a result we have relied on ourconsultations with industry stakeholders to establishestimates for this sector. The MRS Annual Surveyestimated that private sector clients accounted for over80% of industry spend in 2010.7 We undertookconsultations based on the four areas which MRS believerepresent the greatest proportion of private sector clientspend in 2010:
• Food/beverages.• IT/Telecommunications and consumer technology.• Media.• Financial services.
Estimated employment
From our consultations we gathered information on bothtotal FTE employees and the number of FTEs employedin market, social and/or opinion research activities. Weestimated that around 0.6% of total employees in the foursectors were employed in market research. The totalnumber of UK private sector employees in companieswith more than 250 employees across the four sectorswas approximately 710,000.8 Therefore the total marketresearcher FTEs in these four sectors is approximately4,250 (710,000 times 0.6%).
In order to calculate the total FTEs in the remainingother private sector companies, we have extrapolated theresults as follows: the 4,250 FTEs for the four areasaccount for 40% of industry spend. Other private sectorcompanies account for 43% of spend (17% is governmentspend). If we assume that industry turnover isproportionate to employees, we can estimate the rest ofthe employees (by multiplying 43% by 4,250 and then
Using the information gained from our consultations, weobtained estimates of the number of market researcherswithin companies in the four sectors listed above. Using apro rata method, we then estimated the number ofmarket researchers across the four sectors andextrapolated this across the wider private sector. Athreshold level for market research services has been setinsofar as we assumed only private sector companieswith more than 250 employees will have an FTE orproportion of an FTE engaged in market research (forfurther information, see Appendix 2).
the employees (by multiplying 43% by 4,250 and thendividing by 40%). This gives approximately 4,550 FTEs.Therefore, total employment by other private sectorcompanies is estimated to be approximately 8,800 FTEs.
7
7Market Research Society (MRS)(2011) 2010 Annual Survey of the UK Market Research Industry. MRS: London. p.8.
8Office for National Statistics (ONS) (2011), Annual Business Survey. ONS: Newport. The total UK private sector employee data is fromthe ONS Annual Business Survey 2010. The employment figures are based on private sector employees for GB (the UK data wasactually lower due to suppression of Northern Ireland data). The data is for FTEs, we have assumed part time was 0.5 FTE. TheStandard Industry Classification (SIC) codes were used for the four sectors; food/beverage (10&11), IT/Telecommunications andconsumer technology (61-63), media (59, 60) and financial services (64).
In order to determine the number of companies and employees above our estimate of 250 employees, it is based on Department ofBusiness Innovation and Skills (BIS) (2011), Business Population Estimates for the UK and regions 2011. BIS: London. The estimatednumber of employees in the UK private sector was 19.064 million. The number employed in companies with more than 250 employeeswas 9.619 million. Hence, approximately 50% of UK private sector employees work for employers with more than 250 employees.
The employment across the four sectors was 1.4m employees from ONS and approximately 50% of employment is from companiesabove the 250 employee threshold from BIS. Hence, 710,000 is the overall figure.
October 2012

Estimated GVA
Our industry and stakeholder consultations found asignificant variation in average salary levels reflecting therange of skill levels. Based on our discussions and rewardinformation provided, we estimated that the averagesalary was approximately £30,000, giving an averagewage and salary bill of approximately £264 million. UsingONS Annual Business Survey, we obtained the level ofemployment costs and the sector’s GVA - where theemployment costs to GVA ratio is 1.84. From this weestimate the GVA for the other private sectororganisations to be £486 million.
Summary
In-house market research operations in private sectororganisations are the second largest area in employmentterms, after traditional providers. We estimate that thereare 8,800 FTEs in this area.
Case study – other private sectororganisation
Background
• A large professional services company with more than10,000 employees.
Size and positioning of research function
• A team of 20-30 researchers manage and commission(and conduct some) research.
• The research is across two main teams; a public policyteam, which commissions public policy research and amarket insights team which manages employee,customer, thought leadership and market research.
• The organisation has an agreed research programmeand budget in each Financial Year.
Key focus/outcomes
• The research team mainly manage and commissionresearch, particularly quantitative research. They alsoconduct some qualitative research.conduct some qualitative research.
• Research is commissioned across a range of sectors.The company has a strong track record on publicpolicy research and collaboration with otherorganisations such as think tanks and charities.
• Market/policy research helps to inform andstrengthen policies and strategies. Robust research isvital to this professional services company wherereputation is extremely important.
• Employment engagement research helps to track andimprove employee satisfaction and retention.
8
“We need to understand whatour customers really think ofthe service we’re providing.”Stakeholder consultation – other privatesector organisation
October 2012
Key metrics – other private sector
organisations
Estimated employment (FTEs) 8,800
Estimated GVA £486 million
Source: PwC analysis

Higher educationContext
Market and opinion research is becoming a morecommon and increasingly formalised function in HigherEducation Institutions (HEIs). Within HEIs we examinedtwo areas:
• Market research for and by HEIs.• Social research by HEIs.
In 2005, the HEI Market Researchers’ Forum wasestablished as an informal network of newly appointedmarket researchers across four to five institutions. TheForum has grown since 2005 and currently it representsaround 100 members from 60 institutions across the UK.Members must be employed by an HEI andpredominantly engaged in market research activity (i.e.they must spend at least 50% of their time on marketresearch).
Estimated employment
Our interviews with representatives from the HigherEducation sector found that the number of employeesengaged in market research activities by and for HEIs inthe UK is in the region of 100 FTEs. This number is likelyto grow significantly over the next five years.
The Economic and Social Research Council (ESRC)supports a further 4,000 researchers and postgraduatestudents in academic institutions and independentresearch institutes.9 There is no further breakdown ofthese 4,000 researchers either between economic andsocial research or full time and part time. However, basedon the ESRC’s seven broad categories of spend, we haveassumed that 50% are in economic or other research(which we will exclude) and that 50% potentially engagedin social research (as defined above).10 To account for fulltime versus part time we have introduced a range, hencethe number of FTE researchers and postgraduate students
research).
The key themes of market and opinion researchundertaken in the Higher Education sector relate to:
• Portfolio review and new programme development.• Evaluation of new and current markets and target
audiences (including demographic projections).• Evaluation of marketing and recruitment activities
(e.g. open days).• Competitor analysis and mystery shopping.• Branding.• Setting of fees/fee levels.• Student experience/satisfaction.
This list indicates that, in addition to the formalisedmarket research functions, HEIs undertake pockets ofresearch relating to academic quality and studentsatisfaction. Sector representatives considered ‘improveddecision making’ to be the main benefit of market, socialand/or opinion research undertaken by HEIs.
in academic institutions and independent researchinstitutes is estimated to be 1,000 t0 2,000. The totalnumber of FTEs is therefore estimated to be 1,100 to2,100.
Our interviews suggest that average salaries of theseindividuals ranged from £33,000 to £40,000. This isbetween the 60th and 75th percentile of salaries ofindividuals employed in HEIs in the UK.11
9
9Economic and Social Research Council (ESRC) (2011), What we do. ESRC: Swindon.
10 Economic and Social Research Council (ESRC) (2012), Vital Statistics 2011-2012. ESRC: Swindon. The ESRC do not break downresearchers or spend by economic or social research. But they have categorised major research investments into seven themes.Around £320 million is currently invested across these themes by the ESRC. We consider that four of these seven categories arebroadly social research and it accounts for 50% investment. From this we have assumed that research investment is proportionateto employees – hence the assumption that 50% of the 4,000 researchers are engaged in social research.
11Office for National Statistics (ONS) (2011) Annual Survey of Hours and Earnings (ASHE). ONS: Newport. SIC 854: Highereducation.
October 2012

Estimated GVA
According to the representatives we interviewed, mostHigher Education market research functions operate onrelatively small budgets (i.e. much less than 1% of thetotal expenditure for the institution). Most of this activity(approximately 90%) is conducted in-house, unless theproject requires large scale fieldwork. In such cases,where the institution does not have the internal capacityto undertake this work, it is usually outsourced. From ourconsultations, it is clear that the scale and importance ofmarket research activities varies significantly betweeninstitutions.
The estimated wage and salary bill has been calculatedusing the number of market and social researchers, i.e.1,100 and 2,100 multiplied by the estimated averagesalary of £33,000 to £40,000. Therefore, the totalestimated wage and bill is approximately £36 million to£84 million. Using the employment costs to GVA ratio of1.84, the estimated GVA impact is £66 million to £155
Case study – higher education
Background
• A mid-sized university with approximately 16,000students.
Size and positioning of research function
• A small team of researchers work on market researchfor and by the university, which is financed primarilyby the university.
• In addition, within the university are social scientiststhat use core research methodologies and are financedprimarily by the ESRC.
Key focus/outcomes
• Market research by and for the university centres onthe student engagement and experience. It alsoconsiders the student choice element (effectivelycustomer choice research).
• Social scientists operate across a wide range ofservices including some of ESRC’s seven funding areas1.84, the estimated GVA impact is £66 million to £155
million.
Summary
The level of research by and for HEIs is relatively small,yet it is becoming increasingly important due to thegrowing emphasis on commercialisation. As a result, thesector is putting additional resources into market researchservices.
services including some of ESRC’s seven funding areas(e.g. Health and Wellbeing research andUnderstanding Individual Behaviour research).
• The market analysis feeds into the strategydevelopment for the university courses marketing anddevelopment.
• Social research helps to fill in any information andunderstanding gaps not covered elsewhere.
10
Key metrics – higher education
Estimated employment (FTEs) 1,100-2,100
Estimated GVA £66-£155 million
Source: PwC analysis
“I think market research in HEIs willgrow over the next five years byabout 1-2 FTEs [per institute], whichis quite significant when youconsider its current size.”Stakeholder consultation – Higher Education
October 2012
Data analyticsContext
Data analytics is the process of examining raw data for thepurpose of drawing conclusions based upon thatinformation. It helps companies and organisations tomake better business decisions, particularly by examiningraw data within an information system or usinginformatics (computing or operational research) toanalyse and exploit large and complex data.
Defining and valuing the data analytics sector can bedifficult, particularly when trying to link it to marketresearch. However, what is clear is that data analytics isalready a significant segment of the research market andis playing an increasingly important part in its futuregrowth.
Estimated employment
The estimated employment can be derived from the
Estimated GVA
Estimating the value of the data analytics market ischallenging partly because of the range and nature ofservices. In Appendix 2, we set out our methodology forvaluing the UK data analytics market. Broadly, themethod involved:
• using a global valuation of information management.• estimating the global data analytics value.• estimating the UK data analytics value.• determining what categories of data analytics are
linked to the research and evidence market
In summary, we estimate the total value of the dataanalytics market in the UK to be somewhere between£360 and £460 million. In Appendix 2, we identified thatonly categories 1 (solving a business problem) and 3(providing ongoing analytics services) should be includedwithin the definition of market and social research. Wetherefore estimate the total contribution of data analyticsThe estimated employment can be derived from the
estimated UK turnover of data analytics (£120 million to£170 million). In order to determine the employment, anaverage turnover per FTE has been used. Using publiclyavailable information we broadly estimate turnover perFTE for data analytics companies to be £120,000.12
Employment is therefore estimated to be approximately1,000 to 1,400 FTEs. This figure will not include in-housedata analytics functions linked to market research – somust therefore be seen as a conservative estimate. It isarguable that a broader approach could be taken toinclude digital and social media companies withsignificant levels of data analytics and research linked tocustomer information e.g. Google and LinkedIn.Nevertheless, we have opted to remain with the narrowerdefinition.
therefore estimate the total contribution of data analyticsto the UK market research industry to be approximately£120 million to £170 million. Using the GVA to turnoverratio of 0.64, the estimated GVA impact is £75 million to£107 million.
11
12We have assumed that turnover per FTE was around £120,000. This is based on an analysis of selected traditional providers anddata analytics companies’ turnover per FTE.
October 2012

Summary
It is estimated that there are 1,000 to 1,400 FTEs workingpredominantly in data analytics. This reflects theimportance of presenting and analysing the data forcustomers and is a key part of the wider research offering.
Case study – data analytics
Background
• A small but innovative data analytics practice.
Size and positioning of research function
• Approximately 50 employees, with turnover of c£5m.
Key focus/outcomes
• The company focuses on customer/user experiencedata analytics and marketing analytics.
• The company provides data analytics andsegmentation services, and provides advice for theoptimisation of online and marketing strategies.
Key metrics – data analytics
Estimated employment (FTEs) 1,000–1,400
Estimated GVA £75–£107 million
Source: PwC analysis
12
“Data is really important toour business; Better data andanalysis, should mean betterresults.”Stakeholder consultation – data analytics
October 2012

Central GovernmentContext
The UK Central Government is a significantcommissioner of market, social and opinion research inthe UK. However it is also a direct employer ofresearchers. In this section we focus on the latter.
Based on our consultations, a broad mix of methodologiesare used in public sector research, with the majority ofresearch being outsourced because of capacity andcapability issues. Organisations also stressed theimportance of credibility. Research conducted by anindependent organisation relating to government policiesis perceived as strengthening outcomes. Ourconsultations suggested that departments tend to focuson directing, managing and commissioning research, asopposed to conducting it.
Over the past three years, those central government
• 1,000 social scientists based in 20 governmentdepartments and the devolved administrations.
• 1,400 professional statisticians spread across 30-plusgovernment departments, administrations andagencies.
A conservative estimate would only include the 1,000social scientists which is a lower band estimate. If all theoperational researchers, social researchers andstatisticians are included the upper band estimate wouldbe 3,000.
Estimated GVA
To calculate the overall value of research in CentralGovernment, the number of researchers (approximately1,000 to 3,000) was multiplied by the average salary. The2010 median salary of UK public sector workers was£28,545. Based on our consultations, respondentssuggested that the average researcher salary lay between
Over the past three years, those central governmentdepartments we spoke to stated that budgets have beenreduced but not eliminated, with research continuing tobe of key importance, and demand for in-house researchremaining particularly high.
Estimated employment
Based on a report produced by the AnalyticalCoordination Working Group13 approximately 1,000 to3,000 researchers are employed by Central Government,Non-Departmental Public Bodies or DevolvedAdministrations.14 These include:
• 360 operational research staff in 17 departments andagencies.
suggested that the average researcher salary lay between£35,000 and £45,000. Therefore, we estimate the totalwage and salary bill of research in Central Government tobe approximately £35 to £135 million. Using theemployment costs to GVA ratio of 1.84, the estimatedGVA impact is £64 million to £249 million.15
13
13Analytical Coordination Working Group is across the five analytical disciplines in government (economics, operational research,,social research, statistics, and science and engineering). The five organisations are Government Economic Service (GES),Government Operational Research Service (GORS), Government Social Research Service (GSR), Government Statistical Service(GSS), and Government Science and Engineering (GSE). We considered employment levels in GORS, GSR and GSS for this report.
14Analytical Coordination Working Group (ACWG) (2011), Analysis and Use of Evidence Research and analysis in government.ACWG: London. p.7-9.
15Office for National Statistics ONS (2011), Annual Survey of Hours and Earnings (ASHE). ONS: Newport. SIC 84: Publicadministration and defence; compulsory social security.
October 2012

Summary
Demand for market, social and/or opinion researchremains high in Central Government; however, budgetsare coming under pressure. Our consultations uncoveredsome strong examples where research has helped toachieve significant savings. There is a need for stronginformation driven decision making, and good researchshould play an important role in this.
Case study – Central Government
Background
• A research and insight team within a CentralGovernment department.
Size and positioning of research function
• A team of approximately 20 researchers within aCentral Government department.
• The team use a range of quantitative and qualitativetechniques, which are primarily commissioned fromresearch providers as opposed to being undertakenin-house.
• The team’s work contains elements of social, market,operational, behavioural and management research.
Key focus/outcomes
• The research and insight team tests new policies andevaluates existing policies.
• They have a particular focus on researching newpolices and measuring the impact policies have on
Key metrics – Central Government
Estimated employment (FTEs) 1,000-3,000
Estimated GVA £64–£249 million
Source: Analytical Coordination Working Group, PwC
Analysis.
polices and measuring the impact policies have onstakeholders at various socio-economic levels.
• They consider how to communicate policies, andassess which approaches will reach the maximumnumber of individuals.
• The research and insight team has helped to changethe focus of the government department’s activities,concentrating on measuring return on investment,changes in societal behaviour and assessing theimpact of policy outcomes.
14
“We can point to significantsavings as a result of our marketresearch. Our segmentationimproved and we tailored ourapproach. This meant we were ableto achieve a better return on ourinvestment.”Stakeholder consultation – Central Government
October 2012
Local GovernmentContext
As with Central Government, Local Government is asignificant commissioner of market, social and opinionresearch in the UK, and also has a considerable number ofresearchers employed in-house. In this section, we focuson the latter. According to national statistics between 2.8million and 2.9 million people were employed by LocalGovernment in the UK in 2010/11,16 equating to between2.1 million and 2.2 million FTEs.17 The organisation andfunctions performed by Local Government varythroughout the UK.
Our interview findings suggest that where LocalAuthorities (LAs) undertake market, social and/oropinion research this is used to gauge satisfaction withexisting service provision, and to help shape future serviceprovision. From the consultations, there is also evidenceof significant levels of internal research on staff
Of course, the shape and size of LAs across the UK differsconsiderably. We attempted to stratify councils byemployment levels to reflect the fact that large LAs arelikely to have larger research functions than smaller LAs.However, UK wide statistics were not available, so theestimate of 2-3 FTEs per LA was used (based on ourstakeholder consultations), which may prove to be aconservative estimate.
Estimated GVA
We have used the estimated employment figures toestimate the cost of this staff time to be between £26million and £39 million (i.e. based on 870 to 1,300 FTEswith an average salary of approximately £30,000). Usingthe employment costs to GVA ratio of 1.84, the estimatedGVA impact is £48 million to £72 million.
However, it should be noted that stakeholders found thatthe scale of this activity may be decreasing due to areduction in statutory research and evaluationof significant levels of internal research on staff
engagement conducted by Local Government researchers.
Estimated employment
Our initial assessment suggested that LAs devoterelatively limited in-house resources to market, socialand/or opinion research. However subsequent researchinferred that some 0.9% of the Local Governmentworkforce (which would equate to between 18,900 and19,800 FTEs), undertake, amongst other activities,research and consultation functions, including market,social and/or opinion research. Nevertheless, interviewswith representatives of LAs subsequently found that thenumber of FTEs engaged solely or mainly in market,social and/or opinion research alone is actually muchlower, at circa 2-3 FTEs per LA – including analysts andstatisticians. Grossing this figure up by the 433 LAs18 inthe UK, results in estimated FTEs of approximately 870 to1,300.
reduction in statutory research and evaluationrequirements, and falling LA budgets.19
15
16Office for National Statistics (ONS) (2011), Public Sector Employment. ONS: Newport. Q2 2011, Table 1.
17Office for National Statistics (ONS) (2011), Public Sector Employment. ONS: Newport. Q2 2011, Table 3.
18Direct Gov (2012), A-Z of local councils. HM Government: London. [online] available at<http://www.direct.gov.uk/en/Dl1/Directories/Localcouncils/AToZOfLocalCouncils/DG_A-Z_LG>[last accessed 26th September2012]. In England, there are 354 elected local authorities, Wales 22, Scotland 32 and Northern Ireland 26.
19For example, the national requirement for LAs to complete a two-yearly residents’ survey has been removed.
October 2012
Case study – Local Government
Background
• A research and insight team within a City Council.
Size and positioning of research function
• A team of 12 researchers manage the researchprogramme with access to an 80 person contactcentre, which is run by the Council.
• The 12 researchers are across the consultation,research and information teams, which focus on howCouncil activities impact on local residents (the threeteams use core research methodologies).
• The team conducts all its own research and uses arange of quantitative and qualitative techniquesincluding focus groups, telephone survey and e-surveys.
Key focus/outcomes
• The Council has conducted a bi-annual residents’survey, a parents’ survey on school meals, and surveys
Summary
We estimate that there are between 870 and 1,300employees engaged full-time in market research activities.However, the recent fiscal tightening has put pressure onthe budgets for market research within LocalGovernment.
Key metrics – Local Government
Estimated employment (FTEs) 870 - 1,300
Estimated GVA £48 - 72 million
Source: PwC analysis
survey, a parents’ survey on school meals, and surveyson a range of other education, health and social issues.
• This Council feel they are probably atypical in thatmost LAs have similar research requirements (bothstatutory and non-statutory) but choose to buy-in theresearch.
• The Council feel they have more control over theresearch and insight process, and can be more cost-efficient and effective responding to the needs of theCity Council by conducting all their research in-house.They feel that as the Council provides over 700+services, having strong research and insight is vital toensuring value for money and successfully deliveringthe services required.
16
“We aren’t conducting anymarket research at the minutebecause of budget cuts...it won’tcome back for the next 2-3years.”Stakeholder consultation – Local Government
October 2012
Think tanksContext
Think tanks are organisations that conduct research andengage in advocacy in areas such as social policy, politicalstrategy, economics and technology. Most think tanks inthe UK are non-profit organisations, often generatingrevenue streams by charging subscription fees for eventsand publications related to their research projects.
Our desk-based research found that there areapproximately 100 such think tanks in the UK engaged inresearch, consultancy and policy development. Initialconsultations confirmed that many of these organisationstypically undertake some form of market, social and/oropinion research. Our interviews with representativesfrom three think tanks found that the types of market,social and/or opinion research that they conduct include:
• Focus groups.
Estimated employment
Our initial desk research and stakeholder consultationsfound that approximately 1,500 individuals are employedby think tanks in the UK (i.e. 100 think tanks eachemploying an average of 15 people). Based on ourinterviews with representatives from three UK think tanksthe proportion of FTEs devoted to market, social and/oropinion research ranges from 10% to 45% depending onthe nature of the organisation and the type of work that itundertakes. Applying these proportions to the overallemployment in the UK, think tanks provide an estimatedemployment in market, social and/or opinion research ofbetween 150 and 680 FTEs.
Estimated GVA
Our in-depth interviews suggest that the average salaryfor an individual engaged in market, social and/oropinion research in a UK think tank is in the region of£27,000 to £29,000. Assuming there are between 150 and• Focus groups.
• Citizens’ juries.• Polling/survey work.• Consultations/round table discussions with subject
matter experts.
These methodologies are generally used to complementthe organisation’s desk research and analysis of secondarydata. Interviewees identified the key benefit derived fromundertaking market, social and/or opinion research to betransforming their work into credible research by:
• Canvassing ‘real-life’ opinion.• Validating and testing ideas.• Making recommendations more robust.
680 employees with a median salary of £27,000-£29,000,this gives an estimated wage and salary bill ofapproximately £4 million to £20 million. Using theemployment costs to GVA ratio of 1.84, the estimatedGVA impact is £7 million to £37 million.
17 October 2012

Summary
Think tanks are estimated to employ approximately 150 to680 employees who are engaged full time in market,social and/or opinion research. Quantitative andqualitative research helps to inform their policy positions.
Case study – think tanks
Background
• Think tank with a public policy focus.
Size and positioning of research function
• A team of seven full-time researchers representingapproximately half of the think tank’s staff.
Key focus/outcomes
• The main techniques used are: focus groups,deliberative research (citizens’ juries) and pollingsurvey work. The polling survey work is outsourcedfor capacity reasons, but the other primary research isconducted in-house. The think tank also conductssecondary research and desk based reviews.
• They focus on public policy issues and themes such aspublic services, welfare, family and society.
Key metrics – think tanks
Estimated employment (FTEs) 150-680
Estimated GVA £7-£37 million
Source: PwC analysis
18
“Market research turns a thinkpiece into a credible piece ofresearch and makes ourrecommendations morerobust.”Stakeholder consultation – think tank
October 2012
CharitiesContext
The economic climate of recent years has provedchallenging to charities, with funding squeezed whiledemand rises. The consultations undertaken highlightedthe need for strong research skills, as return oninvestment and outcomes become increasingly important.
Estimated employment
In the UK, there are over 160,000 registered charities.The National Council for Voluntary Organisationsestimates that based on the Labour Force Survey, 765,000people were employed in the voluntary sector in 2010.This consisted of 477,000 full time workers and 288,000part time workers. If we assume the part time worker is0.5 FTE, the overall level of FTEs in the sector equates to621,000 persons.
In our interviews, charities pointed to significant
Estimated GVA
Based on evidence from our consultations, we estimatethe average salary to be £30,000. The total estimatedwage and salary bill on research activities is thereforeestimated to be approximately £30 million to £60 million.Using the employment costs to GVA ratio of 1.84, theestimated GVA impact is £55 million to £110 million.
In our interviews, charities pointed to significantcollaboration between smaller charities in relation toresearch activities, and we set a threshold based on thisinformation. We assumed that charities with income ofmore than £5 million will have a research FTE orproportion of an FTE. If we assume income isproportionate to employees, then the number of FTEs inlarge charities is 410,000.20
Based on evidence from our consultations, we estimatethat research accounts for between 0.25% to 0.50% oftotal employment for the largest charities. Totalemployment in the sector is therefore estimated to bebetween 1,000 and 2,000 FTEs.
19
20Charity Commission(2012), Charities by income band. Charity Commission: London. [online] available at <http://www.charity-ommission.gov.uk/ShowCharity/RegisterOfCharities/SectorData/CharitiesByIncomeBand.aspx> [last accessed 23th May2012].Charity Commission estimate total income for UK charities was £56.3 billion in 2011, 66% of income was from largecharities (over £5 million). If we assume employment and income are proportionate, the large charities will employ 66% of the621,000 FTEs, c410,000 FTEs.
October 2012

Summary
It is estimated that there are 1,000 to 2,000 FTEsemployed in market, social and/or opinion researchacross UK charities. There appears to be significantcollaboration in sharing and conducting research acrossthe sector.
Case study – charities
Background
• A large charity with income of over £100m and morethan 1,000 employees.
Size and positioning of research function
• The charity has a considerable number of researchersacross its activities, although there is not a totalaggregated number available. However, for example,in an education section there are four full timeresearchers who commission and manage primaryresearch for the charity.
Key focus/outcomes
• The research team for education focuses on marketanalysis (e.g. forecasting of market size and trends)and on charity donor choices/motives.
• The charity mainly outsource research and insightgeneration due resource constraints.
Key metrics – charities
Estimated employment (FTEs) 1,000 – 2,000
Estimated GVA £55-£110 million
Source: PwC analysis
generation due resource constraints.
• The research teams help to support decision makingand drive priorities.
20 October 2012
“Research helps us focus onwhere we are needed and howwe can make a difference.”
Stakeholder consultation – charities

Overall estimate of the size of the UKmarketBased on the key findings presented earlier, we haveaggregated the employment and GVA estimates across theeight sectors to estimate the overall size of the market (seetable below).
The estimated number of people employed in market,social and/or opinion research in the UK is approximately53,520 to 58,880 FTEs. Traditional providers areestimated to account for 39,600 FTEs, and non-traditional providers account for 13,920 to 19,280 FTEs.
The estimated GVA of the industry is approximately£2,607 to £3,022 million. Traditional providers’ GVA isestimated, to be £1,806 million, and non-traditionalproviders’ GVA is estimated to be £801 to £1,216 million.
In Appendix 2, we have considered how our researchcompares to the ONS statistics. The ONS statisticseffectively only capture the contribution of traditionalproviders and therefore value the GVA contribution to bearound £1,865 million. Our research provides a moreholistic view of the size and shape of the market.
To put our research in context, the ‘business of evidence’market accounts for 0.2% of UK output21 making itcomparable in size to the UK newspaper publishingindustry22 and the UK core film industry23, larger than theUK music industry24 and more than twice the size of theUK radio industry.25
Summary of estimated employment and GVA from our research
21 October 2012
Area Estimated FTEs Estimated GVA
Traditional providers 39,600 £1,806 million
Other private sector organisations 8,800 £486 million
Higher Education 1,100-2,100 £66 - £155 million
Data analytics 1,000-1,400 £75 - £107 million
Central Government 1,000-3,000 £64 - £249 million
Local Government 870-1,300 £48 - £72 million
Think tanks 150-680 £7 - £37 million
Charities 1,000-2,000 £55 - £110 million
Total 53,520 – 58,880 £2,607 - £3,022 million
Source: ONS Annual Business Survey, PwC analysis
21PwC estimate - GVA in the research and evidence market in 2010 was estimated to be 2,607 to £3,022 million (from this report).Total GVA in all industries in the UK was estimated to be £1,308,962 million in 2010 (Office for National Statistics (ONS) (2012),United Kingdom National Accounts, The Blue Book, 2012 edition. ONS: Newport).22PwC (2012), The Global Entertainment and Media Outlook 2012-2016. PwC: London.23Oxford Economics (2010), The Economic Impact of the UK Film Industry. Oxford Economics: London.24PwC (2012), The Global Entertainment and Media Outlook 2012-2016. PwC: London.25Ofcom (2011), The Communications Market 2011. (Eighth Annual Communications Market Report). Ofcom: London.
Wider contribution of the UK marketThe research presented in this report has attempted toquantify the employment and GVA contribution themarket makes to the UK economy. It is equally importantto consider the wider contribution to the UK economy.Some of the key wider contributions include:
• The research and evidence market contributesnotable revenues for the UK Governmentthrough taxation. The income tax contribution willbe noteworthy, given that almost 60,000 areestimated to be employed in the market directly.Furthermore, these employees appear to be on aboveaverage salaries, therefore increasing the tax take. Interms of corporation tax, the revenue will be notablegiven, for example, that turnover for traditionalproviders and data analytics is over £3 billion.26
• The contribution to ‘brand UK’. The UK industry
• The UK market is innovative and is a stimulusfor other sectors. The GDP generated by the marketas a percentage of the UK economy is under 1%, butthe market acts as a stimulus to the wider advertising,communication and marketing environment.
• “Training the world”. The UK market is at theforefront of training in best practice methodologies,data ethics and innovative research methods.
• The efficient allocation of resources. Betterinformation generally means better decisions. Thevalue of research is about getting the information thatmatters, and providing insights.
• The contribution to the UK regions andparticularly the South East where GVA isestimated to be £1.8 billion. The research andevidence sector makes a considerable contributionacross the UK regions in terms of employment and• The contribution to ‘brand UK’. The UK industry
has been central to improving and innovating theresearch offering. UK Trade and Investment (UKTI)recognise the importance of research to ‘brand UK’; inthe 2009/10 UKTI Inward Investment Report theyhighlighted that the UK was independently ranked asthe strongest research base in Europe, and onlysecond to the USA globally.27
• The export of research and evidence services.The UK is a hub for research companies andsignificant revenues are generated from the export ofthis tradeable service. Based on information providedby UK based research agencies, around 33% ofturnover was generated internationally.28
across the UK regions in terms of employment andGVA (see Appendix 2). While the South East is thelargest region for MRS membership, the regionsoutside the South East play an important part in theUK research offering. The regional cost base isgenerally lower but skill levels remain strong. Someproviders have added significant value to their processby locating certain operations outside of the SouthEast.
22
26It should be noted that a considerable level of the £2,882 million UK industry turnover in 2010 is generated by foreign ownedcompanies (particularly US, French and German companies) resulting in some dilution of tax revenues.
27United Kingdom Trade & Investment (UKTI) (2010), UK Inward Investment Report 2009-2010. UKTI: London. p.12.
28Market Research Society (MRS) (2012), 2011 Annual Survey of the UK Market Research Industry. MRS: London.
October 2012

“We can point to significantsavings as a result of ourmarket research. Oursegmentation improved and wetailored our approach. Thismeant we were able to achieve abetter return on ourinvestment.”Stakeholder consultation – Central Government

Conclusion
This report further defines and estimates the size of theUK research and evidence market. We have identifiedand defined eight sectors that we feel fit within the remitof a new, wider and evolving research and evidencemarket. Across these eight sectors we have developedestimates of employment and GVA based on acombination of consultations and secondary research.
Overall, the UK ‘business of evidence’ market issubstantially greater than previously conceived,employing up to 59,000 people and generating annualGVA of up to £3bn. This is considerably greater than theGVA estimate of around £1.8 bn from the ONS, whichcaptures data from only those traditional providers citingmarket research as their primary activity.
Nevertheless, at a sectoral level, traditional providersremain the largest employers with almost 40,000workers, while non-traditional providers across the UKaccount for up to 19,000 researchers across the public
The UK research and evidence market has facedchallenges in the past and will face more in the future. Inorder to understand and capitalise fully on the futurepotential of the market to contribute to the UK economy,we believe that MRS should:
• Work with government and industry stakeholders tofurther refine and quantify the ‘business of evidence’market.
• Undertake regular monitoring and benchmarking ofthe market to facilitate further growth anddevelopment.
• Use robust membership criteria to encourage bestpractice, member training, regulation andtransparency.
account for up to 19,000 researchers across the publicsector, education, industry and the third sector.
This report confirms the strong foundation of the researchand evidence market in London and the South East, withapproximately £1.8 bn generated annually by the sectorthere. It also highlights the UK regional wealth creation,generating up to an annual £1.2bn of GVA outside Londonand the South East; ranging from a potential £190m inthe North East to £27m per annum in Northern Ireland.
The UK research and evidence market has a global reachand is hub for innovation, training and best practice. Thiscan be illustrated by around 33% of activity that isundertaken for clients and end users outside the UK,making the sector a substantial exporter and contributorto brand UK.
24 October 2012

“Research helps us focus onwhere we are needed and howwe can make a difference.”Stakeholder consultation – charities

Appendices
Appendix 1: Interview topic guide 27
Appendix 2: Technical information 30
Appendix 3: Bibliography 37Appendix 3: Bibliography 37

Appendix 1: Interview topic guide
Size of the market research industry in the UKIntroduction
Hello, my name is ____________________ I am calling from PwC. PwC has been commissioned by the MarketResearch Society (MRS) to undertake research to estimate the scale of market, social and opinion research in the UK. Aswell as considering market research providers this work will take a more holistic view and include a range of otherproviders of market research, social research, opinion polling, data analysis and insight.
To help inform this research we are undertaking interviews with a range of organisations that conduct these types ofresearch. This interview will take around 15 minutes of your time. We are very grateful for your participation in thisimportant research, which will provide evidence of the industry’s contribution to the UK economy.
PwC is a MRS company partner and will be conducting this study in line with the MRS Code of Conduct therefore allinformation that you provide will be treated in the strictest confidence. Your responses to this interview will beanonymised and used to inform our estimates of the size of the industry and its contribution to the UK economy. Thesefindings will be presented to MRS in the form of a written report.
PwC agreed a list of target organisations with MRS in advance of commencing this interview programme. Therefore,whilst all responses will be anonymised and aggregated within our draft and final reports, it may be possible forwhilst all responses will be anonymised and aggregated within our draft and final reports, it may be possible formembers of the MRS project management team to identify particular organisations using the aggregated data providedalong with their knowledge of the target organisations. Do you give us permission to share your responses with the MRSin this way?
Yes No
Company characteristics
27
Name of interviewee:
Position/job title:
Organisation:
Industry/sector:
Average annual turnover/ budget/ spend (if known):
Total workforce (in FTE if known):
Estimated turnover/budget/spend on market, social and/or opinion research (in £m if known):
Estimated workforce engaged in market, social and/or opinion research (in FTE if known):
This section is to be completed before interview based on the information gathered during our desk
research and initial consultations.
October 2012

Market, social and/or opinion research activityFor the purposes of this project we are defining market, social and/or opinion research as:
1. Please describe the type(s) of market, social and/or opinion research which your organisationundertakes (e.g. what methodologies do you use)?
2. In your opinion, is this activity typical of organisations in your industry/ sector?
Yes No
3. What was your total budget for market, social and/or opinion research in FY2010/11?
The collection and interpretation of customer, citizen or business information for the purpose ofinforming commercial and public policy decisions, improving management of customer or civicrelationships, or improving commercial or public management efficiency.
Is this typical of your annual market, social and/or opinion research budget over the last 3 years?
4. Approximately what proportion of this budget was spent on research (market, social and/or opinionresearch) conducted by your workforce (i.e. employees on your organisation’s payroll) compared toexternal contractors/ suppliers or agency staff?
Is this typical?
5. How does your organisation decide which research projects to conduct internally and whichprojects to commission externally?
6. Can you estimate how much of your workforce’s time was spent undertaking market, social and/oropinion research in FY2010/11? (Guide the interviewee to help them express their answer in FTE,e.g. one person working 3 days per week equals 0.6 FTE)
7. Thinking about those individuals within your organisation who undertook market, social and/oropinion research in FY2010/11, can you estimate within which of the following ranges their medianannual pay for 2011 would fall?
28 October 2012
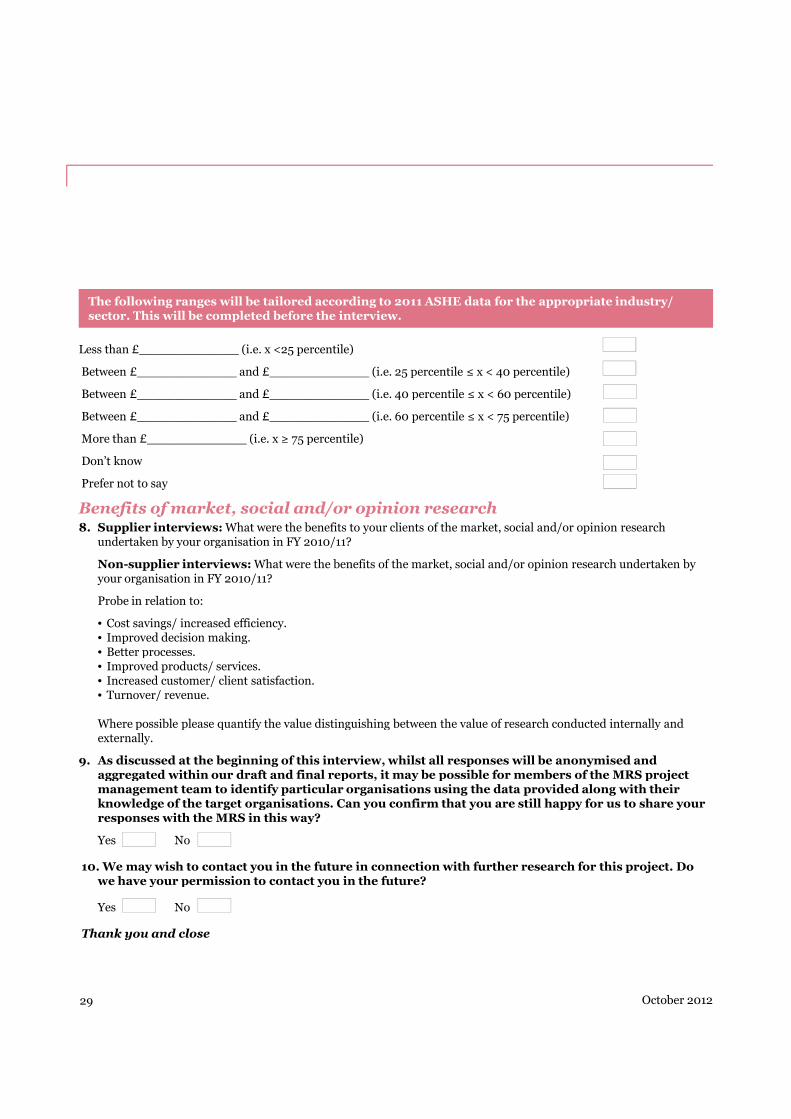
Less than £_____________ (i.e. x <25 percentile)
Between £_____________ and £_____________ (i.e. 25 percentile ≤ x < 40 percentile)
Between £_____________ and £_____________ (i.e. 40 percentile ≤ x < 60 percentile)
Between £_____________ and £_____________ (i.e. 60 percentile ≤ x < 75 percentile)
More than £_____________ (i.e. x ≥ 75 percentile)
Don’t know
Prefer not to say
Benefits of market, social and/or opinion research8. Supplier interviews: What were the benefits to your clients of the market, social and/or opinion research
undertaken by your organisation in FY 2010/11?
Non-supplier interviews: What were the benefits of the market, social and/or opinion research undertaken by
The following ranges will be tailored according to 2011 ASHE data for the appropriate industry/sector. This will be completed before the interview.
Non-supplier interviews: What were the benefits of the market, social and/or opinion research undertaken byyour organisation in FY 2010/11?
Probe in relation to:
• Cost savings/ increased efficiency.• Improved decision making.• Better processes.• Improved products/ services.• Increased customer/ client satisfaction.• Turnover/ revenue.
Where possible please quantify the value distinguishing between the value of research conducted internally andexternally.
9. As discussed at the beginning of this interview, whilst all responses will be anonymised andaggregated within our draft and final reports, it may be possible for members of the MRS projectmanagement team to identify particular organisations using the data provided along with theirknowledge of the target organisations. Can you confirm that you are still happy for us to share yourresponses with the MRS in this way?
Yes No
10. We may wish to contact you in the future in connection with further research for this project. Dowe have your permission to contact you in the future?
Yes No
Thank you and close
29 October 2012
Appendix 2: Technical information
How we estimated the scale and impact of the marketFor the eight types of sectors, we sought to develop an estimate of the scale of their research activities. Across the eightareas we have developed estimates for:
• Employment (full time equivalents, FTEs).• Gross Value Added (GVA).
It is important to note the following two points: firstly, information was mainly based on the most recent data availablewhich was generally 2010. We were conscious that this measured the market at a point in time, but is hopefullyreflective of the ‘natural’ size of the market. Secondly, where information was limited, a conservative estimate has beenused.
The employment estimates have been developed by PwC, based on the interviews we conducted, secondary research(primarily ONS for traditional providers and ACWG for Central Government), and other assumptions.
The GVA estimates have been developed using ONS statistics. Ideally, GVA estimates would be developed from turnoverfigures. However, some of the sectors will not have this information available. For example, Public Sector organisations,do not produce turnover figures, and in large national and multi-national organisations, market research is reported asan expenditure component, and so relevant turnover data is not available.an expenditure component, and so relevant turnover data is not available.
Instead we have used employment costs as a bridge to obtain GVA figures. The result is that we have used the estimatedwage and salary bill29 (employment costs) for six of the eight sectors: other private sector organisations, highereducation, Central Government and Local Government, think tanks and charities. We used turnover figures fortraditional providers and data analytics.
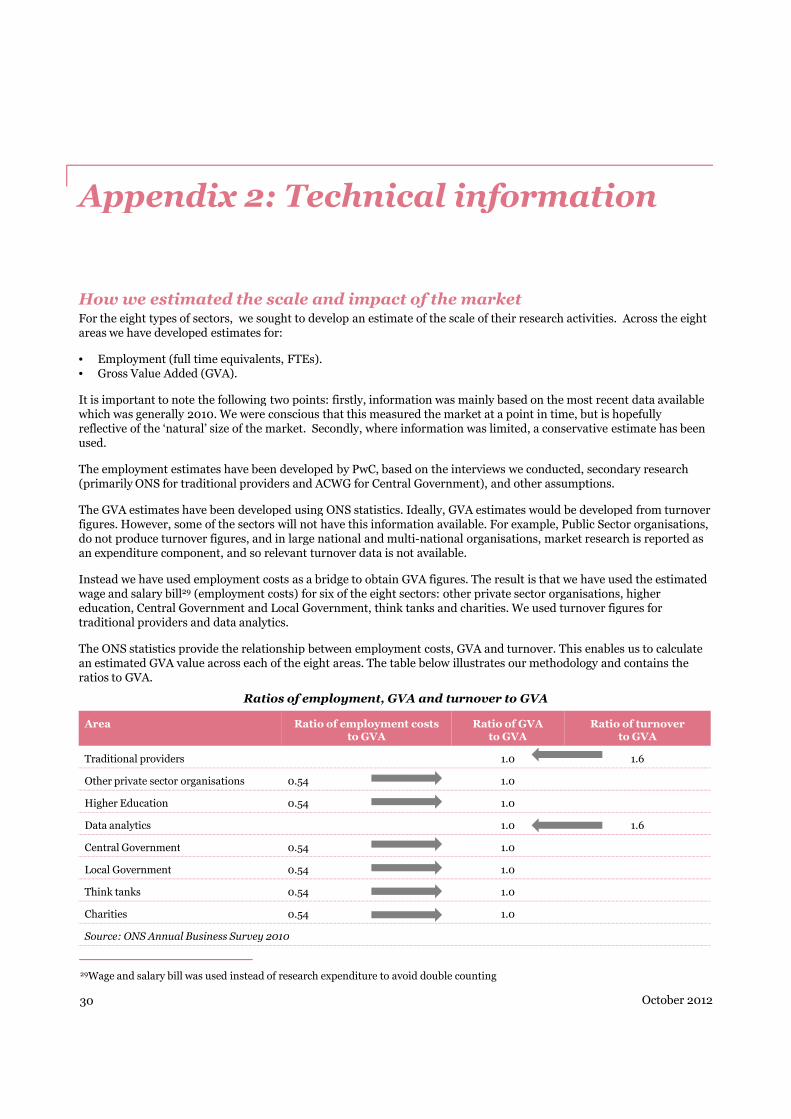
The ONS statistics provide the relationship between employment costs, GVA and turnover. This enables us to calculatean estimated GVA value across each of the eight areas. The table below illustrates our methodology and contains theratios to GVA.
30 October 2012
29Wage and salary bill was used instead of research expenditure to avoid double counting
Ratios of employment, GVA and turnover to GVA
Area Ratio of employment coststo GVA
Ratio of GVAto GVA
Ratio of turnoverto GVA
Traditional providers 1.0 1.6
Other private sector organisations 0.54 1.0
Higher Education 0.54 1.0
Data analytics 1.0 1.6
Central Government 0.54 1.0
Local Government 0.54 1.0
Think tanks 0.54 1.0
Charities 0.54 1.0
Source: ONS Annual Business Survey 2010

An example of how to calculate GVA from these ratios is provided below.
Estimated wage and salary billEstimated wage and salary = £1.00 millionWage and salary bill to GVA = 1.84 (1.00/0.54)Estimated GVA = £1.00 million x 1.84 = £1.84 million
Estimated turnoverEstimated turnover = £1.00 millionGVA to turnover = 0.63 (1.00/1.60)Estimated GVA = £1.00 million x 0.63 = £0.63 million
How we estimated other private sector employment
The chart below is based on a survey of 56 companies which covers 40% of the industry in terms of sales. Collectively,the four relevant sectors accounted for 40% of client spend in 2010. In order to obtain the overall number of in-houseresearchers in the sector –the following method was used:
• Obtain company estimates of research FTEs (γ).• Obtain total employment in the company (β).• Calculate percentage of researchers in the company (α).• Calculate percentage of researchers in the company (α).• Obtain an arithmetic average of the researchers as a percentage of total employees for the companies sampled( ).• Obtain total employees across the four sectors who work in companies with more than 250 employees from
ONS/BIS data (δ).• Estimate number of in-house researchers across the four sectors (μ).• The final stage is estimating the proportion of researchers in the rest of the private sector (Pro-rata sector spend
against employees).
Client sector share of spend on market research in 2010
Source: MRS (2011) 2010 Annual Survey of the UK Market Research Industry. MRS: London. p8.
31 October 2012
Government andpublic services
17%
Food/ beverages13%
IT/ Telecom.s &consumertechnology
12%Other fast-
moving consumergoods10%
Media10%
Other consumergoods/ services
9%
Financialservices
8%
Non OTCpharmaceuticaland medicine
6%
Businessgoods &services
5%
Retail (inc.Mail order)
4%
Transport, travel& tourism
2%
Vehicles4%

How we estimated UK data analytics turnover
The following method was used:
• Obtain global information management turnover.• Determine proportion of global information management turnover that is data analytics.• Map out the categories of data analytics and group into three main categories: solving business problems, creating
an information and analytics capability and providing an on-going information and analytics service .• Estimate the value of these three categories of data analytics based on turnover information.• Identify the relevant data analytics categories that are linked directly to market research. Categories 1 and 3 fall• Identify the relevant data analytics categories that are linked directly to market research. Categories 1 and 3 fall
within our working definition of market, social and/or opinion research. Category 2 does not.• Estimate the UK value of these categories based on the global value. A lower and upper bound estimate has been
used.
Global information management (IM) turnover by sectors that include data analytics
32 October 2012
Sector Global market sizeof sector ($ million)
Proportion ofactivities that are
data analytics
Estimated globalvalue of analytics
($ million)
a. Information Management & Analytics Strategy 2,520 100% 2,520
b. Information Management - Design & Architecture 1.750 100% 1.750
c. Information Management - Data Management 1,560 100% 1,560
d. Information Management - Governance 1,330 100% 1,330
e. Strategic Planning 7,400 5% 370
f. Marketing and Branding 3,750 30% 1,130
g. IT Strategy 6,450 5% 320
h. Financial Strategy 3,300 20% 660
i. Organisational Strategy 4,940 10% 490
j. Knowledge Process Outsourcing - Research andAnalytics
700 100% 700
Sources: Kennedy Consulting Research & Advisory, Information Management and Analytics Consulting Marketplace 2010 -2013. Kennedy Information: New Hampshire. p11. Kennedy Consulting Research & Advisory, Strategy Consulting Marketplace2009-2012. Kennedy Information: New Hampshire. p15. Evalueserve (2010) KPO Industry Growth Impacted by the GreatRecession. Evalueserve: Dübendorf. p15.
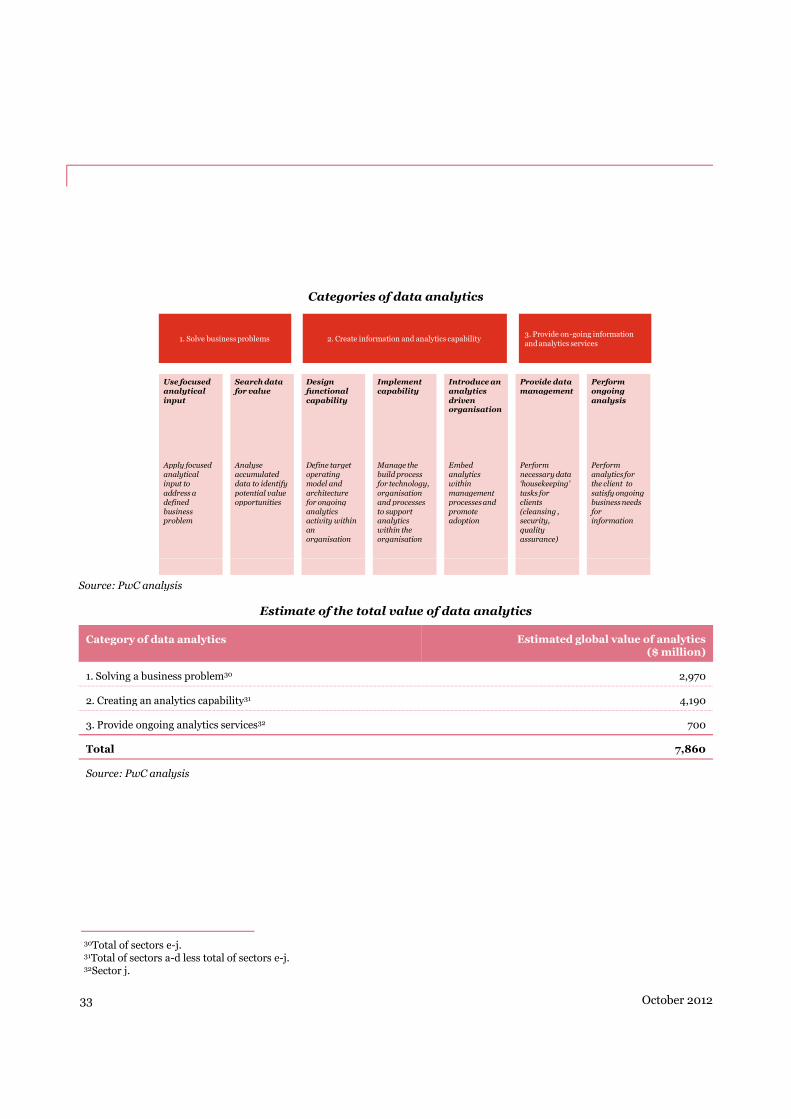
Categories of data analytics
Use focusedanalyticalinput
Apply focusedanalyticalinput toaddress adefinedbusinessproblem
Search datafor value
Analyseaccumulateddata to identifypotential valueopportunities
Designfunctionalcapability
Define targetoperatingmodel andarchitecturefor ongoinganalyticsactivity withinanorganisation
Implementcapability
Manage thebuild processfor technology,organisationand processesto supportanalyticswithin theorganisation
Introduce ananalyticsdrivenorganisation
Embedanalyticswithinmanagementprocesses andpromoteadoption
Provide datamanagement
Performnecessary data‘housekeeping’tasks forclients(cleansing ,security,qualityassurance)
Performongoinganalysis
Performanalytics forthe client tosatisfy ongoingbusiness needsforinformation
1. Solve businessproblems3. Provide on-going informationand analytics services
2. Create information and analytics capability
Source: PwC analysis
Estimate of the total value of data analytics
33 October 2012
Category of data analytics Estimated global value of analytics($ million)
1. Solving a business problem30 2,970
2. Creating an analytics capability31 4,190
3. Provide ongoing analytics services32 700
Total 7,860
Source: PwC analysis
30Total of sectors e-j.31Total of sectors a-d less total of sectors e-j.32Sector j.

Estimate of the total value of data analytics in the UK
Category Global value EstimatedUK value
EstimatedUK value
EstimatedUK value
EstimatedUK value
($ million) Lower($ million)
Upper bound($ million)
Lower bound(£ million)
Upper bound(£ million)
1. Solving a business problem 2,970 100 150 60 100
2. Creating an analyticscapability
4,190 370 460 240 290
3. Provide ongoing analyticsservices
700 100 120 60 70
Total 7,860 570 730 360 460
Total for categories 1&3only
3,670 200 270 120 170
Source: PwC analysisNote: Totals may not sum due to rounding. The exchange rate used to calculate the above was $1=£0.64.
How we estimated regional GVAWe have sought to determine the regional split of employment and economic contribution. As we are able to determinereasonably accurate MRS membership figures by region, we used these as a proxy to estimate regional GVA, but wouldcaution that this is preliminary and subject to further evaluation. It is nonetheless indicative of the importance ofLondon and the South East as the key driver of employment and economic activity, as follows:
Regional MRS membership and GVA estimates
34
Note: Totals may not sum due to rounding. The exchange rate used to calculate the above was $1=£0.64.
October 2012
Region MRS membership % Estimatedemployment
GVA Low £m GVA High £m
North West 5.5 3,240 143 166
Northern Ireland 0.9 530 23 27
South East & London 61.1 35,970 1,593 1,846
West Midlands 4.6 2,710 120 139
South West 6.4 3,770 167 193
Scotland 3.0 1,770 78 91
North East 6.5 3,830 169 196
East Midlands 5.6 3,300 146 169
Membership outside UK 6.4 3,760 167 193
Total 100 58,880 2,607 3,022
Source: MRS, PwC analysis

How our research findings compare to the ONSAn important element that helps to aggregate the research findings is the information available from the ONS AnnualBusiness Survey (ABS). The ONS statistics are based on companies whose primary activity (based on turnover) ismarket research or public opinion polling. Therefore estimates may overstate the size of the research industry: forexample, a company classed as “market research”, but with 40% of its operations in non-market research activities willhave the 40% element included in ONS statistics under “market research and public opinion polling”. Equally, it willalso operate in the opposite direction and underestimate the size of the research industry by excluding any and allresearch employment in organisations where market research operations are not the primary activity.
With anecdotal and stakeholder evidence pointing to a growing trend towards retaining a research capability amongstcommercial, third sector and public sector organisations, it is likely that ONS data may tend to underestimate the realsize of the research industry. We believe that this underestimation could be between 6,700 – 12,000 FTEs across theUK, as shown on the following page.
ONS Annual Business Survey estimates the total turnover of the 3,143 enterprises involved in market research andopinion polling to be £3,401 million in 2010. The estimated GVA at basic prices was £1,865 million in 2010.33
While we believe that these figures may tend to understate elements of the industry they do provide some indication ofWhile we believe that these figures may tend to understate elements of the industry they do provide some indication ofthe overall size of the research industry beyond the 2010 figure of £2,880 million re-calibrated research turnover,estimated for traditional providers by MRS.34 Our findings below should help to provide an holistic (albeit conservative)estimate of the total value of activity in the UK, with the ONS figures providing a useful sense check.
The ONS Annual Business Survey does not provide employment figures for 2010. However, using the figures for totalemployment and employment costs from 2008 and 2009 we can estimate that total employment in 2010 wasapproximately 64,000.35 In 2008, the split between full and part time workers was 49% and 48% respectively (3% wereworking proprietors). If we apply this to the 2010 data, there were approximately 31,500 full time employees and 30,500part time employees. Assuming part time workers are 0.5 FTE, the total number of FTEs based on the ONS data isapproximately 46,750.
35 October 2012
33Office for National Statistics (ONS) (2011), Annual Business Survey. ONS: Newport. Standard Industrial Classification (SIC)73.2: Market research and opinion polling.
34Market Research Society (MRS) (2012), Re-calibrating industry size and growth rate. MRS: London.
35Office for National Statistics (ONS) (2011), Annual Business Survey. ONS: Newport. Total employment in 2008 was 65,000 at acost of £1,113 million and total employment in 2009 was 55,000 at a cost of £1,094 million (i.e. the average cost per 1,000employees over the two year period equals £18.5 million). As the total employment costs in 2010 were £1,187 million we canestimate the total employment to be c.64,000 .
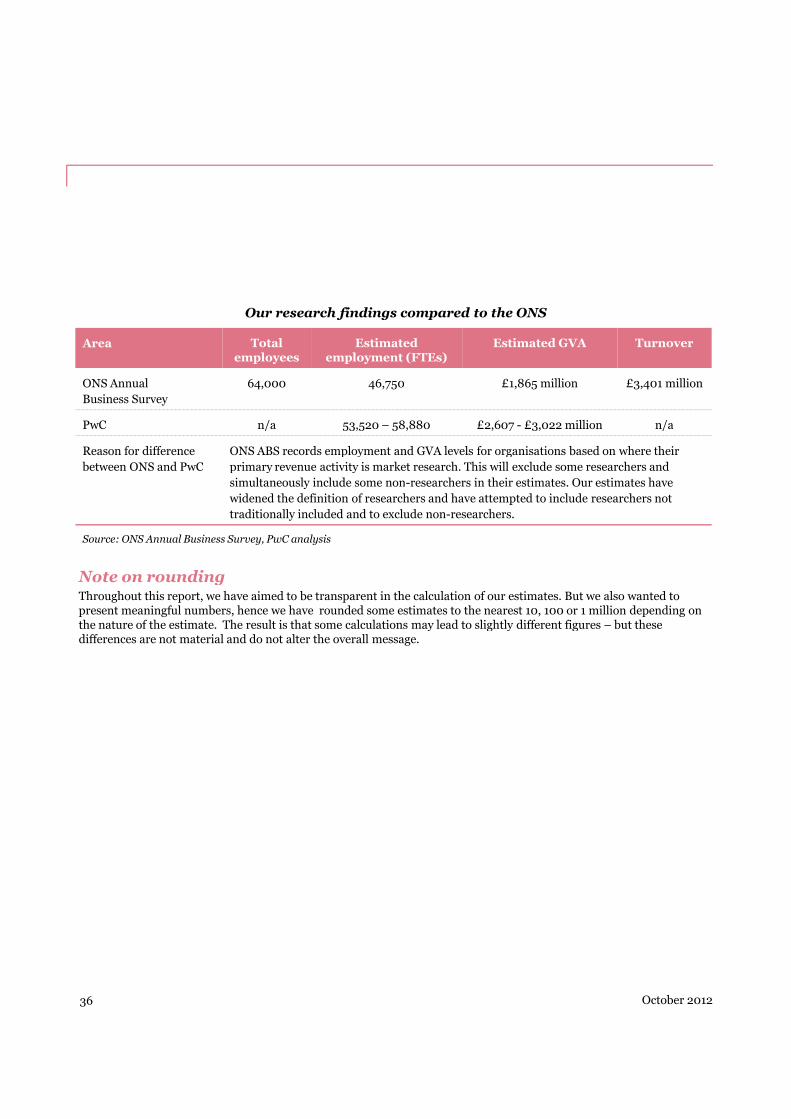
Our research findings compared to the ONS
Area Totalemployees
Estimatedemployment (FTEs)
Estimated GVA Turnover
ONS Annual
Business Survey
64,000 46,750 £1,865 million £3,401 million
PwC n/a 53,520 – 58,880 £2,607 - £3,022 million n/a
Reason for difference
between ONS and PwC
ONS ABS records employment and GVA levels for organisations based on where their
primary revenue activity is market research. This will exclude some researchers and
simultaneously include some non-researchers in their estimates. Our estimates have
widened the definition of researchers and have attempted to include researchers not
traditionally included and to exclude non-researchers.
Source: ONS Annual Business Survey, PwC analysis
Note on roundingThroughout this report, we have aimed to be transparent in the calculation of our estimates. But we also wanted topresent meaningful numbers, hence we have rounded some estimates to the nearest 10, 100 or 1 million depending onthe nature of the estimate. The result is that some calculations may lead to slightly different figures – but thesedifferences are not material and do not alter the overall message.
36 October 2012

Appendix 3: Bibliography
Analytical Coordination Working Group (ACWG) (2011), Analysis and Use of Evidence Research and analysis ingovernment. ACWG: London. [online] available at <http://www.civilservice.gov.uk/wpcontent/uploads/2011/12/research_and_analysis_in_government_Dec_2011.pdf >[last accessed 11th April 2012].
Charity Commission (2012), Charities by income band. Charity Commission: London. [online] available at<http://www.charity-ommission.gov.uk/ShowCharity/RegisterOfCharities/SectorData/CharitiesByIncomeBand.aspx>[last accessed 23th May 2012].
Department of Business Innovation and Skills (BIS) (2011), Business Population Estimates for the UK and regions 2011.BIS: London.
Direct Gov (2012), A-Z of local councils. HM Government: London. [online] available at<http://www.direct.gov.uk/en/Dl1/Directories/Localcouncils/AToZOfLocalCouncils/DG_A-Z_LG>[last accessed 26th
September 2012].
Economic and Social Research Council (ESRC) (2009), Annual report 2008/09. ESRC: Swindon. [online] available at<http://www.esrc.ac.uk/_images/Annual%20Report%2009-10_tcm8-13375.pdf> [last accessed 11th April 2012].
Economic and Social Research Council (ESRC) (2011), Annual report 2010/11. ESRC: Swindon. [online] available atEconomic and Social Research Council (ESRC) (2011), Annual report 2010/11. ESRC: Swindon. [online] available at<http://www.esrc.ac.uk/_images/ESRC_2010_11_AR_tcm8-16081.pdf http://www.esrc.ac.uk/_images/AnnualReport 09-10_tcm8-13375.pdf> [last accessed 11th April 2012].
Economic and Social Research Council (ESRC) (2012), Vital Statistics 2011-2012. ESRC: Swindon. [online] available at< http://www.esrc.ac.uk/_images/Shaping_Society_Vital_Stats_tcm8-23317.pdf > [last accessed 5th October 2012].
Economic and Social Research Council (ESRC) (2011), What we do. ESRC: Swindon. [online] available at<http://www.esrc.ac.uk/about-esrc/what-we-do/> [last accessed 2nd March 2012].
Evalueserve (2010), KPO Industry Growth Impacted by the Great Recession. Evalueserve: Dübendorf.
Higher Education Statistics Agency (HESA) (2012), HE Finance Plus 2010/11. HESA: Cheltenham. [online] available at<http://www.hesa.ac.uk/index.php?option=com_content&task=view&id=2404&Itemid=161> [last accessed 26th
September 2012].
Kennedy Consulting Research & Advisory, Information Management and Analytics Consulting Marketplace 2010 -2013. Kennedy Information: New Hampshire.
Kennedy Consulting Research & Advisory, Strategy Consulting Marketplace 2009-2012. Kennedy Information: NewHampshire.
Market Research Society (MRS) (2011), 2010 Annual Survey of the UK Market Research Industry. MRS: London.
Market Research Society (MRS) (2012), 2011 Annual Survey of the UK Market Research Industry. MRS: London.
Market Research Society (MRS) (2012), Re-calibrating industry size and growth rate. MRS: London.
37 October 2012

Ofcom (2011), The Communications Market 2011. (Eighth Annual Communications Market Report). Ofcom: London
Office for National Statistics (ONS) (2011), Annual Business Survey. ONS: Newport. [online] available athttp://www.ons.gov.uk/ons/guide-method/surveys/list-of-surveys/survey.html?survey=Annual+Business+Survey+(ABS) [last accessed 26th September 2012].
Office for National Statistics (ONS) (2011), Annual Survey of Hours and Earnings (ASHE). ONS: Newport. [online]available at http://www.ons.gov.uk/ons/publications/re-reference-tables.html?edition=tcm%3A77-200444 [lastaccessed 26th September 2012].
Office for National Statistics (ONS) (2011), Public Sector Employment. ONS: Newport. [online] available at<http://www.ons.gov.uk/ons/publications/re-reference-tables.html?edition=tcm%3A77-223952> [last accessed 26th
September 2012].
Office for National Statistics (ONS) (2012), United Kingdom National Accounts, The Blue Book, 2012 edition. ONS:Newport. [online] available at <http://www.ons.gov.uk/ons/rel/naa1-rd/united-kingdom-national-accounts/the-blue-book--2012-edition/index.html> [last accessed 5th October 2012].
Oxford Economics (2010), The Economic Impact of the UK Film Industry. Oxford Economics: London
PwC (2012), The Global Entertainment and Media Outlook 2012-2016. PwC: London
United Kingdom Trade & Investment (UKTI) (2010), UK Inward Investment Report 2009-2010. UKTI: London. p.12.[online] available at< www.ukti.gov.uk/download/114034.../Investment_report_09-10.html >[last accessed 5th July2012].
39 October 2012

www.pwc.comThis publication has been prepared for general guidance on matters of interest only, and doesnot constitute professional advice. You should not act upon the information contained in thispublication without obtaining specific professional advice. No representation or warranty(express or implied) is given as to the accuracy or completeness of the information contained inthis publication, and, to the extent permitted by law, PricewaterhouseCoopers LLP, itsmembers, employees and agents do not accept or assume any liability, responsibility or duty ofcare for any consequences of you or anyone else acting, or refraining to act, in reliance on theinformation contained in this publication or for any decision based on it.
© 2012 PricewaterhouseCoopers LLP. All rights reserved. In this document, “PwC” refers toPricewaterhouseCoopers LLP (a limited liability partnership in the United Kingdom) which is amember firm of PricewaterhouseCoopers International Limited, each member firm of which is aseparate legal entity.
121003-105406-CF-UK_Market research society