the case for unconstrained fixed income - goldman … case for unconstrained fixed income ... where...
TRANSCRIPT
The Case for Unconstrained Fixed Income
White Paper April 2013
gsam.com
This material has been prepared by GSAM and is NOT a product of Goldman Sachs Global Investment Research. The views and opinions expressed may differ from those of Global Investment Research or other departments or divisions of Goldman Sachs and its affiliates. Investors are urged to consult with their financial advisors before buying or selling any securities. This information may not be current and GSAM has no obligation to provide any updates or changes. This information discusses general market activity, industry or sector trends, or other broad-based economic, market or political conditions and should not be construed as research or investment advice. Please see additional disclosures. This material is provided for information purposes only and does not constitute a solicitation or offer to provide any advice or services in any jurisdiction in which such a solicitation or offer is unlawful or to any person to whom it is unlawful.Past performance does not guarantee future results, which may vary. The economic and market forecasts presented herein have been generated by GSAM for informational purposes as of the date of this presentation. There can be no assurance that the forecasts will be achieved. Please see additional disclosures at the end of this presentation.FOR FINANCIAL INTERMEDIARY USE ONLY. NOT FOR USE AND/OR DISTRIBUTION TO THE GENERAL PUBLIC.
Executive Summaryn Central bank intervention has driven interest rates in major government bond markets
below levels justified by fundamentals. We believe this is particularly true in the US due to the Federal Reserve’s asset purchases.
n We believe 2013 will likely mark the start of a prolonged and potentially significant rise in US rates. The early stages of this rising rate trend are likely to be bumpy, but we believe it will be durable and could last for several years. Rate normalization may be delayed in other major developed bond markets but we believe rates in most major markets are at or near a long-term bottom.
n We believe total return prospects in traditional fixed income portfolios are modest in the best case, and more likely negative. Traditional fixed income portfolios, benchmarked to the Barclays US Aggregate or similar indices, are concentrated in interest rate risk. Investors adopted this approach during a 30-year bull market in interest rates. As a result, traditional fixed income allocations have generally provided income, diversification and positive total returns. We do not believe a fixed income allocation concentrated in duration risk offers the same potential today.
n In our view, “unconstrained” fixed income offers a potential solution to this strategic challenge. An unconstrained approach reduces the baseline for duration risk to zero and allows for a more diverse set of global opportunities to drive returns. We believe the global fixed income markets are diverse enough to offer opportunities for an unconstrained approach to generate positive total returns across different market and economic environments, including a prolonged environment of rising interest rates.
n The potential benefits of unconstrained fixed income depend on a manager’s ability to evaluate all available opportunities in the global fixed income market, select and size positions according to the risk-adjusted return potential and employ tactical shifts and hedging strategies to manage risks. We believe this can be accomplished through a systematic and repeatable process for allocating risk.
Fixed Income TeamGoldman Sachs Asset Management (GSAM)

2 | Goldman Sachs Asset Management
The Case for Unconstrained Fixed Income
This information discusses general market activity, industry or sector trends, or other broad-based economic, market or political conditions and should not be construed as research or investment advice. The economic and market forecasts presented herein have been generated by GSAM for informational purposes as of the date of this paper. There can be no assurance that the forecasts will be achieved. Please see additional disclosures at the end of this paper. Past performance does not guarantee future results, which may vary.FOR FINANCIAL INTERMEDIARY USE ONLY. NOT FOR USE AND/OR DISTRIBUTION TO THE GENERAL PUBLIC.
Fed policy has pushed interest rates to levels not justified by fundamentalsCentral bank intervention has driven interest rates in major government bond markets below levels justified by fundamentals. We think this is particularly true in the US, where the Federal Reserve has engaged in three rounds of quantitative easing (QE), as well as “Operation Twist”, in which the Fed kept its overall securities holdings steady but shifted its Treasury holdings from short-term to long-term maturities (Exhibit 1). With economic growth and risk appetite improving, we believe 2013 will be the start of a prolonged period of normalization in both Fed policy and interest rates. Outside of the US, we think central bank intervention has generally been less aggressive and the rise in rates could be more delayed, but the broad theme still holds: rates in major developed bond markets are lower than they would be without central bank intervention and are more likely to rise than fall in the years ahead.
As we discuss in this paper, rising interest rates present a significant challenge for traditional fixed income strategies benchmarked to market indices that are dominated by interest rate risk (duration), such as the Barclays US Aggregate or Barclays Global Aggregate. These benchmarks were adopted and implemented by investors during a 30-year bull market in interest rates, a period in which the US Aggregate has only generated a negative annual total return twice. Given our view that 1) US rates are more likely to rise than not, and 2) low rates offer very unattractive compensation for duration risk, we believe the return prospects in traditional fixed income portfolios are flat at best, and more likely negative. As an alternative, we believe fixed income portfolios that have a starting point of zero for duration risk and include a diversified mix of fixed income risk factors other than rates, along with a significant potential for skill-based returns generated through active sector allocation, duration risk management, security selection and relative value trades, offer the prospect for attractive absolute and relative returns.
Exhibit 1: The Fed has purchased more than $2 trillion in Treasuries and Mortgage-Backed SecuritiesSecurities held outright on the Fed’s balance sheet
Source: Federal Reserve. As of March 7, 2013.
“We do think that these policies can bring interest rates down—not just Treasury rates, but a whole range of rates, including mortgage rates and rates for corporate bonds and other types of important interest rates.”
—Fed Chairman, Ben Bernanke
Sept. 13, 2012
0.0
0.5
1.0
1.5
2.0
2.5
3.0
Jun ‘08 Dec ‘08 Jun ‘09 Dec ‘09 Jun ‘10 Dec ‘10 Jun ‘11 Jun ‘12 Dec ‘12Dec ‘11
Total Securities Total MBS Treasuries < 5 yrs Treasuries > 5 yrs
$ in
Trill
ions
Total Securities held by the Fed
QE1
QE2
QE3Operation Twist
Mortgage-Backed Securities
Short-Term Treasuries
Long-Term Treasuries

Goldman Sachs Asset Management | 3
The Case for Unconstrained Fixed Income
This information discusses general market activity, industry or sector trends, or other broad-based economic, market or political conditions and should not be construed as research or investment advice. Please see additional disclosures. Past performance does not guarantee future results, which may vary. FOR FINANCIAL INTERMEDIARY USE ONLY. NOT FOR USE AND/OR DISTRIBUTION TO THE GENERAL PUBLIC.
Low or negative return prospects on high-quality “core” sectors of the bond market are a direct result of the Fed’s intervention in the bond market. The Fed’s goal in purchasing securities is to reduce the return prospects on safe-haven assets and push investors into riskier assets where investor demand can generate more private-sector economic activity. However, investors’ willingness to move from safe-haven assets to riskier assets has been restrained by a variety of factors: Europe’s sovereign debt crisis, the US debt ceiling crisis in 2011, the “fiscal cliff” in 2012 and the general environment of slow economic growth and balance sheet repair that has followed the financial crisis. This dynamic has essentially broken the transmission mechanism whereby Fed policy stimulates growth and employment. As a result, the Fed has been forced to lower interest rates to extremely low levels.
To illustrate this dynamic, Exhibit 2 shows the components of the yield on the Barclays US High Yield Index. The yield on a non-government bond that pays a fixed rate of interest includes two main components that compensate for two main risk factors:
1. An embedded government bond yield that compensates investors for the duration risk of investing in a bond that pays a fixed interest rate.
2. A risk premium (“spread”) that compensates investors for the risks of investing in a non-government bond. In the case of high yield, this risk premium primarily compensates for credit risk. In an individual bond, this risk premium also reflects issue-specific (or idiosyncratic) risk.
These risk factors are essentially independent and can be isolated via hedging strategies, but together they drive changes in the overall yield.
Exhibit 2: Most of the drop in yield on US high yield is due to falling compensation for duration riskComponents of the yield on US high yield bonds (major Fed policy changes highlighted)
Source: Barclays, GSAM, Federal Reserve. Monthly data through March 2013.
As shown in Exhibit 2, the overall yield on the US high yield sector has declined significantly, from about 8.5% at the end of QE1 to about 6.5% at the start of QE3. However, almost the entire decline in yield in the high yield sector has come from a drop in the compensation for duration risk, which fell from about 2.77% in early 2010 to about 1% by mid-2012 and has held close to that level through February 2013 (this is essentially the same path as the yield on a seven-year US Treasury note). High yield spreads varied over the period but were essentially unchanged from the end of QE1 through the beginning of QE3. In other words, to lower borrowing costs for high yield companies so that those companies invest and create jobs, the Fed was forced to push compensation for duration risk to extremely low levels. When compensation for duration stopped declining and the growth outlook started to weaken, the Fed began a new round of balance sheet expansion (QE3).
0
2
4
6
8
10
Yiel
d (%
)
2010
QE1 Ends
Spread Compensation forDuration Risk
Overall Yield:8.47
Overall Yield:6.51
1.00
QE2 Operation Twist QE3
2011 2012 2013
Spread5.70
Spread5.51
2.77

4 | Goldman Sachs Asset Management
The Case for Unconstrained Fixed Income
This information discusses general market activity, industry or sector trends, or other broad-based economic, market or political conditions and should not be construed as research or investment advice. Past performance does not guarantee future results, which may vary. The economic and market forecasts presented herein have been generated by GSAM for informational purposes as of the date of this paper. There can be no assurance that the forecasts will be achieved. Please see additional disclosures at the end of this paper. FOR FINANCIAL INTERMEDIARY USE ONLY. NOT FOR USE AND/OR DISTRIBUTION TO THE GENERAL PUBLIC.
In our view, the Fed’s increasingly aggressive approach has driven Treasury yields well below the level implied by fundamentals. Exhibit 3 shows the actual 10-year Treasury yield versus the 10-year yield implied by a model based on economic growth, inflation and the Fed’s target for the federal funds rate. Historically, the yield implied by this basic model has tracked the actual yield reasonably well. However, the relationship began to break down in 2011 as the Fed became more aggressive in its effort to push down rates through outright Treasury purchases via QE2 in November 2010 and Operation Twist in August 2011. In fact, the only other period in which actual rates were consistently below the level implied by growth, inflation and Fed rate policy was during the 2005-2007 period. At the time, Fed Chairman Greenspan famously remarked that the Fed’s inability to raise long-term rates by raising the policy rate was a “conundrum”, but the general consensus is that a rise in foreign purchases (notably by China and Japan) helped to hold rates down, ultimately contributing to the search for yield that preceded the 2008 financial crisis.
Exhibit 3: Fed asset purchases have driven rates below the level implied by fundamentals10-year yield implied by US ISM index, US CPI index and Fed Funds target rate vs actual 10-year yield
Source: GSAM, Bloomberg. Quarterly data. 2013 data as of February 2013. Simulated performance results do not reflect actual trading and have inherent limitations. No representation is made that a client will achieve results similar to those shown. Please see additional disclosures.
Outside of the US, central banks have taken a somewhat less aggressive approach, but our overall view is essentially the same. For example, the European Central Bank has pledged to purchase government bonds through the Outright Monetary Transaction (OMT) facility if Eurozone countries request support and meet certain conditions. We believe this policy has clearly contributed to a decline in rates to levels below where they would otherwise be based on sovereign credit fundamentals, even though OMT purchases have not yet occurred.
10-Year Yield Yield Model Based on Growth,Inflation, Fed Rate Policy
0
2
4
6
8
10
‘98 ‘92 ‘96 ‘00 ‘04 ‘08 ‘12 ‘13
Fed asset holdings appear tohave driven 10-year yieldsabout 160 bps below the levelimplied by fundamentals
Yiel
d (%
)

Goldman Sachs Asset Management | 5
The Case for Unconstrained Fixed Income
This information discusses general market activity, industry or sector trends, or other broad-based economic, market or political conditions and should not be construed as research or investment advice. Please see additional disclosures. Past performance does not guarantee future results, which may vary. FOR FINANCIAL INTERMEDIARY USE ONLY. NOT FOR USE AND/OR DISTRIBUTION TO THE GENERAL PUBLIC.
The Outlook for RatesIn our view, the fundamental and supply/demand factors that have driven US rates to abnormally low levels are in the process of turning and rates are likely at the start of a prolonged rise. We believe growth, inflation and Fed policy rates have all essentially bottomed, and demand for Treasuries has likely peaked. We believe interest rates are also likely to rise in other major developed bond markets, but we primarily focus on the US outlook as we believe a variety of local factors in other major markets could delay the rise in rates relative to that of the US.
From a US growth perspective, we think the ongoing housing recovery and pent-up investment demand in the corporate sector after years of uncertainty will help to drive stronger economic growth over the next several years. The global outlook is perhaps more subdued as China attempts to transition to more domestically driven growth, Europe and the UK continue their gradual process of austerity-driven balance sheet repair and Japan continues to ease policy in an effort to stimulate domestic demand. Slower economic recoveries in Europe and Japan are one of the main reasons we think rate normalization is likely to be slower in these major bond markets.
US inflation also appears likely to turn higher in the years ahead. As growth strengthens, we believe the Fed will face significant challenges in attempting to balance the growth and inflation elements of its mandate. In attempting to stimulate growth by pushing down long-term Treasury rates, the Fed has significantly extended the maturity of its balance sheet. As a result, we do not believe the Fed can shrink its balance sheet and reduce its accommodation by simply letting assets on its balance sheet mature. At some point, we think the Fed will be faced with a difficult choice: 1) sell assets to absorb excess liquidity in the financial system and combat inflation pressures, at the risk of driving rates so high that they create recession and raise debt sustainability questions for the US government; or 2) hold assets at the risk of leaving too much liquidity in the financial system, undermining the central bank’s inflation-fighting credibility and driving an increase in inflation expectations and actual inflation.
In the near term, Fed purchases, and its long-term commitment to keeping the policy rate near zero, may help to contain the upward pressure on US rates. The Fed is currently absorbing virtually all of the net new issuance of Treasuries, and the central bank’s own forecasts suggest the policy rate is likely to remain near zero until 2015. However, over the longer term, we believe a turn in supply/demand factors (“technicals”) is likely to combine with the turn in fundamentals to produce a sustained rise in interest rates. In particular, the Fed will need to withdraw its accommodation, both by reducing its asset holdings and by raising the policy rate. We believe this process is likely to be very gradual in the early stages, with the Fed potentially beginning to 1) slow the pace of its asset purchases in late 2013, 2) start gradually reducing the size of its balance sheet in 2014, and 3) beginning the process of normalizing the policy rate in 2015. To the extent that fundamentals strengthen, this process will either need to be accelerated or inflation may become a larger risk.
From a demand perspective, we think the growth rate of official demand for Treasuries has likely peaked. Fed purchases have helped to offset a slowdown in the pace of Treasury purchases from Japan and China (Exhibit 4). However, as the Fed slows its Treasury purchases and begins to reduce the size of its balance sheet, we see the potential for a significant turn in demand, at least in terms of the rate of growth. We think a reduction in private investor demand for Treasuries is also likely in a scenario of strengthening growth and potential inflation risks.
6 | Goldman Sachs Asset Management
The Case for Unconstrained Fixed Income
This information discusses general market activity, industry or sector trends, or other broad-based economic, market or political conditions and should not be construed as research or investment advice. Past performance does not guarantee future results, which may vary. The economic and market forecasts presented herein have been generated by GSAM for informational purposes as of the date of this paper. There can be no assurance that the forecasts will be achieved. Please see additional disclosures at the end of this paper. FOR FINANCIAL INTERMEDIARY USE ONLY. NOT FOR USE AND/OR DISTRIBUTION TO THE GENERAL PUBLIC.
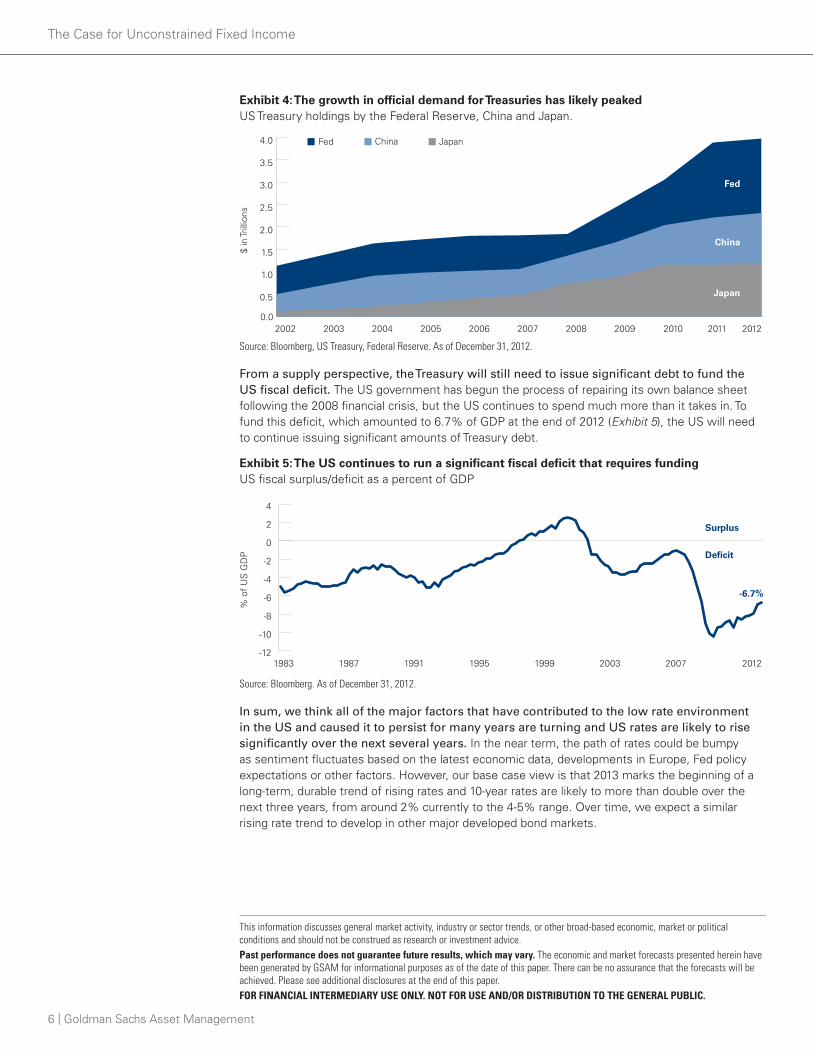
Exhibit 4: The growth in official demand for Treasuries has likely peakedUS Treasury holdings by the Federal Reserve, China and Japan.
Source: Bloomberg, US Treasury, Federal Reserve. As of December 31, 2012.
From a supply perspective, the Treasury will still need to issue significant debt to fund the US fiscal deficit. The US government has begun the process of repairing its own balance sheet following the 2008 financial crisis, but the US continues to spend much more than it takes in. To fund this deficit, which amounted to 6.7% of GDP at the end of 2012 (Exhibit 5), the US will need to continue issuing significant amounts of Treasury debt.
Exhibit 5: The US continues to run a significant fiscal deficit that requires fundingUS fiscal surplus/deficit as a percent of GDP
Source: Bloomberg. As of December 31, 2012.
In sum, we think all of the major factors that have contributed to the low rate environment in the US and caused it to persist for many years are turning and US rates are likely to rise significantly over the next several years. In the near term, the path of rates could be bumpy as sentiment fluctuates based on the latest economic data, developments in Europe, Fed policy expectations or other factors. However, our base case view is that 2013 marks the beginning of a long-term, durable trend of rising rates and 10-year rates are likely to more than double over the next three years, from around 2% currently to the 4-5% range. Over time, we expect a similar rising rate trend to develop in other major developed bond markets.
0.0
0.5
1.0
1.5
2.0
2.5
3.0
3.5
4.0
20122011201020092008200720062005200420032002
Fed China Japan
$ in
Trill
ions
Fed
China
Japan
1983 1987 1991 1995 1999
Surplus
Deficit
-6.7%
2003 2007 2012-12
-10
-8
-6
-4
-2
0
2
4
% o
f U
S G
DP

Goldman Sachs Asset Management | 7
The Case for Unconstrained Fixed Income
This information discusses general market activity, industry or sector trends, or other broad-based economic, market or political conditions and should not be construed as research or investment advice. Past performance does not guarantee future results, which may vary. The economic and market forecasts presented herein have been generated by GSAM for informational purposes as of the date of this paper. There can be no assurance that the forecasts will be achieved. Please see additional disclosures at the end of this paper. FOR FINANCIAL INTERMEDIARY USE ONLY. NOT FOR USE AND/OR DISTRIBUTION TO THE GENERAL PUBLIC.
Return prospects in traditional fixed income: low in the best case, and more likely negativeTraditional fixed income strategies are generally benchmarked to a market index such as the Barclays US Aggregate or Barclays Global Aggregate, which track high-quality “core” sectors of the bond market such as government agency debt, mortgage securities guaranteed by government agencies and investment-grade corporate bonds where duration risk is the dominant risk factor.
During an era when globalization, disinflation and other secular trends aligned to produce a 30-year decline in major government bond market interest rates, an allocation to traditional fixed income dominated by duration risk offered the best of all worlds: the diversification benefits of Treasury exposure in a portfolio of riskier assets, a steady source of income enhanced by the extra yield on high-quality, non-Treasury sectors and consistently positive total returns as the dominant secular themes drove interest rates lower.
Exhibit 6 shows the total return growth of $100 invested in the Barclays US Aggregate and the Barclays 3-7 Year Treasury Index. As the chart shows, exposure to the core sectors in the Barclays Aggregate 1) tracked Treasury returns very consistently, with the exception of the 2008 financial crisis when Treasuries temporarily outperformed, 2) outperformed Treasuries over the longer term, and 3) generated consistently positive total returns (the one main exception is 1994, when 10-year Treasury rates rose more than 2% and the resulting capital loss from rising rates more than offset the income).
Exhibit 6: Core fixed income has historically tracked Treasuries while providing additional returnTotal return growth of $100
Source: Barclays, GSAM. Annual data. 2013 data as of March 28, 2013.
In today’s environment, we are not convinced that a traditional bond portfolio concentrated in duration risk necessarily offers any of its historical benefits.
From a diversification perspective, even a risk-off environment may not lead to a significant decline in rates considering the extremely low level of rates today. If that is the case, capital gains in the bond portfolio that traditionally provide diversification versus equities could be limited in a risk-off scenario, undermining the diversification benefit of core fixed income.
100
150
200
250
300
350
400
1991 1993 1995 1997 1999 2001 2003 2005 2007 2009 2011 2013
Intermediate Treasuries(3-7 Year maturities)
US Aggregate Index
($)
8 | Goldman Sachs Asset Management
The Case for Unconstrained Fixed Income
This information discusses general market activity, industry or sector trends, or other broad-based economic, market or political conditions and should not be construed as research or investment advice. Past performance does not guarantee future results, which may vary. The economic and market forecasts presented herein have been generated by GSAM for informational purposes as of the date of this paper. There can be no assurance that the forecasts will be achieved. Please see additional disclosures at the end of this paper. FOR FINANCIAL INTERMEDIARY USE ONLY. NOT FOR USE AND/OR DISTRIBUTION TO THE GENERAL PUBLIC.
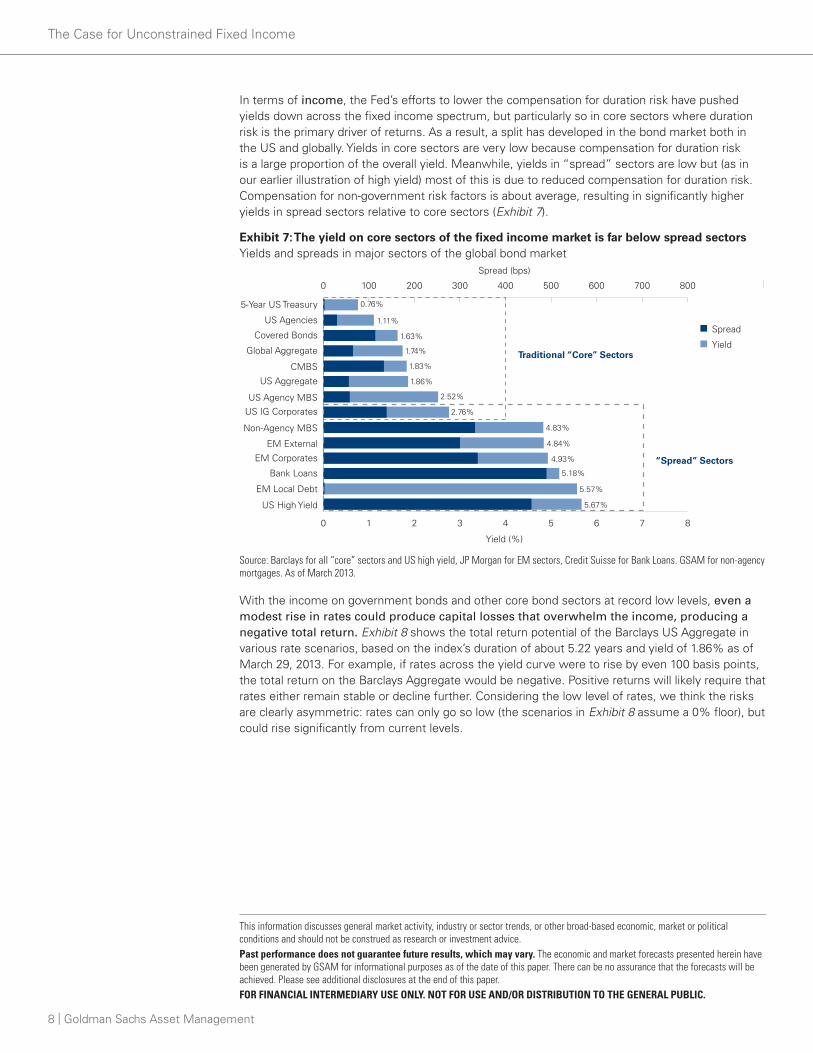
In terms of income, the Fed’s efforts to lower the compensation for duration risk have pushed yields down across the fixed income spectrum, but particularly so in core sectors where duration risk is the primary driver of returns. As a result, a split has developed in the bond market both in the US and globally. Yields in core sectors are very low because compensation for duration risk is a large proportion of the overall yield. Meanwhile, yields in “spread” sectors are low but (as in our earlier illustration of high yield) most of this is due to reduced compensation for duration risk. Compensation for non-government risk factors is about average, resulting in significantly higher yields in spread sectors relative to core sectors (Exhibit 7).
Exhibit 7: The yield on core sectors of the fixed income market is far below spread sectorsYields and spreads in major sectors of the global bond market
Source: Barclays for all “core” sectors and US high yield, JP Morgan for EM sectors, Credit Suisse for Bank Loans. GSAM for non-agency mortgages. As of March 2013.
With the income on government bonds and other core bond sectors at record low levels, even a modest rise in rates could produce capital losses that overwhelm the income, producing a negative total return. Exhibit 8 shows the total return potential of the Barclays US Aggregate in various rate scenarios, based on the index’s duration of about 5.22 years and yield of 1.86% as of March 29, 2013. For example, if rates across the yield curve were to rise by even 100 basis points, the total return on the Barclays Aggregate would be negative. Positive returns will likely require that rates either remain stable or decline further. Considering the low level of rates, we think the risks are clearly asymmetric: rates can only go so low (the scenarios in Exhibit 8 assume a 0% floor), but could rise significantly from current levels.
0 1 2 3 4 5 6 7 8
US High Yield
EM Local Debt
Bank Loans
EM Corporates
EM External
Non-Agency MBS
US IG CorporatesUS Agency MBS
US Aggregate
CMBS
Global Aggregate
Covered Bonds
US Agencies
5-Year US Treasury
0 100 200 300 400 500 600 700 800
Yield (%)
Spread (bps)
Yield
Spread
“Spread” Sectors
Traditional “Core” Sectors
0.76%
1.11%
1.63%
1.74%
1.83%
1.86%
2.52%
2.76%
4.83%
4.84%
4.93%
5.18%
5.57%
5.67%

Goldman Sachs Asset Management | 9
The Case for Unconstrained Fixed Income
This information discusses general market activity, industry or sector trends, or other broad-based economic, market or political conditions and should not be construed as research or investment advice. Past performance does not guarantee future results, which may vary. The economic and market forecasts presented herein have been generated by GSAM for informational purposes as of the date of this paper. There can be no assurance that the forecasts will be achieved. Please see additional disclosures at the end of this paper. FOR FINANCIAL INTERMEDIARY USE ONLY. NOT FOR USE AND/OR DISTRIBUTION TO THE GENERAL PUBLIC.
Exhibit 8: Traditional fixed income allocations may require stable or declining rates for positive returnsBarclays US Aggregate total return potential in different interest rate scenarios
As of March 29, 2013. Source: Barclays, GSAM. *Assumes parallel shift in interest rates over 12 months with a zero rate floor. Simulated performance results do not reflect actual trading and have inherent limitations. No representation is made that a client will achieve results similar to those shown. Please see additional disclosures.
In our view, the total return impact of a rise in interest rates can be mitigated through active bond management, but most traditional bond portfolios are too constrained by benchmark considerations to consistently generate positive total returns in a prolonged environment of rising rates. For example, an actively managed bond portfolio benchmarked to the Barclays US Aggregate will often be constrained to limit its deviation from duration exposure in the benchmark to plus-or-minus two years of duration. Exhibit 9 shows the major risk factors in the Barclays US Aggregate and our estimate of each factor’s contribution to risk based on historical risk and return data since 2002, as well as our estimate of the contribution to risk assuming a two-year underweight to duration risk. Even with a significant underweight to duration, interest rates would account for almost 90% of the risk in a traditional, core portfolio.
Exhibit 9: Duration risk dominates traditional fixed income even with a significant underweightMajor risk factors in the Barclays US Aggregate
Source: GSAM, Barclays. As of February 18, 2013. Simulated performance results do not reflect actual trading and have inherent limitations. No representation is made that a client will achieve results similar to those shown. Please see additional disclosures.
-8
-6
-4
-2
0
2
4
6
+200 +150 +100 -1000 -50
Tota
l Ret
urn
(%)
Change in Interest Rates (bps)
-6.15
-4.10
-1.97
2.47
4.56
6.15
-100
102030405060708090
100110
Interest Rates Spread Sectors Security Selection
Con
trib
utio
n to
Ris
k (%
)
100.6%
88.1%
-0.4%
10.9%
-0.2%
1.0%
Barclays Aggregate Barclays Aggregate assumingtwo-year duration underweight

10 | Goldman Sachs Asset Management
The Case for Unconstrained Fixed Income
This information discusses general market activity, industry or sector trends, or other broad-based economic, market or political conditions and should not be construed as research or investment advice. Please see additional disclosures. Past performance does not guarantee future results, which may vary. FOR FINANCIAL INTERMEDIARY USE ONLY. NOT FOR USE AND/OR DISTRIBUTION TO THE GENERAL PUBLIC.
The Case for Unconstrained Fixed IncomeWe believe a strategic allocation to the global fixed income opportunity set, unconstrained by a benchmark, offers a potential solution. Unconstrained approaches generally target returns relative to a short-term, floating rate such as LIBOR, and allow the manager greater flexibility to size risks according to the opportunity, rather than relative to a benchmark. In our view, this type of approach has two main benefits. First, the baseline for duration risk in an unconstrained portfolio is zero. Second, by removing the constraints that ensure duration is the dominant risk factor, the risk factors driving returns in an unconstrained portfolio can be more diverse.
A zero baseline for duration riskBenchmarking a portfolio to LIBOR (which has a duration of about 0.25 years) rather than a traditional fixed income index with a duration of about five years has the effect of reducing the baseline for duration risk to zero. Duration risk becomes one of many risk factors that can be employed to generate returns, rather than the dominant risk factor that drives returns and limits diversification potential.
Unconstrained approaches generally allow the manager to move to a negative (or “short”) duration position, which can be employed as a strategy for generating positive returns from rising rates. For example, assume a manager expects rates to rise and wants to sell two years of duration exposure to position the portfolio to benefit from this view. In a traditional portfolio with a benchmark duration of five years, the manager can reduce duration to three years. Thus, if rates rise 100 bps, the capital loss will be 3% rather than 5%. However, in an unconstrained portfolio, the manager can employ futures contracts to sell two years of duration risk. In this scenario, the duration position would be expected to generate a 2% gain if rates rise by 100 bps. In other words, instead of 200 bps points of relative outperformance versus a benchmark (resulting in a negative return on an absolute basis), the manager can potentially generate 200 bps of positive return on an absolute basis.
Just as importantly, a manager can sell duration risk to remove that risk factor and isolate other risk factors that may be more attractive. We believe this capability could be particularly important in the years ahead, as a significant rise in rates would weigh on the return of most sectors with embedded duration risk. For example, if economic growth strengthens, rates could rise and credit spreads could tighten. In this case, rising rates would be negative for total return and tighter spreads would be positive, and the total return would depend on the size of the move in each component of the overall yield. By hedging the duration component of the yield, a manager can isolate the spread.

Goldman Sachs Asset Management | 11
This information discusses general market activity, industry or sector trends, or other broad-based economic, market or political conditions and should not be construed as research or investment advice. Please see additional disclosures. Past performance does not guarantee future results, which may vary. FOR FINANCIAL INTERMEDIARY USE ONLY. NOT FOR USE AND/OR DISTRIBUTION TO THE GENERAL PUBLIC.
The Case for Unconstrained Fixed Income
Greater diversity of risk factorsBy reducing the baseline for duration risk to zero, the risk factors driving returns in an unconstrained portfolio can be more diverse. Although duration risk tends to be the dominant driver in many fixed income allocations, the global fixed income markets offer a diverse range of risk factors, including market directional risk in rates and sector spreads, relative value risk and idiosyncratic (i.e., issuer or bond specific) risk. Some of these include:
n Mortgage prepayment risk across different agency mortgage securities
n Mortgage credit risk across different types of non-agency mortgage securities
n Corporate credit risk across investment-grade, high yield, and developed and emerging markets
n Currency risk across developed and emerging market countries
n Sovereign credit risk across developed and emerging market countries
n Local rate directional and relative value risk across developed and emerging market countries
n Sector weightings across the major global fixed income sectors
As a fixed income manager, we assess all of these risk factors with the goal of identifying a set of “high conviction ideas”, or investment strategies in which we have the highest conviction across the global fixed income markets. In traditional portfolios, we implement these views with the goal of outperforming a benchmark. However, if the benchmark is concentrated in duration risk, we believe the portfolio should reflect this, because the purpose of a benchmark is to determine the major risk factors that the client is seeking in the portfolio. As a result, market-directional interest rate risk will be the dominant risk factor.
In an unconstrained portfolio, the lack of a traditional benchmark removes the need to maintain exposure to duration, or any risk factor we believe is unattractive. This allows us to implement only those strategies in which we have high conviction based on their risk-adjusted return and diversification potential. As global macroeconomic and market conditions shift, we can alter the risk factors that drive the portfolio’s returns. In some environments, the overall portfolio may be focused on market directional risk such as credit spread tightening, while other environments may favor a larger allocation to relative value and idiosyncratic risks.
We can also employ hedges to quickly reduce or add market-directional risk. For example, if we believe corporate credit spreads are vulnerable to a temporary sell-off, we can hedge this risk at the sector level without selling individual bonds that we believe are fundamentally attractive over a longer holding period. This can help to reduce transaction costs and avoid situations where we are forced to sell bonds we like and may not be able to repurchase later.
In sum, even in a prolonged period of stable or rising interest rates, we believe an unconstrained portfolio can offer attractive risk-adjusted return potential, dynamic exposure to developing secular themes globally and a low or negative correlation to the direction of major rate markets.

12 | Goldman Sachs Asset Management
This information discusses general market activity, industry or sector trends, or other broad-based economic, market or political conditions and should not be construed as research or investment advice. Please see additional disclosures. Past performance does not guarantee future results, which may vary. FOR FINANCIAL INTERMEDIARY USE ONLY. NOT FOR USE AND/OR DISTRIBUTION TO THE GENERAL PUBLIC.
The Case for Unconstrained Fixed Income
Comparing Apples and Oranges in Global Fixed Income MarketsThe global fixed income markets offer a very diverse set of risk factors that have historically performed differently depending on the economic environment. Thus, one of the key benefits of an unconstrained approach is the ability to flexibly allocate relatively larger amounts of capital to risk factors that potentially offer the most attractive risk-adjusted return potential in a given environment, while avoiding those that are unattractive. However, this approach can also bring challenges, as comparing very different sectors and market risk factors, denominated in different currencies in the global fixed income market, is equivalent to comparing apples and oranges. As a result, the potential benefits of unconstrained fixed income depend on a manager’s ability to evaluate risk factors and time tactical and strategic shifts in the portfolio’s risk exposures.
To illustrate this challenge, and the potential opportunity, we focus on sector rotation among the global fixed income opportunity set. Exhibit 10 shows the annual total return for major sectors of the fixed income market from 2000 to 2012. Performance has varied both in terms of the top-performing sector in any given year, and in terms of the range of annual returns across the spectrum of fixed income sectors.
Exhibit 10: Fixed income sector opportunities can vary significantly from year to yearAnnual total return by fixed income sector (%)
Source: GSAM, Barclays, JP Morgan; As of December 2012. US Treasuries: Barclays US Treasury Index; US Agencies: Barclays US Agency Index; ABS: Barclays US ABS Index; CMBS: Barclays CMBS Index; IG Credit: Barclays US Credit Index; High Yield: Barclays 2% Capped US High Yield Index; EMD External: JPM EMBI Global; EMD Local: JPM GBI-EM Global Diversified Index.
In our view, attempting to assess the value of a fixed income sector in isolation is one of the biggest pitfalls fixed income investors should attempt to avoid. Unconstrained fixed income approaches effectively outsource this decision to an active manager, which should have a consistent process for evaluating sectors and other risk factors in the context of all available opportunities in the global fixed income market, and selecting and sizing those factors according to their risk-adjusted return potential.
GSAM’s sector allocation process employs three main pillars. First, we assess the economic cycle to determine the implications for risk assets and market volatility. Second, we perform scenario analysis to evaluate current and future value in global fixed income spread sectors across a range of future economic and market environments, from our base case to optimistic scenarios to stress scenarios. Third, we attempt to identify special factors that may create inefficiencies in specific sectors.
EMD External14.41
IG Credit10.31
CMBS15.45
CMBS20.82
High Yield28.77
EMDLocal22.97
EMD External
10.73
EMDLocal15.22
EMDLocal18.10
US Treasuries
13.74
US Treasuries
9.81
EMD External
18.54
High Yield58.76
CMBS13.95
ABS9.81
EMD External
13.11
EMDLocal15.68
EMD External25.66
EMD External
11.73
EMDLocal6.27
High Yield10.76
US Treasuries
9.01
US Agencies
9.08
EMD External
8.46
EMDLocal16.76
EMD External
28.18
US Treasuries
13.52
CMBS9.49
US Treasuries
11.79
High Yield14.94
EMDLocal16.92
High Yield11.14
US Treasuries
2.79
EMD External
9.88
US Agencies
7.92
MBS8.52
IG Credit8.15
High Yield15.78
CMBS28.14
US Agencies
12.18
US Agencies
8.41
US Agencies
11.03
EMD External12.04
IG Credit8.24
IG Credit5.39
High Yield2.76
MBS5.22
MBS6.96
IG Credit-4.94
CMBS6.47
IG Credit9.82
ABS24.72
MBS11.16
MBS8.22
IG Credit10.12
IG Credit9.00
CMBS4.73
MBS4.70
MBS2.61
CMBS4.91
EMD External
6.28
EMDLocal-5.22
MBS6.32
CMBS9.66
EMDLocal21.98
ABS10.84
US Treasuries
6.75
MBS8.75
US Treasuries
5.87
ABS4.01
CMBS4.27
US Agencies
2.34
ABS4.70
CMBS4.60
EMD External-10.91
ABS5.14
ABS3.66
IG Credit18.68
IG Credit8.85
High Yield5.37
ABS8.55
ABS5.85
MBS3.07
US Treasuries
3.54
ABS2.09
US Agencies
4.39
IG Credit4.56
ABS-12.72
High Yield4.96
US Agencies
3.02
MBS5.75
High Yield-5.87
EMD External
1.36
High Yield-0.70
MBS5.50
US Agencies
2.62
US Agencies
3.28
CMBS1.83
IG Credit4.30
High Yield2.26
CMBS-22.72
US Agencies
4.86
MBS2.60
US Agencies
1.95
US Agencies
4.56
US Treasuries
2.24
ABS3.00
IG Credit1.68
US Treasuries
3.08
ABS2.21
High Yield-25.88
EMDLocal-1.75
US Treasuries
1.99
US Treasuries
-3.57
20012000 2002 2003 2004 2005 2006 2007 2008 2009 2010 2011 2012

Goldman Sachs Asset Management | 13
This information discusses general market activity, industry or sector trends, or other broad-based economic, market or political conditions and should not be construed as research or investment advice. Please see additional disclosures. Past performance does not guarantee future results, which may vary. FOR FINANCIAL INTERMEDIARY USE ONLY. NOT FOR USE AND/OR DISTRIBUTION TO THE GENERAL PUBLIC.
The Case for Unconstrained Fixed Income
The economic cycle and risk assetsHistorical data suggest a strong relationship between the economic cycle, asset class performance and volatility. Understanding where we are in the economic cycle helps inform our judgments about our aggregate exposure to risk assets. In other words, should we be in a risk-on posture, a risk-off posture, or somewhere in between?
Using the Barclays US Investment Grade Corporate Bond index as a proxy for risk assets and the Conference Board’s indexes of leading and lagging economic indicators to define four phases of the economic cycle, we traced returns against trends in the US macroeconomic environment since 1988. Historically, risky asset performance has been strongest in the recession and recovery phases, although volatility also tends to be highest in these phases (Exhibit 11). The expansion phase tends to be associated with modest returns and low volatility. The late cycle phase is generally the least supportive for risky assets as returns tend to be negative and volatility tends to be elevated.
Exhibit 11: Risk Asset Returns and Volatility Vary Across the Economic Cycle
Source: GSAM. For illustrative purposes only.
The current environment differs somewhat from the historical cycle, as the economy appears to have recovered but without a decisive expansion. Our reading of leading and lagging indicators suggests the economy is in the expansion phase of the cycle, although the expansion has been softer than normal. Based on this view, we would expect risk asset returns to be positive (though less positive than they were in the recovery phase), and volatility to be low. As a result, our bias is to maintain exposure to risk assets.
Expansion
Growth becomes broad-based and sustainable, with both lagging and leading indicators above their long-term averages. Returns tend to be modest and volatility tends to be low during this phase as asset rallies lose momentum.
Late Cycle
Leading indicators begin to fall below historical averages while lagging indicators remain relatively high. Returns tend to be their worst, and volatility tends to be its highest, during this phase of the cycle as the economy peaks and then transitions into recession.
Recovery
Leading economic indicators are improving while lagging indicators remain in negative territory versus historical averages. The recovery phase tends to be associated with a decline in volatility and more modest asset returns.
Recession
Leading and lagging indicators are below their historical averages. Risky asset returns and volatility tend to be highest during this phase, as asset prices are often at depressed levels and tend to rally as investors anticipate a transition into the recovery phase.
Economic IndicatorsLagging: Weak Leading: Strong
Economic IndicatorsLagging: StrongLeading: Strong
Economic IndicatorsLagging: Weak Leading: Weak
Economic IndicatorsLagging: StrongLeading: Weak
Recovery
Return:Volatility:
Expansion
Recession Late Cycle
Return:Volatility:
Return:Volatility:
Return:Volatility:

14 | Goldman Sachs Asset Management
The Case for Unconstrained Fixed Income
This information discusses general market activity, industry or sector trends, or other broad-based economic, market or political conditions and should not be construed as research or investment advice. Past performance does not guarantee future results, which may vary. FOR FINANCIAL INTERMEDIARY USE ONLY. NOT FOR USE AND/OR DISTRIBUTION TO THE GENERAL PUBLIC.
Scenario analysisIn our view, sector spreads have observable, fundamental factors that can explain most of the movement in spreads over time. We employ regression analysis to isolate different factors and identify the combination that best explains the historical variation in spread levels for each fixed income sector. For example, our analysis indicates that four factors explain about 85% of the historical variation in the level of US high yield corporate spreads: the six-month growth rate of US industrial production (a proxy for economic growth), the VIX equity volatility index (a proxy for market volatility), the trailing 12-month default rate (a proxy for the credit cycle), and six-month rolling S&P 500 returns (a proxy for risk appetite). Exhibit 12 shows our fair value spread versus actual spreads since 1990.
Exhibit 12: Most of the variation in High Yield spread levels can be explained by four macro variablesGSAM high yield fair value model versus the Barclays US High Yield Corporate Index spread
Source: GSAM, Barclays. Monthly data as of March 2013. Simulated performance results do not reflect actual trading and have inherent limitations. No representation is made that a client will achieve results similar to those shown. Please see additional disclosures.
The spread models themselves are not predictive. Instead, by knowing which factors influence spreads, we can simulate hypothetical economic scenarios and then assess their potential impact on spreads. We can also avoid becoming too focused on factors that might seem relevant but have historically had little explanatory value. For example, while mutual fund flows are often cited in the financial press as a reason for under- or out-performance of high yield, our empirical analysis shows no evidence that performance follows flows. In our view, this approach brings significantly greater focus to our analysis and helps to separate signal from noise.
Our scenario analysis generally encompasses several different growth scenarios, and a potential tail risk scenario. For each scenario, we form judgments about how the factors that drive spreads might react, and then allow the model to forecast the implied spread six months forward under each scenario. This process gives us a sense of the range of possible outcomes for each sector based on our fundamental views of specific variables in specific scenarios. We also weight each scenario according to our views, and then calculate a probability-weighted average for each variable and spread. This process gives us a “base case” sense of the fair value spread six months forward.
Table 1 shows our forecasts for the four factors in our high yield spread model based on our current scenarios, and the probability we are assigning to each scenario. For example, we think high yield default rates are likely to remain around 2% in scenarios where growth remains above 1%, and we are assigning a combined 80% probability to these scenarios (see highlighted portions of Table 1).
0
500
1,000
1,500
2,000
Jan ‘90 Jan ‘92 Jan ‘94 Jan ‘96 Jan ‘98 Jan ‘00 Jan ‘02 Jan ‘04 Jan ‘06 Jan ‘08 Jan ‘10 Jan ‘12
Actual Spread Fair Value Spread
Opt
ion-
Adj
uste
d S
prea
d (b
ps)

Goldman Sachs Asset Management | 15
The Case for Unconstrained Fixed Income
This information discusses general market activity, industry or sector trends, or other broad-based economic, market or political conditions and should not be construed as research or investment advice. Please see additional disclosures. Past performance does not guarantee future results, which may vary. The economic and market forecasts presented herein have been generated by GSAM for informational purposes as of the date of this paper. There can be no assurance that the forecasts will be achieved. Please see additional disclosures at the end of this paper. FOR FINANCIAL INTERMEDIARY USE ONLY. NOT FOR USE AND/OR DISTRIBUTION TO THE GENERAL PUBLIC.
Table 1: GSAM scenario analysis example for US High Yield Credit
Source: GSAM, Bloomberg. As of February 2013. Simulated performance results do not reflect actual trading and have inherent limitations. No representation is made that a client will achieve results similar to those shown. Please see additional disclosures.
Table 2 shows the results of this scenario analysis in spread terms across several different market sectors. For example, in the same scenarios highlighted in Table 1, our high yield spread model implies a level of 368 bps and 295 bps respectively (see highlighted sections of Table 2). We take the current market spread and subtract the probability weighted average of the scenario-implied spreads to estimate an “excess” spread. With high yield spreads currently at 488 bps, our model implies that current spreads offer about 42 bps of “excess” spread. As the table shows, as of March 5, 2013, Emerging Market External Debt, Bank Loans and US High Yield offered higher spreads that our scenario analysis implies.
Table 2: Implied spreads in select sectors based on GSAM Scenarios
Source: GSAM, Bloomberg. As of February 2013. Simulated performance results do not reflect actual trading and have inherent limitations. No representation is made that a client will achieve results similar to those shown. Please see additional disclosures.
While spreads relative to the fair value implied by our models are an important measure, we think another important aspect of scenario analysis is an ability to estimate a range of potential outcomes across different scenarios. For example, Exhibit 13 shows the results of our high yield scenario analysis in spread terms. The blue line shows actual historical spreads, and the grey shaded area is the potential range of outcomes six-months forward that results from inputting our variable forecasts into the spread model. The dashed line indicates the potential change in spread from its current level to our probability-weighted estimate of forward fair value.
Scenario Implied Spreads (Probability)
Current Market Spread −
Weighted Average
of Implied Spreads =
“Excess” SpreadSector
EU Stress (10%)
GDP < 1% (10%)
GDP 1%-3% (50%)
GDP > 3% (30%)
Emerging Market External Debt 481 337 164 139 284 − 206 = 78
Bank Loans 939 784 404 341 523 − 477 = 47
US High Yield 945 795 368 295 488 − 446 = 42
US Investment Grade Credit 303 249 127 107 138 − 151 = -13
Agency MBS 71 49 51 57 39 − 55 = -16
CMBS 554 444 187 141 135 − 236 = -101
Scenarios (Probability) and Forecasts
Probability Weighted AverageIndicators
Current Level
EU Stress (10%)
GDP < 1% (10%)
GDP 1%-3% (50%)
GDP > 3% (30%)
US Industrial Production (6-mo. growth rate) 0.8% -2.0% -2.0% 2.0% 3.0% 1.5%
VIX Index 14 35 25 14 14 17
S&P 500 (6-month % change) 8% -17% -14% 5% 10% 2%
Default rate (12-month trailing rate) 2.7% 4.0% 3.5% 2.0% 2.0% 2.4%

16 | Goldman Sachs Asset Management
The Case for Unconstrained Fixed Income
This information discusses general market activity, industry or sector trends, or other broad-based economic, market or political conditions and should not be construed as research or investment advice. Past performance does not guarantee future results, which may vary. The economic and market forecasts presented herein have been generated by GSAM for informational purposes as of the date of this paper. There can be no assurance that the forecasts will be achieved. Please see additional disclosures at the end of this paper.FOR FINANCIAL INTERMEDIARY USE ONLY. NOT FOR USE AND/OR DISTRIBUTION TO THE GENERAL PUBLIC.
Exhibit 13: US High Yield Spread Scenario ExampleActual US high yield spreads and GSAM model-implied spreads across different scenarios
Source: Barclays US High Yield Index for actual spreads through February 2013. GSAM for model-implied spreads after February 2013. Simulated performance results do not reflect actual trading and have inherent limitations. No representation is made that a client will achieve results similar to those shown. Please see additional disclosures.
Essentially, our scenario analysis suggests high yield spreads have further room to tighten in scenarios where growth remains trend-like (1%-3% GDP) or accelerates to above trend. Based on our overall macroeconomic view, we estimate that the probability of these scenarios is a combined 80%. Downside scenarios in which growth is flat or contracts, or European market stress spikes, could be associated with significant spread widening. We believe the combined probability of these scenarios is about 20%. As a result, our probability-weighted forward fair value suggests spreads could continue to tighten somewhat.
Volatility is another important consideration when attempting to assess the relative value of different fixed income sectors. Thus, when comparing all sectors globally, we adjust both our current and scenario-based future estimate of fair value to account for the volatility of each sector. This approach allows us to set all sectors on a roughly equal playing field and evaluate spreads on both a current and future basis.
0
100
200
300
400
500
600
700
800
900
1000
Aug-13Feb-13Aug-12Feb-12Aug-11Feb-11
Actual Spread Fair Value
Spr
ead
(bps
)
EU Stress945
No Growth795
Fair Value446Trend-Like367Above Trend294
Goldman Sachs Asset Management | 17
This information discusses general market activity, industry or sector trends, or other broad-based economic, market or political conditions and should not be construed as research or investment advice. Please see additional disclosures. Past performance does not guarantee future results, which may vary. FOR FINANCIAL INTERMEDIARY USE ONLY. NOT FOR USE AND/OR DISTRIBUTION TO THE GENERAL PUBLIC.
The Case for Unconstrained Fixed Income
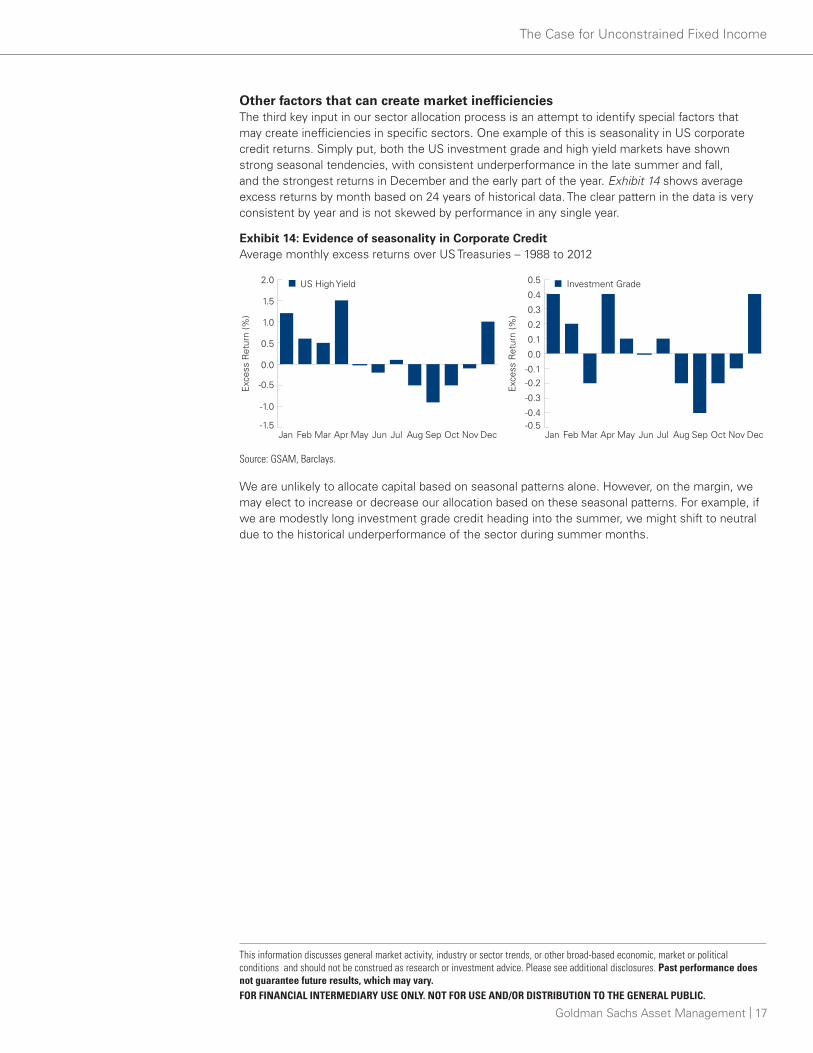
Other factors that can create market inefficienciesThe third key input in our sector allocation process is an attempt to identify special factors that may create inefficiencies in specific sectors. One example of this is seasonality in US corporate credit returns. Simply put, both the US investment grade and high yield markets have shown strong seasonal tendencies, with consistent underperformance in the late summer and fall, and the strongest returns in December and the early part of the year. Exhibit 14 shows average excess returns by month based on 24 years of historical data. The clear pattern in the data is very consistent by year and is not skewed by performance in any single year.
Exhibit 14: Evidence of seasonality in Corporate CreditAverage monthly excess returns over US Treasuries – 1988 to 2012
Source: GSAM, Barclays.
We are unlikely to allocate capital based on seasonal patterns alone. However, on the margin, we may elect to increase or decrease our allocation based on these seasonal patterns. For example, if we are modestly long investment grade credit heading into the summer, we might shift to neutral due to the historical underperformance of the sector during summer months.
-1.5
-1.0
-0.5
0.0
0.5
1.0
1.5
2.0
-0.5-0.4
-0.3
-0.2-0.1
0.0
0.1
0.2
0.3
0.4
0.5
Jan Feb Mar Apr May Jun Jul Aug Sep Oct Nov Dec Jan Feb Mar Apr May Jun Jul Aug Sep Oct Nov Dec
Exc
ess
Ret
urn
(%)
Exc
ess
Ret
urn
(%)
US High Yield Investment Grade

18 | Goldman Sachs Asset Management
This information discusses general market activity, industry or sector trends, or other broad-based economic, market or political conditions and should not be construed as research or investment advice. Please see additional disclosures. Past performance does not guarantee future results, which may vary. FOR FINANCIAL INTERMEDIARY USE ONLY. NOT FOR USE AND/OR DISTRIBUTION TO THE GENERAL PUBLIC.
The Case for Unconstrained Fixed Income
Conclusion
In our view, investing today and in the years ahead presents a unique, strategic challenge for fixed income investors due to the low level of interest rates globally, the asymmetric risk of rising rates relative to further declines, and the negative effect that a rise in rates would have on fixed income allocations concentrated in duration risk.
Although we focus primarily on the US and believe the likely trend toward higher rates may be delayed in major markets outside the US, we think the overall theme is the same globally:
n Compensation for rate risk is unattractive in major government bond markets due in large part to intervention by central banks,
n Rates have limited room for further decline and seem likely to rise in the years ahead, and
n Rising rates could lead to negative total returns on traditional bond allocations, which have historically offered consistently positive total returns due to a 30-year bull market in rates.
In this environment, we believe income-oriented strategies will continue to be a critical part of investors’ asset allocation. However, we also believe many fixed income allocations are generally too concentrated in duration risk and too constrained by benchmark considerations to adapt to this environment and generate positive returns in a prolonged environment of rising interest rates.
We believe many types of investors would benefit from a strategic allocation to unconstrained fixed income approaches that have greater flexibility to allocate capital to fixed income sectors that offer attractive risk-adjusted return potential while limiting exposure to unattractive sectors. In our view, a systematic and repeatable process for evaluating opportunity across the global spectrum of fixed income sectors is important in any multi-sector fixed income portfolio, but is particularly critical in unconstrained portfolios. We believe GSAM Fixed Income’s sector allocation process provides a consistent and repeatable process for quantifying our fundamental judgments, analyzing the potential range of outcomes across a wide variety of scenarios and allocating capital opportunistically to fixed income sectors that offer the most attractive combination of risk and return potential.

Goldman Sachs Asset Management | 19
This information discusses general market activity, industry or sector trends, or other broad-based economic, market or political conditions and should not be construed as research or investment advice. Please see additional disclosures. Past performance does not guarantee future results, which may vary. FOR FINANCIAL INTERMEDIARY USE ONLY. NOT FOR USE AND/OR DISTRIBUTION TO THE GENERAL PUBLIC.
The Case for Unconstrained Fixed Income
THIS MATERIAL IS PROVIDED SOLELY ON THE BASIS THAT IT WILL NOT CONSTITUTE INVESTMENT ADVICE AND WILL NOT FORM A PRIMARY BASIS FOR ANY PERSON’S OR PLAN’S INVESTMENT DECISIONS, AND GOLDMAN SACHS IS NOT A FIDUCIARY WITH RESPECT TO ANY PERSON OR PLAN BY REASON OF PROVIDING THE MATERIAL OR CONTENT HEREIN.This material is provided for educational purposes only and should not be construed as investment advice or an offer or solicitation to buy or sell securities. THIS MATERIAL DOES NOT CONSTITUTE AN OFFER OR SOLICITATION IN ANY JURISDICTION WHERE OR TO ANY PERSON TO WHOM IT WOULD BE UNAUTHORIZED OR UNLAWFUL TO DO SO. Views and opinions expressed are for informational purposes only and do not constitute a recommendation by GSAM to buy, sell, or hold any security. Views and opinions are current as of the date of this presentation and may be subject to change, they should not be construed as investment advice.References to indices, benchmarks or other measures of relative market performance over a specified period of time are provided for your information only and do not imply that the portfolio will achieve similar results. The index composition may not reflect the manner in which a portfolio is constructed. While an adviser seeks to design a portfolio which reflects appropriate risk and return features, portfolio characteristics may deviate from those of the benchmark.Although certain information has been obtained from sources believed to be reliable, we do not guarantee its accuracy, completeness or fairness. We have relied upon and assumed without independent verification, the accuracy and completeness of all information available from public sources. Past performance does not guarantee future results, which may vary. The value of investments and the income derived from investments will fluctuate and can go down as well as up. A loss of principal may occur.Confidentiality No part of this material may, without GSAM’s prior written consent, be (i) copied, photocopied or duplicated in any form, by any means, or (ii) distributed to any person that is not an employee, officer, director, or authorized agent of the recipient.Expected return models apply statistical methods and a series of fixed assumptions to derive estimates of hypothetical average asset class performance. Reasonable people may disagree about the appropriate statistical model and assumptions. These models have limitations, as the assumptions may not be consensus views, or the model may not be updated to reflect current economic or market conditions. These models should not be relied upon to make predictions of actual future account performance. GSAM has no obligation to provide updates or changes to such data. This information discusses general market activity, industry or sector trends, or other broad-based economic, market or political conditions and should not be construed as research or investment advice. Please see additional disclosures.This material has been prepared by GSAM and is not a product of Goldman Sachs Global Investment Research. The views and opinions expressed may differ from those of Goldman Sachs Global Investment Research or other departments or divisions of Goldman Sachs and its affiliates. Investors are urged to consult with their financial advisors before buying or selling any securities. This information may not be current and GSAM has no obligation to provide any updates or changes.Goldman Sachs does not provide accounting, tax, or legal advice. Notwithstanding anything in this document to the contrary, and except as required to enable compliance with applicable securities law, you may disclose to any person the US federal and state income tax treatment and tax structure of the transaction and all materials of any kind (including tax opinions and other tax analyses) that are provided to you relating to such tax treatment and tax structure, without Goldman Sachs imposing any limitation of any kind. Investors should be aware that a determination of the tax consequences to them should take into account their specific circumstances and that the tax law is subject to change in the future or retroactively and investors are strongly urged to consult with their own tax advisor regarding any potential strategy, investment or transaction.Please note that neither Goldman Sachs Asset Management International nor any other entities involved in the Goldman Sachs Asset Management (GSAM) business maintain any licenses, authorizations or registrations in Asia (other than Japan), except that it conducts businesses (subject to applicable local regulations) in and from the following jurisdictions: Hong Kong, Singapore, Malaysia, Korea, and India. This material has been communicated in Canada by Goldman Sachs Asset Management, L.P. (GSAM LP). GSAM LP is registered as a portfolio manager under securities legislation in certain provinces of Canada, as a non-resident commodity trading manager under the commodity futures legislation of Ontario and as a portfolio manager under the derivatives legislation of Quebec. In other provinces, GSAM LP conducts its activities under exemptions from the adviser registration requirements. Investments in securities of the type referenced in this presentation may only be made pursuant to applicable Canadian private placement offering documents, of which this material is not a part. Canadian private placement offering documents will be provided to you upon request for the purpose of any investment you may wish to make in any securities referenced herein. In certain provinces, GSAM LP is not registered to provide investment advisory or portfolio management services in respect of exchange-traded futures or options contracts and is not offering to provide such investment advisory or portfolio management services in such provinces by delivery of this material. GSAM LP and certain of its affiliates may serve as the investment manager or adviser to the investment funds described in this presentation and may be entitled to receive fees in connection therewith. Accordingly, the investment funds may be considered a “related issuer” or “connected issuer” of GSAM LP or certain of its affiliates for purposes of applicable Canadian securities laws. Further information concerning relationships between GSAM LP and its affiliates and the investment funds described in this presentation is included in the applicable Canadian private placement offering documents pursuant to which the investment funds may be offered for sale in Canada. GSAM LP and certain of its affiliates may serve as the investment manager or adviser to the investment funds described in the presentation and may be entitled to receive fees in connection therewith. Accordingly, the investment funds may be considered a “related issuer” or “connected issuer” of GSAM LP or certain of its affiliates for purposes of applicable Canadian securities laws. Further information concerning relationships between GSAM LP and its affiliates and the investment funds described in this presentation is included in the applicable Canadian private placement offering documents pursuant to which the investment funds may be offered for sale in Canada. This material has been issued for use in or from Hong Kong by Goldman Sachs (Asia) L.L.C, in or from Singapore by Goldman Sachs (Singapore) Pte. (Company Number: 198602165W), and in or from Korea by Goldman Sachs Asset Management Korea Co. Ltd., in or from Malaysia by Goldman Sachs(Malaysia) Sdn Berhad and in or from India by Goldman Sachs Asset Management (India) Private Limited (GSAM India). This material has been issued or approved in Japan for the use of professional investors defined in Article 2 paragraph (31) of the Financial Instruments and Exchange Law by Goldman Sachs Asset Management Co., Ltd. This material has been approved by Goldman Sachs International, which is authorised in the UK by the Prudential Regulation Authority and regulated by the Financial Conduct Authority and the Prudential Regulation Authority.

FOR FINANCIAL INTERMEDIARY USE ONLY. NOT FOR USE AND/OR DISTRIBUTION TO THE GENERAL PUBLIC. © 2013 Goldman Sachs. All rights reserved. 96189.OTHER.OTU USIWPUFI/04-13