the collegiate learning assessment - stanford...
TRANSCRIPT
The Collegiate Learning AssessmentFacts and Fantasies
Stephen KleinRoger BenjaminCouncil for Aid to EducationRichard ShavelsonStanford UniversityRoger BolusResearch Solutions Group
The Collegiate Learning Assessment (CLA) is a computer administered,open-ended (as opposed to multiple-choice) test of analytic reasoning, criti-cal thinking, problem solving, and written communication skills. Because theCLA has been endorsed by several national higher education commissions, ithas come under intense scrutiny by faculty members, college administrators,testing experts, legislators, and others. This article describes the CLA’s mea-sures and what they do and do not assess, how dependably they measure whatthey claim to measure, and how CLA scores differ from those on other directand indirect measures of college student learning. For instance, analyses areconducted at the school rather than the student level and results are adjustedfor input to assess whether the progress students are making at their schoolis better or worse than what would be expected given the progress of “simi-larly situated” students (in terms of incoming ability) at other colleges.
Keywords: performance testing; higher education assessment
The Secretary of Education’s Commission on the Future of HigherEducation, which has come to be known as the “Spellings’ Commission,”
identified the Collegiate Learning Assessment (CLA) as one of “the mostcomprehensive national efforts to measure how much students actually learnat different campuses” and that the CLA, “promotes a culture of evidence-based assessment in higher education” (U.S. Department of Education2006, 22). The Commission went on to recommend that “higher educationinstitutions should measure student learning using quality assessment datafrom instruments such as, for example, the Collegiate Learning Assessment,
Evaluation ReviewVolume XX Number XMonth XXXX X-XX
© Sage Publications10.1177/0193841X07303318
http://er.sagepub.comhosted at
http://online.sagepub.com
1
which measures the growth of student learning taking place in colleges . . .”(p. 23). This recommendation concurs with that of the Association ofAmerican Colleges and Universities (AAC&U 2005) and the AmericanAssociation of State Colleges and Universities (AASCU, 2006): The bestexample of direct value-added assessment is the Collegiate LearningAssessment (CLA), an outgrowth of RAND’s Value-added AssessmentInitiative (VAAI) that has been available to colleges and universities sincespring 2004. The test goes beyond a multiple-choice format and poses real-world performance tasks that require students to analyze complex materialand provide written responses (such as preparing a memo or policy recom-mendation). (AASCU 2006, 4)
When a relatively novel assessment of student learning receives this kindof praise and attention, it rightfully gets put under the microscope. Questionsare raised about what it measures, its technical qualities, and its usefulness.Committees review the instruments, and opinions are formed about theirstrengths and weaknesses, sometimes by their competitors, rightly or wrongly.The CLA is a case in point. For example, Banta and Pike (2007) have raisedquestions about the appropriateness of the CLA’s value-added approach tolearning assessment. And Kuh (2006) has expressed concerns about the CLA’sreliability and utility.
Consequently, the time seems right to present, albeit briefly, the approachthe CLA program takes to assessment and score reporting, the types of mea-sures it uses, the similarities and differences between the CLA approach and themethods used by other large-scale programs, and finally, some of the importantstatistical properties of the CLA’s measures, including their reliability.
CLA Approach to Assessment
Here we describe the learning outcomes the CLA does and does not mea-sure. We also discuss the CLA’s approach to assessing learning outcomeswhich, while having a long and distinguished history (Shavelson, 2007a,2007b), is distinctly different than typical general education1 measures, suchas Educational Testing Service’s (ETS) more traditional Measure of AcademicProficiency and Progress (MAPP).
What the CLA Does and Does Not Measure
A truly comprehensive assessment of learning outcomes could very wellinclude most or perhaps all of the capacities shown in figure 1. While no one
2 Evaluation Review
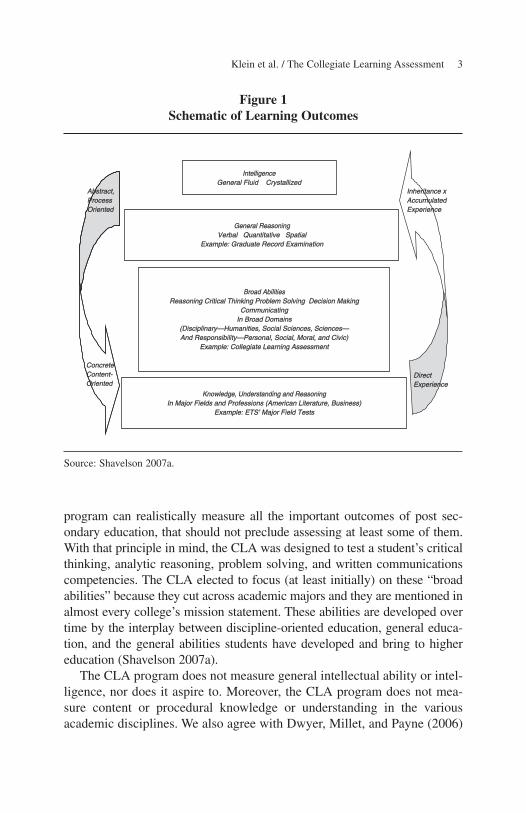
program can realistically measure all the important outcomes of post sec-ondary education, that should not preclude assessing at least some of them.With that principle in mind, the CLA was designed to test a student’s criticalthinking, analytic reasoning, problem solving, and written communicationscompetencies. The CLA elected to focus (at least initially) on these “broadabilities” because they cut across academic majors and they are mentioned inalmost every college’s mission statement. These abilities are developed overtime by the interplay between discipline-oriented education, general educa-tion, and the general abilities students have developed and bring to highereducation (Shavelson 2007a).
The CLA program does not measure general intellectual ability or intel-ligence, nor does it aspire to. Moreover, the CLA program does not mea-sure content or procedural knowledge or understanding in the variousacademic disciplines. We also agree with Dwyer, Millet, and Payne (2006)
Klein et al. / The Collegiate Learning Assessment 3
AbAbstracract,ProcesscessOrientOriented ed
ConConcrereteConContenent-OrientOriented ed
Broad AbilitiesBroad AbilitiesReasoning Critical Thinking Problem Solving Decision MakingReasoning Critical Thinking Problem Solving Decision Making
CommunicatingCommunicatingIn Broad DomainsIn Broad Domains
(Disciplinary(Disciplinary—Humanities, Social Sciences, SciencesHumanities, Social Sciences, Sciences—And ResponsibilityAnd Responsibility—Personal, Social, Moral, and Civic)Personal, Social, Moral, and Civic)
Example: Collegiate Learning AssessmentExample: Collegiate Learning Assessment
Knowledge, Understanding and ReasoningKnowledge, Understanding and ReasoningIn Major Fields and Professions (American Literature, Business)In Major Fields and Professions (American Literature, Business)
Example: ETSExample: ETS’ Major Field Tests Major Field Tests
General ReasoningGeneral ReasoningVerbal Quantitative SpatialVerbal Quantitative Spatial
Example: Graduate Record ExaminationExample: Graduate Record Examination
IntelligenceIntelligenceGenerneral l Fluiuid d C Crystallllizized
InInheritaritance xce xAccuAccumulatelatedExpExpeririencece
DireDirectctExExperienerience
Figure 1Schematic of Learning Outcomes
Source: Shavelson 2007a.
that it would be useful to have inter-institutional measures of these andother important post-secondary outcomes. However, there are real ques-tions about the feasibility of constructing such instruments so that theywould by appropriate for inter-institutional comparisons, particularly whenthere is a need to combine data across academic majors or to be applicableto students with joint majors. Nevertheless, if such measures could be con-structed and calibrated to a common score scale, it is anticipated that theywould be used in conjunction with (rather than as a replacement for) theCLA’s tests.
The CLA focuses on the institution (rather than the student) as the unit ofanalysis. Its goal is to provide a summative assessment of the value-addedby the school’s instructional and other programs (taken as a whole) withrespect to certain important learning outcomes. The results with these mea-sures are intended to send a signal to administrators, faculty, and studentsabout some of the competencies that need to be developed, the level of per-formance attained by the students at their institution, and most importantly,whether that level is better, worse, or about the same as what would beexpected given the ability level of its incoming students.
The CLA itself does not identify the reasons why a school’s students dobetter or worse than expected nor does it suggest what curricular or otherchanges the school should implement to improve student performance. Acollege must turn to its faculty, reviews from accrediting agencies, data fromlocally constructed measures, and other sources to determine what it can andshould do to raise scores. However, because CLA scores are standardizedacross administrations, they can be used (along with other indicators) toexamine the overall effects on student performance of the reforms and poli-cies an institution implements.2
In short, the CLA’s main goal is to provide information that will help col-leges and universities determine how much their students are improving andwhether that improvement is in line with the gains of comparable students atother institutions. Some leading colleges also are using the CLA to examinethe effects of alternative instructional programs within their institution.
Ideally, assessment of learning outcomes should go beyond the CLA’sdirect measures of learning to tap some of the other areas shown in figure 1.By direct measures we mean students actually have to perform some cog-nitively demanding task and the quality of that performance is graded on anumerical scale (Carroll 1993). In contrast, indirect measures are designedto provide information about institutional characteristics that are believedto be important to the learning environment. For example, the Spellings’Commission noted that the National Survey of Student Engagement
4 Evaluation Review
(NSSE) inquires about “student participation and engagement in programsdesigned to improve their learning and development. The measures ofstudent engagement—the time and effort students put into educationalactivities in and out of the classroom, from meeting with professors to read-ing books that weren’t assigned in class” are designed to “serve as a proxy forthe value and quality of their undergraduate experience” (U. S. Departmentof Education 2006, 22; emphasis added). We will have more to say aboutthe distinction between direct and indirect measures (and the NSSE) laterin this article.
Finally, of particular importance to higher education policy are actuarialindicators of access to, cost of, and rates of graduation from higher educa-tion. A comprehensive assessment of learning access and learning shouldalso include such indicators.
In sum, the CLA is but one of many important indicators of student learn-ing. Ideally, it will be used in conjunction with other direct measures of learn-ing outcomes, indirect measures of institutional support for learning, andother indicators that are important to the policy community and the public.
CLA Instruments
The CLA measures students’ critical thinking, analytic reasoning, problemsolving, and written communication skills with meaningful, holistic, complextasks following in the tradition of the progressive education movement thatcan be traced back to the 1930s (Shavelson 2007b). Some of the CLA tasksemphasize written communication skills whereas others involve realistic“work-sample” performance tasks. All the tasks are designed to be appropri-ate for college students across a wide range of undergraduate academicmajors and general education programs.
The CLA’s performance tasks were modeled after measures developed byKlein for the California bar examination (1982, 1983) and by the “Tasks inCritical Thinking” that were developed by the New Jersey Department ofHigher Education (Ewell 1994; Erwin and Sebrell 2003). With this approach,tasks are derived from a domain of real-world jobs suggested by activitiesfound in education, work, policy, and everyday practice. To perform the tasks,test-takers need to think critically and analytically about the information theyare given and communicate their decisions, judgments, or recommendationsclearly and with appropriate justification (see McClelland 1973).
The capacity to provide these rich tasks without overburdening students isin part afforded by recent developments in information technology. All the
Klein et al. / The Collegiate Learning Assessment 5
assessments are delivered on an interactive internet platform that produces apaperless, electronic administration, and online scoring and reporting ofresults. Answers to the essay type tasks are scored using natural language pro-cessing software. Answers to the performance tasks are currently scored byhuman readers who after extensive training and calibration, grade the answerson line. The whole system, then, is paperless, which significantly reducescosts. We anticipate that within the next few years, the performance tasks alsowill be scored by computer software.3
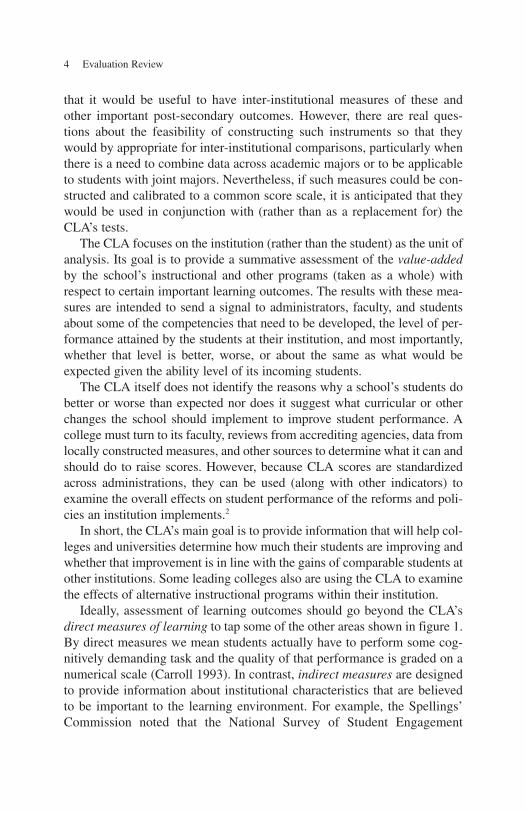
Figure 2 illustrates one performance task. In this task, students are asked toassume they work for DynaTech—a company that produces electronic navi-gational and communication equipment for small aircraft—and have beenasked by their boss to evaluate the pros and cons of purchasing a plane (calledthe “SwiftAir 235”) for the company. Concern about this purchase has risenwith the report of a recent SwiftAir 235 crash. In evaluating the situation,students are given a library of information about the SwiftAir 235 in particu-lar and airplane accidents in general. Some of the information is relevant andsound, but some is not. Part of the problem is for students to decide what infor-mation to use and what to ignore. Students integrate these multiple sources ofinformation to arrive at a problem solution, decision, or recommendation.
Students respond in a real-life manner by, for example, writing a memo-randum to their boss analyzing the pros and cons of alternative solutions,anticipating possible problems and solutions to them, recommending whatthe company should do, and marshalling the evidence to support their opin-ions and recommendations. In scoring performance, alternative justifiablesolutions to the problem and alternative solution paths are recognized andevaluated.4 With this particular task, some students, quite perceptively, rec-ognized that there might be undesirable fallout if DynaTech’s own airplanecrashed while flying with DynaTech instruments.
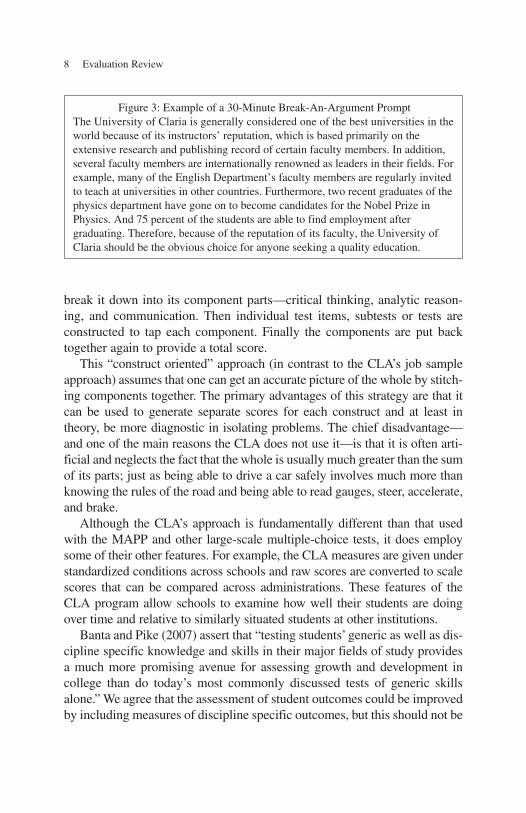
The CLA program also uses two types of essay questions. The thirty-minute “break-an-argument” type prompts present an argument and asksstudents to critique it, including their analysis of the validity of the author’sarguments, rather than simply agreeing or disagreeing with the author’s posi-tion (see figure 3 for an example).
The forty-five-minute make-an-argument type prompts present studentswith a point of view about a topic of general interest and asks them torespond to it from any perspective(s) they wish. One of these prompts is:“In our time, specialists of all kinds are highly overrated. We need moregeneralists—people who can provide broad perspectives.” Students areinstructed to provide relevant reasons and examples to explain and justifytheir views. The answers to the break-an-argument and make-an-argumentprompts are machine scored.
6 Evaluation Review

All the machine and reader assigned “raw” scores are converted to acommon scale of measurement. Consequently, an answer that receives agiven scale score on one task reflects about the same level of relative profi-ciency as answers that received that same scale score on another task. Thisfeature permits combining and averaging scores from different tasks to obtainoverall school means. Moreover, by anchoring this scale to the SAT, the CLAprogram can compare scale scores over time, such as for measuring improve-ment between entering first year students and graduating seniors.5
The CLA approach recognizes that critical thinking, analytic reasoning,problem solving, and written communication skills are inherently and com-plexly intertwined in the task and response demands. The performance tasksin particular need to be drawn from real-world domains of activities to pre-serve their integrity. To pull the tasks apart and index critical thinking, ana-lytic reasoning, and communication separately would be impossible with thecomplexity and wholeness of these tasks. To do so would give up their job-sample flavor and create artificial tasks that are stripped of their real-worldcomplexity. Nevertheless, that is what measures like the MAPP do. Theirapproaches to assessment grew out of the Carnegie Foundation’s pioneeringwork in the measurement of undergraduates’ learning at the beginning of thetwentieth century and were greatly influenced by the behaviorists, mostnotably by E. L. Thorndike (Shavelson 2007b). These assessments take amultidimensional “construct” such as the one the CLA deals with and try to
Klein et al. / The Collegiate Learning Assessment 7
Figure 2Format for a Collegiate Learning Assessment Performance Task
break it down into its component parts—critical thinking, analytic reason-ing, and communication. Then individual test items, subtests or tests areconstructed to tap each component. Finally the components are put backtogether again to provide a total score.
This “construct oriented” approach (in contrast to the CLA’s job sampleapproach) assumes that one can get an accurate picture of the whole by stitch-ing components together. The primary advantages of this strategy are that itcan be used to generate separate scores for each construct and at least intheory, be more diagnostic in isolating problems. The chief disadvantage—and one of the main reasons the CLA does not use it—is that it is often arti-ficial and neglects the fact that the whole is usually much greater than the sumof its parts; just as being able to drive a car safely involves much more thanknowing the rules of the road and being able to read gauges, steer, accelerate,and brake.
Although the CLA’s approach is fundamentally different than that usedwith the MAPP and other large-scale multiple-choice tests, it does employsome of their other features. For example, the CLA measures are given understandardized conditions across schools and raw scores are converted to scalescores that can be compared across administrations. These features of theCLA program allow schools to examine how well their students are doingover time and relative to similarly situated students at other institutions.
Banta and Pike (2007) assert that “testing students’ generic as well as dis-cipline specific knowledge and skills in their major fields of study providesa much more promising avenue for assessing growth and development incollege than do today’s most commonly discussed tests of generic skillsalone.” We agree that the assessment of student outcomes could be improvedby including measures of discipline specific outcomes, but this should not be
8 Evaluation Review
Figure 3: Example of a 30-Minute Break-An-Argument PromptThe University of Claria is generally considered one of the best universities in theworld because of its instructors’ reputation, which is based primarily on theextensive research and publishing record of certain faculty members. In addition,several faculty members are internationally renowned as leaders in their fields. Forexample, many of the English Department’s faculty members are regularly invitedto teach at universities in other countries. Furthermore, two recent graduates of thephysics department have gone on to become candidates for the Nobel Prize inPhysics. And 75 percent of the students are able to find employment aftergraduating. Therefore, because of the reputation of its faculty, the University ofClaria should be the obvious choice for anyone seeking a quality education.
done at the expense of assessing the broad skills that colleges say they aretrying to develop in their students and employers value. Moreover, the aver-age improvement in scores between entering freshmen and graduatingseniors on the CLA is more than one standard deviation. By any standard,this is a very large effect size, and one that suggests the CLA is sensitive tothe effects of a college education.
Some of the CLA’s Other Distinguishing Features
As noted above, the CLA approach differs from the ones used in mostother large scale testing programs. For example, all CLA measures areadministered on line, all the questions are open-ended (there are no multiple-choice items), and all the students’ responses are scored by machine or by atrained cadre of readers who grade the answers on-line. In addition, students areassigned randomly to tasks so that a given student answers only a small portionof the full complement of tasks, but all the tasks are given at each school.6 This“matrix sampling” strategy greatly reduces the testing burden on individualstudents while still using the same set of measures across institutions.
Unlike large-scale testing programs at the elementary and secondaryschool levels, the CLA program tests only a sample of a school’s students.Moreover, student participation in this program is typically voluntary ratherthan required. Although it certainly would be more desirable to test all or atruly random sample of students at each school, neither of these options isfeasible on most college campuses. MAPP and NSSE, for example, face thesame problem.
Colleges and universities use a variety of methods to encourage theirstudents to take the CLA tests, such as giving them bookstore gift cards,preference in registration, and prizes. However, at least so far, there does notappear to be any meaningful relationship between the type of inducementused and participation rates, student motivation to do well on the tests, orscores. For example, students who take a performance task complete a post-assessment questionnaire that asks them how hard they tried to do well onthe task. Analyses of these data indicate that once there is control on SATscores, self reported ratings of effort account for only about five percent ofthe variance in mean school scores, which is too small to have much impacton results.7
Students also report the primary motivating factor for taking the CLA.Their responses are categorized into the following three groups: (1) Personal
Klein et al. / The Collegiate Learning Assessment 9
Development (understanding my strengths and weaknesses or how my scorecompares to those of other students); (2) Remuneration (stipends, gift cer-tificates, lottery for large prize); and (3) Requirement (embedded in a classor campus-wide assessment activity). After controlling on their SAT scores,which type of factor they mention accounts for only one percent of the vari-ance in student level CLA scores.
Reporting Results in Terms of Value-added
One of the most important features of the CLA program is its policy ofreporting results in terms of whether an institution’s students are doingbetter, worse or about the same as would be expected given the level of theirentering competencies. The program also examines whether the improve-ment in average student performance between entry and graduation at aschool is in line with the gains of comparable students at other colleges. Theprogram is therefore able to inform schools about whether the progress theirstudents are making is consistent with the gains at other institutions (e.g.,Raudenbush 2004). Thus, the CLA program adheres to the principle thatpost-secondary assessment programs should focus on measuring and con-tributing to improvement in student learning.8
A “value-added” approach to assessing improvement was adopted because(a) the sample of students tested at a school may be somewhat more or lessable than their classmates, (b) the incoming characteristics of a school’sstudents who participate in one year may be different from the characteristicsof those who participate in another year, and (c) schools differ markedly in thecompetencies of their entering students.9 These complicating factors precludemaking simple comparisons of mean scores between schools. Thus, to providea reasonable, practical method for measuring improvement between schoolsas well as within a school over time, it is first necessary to adjust the scores forthe entering competencies of the students who actually participate in the test-ing program at each institution.
Operationally, this adjustment is made by calculating the differencebetween a school’s actual mean CLA score and the mean its students wouldbe expected to earn. 10 For this purpose, the expected mean is derived fromthe strong empirical relationship between mean CLA and SAT scores acrossall the schools in the CLA program (e.g., Raudenbush 2004). For each col-lege, then, we subtract its freshmen’s expected mean score from its seniors’expected mean score. In so doing, we assume, as do most value-addedapproaches (Wainer 2004), a simple additive model: that the effect of fouryears of education (and experience) adds an equal increment to students’
10 Evaluation Review
outcomes. The regression equations for freshmen and seniors that are usedfor this purpose have nearly identical slopes, but quite different intercepts(see CLA Test Report @www.cae.org for details).11
To be sure, there are potential problems with value-added (and other)learning-assessment scores if the assumptions underlying these methods aresubstantially violated (Banta and Pike 2007; Braun 2005). For example, theCLA approach assumes that the relationship between CLA and SAT scoresin the sample of students tested at a school is linear, an assumption sup-ported by a long history of such relationships among cognitive measures (fora readable review of human cognitive abilities, see Martinez 2000). Theapproach also assumes that the relationship between CLA and SAT scores inthe sample of students tested is generally representative of the relationshipbetween these variables among all the students at that school. The analysisfurther assumes that the sample of schools participating in the CLA programis generally representative of a national sample of schools.
As noted in the CLA test reports (CLA 2006), there is empirical evidenceto indicate that both of these conditions are being met. For example, when theschool is used as the unit of analysis, there is a 0.96 correlation between the
Klein et al. / The Collegiate Learning Assessment 11
Table 1Four-Year Institutions in the CLA and Nation
by Key School Characteristics
School Characteristic Nation CLA
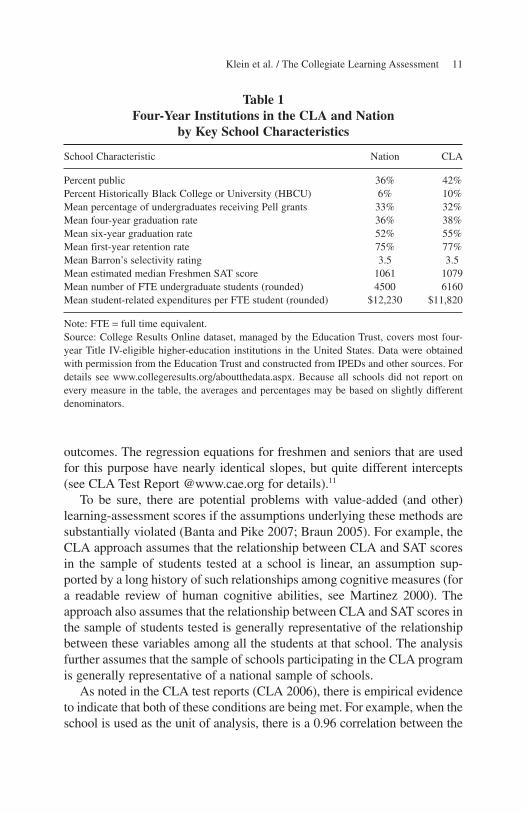
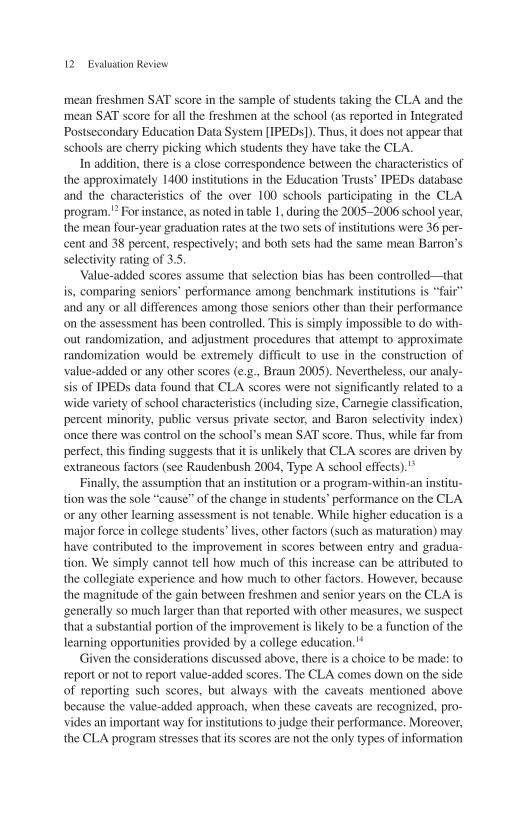
Percent public 36% 42%Percent Historically Black College or University (HBCU) 6% 10%Mean percentage of undergraduates receiving Pell grants 33% 32%Mean four-year graduation rate 36% 38%Mean six-year graduation rate 52% 55%Mean first-year retention rate 75% 77%Mean Barron’s selectivity rating 3.5 3.5Mean estimated median Freshmen SAT score 1061 1079Mean number of FTE undergraduate students (rounded) 4500 6160Mean student-related expenditures per FTE student (rounded) $12,230 $11,820
Note: FTE = full time equivalent.Source: College Results Online dataset, managed by the Education Trust, covers most four-year Title IV-eligible higher-education institutions in the United States. Data were obtainedwith permission from the Education Trust and constructed from IPEDs and other sources. Fordetails see www.collegeresults.org/aboutthedata.aspx. Because all schools did not report onevery measure in the table, the averages and percentages may be based on slightly differentdenominators.
mean freshmen SAT score in the sample of students taking the CLA and themean SAT score for all the freshmen at the school (as reported in IntegratedPostsecondary Education Data System [IPEDs]). Thus, it does not appear thatschools are cherry picking which students they have take the CLA.
In addition, there is a close correspondence between the characteristics ofthe approximately 1400 institutions in the Education Trusts’ IPEDs databaseand the characteristics of the over 100 schools participating in the CLAprogram.12 For instance, as noted in table 1, during the 2005–2006 school year,the mean four-year graduation rates at the two sets of institutions were 36 per-cent and 38 percent, respectively; and both sets had the same mean Barron’sselectivity rating of 3.5.
Value-added scores assume that selection bias has been controlled—thatis, comparing seniors’ performance among benchmark institutions is “fair”and any or all differences among those seniors other than their performanceon the assessment has been controlled. This is simply impossible to do with-out randomization, and adjustment procedures that attempt to approximaterandomization would be extremely difficult to use in the construction ofvalue-added or any other scores (e.g., Braun 2005). Nevertheless, our analy-sis of IPEDs data found that CLA scores were not significantly related to awide variety of school characteristics (including size, Carnegie classification,percent minority, public versus private sector, and Baron selectivity index)once there was control on the school’s mean SAT score. Thus, while far fromperfect, this finding suggests that it is unlikely that CLA scores are driven byextraneous factors (see Raudenbush 2004, Type A school effects).13
Finally, the assumption that an institution or a program-within-an institu-tion was the sole “cause” of the change in students’ performance on the CLAor any other learning assessment is not tenable. While higher education is amajor force in college students’ lives, other factors (such as maturation) mayhave contributed to the improvement in scores between entry and gradua-tion. We simply cannot tell how much of this increase can be attributed tothe collegiate experience and how much to other factors. However, becausethe magnitude of the gain between freshmen and senior years on the CLA isgenerally so much larger than that reported with other measures, we suspectthat a substantial portion of the improvement is likely to be a function of thelearning opportunities provided by a college education.14
Given the considerations discussed above, there is a choice to be made: toreport or not to report value-added scores. The CLA comes down on the sideof reporting such scores, but always with the caveats mentioned abovebecause the value-added approach, when these caveats are recognized, pro-vides an important way for institutions to judge their performance. Moreover,the CLA program stresses that its scores are not the only types of information
12 Evaluation Review
about student learning that should be used in examining and improvingstudent and institutional performance. Rather, CLA scores are but one sourceof information about institutional or program performance. The CLA resultsshould be used with those from other measures of student learning.
Banta and Pike (2007) based their criticism of the CLA’s use of value-added scores in part on a quote from ETS President and CEO KurtLandgraf’s statement that “Results from value-added models should notserve as the primary basis for making consequential decisions. Other mea-sures must be included in any fair and valid teacher evaluation system.” Wedo not disagree. Value-added results should be used with other indicators,but there is no reason to exclude them. Quite simply, the competencies theCLA measures are a critical part of higher education and the value-addedapproach is the most suitable way to measure them. Moreover, Landgraf wasreferring to using value-added scores to make important decisions aboutindividual instructors, which is not something the CLA program recom-mends and its results are not used for that or similar purposes by any of theinstitutions participating in the CLA program.
The CLA’s and the NSSE’s Similarities and Differences
The Spellings’ Commission mentioned the CLA, MAPP, and NSSE asmeasures schools should consider. We have already discussed differencesbetween the CLA and MAPP approaches, which are both direct measures oflearning. Consequently, we now turn to some of the important similarities anddifferences between the CLA and NSSE programs and in doing so, compareand contrast direct and indirect measures of learning.
The CLA and NSSE programs are both limited to the sample of studentswho agree to participate. The CLA addresses this constraint by using a value-added model, as described above. NSSE takes a different tack. It selects a ran-dom sample of the school’s students, but many of those students do not takeor complete the survey. Consequently, the NSSE program has to work withvoluntary samples, just like the CLA.
However, unlike the CLA, NSSE does not adjust its results for the rele-vant background characteristics of those who do respond which leads tointerpretive challenges. For example, at one school, the students who say onthe NSSE that they often read books that were not assigned in class mayhave been reading unassigned books long before they ever went to collegewhereas the students at another school who say they are reading unassignedbooks may be doing it for the first time.
Klein et al. / The Collegiate Learning Assessment 13
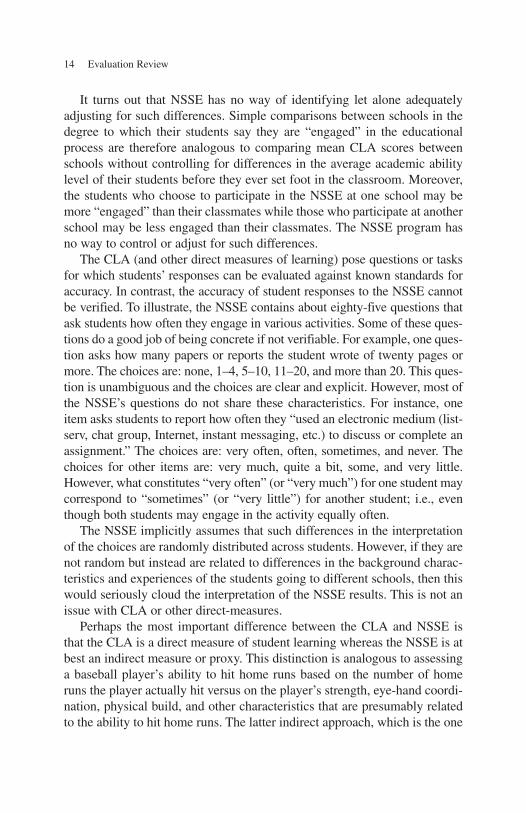
It turns out that NSSE has no way of identifying let alone adequatelyadjusting for such differences. Simple comparisons between schools in thedegree to which their students say they are “engaged” in the educationalprocess are therefore analogous to comparing mean CLA scores betweenschools without controlling for differences in the average academic abilitylevel of their students before they ever set foot in the classroom. Moreover,the students who choose to participate in the NSSE at one school may bemore “engaged” than their classmates while those who participate at anotherschool may be less engaged than their classmates. The NSSE program hasno way to control or adjust for such differences.
The CLA (and other direct measures of learning) pose questions or tasksfor which students’ responses can be evaluated against known standards foraccuracy. In contrast, the accuracy of student responses to the NSSE cannotbe verified. To illustrate, the NSSE contains about eighty-five questions thatask students how often they engage in various activities. Some of these ques-tions do a good job of being concrete if not verifiable. For example, one ques-tion asks how many papers or reports the student wrote of twenty pages ormore. The choices are: none, 1–4, 5–10, 11–20, and more than 20. This ques-tion is unambiguous and the choices are clear and explicit. However, most ofthe NSSE’s questions do not share these characteristics. For instance, oneitem asks students to report how often they “used an electronic medium (list-serv, chat group, Internet, instant messaging, etc.) to discuss or complete anassignment.” The choices are: very often, often, sometimes, and never. Thechoices for other items are: very much, quite a bit, some, and very little.However, what constitutes “very often” (or “very much”) for one student maycorrespond to “sometimes” (or “very little”) for another student; i.e., eventhough both students may engage in the activity equally often.
The NSSE implicitly assumes that such differences in the interpretationof the choices are randomly distributed across students. However, if they arenot random but instead are related to differences in the background charac-teristics and experiences of the students going to different schools, then thiswould seriously cloud the interpretation of the NSSE results. This is not anissue with CLA or other direct-measures.
Perhaps the most important difference between the CLA and NSSE isthat the CLA is a direct measure of student learning whereas the NSSE is atbest an indirect measure or proxy. This distinction is analogous to assessinga baseball player’s ability to hit home runs based on the number of homeruns the player actually hit versus on the player’s strength, eye-hand coordi-nation, physical build, and other characteristics that are presumably relatedto the ability to hit home runs. The latter indirect approach, which is the one
14 Evaluation Review
adopted by the NSSE, might make sense if the combination of these char-acteristics was strongly related to the number of home runs hit. However,there is little empirical evidence to suggest that student responses to theNSSE are in fact even moderately related to college grades, CLA scores, orCLA value-added scores (Klein et al. 2005).
Given these considerations, it is probably best to view the NSSE as a mea-sure of the degree to which students engage in activities that are important inand of themselves; i.e., rather than as proxies for learning outcomes. Thissuggestion is consistent with the one made in the ETS Culture of Evidencereport (Dwyer, Millett, and Payne 2006).
The CLA’s Statistical Properties
Banta and Pike (2007) as well as Kuh (2006) have raised questions aboutwhether CLA scores, and in particular the value-added (“residual”) scores, canbe trusted. In this section, we review some of the relevant statistical character-istics of the CLA scores that bear on this question. Specifically, we examinethe comparability between hand and machine assigned scores, the degree towhich different readers assign the same score to a given answer, the extent towhich school mean and residual scores are affected by chance, the effect ofusing the school as the unit of analysis, and the degree to which a student’sCLA scores are a function of that student’s demographic characteristics.
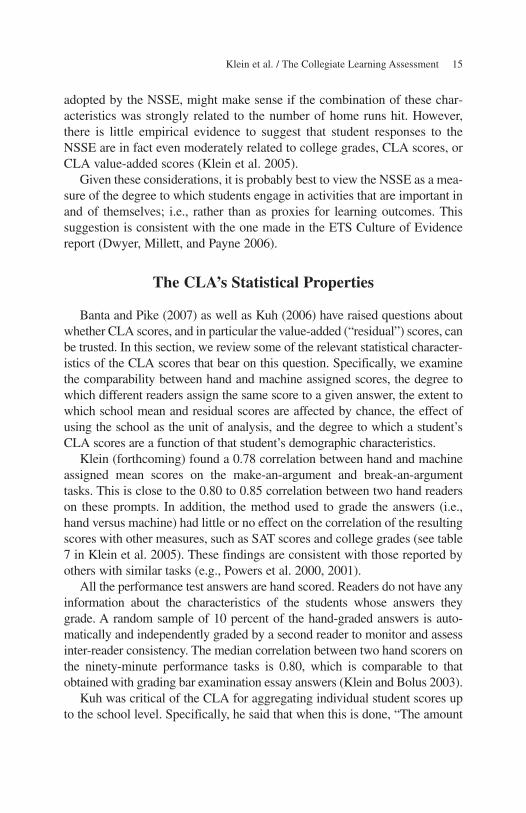
Klein (forthcoming) found a 0.78 correlation between hand and machineassigned mean scores on the make-an-argument and break-an-argumenttasks. This is close to the 0.80 to 0.85 correlation between two hand readerson these prompts. In addition, the method used to grade the answers (i.e.,hand versus machine) had little or no effect on the correlation of the resultingscores with other measures, such as SAT scores and college grades (see table7 in Klein et al. 2005). These findings are consistent with those reported byothers with similar tasks (e.g., Powers et al. 2000, 2001).
All the performance test answers are hand scored. Readers do not have anyinformation about the characteristics of the students whose answers theygrade. A random sample of 10 percent of the hand-graded answers is auto-matically and independently graded by a second reader to monitor and assessinter-reader consistency. The median correlation between two hand scorers onthe ninety-minute performance tasks is 0.80, which is comparable to thatobtained with grading bar examination essay answers (Klein and Bolus 2003).
Kuh was critical of the CLA for aggregating individual student scores upto the school level. Specifically, he said that when this is done, “The amount
Klein et al. / The Collegiate Learning Assessment 15
of error in student scores compounds and introduces additional error into theresults, which makes meaningful interpretation difficult” (Kuh 2006, 9).Actually, measurement theory would predict just the opposite (see Brennan1995); namely, that scores would become much more rather than less reliablewhen results are aggregated to the school level. If so, this increase in relia-bility would lead to higher correlations among measures (provided there isreasonable variability in scores among campuses).15
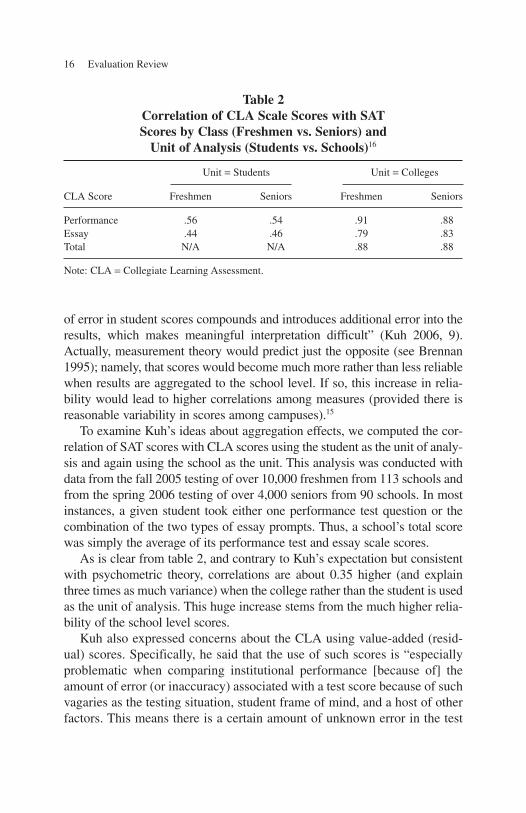
To examine Kuh’s ideas about aggregation effects, we computed the cor-relation of SAT scores with CLA scores using the student as the unit of analy-sis and again using the school as the unit. This analysis was conducted withdata from the fall 2005 testing of over 10,000 freshmen from 113 schools andfrom the spring 2006 testing of over 4,000 seniors from 90 schools. In mostinstances, a given student took either one performance test question or thecombination of the two types of essay prompts. Thus, a school’s total scorewas simply the average of its performance test and essay scale scores.
As is clear from table 2, and contrary to Kuh’s expectation but consistentwith psychometric theory, correlations are about 0.35 higher (and explainthree times as much variance) when the college rather than the student is usedas the unit of analysis. This huge increase stems from the much higher relia-bility of the school level scores.
Kuh also expressed concerns about the CLA using value-added (resid-ual) scores. Specifically, he said that the use of such scores is “especiallyproblematic when comparing institutional performance [because of] theamount of error (or inaccuracy) associated with a test score because of suchvagaries as the testing situation, student frame of mind, and a host of otherfactors. This means there is a certain amount of unknown error in the test
16 Evaluation Review
Table 2Correlation of CLA Scale Scores with SAT Scores by Class (Freshmen vs. Seniors) and
Unit of Analysis (Students vs. Schools)16
Unit = Students Unit = Colleges
CLA Score Freshmen Seniors Freshmen Seniors
Performance .56 .54 .91 .88Essay .44 .46 .79 .83Total N/A N/A .88 .88
Note: CLA = Collegiate Learning Assessment.
result because a student’s “true” score may vary from one day to the next.”(Kuh 2006, 9). He goes on to say that:
These are not merely hypothetical musings. NSSE experimented with its ver-sion of value-added to calculate predicted institution-level scores. After athorough review . . . we no longer provide this information because it can bepotentially misleading when used to distinguish institutions.” (Kuh 2006, 9)
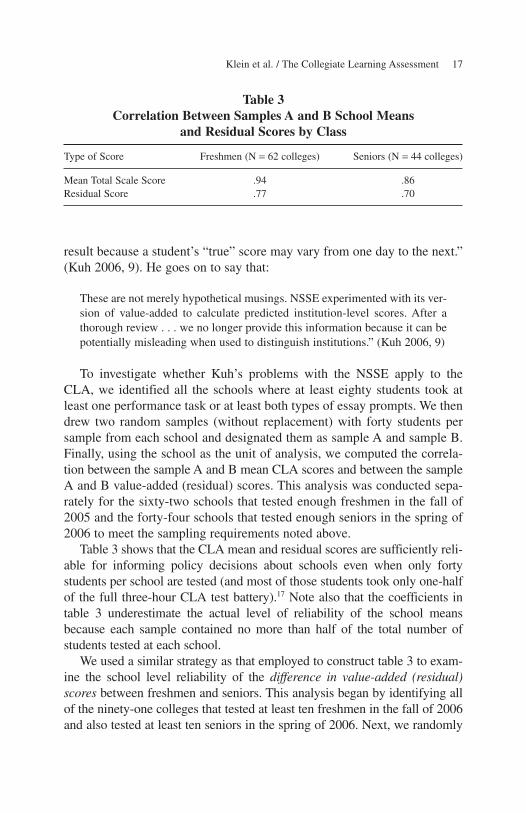
To investigate whether Kuh’s problems with the NSSE apply to theCLA, we identified all the schools where at least eighty students took atleast one performance task or at least both types of essay prompts. We thendrew two random samples (without replacement) with forty students persample from each school and designated them as sample A and sample B.Finally, using the school as the unit of analysis, we computed the correla-tion between the sample A and B mean CLA scores and between the sampleA and B value-added (residual) scores. This analysis was conducted sepa-rately for the sixty-two schools that tested enough freshmen in the fall of2005 and the forty-four schools that tested enough seniors in the spring of2006 to meet the sampling requirements noted above.
Table 3 shows that the CLA mean and residual scores are sufficiently reli-able for informing policy decisions about schools even when only fortystudents per school are tested (and most of those students took only one-halfof the full three-hour CLA test battery).17 Note also that the coefficients intable 3 underestimate the actual level of reliability of the school meansbecause each sample contained no more than half of the total number ofstudents tested at each school.
We used a similar strategy as that employed to construct table 3 to exam-ine the school level reliability of the difference in value-added (residual)scores between freshmen and seniors. This analysis began by identifying allof the ninety-one colleges that tested at least ten freshmen in the fall of 2006and also tested at least ten seniors in the spring of 2006. Next, we randomly
Klein et al. / The Collegiate Learning Assessment 17
Table 3Correlation Between Samples A and B School Means
and Residual Scores by Class
Type of Score Freshmen (N = 62 colleges) Seniors (N = 44 colleges)
Mean Total Scale Score .94 .86Residual Score .77 .70
assigned half the freshmen at a college to sample A and the other half to sam-ple B. We then randomly assigned half the seniors to sample A and the otherhalf to sample B. Finally, we computed the difference in school mean value-added (residual) scores between classes within each sample. For example, ifthe mean value-added score for freshmen in a college’s sample A was 0.20standard errors below expected and the mean for the seniors in sample A atthis school was 0.15 standard errors above expected, then the net differencebetween these two classes in sample A was 0.35 standard errors. We thenmade the corresponding calculations for sample B.
The correlation between the two sets of residualized difference scoresacross the ninety-one schools was 0.63, which is quite high given the smallnumber of students in each sample at each school (i.e., as few as five studentsper sample per class within a college) and theoretical concerns about the unre-liability of difference scores and especially residualized difference scores.
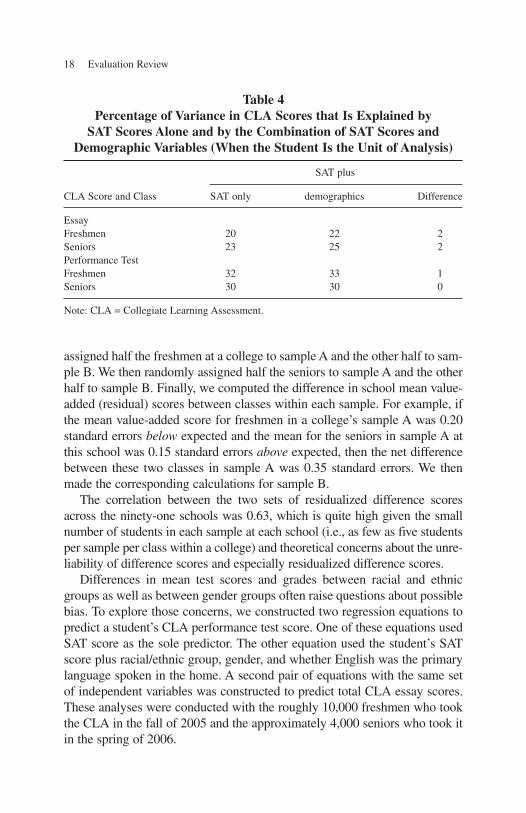
Differences in mean test scores and grades between racial and ethnicgroups as well as between gender groups often raise questions about possiblebias. To explore those concerns, we constructed two regression equations topredict a student’s CLA performance test score. One of these equations usedSAT score as the sole predictor. The other equation used the student’s SATscore plus racial/ethnic group, gender, and whether English was the primarylanguage spoken in the home. A second pair of equations with the same setof independent variables was constructed to predict total CLA essay scores.These analyses were conducted with the roughly 10,000 freshmen who tookthe CLA in the fall of 2005 and the approximately 4,000 seniors who took itin the spring of 2006.
18 Evaluation Review
Table 4Percentage of Variance in CLA Scores that Is Explained by
SAT Scores Alone and by the Combination of SAT Scores andDemographic Variables (When the Student Is the Unit of Analysis)
SAT plus
CLA Score and Class SAT only demographics Difference
EssayFreshmen 20 22 2Seniors 23 25 2Performance TestFreshmen 32 33 1Seniors 30 30 0
Note: CLA = Collegiate Learning Assessment.
Table 4 shows that including student demographic characteristics in theregression model had little or no effect on predictive accuracy for either classor with either type of CLA test score. This finding supports the thesis thatthe CLA’s measures do not favor one group over another.
Summary and Conclusions
The Spellings’ Commission reaffirmed the importance of learningassessment for both campus improvement and accountability purposes. Indoing so, it highlighted the CLA as an exemplary measure of learning;and, that publicity has rightfully placed this assessment program under themicroscope. Initial reports from this inspection have made claims, somebased on fact and others on fantasy. Consequently, in this article weattempted to point out: (a) what the CLA does and does not measure,(b) how dependably it measures what it claims to measure, and (c) how itcan be distinguished from other direct (e.g., MAPP) and indirect (e.g.,NSSE) measures of student learning.
The CLA program views its current assessment as but one (albeit a veryimportant and essential) measure in an overall system of higher educationindicators. Other measures, such as performance in an academic discipline,in social, moral, and personal situations along with policy relevant measuresof student access, instruction and graduation should be incorporated in atruly comprehensive indicator system.
The CLA’s importance lies in its focus on the broad abilities that collegesand universities almost universally claim to instill in their students: criticalthinking, analytic reasoning, problem solving, and communication skills. Itsnovelty lies in the fact that it samples holistically “real-world” tasks thateducators, students, and the public consider important outcomes of collegeeducation. In addition, and in contrast to other direct measures of studentlearning, the CLA relies entirely on open-ended measures and it does notbreak a complex task into constituent competencies so as to report separateability scores. This is because the CLA believes that to do so would removethe assessment from reality and that the sum of the parts of such an assess-ment does not capture the complexity of the whole. Consequently, the CLAis an entirely constructed response assessment on realistic performance andwritten tasks. The advent of new technologies, including internet adminis-tration and scoring, as well as availability of natural language processingsoftware for scoring, make this assessment cost and time feasible where inthe past such assessments were not.
Klein et al. / The Collegiate Learning Assessment 19
The CLA and other assessment programs along with the colleges and uni-versities where they are used, all face the challenge of obtaining student coop-eration in taking the measures which in turn means that the sample of studentsparticipating may not be truly representative. The CLA addresses this problemby taking a value-added approach; i.e., it adjusts college-performancescores for differences in the entry-level abilities of the students who doparticipate (as indicated by their SAT scores). This approach assumes that therelationship between CLA and SAT scores in the sample of students tested ata school is generally representative of the relationship between these vari-ables among all the students at that school. The analysis also assumes that thesample of schools participating in the CLA program is generally representa-tive of a national sample of schools. There is empirical evidence to indicatethat both of these conditions are being met (CLA 2006). While this approachis not optimal and selectivity is always a concern, it is pragmatic, practical,and the value of such information, we believe, outweighs the alternative of making no adjustment for input or relying on indirect measures of ques-tionable validity.
The caveats discussed above establish the limits of certainty in educationalassessment. In the real world of educational assessment, the question becomeshow to develop approaches that maximize the likelihood of identifying policyrelevant relationships and patterns among variables so as to provide educatorswith information that is useful for improving teaching and pedagogy. Suchapproaches can only be judged as credible if they show how they deal with theimplications of these caveats in terms of the methods of assessment used, theunit of analysis chosen, what analyses are conducted, and how the results ofthose analyses are interpreted and used. The approaches must also providepractical protocols that assist the educational community for whom theapproaches are developed to address concerns about possible sample andselection bias, misunderstandings, and misstatements of the results. Finally, itis important to make explicit all aspects of one’s approach so as to invite sug-gestions for improvements based on the distinction between the methodolog-ical constraints involved in all educational assessment from specific strategies,some of which are better than others.
The CLA signals a campus as to how it is performing relative to bench-mark campuses. Other information, such as campus assessments and IPEDSdata, along with this signal are needed for campuses to identify possible chal-lenges that should be addressed. A number of campuses also are using theCLA to assess the effects of reforms they have made or new programs theyhave introduced to see if such “experiments” worked.
20 Evaluation Review
Issues have been raised about the technical characteristics of the CLA.Some have claimed that having computers score writing tasks is inappropri-ate or that CLA scores are unreliable. However, these claims are contra-dicted by the empirical data reported here and elsewhere. The reliability ofrater and machine scoring is roughly the same; the reliability of mean col-lege CLA scores and residual scores is quite adequate (above 0.80 in the former and 0.70 in the latter). Finally, the reliability of the difference inmean residual scores between classes within a school is adequate for the pur-poses for which this metric used.
In summary, the CLA appears to reliably measure certain important learn-ing outcomes of undergraduate education. Its approach differs from otherdirect measures of learning in that holistic, open-ended real-world tasks aresampled on the assessment and students construct their responses in a man-ner similar to what might occur in real life situations. This approach differsfrom other direct measures of learning, such as those that use selected-response (multiple-choice) tests that break down complex tasks into sets ofsubtasks and then sum them up in an attempt to capture the whole. Life doesnot come packaged as a multiple-choice question; we do not believe thewhole is simply the sum of the parts. Moreover, the CLA and other directmeasures of learning are quite distinct from indirect measures, such as theNSSE, in that they do not rely on students’ self-report of experiences or per-formance but instead, directly measure what a student is able to do when con-fronted with a meaningful cognitive task. And contrary to rhetoric, both directand indirect measures of student learning can be affected by which studentsdo and do not choose to participate in the assessment, but only direct assess-ments have a viable statistical means for addressing this concern. Finally, thestatistical characteristics of the CLA’s measures meet or exceed generallyaccepted technical quality standards. This said, there is always room forresearch and improvement of any assessment system, and the CLA is pursu-ing that R&D agenda.
Notes
1. We speak of general education with some hesitation because typically educators and thepublic think this refers to the first two years of college. However, we refer to the general edu-cation provided throughout the undergraduate experience.
2. CAE researchers are working with many institutions using the CLA, grouped withinconsortia to identify and implement the best practices that produce better CLA results. Theseinclude the Council of Independent Colleges, the University of Texas system, the HigherEducation Commission of West Virginia, public research universities, and the Lumina longi-tudinal group.
Klein et al. / The Collegiate Learning Assessment 21
3. Results from a recent pilot indicate that the correlation between hand and machineassigned total scores on a performance task (r = 0.86) is comparable to the correlation betweenthe scores assigned by two hand readers. The two scoring methods also had comparable meansand standard deviations.
4. All the hand scoring is done anonymously. Readers do not have any information aboutthe characteristics of the students whose answers they grade. Handwriting is not an issuebecause all students key enter their answers.
5. Students who took the ACT rather than the SAT have their ACT scores converted to theSAT’s scale of measurement. This is done using the standard cross-walk between these twoexams that most colleges use in their admissions process. The analyses conducted by the CLAprogram and those presented in this article do not distinguish between actual SAT scores andthose converted from ACT scores.
6. Students who participate in the CLA program more than once, such as freshmen andlater as seniors, are automatically assigned to different tasks between administrations. Theprogram currently uses eight different performance tasks and several of each type of essayprompt.
7. When the school is the unit of analysis, the SAT by itself accounts for about 70 percentof the variance in performance test scores. The SAT plus self-reported effort accounts foranother 3 percent to 7 percent, depending on the sample (e.g., freshmen vs. seniors). Self-reports of effort may, of course, be influenced by the students’ sense of how well they did onthe task, such as by saying they did not try hard if they felt they did not do well. An argumentalso could be made that the CLA is a measure of typical rather than maximum performance(Cronbach 1990). If so, then student motivation can be viewed as an outcome in that someschools may be more successful than others in instilling in their students the attitude that theyshould take pride in their work and always try to do their best.
8. This is the opposite of the philosophy underlying the national No Child Left Behind(NCLB) program at the elementary and secondary level where the focus is on the percentageof a school’s students who achieve a certain level of proficiency (i.e., regardless of how muchimprovement they made).
9. Indeed, the entering students at some schools are so able that they out perform the grad-uates at other institutions. However, by using a value-added approach to assessment, schoolswith relatively less able entering classes can show as much improvement in student learning asinstitutions with the most able entering classes. Moreover, even at the colleges with the highestscoring students, student scores are well below the maximum possible score. In other words,ceiling effects are not a concern because there is plenty of room for growth for everyone.
10. A review of approaches to estimating value-added is beyond the scope of this article.For a thorough discussion of various methods for estimating value-added, see the special issueof the Journal of Educational and Behavioral Statistics (2004, vol. 29, No. 1).
11. The CLA program followed the SAT’s policy of capping individual student scores at1600; i.e., we capped the highest performance and essay scale scores at 1600. This policyraised concerns about possible artificial ceiling effects on the CLA. Our analysis of this matterfound that less than 1 percent of the freshmen and less than 3 percent of the seniors hit the cap.Thus, there was no sign of a significant ceiling effect. We also found that only a few schoolsimproved their classification (such as moving from “at expected” to “above expected”) whenwe removed the cap even though we did not change the regression equations or standard errorsthat were used to compute a college’s classification. Nevertheless, the cap will be removedfrom future score calculations to avoid any concerns about this matter.
22 Evaluation Review
12. The College Results Online does not include every four-year Title-IV eligible highereducation institution in the United States. It only contains institutions that meet all of the fol-lowing criteria: (1) They fall in the public or private not-for-profit sector. This excludes for-profit four-year institutions like the University of Phoenix. (2) They reported Graduate RateSurvey (GRS) data for the 2004 cohort. (3) They were assigned a selectivity rating in Barron’sProfiles of American Colleges 2005 Edition. These restrictions limit the universe of four-yearinstitutions being analyzed to approximately 1,400 institutions. Accordingly, the results of sta-tistical analyses and descriptions of this universe of institutions may vary from the results ofcorresponding descriptions of all four-year institutions. However, because the institutions cov-ered in that universe enrolled 96 percent of all students in the total four-year non-profit bach-elor’s degree seeking GRS cohort, such variance is likely to be small.
13. These findings are based on regression models that were run with the 103 schools thattested freshmen in the fall of 2005 and the 91 schools that tested seniors in the spring of 2006where each school had IPEDs data and at least twenty-five students at each test administra-tion. The results with these models indicate that the SAT alone explained 74 percent of thevariance in CLA scores for freshmen whereas the combination of SAT and IPEDs variablesexplained 75 percent; i.e., an increase of only 1 percent. The corresponding percentages forseniors were 76 percent and 78 percent. Moreover, the correlation between the expected val-ues from each model was 0.98 for freshmen and 0.97 for seniors. In short, including the IPEDsvariables in the model had little or no effect on expected or value-added scores. This findingindicates that nothing would be gained by reporting CLA results separately by school type.
14. The CLA program is currently conducting an empirical study of the effects of matura-tion on scores.
15. There is plenty of variation in school level CLA and SAT scores, with school levelmean scores ranging from 900 to 1400.
16. The high college-level correlations in table 3 are sometimes misinterpreted to mean thatthe CLA is just another SAT. If we have the SAT, the reasoning goes, why do we need the CLA?However high correlations do not imply two tests are measuring the same thing—i.e., the samethinking or reasoning, or “cognitive processing.” Consider the following. If we were going toteach to the CLA, our CLA preparation course would look a lot different from that used byPrinceton Review to train students to take the SAT. That is, if college instructors trainedstudents to work through CLA tasks, they would be teaching the kind of critical thinking, ana-lytic reasoning, and communication skills their colleges’ mission statements say they are teach-ing. Or put another way, even if the CLA correlates highly with the SAT, we would not take astudent’s SAT score as a proxy for his or her grade or performance in, say, an American historycourse—the SAT doesn’t say anything about the student’s history knowledge and reasoning justas the SAT doesn’t say anything about a student’s reasoning on the CLA.
17. The CLA program recommends that schools test 100 students per class with the fullbattery, but recognizes that many schools cannot meet this target.
References
AAC&U. 2005. Liberal education outcomes. Washington, DC: Association of American Collegesand Universities.
AASCU. 2006. Value-added Assessment. Perspectives. Washington, DC: American Associationof State Colleges and Universities.
Klein et al. / The Collegiate Learning Assessment 23
Banta, T. W., and G. R. Pike. 2007. Revisiting the blind alley of value-added. Assessment Update19 (1):
Braun, H. J. 2005. Using student progress to evaluate teachers: A primer on value-added models.New Jersey: Educational Testing Service.
Brennan, R. L. 1995. The conventional wisdom about group mean scores. Journal of EducationalMeasurement 32 (4): 385–396.
CLA. 2006. Available at: www.cae.org/cla.Carroll, J. B. 1993. Human cognitive abilities: A survey of factor-analytic studies. New York:
Cambridge University Press.Cronbach, L. J. 1990. Essential of psychological and educational testing. 5th edition. New York:
Harper Collins.Dwyer, C. A., C. M. Millett, and D. G. Payne. 2006. A culture of evidence: Postsecondary
assessment and learning outcomes. Princeton, NJ: Educational Testing Service.Erwin, D., and K. W. Sebrell. 2003. Assessment of critical thinking: ETS’s tasks in critical
thinking. The Journal of General Education 52 (1): 50–70.Ewell, P. T. 1994. A policy guide for assessment: Making good use of the Tasks in Critical
Thinking. Princeton, NJ: Educational Testing Service.Klein, S., G. Kuh, M. Chun, L. Hamilton, and R. Shavelson. 2005. An approach to measuring
cognitive outcomes across higher-education institutions. Research in Higher Education 46 (3): 251–276.
Klein, S., and R. Bolus. 1982. An analysis of the relationship between clinical skills and barexamination results. Report prepared for the Committee of Bar Examiners of the State Barof California and the National Conference of Bar Examiners.
———. 2003. Factors affecting score reliability on high stakes essay exams. Paper presentedat the meetings of the American Educational Research Association, Chicago, Illinois.
Klein, S. 1983. Relationship of bar examinations to performance tests of lawyering skills.Paper presented to the American Educational Research Association, Montreal, April.(Reprinted in Professional Education Researcher Notes, 1982, 4: 10–11).
———. (Forthcoming). Characteristics of hand and machine-assigned scores to collegestudents’ answers to open-ended tasks. In Festschrift for David Freedman, edited by D. Nolan and T. Speed. Beachwood, OH: Institute for Mathematical Statistics.
Kuh, G. 2006. Director’s message in: Engaged learning: fostering success for all students.Bloomington, IN: National Survey of Student Engagement.
Landgraf, K. 2005. Cover letter accompanying the distribution of Braun (2005) report.Martinez, M. E. 2000. Education as the cultivation of intelligence. Mahwah, NJ: Erlbaum.McClelland, D. C. 1973. Testing for competence rather than for “intelligence.” American
Psychologist 28 (1): 1–14.Powers, D., J. Burstein, M. Chodorow, M. Fowles, and K. Kukich. 2000. Comparing the valid-
ity of automated and human essay scoring (GRE No. 98–08a, ETS RR-00–10). Princeton,NJ: Educational Testing Service.
————. (2001). Stumping e-rater: Challenging the validity of automated scoring. (GRE No.98–08Pb, ETS RR-01–03). Princeton, NJ: Educational Testing Service.
Raudenbush, S. W. 2004. What are value-added models estimating and what does this implyfor statistical practice. Journal of Educational and Behavioral Statistics 29:121–129.
Shavelson, R. J. 2007a. Assessing student learning responsibly: From history to an audaciousproposal. Change.
———. (2007b). Student learning assessment: From history to an audacious proposal. AAC&U.
24 Evaluation Review
U. S. Department of Education. 2006. A test of leadership: Charting the future of U.S. highereducation. Washington, DC.
Wainer, H. 2004. Added-value assessment special issue. Journal of Educational andBehavioral Statistics 29.
Stephen P. Klein is Director of Research and Development for the Collegiate LearningAssessment. His over 250 publications include research on health, criminal justice, and educa-tional issues. He consults for licensing boards in law, dentistry, teaching, and other professions.
Richard J. Shavelson is Margaret Jack Professor of Education, Professor of Psychology (cour-tesy), and Senior Fellow-Woods Environment Institute. His publications include StatisticalReasoning for the Behavioral Sciences, Generalizability Theory, Scientific Research inEducation, and The Quest to Assess Learning and Hold Higher Education Accountable.
Roger Benjamin is president of the Council for Aid to Education. His publications include TheEnvironment of Higher Education and Recreating the Faculty Role in Governance, andAssessment Versus Accountability in Higher Education. He co-directs the Collegiate LearningAssessment initiative.
Roger Bolus is founder and senior partner of Research Solutions Group. He has conductedextensive applied research on factors impacting performance in large-scale testing programs.He also serves as principal psychometrician at CORE, an outcomes research laboratory at theUniversity of California, Los Angeles.
Klein et al. / The Collegiate Learning Assessment 25