the cost of politics in kenya
TRANSCRIPT

Karuti KanyingaTom Mboya
July 2021
The cost of politics in KenyaImplications for political participation and development
2
Acknowledgements and disclaimers
We are sincerely grateful to the donors of Westminster Foundation for Democracy (WFD) and Netherlands Institute for Multiparty Democracy (NIMD), namely, UK Foreign, Commonwealth and Development Office (FCDO) and the Netherlands Ministry of Foreign Affairs.
Many thanks to the South Consulting team that worked on the report: Osendo Omore, Project Advisor and Analyst; Elli Chanzu, Research Analyst; Elizabeth Wachamba, Project Administator. Thanks also go to Jamie Hitchen for his contributions to the methodology and final review and to Maureen Oduori, Elijah Ambasa, and Caroline Gaita for their inputs during the research process.
This study was prepared by Prof. Karuti Kanyinga and Tom Mboya on behalf of South Consulting Africa Limited. It was funded by WFD and NIMD. The views expressed in this paper are those of the authors, and not necessarily those of or endorsed by WFD, NIMD, their funders, nor the parliaments or independent institutions mentioned in the paper.
All rights in this work, including copyright, are co-owned by the Westminster Foundation for Democracy Limited (WFD) and the Netherlands Institute for Multiparty Democracy and are protected by applicable UK and international laws. This work is licensed under an Attribution Non-Commercial ShareAlike Creative Commons license. This license allows you to remix, adapt, and build upon this work non-commercially, provided that you credit WFD and NIMD and license your new creations under the identical terms. Any permissions outside the scope of this license should be requested from WFD and NIMD.
For more information about Westminster Foundation for Democracy and Netherlands Institute for Multiparty Democracy’s work, visit:
www.wfd.org and follow @WFD_Democracy
www.nimd.org and follow @WeAreNIMD

3
Table of contents
1.0 Executive summary .......................................................................................... iii
2.0 Introduction ....................................................................................................... 1
2.1 Electoral politics in Kenya ............................................................................. 2
2.2 Kenya’s Representative system .................................................................... 4
2.3 Money and politics in Kenya ......................................................................... 5
2.4 The approach ................................................................................................ 7
2.5 Limitations and challenges .......................................................................... 11
3.0 Key findings .................................................................................................... 13
3.1 Overall costs ............................................................................................... 13
3.2 Party Primaries ............................................................................................ 20
3.3 Election campaigns ..................................................................................... 26
3.4 Costs of holding political office .................................................................... 31
3.5 Raising and Spending Funds ...................................................................... 36
4.0 Future costs .................................................................................................... 41
5.0 Drivers of the cost of politics ........................................................................... 44
6.0 Impacts of the rising cost of politics ................................................................ 48
7.0 Conclusions .................................................................................................... 50
8.0 Key recommendations .................................................................................... 51
9.0 About the authors ........................................................................................... 53
Endnotes .................................................................................................................. 54

ii
List of Tables
Table 1: Number of persons elected per political position. ......................................... 4
Table 2: Ethno-regional voting blocs .......................................................................... 8
Table 4: The total costs for winners vs losers: ......................................................... 15
Table 5: Female candidates elected per political position (2017) ............................. 18
Table 6: Average costs of running for elective posts by region ................................ 19
Table 7: monthly and 5-year salaries for the four elective positions ......................... 32
Table 8: Regional Analysis of current/predicted expenditure ................................... 42
Table 9: Estimated costs per elective position (2022) .............................................. 43
List of Figures
Figure 1: GDP and Agriculture growth rates ............................................................... 3
Figure 3: General election cost – all candidates ....................................................... 14
Figure 4: Party primary – woman Representative costs by ethno-political region .... 22
Figure 5: Party primary – MP costs by ethno-political region ................................... 24
Figure 6: Party primary – National Assembly (MP) costs by gender ........................ 25
Figure 7: Party primary – MCA costs by gender ....................................................... 26
Figure 8: General election – Senate costs by ethno-political region ......................... 28
Figure 9: General election – Senate costs by political party ..................................... 28
Figure 10: Women Rep. Party primaries and election costs ..................................... 30
Figure 11: shows the total average expenditure for each post disaggregated by party, and gender ..................................................................................................... 33
Figure 12: Monthly costs in office - MP .................................................................... 35
Figure 13: Sources of financing ................................................................................ 36
Figure 14: Areas of expenditure – party primaries ................................................... 37
Figure 15: Areas of expenditure – general elections ................................................ 38
Figure 16: Areas of expenditure – in office ............................................................... 39
Figure 17: MCA expenditure items ........................................................................... 40
Figure 18: Estimated costs of running for a seat in 2022 ......................................... 41
Figure 19: Perceptions of MP and MCA roles .......................................................... 46
iii
1.0 Executive summary This study of the cost of politics in Kenya analyses the expenditure of individuals who contested for political office at Senate, National Assembly and County Assembly level in Kenya in 2017. Drawing on data from a survey of 300 aspirants as well as focus group discussions and key informant interviews with prominent political participants and experts, this study uncovers the costs for aspirants at different stages of this process, from the party primary, through the general election and, for those who were successful, whilst in office. The Senate seat is the most expensive of all the posts to contest for. It cost an average of Kshs. 35.5 million (US$ 350,000) to contest for this seat in 2017. Contestants for the Woman Representative seats also spent significant sums, with the average expenditure reaching Kshs. 22.8 million (US$ 228,000). For those seeking to become members of parliament the average spend was Kshs. 18.2 million (US$ 182,000), while the Member of County Assembly seat was the least expensive at Kshs. 3.1 million (US$ 31,000). These costs are predominantly raised from individual’s personal savings or with the support of friends or family. Less than 20% of survey respondents received financial support directly from their political party. Our survey found that, on the whole, the more a candidate spends, the greater their chance of electoral victory. Woman Rep candidates who won their race spent almost three times as much as those who were unsuccessful. Victorious Senators spent more than double than those who lost. In the race for National Assembly seats successful candidates spent 50% more than those who did not win. In addition to significant expenditure, the support of a dominant party enhances a candidates chances significantly. However, this does not apply if you are a woman contesting an open seat. The data reveals that in most cases, women are spending as much or more than men, but they are not enjoying the same level of success for reasons best explained by prevailing patriarchal norms that impact on how they can campaign and how they are perceived by voters. But for those successfully elected the costs do not stop when in office. On average elected members of the National Assembly spend as much as Ksh780,000 (US$ 7,800) a month: primarily on development projects for constituents and donations to local interest groups. This is more than their basic monthly salary before allowances and benefits. A similar trend of monthly expenditure matching or being greater than basic salary income was reported across all four positions studied. There are several key drivers and enablers of these costs. First and foremost, running for office in Kenya takes place in the absence of the enforcement of the law and regulations on campaign financing. Second the benefits that come with being an elected official are sizeable and extend beyond the salaries and benefits. The position grants the individual the title of Mheshimiwa - Kiswahili for honourable - and can open doors into Kenya’s wider patronage structures. Some of those interviewed for this study were of the view that people do not run for office to serve the community; they run for office because when you win, you have many benefits and networks for easy self-enrichment. But voters also drive the cost of

iv
politics by demanding hand-outs from MPs. This stems from a limited understanding of the role of elected officials should play; one of oversight and policy formulation not of direct service provision. The implications of the huge outlay made by many aspirants for political office across Kenya are documented in this study. One is simply that the high cost of politics is excluding capable candidates without access to sizeable resources. Instead, many of those who are elected to office use their seat as a source of patronage in national level networks, which are heavily involved in corruption in the public sector. Elected officials rarely convene meetings to discuss legislative matters that the constituents would like presented in Parliament or through the County Assembly. In short, politics is increasingly transactional and campaigning never stops. As soon as candidates are elected, they start right away with efforts to reward voters and to ensure their continued ongoing support. A final implication of the importance attached to money in politics is that elected officials regularly fail to provide effective oversight of the use of resources by the Executive at the national and county level. This would be an exercise in futility, given that some intend to target access to those resources for personal or political gain. To tackle these issues and reduce the costs involved with seeking political office in Kenya the report provides a set of recommendations. They include the need to improve the transparency and quality of party primaries; the introduction of enforceable regulations for monitoring campaign finance expenditure as set out in the 2014 Campaign Finance Act that are complied with by all political parties; the need for greater support to be afforded to female candidates contesting for open seats and how that can be done; and the important role than continuous civic education can play in improving voters awareness of the roles of elected officials and the negative consequences of the increasing prominence of money in politics.

1
2.0 Introduction Recent studies on the cost of politics in Africa show that running for office is becoming increasingly expensive and that rising costs in competitive elections are a challenge to participatory electoral democracy.1 They result in only the rich and those with the resources running for office because they are the only ones who can finance the campaigns.2 A study on cost of politics in Ghana showed that since the return to multi-party democracy in 1992, elections have become increasingly expensive. Between 2012 and 2016, the cost of running for political office increased by 59%3 with a candidate spending about US$ 85,000 from party primaries to the parliamentary election. A 2020 study in Uganda had similar findings with candidates spending between US$ 43,000-143,000 in order to be elected to parliament in 20164. Although there is a law to regulate spending by politicians and political parties, there is weak enforcement of such measures, and the political process proceeds without hindrance. In Kenya, a background study on the cost of parliamentary politics highlighted a similar trend, characterised by a high cost for running in parliamentary elections. The study observed that the cost of managing elections in Kenya is one of the highest in the world at US$25 per voter5. Kenya’s parliamentarians are also some of the most highly paid in individuals in the society, and this on its own attracts numerous interests, creating intense competition to win an election. All the same, until now, there has been little systematic data on what it costs to run for different electoral seats and the implication of these costs for public participation and social economic development in general. This research seeks to delve further into the cost of politics in Kenya, focusing on four electoral posts during the 2017 election: The Senate; County Woman Member of the National Assembly (Woman Rep); the Member of the National Assembly (MP); and the Members of the County Assembly (MCAs) in Kenya’s devolved system of government.
BOX 1 – Electoral positions studied. Senator The role of the Senator is primarily to safeguard the interests of the Counties in legislation. The Senator also makes laws for the County Government and is responsible for protecting their interests. Oversight of national revenue allocated to the County Government and that of state offices also fall under the responsibility of the Senate.6 Woman Rep/MP Sitting in the National Assembly, both the MP and the Woman Rep are national legislators. They make laws and deliberate on issues of concern to their

2
constituents. The legislators also decide on the allocation of national revenue between the national and county levels of government, and conduct oversight over state organs, national revenue and its expenditure. MCA The Member of the County Assembly consults the electorate on issues before the County Assembly as well as presenting views and proposals of the electorate to the County Assembly. The MCA acts as a liaison between the County Assembly and the electorate on public service delivery7.
2.1 Electoral politics in Kenya Kenya remained a one-party state from the late 1960s to 1991 when a constitutional amendment lifted the bar on the registration of political parties and re-introduced multiparty democracy. In November 1991, the Constitution was repealed following popular demand for political reforms, allowing for the formation of political parties and the return of competitive multi-party politics. Several parties were formed and competed against the ruling party, Kenya African National Union (KANU). The return of multi-party politics had several consequences. Opposition political parties proliferated with some founded by former ruling party KANU members while others were formed by those who had opposed the former ruling party for many years. At the start, many of these parties focused their attention on broad reforms, but internal competition for leadership led to splits. From then on, interest in broader reforms dissipated. Ethnic interests fronted by ethno-regional elites came to the fore and began to drive party formation and electoral politics. The ruling party also manipulated rivalries within the newly established political parties to blunt their influence. Kenya held multiparty elections in 1992, 1997, 2002 and 2007 under this dispensation. Apart from 2002, all of them featured an element of localised ethnic clashes and violence. The worst such episode of election-related violence occurred in the aftermath of the disputed 2007 elections. Kenya’s elections also have a profound effect on the economy. Figure 1 shows the relationship between elections and economic growth. There are significant drops in the 1992, 1997, and 2002. There was also a major decline in economic growth in the period around the 2007 election which aroused widespread ethnic conflict that threatened to split Kenya. It is notable that this also affects growth in Kenya’s main employment sector, agriculture. Agricultural growth tends to decline during such periods which in turn impacts the broader economy because of sectoral interlinkages.

3
Figure 1: GDP and Agriculture growth rates A new constitution promulgated in August 2010 altered the electoral system and changed the electoral landscape. It provided for two levels of government at the national and county level. There are 47 county governments each headed by an elected governor, and oversighted by county assemblies. The Constitution also provides for a bicameral Parliament at the national level comprising the Senate and the National Assembly. The members of the Senate are elected from each of the 47 counties, while members of the National Assembly are elected from 290 single member constituencies. Woman Reps, who sit in the National Assembly, are elected from each of the 47 counties. The 2010 Constitution further required that for a presidential candidate to win election, they must obtain 50 per cent plus one vote. This is in addition to securing 25 per cent of votes from at least half of each of the 47 counties. The introduction of a devolved system of government, and the increase in the number of elected leaders, radically altered the organisation of politics.8 First, it is near impossible for a party organised solely along ethnic lines to meet the constitutional threshold to win a presidential election. Parties must form alliances in order to outcompete others. Second, significant resources are now devolved to county governments. The Constitution provides for at least 15 per cent of an equitable share of revenue collected nationally to be allocated to county governments. This has increased interests in local level contests, among them the posts of governor and MCA.9
4.43.9
3.4
-1.1
-3.7 -4.1
2.8
4.8
6.5
-3.4
8.8
6.7
-1.3
11.0
-3.2
2.6
1.7
7.0
4.6
2.5
-4.3
-2.7
6.3
1.5
4.2
2.9
4.5
6
5.1
1.8
6.6
5.24.9
4.6
1.5
-0.30.8
4.5
3.5
3.4
0.3
3.4
2.1
0.5
4.5
0.5
2.9
5.1
5.9
6.3
7.0
1.6
2.6
5.6
4.4
4.6 5.7
5.3
5.75.9
4.9
6.3
-10.0
-5.0
0.0
5.0
10.0
15.0
20.0
1988 1989 1990 1991 1992 1993 1994 1995 1996 1997 1998 1999 2000 2001 2002 2003 2004 2005 2006 2007 2008 2009 2010 2011 2012 2013 2014 2015 2016 2017 2018
GDP and Agriculture growth rate (%)1988 – 2019
Agr iculture(growth rate %) (GDP growth rate %)
4
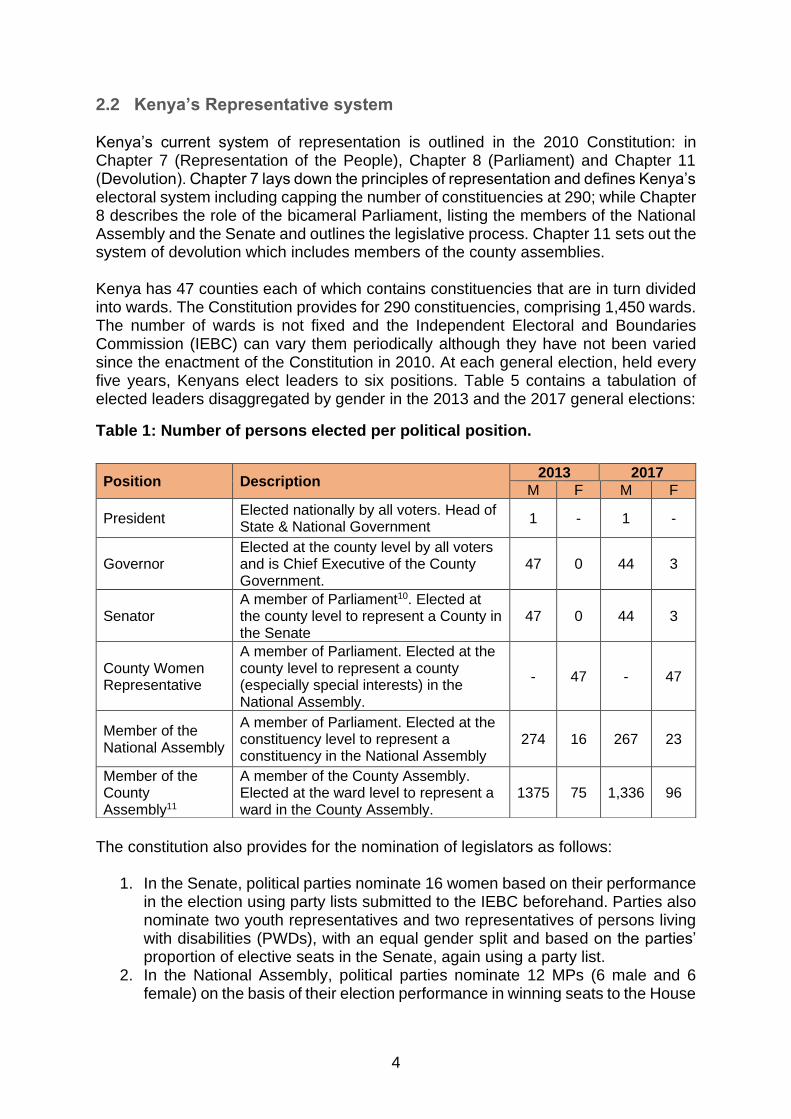
2.2 Kenya’s Representative system Kenya’s current system of representation is outlined in the 2010 Constitution: in Chapter 7 (Representation of the People), Chapter 8 (Parliament) and Chapter 11 (Devolution). Chapter 7 lays down the principles of representation and defines Kenya’s electoral system including capping the number of constituencies at 290; while Chapter 8 describes the role of the bicameral Parliament, listing the members of the National Assembly and the Senate and outlines the legislative process. Chapter 11 sets out the system of devolution which includes members of the county assemblies. Kenya has 47 counties each of which contains constituencies that are in turn divided into wards. The Constitution provides for 290 constituencies, comprising 1,450 wards. The number of wards is not fixed and the Independent Electoral and Boundaries Commission (IEBC) can vary them periodically although they have not been varied since the enactment of the Constitution in 2010. At each general election, held every five years, Kenyans elect leaders to six positions. Table 5 contains a tabulation of elected leaders disaggregated by gender in the 2013 and the 2017 general elections:
Table 1: Number of persons elected per political position.
The constitution also provides for the nomination of legislators as follows:
1. In the Senate, political parties nominate 16 women based on their performance in the election using party lists submitted to the IEBC beforehand. Parties also nominate two youth representatives and two representatives of persons living with disabilities (PWDs), with an equal gender split and based on the parties’ proportion of elective seats in the Senate, again using a party list.
2. In the National Assembly, political parties nominate 12 MPs (6 male and 6 female) on the basis of their election performance in winning seats to the House
Position Description 2013 2017
M F M F
President Elected nationally by all voters. Head of State & National Government
1 - 1 -
Governor Elected at the county level by all voters and is Chief Executive of the County Government.
47 0 44 3
Senator A member of Parliament10. Elected at the county level to represent a County in the Senate
47 0 44 3
County Women Representative
A member of Parliament. Elected at the county level to represent a county (especially special interests) in the National Assembly.
- 47 - 47
Member of the National Assembly
A member of Parliament. Elected at the constituency level to represent a constituency in the National Assembly
274 16 267 23
Member of the County Assembly11
A member of the County Assembly. Elected at the ward level to represent a ward in the County Assembly.
1375 75 1,336 96
5
using party lists submitted to the IEBC and taking into consideration youth, PWDs and workers.
3. In the county assemblies, the Constitution requires that at least one third of the members should be of the opposite gender. Where the number of elected women does not reach the required threshold, political parties nominate additional members on the basis of their performance in the election, using lists submitted beforehand to the IEBC.
2.3 Money and politics in Kenya There was increased political competition at all levels in the 2013 general election which was the first election following the promulgation of the 2010 Constitution. Candidates for the presidential election identified allies to contest elections as governors, senator, and woman representatives. These would also provide local level support. All the candidates embarked on high-octane and flashy political campaigns made possible by contributions from business elites, families and friends among others. The use of helicopters to move from one location to another quickly became the norm for the leading presidential candidates. Elections have become highly competitive because of the power, prestige and benefits attached to elected office. Furthermore, the country practices a winner-takes-all electoral system, in which those who win tend to exclude the losers completely. This has created a do-or-die environment around political competition. This has increased the costs of running for elective office and has consequences for political and social-economic development in Kenya. There have been attempts to reduce the cost of election campaigns. The enactment of the Election Campaign Financing Act 2013 and the Political Parties Act 2011 both sought to address these challenges. The Political Parties Fund, established by the Political Parties Act12, sets the threshold for political parties to receive funds. This includes obtaining at least 3% of the total votes in a general election and meeting the constitutional threshold of not more than two thirds of registered office bearers from one gender. There is also a requirement for representation of special interest groups in the party’s governing council and securing at least 20 elected members of the National Assembly, three elected Senators, three elected Governors and 40 elected MCAs. Following the 2017 elections, only the largest political formations, Jubilee and the Orange Democratic Movement (ODM), met this threshold. The Election Campaign Financing Act provides a framework for political candidates and parties to receive only regulated contributions, to form campaign finance committees, and to account for funds received. The IEBC drafted rules that covered the candidate selection process, donation and spending limits, bookkeeping and disclosure requirements and provision for enforcement of regulations13. But the Election Campaign Finance Act requires that campaign finance rules must be in place at least a year before the general election. In early 2017, the High Court suspended implementation of the law after the opposition political party ODM protested against it.14 Without effective enforcement, the cost of politics has continued to rise in Kenya.

6
Methodology To hold nationwide elections and sustain political campaigns, both key elements of any democracy, requires resources. Increasingly important, money may not guarantee electoral success, but it is rare that it comes to those with limited funds. How that money is raised and spent, as well as who receives it and how important but under-researched questions are. The “cost of politics” - the amount an individual politician spends to be chosen as the party’s candidate for an election, compete in that election and, for those whose are successfully elected, during his or her term in public office - is a research approach aimed at improving data about the amount of money in politics and an attempt to better understand who benefits from these resources, why and how. The “cost of politics” approach focuses on the spending of individuals contesting for political office rather than those of political parties. It is broad in its scope, aiming to cover expenditure incurred across the election cycle: following the money spent, from the candidates’ decision to stand for political office at the party primary phase, to the end of an individual's elected tenure - a period of several years. The “cost of politics” approach looks at the amount spent in comparison with national economic parameters, such as salaries of elected officials, to assess affordability. The approach attempts to better understand what factors drive individual choices when it comes to spending funds on politics. A key component of this is understanding the demands placed on, internal calculations of, and accountability pressures facing, prospective and existing parliamentarians. These demands and pressures can be influenced by both formal institutions and regulations as well as informal institutions, cultures and norms and are a crucial part of the “cost of politics” more holistic approach to the question of how increasing resources impact on, and shape, political and democratic processes15. This study, focusing on Kenya’s 2017 elections, seeks to answer the following questions:
a. What are the key social, economic and political drivers of the cost of politics at the parliamentary and county assembly levels?
b. What are the costs of politics incurred at both parliamentary and county assembly levels during the electoral cycle?
c. How do the cost of politics at parliamentary and county assembly levels impact on the participation of marginalised and special interest groups (youth, women and persons living with disabilities) in electoral politics?
d. How do the cost of politics at parliamentary and county assembly levels impact on the socio-economic development of the country?
e. What are the legal, policy and programming options likely to reduce or regulate the cost of politics in Kenya?

7
2.4 The approach The study used a mixed methods approach to collect data. The study was carried out during the challenges of COVID-19 pandemic and therefore the quantitative survey was conducted through computer aided telephonic interviews and, where possible, face to face interviews. The qualitative data was collected through Focus Group Discussions (FDGs) as well as interviews with select group of key informants from across the country.
Kenya’s electoral system and attendant voting patterns informed the sampling method for data collection. Kenya’s ‘first past the post’ electoral system involves voting for candidates in six electoral posts on the same day. Over the years, political parties have tended to form and mobilise along ethno-regional lines. Voting patterns follow this divide. Furthermore, regions populated by numerically large ethnic groups tend to feature dominant parties; these are political parties which are the de-facto preference of residents of a particular political region. Political elites representing these groups form alliances to improve their chances in the competition for political power. Several regional voting blocs are prevalent in the country. Therefore, the first stage in sampling was the county selection for the study based on 11 ethno-regional voting blocs that were representative of the voting patterns in the 2017 elections. The 11 voting blocs are grouped at a regional level and illustrated in Table 2.

8
Table 2: Ethno-regional voting blocs
Regional
blocs Proposed counties
Ethno-regional
voting blocs
Region 1 Nairobi Nairobi
Region 2 Kakamega, Busia, Bungoma, and Vihiga Western Kenya
Region 3 Turkana, West Pokot, Samburu, Baringo Northern Rift
Region 4 Trans Nzoia, Uasin Gishu, Elgeyo Marakwet,
Nandi, and Laikipia Central rift
Region 5 Kiambu, Nyeri, Murang’a, Kirinyaga, and
Nyandarua Central Kenya
Region 6 Garissa, Wajir, Mandera and Marsabit Northern Kenya
Region 7 Mombasa, Kwale, Kilifi, Lamu, Tana River
and Taita Taveta Coast
Region 8 Bomet, Kericho, Nakuru, Kajiado and Narok Southern Rift
Region 9 Kisumu, Homa Bay, Migori, Kisii, Nyamira
and Siaya Greater Nyanza
Region 10 Makueni, Machakos and Kitui South Eastern
Region 11 Meru, Tharaka Nithi, Embu and Isiolo Central Eastern
The second sampling stage involved purposive selection of the counties from the regional blocs. In all, the study covers counties dominated by a single political alliance; and where the process was highly competitive. The survey was spread across 32 counties, 58 constituencies and 51 wards. The following sample distribution was achieved: Nairobi (8%,) Western Kenya (16%), Northern rift (5%), Central rift (6%), Central Kenya (6%), Central Kenya (17%), Northern Kenya (6%), Coast (12%), Southern rift (9%), Greater Nyanza (12%), South Eastern (3%) and Central Eastern (6%).

9
The survey used a political cycle approach in order to cover all aspects of expenditure by those running for office. The experiences of those who had vied for different political posts at the party primary level and in the 2017 general election were captured through questionnaires administered individually and through FGDs. The analysis examined the expenditure costs of those currently in office – and therefore the costs of maintaining an office. The respondent identification and selection were based on participation in the 2017 general election and party primaries results. The target respondents were:
• The winners in the 2017 election,
• The runners up,
• The third best candidate for the positions of the Senator, MP, the Woman Rep to the National Assembly, and the Member for the County Assembly.
In circumstances where the first or second target was not available for the survey the immediate next participants in the general election was selected. This approach resulted in 48 respondents who contested only the primary process, 81 respondents who participated in the elections only and another 171 who participated in both elections and party primaries (See Table 3).

10
The data collection took place from 30 November 2020 to 11 March 2021. A team of 30 interviewers spread across the counties conducted the interviews. Prior to the start of the data collection process, two reference group sessions were conducted. The sessions included seasoned politicians who reviewed and provided input into the design of the research tools. Additionally, two pilot interviews were conducted during the reference group meeting to confirm the questionnaire duration and test the logic of the data collection questionnaire. Table 3: Respondent category sampled
Respondent category and race participation Achieved sample
General election participants only 81
• Member of County Assembly (MCA) 35
• National assembly member (MP) 30
• Senate 8
• Women representative 8
Party primaries and General Elections participants 171
• Member of County Assembly (MCA) 72
• National assembly member (MP) 58
• Senate 16
• Women representative 25
Party primaries participants only 48
• Member of County Assembly (MCA) 23
• National Assembly member (MP) 12
• Senator 6
• Women representative 7
Grand Total 300
Qualitative data was obtained from FGDs and key informant interviews (KIIs) in the counties. The key informants were identified from the party primary lists and those who contested in the 2017 elections. The respondent identification and selection targeted the following individuals at the constituency or ward level:
• Those who contested in the primaries but lost.
• Those who won primaries but lost in the general election (if not interviewed
under the survey sample)
• First time contestants who were unsuccessful.
• Previously unsuccessful candidates in several elections
11
The survey targeted 36 key informants at the constituency level and 44 key informants at the ward level. However, in total just 25 in depth interviews were achieved (9 with members of national assembly, 11 members of county assembly and 5 elections experts). The number of interviews fell short of the target because of low response rates. Most of the legislators were not willing to have a face-to-face meeting due to the COVID-19 pandemic and the telephonic or online in-depth interviews took more than 30 minutes thus ending up in refusals or incomplete interviews. Legislators in some regions such as Mt. Elgon had network challenges and thus attempts to contact them were not successful. A total of six FGDs with four to eight persons were conducted. One in Kakamega targeting members of the National Assembly and one each in Machakos, Meru, Murang’a and Nairobi with MCAs and one in Uasin Gishu which contained a mixed group of members of the National Assembly, Woman Reps and MCAs. These comprised those who contested in the primaries but lost, those who won primaries but lost in the general election, first time contestants and aspiring candidates. The FGDs were conducted through web-based platforms such as Zoom or Google hangouts. Interviewers at the regional level were tasked to recruit the target groups, guide them on the use of Zoom and Google hangouts platforms and schedule the FGDs. The following quality control measures were used:
▪ Silent recording of the interviews in which the quality control team would listen in and verify if the interviews were done and answers match what was keyed in.
▪ Verification of general election participants from the IEBC list to ensure the correct respondents were sampled.
▪ Conducting call backs to randomly selected respondents to confirm their participation and thank them for their time.
▪ Data logic checks on responses keyed in that are way below or above the average in the quest to verify the respondents’ response.
▪ Recording the qualitative interviews with the intention of transcribing them once they are done.
2.5 Limitations and challenges The survey encountered various challenges during execution:
1) Refusal to participate in the survey by some legislators, especially women. The data collection team were forced to make replacements especially with sitting MPs who were either too busy or not willing to disclose their ‘confidential’ information. Women legislators were the most unresponsive, with many not honouring scheduled appointments. Most of them were fearful of being investigated by competitors or consequences that might follow with disclosure of their ‘political secrets’.
2) Major difficulties were experienced in conducting online interviews. Some respondents would drop off from the conversations before they had completed

12
the interview, thus disrupting the FGDs. Others reported experiencing difficulty in using online platforms to join the conversations. This despite respondents being provided with guidance on accessing the meetings through the Google hangouts or Zoom platforms, given their limited proficiency, and being reminded to join the meetings at least 20 minutes before the projected start time.
3) Due to the social status of the target group, securing appointments for an interview was difficult, thus resulting in a number of team members dropping off from the survey team. The project manager and supervisors trained an additional team so as to proceed with the data collection exercise.
4) National events disrupted most politicians’ schedules. Interviewers attempted to engage the politicians over weekends when they were more likely to be available, book appointments and send reminders to the target respondents.
13
3.0 Key findings This research sheds light on the actual expenditure candidates incur in running for elective office. Three major themes warrant highlighting and form the focus of this section.
1) Spending: The more a candidate spends the greater their chances of winning There is little doubt that the cost of participating in elective politics is on the rise. The findings from interviews demonstrates that even with the very best of intentions, under current conditions, it is unlikely that one can seriously compete for elections without a significant financial war-chest. 2) Party matters: Running on a ‘dominant party’ in a region where a party is dominant improves chances of success. Money is not everything, however. There are numerous examples of well-resourced candidates spending lavishly only to lose elections. Alongside a big war-chest, belonging to the party that enjoys dominance in a region increases chances of winning an election. 3) Gender: Despite spending more than men, women are not winning as often. Findings from the sample in this study reveals that in most cases, women are spending more than men, but they are not enjoying much success as a result. The data demonstrate the prevalence and extent of a gender gap in the continuum of election spending, performance and results.
3.1 Overall costs Respondents were asked to provide an estimate of their expenditure in both party primaries and the 2017 election campaign period. The survey findings show that it costs candidates more to run for Senate for than any other seat. It cost Kshs. 35.5 million (US$ 350,000) on average to run for Senate seat; and Kshs. 22.8 million (US$ 228,000) to contest for the county Woman Rep seat in the National Assembly. Running for the constituency MP seat, on the other hand, costs just Kshs. 18.2 million (US$182,000); Kshs 4.6 million less than what it costs to contest the Woman Rep seat, with the same benefits, in the same house. Running to be a MCA cost, on average, Kshs. 3.1 million (US$ 31,000).

14
Figure 2: Total expenditure by party and gender There are marked differences between costs associated with party primaries and the general election. Candidates spent more on party primaries or nominations to win tickets for the Senate and Woman Rep races than they did on the general election. This is because securing the ticket of a dominant party enables a candidate to ride on the popularity of the party/party leader during the general election campaign.
Figure 3: General election cost – all candidates
GENERAL ELECTION COST - ALL CANDIDATES (SUMMARY FOR 4 POSTS)
19.2
16.3
13.6
9.28.3
9.9
1.4 1.7
Party primaries cost Elections cost
Party primaries and elections cost summary for all candidates in millions of KES
Senate Women Representative Members of the national assembly Members of the county assembly
n=300 …Q15 Thinking about the party primaries, approximately how much money did you spend in the party primaries/nominations?
Q21 Thinking about the 2017 main election campaign period, approximately how much money did you spend?
TOTAL EXPENDITURE FOR ALL 4 POSTS -SUMMARY
35.5
40
33.4 33.535.7
22.8
35.4
17
22.8
18.2 17.7
22.8 23.6
17
3.1 2.43.7
6.4
2.9
Total Jubilee NASA Female Male
Total expenditure of all candidates in millions of KES
Senate Women Representatives Members of national assembly Member of county assembly
n=300 …Q15 Thinking about the party primaries, approximately how much money did you spend in the party primaries/nominations?
Q21 Thinking about the 2017 main election campaign period, approximately how much money did you spend?

15
Regardless of the seat in question, the more you spend, the greater the chances of winning. Candidates who won a Senate seat, for example, spent an average of Kshs. 49 million (US$490,000). Those who lost in the contest of Senate seat spent an average of Kshs. 20.3 million (US$203,000). Whilst money was important, the choice of political party also matters. Spending alone may not achieve the desired result. The combination of spending AND the right choice of party - usually a dominant party in a particular region - offered the winning combination.
Table 4: The total costs for winners vs losers:
Seat
Winner’s cost Loser’s cost
(Kshs
millions)
$
(Kshs millions)
$
Senate 49 490,000 20.3 203,000
Woman Reps 32.2 322,000 13.4 134,000
MPs 21.2 212,000 14.9 149,000
MCA 4.2 42,000 2.3 23,000
Although the Senate and Woman Rep have similar mandates in representing the same constituencies of voters - an entire county - the costs for candidates seeking election differ significantly. The primary reason for varied costs of politics is attributable to the more competitive nature of the Senate post. It attracts some of the most experienced politicians in the country and in particular political elites who have served as constituency MPs in the past. One aspiring Senator spent Ksh. 100 million (USD 1 million) across the primary process and campaign period in 2017. On the other hand, the Woman Rep post is generally perceived as a seat without the same level of political clout and influence owing to public attitudes on the mainstreaming of gender in politics. As such, it has less contestation among the electorate even though political parties consider it strategic when sizing up their parliamentary strength. The cost of election for both Senators and Woman Reps is higher than for MPs in the National Assembly because of the geographical size of their constituencies. Senators and Woman Reps are elected in a county which has several National Assembly constituencies, each represented by an MP. The county is geographically much more expansive, and therefore costs more in terms of logistics of running an election campaign than a single member National Assembly constituency. Wards, represented by MCAs are a smaller unit than a constituency; several wards make up one constituency. Wards have much more local focus, and may not carry the same prestige as national level positions. That is not to say that the role of an MCA is insignificant. On the contrary, the MCAs tend to live and work in the wards they represent, giving them much closer engagement with the electorate on a day-to-day basis but this means they are less influential at a national level.

16
3.1.1 By party Jubilee, the ruling party, was the most expensive political ticket to seek elections on, for Senate and the Woman Rep seats in 2017. The fact that Jubilee resulted from a merger of several parties including the president’s party The National Alliance (TNA) and the Deputy President’s party United Republican Party (URP) raised the stakes in their respective strongholds, given the significant interest numerous candidates from both camps expressed in obtaining the single party ticket. The Jubilee party Senate primary in Nandi County attracted 15 candidates, while in Uasin Gishu County the Woman Rep race attracted 13 candidates16. An illustration of the importance of obtaining a dominant party ticket in some regions. One respondent noted that;
“Some people opt for big parties even though there may be some cost element … parties like Jubilee or ODM, you have to go there when you have a big budget. I believe and I feel that the amount that we have paid to register (to be allowed to vie in that particular party), it is so much. I think it should be reduced somehow to allow even those people who don’t have enough money or so much money, so they can also be allowed to vie for that particular seat especially during the party nominations.”17
On average, it cost more to contest election on a Jubilee ticket than a NASA one: an average of Kshs. 40 million (US$ 400,000) to run for the Senate seat, and Kshs. 35.4 million (US$ 354,000) to contest for the Woman Rep seat. NASA Woman Rep candidates spent less than half (Kshs. 17 million or US$ 170,000) the amount their Jubilee counterparts spent. Those running for Senate on NASA allied political parties spent about Kshs.7 million (US$. 70,000) less than their competitors in Jubilee. However, NASA candidates for MP and the MCA spent slightly more than their Jubilee counterparts. That NASA was a coalition, unlike Jubilee which dissolved constituent parties to form one party, meant it still fielded candidates from several constituent parties in the same race, that were in competition with each other. As the MP and MCA races were hotly contested, this likely served to drive up the costs at this juncture. Another factor that increased the average costs for Jubilee candidates was the repeat of primary processes in the party’s strongholds in Central Kenya. The party concluded the nomination of candidates through primaries in almost half of 47 counties, but it was forced to cancel the exercise for all seats due to a severe lack of polling materials in some areas18. This necessitated a repeat of the exercise in 21 counties at a time when the candidates had already outlaid a lot of financial and other resources in mobilising political support and other preparatory arrangements. In other instances, the party gave the ticket to some candidates without any competitive primaries. This happened despite the fact that their competitors had already spent money in anticipation of a contest. 3.1.2 By gender Overall, women outspent men in all elective posts except the Senate (see Figure 3). They spent an average of Kshs. 23.6 million (US$ 236,000) running for National Assembly seats while their male counterparts spent Kshs. 17 million (US$ 170,000). Women candidates spent more than double the amount male candidates put up for

17
MCA seats, spending an average of Kshs. 6.4 million (US$ 64,000) compared to Kshs. 2.9 million (US$ 29,000). Despite this, from a total of roughly 1,800 aspirants, for the National Assembly single member constituency seats, for example, only 131 women candidates made it to the ballot. Furthermore, only 18% of the women who contested were elected. At the County Assembly level, that figure was just 10.8% of the 900 female candidates who came from a total pool of 11,848 aspirants. Socio-cultural factors prevent women from winning seats consistently outspending more than men. Traditionally, community leadership has been the preserve of men. Long-held cultural practices and beliefs are difficult to change, and often only do so over a considerable period of time. As one respondent noted;
“When it comes to politics it’s a big challenge to women…some people still think in patriarchal ways, in discrimination (against women) …some people still think that the women’s place is still in the kitchen”19
It is, perhaps because women are aware that the political deck is stacked against them that they, make greater efforts to outspend their male counterparts. Furthermore, and again because of socio-cultural norms, women do not always campaign in the same way that men do. Women often engage in more direct forms of campaigning, using small focus groups, door-to-door and face-to-face meetings. These smaller events can be cumbersome, labour-intensive and more costly. Many of these engagements will require a candidate to support a women’s group or project, which comes at further expense. Efforts to engage in largescale rallies, which tend to be dominated by men, come not only with personal security implications but are also challenged by traditional gender roles. The community will immediately raise questions about a female candidate’s morals if she is to hold a rally that is attended by a primarily male audience. In short, they subject women candidates to standards that men are not subjected to. The patriarchal nature of the society leads to women having to account more for their quest to leadership than is the case with men. The reality is that this comes with increased costs. Furthermore, some communities are yet to accept the idea of women in leadership, let alone the possibility of them competing for and winning an elective positions. Despite the Constitution contemplating that the Woman Rep role would be to represent special interests (especially women) in the National Assembly, the position has had significant, unintended consequences. A 2015 study by the Netherlands Institute for Multiparty Democracy (NIMD)20 notes that the existence of the Woman Reps seats in the National Assembly has fed a perception that other elected seats are reserved for men. This has created obstacles for women seeking to contest elective constituency seats. Some of their male competitors exploit this perception to argue that women have their reserved seats and should therefore, not contest other parliamentary seats. Finally, in the Kenyan context, “big man” politics remains pervasive. The electorate tend to seek candidates with the ‘ability’ to resolve the many pressing challenges they face. This ‘ability’ is most often pegged on deep pockets, or in other cases, proximity to the centre of power in the political elite. Proximity to the political leadership demonstrates the ability to leverage opportunities for patronage. The electorate thus needs to be convinced that one has the financial resources to regularly part with hand-outs, or at the very least, leverage opportunities for personal and, by extension,

18
community benefit. In a campaign, this is most often demonstrated not only by cash hand-outs, but also by driving expensive cars, the size of a motorcade, and in recent years, using helicopters on the campaign. Women have to work harder than their male counterparts to break down these barriers, and to prove that they are every bit as ‘capable’ as the men.
Table 5: Female candidates elected per political position (2017)
Position No. of Female Candidates
No. of Female Candidates Elected
% Female elected
Senate 20 3 15%
Women Rep (NA) 298 47 -
National Assembly
131 23 18%
MCA 900 98 11% Computed using data by the Independent Electoral & Boundaries Commission (IEBC), ‘Data Report of 2017 Elections’. Available at https://www.iebc.or.ke/uploads/resources/siEABKREDq.pdf
3.1.3 By region Politics costs more in some regions of Kenya than in others. For example, it costs more in Western Kenya and Nyanza to run for Senate than it costs in the former Coast Province and in Southern Rift. In the old Western Province, candidates spent an average of Kshs. 45.8 million (US$ 458,000) for the Senate election. In Nyanza, it cost Kshs. 43.3 million (US$ 433,000). These figures are double the amount spent by candidates in the Coast region where candidates for Senate forked out an average of Kshs. 20 million (US$ 200,000) while those in South Rift spent Kshs. 27.8 million (US$ 278,000) on average. It costs more on average to run for Woman Rep in the capital than elsewhere in the country. The average cost in Nairobi was Kshs. 45 million (US$ 450,000). This is four times higher than the average cost for candidates seeking the same seat in Coast who spent Kshs. 10.5 million (US$105,000); and those in Central Eastern spent an average of Kshs. 17 million (US$ 170,000). Costs for contesting the constituency seat in the National Assembly are the lowest in the Central Eastern part of Kenya and Nyanza. Candidates in Central Eastern spent Kshs. 7.4 million (US$ 74,000) while those in Nyanza spent Kshs. 13.2 million (US$ 132,000). South eastern region, Western region and Southern Rift had the highest costs: about Kshs. 21 million (US$ 210,000). MCAs in Central Rift, Central Kenya, and Southern Rift spent the least on seeking election, compared to the rest of the country. It cost between Kshs. 1.6 million (US$ 16,000) and Kshs. 1.8 million (US$ 18,000) on average to contest an MCA seat. It is,

19
however, most expensive to run for MCA in Western and Nyanza regions where the average cost is over Kshs. 4 million (US$ 40,000). Political competition in the stronghold of a dominant party can be fierce. This, in part, explains why politics costs more in some regions than others. A candidate in a dominant party would be willing to go to great lengths to secure a place on the ballot, in the hope that the influence of the party leader and the party will thereafter be enough to deliver electoral victory. At the same time, poverty levels vary across the country, thus, the costs of politics in impoverished regions are less expensive than others.
Table 6: Average costs of running for elective posts by region
Post
Senator
(Kshs in
millions)
Senato
r ($)
Woman
Rep (Kshs
in millions)
Woman
Rep ($)
MPs
(Kshs in
millions)
MPs ($)
MCA
(Kshs in
millions)
MCA ($)
Nairobi 45
450,000 16.7
167,000 2.6
26,000
Western Kenya
45.8
458,00
0 23.9
239,000 21.2
212,000 4.1
41,000
Greater Nyanza
43.3
433,00
0 22.3
223,000 13.2
132,000 4.6
46,000
Central eastern
40
400,00
0 17
170,000 14.8
148,000 2.6
26,000
Central Kenya
36.8
368,00
0 35.9
359,000 7.4
74,000 1.8
18,000
Central rift
32.7
327,00
0 18.4
184,000 17.3
173,000 1.6
16,000
Southern rift
27.8
278,00
0 17.4
174,000 20.8
208,000 1.8
18,000
Coast
20
200,00
0 10.5
105,000 16.9
169,000
-
Southern
eastern 30
300,000 21.5
215,000 4
40,000
Northern
Kenya 27.5
275,000
- 2.2
22,000
Northern rift 18.3
183,000 2.9
29,000
Logistics and transport costs, the expansive nature of some constituencies and counties, and population density in a unit also combine to impact on the cost of running for elective office. Urban and rural divisions also matter. Even though the design of the survey did not anticipate this dimension, some of those interviewed identified the urban-rural divide as a distinct feature of electoral politics. Gifts to voters in urban
20
areas plus the costs of campaign logistics makes them more expensive contests than those in rural areas. Gifts to voters varied considerably across the country. There are some regions of the country where voters will not accept a Kshs. 50 handout (US$ 50 cents) and instead demand not less than Kshs. 500 (US$ 5) to attend a meeting according to individuals interviewed for this study. In other regions, Kshs. 50 (US$ 50 cents) is accepted on the understanding that many candidates would come round and give a similar amount, or even more. In Nairobi, when an MP from Northern Kenya meets with one of his constituents, he must part with Kshs. 1,000 (US$ 10) in transport money whilst an MP from the former Central Province may only have to part with Kshs. 500 (US$ 5)21.
“….in Kenyan politics people ‘come with their stomachs’ … most people around will tell you that giving out money is part and parcel of the cost of business. …. people stand on their side and assume that because you’ve gone into politics, then you have the money. So, you must give them money.”22
There are regions where the age of candidates matters in terms of costs. Some of the respondents in several parts of Rift Valley pointed out that a majority of candidates at party primary level were youth. Though they spent less than other candidates they were able to go froward because of party priorities. Respondents in several parts of Rift Valley noted that Jubilee party leadership in the region, who were allied to the Deputy President in 2017, were keen to field younger candidates and mobilised youthful candidates to stand for elections. The leadership wanted to demonstrate a clear break with the past when old and senior politicians dominated political contests.23 However, on the whole youthful candidates (18-34 years) did not have great success in 2017. Out of 3,428 who contested less than 10% were elected24.
3.2 Party Primaries Party primaries have traditionally been hotly contested affairs in Kenya. Indeed, these processes can be more important, more competitive, and thus more expensive than the general election. This is a result of the prevailing political culture; whereby a ticket from a dominant party could proffer a distinct advantage by dint of ethno-regional support. Within the context of the 2017 election, this was true of dominant parties such as Jubilee in Central Kenya and Rift Valley region, and ODM in Nyanza and parts of Western and the Coastal regions.
“…you find that all of the aspiring candidates have to align themselves with the strong party in the area... you really campaign in the party primaries as if you are campaigning for the final election. A win for the party ticket is generally a win for the National Assembly seats. So, in that case, you need the manifesto as early as you can in the primaries…you show your agenda to them, and it comes with a budget.”25
3.2.1 Senate Those who were successful in their primary contests spent Kshs. 25.5 million (US$ 255,000), while those who lost spent Kshs. 11.5 million (US$ 115,000) on average. This suggests a direct correlation between the amount of money spent and the
21
chances of success. All the same, some of the respondents interviewed pointed out that while money matters, it is not the only factor shaping electoral success; the party for which the candidate is vying is equally important26. Some other key considerations include region, urban versus rural location, and whether the party is in government or the opposition. This latter criterion is significant because being in government provides greater opportunities to benefit from campaign resources acquired for the purpose of aiding campaign activities. Through patronage and blatant corruption, public funds often find their way into campaign war-chests. Both the Goldenberg and the Anglo-Leasing scandals, for example, were engineered to misappropriate public funds for the purpose of financing elections in the 1990s and the 2007 general elections respectively27. The survey data also suggests that money cannot easily overcome attitudes towards gender. Women spent considerably more than men during the 2017 Senate party primaries. They forked out Kshs. 25 million (US$ 250,000), outspending their male counterparts who spent an average of Kshs. 18.6 million (US$ 186,000). Yet only three of the 20 female candidates who ran for Senate were elected, demonstrating that the increased investment is yet to bear commensurate dividends.28 The number of elected women may appear low in relative terms, but it is still an improvement on past performance. For example, no women were elected to the Sente in 2013. From a political party perspective, Jubilee’s Senate candidates spent more than those of other parties at Kshs. 21 million (US$ 210,000). Independent candidates spent almost a similar amount, Kshs. 20.5 million (US$ 205,000). It is instructive that a good number of independent candidates began the race within the political party primaries. They then changed their minds when it became apparent, they were not the front-runners in the primaries, or felt that they were likely to be rigged out or denied the ticket through other means. Capitalising on a loophole in the law that allowed them to leave their parties and register to run as ‘independent’ candidates. NASA candidates, in comparison, spent the least at Kshs. 14.8 million (US$ 148,000).
BOX 2: Independent Candidates The Constitution of Kenya 2010 requires that an independent candidate is one who “…is not a member of a registered political party and has not been a member for at least three months immediately before the date of the election”.29 In practice, many independent candidates begin as party candidates and at some point before or around party nominations, when it becomes clear they are unlikely to win or be given the party ticket, they resign from their respective parties in order to ensure they will be on the ballot without falling foul of the legal requirements. Though it is difficult to fully gauge the extent of this phenomenon, as some candidates may never have been officially recorded as candidates (were party members but fell to the wayside early in the nomination process), while others were recorded as candidates and subsequently resigned, our survey data suggests as many as 80% of independent candidates first, unsuccessfully, sought party backing before going it alone. Given the fact that they have already invested heavily in the primaries, many candidates do what they can to keep their electoral hopes alive. It
22
is also instructive to note that almost one-third of all candidates in the 2017 elections were independents. If not adequately sealed, this loophole around independent candidacy will continue to cause a significant challenge for political parties and their candidates. With or without the benefit of a dominant party ticket, it may become necessary for one to invest heavily in both the primaries and the general election phase, and there is the likelihood of facing a strong candidate they already faced, and defeated, in the primaries. Furthermore, it will do little to promote genuine independent candidacy. Rather, it will further entrench independent candidacy as an alternative route to the ballot in the event of an unsatisfactory party primary.
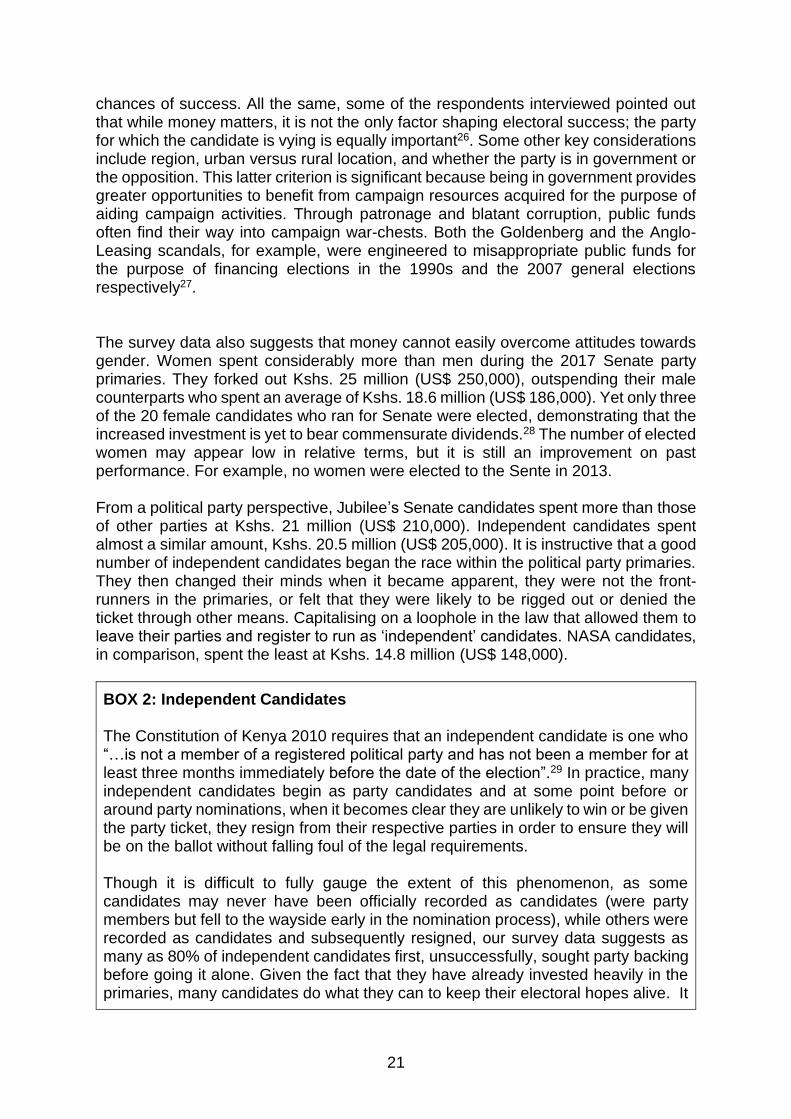
3.2.2 Women’s Representative
Figure 4: Party primary – woman Representative costs by ethno-political region Candidates for Woman Rep seats in the major urban centres such as the capital city, Nairobi, spent three times more on party primaries than the average during primaries. In Nairobi, Woman Rep aspirants spent an average of Kshs. 40 million (US$ 400,000), while candidates in Central Kenya spent Kshs. 24 million (US$ 240,000). Candidate spending in all other regions was at an average of Kshs. 15 million (US$ 150,000) or less – with candidates in Coast spending the least at Kshs. 10.5 million (US$ 105,000). In the case of Nairobi, the population density translates to an increase in demands for any candidate. Being an urban area as well as the capital city, and the fact that one must traverse the entire county - 17 constituencies as opposed to an average of five constituencies per county in other areas - further compounds this. Overall successful
PARTY PRIMARY - WOMEN REP COSTS BY ETHNO-POLITICAL REGION
13.60
40
24
1513.3 12.2 11.8 11.3
108
4.6
Total Nairobi Central Kenya
Northern Kenya
Greater Nyanza
Western Kenya
Central rift Southern Rift
South Eastern
Central Eastern
Coast
Women rep costs in millions of KES
n=32 …Q15 Thinking about the party primaries, approximately how much money did you spend in the party primaries/nominations?

23
Woman Rep aspirants spent on average Kshs. 20.2 million (US$ 202,000), significantly more than those who lost who spent Kshs. 6.1 million (US$ 61,000). Jubilee candidates spent the highest amount of money in the party primaries. They spent an average of Kshs. 22.1 million (US$ 221,000), while independent candidates and those with NASA tickets spent slightly less than half that amount, Kshs. 9.2 million (US$ 92,000) and Kshs. 9.1 million (US$ 91,000) respectively. This can, in part, be attributed to the fact that repeat primary elections were called for in several Jubilee races. In terms of demography, older candidates for the post of Women Rep spent more than younger ones. Those aged between 45 and 54 years spent Kshs. 16.2 million (US$ 162,000) while those in to the 35-44 age group spent less at Kshs. 15.4 million (US$ 154,000). Women under 35 years did not have the ability to compete financially with their older competitors. Indeed, in some of the FGDs, respondents observed that they went into politics to expand their opportunities, and create networks for future use as individuals and/or for their constituencies even if not necessarily with the expectation of winning. 4.2.3 National Assembly Member The survey data about the cost of contesting for the National Assembly seat shows a correlation between spending and chances of success. While it might not be accurate to draw the conclusion that spending alone was the key driver of primary success, it is clear that levels of spending are a major contributor to the outcome. Winners in the party primaries, for example, spent Kshs. 10.4 million (US$ 104,000) while those who lost spent significantly less at Kshs. 5.9 million (US$ 59,000). However, this is not true if you are a woman. Female candidates spent more than males in the party primaries by Kshs. 4.6 million (US$ 46,000) -Kshs. 12.1 million (US$ 121,000) to Kshs. 7.5 million (US$ 75,000) - but struggled to obtain the same level of success. Only 23 women were elected in the 2017 National Assembly, as compared to 267 men30. Findings such as this raise questions about long-held assumptions that one of the reasons women are under-represented in elected office is the lack of financial resources. These findings show that financial resources alone might not be sufficient to address the gender gap in representation in the National Assembly. Pervasive historical and socio-cultural challenges are still pervasive in society, and prevent women from winning more elective seats, despite their best fundraising efforts. In the political regions, the survey found that candidates in the strongholds of the two major political alliances – Jubilee and NASA – were among the highest spenders in the party primaries and spent comparable amounts. Topping the list were candidates from the Jubilee-aligned regions of Southern Rift and Central Rift who spent Kshs. 12.2 million (US$ 122,000) and Kshs. 9 million (US$ 90,000) respectively. Following closely behind was Central Kenya where candidates spent Kshs. 8.5 million (US$ 85,000). Candidates in the NASA-affiliated regions of Greater Nyanza spent Kshs. 7.5 million (US$ 75,000), while Western Kenya spent Kshs. 7.2 million (US$ 72,000).

24
Figure 5: Party primary – MP costs by ethno-political region For the post of constituency MP younger candidates seem to have spent more during the party primaries. Those in the 35-44 age bracket spent the highest at Kshs. 9.3 million (US$ 93,000) while those in the 45-54 age bracket expended Kshs. 8.7 million (US$ 87,000). Candidates in the older age brackets, of 55-64 years spent Kshs. 6.8 million (US$ 68,000) while those aged 65-74 spent Kshs. 7.3 million (US$ 73,000). However, in this survey, no candidates under the age of 34 were recorded as having participated in the party primaries. This suggests that at a strategic level, this segment of young people chose not to compete in the primaries of dominant parties, likely due to cost, and chose either smaller parties without competitive primaries, or where they were able to obtain a direct nomination, or choose to run as independents candidates.
PARTY PRIMARY - MP COSTS BY ETHNO-POLITICAL REGION
8.30
12.2
10.610
98.5
7.5 7.2
5.2
3
0.5
Total Southern Rift
Nairobi South Eastern
Central rift Central Kenya
Greater Nyanza
Western Kenya
Coast Northern Rift Central Eastern
MP costs in millions of KES
n=69 …Q15 Thinking about the party primaries, approximately how much money did you spend in the party primaries/nominations?
25
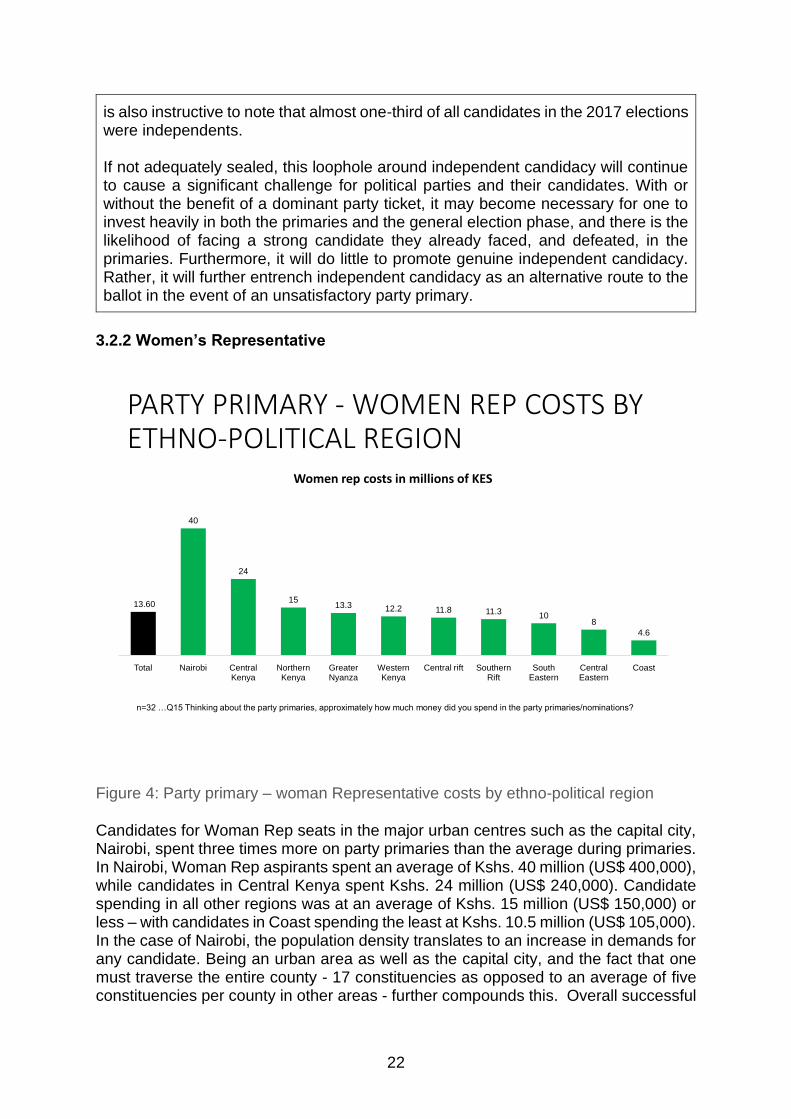
Figure 6: Party primary – National Assembly (MP) costs by gender 3.2.4 Member of County Assembly During the party primaries, women candidates for MCA once again outspent their male counterparts without correlating success. In fact, they spent almost double their male counterpart’s expenditure of Kshs. 1.3 million (US$ 13,000). But an analysis of the amount winners spent versus what losers expended demonstrates the impact of financial resources on politics if you are a male candidate. Poll winners spent an average of Kshs. 2.1 million (US$ 21,000) more than double the amount spent by those who lost, Kshs. 0.8 million (US$ 8,000). It appears that money, more so than the party, ideology and ability to deliver, has taken a central role in influencing MCA election outcomes. Women remain outliers though, as spending does not appear to have significantly improved their chances of winning. This raises the question of whether it would be possible to attract candidates who are driven by passion to serve, ideology, and policy positions, if they do not have sufficient resources. Candidates across parties spent similar amounts, with Jubilee spending Kshs. 1.4 million (US$ 14,000) while NASA spent Kshs. 1.3 million (US$ 13,000). Anecdotal evidence suggests that at the MCA level, given the proximity of office holders to their day-to-day realities, the electorate are more interested in selecting people whom they feel had a strong affinity to the community and are likely to deliver public goods, while setting aside party affiliations. As an illustration of this during 2017 elections, 109 independent candidates were elected31 as MCAs, the third largest grouping behind Jubilee and ODM.
PARTY PRIMARY – NATIONAL ASSEMBLY (MP) COSTS BY GENDER
8.30
12.1
7.5
Total Female Male
MP costs in millions of KES
Total Female Male
n=69 …Q15 Thinking about the party primaries, approximately how much money did you spend in the party primaries/nominations?

26
Figure 7: Party primary – MCA costs by gender
3.3 Election campaigns The actual campaign, managed by the national election management body, is a completely different animal, it brings with it a whole new set of priorities and challenges. For those within a dominant party set-up, the sense of relief at having clinched the all-important party ticket is only a brief reprieve from the bruising battle to the ballot. However, they do hold significant advantages. These can include accessing party financing during the campaign, support from the party machinery, and perhaps most important of all, the support of the party leader. The party leader’s support, often a veritable deity to the party rank and file, goes a long way in a region where the party is dominant, and in particular the home areas of the party leader. Party leaders rarely support any candidate during the primaries because of the need to maintain unity within the party. However, during the election campaigns, party leaders openly support the selected candidate. This support is worth its weight in gold to the aspirant. It can even reduce the financial burden on candidates, because many voters are usually convinced that if their candidate is close to the party leader, that there is an explicit endorsement and that they will benefit if the party forms the government. Candidates in smaller political parties have the advantage of less financially demanding and strenuous primaries, if and when such nominations are conducted. This advantage creates savings for their election campaigns. These candidates are, however, unlikely to enjoy significant financial or material support from their own parties, as may be the case with the candidates from the main or dominant political
PARTY PRIMARY - MCA COSTS BY GENDER
1.40
2.5
1.3
Total Female Male
MCA costs in millions of KES
Total Female Male
n=95 …Q15 Thinking about the party primaries, approximately how much money did you spend in the party primaries/nominations?

27
outfits. Independent candidates also have an advantage of not expending enormous financial resources at the time other candidates are competing in party primaries. But this advantage only exists if candidates are independent all along, not if they morph into “independent candidates” following a less than satisfactory primary campaign. 3.3.1 Senate races Expenditure analysis of winners versus losers shows that successful Senate candidates spent significantly more during the campaign phase, at Kshs. 23.5 million (US$ 235,000) compared to the Kshs. 8.8 million (US$ 88,000) spent by those who lost. Two major political formations’ candidates spent the most, with Jubilee forking out Kshs. 19 million (US$ 190,000) and NASA close behind at Kshs. 18.6 million (US$ 186,000). The strength of independent candidates continued to manifest itself in the Senate campaigns, as in this case they trailed only marginally behind NASA candidates, spending Kshs. 16.6 million (US$ 166,000). This high level of expenditure from non-party affiliated candidates suggests that individual candidates bear the greatest share of the burden of funding their campaigns. Unlike the party primaries contest where women Senate candidates outspent men, male candidates spent more than twice the amount spent by their female counterparts, during the election campaigns: Kshs. 17.1 million (US$ 171,000) as opposed to Kshs. 8.5 million (US$ 85,000). This is a remarkable and complete reversal in spending. In this instance, men appear to have reserved the bulk of their spending for the campaigns as opposed to the primaries. The Senate field consists of numerous seasoned politicians, most of whom are well experienced in political campaigns. They understand the context, they help fund their parties, and have the ability to influence party nominations, or ensure direct nominations, because of their close relationship with the party leaders. These factors can help explain this turnaround. Data on spending by region also highlights some interesting results in that core constituencies of the two major rival political formations were not the biggest spenders during the elections campaigns. In Nyanza, a key NASA constituency, Kshs. 22 million (US$ 220,000) was spent on average in contesting for the Senate while in the Central region, a key Jubilee constituencies, spending stood at Kshs. 15 million (US$ 150,000). Ranked firmly in the median on the spending scale South Rift and North Rift, also Jubilee strongholds, recorded the least spending at Kshs. 9.8 (US$ 98,000) and Kshs. 4.5 million (US$ 45,000) respectively. NASA-allied Western region led spending during the election campaigns at Kshs. 25.5 million (US$ 255,000), with North Eastern following closely at Kshs. 25 million (US$ 250,000). The geography of the North Eastern region comprising vast counties, poor road infrastructure, and difficult terrain, can explain why one would have to spend a significant amount of resources to traverse these counties on the campaign trail. Inter and intra clan dynamics and rivalries over leadership are unique to this part of the country, and also increase financial outlays for the candidates.32
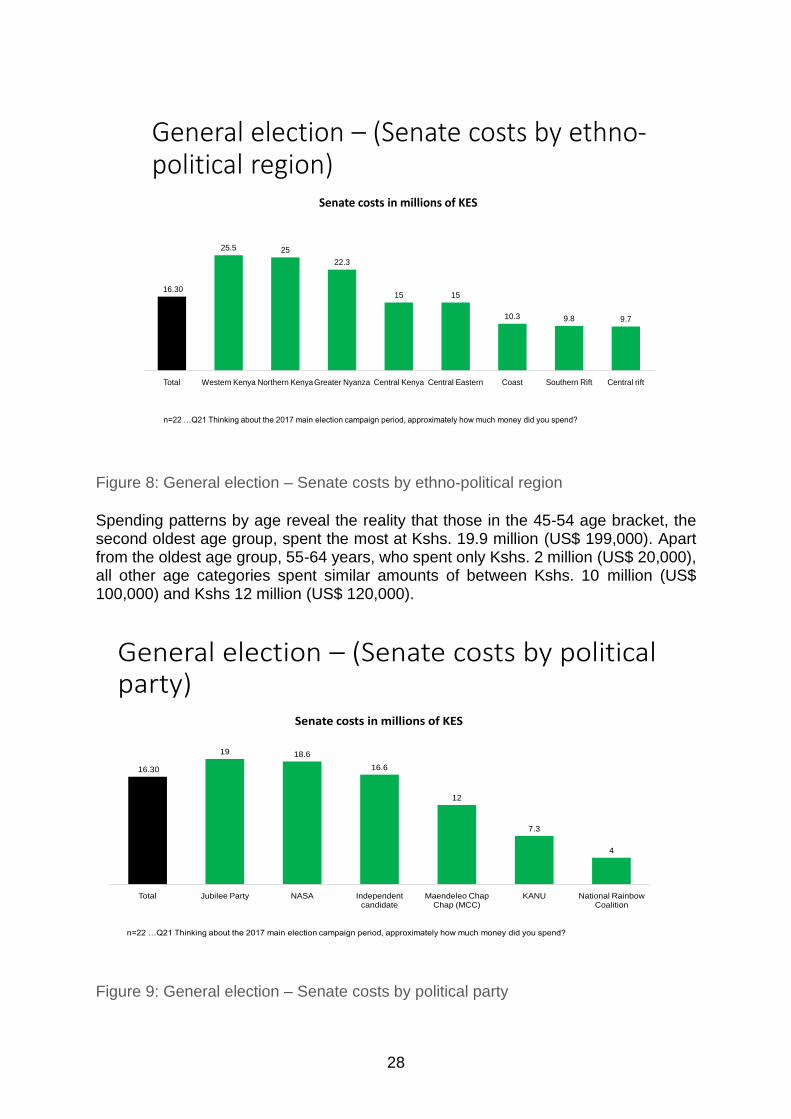
28
Figure 8: General election – Senate costs by ethno-political region Spending patterns by age reveal the reality that those in the 45-54 age bracket, the
second oldest age group, spent the most at Kshs. 19.9 million (US$ 199,000). Apart from the oldest age group, 55-64 years, who spent only Kshs. 2 million (US$ 20,000), all other age categories spent similar amounts of between Kshs. 10 million (US$ 100,000) and Kshs 12 million (US$ 120,000).
Figure 9: General election – Senate costs by political party
General election – (Senate costs by political party)
16.30
19 18.6
16.6
12
7.3
4
Total Jubilee Party NASA Independent candidate
Maendeleo Chap Chap (MCC)
KANU National Rainbow Coalition
Senate costs in millions of KES
n=22 …Q21 Thinking about the 2017 main election campaign period, approximately how much money did you spend?
General election – (Senate costs by ethno-political region)
16.30
25.5 25
22.3
15 15
10.3 9.8 9.7
Total Western Kenya Northern KenyaGreater Nyanza Central Kenya Central Eastern Coast Southern Rift Central rift
Senate costs in millions of KES
n=22 …Q21 Thinking about the 2017 main election campaign period, approximately how much money did you spend?

29
3.3.2 Woman’s Representative On average, Woman Rep candidates spent, Kshs. 9.2 million (US$ 92,000) during the general election campaigns. Those who won spent more than their competitors, spending Kshs. 12 million (US$ 120,000) in comparison to the Kshs. 7.3 million (US$ 73,000) spent by those who lost. In the general election, the cost - Kshs. 5 million (US$ 50,000)33 - for contesting the Woman Rep seat in Nairobi were lower than in other regions in a turnaround from the primary process where candidates spent the most. In the South Eastern counties of Kitui, Machakos, and Makueni, Woman Rep candidates spent, Kshs. 20 million (US$ 200,000) on the campaign. Those in North Eastern spent Kshs. 12.5 million (US$ 125,000). The huge costs during the general election in these counties is attributable to the expansive spread of the counties. Nonetheless in the majority of the counties, candidates for Woman Representatives seats campaigned on the platform of the dominant parties in their respective areas which often led to them spending less. Candidates spent less in the general election (Kshs. 9.2 million or US$ 92,000) as compared to the party primary (Kshs. 13.6 million or US$ 136,000). A further illustration of the importance of the leverage of a dominant political party. In regions where a particular party is dominant, candidates compete intensely to win the party ticket because it minimises the costs during the actual election. Our survey data supports this assumption. Candidates for Woman Rep seats that ran on the platform of the dominant parties in their respective areas spent less. This is because the party leader, and candidates running for the post of governor on the same ticket, will campaign for candidates on the same ticket. Candidates in NASA strongholds of Western Nyanza and Coast regions spent Kshs. 11.7 million (US$ 117,000), Kshs. 9 million (US$ 90,000), and Kshs. 5.8 million (US$ 58,000) respectively. Whilst in Jubilee strongholds of Lower Central, Central, South Rift, and North Rift spent Kshs. 11 million (US$ 110,000), Kshs. 10.4 million (US$ 104,000), Kshs. 6.1 million (US$ 61,000), and Kshs. 6 million (US$ 60,000) respectively. Overall, Jubilee candidates for Women’s Rep seats spent considerably more - Kshs. 13.3 million (US$ 133,000) - than their main NASA competitors, who spent Kshs. 7.9 million (US$ 79,000). Independent candidates featured in between the two, spending Kshs. 8.4 million (US$ 84,000)34.

30
Figure 10: Women Rep. Party primaries and election costs 3.3.3 National Assembly Member On average, contestants for the National Assembly seat spent Kshs. 9.9 million. (US$ 99,000). Those who won the seats, on average, spent Kshs. 10.8 million (US$ 108,000), while those who lost were only marginally behind them at Kshs. 9 million (US$ 90,000). Female candidates again spent more than their male counterparts: Kshs. 11.5 million (US$ 115,000) versus Kshs. 9.5 million (US$ 95,000). Interestingly, these amounts are similar to what both men and women candidates spent during the primaries (female – Kshs. 12.1 million (US$ 121,000); men – Kshs. 7.5 million (US$ 75,000)). Regional patterns of spending remain the same: although some regional strongholds of the two major political formations spent considerably less during the general election campaign. This was because they won the dominant party tickets which gave them significant advantage. Northern Kenya and the North Rift regions recorded the highest expenditure at Kshs 23.8 million (US$ 238,000) and Kshs 15.3 million (US$ 153,000) respectively. Candidates from these two regions have to contend with perennial conflict coupled with being an expansive region with poor infrastructure. The lowest expenditures were recorded in Nyanza, Central and Nairobi regions at Kshs. 5.7 million (US$ 57,000), Kshs. 6.3 million (US$ 63,000), and Kshs 6.1 million (US$ 61,000) respectively. These are regions controlled by the two dominant national parties. As argued in previous sections once you win a ticket in the party primaries to run with a dominant party in these regions, you are likely to spend less during the general election. An analysis of spending by political party candidates reveals a similar pattern. During the elections phase, the two largest political formations were not the biggest spenders,
40
21.9
1513.3 12.2 11.3 10
5.2 4.65
10.412.5
911.7
6.1
20
6 5.8
Nairobi Central Northeastern
Nyanza Western South Rift SouthEastern
North Rift Coast
Women rep party primaries and election costs in millions of KES
Party Primaries cost Elections

31
taking the opportunity to capitalise on their dominant positions in their respective regions, as well as the popularity of their party leaders, who enjoy near fanatical following. Leading the spending by political party were some of the Jubilee affiliated parties such as the Frontier Alliance Party with spending of about Kshs. 24 million (US$ 240,000). Others were those in KANU and the National Rainbow Coalition (NARC), both who spent Kshs. 20 million (US$ 200,000). Trailing these affiliates at Kshs. 15 million (US$ 150,000), NASA candidates spent more than their Jubilee competitors who spent Kshs. 8.3 million (US$ 83,000). Independent candidates spent Kshs. 6.3 million (US$ 63,000). Younger candidates – those aged 24 – 34 years – across all parties spent the least (Kshs 4.1 million – US$ 41,000), with candidates in the 45-54 age group spending the most at Kshs. 11.7 million (US$ 117,000). Those in the 35-44 age group spent Kshs. 8.8 million (US$ 88,000), while those in the 65-74 age group spent Kshs. 8.3 million (US$ 83,000). Unable to compete financially, younger candidates have reduced chances of winning and are therefore less represented across Kenya’s governance structures. 3.3.4 Member of the County Assembly The MCA contests at the general election followed a similar pattern as the party primaries. Women candidates spent well in excess of double the amount spent by their male counterparts. Winning women, spent an average of Kshs. 3.9 million (US$ 39,000), while male MCA candidates spent only Kshs. 1.6 million (US$ 16,000). Despite this difference in spending, only 9835 out of 900 women candidates, less than 11%, were elected. This is an important finding: women spend significant resources and effort but receive limited returns as compared to men. This shows that there are challenges in improving the political conditions to ensure a level playing field for both women and men. Without a doubt, the patriarchal nature of Kenyan society and attitudes towards women in leadership are likely a contributory factor. That women enjoy a numerical advantage and constitute 52% of the population and 60% of the country’s registered voters is an indication of the scale of this challenge. 36 The findings on candidates spending by political party affiliation at the MCA level reveals a wide array of parties contesting seats at this level, many with some level of success given the numerous seats at play. This demonstrates that in relative terms, the electorate does not seem to view the MCA contests through the same “high stakes” lens as they do the presidential, gubernatorial, or even parliamentary contests, in which many would vote straight along party lines, without knowing much about the individual candidates. In this case, the electorate are keener on electing individuals whom they know, and feel can deliver public goods at the local level. The major political formations did not produce the biggest spenders, with NASA candidates spending Kshs. 2.4 million (US$ 24,000) and Jubilee’s Kshs. 1 million (US$ 10,000), which falls around the median spending range. Independent candidates spent more on average Kshs. 1.6 million (US$ 16,000).
3.4 Costs of holding political office The salaries of elected officials in Kenya are considerable, and it is no longer unusual for individuals from the private sector to leave their lucrative, senior level positions in

32
favour of the salaries, emoluments, and prestige that come with public or elective office (see Table 7). In fact, over 40% of respondents entered into politics from the business sector. Of the women represented in this survey, prior to election, 35% were business owners, 22% were in the education sector, 11% were in government administrative positions, while 8% were journalists. The situation is not dissimilar for male candidates. 43% were business owners, 15% from the education sector, and 8% were previously government administrators.
Table 7: monthly and 5-year salaries for the four elective positions
Senate Woman Rep MP MCA
Monthly salary 621,250
($ 6,212)
621,250
($ 6,212)
621,250
($ 6,212)
144,375
($ 1,443)
Min Max Min Max Min Max Min Max
Monthly salary
+ allowances
902,913
($ 9,029)
1,375,08
3
($
13,750)
902,913
($ 9,029)
1,375,083
($ 13,750)
902,913
($ 9,029)
1,375,083
($ 13,750)
171,508
($1,715)
296,925
($ 2,969)
5-year salary 37,275,000
($ 372, 750)
37,275,000
($ 372, 750)
37,275,000
($ 372, 750)
8,662,500
($ 86,625)
Min Max Min Max Min Max Min Max
5-year salary +
allowances
54,174,780
($ 541,747)
82,504,9
80
($
825,049)
54,174,780
($ 541,747)
82,504,980
($ 825,049)
54,174,780
($ 541,747)
82,504,980
($ 825,049)
10,290,480
($ 102,904)
17,815,500
($ 178,155)
An examination of emoluments earned during the five-year term against the cost of participating in an election reveals that for all seats, the emoluments (salary + allowances) outweigh the cost of contesting the election, even if they all have to spend, on average, more than a year’s salary to win the seat and many million shillings a year when in office. The analysis was carried out at the lower salary band for ordinary members, and excludes various variable allowances, thus these are conservative figures.

33
Figure 11: shows the total average expenditure for each post disaggregated by party, and gender. But expenditure does not cease for candidates when they are elected to office. Informal costs continue to be paid by those candidates who are successfully elected throughout their time in office. Due to the significant outlay in regards to the cost of contesting an election, followed by costs associated with maintaining political office, elected officials are always on the lookout for additional sources of income, whether legitimate or otherwise. Members of the National Assembly and their counterparts in the Senate spend the most while in office. At the parliamentary level, the Woman Rep candidates do not spend quite as much as their parliamentary colleagues, while the MCAs spend the least, as outlined below. 3.4.1 Senate On average a Senator spends Ksh778,600 (US$7,786) monthly to maintain his or her office; more than their monthly salary before allowances. A majority (54%) of Senators interviewed listed contributions to development projects as their main cost driver and expenditure while in office with donations to local groups and contribution to fundraisers listed as the second highest (45% each). Despite the official function of a Senator being largely to provide oversight over the county governments, Kenyan voters are still demanding that Senators make contributions to local development projects directly. The findings show Senators from South Rift spent the most to maintain their office per month (Kshs. 1.65m, or US$ 16,500) while Western Kenya Senators spent the least (Kshs. 150,000 or US$ 1,500). The majority of the regions where Senators spend the most to maintain their offices are Jubilee strongholds where changing political dynamics occasioned by shifting alliances have increased political uncertainty thus

34
requiring politicians to spend more time with the electorate and invest more resources in the process. But Senators from Greater Nyanza also spend a significant amount, Kshs. 700,000 (US$ 7,000) to maintain their offices on a monthly basis. Greater Nyanza counties re-elected five out of six Governors for a second term in 2017, who, by virtue of serving in their second terms, will legally be barred from contesting the same office again. This might explain why Senators are spending more than other elected leaders as they position themselves to run for the coveted Gubernatorial seat. According to IEBCs 2017 elections data report, some 16 Senators elected in 2013 ran for Governor in the 2017 elections, six of them successfully. 3.4.2 Woman Representative Woman Reps pay an average of Kshs. 543,000 (US$ 5,430) per month when in office. This translates to Kshs. 6.5 million (US$ 65,000) per year and about Kshs. 32.5 million (US$ 325,000) for a five-year term in office. This amount is more than a Woman Rep spends to get elected and is three times more than the lower band annual salary for a Women’s Rep, Kshs. 10,834,956 (US$ 108,349). A significant finding is that the type of costs incurred by incumbents or costs associated with being in office is radically different from the expenses during campaigns. While publicity and logistics (transport) are the main item while competing against other candidates in party primaries and the general election, incumbents incur different type of costs thereafter. Giving donations to local development projects (64%), and gifts to organised local groups (54%) top the list of expenses while in office. Visiting the county (38%), and social contributions (38%) are also important. The costs incurred by incumbents point to the need to maintain a presence in the county. They do so by attaching significance to development projects and directly relating to local organised groups. 3.4.3 Member of the National Assembly National Assembly members earn Kshs. 621,250 (US$ 6,212) monthly, before allowances. The average monthly expenditure for a constituency MP on maintaining their offices is Kshs. 780,000 (US$ 7,800). This amount is expended on a patronage basis. That is, after winning elections, expenditure for maintaining office changes considerably. Expenditure as a sitting MP takes on a social welfare dimension. MPs become a major source of funds for development projects, local social groups and supporting needy individuals. It is important for elected leaders to remain visible all the time in the constituency. Therefore, the expenditure tends to revolve around visibility. MPs make contributions to development projects, contribute to social welfare of individuals who are in need, visit their constituents and support numerous fundraising events organised by needy individuals and organised groups in the constituency.
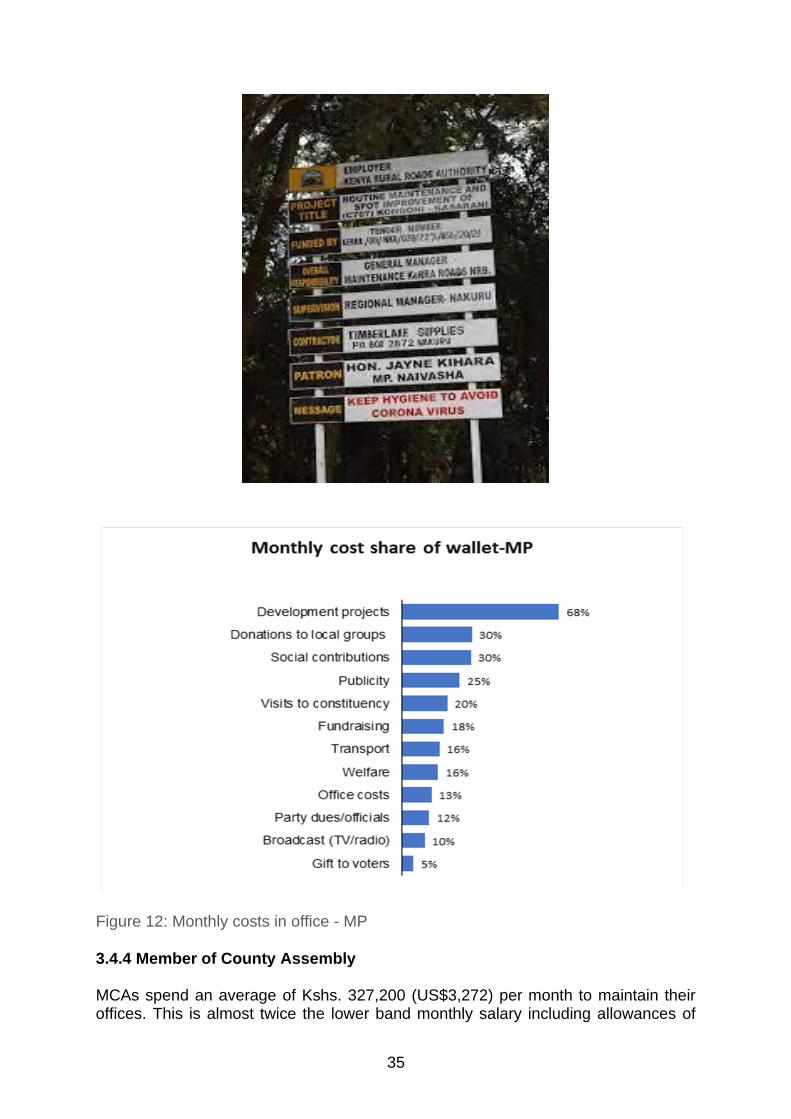
35
Figure 12: Monthly costs in office - MP 3.4.4 Member of County Assembly MCAs spend an average of Kshs. 327,200 (US$3,272) per month to maintain their offices. This is almost twice the lower band monthly salary including allowances of
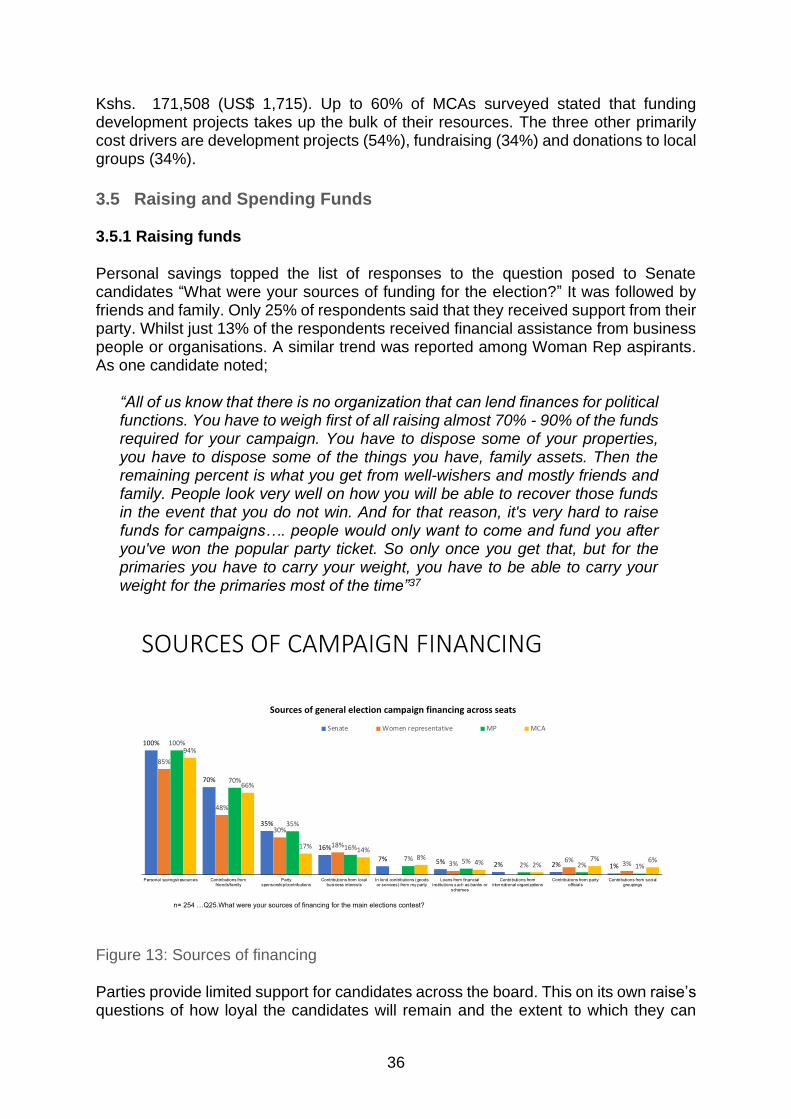
36
Kshs. 171,508 (US$ 1,715). Up to 60% of MCAs surveyed stated that funding development projects takes up the bulk of their resources. The three other primarily cost drivers are development projects (54%), fundraising (34%) and donations to local groups (34%).
3.5 Raising and Spending Funds 3.5.1 Raising funds Personal savings topped the list of responses to the question posed to Senate candidates “What were your sources of funding for the election?” It was followed by friends and family. Only 25% of respondents said that they received support from their party. Whilst just 13% of the respondents received financial assistance from business people or organisations. A similar trend was reported among Woman Rep aspirants. As one candidate noted;
“All of us know that there is no organization that can lend finances for political functions. You have to weigh first of all raising almost 70% - 90% of the funds required for your campaign. You have to dispose some of your properties, you have to dispose some of the things you have, family assets. Then the remaining percent is what you get from well-wishers and mostly friends and family. People look very well on how you will be able to recover those funds in the event that you do not win. And for that reason, it's very hard to raise funds for campaigns…. people would only want to come and fund you after you've won the popular party ticket. So only once you get that, but for the primaries you have to carry your weight, you have to be able to carry your weight for the primaries most of the time”37
Figure 13: Sources of financing Parties provide limited support for candidates across the board. This on its own raise’s questions of how loyal the candidates will remain and the extent to which they can

37
contribute to the strengthening of the political parties. This may explain the limited institutionalisation of political parties as demonstrated by continuous fragmentation and changing alliances: parties appear to be fluid institutions serving as vehicles to propel leaders from one electoral process to another rather than ideological bases to which candidates with shared values are attached. 3.5.2 Spending on what?
The survey collected data about candidates’ expenditure before, during, and, for those who won, after the election. Over 80% of candidates for each of the posts revealed that they spent the most on publicity and transport costs before and during the party primaries. Publicity was concerned with making campaign merchandise and in particular items to profile them and increase their visibility in their respective electoral units. Publicity and transport costs remained important during the general election campaign as well. As one individual interviewed for this study explained:
“… a candidate has got to have agents that’s the first cost. An agent comes at a cost, which includes food for them, and then their time and labour, and their transport to different stations… And then you'll have to be prepared for any eventuality… especially if it's a notorious house like Orange house or Jubilee house, you must be prepared to factor costs to go and camp and petition at the Political Parties Tribunal for purposes of complaints, and so on.”38
Figure 14: Areas of expenditure – party primaries
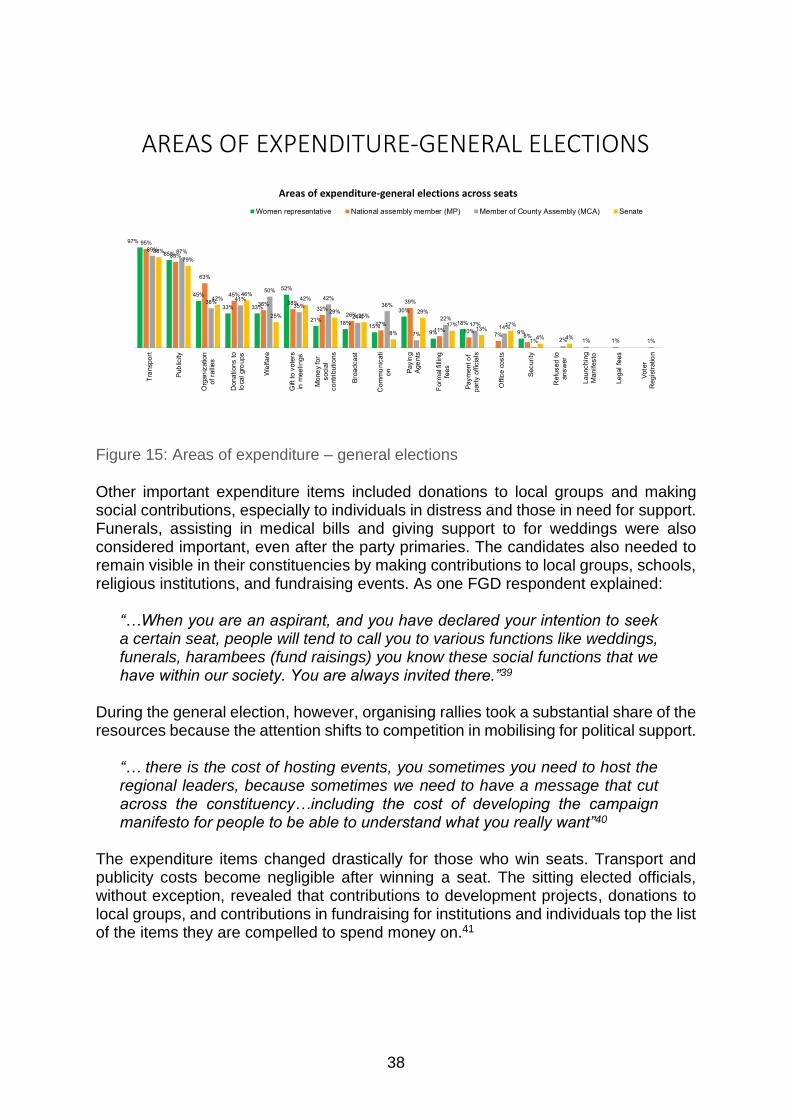
38
Figure 15: Areas of expenditure – general elections Other important expenditure items included donations to local groups and making social contributions, especially to individuals in distress and those in need for support. Funerals, assisting in medical bills and giving support to for weddings were also considered important, even after the party primaries. The candidates also needed to remain visible in their constituencies by making contributions to local groups, schools, religious institutions, and fundraising events. As one FGD respondent explained:
“…When you are an aspirant, and you have declared your intention to seek a certain seat, people will tend to call you to various functions like weddings, funerals, harambees (fund raisings) you know these social functions that we have within our society. You are always invited there.”39
During the general election, however, organising rallies took a substantial share of the resources because the attention shifts to competition in mobilising for political support.
“… there is the cost of hosting events, you sometimes you need to host the regional leaders, because sometimes we need to have a message that cut across the constituency…including the cost of developing the campaign manifesto for people to be able to understand what you really want”40
The expenditure items changed drastically for those who win seats. Transport and publicity costs become negligible after winning a seat. The sitting elected officials, without exception, revealed that contributions to development projects, donations to local groups, and contributions in fundraising for institutions and individuals top the list of the items they are compelled to spend money on.41

39
Figure 16: Areas of expenditure – in office These items for sitting officials point towards a patronage structure: the officials develop relations in the constituencies by providing resources for development projects and by assisting local groups, institutions, and individuals. Even though not all elected representatives have direct access to public funds, it was evident that the MPs in the National Assembly have indirect access to the National Government Constituency Development Fund. This fund supports national government projects in the constituencies. MPs have an overwhelming influence in the management of the fund and projects, even though their role is primarily oversight and law-making. The MCAs also have access to county governments where their relationship with sitting governors may facilitate access to funds to support development projects in their wards. Even though they are required to oversee the use of these funds, the MCAs tend to influence how the funds are allocated and utilised in their wards. Some of them use their positions to determine which projects get funded and implemented based on what might appear political beneficial for them.
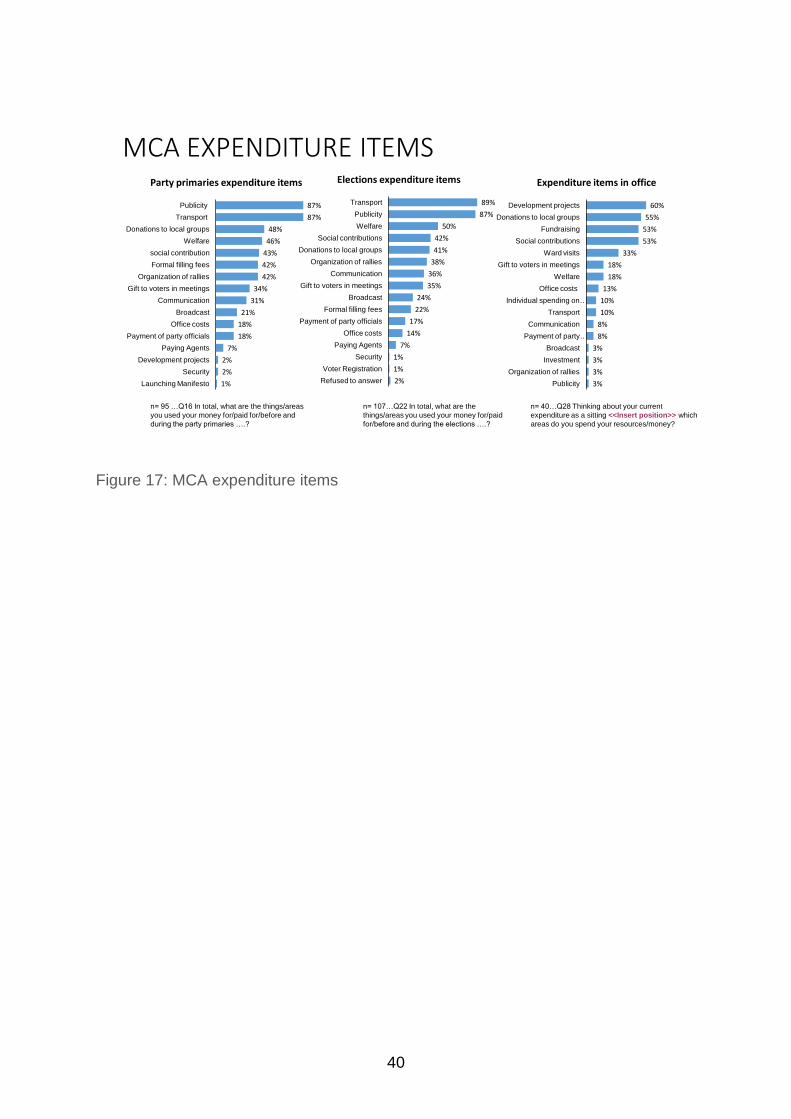
40
Figure 17: MCA expenditure items
MCA EXPENDITURE ITEMS
87%
87%
48%
46%
43%
42%
42%
34%
31%
21%
18%
18%
7%
2%
2%
1%
Publicity
Transport
Donations to local groups
Welfare
social contribution
Formal filling fees
Organization of rallies
Gift to voters in meetings
Communication
Broadcast
Office costs
Payment of party officials
Paying Agents
Development projects
Security
Launching Manifesto
Party primaries expenditure items
89%
87%
50%
42%
41%
38%
36%
35%
24%
22%
17%
14%
7%
1%
1%
2%
Transport
Publicity
Welfare
Social contributions
Donations to local groups
Organization of rallies
Communication
Gift to voters in meetings
Broadcast
Formal filling fees
Payment of party officials
Office costs
Paying Agents
Security
Voter Registration
Refused to answer
Elections expenditure items
60%
55%
53%
53%
33%
18%
18%
13%
10%
10%
8%
8%
3%
3%
3%
3%
Development projects
Donations to local groups
Fundraising
Social contributions
Ward visits
Gift to voters in meetings
Welfare
Office costs
Individual spending on …
Transport
Communication
Payment of party …
Broadcast
Investment
Organization of rallies
Publicity
Expenditure items in office
n= 95 …Q16 In total, what are the things/areas
you used your money for/paid for/before and
during the party primaries ….?
n= 107…Q22 In total, what are the
things/areas you used your money for/paid
for/before and during the elections ….?
n= 40…Q28 Thinking about your current
expenditure as a sitting <<Insert position>> which
areas do you spend your resources/money?
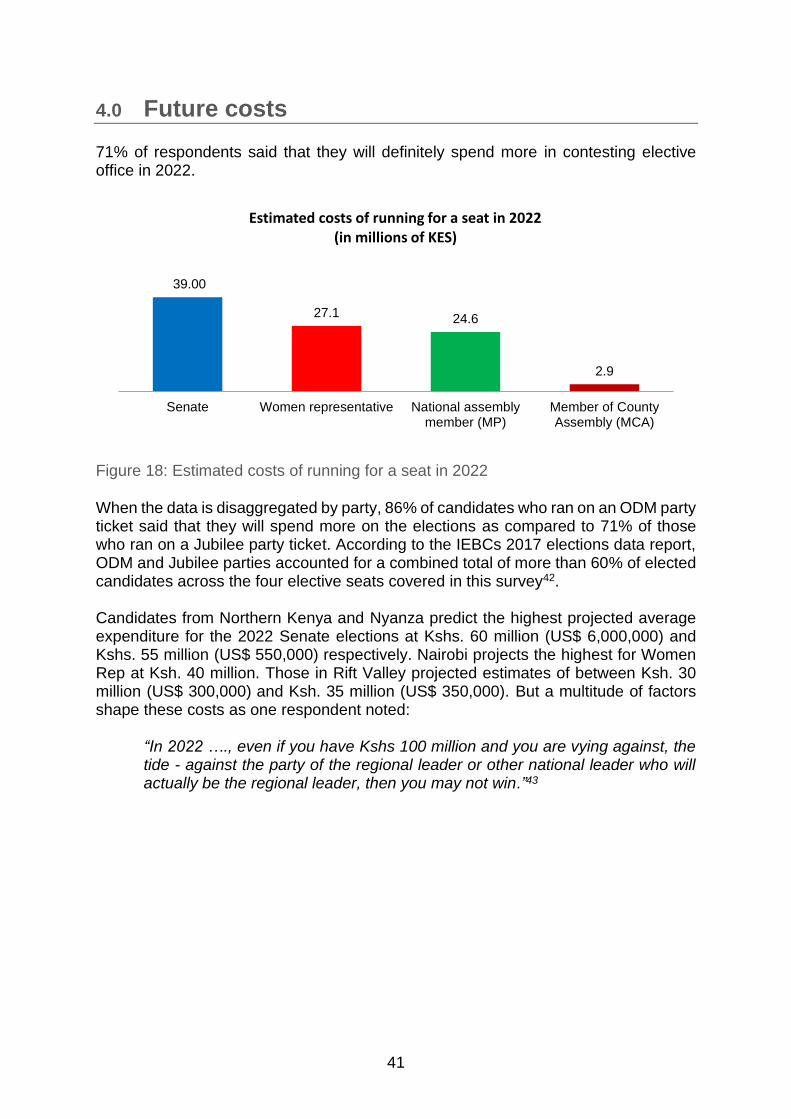
41
4.0 Future costs 71% of respondents said that they will definitely spend more in contesting elective office in 2022.
Figure 18: Estimated costs of running for a seat in 2022 When the data is disaggregated by party, 86% of candidates who ran on an ODM party ticket said that they will spend more on the elections as compared to 71% of those who ran on a Jubilee party ticket. According to the IEBCs 2017 elections data report, ODM and Jubilee parties accounted for a combined total of more than 60% of elected candidates across the four elective seats covered in this survey42. Candidates from Northern Kenya and Nyanza predict the highest projected average expenditure for the 2022 Senate elections at Kshs. 60 million (US$ 6,000,000) and Kshs. 55 million (US$ 550,000) respectively. Nairobi projects the highest for Women Rep at Ksh. 40 million. Those in Rift Valley projected estimates of between Ksh. 30 million (US$ 300,000) and Ksh. 35 million (US$ 350,000). But a multitude of factors shape these costs as one respondent noted:
“In 2022 …., even if you have Kshs 100 million and you are vying against, the tide - against the party of the regional leader or other national leader who will actually be the regional leader, then you may not win.”43
39.00
27.1 24.6
2.9
Senate Women representative National assemblymember (MP)
Member of CountyAssembly (MCA)
Estimated costs of running for a seat in 2022 (in millions of KES)

42
Table 8: Regional Analysis of current/predicted expenditure
Highest Average
Expenditure
Lowest Average
Expenditure
2017 2022 2017 2022
Senate Western Central
Kenya Coast Northern
Woman
Representative Nairobi Nairobi Coast North Rift.
Member of the
National
Assembly
South
Eastern Northern
Central
Eastern Central Rift
MCA Greater
Nyanza North Rift Central Rift Central Rift
Table 8 provides a comparison showing the highest and lowest average expenditures from 2017, with the areas which are expected to be the most expensive in 2022. From this data, it is observed that it will be more expensive to run for seats in Northern Kenya. Northern Kenya has traditionally relied on clan dynamics and clan elder endorsements to determine who becomes a candidate in the most popular political party. Devolution brought about political pluralism, and many are now defying clan dynamics to run on different political parties for the National Assembly MP and the MCA seats which provide more options for candidates. A range of popular candidates are thus fielded in the election, and they have to traverse the expansive but sparsely populated terrain to directly engage with the voters.
Central Kenya, Nairobi and North Rift are also predicted to see an increase in election expenditure. These are populous regions where resources are expended to reach as many people as possible. These are also the regions that are the focus of the 2022 power transition and shifting political alliances, thus raising the stakes for anyone interested in running for office. For example, Central Kenya is unlikely to field a presidential candidate for the first time since 1992 and as such has emerged as an open vote-rich region that will be fought over by leading contenders and parties. The North Rift - the political stronghold of current Deputy President William Ruto – will also likely be highly contested as other political leaders from the area mobilise to contest Ruto’s dominance in the region. While the Coast region recorded low expenditures in the 2017 elections, likely due to the support it gave to the ODM party, it has now become an open region with unpredictable shifting allegiances. Deputy President Ruto, who by all indications will likely run for President in 2022, has made inroads into the region, including supporting the winning candidate for the Msambweni by-election in Kwale County. Furthermore, three of the six governors in the region are serving their second and last term, and are therefore ineligible to run for another term. Although they continue to wield significant political influence, they have been unclear about their current allegiances and future

43
political roles, sowing a great deal of uncertainty in the region. Uncertainty that could increase the cost of acquiring party tickets and running for office in 2022.
On the flip-side Central Rift is expected to have relatively low expenditure rates. This is a region where political allegiances are unlikely to shift. It is also a region that has traditionally elected young politicians. The 2017 data shows that young politicians typically spend less than their older counterparts and is perhaps another reason to explain the lower costs.
Table 9: Estimated costs per elective position (2022)
Total Expenditure
(Kshs. million)
Total Expenditure
($)
Projected Average
Future Cost (Kshs. million)
Projected Average
Future Cost ($)
2017 2017 2022 2022
Senate 35.5 355,000 39.3 393,000
Women
Representative
22.8 228,000 23.9 239,000
Member of the
National Assembly
18.2 182,000 22.2 222,000
MCA 3.1 31,000 3.1 31,000
According to estimates provided by our survey respondents, aspiring members of the National Assembly are set for the largest percentage increase in average expenditure in 2022. The National Assembly seat is predicted to be the most attractive seat in the 2022 elections given that there is a proposal to return to a parliamentary system of governance where influential cabinet ministers will be appointed from within the legislature.

44
5.0 Drivers of the cost of politics This section examines some of the factors behind the rising cost of electoral politics in the country. It elaborates on reasons why people continue to run for office even when it is evident that the costs are very high.
1) Allure of elective office Kenya is home to some of the highest paid legislators in the world. They have a monthly emolument package of at least Ksh. 1,000,000 (US$ 10,000), including basic allowances. The allowances and benefits for the MP include accommodation and subsistence allowances; security; mileage allowances; medical scheme; retirement benefits; and special duty allowance for those with additional responsibilities. If these were valued in money terms, their earnings would go far beyond this figure and indeed put the elected officials on the same level as the most highly remunerated people in the country. Furthermore, the position is prestigious. Upon winning an election, the person acquires a new status complete with the title of Mheshimiwa - Kiswahili for honourable. This title opens doors to many offices. The title is associated with ‘power and influence’ because one can access any office without difficulties. In one FGD, participants underlined that
“MPs are very well paid but the pay is not the only thing that makes the post attractive. The position opens all the doors one would want…you establish connections and rich networks which you can use to benefit your constituency or even for your personal benefit”.44
Money, status and power therefore combine to give the seat of elected officials an allure that attracts many to the race for office. Some of those interviewed indeed stressed that people do not run for office to serve the community; they run for office because when you win, you have many benefits and networks for easy self-enrichment.
2) Patronage and connections The status of the office is buttressed by patronage opportunities. Being a ‘big-man’ also means that you are in the patron-client network chain that connects the higher levels of the state and senior politicians to the grassroots. Here it is worth emphasising that patronage resource is central to political support and maintaining loyalty among politicians and their supporters. The ability to draw resources from the centre for development of any politician’s constituency is tied to their connection to patronage networks. This connection, however, is not for the purpose of developing their communities alone. This is also an opportunity for self-enrichment through contracts with public institutions. Furthermore, proximity to power enables those elected to also create opportunities for relatives to enrich themselves. The package of benefits through an elaborate structure of patron-client relationship, and particularly access to state resources, therefore, drives the cost of politics as elites compete to access the centre of power. Ironically this does not only increase the cost of politics but also
45
undermines accountability. MPs become much more accountable to those who give them favours, rather than voters.
3) Pressure from below Voters also drive the cost of politics by demanding hand-outs from MPs. In many of the interviews, respondents repeatedly pointed out that
Voters will not listen to anyone who does not give them money…they openly demand money from candidates. In some instances, they demand payment to attend meetings…they will fail to attend if they are not given what they call ‘facilitation’ (hand-out).45
Voters demand payment because some of those elected rarely engage with voters after elections. They recognise this and therefore insist that they get something before that happens. Respondents said that voters demand ‘hand-outs’ because they know those elected go to office only enrich themselves. Election time is the only chance they have to get a ‘bit from them’. In addition, there were respondents who pointed out that the level of corruption in Kenya among elected officials is high. They ‘get to public office and plunder resources…which they use for campaigns at election time.’ These respondents argued that voters are disillusioned by levels of corruption in which elected official are at the centre. To them, the election presents an opportunity to get what they consider to be theirs – money stolen from the public. This pressure from below results in candidates spending more money at election time. If one does not play ball, voters shift attention to those who will give cash hand-outs:
“Voters themselves will tell you that so and so passed by and gave us Ksh. 500…those who were assembled at this matatu stage [public transport station]; or those in a women’s group meeting waiting for a politician…they will demand you give the same amount or even more…they even pretend to return your money if they consider it little… under the circumstances you have to give… and your opponent will do so as well on another occasion”.46
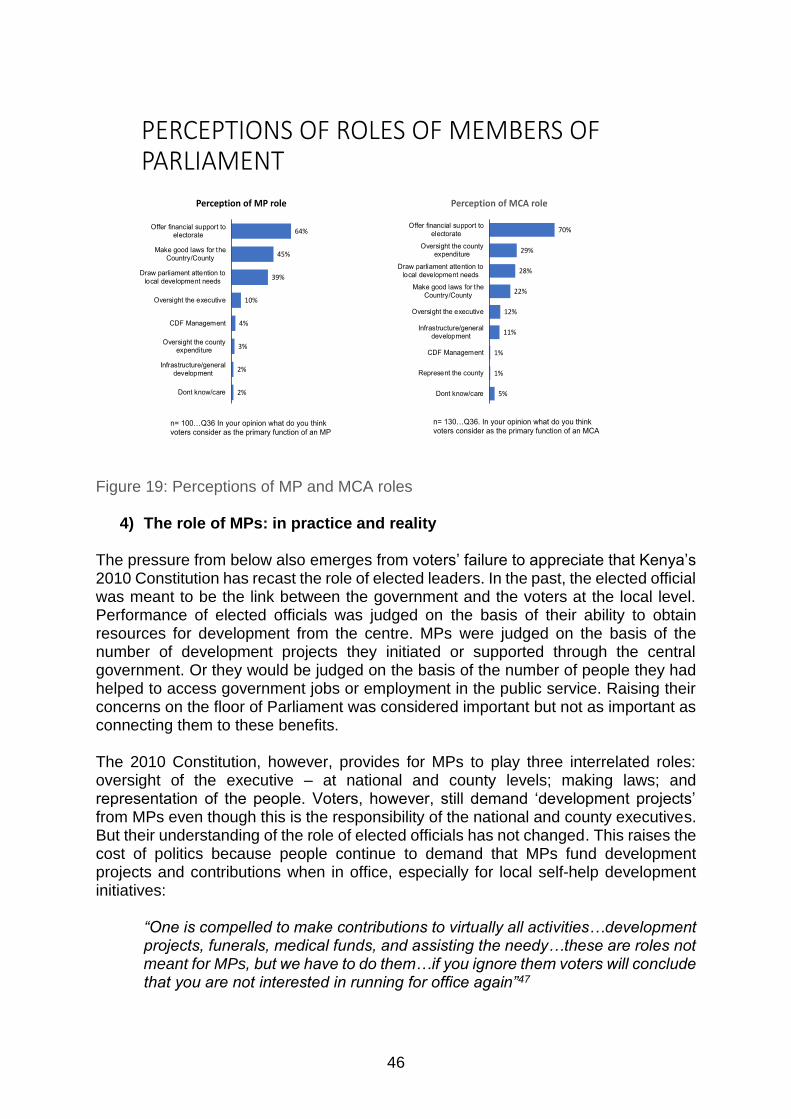
46
Figure 19: Perceptions of MP and MCA roles
4) The role of MPs: in practice and reality The pressure from below also emerges from voters’ failure to appreciate that Kenya’s 2010 Constitution has recast the role of elected leaders. In the past, the elected official was meant to be the link between the government and the voters at the local level. Performance of elected officials was judged on the basis of their ability to obtain resources for development from the centre. MPs were judged on the basis of the number of development projects they initiated or supported through the central government. Or they would be judged on the basis of the number of people they had helped to access government jobs or employment in the public service. Raising their concerns on the floor of Parliament was considered important but not as important as connecting them to these benefits. The 2010 Constitution, however, provides for MPs to play three interrelated roles: oversight of the executive – at national and county levels; making laws; and representation of the people. Voters, however, still demand ‘development projects’ from MPs even though this is the responsibility of the national and county executives. But their understanding of the role of elected officials has not changed. This raises the cost of politics because people continue to demand that MPs fund development projects and contributions when in office, especially for local self-help development initiatives:
“One is compelled to make contributions to virtually all activities…development projects, funerals, medical funds, and assisting the needy…these are roles not meant for MPs, but we have to do them…if you ignore them voters will conclude that you are not interested in running for office again”47

47
5) Dominant parties and coalitions/alliances Candidates are also willing to spend more, especially at party primaries to secure a ticket from the dominant party or alliance of parties. This is because securing the ticket from the dominant party reduces the costs at the general election. The party leader and senior politicians from the party usually come to the region and support the party candidates openly stating that they do not want anyone opposing the party candidates. This, on the whole, reduces the costs at general election.
6) Limited oversight Running for office in Kenya takes place in the absence of the enforcement of the law and regulations on campaign financing. The regulations that could have helped enforce the law have been shelved. Thus far, there has been no major interest in dusting off the law for implementation. At the same time, the IEBC and the Office of the Registrar of Political Parties (ORPP)- the institutions with responsibility for holding individual political parties to account especially in terms of how they manage the party primary process - are weak.

48
6.0 Impacts of the rising cost of politics
(a) Exclusion of capable candidates Many of those interviewed agreed strongly that the cost of politics in Kenya is on the rise. They also indicated that the increasing costs were a concern because high costs of participating in the democratic process made it difficult for many potential candidates to present themselves for elective office. The implication being that the high cost of politics is excluding capable candidates without access to sizeable resources. In Kenya, politics is rapidly becoming the preserve of those able to pay the high costs associated with running an election campaign. It is not surprising, therefore, that one third of the respondents who won the election stated that their previous occupation was business.
(b) Non-functioning representative democracy The pattern of expenditure for maintaining an office for sitting legislators, without exception, is dominated by contributions to development projects, donations to groups, and fundraising and supporting individuals in need. At no time did any sitting respondent point out that they convene meetings to discuss legislative matters that the constituents would like presented in Parliament or the County Assembly. This suggests that the transactional nature of politics is reducing opportunities for debate and dialogue between elected officials and their constituents. Instead elected officials turn their office into a source of patronage for the purpose of maintaining supporters and improving chances of re-election.
(c) Prevailing patronage All the sitting legislators interviewed for this study pointed out that they spend almost the equivalent, or more, of their monthly emoluments to maintain their offices. At the end of the five-year term of office, many will have spent double, or more, the amount outlaid on seeking office in the first place. With another election at the end of this five-year period this may seem like a zero-sum game, but it is not. Once they win elections, the legislators turn to the Executive and to the public sector institutions for contracts and rent seeking opportunities. Some of them get contracts to supply goods and services to government institutions. The use of an electoral seat as a source of patronage in the constituency is linked to national level patronage networks, which in turn is the basis for corruption in the public sector. These networks help to entrench abuse of office, especially because political actors have to continue acquire resources to maintain their support bases.
(d) Constant campaign politics Many political candidates acknowledge that money is required to win an election and therefore they do not pay much attention to their functions. It is for this reason that the re-election bid begins almost immediately after the end of the electoral process. Both incumbents and aspiring candidates will seek to initiate ‘development projects’ which will increase their visibility come campaign time, while at the same time engaging key

49
strategic constituencies in preparation for party contests and campaigns. All this comes at a cost. But they do not engage constituents for the purpose of seeking their opinions per se: in political season the discourse is one-way. However, it would be disingenuous to assume that politicians alone are at fault for the development of this pervasive culture. In some parts of the country the culture of hand-outs is driven by the voters who will not give politicians audience without parting with “something”. As one respondent lamented, “voters are ruthless48”, in reference to the demand for cash hand-outs from the electorate, who will often demand a candidate leave them with ‘something’ before he or she is even allowed to address them at a public meeting.
(e) Weak oversight A final impact of the importance attached to money in politics is that elected officials do not always provide effective oversight of the use of resources by the Executive at the national and county level. This would be an exercise in futility, given that some intend to target access to those resources for personal or political gain rather than oversee the usage by the executive. The choice to turn a blind eye to effective oversight is often a partisan one, allowing those from the right side of the political divide the opportunity to generate resources for political purposes. All this becomes a vicious cycle that undermines the basic conditions for democratisation. In short, the cost of politics is threatening efforts to improve Kenya’s electoral democracy.

50
7.0 Conclusions Money matters a great deal in Kenya’s politics. Those who win their seats at all levels, without exception, tend to have spent double the amount of their nearest competitor. This is not to suggest that the losing candidates spend an inconsequential amount. They too spend huge sums of money. Indeed, many respondents among those who lost in the party primaries or even the general election pointed out that losing an election leads to many challenges. Some see their family businesses collapsing or declining in performance especially if they used family resources to run their campaigns. Although money matters, this research reveals that the choice of political party is also important. A dominant party ticket is beneficial when contesting for any political office in the stronghold region of the party. The winning combination of money and a dominant party is the much sought-after formula that politicians go to great lengths to secure. However, spending more than your opponent does not always guarantee you victory, particularly if you are a woman. Female candidates spend more than men in many regions and across several seats. Nonetheless, the number of women in the three open seats has not increased significantly in the past two elections. The potential reasons for this are complex and multifaceted but clearly the patriarchal nature of the Kenyan society puts them at a disadvantage. In short, women have to work much harder and use different mobilisation strategies to win support. Winning an election, however, does not afford a politician much respite: the spending must continue. The costs of maintaining political office are also significant, often matching their official monthly salaries. Furthermore, campaigning for the next term begins as soon as the candidates reached elected office. To be competitive in a future election, it has become necessary for politicians to begin campaigns early, to a point that now the entire five-year term in office resembles a campaign. When campaigning for office is a constant priority, the core mandate of an elected official suffers. As a result of the amount of money involved, many willing, able or worthy candidates are excluded. Consequently, representative democracy is compromised, as opportunities for patronage become of greater importance than engaging with constituents for the purpose of representing their views, improving their lives and circumstances. This transactional approach to politics leads to a perpetual search for rent-seeking opportunities, which in turn fuels corruption in the public sector. Thus, if not carefully managed, the cost of politics, has the potential to severely undermine the democratic process.

51
8.0 Key recommendations The results of this survey reveal a disconnect between the prescribed roles of elected officials, and the perception of these roles by the electorate. To address the rising costs of politics and its impact on Kenya’s electoral democracy and wider democratic structures the following recommendations are proposed. Address problematic party primaries:
• The election management body – IEBC - should train political parties on the conduct of party primaries. The IEBC should seek support of other agencies including the Office of the Registrar of Political Parties and the Judiciary to strengthen enforcement of procedures for party primaries. The Office of Registrar of Political Parties should ensure that political parties receiving public funds, are compelled to budget sufficiently for party primaries, among other things than can strengthen political parties.
• The threshold for the Political Parties Fund is set such that only the largest parties or coalitions of parties can benefit from the fund. This should be reviewed to enhance democracy by providing funding for a broad range of parties, rather than only those with the greatest numerical strength. Furthermore, it is important for the government to hold the parties who received this support to account in their use of public funds.
• Though the Public Officers Ethics Act provides for Declarations of Wealth of public officers, these declarations are not publicly available. To make this an effective accountability mechanism, it would be prudent to subject these declarations to public scrutiny.
Introduce mechanisms to monitor candidate expenditure
• The Election Campaign Finance Act was passed in 2014, mandating the IEBC to regulate and administer campaign financing. As required, the IEBC submitted regulations to Parliament for approval. Specifically, these regulations sought to require political parties to open expenditure accounts, appoint individuals authorised to manage these accounts, to submit bank account details to IEBC, and furthermore, to establish expenditure limits for parties. These regulations need to be operationalised before the next election in 2022.
• There is a need to table the regulations for public debate. This will sensitise the public and create awareness on how the increased cost of politics is excluding some people from participating in running for office. It will also make people pay attention to the fact that elective politics has become the basis of advancing self-interests.
Greater support for female candidates
• It is necessary to level the playing field. Following the 2017 elections, 1,336 men were elected to office as compared with only 96 women. Of those 47 were elected to the Woman Rep position, a position which only women compete for. Initiatives such as gender quotas for women candidates at the party primaries,

52
and reduced fees for women contesting at the party primaries and election level can begin to redress the balance.
• Advocacy focused on the leadership capacity of women, and enabling women candidates to receive public funds for their campaigns. This should be on basis of an agreed criteria including their performance in party primaries.
• Efforts are needed to challenge the perception that women should only compete for affirmative action seats. Women should be facilitated and encouraged to compete for the full range of elective positions. Political parties, in particular, must lead from the front in this regard. Alongside this, public advocacy on the ability of women to fulfil any, and all, elective positions is needed to start to address long held attitudes.
Engage voters
• It is critical that on-going sensitisation and civic education is carried out on the roles of elected officials. Very little has been done in this regard in the past. This failure has reinforced the political culture of patronage and handouts. As it stands, the electorate feel they are justified to make financial demands of legislators because they feel that legislators are paid substantial salaries for this reason, and because they do not fully appreciate the primary roles of elected officials49.
• Civil society groups should create and implement a public advocacy and civic education programme on money and politics in Kenya. This should take the form of both civic and political education. It should aim at weakening the values that entrench the cogent link between money and being elected as leaders.
53
9.0 About the authors Prof. Karuti Kanyinga (@karutikk) is a Research Professor based at the Institute for Development Studies (IDS), University of Nairobi. He is an accomplished development researcher and scholar with extensive national and international experience. He has published extensively and is renowned for his contributions to scholarship and knowledge on governance and development in Kenya and Africa in general. Tom Mboya (@TomMboya) is a governance and political affairs consultant based in Nairobi, Kenya. He has extensive experience in capacity building, research and policy analysis, working nationally and internationally. He has written and contributed to numerous political, technical as well as academic publications.
54
Endnotes
1 See for instance Kevin Casas-Zamora Daniel Zovatto. 2016. ‘The Cost of Democracy: Essays on Political Finance in Latin America’. Stockholm: International IDEA. Westminster Foundation for Democracy. 2 Mboya, T. 2020. “The Cost of Parliamentary Politics in Kenya”. Westminster Foundation for Democracy. 3 Asante, K et al. 2018. The Cost of Politics in Ghana. Westminster Foundation for Democracy. 4 Golooba-Mutebi, F. 2016. “The Cost of Politics in Uganda”. Westminster Foundation for Democracy 5 Mboya, T. 2020. “The Cost of Parliamentary Politics in Kenya”. Westminster Foundation for Democracy 6 Article 96. The Constitution of Kenya
55
7 Independent Electoral & Boundaries Commission (IEBC). Handbook on Elective Positions in Kenya 8 See Kanyinga, K, 2019. Political Economy of Kenya and the 2017 General Election, Observatoire de l'Afrique de l'Est, Note n°9, mars 2019. For details on how Kenya has changed over the years before and after 2010 Constituiton see Cheeseman, N, Kanyinga, K, and Lynch, G (eds). 2020. Oxford Handbook of Kenyan Politics. Oxford: Oxford University Press 9 Cheeseman, N, Kanyinga, K., Lynch, G., Ruteere, M & Willis, J. 2019. “Kenya’s 2017 elections: winner-takes-all politics as usual?” Journal of Eastern African Studies 13(2). pp, 215-234. 10 Parliament comprises the National Assembly and the Senate. 11 Some MCAs were elected unopposed in the 2017 elections and are not factored here. 12 Section 23, Political Parties Act (No. 11 of 2011) 13 Netherlands Institute for Multiparty Democracy. 2015. ‘Political party financing and equal participation of women in Kenyan electoral politics: A situation overview’. 14 Makana, F. 2017. ‘High Court suspends law on election campaign financing’, Nairobi: The Standard, 6 January 2017. 15. Kitamirike E. & Kisaakye P. (2020). Impact of the Cost of Politics on Inclusive Political Participation in Uganda. Westminster Foundation for Democracy and Netherland Institute for Multiparty Democracy. 16 Ngige, F. 2017. ‘Jubilee approves over 7,000 aspirants for party primaries’, The Standard. Available at https://www.standardmedia.co.ke/politics/article/2001235278/jubilee-approves-over-7000-aspirants-for-party-primaries 17 Kakamega FGD respondent, 22 January 2021; and Nairobi FGD respondents, 16 February 2021. 18 Graham Kajilwa (2017). ‘Jubilee Party primaries to be repeated in 21 counties’. Available at https://www.standardmedia.co.ke/politics/article/2001237185/jubilee-party-primaries-to-be-repeated-in-21-counties 19 Female respondent – Nairobi FGD, 16 February 2021. 20 Ohman, M & Lintari, C. “Political party financing and equal participation of women in Kenyan electoral politics: A situation overview”. Netherlands Institute for Multiparty Democracy. 21 Reference group meeting and peer review discussions highlighted this as a common phenomena. 22 Kakamega FGD respondent. 22 January 2021. 23 Key Informant Interview, Uasing Gishu; 3 February 2021; and discussion with County Assemblies Forum, 4 April 2021. 24 Independent Electoral & Boundaries Commission. ‘Data Report of 2017 Elections’. Available at https://www.iebc.or.ke/uploads/resources/siEABKREDq.pdf 25 FGD respondent, Uasin Gishu. 2 February 2021. 26 FGD respondent, Uasin Gishu. 2 February 2021. 27 Wilson Muna and Michael Otieno (2020). ‘Voting With the Shilling: The Money Talks factor in Kenya’s Public Policy and Electoral Democracy.’ 19(1), pp.92-111.
56
28 Party primaries are conducted by respective parties and not the electoral management agency, IEBC. Parties’ parties are weak in record keeping and therefore constructing records on all the candiates who ran in party primaries and compare this to those who won is a hard task. 29 Constitution of Kenya 2010, Art 85 (a) 30. Independent Electoral & Boundaries Commission (IEBC), ‘Data Report of 2017 Elections’. Available at https://www.iebc.or.ke/uploads/resources/siEABKREDq.pdf 31 Ibid., 32 Clans compete for leadership, and more often make the decision who should be elected. Candidates spend money during this process. They negotiate with elders for ‘selection’ to run. 33 Woman Rep. candidates in Nairobi (in particular) were campaigning on the back of their parties and gubernatorial candidates. 34 As noted in other incidences independents can spend as much as party candidates, and the fact that party support is not often cited as a source of funding, demonstrates that party support, financially, to candidates, is minimal. 35 Independent Electoral & Boundaries Commission (IEBC), ‘Data Report of 2017 Elections’. Available at https://www.iebc.or.ke/uploads/resources/siEABKREDq.pdf 36 Gatimu, S. “Kenyan politics: where have all the women gone?”, Institute for Security Studies. 37 - Nairobi FGD respondent, 16 February 2021. 38 Uasin Gishu FGD respondent, 2 February 2021; and Muranga FGD, 14 January 2021. 39 Nairobi FGD respondent, 16 February 2021 40 Uasin Gishu FGD respondent, 02 February 2021 41 Getting elected is the main driver, and constituency consultations for public participation purposes while in office is seen as less of a priority. 42 Independent Electoral & Boundaries Commission (IEBC), ‘Data Report of 2017 Elections’. Available at https://www.iebc.or.ke/uploads/resources/siEABKREDq.pdf 43 Uasin Gishu FGD respondent, 02 February 2021 44 Kakamega FGD respondent, 22 January 2021 45 Kakamega FGD respondent, 22 January 2021 46 Key Informant Interview, Woman Rep, aspirant, 16 March 2021. 47 Discussion with MPs in a reference group meeting. 48 Kakamega FGD respondent, 22 January 2021. 49 Golooba-Mutebi, F. 2016. “The Cost of Politics in Uganda”. Westminster Foundation for Democracy.
57
References Cheeseman, Nic, Kanyinga, Karuti, and Lynch, Gabrielle (eds). 2020. Oxford Handbook of Kenyan Politics. Oxford: Oxford University Press Cheeseman, Nic., Kanyinga, Karuti., Lynch, Gabrielle., Ruteere, Mutuma., & Willis, Justin. 2019. “Kenya’s 2017 elections: winner-takes-all politics as usual?” Journal of Eastern African Studies 13(2). Pp, 215-234. Gatimu, S. “Kenyan politics: where have all the women gone?” Pretoria: Institute for Security Studies (ISS). Golooba-Mutebi, F. 2020. “The Cost of Politics in Uganda”. Westminster Foundation for Democracy. Independent Electoral & Boundaries Commission (IEBC). 2019. Data Report of 2017 Elections. Available at https://www.iebc.or.ke/uploads/resources/siEABKREDq.pdf. Independent Electoral & Boundaries Commission (IEBC). Handbook on Elective Positions in Kenya. Kanyinga, Karuti, 2019. Political Economy of Kenya and the 2017 General Election, Observatoire de l'Afrique de l'Est, Note n°9, mars 2019. Kevin Casas-Zamora, Daniel Zovatto. 2016. The Cost of Democracy: Essays on Political Finance in Latin America. Stockholm: International IDEA. Westminster Foundation for Democracy.
Kitamirike E. & Kisaakye P. (2020). Impact of the Cost of Politics on Inclusive Political Participation in Uganda. Westminster Foundation for Democracy and Netherlands Institute for Multiparty Democracy, Kampala.
Makana, Fred. 2017. ‘High Court suspends law on election campaign financing’, Nairobi: The Standard, January 6, 2017. Mboya, Tom. 2020. The Cost of Parliamentary Politics in Kenya. Westminster Foundation for Democracy. Netherlands Institute for Multiparty Democracy. 2015. Political party financing and equal participation of women in Kenyan electoral politics: A situation overview. The Hague: Netherlands Institute for Multiparty Democracy. Ngige, Francis (2017). ‘Jubilee approves over 7,000 aspirants for party primaries’, The Standard. Available at https://www.standardmedia.co.ke/politics/article/2001235278/jubilee-approves-over-7000-aspirants-for-party-primaries.

58
Ohman, M & Lintari, C. “Political party financing and equal participation of women in Kenyan electoral politics: A situation overview”. Netherlands Institute for Multiparty Democracy (NIMD). Westminster Foundation for Democracy. The Cost of Politics in Ghana. London: Westminster Foundation for Democracy. Westminster Foundation for Democracy. The Cost of Politics: Understanding political economy incentives. London: Westminster Foundation for Democracy.