the development effects of high-speed rail stations and ... · the development effects of...
TRANSCRIPT

The Development Effects of High-Speed Rail Stationsand Implications for California
Brian D. Sands
Institute of Urban and Regional DevelopmentUniversity of California at Berkeley
Berkeley, CA 94720
CALIFORNIA HIGH SPEED RAIL SERIES
Working PaperApril 1993
UCTC No. 115
The University of California Transportation CenterUniversity of California at Berkeley

PREFACE
This is one of a series of reports now being published as the output of IURD’s study of the
potential for a high-speed passenger train service in California. The present series includes twelve
studies. This is the tenth of twelve studies, nine of which have already been published.
We gratefully acknowledge the support provided by the United States Department of
Transportation and the California Department of Transportation [CALTRANS] through the
University of California Transportation Center. Of course, any errors of fact or interpretation
shoukl be assigned to us and not to our sponsors.
PETER HALLPrincipal Investigator

CONTENTS
Acknowledgements
List of Tables and Figures
Summary
1. Introduction
2. Japan and the Shinkansen
3. France and the TGV
4. Germany and the ICE
5. Implications for California
References
ii~°°!11
iv
1
2
22
39
5O
56

ACKNOWLEDGEMENTS
This study was prepared in cooperation with the California High-Speed Rail Project (CalSpeed) the Institute of Urban and Regional Development, University of California at Berkeley, which isfunded jointly by the California Department of Transportation and the University of CaliforniaTransportation Center. I alone take responsibility for the views and mistakes contained herein.
Without the guidance and support of many people, this paper would not have been possible. Iwould especially like to thank Peter Hall, who enabled me to grow as a student and researcherunder his tutelage. He has also assisted me with trips abroad to gather information for this studyand others, to experience first-hand European planning, and to maintain a semblance of contactwith my wife in Germany during the last two years; such guidance and assistance simply camaot berepaid. I would like to thank David Dowall for his reminders that the market is the ultimate deter-minate to development. I would also like to thank Steve Zimrick of the California Department ofTransportation for his interest in this study and for accepting the many modifications which haveoccurred along the way, and all of the staff and students at DCRP and IURD for their help andsupport, especially Kaye Bock and Martha Conway. Finally, I’d like to thank Dan Leavitt and JoelTranter for their contributions in reviewing and edidng this paper.

LIST OF TABLES
2.12.22.32.42.5
5.15.2
Number of Regions with Population Increase/Decrease, 1980-85Population of Cities with Stations and Neighboring Cities with StationsChange of Population and Economic ~dices in Cities on Tokaido LineEmployment of Cities with Stations and Neighboring Cities with StationsInformation Exchange Industries Employment Growth (%)
in Regions with Population Increase, 1981-1985
California Population by Region, 1980-2000 (000s)California Employment by Region, 1980-2000 (000s)
899
10
12
5254
LIST OF HGURES
2.12.22.32.42.52.62.72.8
3.13.23.33.43.53.63.73.83.9
4.14.24.34.44.54.6
5.15.2
Shinkamen NetworkPopulation Changes at the Prefecture LevelGifu-Hashima Shinkansen Station LocationGifu-Hashima Station DevelopmentShin-Yokohama Station LocationShin-Yokohama Station DevelopmentShin-Osaka Station LocationShin-Osaka Station Development
TGV NetworkLyon: Traditional City Center and Station Part-DieuNantes TGV Station and SurroundingsNantes TGV Station: View of North and South SidesNantes TGV Station: Northern SideNantes TGV Station: Southern SideSouthern Side of Station: Hotel/Office BuildingLu Factory Redevelopment SiteBank Office Building Complex
ICE and IC NetworkKassel-Wilhelmsh6he ICE Station LocationKassel-Wilhelmsh6he ICE Station and EnvironsDevelopment Complex at West End of StationDevelopment Along Wilhelmsh6he Allee West of StationParcel Under Development Behind Station
Califorrfia High-Speed Rail Network (Proposed)Major Economic Regions of Califomia
37
141517I82021
23263O323334353738
404344464849
5153
iii

SUMMARY
High-speed rail is the most visible form of new technology accompanying and enhancing the trans-formation to an information-based economy, and is likely to have the greatest spatial developmenteffects of any of these technologies. This report studies the development effects of high-speed railstations on behalf of the California Department of Transportation (Caltrans), which is currentlyconsidering the use of high-speed rail in California.
Since high-speed rail is a relatively new technology and is in use in only a few countries, the develop-ment effects of high-speed rail stations are somewhat difficult go discern and categorize° Nonethe-less, a review of the literature on its development effects in Japan, France, and Germany, and obser-vation of stations in the latter two countries, reveals significant development effects at the regional,urban, and station levels. These include changes to the following: population and employmentgrowth rates; ridership; business behavior; real estate values and activity; business and employmentlocation; and residential location. A review of related rail systems, heavy and commuter rail,reveals similar effects and opportunities for value capture.
The development effects of high-speed rail stations are most clearly associated with a strong regionaleconomy and good links with other transportation modes, especially rail links to the local city cen-ter and public sector support ofdevelopmento The presence of these factors can help provide theformation ofsignificam development activity around stations catering to the information-exchangesector, such as offices and hotels, the stimulation of retail activities in the area, and increases inoverall land value of approximately 20 percent. At the regional and urban levels, concentrationsof information-exchange sector employment and centers of higher education are associated withabove-average employment and population growth rates, as weU as access to high-speed rail.
In California, high-speed rail would reinforce existing population and employment patterns andfuture growth trends. In order to fully exploit station development opportunities and ensure rider-ship, the agency responsible for developing a high-speed raiI system in California must take anactive role in station area development and coordinate its activities with local transportationagencies.

1. INTRODUCTION
Conte.xt
High-speed rail is the most visible form of new technology accompanying the transformation
to an informationobased economy, and is likely to have the greatest spatial development effects of
any technology. Although the use of new technologies may reinforce existing urban cores, they
will nevertheless also have wide-spread effects at the local level.
As opposed to fax machines or electronic mail networks, which are ubiquitous and difficult
to measure, high-speed rail provides clear evidence of the effect of new technologies at the local
level. This effect can most easily be measured in terms of ridership and the development that
occurs around high-speed rail stations. Closer analysis can reveal the effect of high-speed rail on
population and employment, business behavior, real estate values, and business and residential
location, as well as revealing possibilities for value capture. Such analysis can also reveal those
planning strategies necessary to influence the effects of high-speed and value capture efforts.
The California Department of Transportation is currently examining the possible use of
high-speed rail in California, and the state legislature may authorize substantial funds for prelimi-
nary studies and engineering. This paper addresses those topics to be investigated in the prelimi-
nary studies concerning the development effects of highospeed rail and the possibilities for value
capture. In doing so, it also identifies planning strategies that must be pursued in order to take
advantage of development effects.
Questions
This paper addresses the following sets of questions:
1. What are the development effects of high-speed rail? What conditions are necessaryfor those effects? Are value increases created and can they be captured?
2. What development effects are expected with the introduction of high-speed rail inCalifornia? What can be done to control or take advantage of them?
The focus of this paper is on the development effects of a high-speed rail system at the regional,
urban, and station levels, with emphasis on the last. The primary effects analyzed are changes in the
foUowing: business behavior; real estate values; business and employment location; and residential
location. Other related effects of interest are changes in ridership, population and employment
growth, overall economic activity, and any public sector activity that affects development.
Methodology
The first set of questions is answered through a combination of literature review and case
studies. The focus here is on the Japanese Shinkansen, French TGV, and German ICE. The

second set is answered by extrapolating past experience to the situation in California, given
certain high-speed rail system characteristics and economic conditions.
Limitations
To date, little attention has been paid to the development effects of high-speed rail. This is
largely due to the relative youth of high-speed rail systems, the long time period required before
development effects are discernible, the difficulty in directly attributing these effects to high-speed
rail, and the apparent multitude of factors influencing development outcomes. As such, there is
only a limited amount of literature on the topic, and what does exist is not particularly well-organ-
ized or easily comparable.
If high-speed rail is defined as those systems operating daily at speeds of 150 mph (240
kmh) or greater, there are currently five high-speed rail systems: the Japanese Shinkansen (SKS),
the French Train/~ Grande Vitesse (TGV), the German InterCity Express (ICE), the Italian ETR-450,
and the Swedish X-2000. Because of the limited available information on development effects,
only the first three are analyzed here.
The two limitations noted above indicate that this topic is ripe for in-depth, comprehen-
sive, and comparable research. This paper merely sketches an outline of the kind of research that
should be pursued in the future on one of the most dynamic influences on development in the
20th century.
2. JAPAN AND THE SHINKANSEN
Shinkansen System
This section reviews the characteristics of the Shinkansen system, its development history,
and its effects at the national level. It sets the stage for the more in-depth regional, urban, and
station level analysis that appears in subsequent sections.
Characteristics
The Japanese Shinkansen (SKS) is the world’s longest-running high-speed rail system. The
first line, the Tokaido Line, opened in 1964 between Tokyo and Osaka (Figure 2.1). Since then,
three other lines have opened: the Sanyo Line (Osaka-Hakata), the Tohoku Line (Omiya-Morioka),
and thejoetsu Line (Omiya-Niiigata). The total Shinkansen network is currently more than 1,100
miles (1,800 kin) in length and connects 56 stations, but extensions to the system are under
consideration.
The Shinkansen network is served by two types of train: Kodama Express trains, which
stop at every station; and Hikari Super Express trains, which stop at selected stations. Reaching
speeds of up to 1713 mph (275 kmh) on advanced steel-wheel-on-rail technology (Taniguchi, 1992:
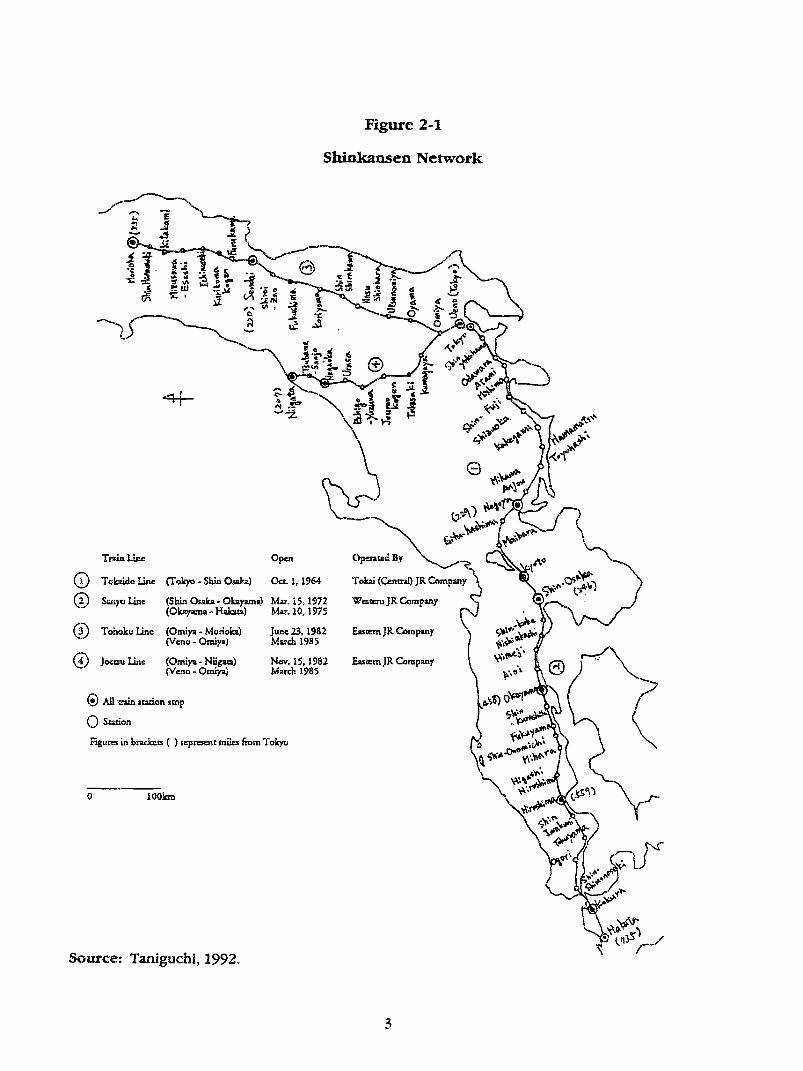
Figure 2-1
Shinkansen Network
®
®®®®
Open
Oct. 1, 1964
Mar. 15, !972Mar. I0, 1975
June 23, 1982March 1985
Nov. 15, 1982March 1985
0 100kin
Source:: Taniguchi, 1992.

2-4, 11, 18-21), and operating at minimum four-minute headways, as many as 290 Shinkansen
trains may run per day on the Tokaido line alone. In addition, the Shinkansen (as of 1979)
supported by a conventional rail network 12,600 miles (21,000 kin) long, with 28,000 trains per
day (Nishida, 1979: 13).
Background
With an area of only 145,800 sq mi (377,800 sq kin) and a population of almost 123 million,
Japan is one of the most densely populated countries in the world (Fischer Weltalmanach, 1990:
354). The region from Tokyo to Kobe, commonly called the Tokaido region, which contains only
16 percent of Japan’s land area, is the most important region in the country, for several reasons: it
contains 34 percent of the national population; it has seven of the ten cities with populations of one
million or more; it produces 60 percent of the national economic output; it carried 24 percent of
national passenger and 23 percent of national freight rail traffic; and its annual passenger and
freight rail growth rates average 1 percent higher than the national average of 6.1 percent and 4.1
percent, respectively (Nishida, 1979: 14).
By 1952, the conventional rail line between Tokyo and Kobe (the Tokaido Line) was
approaching capacity. In 1956, a commission was established to determine how to expand capa-
city on the line, and two years later the decision was made to build the Shinkansen (literally "new
trunk line") Tokaido Line, using standard gauge instead of the traditional Japanese narrow gauge.
Because of the 122 stations and 1,100 at-grade crossings on the existing line and the inability of
the existing line to handle the higher speeds of the Shinkansen (120 mph/200 kph vs. 95/160),
new alignment was chosen (ibid.: 16-17). In 1964, only six years later, the Tokaido Shinkansen
began operations.
The speed with which the new line was constructed exemplified the strength of Japanese
national planning as outlined in the Comprehensive National Land Development Act and the New
Long-Range Economic Piano The former was created in 1950 to coordinate land planning, provide
adequate infrastructure, and improve social welfare, while the latter was implemented in 1957 to
place emphasis on the construction of transportation and industrial infrastructure (Miyasawa,
1979: 262-265). Both provided powerful national economic and planning powers at the national
level and were influential in the construction of the Shinkansen Tokaido Line.
The two plans, like the plans which followed them, were particularly concerned about the
increasing concentration of population and economic activity in large metropolitan areas, which
had created substantial disparities between those areas and more isolated areas. Although this
concentration had substantial economic advantages, it created an increasingly stressful and polluted
urban environment. However, as the post-World War II economic recovery has subsided, as the
national economy and personal incomes have grown, and as economic concerns have been replaced
4

by quality-of-life concerns (ibid.: 268-272), such national planning powers have been scaled back.
One indication of this phenomenon is the resistance to new Shinkansen lines and complaints
about noise on existing lines (Taniguchi, 1992: 18; Kamada, 1979: 55).
Macro.Effects
The Shinkarisen was designed to supplement existing intercity transportation modes,
particularly from other rail lines and the airlines, and to reduce the time required to travel
between cities along its route. By those standards, it has been very successful. The f~rst
Shinl~msen, traveling at a maximum speed of 125 mph (200 kmh), reduced the travel time
between Tokyo and Osaka to four hours, saving 21/2 hours over the previous best time; today, with
trains ’traveling at a maximum speed of 170 mph (275 kmh), the trip takes less than 3 hours
(Amano et al. ,1991: 40; Taniguchi, 1992: 5). In addition, from 1965 to 1989, annual ridership
increu.sed from 31 million to 236 million, and annual passenger kilometers increased from 11
miUion to 66 million (Taniguchi, 1992: 4). Finally, in the first 11 years of operation, the
Shinkansen was estimated to have saved 2,246 million hours, the equivalent of one year of
standard working time for 1.22 million people (Sanuki, 1979: 234).
On the Sanyo Line (Osaka-Hakata), actual passenger traffic has exceeded estimates by
percent, with 23 percent diverted from airlines, 55 percent from other rail lines, and 6 percent
induced (Okabe, 1979: 110-112). The Shinkansen has proven to be particularly effective in compe-
tition with air at distances of up to 425 miles (700 kin) because of its more frequent service, lower
cost, easier station access, greater reliability, and increased safety (ibid.: 111-114; Sanuki, 1979:
235-237; Taniguchi, 1992: 15). "Erie majority of Shinkansen passengers travel 90-100 miles (150-
160 kin) per trip, though trips in the 45-60 miles (70-100 kin) range are becoming more common
(Sanuld, 1979: 230).
According to some students of the system, the Shinkansen has also had an image effect,
further strengthening the image of Japan as a nation of precision and reliability, not just one of
cherry blossoms, Mt. Fuji, and temples (Sanuki, 1979: 231).
Urban and Regional Development
The Shinkansen has had strong effects on Japanese regional and urban structure and func-
tions, although these effects have not always been consistent. Considerable attention has been paid
to the Shinkansen’s effect on the dispersion or concentration of population and economic activities.
Planning policy has been to disperse activities out of the urban cores, especially the Tokaido core
(Tokyo-Nagoya.Osaka), although it is not clear that the Shinkansen has helped bring about this goal.

Population
Nakamura and Ueda (1989) conducted a detailed analysis of the effect of the Joetsu and
Tohoku Shinkansen Lines on regional population between 1975 and 1985. Their analysis compared
population growth in 10 prefectures, six with one or more Shinkansen stations and four without,
with the national average (Figure 2.2). They categorized the prefectures on the basis of those with
an expressway and those without. The effect of an expressway was largely inconclusive at this
level: only three of the six prefectures with a Shinkansen station had higher population growth
than the national average, although none of the prefectures without the Shinkansen had growth
rates higher than the national average.
In order to improve the analysis, the researchers broke down the ten prefectures into 735
municipalities. At this level, they found significant population increases in municipalities with at
least one of the following characteristics: proximity to the prefecture capital or other regional
centers; location of a Shinkansen station within the municipality or a neighboring municipality;
and location of an expressway within the municipality or a neighboring municipality (Nakamura
and Ueda, 1989: 96).
Nakamura and Ueda (1989) conducted further analysis on the municipalities by aggregating
them into 104 "daily life regions," which were defined as the economic and daily life activity terri-
tories of households within the municipalities (ibid.: 97) (Table 2.1). There are a few interesting
results. For instance, of those regions with increased population, slightly more had the Shinkansen,
and of those regions that had a Shinkansen station, more increased in population (19) than
decreased (14). Also, there appears to be a high degree of correlation between the effect of the
Shinkansen station and the existence of an expressway, and it is interesting to note that in those
regions with an expressway but no station, there were more population decreases (16) than
increases (13), while in those regions with both a station and an expressway, there were more
increases (17) than decreases (10).
Finally, the data suggest that the Shinkansen station was the primary cause of population
increases, with the presence of an expressway enhancing the effect. However, there are few cases to
examine, so the relationship seems tenuous, and the results may have been influenced by the
manner in which the municipalities were aggregated into regions. Ultimately, then, it is unclear if
the Shinkansen station was leading growth or growth was leading the Shinkansen.
After determining the existence of a relationship between the Shinkansen, economic develop-
ment, and population, Nakamura and Ueda (1989) went on to conduct discriminant analysis on the
33 regions with Shinkansen stations in an attempt to explain the relationship between population
change and Shinkansen-related activities. This analysis revealed that the possibility of growth caused
by the Shinkansen could be predicted for a region with 90 percent accuracy. The analysis concluded
that there were three principal conditions needed for growth in a region: a high incidence of"infor-

Figure 2-2
Population Changes at the Prefecture Level
116~
114
112
108
!06
lO:g
102
|00
I10--
108
106
104
I02
100
ViLhout ShinkznsenI
-- Vith expressvzy National Tread.... Vithout ezpres3vay
~ AMASHIYAMACATA
( Populzt|on in "T5 = 100 )
Source: Nakamura and Ueda, 1989.
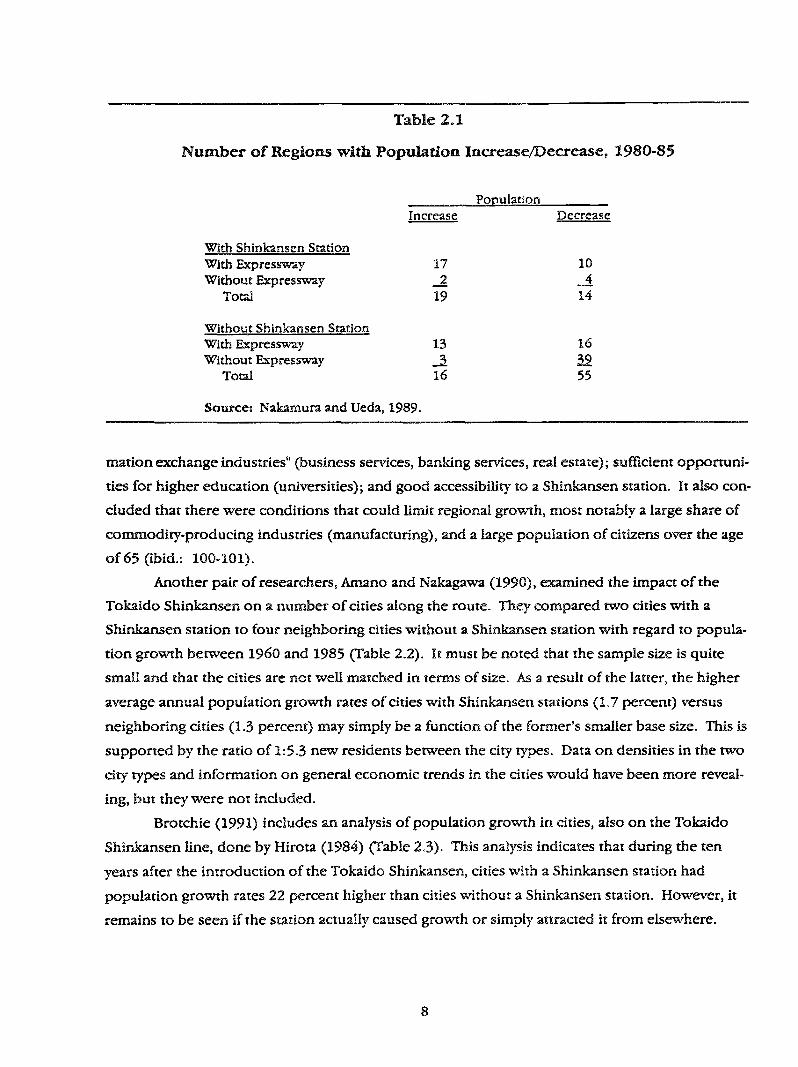
Table 2.1
Number of Regions with Population Increase/Decrease, 1980-85
PopulationIncrease Decrease
With Shinkansen StationWith Expressway 17 10Without Expressway ~
Total 19 14
Without Shinkansen StationWith Expressway 13 16Without Expressway _3_ 39
Total 16 55
Source: Nakamura and Ueda, 1989.
marion exchange industries" (business services, banking services, real estate); sufficient opportuni-
ties for higher education (universities); and good accessibility to a Shinkansen station. It also con-
cluded that there were conditions that could limit regional growth, most notably a large share of
commodity-producing industries (manufacturing), and a large population of citizens over the age
of 65 (ibid.: 100-101).Another pair of researchers, Amano and Nakagawa (1990), examined the impact of the
Tokaido Shinkansen on a number of cities along the route. They compared two cities with a
Shirlkansen station to four neighboring cities without a Shinkansen station with regard to popula-
tion growth between 1960 and 1985 (Table 2.2). It must be noted that the sample size is quite
small and that the cities are not well matched in terms of size. As a result of the latter, the higher
average annual population growth rates of cities with Shinkansen stations (1.7 percent) versus
neighboring cities (1.3 percent) may simply be a function of the former’s smaller base size. This
supported by the ratio of 1:5.3 new residents between the city types. Data on densities in the two
city types and information on general economic trends in the cities would have been more reveal-
ing, but they were not included.
Brotchie (1991) includes an analysis of population growth in cities, also on the Tokaido
Shinkansen line, done by Hirota (1984) (Table 2°3). This analysis indicates that during the
years after the introduction of the Tokaido Shinkansen, cities with a Shinkansen station had
population growth rates 22 percent higher than cities without a Shinkansen station. However, it
remains to be seen if the station actually caused growth or simply attracted it from elsewhere.

Table 2.2
Population of Cities with Stationsand Neighboring Cities with Stations
ShinkansenYear Chan~e
Station
Total
City _ 1960 1985 Absolute Percent
41,438 59,760 18,32262~966 99,600
104,404 159,360 54,956
Neighboring
Total
12
1 102,478 145,910 43,4322 142,609 210,490 67,8813 182,984 257,388 74,4044 304.492 411,743 107 251
732,563 1,025,531 292,968
Source:: Amano and Nakagawa, 1990.
44.258.2
52.6
42.447.640.735.2
40.0
Rate
1.5%1.8%
1.7%
1.4%1.6%1.4%1.2%
1.3%
Table 2.3
Change of Population and Economic Indicesin Cities on Tokaido Line
(i)Annual Increase
Index
Pre-Shinkansen Post-Shinkansen(AI) (B 1) (C 1) (A2) (B2) (C2)
With Without With WithoutStation Station A1/B1 Station Station A2/B2
Population 2.64 3.39 0.78 1.88 1.55 1.22Retail 10.10 13.50 0.75 9.96 8.58 1.16Wholesale 12.90 20.80 0.62 11.63 8.70 1.34Industrial(2) 13.70 14.20 0.97 9.48 7.81 1.21Construction(3) 13.80 14.90 0.93 8.01 6.37 1.26
O) Annual increase is the average of the ten yearsthe Shinkansen (1964). The period followingnational economic stagnation.
(2) Industrial production in area.~3) Construction in area.
Notes
Source: Brotchie, 1991 (based on Hirota, 1984).
preceding and following the introduction ofintroduction is lower overall because of
9
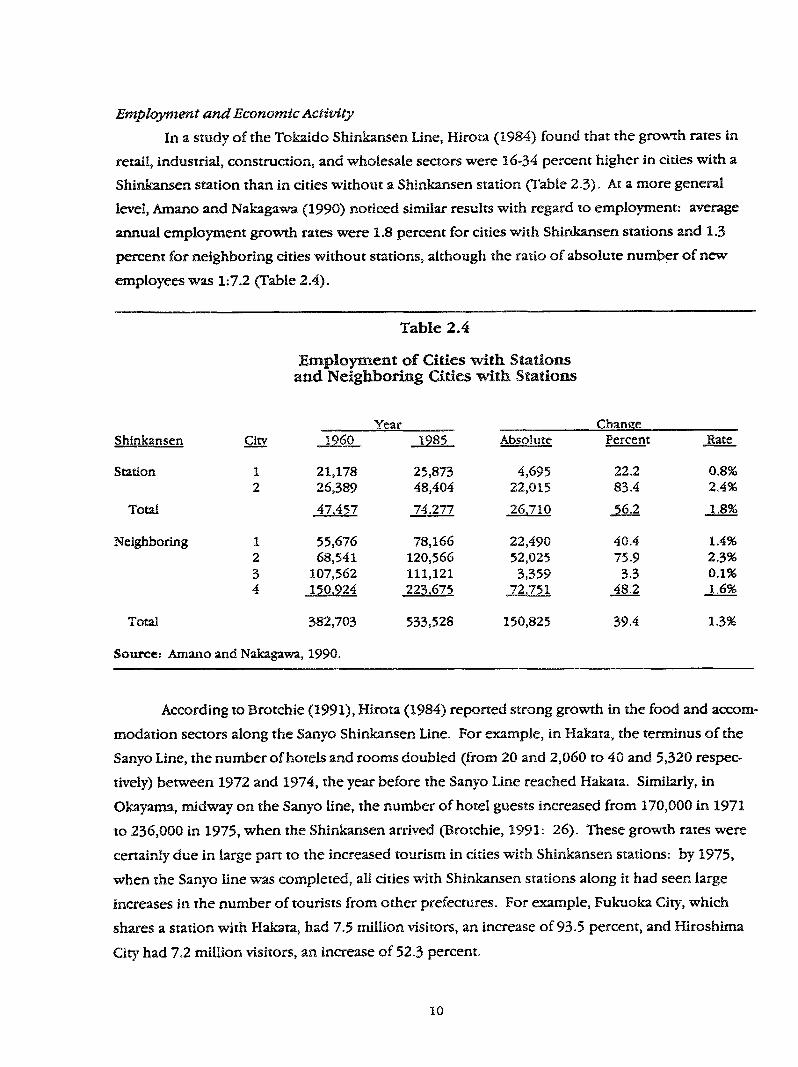
Employment and Economic Activity
In a study of the Tokaido Shinkansen Line, Hirota (1984) found that the growth rates
retail, industrial, construction, and wholesale sectors were 16-34 percent higher in cities with a
ShinAmnsen station than in cities without a Shinkansen station (Table 2.3). At a more general
level, Amano and Nakagawa (1990) noticed similar results with regard to employment: average
annual employment growth rates were 1.8 percent for cities with Shinkansen stations and 1.3
percent for neighboring cities without stations, although the ratio of absolute numb.er of new
employees was 1:7.2 (Table 2.4).
Table 2.4
Employment of Cities with Stationsand Neighboring Cities with Stations
ShinkansenYear Change
City ~ 1985 Absolute Percent Rate
Station
Total
1 21,178 25,873 4,695 22.2 0.8%2 26,389 48,404 22,015 83.4 2.4%
47,4~7 74.277 26,710 ~ 1.8%
Neighboring 1 55,676 78,166 22,490 40.4 1.4%2 68,541 120,566 52,025 75.9 2.3%3 107,562 111,121 3,359 3.3 0.1%4 ~ 229,675 72,751 .48.2 1.6%
Total 382,703 533,528 150,825 39.4 1.3%
Source: Amano and Nakagawa, 1990.
According to Brotchie (1991), Hirota (1984) reported strong growth in the food and accom-
modation sectors along the Sanyo Shinkansen Line. For example, in Hakata, the terminus of the
Sanyo Line, the number of hotels and rooms doubled (from 20 and 2,060 to 40 and 5,320 respec-
tively) between 1972 and 1974, the year before the Sanyo Line reached Hakata. Similarly, in
Okayama, midway on the Sanyo line, the number of hotel guests increased from 170,000 in 1971
to 236,000 in 1975, when the Shinkansen arrived (Brotchie, 1991: 26). These growth rates were
certainly due in large part to the increased tourism in cities with Shinkansen stations: by 1975,
when the Sanyo line was completed, all cities with Shinkansen stations along it had seen large
increases in the number of tourists from other prefectures. For example, Fukuoka City, which
shares a station with Hakata, had 7.5 million visitors, an increase of 93.5 percent, and Hiroshima
City had 7.2 million visitors, an increase of 52.3 percent.
10

However, some cities along the line without a Shinkansen station saw a decline in the
number of visitors, notably Onomuchi City, which experienced a decline of 9.0 percent. In addi-
tion, ~he number of visitors staying overnight declined in some cities with Shinkansen stations, as
tourists decided to make only day trips (Okabe, 1979 116-118). It should also be noted that
effects similar to these were occurring along the Tokaido Line (Kamada, 1979: 47). In sum, what
all of these figures seem to indicate is that although the Shinkansen might have directed existing
tourist activities, it did not necessarily induce new tourist activities.
Another indication that the Shinkansen might not have been effective in directing activities
was the trend in retail and wholesale activity. Although there were increases in retail and whole-
sale activity in cities with a Shinkansen station (Brotchie, 1991; Hirota, 1984; Nakamura and Ueda,
1989; ".rod Okabe, 1979), in only two cities with stations was there a rise in retail sales of more
than 10 percent in the year following the 1975 opening of the Sanyo line (Okabe, 1979: 123).
Furthermore, growth was concentrated in those shopping centers near the station, to the detri-
ment of other shopping centers in the city (ibid.: 125). In addition, wholesale activities became
increasingly concentrated in the existing centers (Osaka, Fukuoka City, and Hiroshima City),
the detriment of smaller wholesale centers, particularly those in cities without a Shinkansen
station (ibid.: 126-128).
After discerning an apparent but tenuous relationship between the presence ofa Shinkansen
station and population growth along theJoetsu and Tohoku Shinkansen lines, Nakamura and Ueda
(1989) analyzed the relationship between the station and economic changes in regions that experi-
enced population growth during the period 1981-85. They noted four effects. First, per capita
income growth increased significantly relative to the total average in regions with either a Shinkan-
sen station (2.6 percent), an expressway (6.4 percent), or both (9.5 percent); it decreased
percent) in regions with neither (ibid.: 99). Second, the number of employees in the retail sector
increased relative to the total average in regions with just a station (0.4 percent), just an expressway
(1.2 percent), or both (2.8 percent); it declined (-3.6 percent) in regions with neither (ibid.:
Third, the growth of employees in "information exchange industries" increased significantly more
in regions with a Shinkansen station and an expressway (22 percent) than in those with only
expressway (7 percent) (Table 2.5). Fourth, the highest land prices in the commercial area
regions served by the Shinkansen increased 67 percent, while those in regions served by just an
expressway increased 42 percent (ibid.).
Nakamura and Ueda’s work (1989) provides evidence that the Shinkansen, like similar trans-
portation systems, does not cause growth, but allows it to disperse from existing centers, even as it
concentrates growth around locations with access to the transportation system. The fact that growth
is stronger when both the Shinkansen and an expressway are present is especially convincing. Free-
ways (¢~pressways) have long been known for allowing population and employment to disperse

Table 2.5
Information Exchange Industries Employ’men, Growth (Percent)in Regions with Population Increase, 1981-85
Business Services (Total)Information, Investigation, Advertising ServicesR & D and Higher EducationPolirlcal InstitutesOther
Banking ServicesReal Estate Agencies
Shinkansen & ExpresswayOnly (%)
42 12125 6327 2120 1157 2827 2821 _.~
Total 22 7
Source: Nakamuraand Ueda, 1989.
from existing centers (witness the suburbanization of the United States) and converge around loca-
tions with good freeway access (highway interchanges and urban ring roads). The Shinkansen line
allowed the growth of population, employment, and economic activities to shift out of existing
centers to sub-centers. At the same time, it concentrated this growth and growth indigenous to
the sub-center around locations with access to the Shinkansen.
The Shinkansen’s apparent ability to cause growth is probably derived from its routing.
Since the system was apparently designed to serve regions experiencing or expected to experi-
ence growth, a self-fulfiUing prophesy, developed: growth was dispersed from existing centers to
sub-centers, and indigenous growth in the region was attracted to the sub-center by the growth
taking place there. Not all growth occurred that way; there was certainly some growth above and
beyond that dispersed and attracted from other locations, created by the synergistic economies
that form at locations where growth concentrates. However, the relative importance of such
growth is uncertain.
Station Development
With the start of operations between Tokyo and Shin-Osaka in 1964, the Tokaido Shinkansen
line had 12 stations. Three of these stations were completely new and located on the periphery of
the city, and therefore were excellent test cases for the impacts of the Shinkansen. The other sta-
tions were located in the traditional center of the city, and were already served by intercity rail and
local rail transit services. The following sections review Amano and Nakagawa’s 1990 findings of
12

the effect of the Shinkansen on population and employment, and on development at existing and
new stations.
Existing Station Locations
There were no significant development impacts in cities where Tokaido Shinkansen stations
were built within existing intercity rail stations (Amano and Nakagawa, 1990: 48). Given the scale
of rail operations in Japan, this finding is not surprising. For example, the Osaka station, which is
not served directly by the Shinkansen, was at the convergence of the JNR Tokaido line and two
other major intercity lines (Osaka loop and Fukuchyama line), and bordered two municipal rail
line stations. More than 2,000 trains arrived and departed each day, carrying 600,000 passengers
to and from the station (Goto, 1986). With such high existing levels of service and ridership, the
impact of the Shinkansen on development at such train stations was likely to be limited.
In Hamamatsu, Nagoya, and Kyoto, where a Shinkansen station was located in or near the
existing city center and attached to an existing station, development was shifted within the city
center toward the station (Amano and Nakagawa, 1990: 48). It seems clear in those cities that
although development would have occurred without the introduction of a Shinkansen station, the
station did affect the location of new development.
New Station Locations
Three new stations were opened with the introduction of the Shinkansen in 1964: Gifu-
Hashima, Shin-Yokohama, and Shin-Osaka. The first station was served only by Kodama Shinkar~sen
trains, which stop at every Shinkansen station on the line, while the other two were served by both
Kodama and Hikari Shinkansen, which provide express service between major stations. These three
stations have provided an excellent opportunity for before-and-after comparisons of development,
particularly in light of planning policies toward development and transportation system linkages.
Gifu-Hasbima Station
The Gifu-Hashima station, located in a rice paddy about nine miles (15 km) from the
center .of the City of Gifu, was intended to be a major gateway for intercity travelers entering the
city. However, because the trip to the city center takes about 30 minutes by car and the trip by rail
requires a stop in Nagoya, which also has a Shinkansen station (Figure 2.3), ridership peaked
just ovx~r 8,000 persons per day in 1974 and has dropped down to about 7,000 persons per day
since then (ibid.: 55, 57-58).
Despite optimistic predictions, there has been relatively little development at the station
since it opened almost 30 years ago (Figure 2.4). There are a number of warehouses, restaurants,
entertainment centers, and toll parking lots near the station, but it still seems like a remote loca-
tion. Two factors appear to be responsible for this impression. First, transportation service to the
13
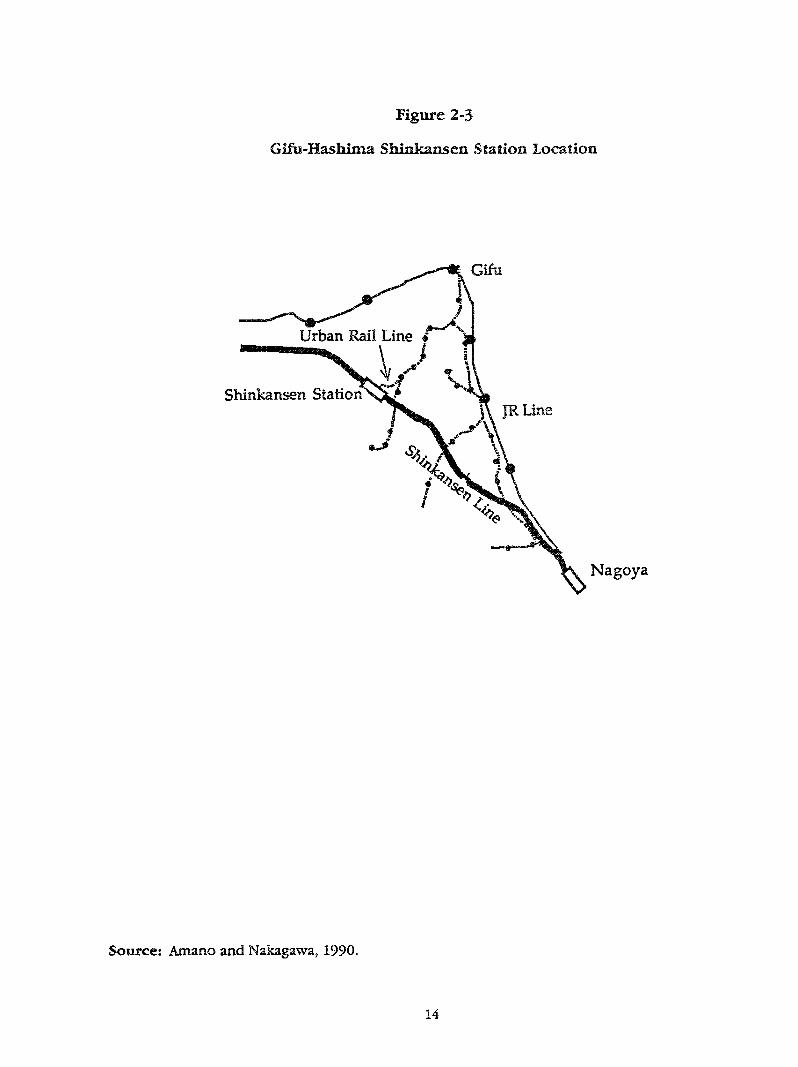
Figure 2-3
Gifu-Hashlma Shinkansen Station Location
Gifu
Urban Rail Line g
ShinkansenJR Line
Nagoya
Source: Amano and Nakagawa, 1990.
14

Figure 2-4
Gifu-Hashima Station Development
Prior to Station Construction
Present Situation
!1..."
Source: Amano and Nakagawa, 1990.
15

city center has not been improved. The first attempt, a new urban rail line, was not introduced
until 1982, ten years after the station opened. The new line has had no effect because the existing
service via Nagoya, although longer in distance and time, has higher frequencies (ibid.: 57-60).
This problem is reinforced by the fact that both the express Hikari and the local Kodama trains
stop at Nagoya, while only the local trains stop at Gifu-Hashima; thus, long-distance Shinkansen
travelers can bypass Gifu-FIashima for Nagoya.
The second factor contributing to the sense of isolation at the station is the land specula-
tion that has occurred, apparently discouraging many developers 0bid.: 57-58). One result is that
residential commuters are using increasing amounts of the area around the station for parking.
All this is occurring even as Hashima, unlike other cities of its size (100,000), gains population
and employment and seems to offer the promise of strong development pressures (ibid.: 60).
would appear that poor planning is causing these development pressures to go elsewhere, when
they would probably be best served by Gifu-Hashima.
Shin-Yokohama Station
The Shin-Yokohama station is located about four miles (seven kin) north of the city center in
area of undeveloped hills, and is connected by a JR branch rail line to the center of Yokohama
(Figure 2.5). However, the trip to the city center on the JR line was about 30 minutes because
the low frequency of service and the need for a transfer en route, and after a peak of 15,000 in
1974, ridership only averaged about 10,000 per day for the next decade. Ridership jumped to
27,000 in 1989, however, giving the station the highest ridership increase of any Shinkansen
station since the system’s introduction in 1964 (ibid.: 50-51, 53).
Three reasons are cited for the jump in ridership. First, an underground municipal rai|way
was built, linking the station to Yokohama’s city center and reducing journey times to 12 minutes.
The frequency of service on the existing JR Yokohama line was also boosted. These improvements
in service made the Shin-Yokohama station one of the main entrance points to the city. Second,
some of the express Hikari Shinkansen began to stop at the station, supplementing the local Kodamao
By 1990, 48 of the 105 Hikari trains in Japan called on Shin-Yokohama daily (ibid.: 52-53). Finally,
heavy development of the area around the entrance of the station led to the formation of a new city
center (ibid.: 54).
The role of planning in allowing and encouraging development at high-speed rail stations is
illustrated by a comparison of the north and south sides of the station. Both sides were designated for
development, but because of resistance from residents on the south side, only the north side has fol-
lowed through with their plans. As a result, the north side now has a modern road network and numer-
ous new buildings, while the south side remains undeveloped (Figure 2.6). This contrast points to the
value of long-range planning before and after the introduction of high-speed rail stations (ibid.: 55).
16

Figure 2-5
Shin-Yokohama Shinkaxtsen Station Location
ShinkansenStation
Shinkansen dLine
Z
Underground "_
~~..,.Railway ;
JR Branch Line
Yokohama City Center
Source:: Amano and Nakagawa, 1990.
17

Figure 2-6
Shin-Yokohama Station Development
Immediately After Station Construction
Station:
Present Situation
Source: Amano and Nakagawa, 1990.
18

Shin-Osaka Station
The Shin-Osaka station is located about 3.5 miles (six km) from the center of Osaka and
was linked to it upon the opening of the Shinkansen by a JR line and an underground municipal
railway (Figure 2.7). Ridership peaked at over 11,000 per day in 1975 and has since leveled off
just under 10,000 passengers per day (ibid.: 60-62).
Although the station is near Osaka’s city center, development around it was initially limited
because the area is separated from the city by the River Yodo. In recent years, however, develop-
ment has been strong around the station, primarily because of several planning strategies (Figure
2.8). First, large-scale development projects were initiated around the station. Second, as men-
tioned above, excellent transportation linkages to the city center were opened at the same time as
the Shinkansen station. Third, a large new town was developed at the terminus of the municipal
railway north of the station (ibid.: 62-65).
Sutnmcary
The Shinkansen has had strong development effects in Japan at the regional, urban, and
station levels. Regions served by the Shinkansen generally have higher population and employ-
ment growth rates than those without direct Shinkansen service. These higher growth rates are
positively associated with three factors: a high incidence of"information exchange industries"
(business services, banking services, real estate); sufficient opportunities for higher education
(universities); and good accessibility to a Shinkansen station. In addition, the combination of
expressway and the Shinkansen had an especially strong effect on growth rates. There are also
two factors that seem to limit growth: a large share of commodity producing industries (manufac-
turing), and a large population of citizens over the age of 65.
However, what remains unclear is the direction of causation: does the Shinkansen cause
the increases in growth rates, or is it constructed in regions that are already increasing and thus
simply concentrates growth within those regions? The latter explanation seems more likely,
although detailed analysis of route planning policies and growth rates would be necessary to
provide a definitive answer.
At the urban level, the Shinkansen’s correlation with population and employment growth
rates increases is clear. Although rates vary between studies, population and employment growth
rates were consistently greater in areas with Shinkansen service than in those without. Employ-
ment growth and development activity were especially strong in the information exchange sector,
as well as the hotel and food service sectors. Although there was also increased growth in the
retail and wholesale sectors, there is evidence that these were merely shifts within communities,
not general growth. This last observation lends further support to the theory that the Shinkansen
has se~ed to shift growth, not induce it.

Figure 2-7
Sh/n-Osaka Shinkansen Statiotl Location
~ottrce: Amano and Nakagawa, 1990.
2o

Figure 2-8
Skin-Osaka Station Development
Immediately After Station Construction
Present Situation
Source:: Amano and Nakagawa, 1990.
21

At the station level, development has varied. The expansion of existing stations for Shinkan-
sen service has had little or no effect on development around the station. At the new stations built on
the fringes of existing communities, development was found to be highly dependent on the provi-
sion of good transportation links to the new station-- especially rail transportation from the existing
urban center --and on planning policies that encouraged development and resisted speculation.
The only reference to land value increases was made by Nakaraura and Ueda (1989), who
found that land prices in the commercial areas increased 67 percent when served by the Shinkansen.
No information was found on value capture. However, given the scale of Japanese rail operations,
value capture is likely to be quite extensive. A review of the development effects of Japanese heavy
and commuter rail confirms this supposition.
3. FRANCE AND THE TGV
TGV System
The French Train ~ Grande Vitesse (TGV) has been in operation in France for more than
ten years. There are currently two TGV lines: the TGV Southeast line (Paris-Lyon) and the TGV
Atlantic line (Paris-Le Marts/Tours) (Figure 3.1). The network is a mix of high-speed dedicated
track and upgraded track, totaling 2,920 miles (4,702 kin) in length. On the 436 miles (702 kin)
of dedicated track, trains run at speeds of up to 186 mph (300 kml~), while on the remainder
the network trains run at a maximum of 136 mph (220 kmh) (Hall et al., 1992: Table 2.1; Streeter,
1992: 24).
Since the introduction of the TGV, there have been definitive signs of its development
effects. Planning, Economic and Development Consultants (Pieda), a British firm retained
British Rail to compare the impacts of four alternative high-speed rail routes linking the Channel
Tunnel with London, has conducted an extensive review and analysis of the literature on the
development effects of the TGV (Pieda, 1991). Its analysis is based on the following sources:
Bernadet, 1988; Bonnafous et al., 1981; Buisson, 1989; Cointel-PineU and Plassard, 1986; Gac,
1990; Le Monde, 1990; Plassard, 1990, 1989, 1987a, 1987b. Pieda’s information is combined with
other English- and French-language literature, as well as a site visit to Nantes.
TGV Southeast
The TGV Southeast (Paris-Lyon) has been in operation since 1981 and currently serves
cities with non-stop or one-stop service to Paris (Figure 3.1). The line connects the two strongest
economic regions of France, Paris and the Rhone.Alps region, and ridership is very high, with
farebox revenues more than covering its costs°
22

TGV Southeast
TGV Atlantic
Figure 3-1
TGV Network
Brest Morlaix
Quire
Le CrolLe
St Naza
La Ro
Bor
Bayonn(Biarrltz
Hendsye
TGV-Nordieuc
Rennes Le ~ARIS-Montparnasse
hAtellerttu|t = - -
Poitiers High Speed Line
oulSme Line in ServJoe
Libourne Being Electrified
AgenMontauban
Toulouse
irbe8
Source: Bormafous, 1987; Streeter, 1992.
23

Since 1979, several agencies have examined the socioeconomic impacts of the TGV South-
east: the Laboratoire d’Economie des Transports (LET); Societe Nationale des Chemins de Fer
(SNCF or French National Railways); DATAR (Regional Planning); and the Ministry of Transport
(INRETS and OEST). Their focus has been on service industries, centralization, tourism, and
business location and development (Pieda, 1991: 15). After a brief review of the first three
subjects, this section will conduct a more in-depth analysis of business location and development
impacts, with emphasis on several specific examples.
Services, Centralization, and Tourism
The largest increase in ridership after the introduction of high-speed rail services between
Paris and Lyon was in business iourneys related to the sale or purchase of services. While total
business journeys increased 56 percent, those related to the trade of services jumped by 112
percent (Pieda, 1991: 18).
Before the TGV Southeast began service, it was feared that Paris-based service sector com-
panies would expand their operations and displace those based in the Rhone-Alps region (around
Lyon). In fact, as Rhone-Mps companies-- particularly medium-sized firms-- have expanded into
the Paris market, the opposite appears to have occurred. In addition, the fear that Lyon-based ser-
vice companies and head offices would relocate to Paris has also been unsubstantiated. However,
as companies attempt to expand into the international market, this fear may eventually be realized
0bid.).
Tourism underwent two contradictory changes: there were fewer overnight stays, but
there were also new travel packages for users of the TGVo The former was the result of an increase
in the number of same-day return trips, while the latter was a function of increased promotion by
areas along the line. Winter tourism apparently was not affected by the TGV (ibid.: 19).
Business Location and Development
Surveys of managers assessing the [ink between the TGV and the location of businesses
were conducted in ten cities in the Rhone-Aips and Burgundy regions. These assessments were
conducted only two to three years after the introduction of high-speed rail services and during a
regional economic depression, so longer term impacts might be of greater magnitude, particularly
given better economic conditions (Pieda, 1991: 19).
The TGV was only one factor considered by businesses in the decision to locate in a town
or city, and no business relocated primarily because of TGV service. Other important factors
included the profitability of the company, proximity to the market, the complete transportation
network (including road and rail links), and public sector assistance (site identification, site provi-
sion, and/or facilities assistance).
24

Only three new stations were built along the TGV Southeast line: Lyon Part-Dieu, Le
Creusor, and Macon. Of the three, only Lyon Part-Dieu was the site of significant economic devel-
opment. The three stations and the reasons for the success or failure of their development are
examined in detail below.
Because development in Lyon’s traditional downtown is constrained by rivers, Part-Dieu
was promoted as part of a standing policy by local authorities (Figure 3.2). As a result, the area
around the TGV station is now the most sought-after location for office space in Lyon: it has almost
40 percent of the city’s total office space, and in 1990 it had 60 percent of the city’s planned office
project.,;. From 1983 to 1990, office space around the TGV station rose from 1,883,000 sq ft
(175,000 sq m) to 2,702,000 sq ft (251,000 sq m), a total increase of 43 percent and an annual
increase of 5.2 percent. According to local property agents, there are four factors responsible for
the strong growth: easy access to and from the station by foot; convenience for customers; a
steady flow of businessmen through the district; and high visibility of the firms from the TGV
trains (ibid.: 21-22).
Based on the previous observations, it seems that the impact of the TGV is limited to a
relatively small area of Lyon near the station, and is limited thereof mainly to advanced service
firms that require good access to Paris. It also seems that much of the new development is leased to
firms that have simply relocated from the traditional downtown, not to newly formed or attracted
firms. Moreover, it has been suggested that much of the economic activity has been the result of
joint ventures between the public and private sector, in the form of financing for construction and
redevelopment (ibid.: 21-22). The specifics of such financing is not given in the literature.
The town of Le Creusot provides an example of a new TGV station that has failed to stimu-
late development. The town, located in a region undergoing economic restructuring because of
the closure of local coal mines, had hoped to capitalize on its access to Paris to stimulate industrial
growth. However, in 1990, six years after the TGV began service and reduced the travel time from
Paris to 85 minutes, only two firms, both marginal, had located near the isolated TGV station. The
main reasons for the weak development impact of the TGV seem to be a general lack of demand
for new development, the isolated station location, and the station’s poor road access and image
(ibid.: 20).
TGV Atlarttic
Operations on the TGV Atlantic line between Paris and Le Mans were only begun in 1989
(Streeter, 1992: 6) (Figure 3.1), so there are few studies about the line and few detectable develop-
ment impacts. In the future, however, development impacts will be better recorded because of
extensive pre-TGV studies made along the route. Property development subsidiaries of SNCF and
25

Figure 3-2
Lyon: Trad/tional City Center and Star/on Part-Dieupr
\
Source: Lan Uide Lay, 1967.
26

local attthorities have taken an active role in promoting development near the TGV Atlantic sta-
tions, and preliminary studies of Le Marts, Vendome, and Nantes indicate their apparent success.
Le Mans
One year after the TGV Atlantic put Le Mans only 55 minutes from Paris, the City of Le
Marts already had an active and diverse development program to promote the area around the
station. A new business center with 108,000 sq ft (10,000 sq m) had already leased half of its
space to an insurance company, 21,500 sq ft (2,000 sq m) to the local economic development
agency for new industry, and 28,000 sq ft (2,600 sq m) to the second-largest dairy company
France. By the end of 1991, an additional 237,000 sq ft (22,000 sq m) were to be provided. A new
technol[ogy center is also planned near the existing university and has already attracted the new
European Institute of the Musical Profession, with 350 trainees. The Institute chose Le Marts in
part because of the TGV, but also because of a new highway linking it in 1996 with Belgium and
the rest: of northern Europe. General economic indicators are also very strong in Le Mans: the
number of transactions of raw land and building sites doubled in three years; land prices doubled
from $82.07 to $164.14/sq ft (FF5,000-10,000/sq m) in four years; and apartment prices rose from
$9.52 to $18.06/sq h/year (FF580-1,100/sq m/year) in three years.1 However, the TGV is viewed as
a catalyst to this development and economic activity, not its main cause or even a critical element
(Pieda, 1991: 22-23).
Vendome
Vendome was an unknown village before the TGV Atlantic reduced its time to and from
Paris to 42 minutes, down from 2 hours 15 minutes. Within three years, the price of property in
the town had increased 35 percent and real estate exchanges had increased 22 percent. A new
business park with 370 acres (150 hectare) was scheduled to open in September of 1991 and
expected to include a European graphics industry research and training center. All of this activity
has sparked fears that the town will become a commuter suburb of Paris, for those able to afford
the monthly $357 (FF2,000) fare (ibid.: 23).
Nantes
This section details the development effects observed during a visit to Nantes, located on
the TGVAtlantic, in January 1992. Prior to the TGVAtlantic connection to Nantes, an extensive
study was conducted to create a baseline against which to examine the impacts of the TGV Atlantic
over time. The study will allow changes in the following property and urban form factors to be
tracked: economic activities by type, location, and intensity; property values and rents; and
XPrices calculated using an exchange rate of $1 = 5.66 French Francs (New York Times, 1992).
27

development programs and projects (Gac and Paumier, 1990: 8). Although it is still too soon
conduct meaningful comparisons with the baseline, anecdotal evidence suggests that the TGV is
having a substantial impact on development in Nantes.
Background
Nantes, 230 miles (380 km) from Paris on the northwestern coast of France, is France’s
seventh largest city and the political and economic center of the Pays-de-Loire region. The city
had a population of 232,000 in 1988 (Gac and Paumier, 1990:11), while the greater metropolitan
area had a population of 500,000 (Audic, 1992). Nantes has u growing and diverse economy,
specializing in food processing, materials research and manufacturing, electronics, data proces-
sing, medical research, and finance. In France it is second only to Toulouse in high-technology
industries (Audio, 1992).
The opening of TGV Atlantic service in 1989 reduced rail travel times between Paris and
Nantes from three hours to one hour, 59 minutes. Automobile travel time is three hours, 30
minutes. Nantes is currently served by three highways, and it will soon complete a 42 km ring
road and expand its two existing tramlines (ibid.).
Nantes has an active economic development program that assists existing and start-up
companies and is actively involved in the redevelopment of land around the TGV station. Existing
companies interested in expanding or relocating to Nantes are provided with assistance in locating
sites and with the planning process. They may also participate in redevelopment activities around
the station, as discussed below. Start-up companies may qualify to begin operations in one of the
60 incubator spaces the city has at six locations throughout the city; these spaces offer rents
approximately 25 percent below the city-wide average of $9.03-10.66 sq it/year (FF550-650/sq m/
year), as well as shared business services (ibid.).
Urban Effects
According to Phillipe Audic (1992), the Managing Director of the Nantes Development
Department, the TGV has had three types of effects on the city: qualifying, image, and direct. The
qualifying effect springs from the improved connection between Paris and Nantes: reduction of
the travel time between Nantes and Paris to two hours qualifies it for consideration by businesses
for location, expansion, or relocation. This notion is especially important for international
companies.
The image effect relates to the TGV’s style and service: sleek, smooth, fast, and exciting.
All of the stations have been architecturally updated with wave- and sail-Like detail work that
reflects the network’s connection to the Atlantic Ocean and its smooth modernity. In addition,
because the train itself is a technical and commercial success, it has an "osmotic" effect on the
cities it serves, invigorating them with promise and vitality. Before the TGV, Nantes had never
28

advertised itself, as many cities now do, as a prime location for economic development. Now it
actively courts companies and takes steps to assist them in locating to Nantes.
The direct effects of the TGV are the reduced travel time, guaranteed arrival, lower travel
costs, increased productivity, and the cumulative effects of the decision by businesses to locate in
Nantes.
Business Behavior
Although it is still too early to test fully the impact of the TGV Atlantic on business location
decisions, preliminary information indicates that the TGV plays a large role in the decision of busi*
nesses to locate in Nantes. The Waterman Company, a producer of writing instruments sold world-
wide, recently relocated its headquarters from Paris to Nantes, despite the fact that construction of
a new headquarters in Nantes cost the equiw-alent of two years’ rent in Paris. Its manufacturing
plant, x~th 1,000 employees, was already in Nantes, and the company had indicated that it could
conduct its sales and marketing activities in Paris and beyond with the use of the TGV connections
to Paris. Other companies relocating from Paris include Sonye du Val d’Electricite, an electrical
transformer manufacturing company with 150 employees (with plans to add 50 more). The
company considered only cities on the TGV network for relocation. Similarly, a large insurance
company with 100 employees that is relocating to Nantes considers the TGV vital to maintain
contact with Paris (ibid.).
However, not all of the TGV’s effects are beneficial. Arthur Anderson France had intended
to local:e a regional office with 100 people in Nantes, but then realized it could serve the regional
market from Paris. This is not the only reverse impact: some medium-sized French companies
which had been located in small towns in the countryside are beginning to relocate to cities served
by the TGV. This has an especially disruptive impact on the small towns, which have come to rely
on the companies as their major or only source of income. SNCF is attempting to counteract this
problem by improving service to towns that have rail service to cities served by the TGV (ibid.).
Station Development
Name’s TGV station is located in the heart of the city, about ¼ mile (0.5 km) from the city
center, which is northwest of the station (Figure 3.3). The railway runs through Nantes from east
to west:, paralleling the Loire River. The station is about ¼ mile (0.5 km) north of the river and
almost connected to it by a canal (Canal St. F~lix) running from the Loire to the western edge
the statiion. To the north of the station is a residential district. Buildings here are four to five
stories in height, with some offices and ground floor retail. To the south and east appear to be
former manufacturing districts, now dominated by offices, some five to six stories in height. To
the somhwest of the station is a former manufacturing district that borders a mixed residential
29

Figure 3-3
Nantes TGV Station and Surroundings
Center
-, ; °"
Loire River ~
Source: Gac and Paumier, 1990.
30
and light manufacturing district. This last area is the focus of major redevelopment efforts and is
discussed in detail below.
The station itseff is divided into a northern and southern side, with the tracks between
them and an underground passageway making it possible to reach the four platforms (Figure 3.4).
The noJrthern side is the city’s traditional train station, with a long two-story building housing
various railway passenger functions and an eight-story SNCF office building to the east (Figure
3.5). ~here is also a large five-story parking structure to the west of the station’s north side (esti-
mated ,100 spaces). This side of the station is served by a main east-west road and tram line.
There are numerous small hotels, restaurants, cafes, and small retail stores lining the northern
side of the road°
As its architectural design indicates, the southern side of the station is new and was built
specifically for the coming of the TGV. It is dominated by a large entrance hallway on the south-
west corner of the station that contains passenger service functions (Figure 3.6). Stretching to the
west of this is a long one-story structure that also contains passenger service functions and a large
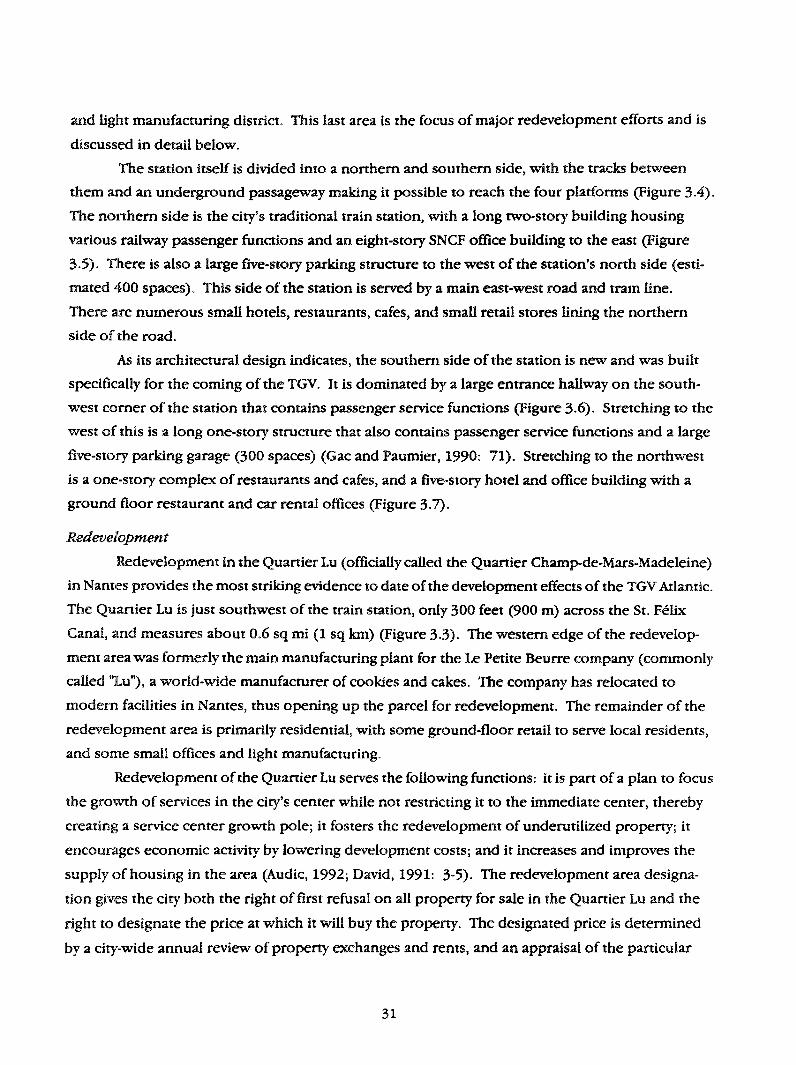
tqve-story parking garage (300 spaces) (Gac and Paumier, 1990: 71). Stretching to the northwest
is a one-story complex of restaurants and cafes, and a five-story hotel and office building with a
ground floor restaurant and car rental offices (Figure 3.7).
Redevelopment
Redevelopment in the Quartier Lu (officially called the Quarrier Champ-de-Mars-Madeleine)
in Nantes provides the most striking evidence to date of the development effects of the TGV Atlantic.
The Quartier Lu is just southwest of the train station, only 300 feet (900 m) across the St. F6Iix
Canal, and measures about 0.6 sq mi (1 sq km) (Figure 3.3). The western edge of the redevelop-
ment area was formerly the main manufacturing plant for the Le Petite Beurre company (commonly
called "Lu"), a world-wide manufacturer of cookies and cakes. The company has relocated to
modern facilities in Nantes, thus opening up the parcel for redevelopment. The remainder of the
redevelopment area is primarily residential, with some ground-floor retail to serve local residents,
and some small offices and light manufacturing.
Redevelopment of the Quartier Lu serves the following functions: it is part of a plan to focus
the growth of services in the city’s center while not restricting it to the immediate center, thereby
creating a service center growth pole; it fosters the redevelopment of underutilized property; it
encourages economic activity by lowering development costs; and it increases and improves the
supply of housing in the area (Audic, 1992; David, 1991: 3-5). The redevelopment area designa-
tion gives the city both the right of first refusal on all property for sale in the Quartier Lu and the
right to designate the price at which it will buy the property. The designated price is determined
by a city-wide annual review of property exchanges and rents, and an appraisal of the particular
31

Figure 3-4
Nantes TGV Station: View of North and South Sides
AMENAGEMENT DE LA NOUVELLE GARE SUD
Source: Gac and PaumAer, 1990.
32

Figure 3-5
Nantes TGV Station: Northern Side
View R)oking east (standing slightly west of station)
//// /
///
.//
View to west
33

Figure 3-6
Nantes TGV Station: Southern Side
View of entrance (looking north)
View to east
34
View of South Side
Figure 3-7
Southern Side of Station: Hotel/Office Building
View of west side
35

parcel’s value. If the landowner chooses not to sell the property to the city at the designated
price, the property cannot be sold to any other part),. As in most redevelopment plans, the city
assembles and reconfigures the properties for more efficient use, allows more intense lane1 use of
the property, ancl improves the infrastructure serving the property. The city then resells the
property to developers at the price for which it was originally bought. This process is used as a
means to retain a larger degree of control over the planning and development of the property,
making it an indirect form of value capture.
Construction ofa mLxed-use development is progressing rapidly on the 6.7-acre (2.7 hectare)
site of the Lu factory. About one-half of the site will be offices and a convention center/hotel com-
plex, and the rest wiU be residences (Figure 3.8). The development will have approximately
592,000 sq ft (55,000 sq m) of built space in a mix of four- and five-story buildings. A new pedes-
trian bridge across the St. F61ix Canal wiU provide a direct connection between the development
and the TGV station. Total development costs are estimated at $53 (FF300) million, about
percent of which is land costs. The convention center is scheduled to open in September 1992,
with the remainder of the project to open sometime thereafter (Audio, 1992; David, 1991: 127).
Another major project in the redevelopment area is a bank and once building complex
directly across the street from the convention center (Figure 3.9)° It opened in the fall of 199I,
employing 1,000 people in a building complex of 108,000 sq ft (10,000 sq m). In addition, the
residential population of the area is scheduled to rise from 3,000 to 6,000 in the near future,
indicating a large amount of new housing development and subdivision of existing units (Audic,
1992).
New development in the redevelopment area as a whole is considered to be unsurpassed
in the city because of its modern qualities and its proximity to both the TGV station and the city
center. As a result, rents are subject to a 20 percent premium above equivalent space in other
areas of the citymnew office space on the former Lu factory site already is leasing for $13.95-
16.41/sq ft/year (FF850-1,000/sq m/year) (ibid.). These rents are not for a lack of development
Nantes, though: since 1980, an average of 604,000 sq ft (57,000 sq m) of office space has been
constructed annually in the Nantes greater metropolitan area, and more than half of it has been
within the city boundaries (David, 1991: 26).
Summary
The TGV has affected the behavior and location decisions of businesses and has had notice-
able development effects around some stations. Introduction of the TGV Southeast (Paris-Lyon) had
several discernible effects: total business trips by rail increased 50 percent; service sector business
trips by rail more than doubled; tourism increased; overnight hotel stays dropped; and medium-
36

Figure 3-8
Lu Factory Redevelopment Site
Convention center (looking south)
Hotel~Office Complex (looking southwest)
37

38
size information sector firms in hinterland areas used the TGV Southeast to enter Paris markets.
Howecer, when making business location decisions, access to the TGV Southeast was just one of a
number of factors cited in business relocation decisions. Other factors included the overall eco-
nomic situation; the entire transportation network (roads and rail); and public sector assistance.
Development was inconsistent across station locations, with effects generally limited to the area
around the station, but the level of development was determined by the overall economic strength
of the community and the presence of service sector firms requiring access to Paris.
Although the TGV Atlantic (Paris-Le Mans) has only been in operation for three years, some
development effects are already detectable. Real estate prices and transactions have risen sharply
in several communities with stations, and in Nantes the network is perceived as qualifying the city
for the location of businesses. Nantes has attracted a number of large businesses out of Paris
(although the TGV is also used by Paris-based firms to serve customers in and around Nantes),
and the presence of the TGV has spurred a major redevelopment project near the station as well
as heltx.~d to produce a 20 percent rent premium on space in the redevelopment area.
No information on value capture was found in the literature, but in Nantes, some form of
value capture was in effect on the redevelopment site near the station.
4. GEI.B~dVY AND THE ICE
ICE System
The German InterCity Express (ICE) began operating in June, 1991, and connected
cities over a single north-south line 648 miles (1,043 kin) in length (Figure 4.1). 20 trains per
traveled between Hamburg and Munich at scheduled speeds up to 155 mph (250 kph), with
maximum of 173 mph (280 kph) to make up for lost time. Deutsche Bundesbahn (DB) plans
the end of the decade to double the number of miles over which high-speed operations are capa-
bleo It also plans to expand ICE operations to 10 or 11 lines, several of which will run into the
eastern portion of the country, and expects to be operating at speeds of 186 mph (300 kmh) on
least one of those new lines. With the integration of the European high-speed rail network, the
next generation of ICE trains will operate on lines extending into Switzerland, The Netherlands,
Belgium, France, and perhaps Great Britain (Sands, 1992: 3, 17, 20, 23, 33).
The InterCity Express (ICE) is part of an effort to relieve congested freeways and airports
divertinG; intercity travelers. Prior to the unification of the former East and West Germanys, it had
been used mainly to serve the north-south corridor that had been overburdened ever since the post-
World War II division of the country had disrupted the rail lines’ traditional east-west orientation.
The introduction of the ICE presents an excellent opportunity to observe the effects of
high-speed rail on development at the national to local levels. Unfortunately, no formal studies
39

Figure 4-1
ICE and IC Network
Source: Deutsche Bundesbahn <January 1991).
4O

have been initiated by the Deutsche Bundesbahn nor, apparently, by any other national agency
(Lange, 1992). Given the level of resources necessary for the reconstruction of the former East
Germany, this is not entirely surprising, but it does seem to be a lost opportunity, especially for
crossonational comparisons.
Kasse|-Wilhelmsh6he
The following sections detail the development effects observed during a site visit to the
Kassel-Wilhelmsh6he ICE station in January 1992. Of the 11 cities served by the ICE upon its
introduction in June 1991, this is the only completely new intercity train station. It is also the first
new station to be built in a German city since shortly after WWII. It is here that the preliminary
development effects of high-speed rail are most readily observable. The remaining ICE stops are
at long-established stations in the center of major urban centers. No development effects are as
..yet ob.,;ervable at these stations.
Background
Kassel is located on Germany’s longest new high-speed line segment, the Harmover-Wiirz-
burg section. This section forms a new north-south axis in the German high-speed rail system,
supplementing the traditional north-south line running through Hamburg-Bremen-DOsseldorf-
Frankfi~rt-Stuttgart. Although Kassel is located in the middle of German)- latitudinally, it was
located very close to the border of what was previously East Germany when the decision was
made in the early 1970s to route the new line there. At that time, its 213,000 residents were
served by only two intercity trains per day, both of which called on the main train station located
in the center of the city (Nose: 134; Klotz, 1987). With the reunification of Germany in 1990,
Kassel has again become a centrally located city, making the decision to locate an ICE station
there a fortuitous one for the Deutsche Bundesbahn, and especially for Kassel.
The station was perceived as a great economic opportunity for the city, enabling it to be
integrated with the rest of Germany and Europe via up to 100 hourly ICE and IC trains per day.
By ICE., Kassel-Wilhelmsh6he is now less than one hour from Hannover, 1V2 hours from Frankfurt, 2
hours and 10 minutes from Hamburg, and 2 hours and 45 minutes from Stuttgart (Deutsche
Bundesbahn, 1991: 48, 74, 76, 116). These times, combined with the station’s centrality within
the city, are expected to provide a strong development impulse near the station and in Kassel as a
whole. Specifically, the station is expected to improve the ability of the city to attract industrial
and service firms, and in addition to improve the image and, possibly, the funding of its university
and government agencies (Bergholter, 1991: 24; Klotz, 1987).
41

Planning
Although the cityviews the newstation as an excellent stimulus to the community, officials pt
ceive it as both an opportunity and a threat. These uncertainties can be narrowed down to three
questions. First, is it possible to build a multi-modal terminal that serves not only intercity passen
gers, but also regional and local passengers; that facilitates transfer between them and intra-urbar
transit; and that is compatible with the existing site characteristics (Bergholter, 1991: 25)? Based
on the design and layout of the facilities and the observation of passengers using the station, one
would have to answer Jn the affirmative.
Second, is it possible to control speculation and conversion around the station, even in the face
of high demand for office, hotel, and retail space? The strong demarcation of growth and non-growth
areas in city development plans is expected to help control this. According to Bergholter, though,
almost all available space in the city already had firm development plans at the time of his writing
0bid.).
Third, is there a role for the old main train station in the city center? The city wants to
strengthen regional transportation links to the city center and turn it into a regional service center
0bido: 26). Although the city center station still receives local train service and some regional trains,
and is connected to the KasseloWilhelmsh6he station via bus, tram, and train, one has to wonder if it
will not simply be left behind as development occurs around the new station.
The city has three ongoing programs which it would like to couple with the new station:
the upgrading of the university to a top scientific and industrial research center, along with the
integration of the university with the city’s growth plans; revitalization of the inner-center and the
re-establishment of its role as city-center; and general plans and policies to improve the quality of
life and standard of living in Kassel. The station is also thought to provide an opportunity to chan-
nel growth that is occurring in the western part of the city (Bergholter, I991: 24).
Location and Design.
The city originally wanted the new intercity train station to be built underneath the exist-
ing station in the city center. However, this soon proved to be prohibitively expensive and the site
was shifted to a small local passenger and freight train station approximately 2.2 miles (3.5 km)
the west of the city center (Figure 4.2) (Klotz, 1991: 40-41). The new station is located on
WilhelmshCShe AUee, a wide street running east-west and dating from the Baroque era. Because it
links the urban city center with a growing residential area and a nearby large park to the west, the
street carries high levels of automobile, streetcar, and bus trafi~c (Bergholter, 1991: 24).
The station itself has an innovative and distinct architectural design (Figure 4.3). Located
on a bridge that crosses the railroad tracks, its most distinctive feature is the large canopy that
ex~ends out from the front of the station lobby to cover the four light-rail stops, seven bus stops,
15 taxi stands, and the kiss-and-ride stop. Although temporary drop-off/pick-up automobile park-
42

Figure 4-2
Kassel-Wiiheln~h6he ICE Station Location
0 1 2mi
Source:: Klotz, 1991.
43

Figure 4-3
Kassel=W’xlhelmsh~he ICE Station and Environs
Souxce: Langer, 1991.
44

ing is allowed in front of the station, regular parking is located either behind the station, above
the train platforms, or underground to the west. Tour bus parking is available to the east of the
station. Transit and automobile passengers have no more than a flve-minute walk to the plat-
forms. The platforms are reached by long ramps extending down from the station lobby, and by
stairs and elevators from the parking lot above the platforms. ICE, IC, regional, and local train
service is provided from the four platforms.
Development
Because the station has been in operation for less than one year, it is difficult to observe
development effects, and, unfortunately, DB is not monitoring development activity in the area
around the station (Lange, 1992). However, the Kassel Industrie und Handeslkammer (an indus-
trial and trade organization simiLar to a chamber of commerce) reports that a general increase in
demand for all types of space has taken place, including retail, service, hotel, residential, and raw
land. Some specific effects that have been noted are: a 20 percent increase in rents for area office
space, to $13.38/sq ft/year (DM 240/sq n~ear); the construction of a new hotel near the station;
the development of a large parcel behind the station, which is expected to serve mainly service
industry firms requiring access to the ICE; and little demand for manufacturing uses in the area
(Frei, 1992).2
A brief visit to the station and a cursory land use survey around it produced similar find-
ings. The design of the station is innovative, highlighted by the architectural qualities and details,
which are effective at creating a sleek and polished image. DB sought this image for the ICE, in
part as a signal to development in the area, although it does sometimes seem a little out of place
with the current development in the area. The station itself has the usual array of small retail
shops, restaurants, and cafes catering to travelers, as well as information and ticketing facilities,
and railway offices. In addition, it has a fairly large retail/drug store, estimated to be 5,000 sq ft
(465 sq m).
Attached to the west of the station by a covered walkway is a large building containing
several diverse uses (Figure 4.4). Towards the back on the ground floor is a grocery store estimated
to be 4,000 sq ft (370 sq m). Above this are four stories of offices for a number of electronics,
communications, financing, and business management firms, estimated at 21,000 sq ft (1,950 sq
m). Towards the front on the ground and second floors is a mix of cafes, restaurants, retail stores,
and a hotel, with an estimated total of 30,000 sq ft (2,800 sq m)o The building continues along
parallel to Wilhelmsh6he Allee for about 100 feet, then turns up a neighboring street, where it has
ground-.floor retail stores and a mix of offices for lawyers, doctors, and business management
above. The remaining buildings on that street are strictly residential.
2Prices ~dculated using an exchange rate of $1= 1.66 German Marks (NewYork Times, 1992).
45

Figure 4-4
Development Complex at West End of Station
Offices and Ground-Floor Retail Stores (behind station, looking southwest)
Offices, Hotel, Restaurant, Cafes (in front of station looking west)
t!!111
46

Wilhelmsh6he Alice itself is a four-lane street with light.rail tracks running up the middle
and wide sidewalks. Continuing west from the station, it is bordered by four- to six-story build-
ings, most of which are entirely retail or a mix of ground-floor retail and offices (Figure 4.5).
Several, however, have ground-floor retail with residences above. Most of these uses appear to be
continuation of existing uses. Only one new building was noted within one-half kilometer west of
the station, an architecturally innovative building (similar to the station) with ground-floor retail
and cafes, and two to three storys of what appeared to be residences above, estimated at a total of
30,000 sq ft (2,800 sq m). Although partially occupied, in late 1992 it was still in the process
being painted and finished internally.
Across from the station, to the west of the tracks, are several five-story buildings with
ground-floor retail and offices above. A completely new building is under construction directly
across f~’om the station, to the east of the tracks. It is a five-story building with 6,900 sq ft (640 sq
m) of ground-floor retail space, and 28,500 sq ft (2,640 sq m) of office space. It is bordered
another building with a similar mix of uses. To the northeast of the station is a large government
building that appears to be undergoing renovations.
The remaining property within a one-mile radius of the station is primarily residential,
with one large exception. To the southwest of the station, bordering the parking above the train
platforms, is the large parcel (approximately 500 ft [150 m] wide and 2,500 ft [760 m] long) that
Frei (19’92) referred to as being under development for offices (Figure 4.6). Needless to
development of such a large piece of property will have a substantial effect on the local property
market and business location. It is the clearest evidence to date that the ICE station has had an
effect on development in the area.
Summary
The Kassei-Wikhelmsh6he station provides an opportunity to observe the development
effects of high-speed rail at a new intercity station location, although the ICE has been operating
for less than a year. Demand for office, hotel, and retail space around the station has significantly
increased (as evidenced by a 20 percent rent increase for retail space), and a large parcel border-
ing the station is being developed and is expected to serve information/service sector firms requir-
ing access to the ICE. However, the question of the ICE’s impact on the existing city center remains
unanswered, and there is no available information on value capture.
47
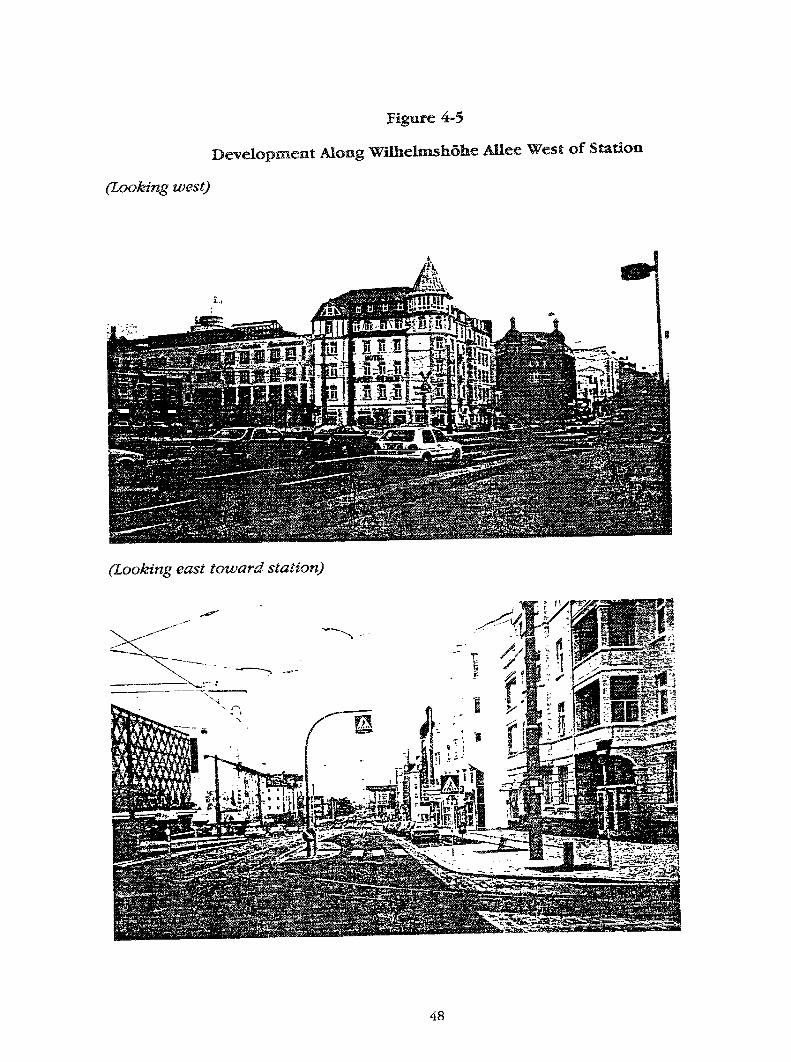
Figure 4-5
Development Along Wilhelmsh6he AUee West of Station
(Looking west)
(Looking east toward station)
48
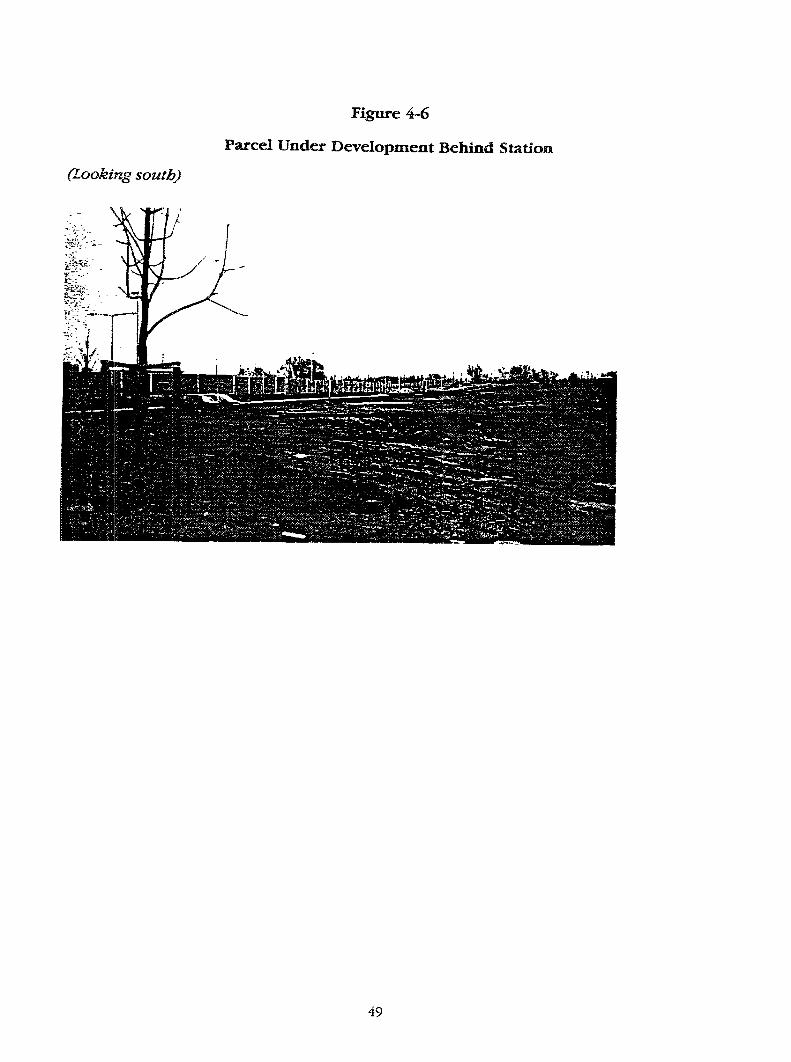
(Looking south)
Figure 4-6
Parcel Under Development Behind Station
49

5. IMPLICATIONS FOR CALIFORNIA
I, iigh-Speed Rail System
The CalSpeed research group at the Institute of Urban and Regional Development, Univer-
sity of California at Berkeley, has developed a detailed proposal for a high-speed rail system in
California (Hall et al., 1992). This system is designed primaxily to serve the Los Angeles Consoli-
dated Metro Area and the San Francisco Bay Area (Figure 5.1). According to the 1990 Census,
these areas have a combined population of approximately 20.5 million (Table 5.1). In addition,
the system would serve the next group of medium-size metropolitan areas, those with populations
of 0.4-2.5 million, including San Diego (2.5 million), Bakersfield (0.54 million), Fresno (0.67
million), Stockton (0.48 million), and Sacramento (1.5 million).
The CalSpeed high-speed rail system is based on steel-wheel-on-rail trains capable of speeds
up to 200 mph (322 kmh). It would be able to achieve approximately the following express travel
times from Los Angeles: Bakersfield, 0:50; Fresno, 1:20; San Jose, 2:05; Sacramento, 2:30; and San
Francisco, 2:55.
Anticipated Development Effects
As a review of high-speed rail systems in Japan, France, and Germany, has indicated, the
development effects of high-speed rail are highly variable and depend on a range of factors, mak-
ing it difficult, without detailed analysis, to specify development effects by location. However, a
number of general statements about the potential development effects of a high-speed rail system
in California are possible.
1. The current recession will reduce all development effects, from the regional to station
level. The importance of the economy for development to occur has been repeatedly highlighted
in the preceding sections. However, considering the amount of time necessary to plan and con-
struct such a system, the state will probably be well on the way to recovery by the time operations
begin. In fact, according to one theory, infrastructure investments at the scale of a high-speed rail
system may be required for economic recovery.
According to the Center for the Continuing Study of the California Economy (1992), Cali-
fornia will add an additional three million jobs and six million residents during the 1990s,
increases of approximately 20 percent each, despite the fact that the recession is more severe in
California than in the rest of the nation. Although the state will experience numerical growth,
prosperity and quality of life may suffer if the state does not take action to increase investment by
the public and private sectors in education, production facilities, research and development, and
infrastructure (ibid.: 3).
50

Figure 5-1
California High-Speed Rail Network (Proposed)
|
Source: Hall et al., 1992.
51

Table 5.1
C~!ifo~Lia Pop1~lation by Region, 1980~2000 (000s)
Annual Growth
Los Angeles BasinSan Francisco Bay AreaSan Diego RegionSacramento RegionRest of State
Growth Rate
California
1980- 1990- 1980- 1990-1_9_~o) 19900) 2000~2) 1990 2000 1_9_9_Q 200.___0
11,589.9 14,640.8 17,197.3 305.1 255.7 2.4% 1.6%
5,179.8 6,023.6 6,901.0 84.4 87.7 1.5% 1.4%
1,861.8 2,498.0 3,218.7 65.6 72.1 3.0% 2.6%
X,099.8 1,481.0 1,941.2 38.1 46.0 2.0% 2.7%3,948.6 5,166.6 6,423.6 121.8 125.7 2.7% 2.2%
23,679.9 29,760.0 35,681.7 608.0 592.2 2.3% 1.8%
Note: O) Census data.(2) Estimated by CCSCE.
Source: Center for the Continuing Study of the California Economy, 1991.
2. A high-speed rail system would increase population and employment growth rates in
the regions it serves above the statewide average. Actually, according to the Center for the Con-
tinuing Study of the California Economy (1992), the regions that such a system would serve have
been and will continue to be the fastest-growing in the state. The Center divides the state into
economic regions similar to those identified by the CalSpeed study (Figure 5.2). In the 1980s, the
Sacramento and San Diego regions led the state in population growth rates, and they wiLl do so
again in the 1990s, followed closely by the San Joaquin Valley, which dominates growth in the
"Rest of State" group (Table 5.2). The Los Angeles Basin and San Francisco Bay Areas will grow
more slowly, but will still account for 60 percent of the state’s absolute population gain during the
next decade. The situation for employment growth is similar, although the "Rest of State" group
experienced below average job growth during the 1980s. This trend is expected to reverse as
employment growth in the major regions spills out into the San Joaquin Valley. These trends are
likely to continue into the following decade.
A high-speed rail system would reinforce this growth and channel it within regions to cities
with stations, which would then have significant advantages in accessibility over their neighbors
and be in a better position to attract growth. Once this point was recognized, competition for a
high-speed rail station would probably be fierce between cities within a region.
3. Employment growth rates will be highest in those regions with large concentrations of
information-related economic activities and centers of higher education. The information-related
sector is the fastest-growing sector of the economy, accounting for one million new basic jobs
52

Figure 5-2
Major Economic Regions of California
HUMBOLDT
SISKWOU
SHASTA
®TEHAMA
LOS ANGELES BASIN
SAN FRANCISCO BAY AREA
SAN DIEGO REGION
SACRAMENTO REGION
REST OF STATE
SAN FRANCISCC
SAN MATEO
"CRUZ
MONTEREY’
TUI..ARE
SAN LU|S0t~l$PG
BARBAR~
KERN
LOS ANGELES
SAN BERNARDINO
RIVERSI£iE
SAN D|EG0 iMPERIAL
Source: Center for the Continuing Study of the California Economy, 1992.
53

Table 5.2
C~llfornia Employment by Regfon, 1979-2000 (O00s)
Annual Growth Growth Rate1980- 1990- 1980- 1990-
1980(1) 1990(I ) 2000(2) ~ 200__0 1990 2000
Los Angeles 5,445.7 6,917.2 8,485.8 147.1 142.6 2.4% 1.9%San Francisco Bay Area 2,574.9 3,210.5 3,824.8 63.6 55.8 2.2% 1.6%San Diego Region 716.2 1,073.0 1,449.4 35.7 34.2 4.1% 2.8%Sacramento Region 462.6 663.6 912.6 20.1 22.6 3.7% 2.9%Rest of State 1,732.6 2,174.6 2,748.7 44.2 52.2 2.3% 2.2%
California 10,932.0 14,038.9 17,421.0 310.7 307.5 2.5% 2.0%
Note: O) California Employment Development Dept.(2) Estimated by CCSCE.
Source: Center for the Continuing Study of the California Economy, 1991.
(exporting products/services outside of California) during the period 1979-89, approximately
percent of total basic job growth in the state. During the period 1989-2000, this sector is expec-
ted to provide approximately 0.8 million new basic jobs, over 90 percent of the new basic jobs in
California (Center for the Continuing Study of the California Economy, 1991: Peg 16). The
majority, of these types of jobs will be found in the Los Angeles Basin and San Francisco Bay Area,
thereby further reinforcing their economic advantages in these sectors. However, this effect will
be mitigated somewhat by the dispersion of "back-office" information-related activities out of these
two regions to others where there are lower land and labor costs.
4. Increases in employment and economic activity in the accommodation, retail, and
wholesale sectors would be dispersed across the system. However, regional activities would
concentrate in cities with stations.
5. Ridership would be poor at stations without adequate transportation network connec-
tions, specifically an urban rail link directly to the local city center. Given that systems already
exist or are under construction in the Los Angeles Basin, the San Frandsco Bay Area, San Diego,
and Sacramento, it would be possible to connect high-speed rail to these systems. These connec-
tions would likely increase ridership on both the local and high-speed rail networks and increase
development around the stations.
6. Land value premiums on the order of 20 percent might occur around stations if
adequate transportation infrastructure were provided and development were supported by public
agencies.
54

Recommendations
On the basis of the aforementioned anticipated development effects, two
recommendations are made.
1. The state agency responsible for development of a state high-speed rail system must
take an active role in developing the area around stations. This can be clone by establishing a
development authority within that agency and giving it three fundamental powers: the ability to
buy and sell property; the ability to develop its property; and the ability to enter into development
agreements with local public agencies and private developers. This agency must also coordinate
and facilitate development done by local public agencies and private developers, and provide
adequate staff and funding for such activities.
2. The state agency responsible for the development of a high-speed rail network must
work cl[osely with local transportation authorities to guarantee that adequate road and transit
connections are provided to high-speed rail stations. This is especially true for local rail systems,
so that high-speed rail stations can be easily accessible and can allow passengers to transfer
smoothly between modes. This may require the provision of funding to assist local agencies in
making connections to high-speed rail stations.
These recommendations are made on the basis of the observed development effects of
high-speed rail and related rail systems. For better or worse, the State of California has little
control over the regional scale population and employment growth effects which a high-speed rail
system will generate. However, in the process of developing such a system, the state will have to
purchase property for high-speed rail lines and stations. This will give the state the opportunity to
improve the development that takes place around stations, ensure adequate transportation linkages,
and capitalize on land value increases that the stations and related development generate. Failure
to do so will not only result in a loss of possible revenue to support the development of high-speed
rail facilities, but a loss of ridership. The latter is especially critical for the long-term success of a
high-speed rail system.
55

REFERENCES
Amano, Kozo, and Dai Nakagawa. 1990. "Study on Urbanization impacts by New Stations of HighSpeed Railway." Conference of Korean Transportation Association. Dejeon City. (Photocopyobtained from Mamoru Taniguchi.)
Amano, Kozo, Tsunekazu Toda, and Dai Nakagawa. 1991. "The Rapid Transportation System andthe Socioeconomic Restructuring of Japan." In Cities of the 21st Century, Brotchie, Batty,Hall, and Newton, eds., New York: Longman Cheshire.
Audic, Philippe (Directeur G~n6ral, Nantes Atlantique Developpernent). 1992. Interview (January6).
Balause, Jacques (International Affairs Department, SNCF). 1992. Interview (Ianuary
Bergholter, Michael. 1991. "Eine Chance ffir die Stadt Kassel?.~" Mitten in Deutschland: BahnbofKassel-Wilhelmsh(Sbe, Engels, Walter, Giinter Klotz, and Jochen Lengenmann, eds., Darmstadt:Hestra-Verlag. 24-26.
Bernadet, M. 1988. Le Train d Grande Vitesse (TG~ Fran~ais et ses Consequences Socio-Economtques. Lyon: Laboratoire d’Economie des Transports.
Berry, Brian J. L. 1991. Long-Wave Rhythnm in Economic Development and PoliticaI Behavior.Baltimore: Johns Hopkins University Press.
Bonnafous, A. 1987. "The Regional impact of the TGV." Transportation 14(2): 127-137.
Bonnafous, A~, D. Pattier-Marque, and F. Plassard. 1981. Les D~placements d’Affaires Paris-Rhohne.AIpes, Etudes et Recherches. Lyon: Laboratoire d’Economie des Transports.
Brotchie, John. 1991. "Fast Rail Networks and Socioeconomic Impacts." In Ctties of the 2IstCentury: New Technologies andSpatialSystems, Brotchie, Batty, Hall, and Newton, eds.,New York: Longman Cheshire: 25-37.
Brotchie, John, Michael Batty, Peter Hall, and Peter Newton, eds. 1991. Cities of the 21st Century:New Technologies and Spatial Systems. New York: Longman Cheshire.
Brotchie, John F., Peter Hall, and Peter W. Newton, eds. 1987. The Spatiallmpact ofTechnological Change° New York: Croom Helm.
Buisson, M.A. 1989. L’In~act du TGV sur les Activit$s d’Etudes, de Conseil et Assistance auxEntreprises: l’Exemple de la R~gion Lyonnaise. Relations Entre Offre et Demande, Acres,INRETS No. 22.
CasteUs, Manuel. 1989. The Informational City: Information Technology, EconomicRestructuring and the Urban-Regiorml Process. Oxford: Basil BlackweU.
Center for Continuing Study of the California Economy. 1992. The Outlook for the CaliforniaEconomy: A Special Supplement to California Economic Growth w1992 Edition. Palo Alto:C.C.S.C.E. (May).
__. 1991. California Economic Growth: Short Term Uncertainties, Long Term Trends, 199IEdition. PaloAlto: C.C.S.C.E. (May).
56

Cointet-PineU, O. and F. Plassard, avec la collaboration de D. Michaeli. 1986. LesEffets Socio-E¢onomique due TGV en Bourgogne et Rhone-Alps: Document de Synthdse. DATA1L INRETS,OEST, SNCF.
David, l~m% 1991. Nantes: Les Services aux Entreprises et les Transformations du QuartterCbamp-de-Mars/Madeleine. Paris: Institut Franqais d’Urbanisme, Universite de Paris VIII(November).
Deutsche Bundesbahn. 1991. Bahnbuch 91/91: KasseL Frankfurt am Main: DeutscheBundesbahn, Zentrale Hauprverwaltung.
. 1991. %rorbereitungen im Hintergrund: Farhplan ’91." In Die Bahn lnformiert 1/91,F~,mkfurt: Deutsche Bundesbahn (January).
Fischer Wehalmanach. 1990. DerFischer Weltalmanach 1991. Frankfurt am Main: FischerT~schenbuch Verlag.
Frei (Dipl. Kaufmann, Industrie und Handelskammer Kassel). 1992. Letter (4 May).
Gac,G., andJ. Y. Paumier. 1990. Nantes aL’~vee du ZG.E Atlantique. Paris: Ministere del’Equipement, du Logement, des Transports et de la Met Observatoire Economique etStatistique des Transports (December).
Gentlextmn, H., et al. 1983. 7he Glasgow Rail lmpact Study: Summary ReportSupplementary Report 800). Crowthome: Department of Transport.
Goto, Toshiyuki. 1986. ~lew Railway Stations for Passengers: Aiming at Stations Where CitizensGather." Japanese Railway Engineering 26(1).
Hall, Peter, and Carmen Hass-Klau. 1985. Can RailSave the City? Brookfield, Vermont: GowerPublishing.
Hall, Peter, Dan Leavitt, and Erin Vaca. 19920 High.Speed Trains for California: Strategic Choice:Comparison of Technologies and Choice of Route, VoL 1. Working Paper No. 564, Berkeley:Institute of Urban and Regional Development, University of California at Berkeley (June).
Hall, Peter, and Paschal Preston. 1988. The Carrier Wave: New Information Technology and theGeography of lnformation, 1866-2003. London: Unwin Hyman.
Hirota, tL 1984. "Present Situation and Effects of the Shinkansen," Paper presented to theInternational Seminar on High-Speed Trains, Paris, November, 15 pages.
Hoel, Lester A., and Gary T. Johnson. 1986. "Innovative Financing for Transportation: What arethe Options?" Urban Resources 4(1): I7-22.
Kamada, M. I979. "Achivements and Future Problems of the Shinkansen." In The ShinkansenHigh-Speed RatlNetwork of Japan (Proceedings of an International Institute for AppliedSystems Analysis Conference, June 27-30, 1977), A. Straszak and 1Z Tuch, eds.: 41-56.
Klotz, Giinter. 1991. "Planung der Neubaustrecke in Kassel." Mitten in Deutschland: BahnhofKa~’sel-WilhelmshOhe, Engels, Walter, Giinter Klotz, and Jochen Lengenmarm, eds., Darmstadt:Hestra-Verlag: 38-42.
Klotz, Giinter. 1987. "Der neue Bahnhof in Kassel-Wilhelmsh6he." Die Bundesbahn. (September.)(Photocopy from Deutsche Bundesbahn, Presse und Offentlichkeitsarbeit, no page numbersgiven .)
57

Knight, K L., and L.L. Trigg. 1977. Land Use Impacts of Rapid Transit: Implications of RecentF_x’perience: Executive Summary (DOT-TPI-10-77-31). Washington, D.C.: U.S. Departmentof Transport.
Lan Uide Lay. 1967. Lyon et Environs (Map).
Landis, John, Robert Cervero, and Peter Hall. 1992. "Transit Joint Development in the U.S.: AnInventory and Policy Assessment." Environment and Planning.
Lange, H. (Presse und (7)ffentlichkeitsarbeit, Bundesbahndirektion Frankfurt am Main) 1992.Letter (16 March).
Langer, Ulrich. 1991. "Die Odysssee einer Bahnholfsplanung." Mitten in Deutschland: BahnhofKassel-WilhelmshOhe, Engels, Walter, G/inter Klotz, and Jochen Lengenmann, eds., Darmstadt:Hestra-Veriag: 49-73.
Langer, Ulrich. 1987. "Die Neuplanung yon Bahnhofsanlagen an Hochgeschwindigkeitsstreckenam Beispiel Kassel-Wilhelmshbhe." Die Bundesbahn (September). (Photocopy fromDeutsche Bundesbahn, Presse und OffentlichkeitsarbeiL no page numbers given.)
Le Monde. 1990. "Les Villes au Rendez-Vous du TGV.~ (7/8 October.)
Metro Monitoring and Development Study. 1986. The Metro Report: The Impact of Metro andPubIic Transport Integration in Tyne and Wear. Newcastle upon Tyne: Tyne and WearPassenger Transport Executive.
Miyasawa, K. 1979. "Comprehensive National Development Plans in Japan: Their Logic andReality." In The Shinkansen High-Speed RailNetwork of Japan (Proceedings of anInternational Institute for Applied Systems Analysis Corderence, June 27-30, 1977), A.Straszak, and R. Tuch, eds.: 253-274.
Nakamura, Hideo, and Tak~ki Ueda. 1989. "The Impacts of the Shinkansen on RegionalDevelopment." In/be Fifth World Conference on Transport Research, Yokohama, 1989, VoL///, Ventura, California: Western Periodicals.
Nishida, M. 1979. "Histo~ of the Shinkansen." In The Shinkansen High-Speed Rail Network ofJapan (Proceedings of an International Institute for Applied Systems Analysis Conference,June 27-30, 1977), A_ Straszak, and IL Tuch, eds.: 11-20.
Nose, Dieter. "Der neue Intercity-Bahnhof in Kassel.Wilhelmshfihe." pp. 134-143. (Photocopyfrom Deutsche Bundesbahn, Presse und C)ffentlichkeitsarbeit, no source or date given.)
Okabe, S. 1979. "Impact of the Sanyo Shinkansen on Local Communities." In The ShinkansenHigh-Speed Rail Nettt~rk of Japan (proceedings of an International Institute for AppliedSystems Analysis Conference, June 27-30, 1977), A. Straszak, and R. Tuch, eds.: 105-129.
Pickett, M. W., and K. E. Perrett. 1984. The Effect of the Tyne and WearMetro on ResidentialProperty Values (TR~ Supplementary Report 828). Crowthorne: Department of Transport.
Pieda (Planning, Economic and Development Consultants). 1991. Rail Link Project: AComparative Appraisal of SocioEconomic and Development Impacts of Alternative Routes.Reading: Pieda (May).
Plassard, F. 1990. "Transport and Spatial Distribution of Activities: The Case of NewInfrastructures: the Channel Tunnel and its Links to High Speed Lines." Paper presented atthe European Conferenece of Minsters of Transport, 1990.
58
1’.989. "Les Cons6quences de la Grande Vitesse sur les Ddplacements d’Affaires entre Paris etle Sud-Est." Paper presented at the Moscow Congress of the AICCF-UIC. Rail International,No. 1.
F. 1987a. "Les Effets du TGV sur les D~placements entre Paris et Rhone-Alpes." Paperpresented at the Fifth International Conference on Travel Behaviour, Aix-en-Provence,October 1987.
1987b. Le TGV ParismSud-est: Modifie-t.il les Relations Centre-Pd~iph&rie? Lyon:Laboratoire d’Economie Transports.
1985. Les Effets du TGV sur les Agglomd, rations du Centre et du Sud-Est. Lyon: Laboratoired’Economie des Transports.
Pucher, John. 1988. "Urban Travel Behavior as the Outcome of Public Policy: The Example ofModal-Split in Western Europe and North America" Journal of American PlanningAssociation 54(4): 509-520.
Robinson, F., and G. Stokes. 1987. Rapid Transit and Land Use: the Effects of the Tyne andWearMetro (Discussion Paper 88). Newcasde upon Tyne: Centre for Urban and RegionalDevelopment Studies.
San Francisco Chronicle. 1992. "O&YTrying to Keep Canary Wharf." B1, B10 (16 May).
Sands, Brian. 1992. The InterCity Express: A Technical and Commercial Assessement. WorkingPaper No. 559, Institute of Urban and Regional Development. Berkeley: University ofCalifornia at Berkeley (March).
Sanuki, T. I979. "The Shinkansen and the Future Image of Japan." In The Sbirdeansen High-SpeedRaiINetwork of Japan (Proceedings of an International Institute for Applied SystemsAnalysis Conference, June 27-30, 1977), A. Straszak, and 1L Tuch, eds.: 227-251.
Streeter, Walter. 1992. The French Train d Grande Vitesse: Focusing on the TGV-Atlantique.Working Paper No. 558, Institute of Urban and Regional Development. Berkeley: Universityof California at Berkeley.
Taniguchi, Mamoru. 1992. High Speed Rail in Japan: A Review and Evaluation of theShinkansen Train. Working Paper No. 557, Institute of Urban and Regional Development.Berkeley: University, of California at Berkeley.
The New York Times. 1992. (March 14.)
Tsukada, Shunso, and Chiaki Kuranami. 1990. Walue Capture with Integrated Urban Rail andLand Development: The Japanese Experience and Its Applicability to Developing Countries."Paper presented at the 18th Summer Annual Meeting of PTRC European Transport andPlanning, University of Sussex, England.
59