the development of shale gas in the united states development of shale gas in the united ... this...
TRANSCRIPT
the ENERGY lab
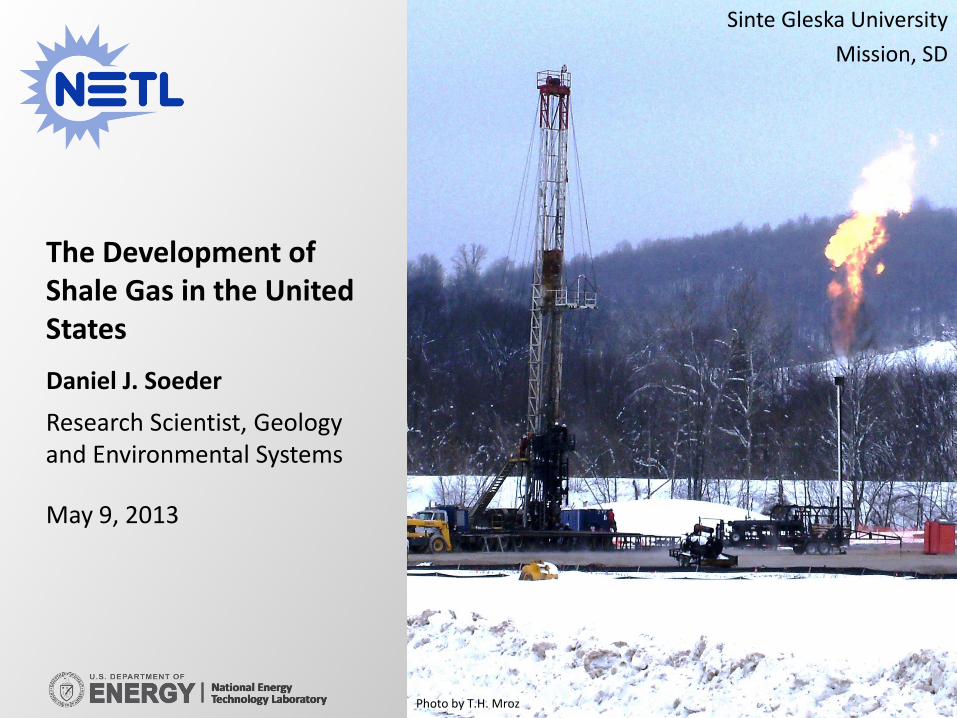
Daniel J. Soeder
The Development of Shale Gas in the United States
Research Scientist, Geology and Environmental Systems
May 9, 2013
Sinte Gleska University
Mission, SD
Photo by T.H. Mroz
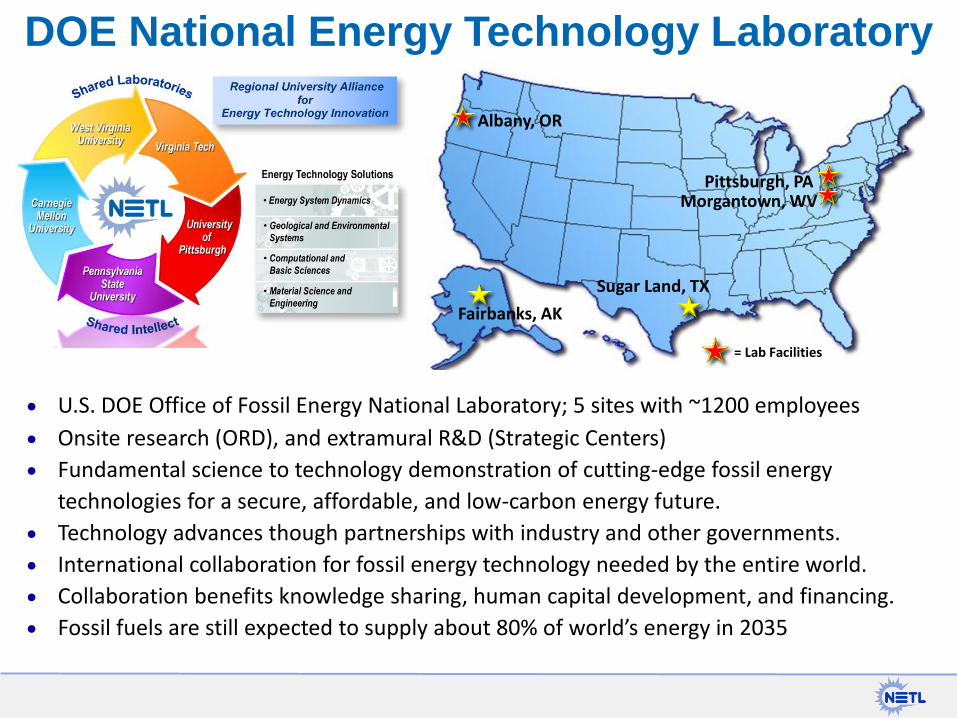
DOE National Energy Technology Laboratory
= Lab Facilities
U.S. DOE Office of Fossil Energy National Laboratory; 5 sites with ~1200 employees
Onsite research (ORD), and extramural R&D (Strategic Centers)
Fundamental science to technology demonstration of cutting-edge fossil energy
technologies for a secure, affordable, and low-carbon energy future.
Technology advances though partnerships with industry and other governments.
International collaboration for fossil energy technology needed by the entire world.
Collaboration benefits knowledge sharing, human capital development, and financing.
Fossil fuels are still expected to supply about 80% of world’s energy in 2035
Fairbanks, AK
Sugar Land, TX
Albany, OR
Pittsburgh, PA Morgantown, WV

• History of U.S. shale gas research
• Shale geology and resources (including Niobrara in SD)
• Production technology for shale gas
• Concepts of environmental risk
• Risk assessment process for shale gas
• Risk assessment status and plans
• Questions and discussion
This Presentation
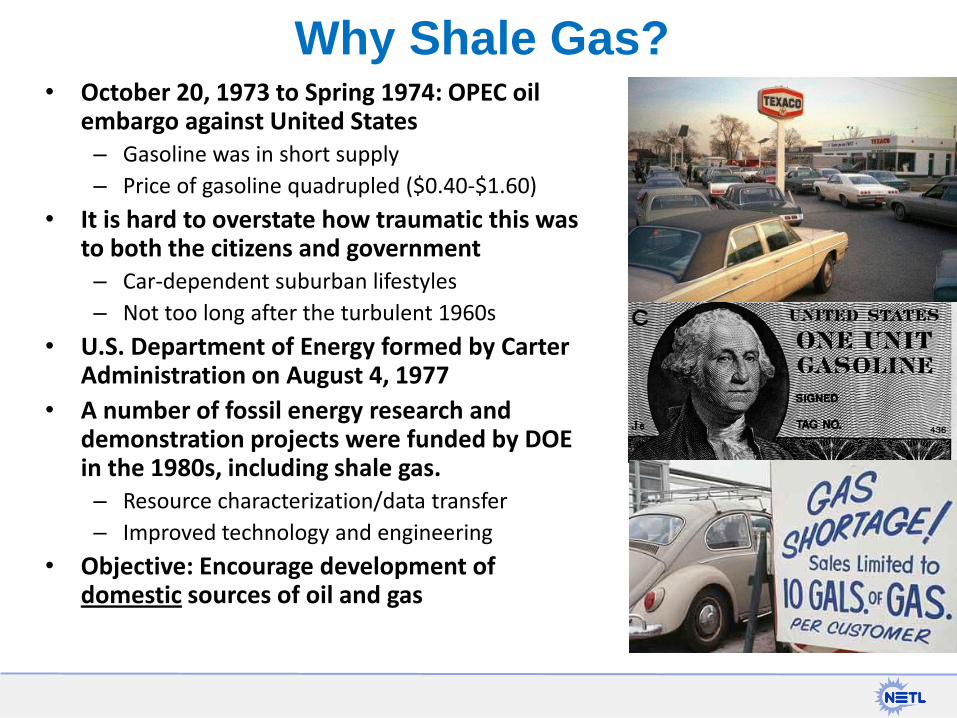
• October 20, 1973 to Spring 1974: OPEC oil embargo against United States – Gasoline was in short supply
– Price of gasoline quadrupled ($0.40-$1.60)
• It is hard to overstate how traumatic this was to both the citizens and government – Car-dependent suburban lifestyles
– Not too long after the turbulent 1960s
• U.S. Department of Energy formed by Carter Administration on August 4, 1977
• A number of fossil energy research and demonstration projects were funded by DOE in the 1980s, including shale gas. – Resource characterization/data transfer
– Improved technology and engineering
• Objective: Encourage development of domestic sources of oil and gas
Why Shale Gas?
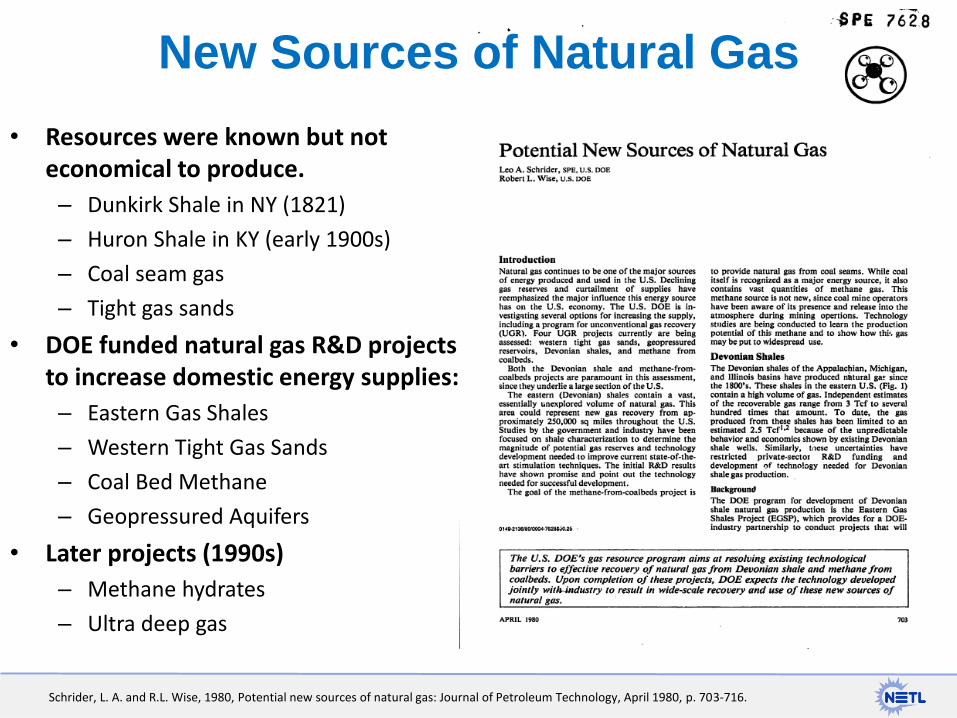
New Sources of Natural Gas
• Resources were known but not economical to produce.
– Dunkirk Shale in NY (1821)
– Huron Shale in KY (early 1900s)
– Coal seam gas
– Tight gas sands
• DOE funded natural gas R&D projects to increase domestic energy supplies:
– Eastern Gas Shales
– Western Tight Gas Sands
– Coal Bed Methane
– Geopressured Aquifers
• Later projects (1990s)
– Methane hydrates
– Ultra deep gas
Schrider, L. A. and R.L. Wise, 1980, Potential new sources of natural gas: Journal of Petroleum Technology, April 1980, p. 703-716.
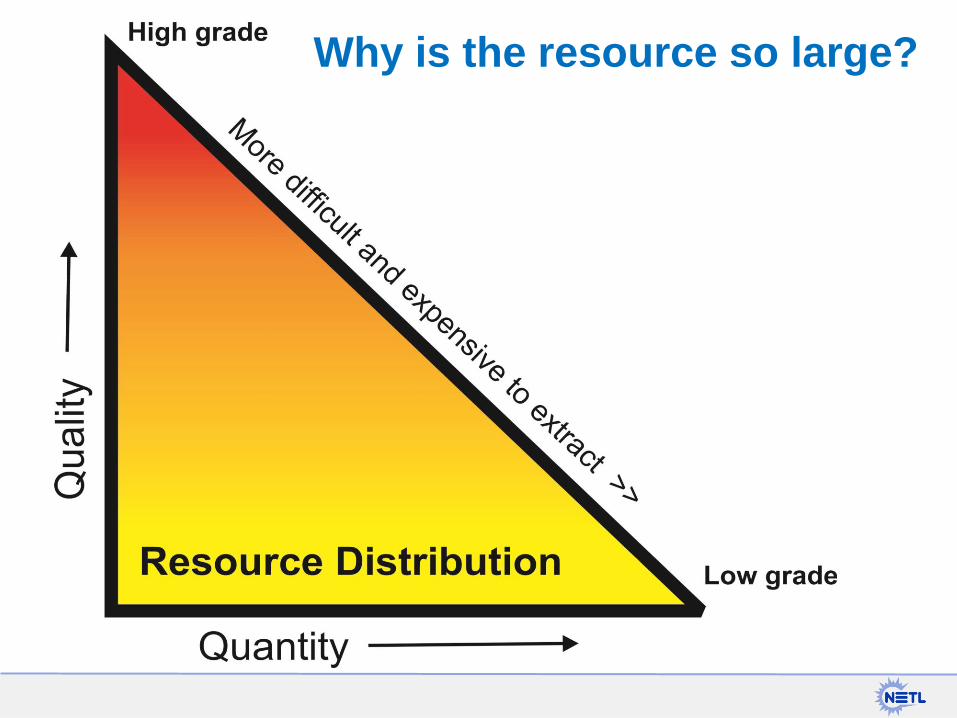
Why is the resource so large?

Petroleum Geology Review
Coleman, J.L., R.C. Milici, T.A. Cook, R.R. Charpentier, M. Kirshbaum, T.R. Klett, R.M. Pollastro, and C.J. Schenk, 2011, Assessment of undiscovered oil and gas resources of the Devonian Marcellus Shale of the Appalachian Basin Province, 2011: USGS Fact Sheet 2011–3092, U.S. Geological Survey, Reston, VA, 2 p. (http://pubs.er.usgs.gov/publication/fs20113092)
Conventional Reservoir: concentrated deposit of recoverable oil and/or gas.
NEED: 1. Source rock: 1-2% organics (kerogen)
a. Types I and II kerogen (petroleum + gas) b. Type III kerogen (coal + gas)
2. Thermal maturity 3. Reservoir rock 4. Trap and Seal 5. Migration pathway If any one of these is missing, no production. Shale gas is "unconventional": produced directly from thermally-mature high-organic content source rock. No reservoir, trap or seal needed. USGS calls this a “continuous resource,” producible essentially anywhere.

Gas Shale Geology
Soeder, D. J., 1988, Porosity and permeability of eastern Devonian gas shale: SPE Formation Evaluation, Vol. 3, No. 2, p. 116-124, DOI 10.2118/15213-PA.
Fine-grained, clastic mudrock, composed of clay, quartz, carbonate, organic matter, and other minerals.
Shale is organic-rich (black: >2% carbon), or organic lean (gray or red), and commonly fissile.
Shale. porosity (φ) ~ 10% Shale permeability (k) µd to nd.
Small grains = small pores; φ can be
intergranular, intragranular, and intra-organic.
Gas occurs in fractures, in pores and adsorbed or dissolved onto organic materials and clays.
Photo by D. Soeder
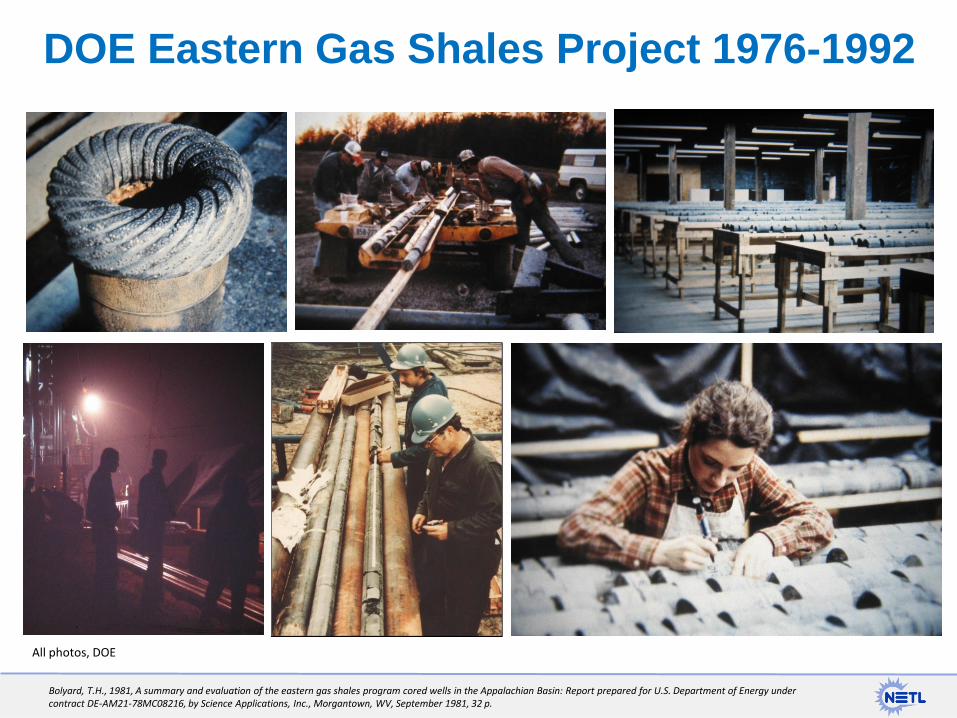
DOE Eastern Gas Shales Project 1976-1992
Bolyard, T.H., 1981, A summary and evaluation of the eastern gas shales program cored wells in the Appalachian Basin: Report prepared for U.S. Department of Energy under contract DE-AM21-78MC08216, by Science Applications, Inc., Morgantown, WV, September 1981, 32 p.
All photos, DOE

Appalachian Basin Stratigraphy
Potter, P.E., B. Maynard, and W.A. Pryor, 1980, Final report of special geological, geochemical, and petrological studies of the Devonian shales of the Appalachian Basin: report prepared for U.S. Department of Energy under contract EY-76-C-05-5201, by University of Cincinnati, OH, January 1980, 94 p.

44 cores total • 34 wells in the Appalachian Basin
• Most Upper Devonian • Only 9 wells to Marcellus
Shale • WV-6, WV-7 • OH-4, OH-7, OH-8 • PA-1, PA-2, PA-4, PA-5 • None deeper
• 3 wells in Michigan Basin (Antrim Shale)
• 7 wells in the Illinois Basin (New Albany Shale)
• "Stimulation alone is insufficient to achieve commercial shale gas production." - Horton, 1981
EGSP Cored Well Locations
Horton, Andrea I. , 1981, A comparative analysis of stimulations in the eastern gas shales: Report DOE/METC 145, U.S. Department of Energy, Morgantown Energy Technology Center, Morgantown, WV, 120 p.
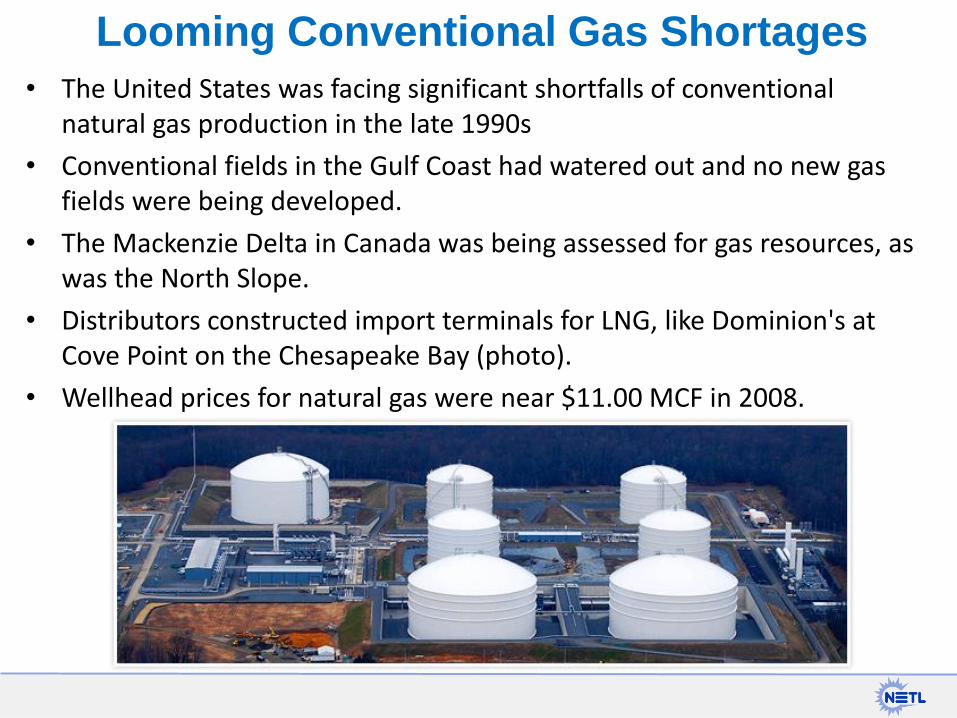
• The United States was facing significant shortfalls of conventional natural gas production in the late 1990s
• Conventional fields in the Gulf Coast had watered out and no new gas fields were being developed.
• The Mackenzie Delta in Canada was being assessed for gas resources, as was the North Slope.
• Distributors constructed import terminals for LNG, like Dominion's at Cove Point on the Chesapeake Bay (photo).
• Wellhead prices for natural gas were near $11.00 MCF in 2008.
Looming Conventional Gas Shortages
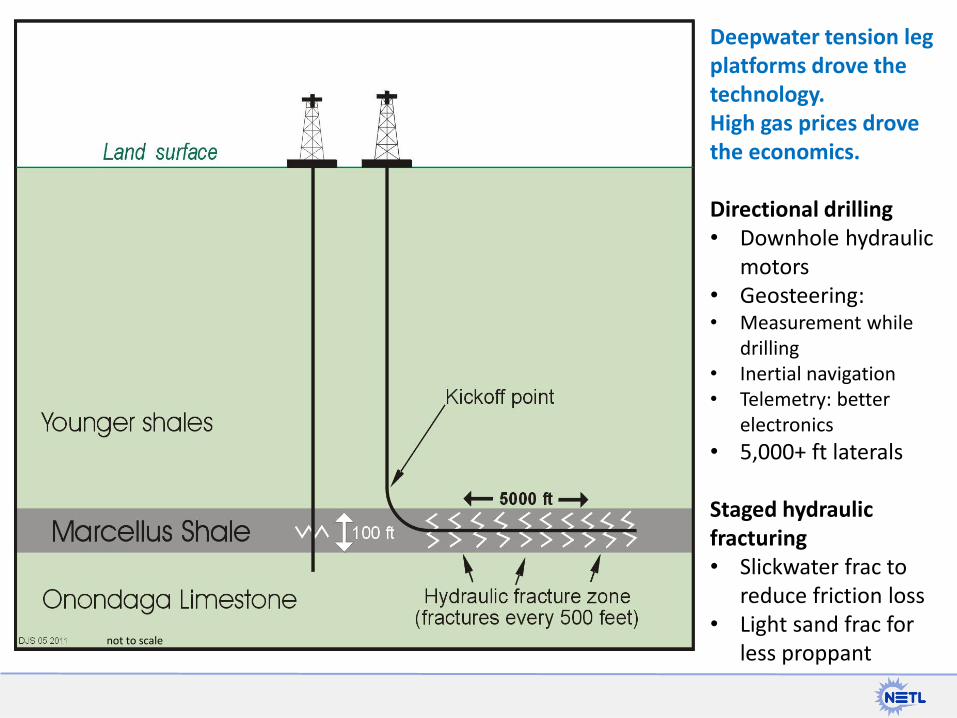
not to scale
Deepwater tension leg platforms drove the technology. High gas prices drove the economics. Directional drilling • Downhole hydraulic
motors • Geosteering: • Measurement while
drilling • Inertial navigation • Telemetry: better
electronics
• 5,000+ ft laterals Staged hydraulic fracturing • Slickwater frac to
reduce friction loss • Light sand frac for
less proppant
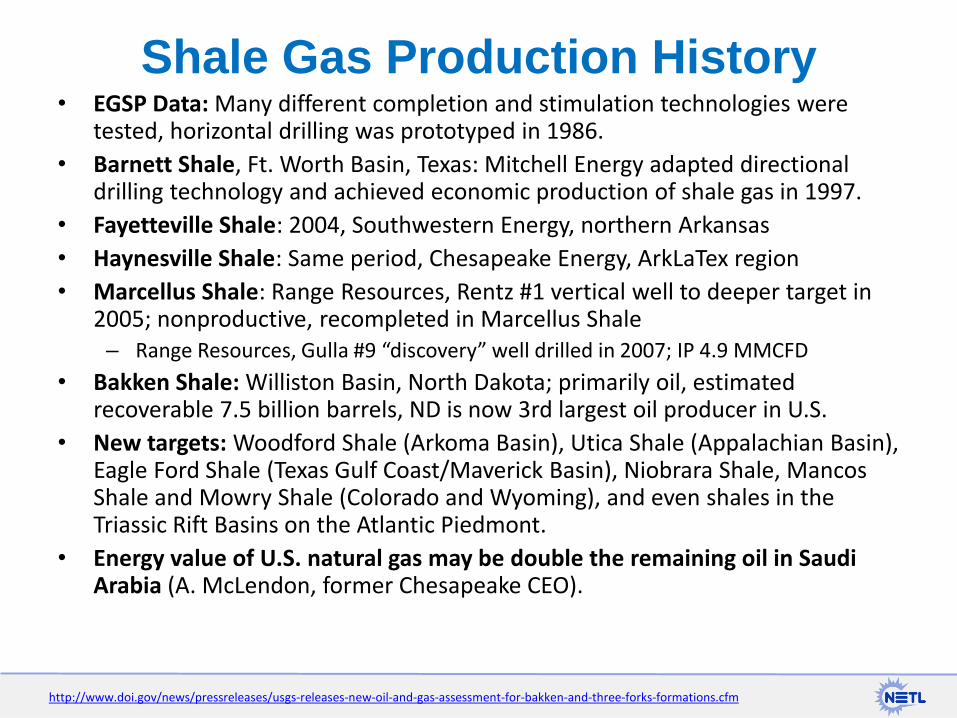
• EGSP Data: Many different completion and stimulation technologies were tested, horizontal drilling was prototyped in 1986.
• Barnett Shale, Ft. Worth Basin, Texas: Mitchell Energy adapted directional drilling technology and achieved economic production of shale gas in 1997.
• Fayetteville Shale: 2004, Southwestern Energy, northern Arkansas
• Haynesville Shale: Same period, Chesapeake Energy, ArkLaTex region
• Marcellus Shale: Range Resources, Rentz #1 vertical well to deeper target in 2005; nonproductive, recompleted in Marcellus Shale – Range Resources, Gulla #9 “discovery” well drilled in 2007; IP 4.9 MMCFD
• Bakken Shale: Williston Basin, North Dakota; primarily oil, estimated recoverable 7.5 billion barrels, ND is now 3rd largest oil producer in U.S.
• New targets: Woodford Shale (Arkoma Basin), Utica Shale (Appalachian Basin), Eagle Ford Shale (Texas Gulf Coast/Maverick Basin), Niobrara Shale, Mancos Shale and Mowry Shale (Colorado and Wyoming), and even shales in the Triassic Rift Basins on the Atlantic Piedmont.
• Energy value of U.S. natural gas may be double the remaining oil in Saudi Arabia (A. McLendon, former Chesapeake CEO).
Shale Gas Production History
http://www.doi.gov/news/pressreleases/usgs-releases-new-oil-and-gas-assessment-for-bakken-and-three-forks-formations.cfm

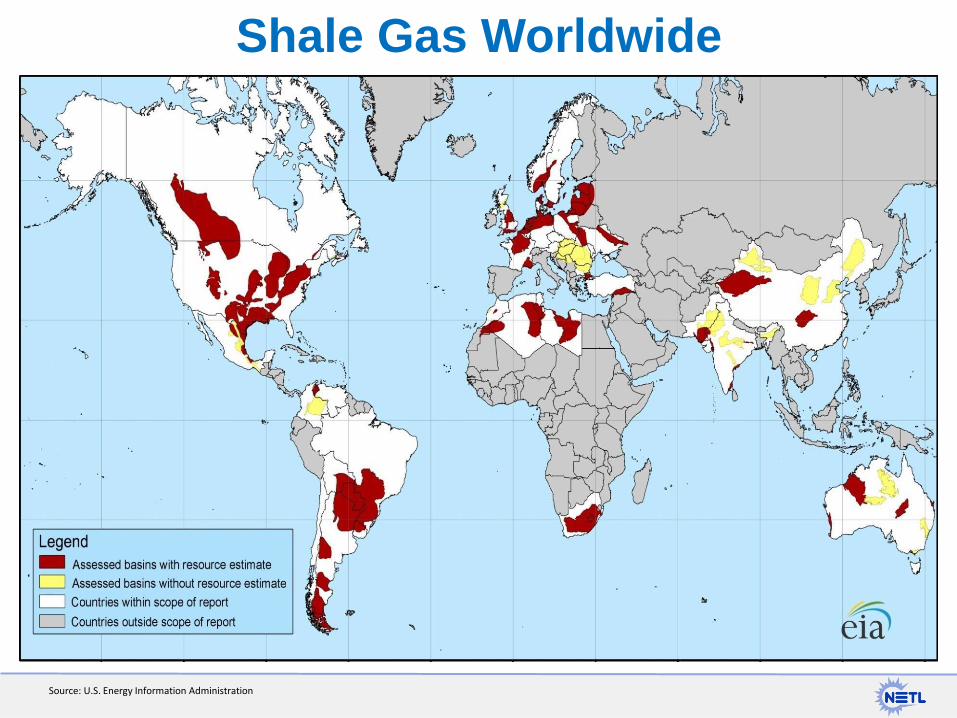
Shale Gas Worldwide
Source: U.S. Energy Information Administration

South Dakota Geology
http://www.sdgs.usd.edu/publications/maps/geo/generalgeo.html

Generalized Cross Section
Gries, J.P, P.H. Rahn, and R.K. Baker, 1976, A pump test in the Dakota Sandstone at Wall, SD, South Dakota Geological survey, circular 43, 11 p.
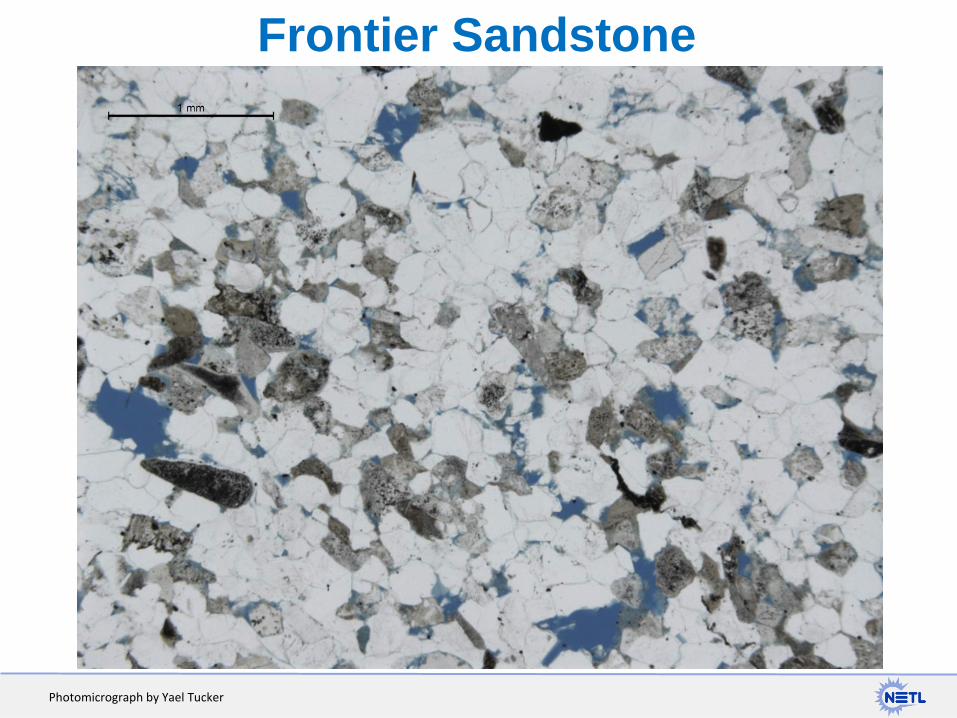
Frontier Sandstone
Photomicrograph by Yael Tucker
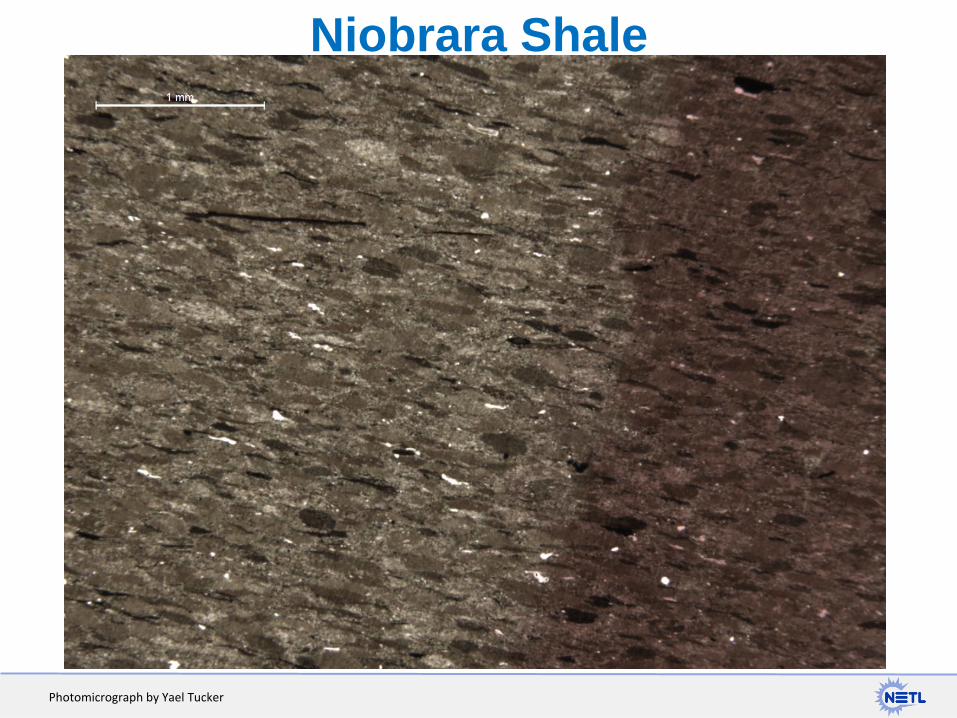
Niobrara Shale
Photomicrograph by Yael Tucker
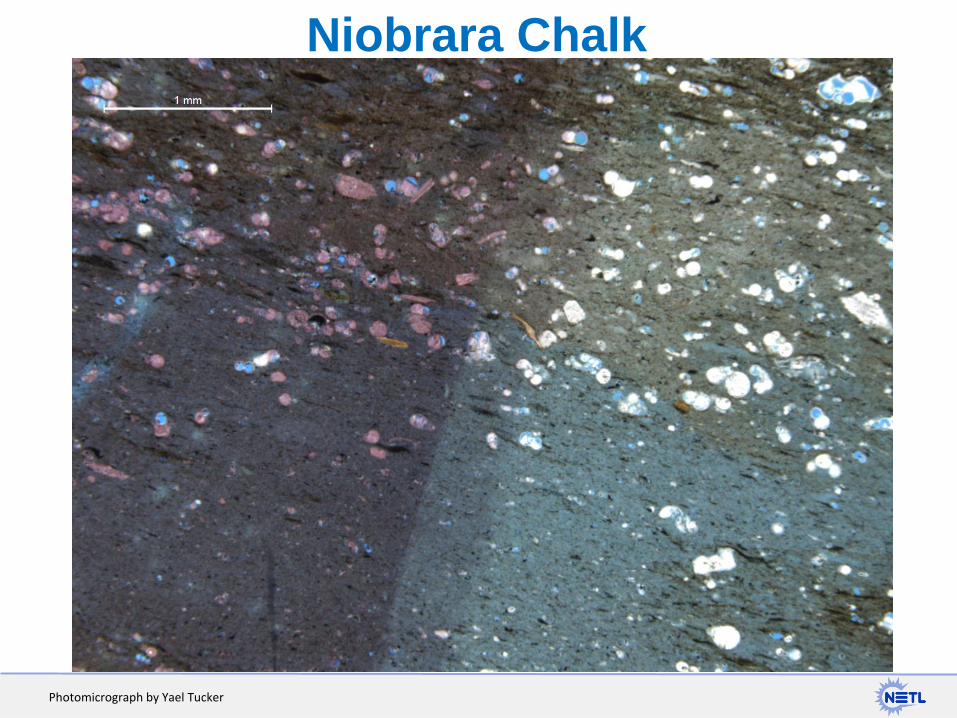
Niobrara Chalk
Photomicrograph by Yael Tucker

Niobrara Chalk 320X
Photomicrograph by Yael Tucker
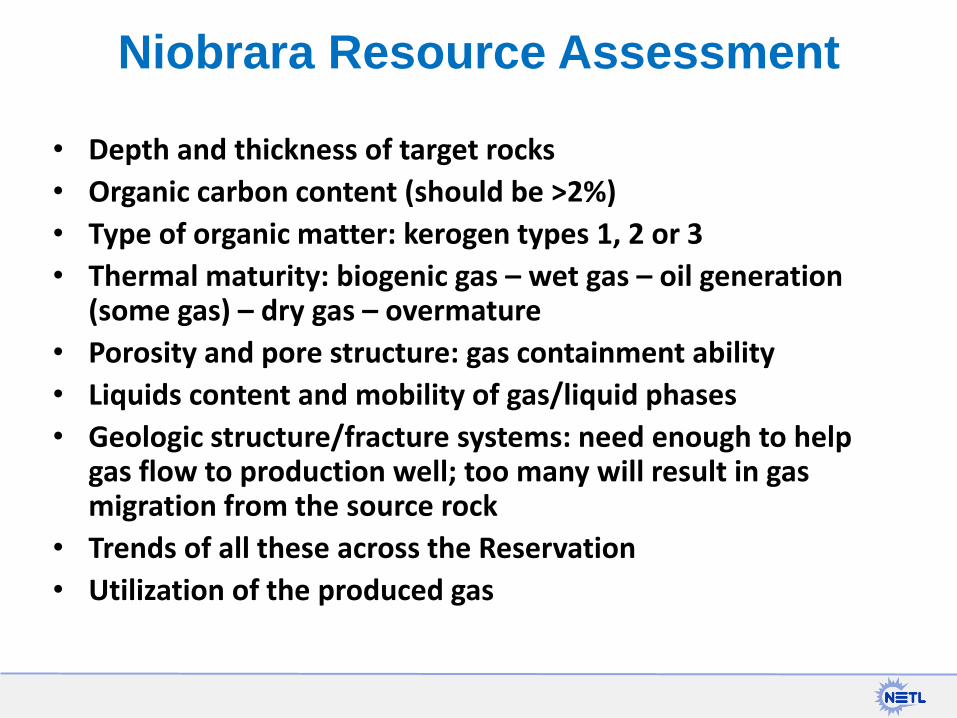
• Depth and thickness of target rocks
• Organic carbon content (should be >2%)
• Type of organic matter: kerogen types 1, 2 or 3
• Thermal maturity: biogenic gas – wet gas – oil generation (some gas) – dry gas – overmature
• Porosity and pore structure: gas containment ability
• Liquids content and mobility of gas/liquid phases
• Geologic structure/fracture systems: need enough to help gas flow to production well; too many will result in gas migration from the source rock
• Trends of all these across the Reservation
• Utilization of the produced gas
Niobrara Resource Assessment
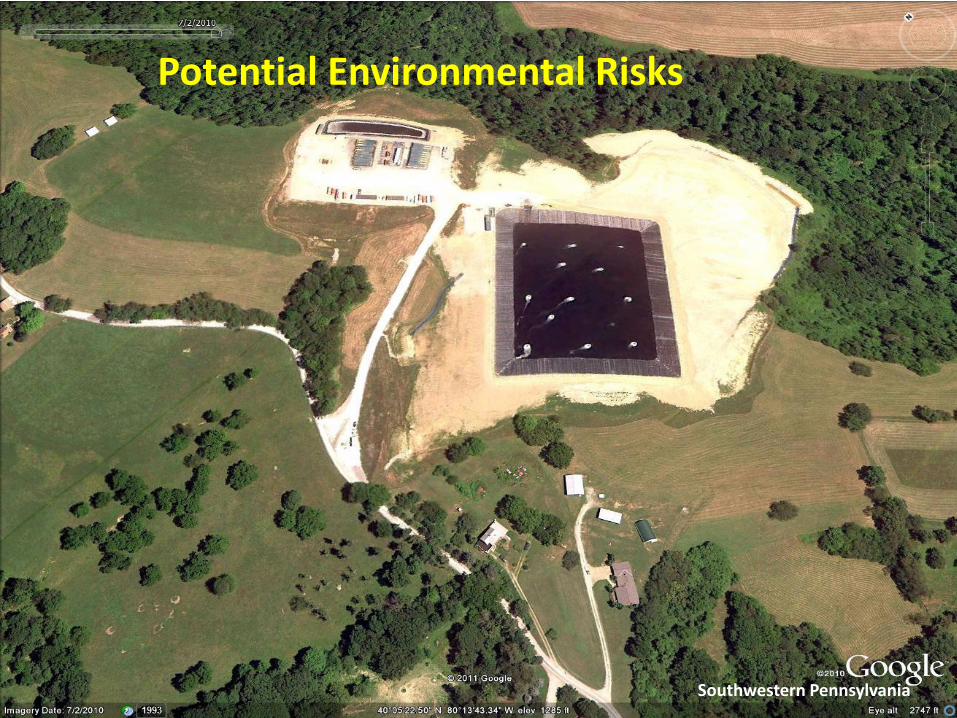
Southwestern Pennsylvania
Potential Environmental Risks

Drilling operations, Greene Co., PA, 2011 (Photos by D. Soeder)

Hydraulic fracturing operations near Waynesburg, PA, 2011 (Photo by D. Soeder)

1. Hydraulic fracturing can directly contaminate groundwater (Myers, 2012)
2. Hydraulic fracturing introduces natural gas into groundwater (Osborn et al., 2011)
3. Hydraulic fracturing of shale releases more greenhouse gas than burning coal (Howarth et al., 2011)
Alarming Assertions
"Seem logical" - but are they?

• Myers’ paper is a modeling exercise with no data; simulates five scenarios
• Gas shales are gas-saturated, and gas is the mobile phase. The partial water saturation present in gas shales is not mobile (Soeder et al., 1986)
• The Duke study offers no baseline data of pre-drilling methane.
• Baseline data show that methane is ubiquitous in northeastern PA groundwater, and appears to have migrated upward along natural fracture systems from shallow geologic sources (Molofsky et al., 2012)
• The Cornell paper admits up front that their leakage data are very uncertain, but draws broad conclusions anyway.
• Greenhouse gas life cycle calculations for natural gas suffer huge levels of uncertainty in the data on leakage downstream, midstream and upstream, ranging from 1% to 11% of throughput (Stephenson et al., 2011)
Looking a bit more closely…
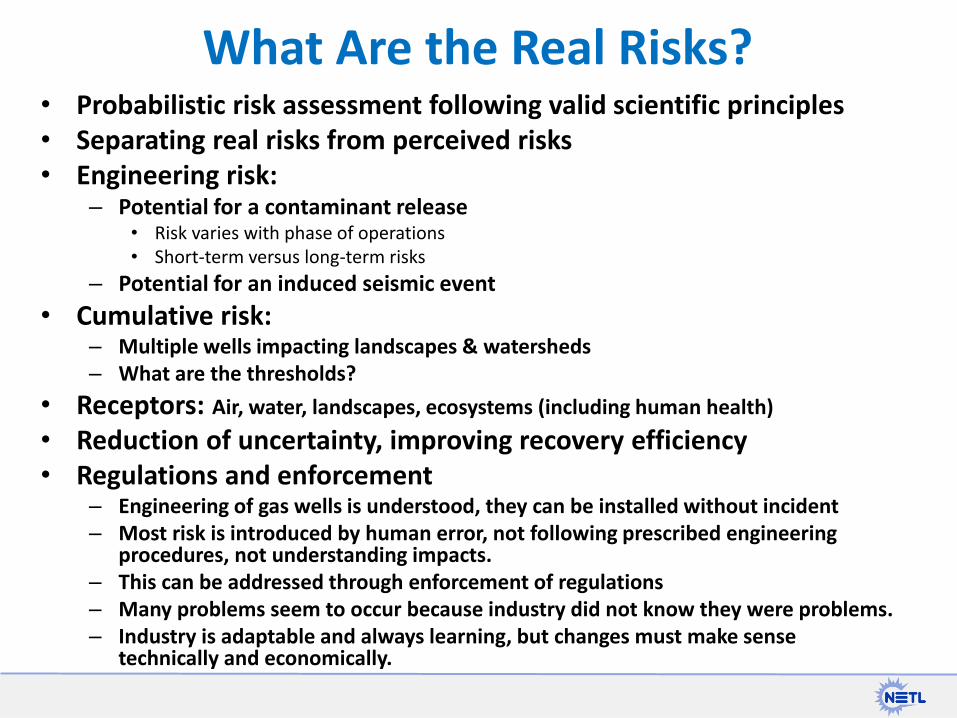
• Probabilistic risk assessment following valid scientific principles • Separating real risks from perceived risks • Engineering risk:
– Potential for a contaminant release • Risk varies with phase of operations • Short-term versus long-term risks
– Potential for an induced seismic event
• Cumulative risk: – Multiple wells impacting landscapes & watersheds – What are the thresholds?
• Receptors: Air, water, landscapes, ecosystems (including human health)
• Reduction of uncertainty, improving recovery efficiency • Regulations and enforcement
– Engineering of gas wells is understood, they can be installed without incident – Most risk is introduced by human error, not following prescribed engineering
procedures, not understanding impacts. – This can be addressed through enforcement of regulations – Many problems seem to occur because industry did not know they were problems. – Industry is adaptable and always learning, but changes must make sense
technically and economically.
What Are the Real Risks?

Multi-Agency Environmental Assessment
Risk Assessment
Data Science
Base
Platforms/Tools/Diagnostics
Direction from DOE Secretary Chu in 2011: Assess environmental risk of oil and gas: 1) unconventionals; 2) deepwater/frontier Executive Order from President Obama in April 2012: DOE, USGS and EPA are to jointly investigate risks from hydraulic fracturing. • Assess the risks and receptors • Research focus: UOG national plan, case studies (Marcellus, Barnett, Bakken) • Plan completed November 2012, sent to White House for review.

DOE Risk Assessment for Shale Gas Development
Goal: Deliver Integrated Assessments for • Fugitive Air Emissions and GHG • Produced Water Management • Subsurface Migration of Gas and Fluids • Induced Seismicity
Research Plan Organization • Science Base to Support Assessments • Tool for Data Management and Model Baselines • Development of Integrated Assessments
•Field Data to establish baselines and impacts of processes •Laboratory Data for simulations and confirmation of field data •Computational Tools to characterize and predict system baselines and behavior
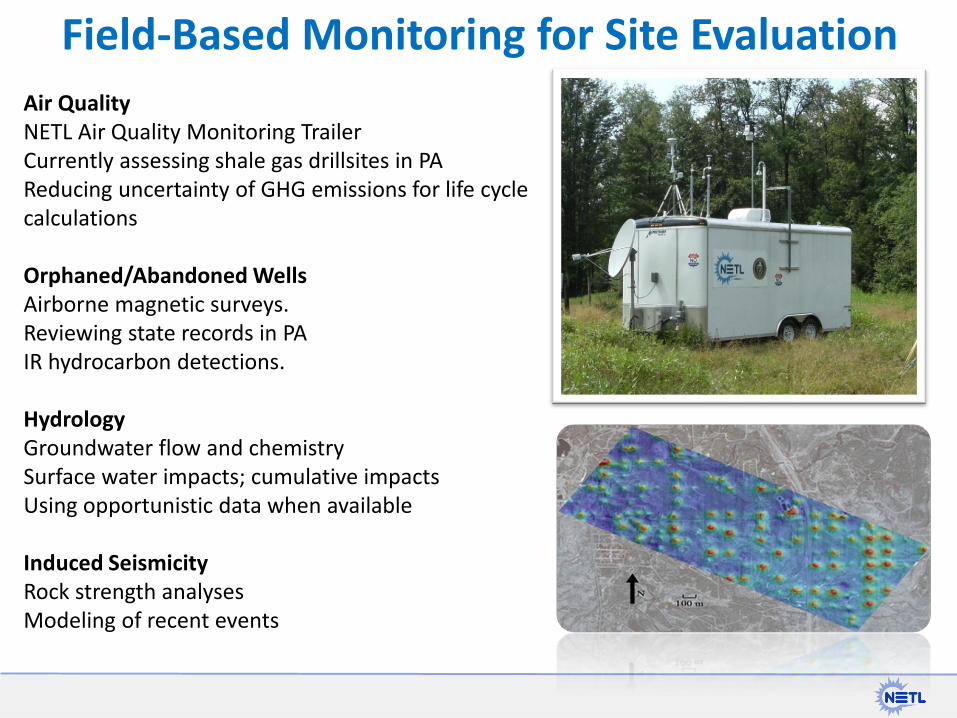
Air Quality NETL Air Quality Monitoring Trailer Currently assessing shale gas drillsites in PA Reducing uncertainty of GHG emissions for life cycle calculations Orphaned/Abandoned Wells Airborne magnetic surveys. Reviewing state records in PA IR hydrocarbon detections. Hydrology Groundwater flow and chemistry Surface water impacts; cumulative impacts Using opportunistic data when available Induced Seismicity Rock strength analyses Modeling of recent events
Field-Based Monitoring for Site Evaluation
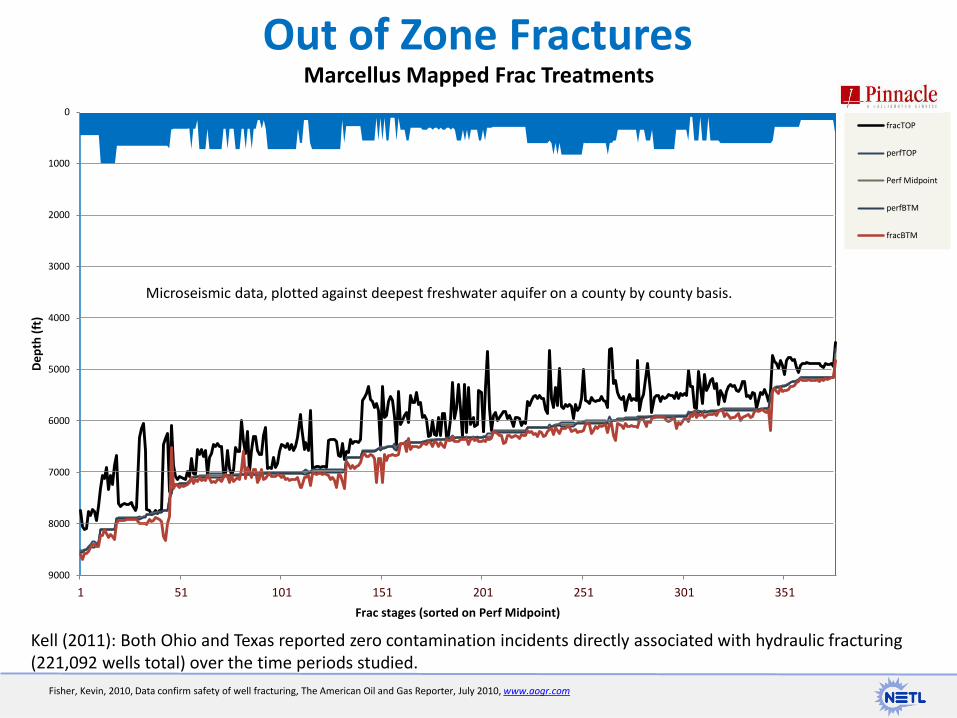
Out of Zone Fractures
Fisher, Kevin, 2010, Data confirm safety of well fracturing, The American Oil and Gas Reporter, July 2010, www.aogr.com
0
1000
2000
3000
4000
5000
6000
7000
8000
9000
1 51 101 151 201 251 301 351
De
pth
(ft
)
Frac stages (sorted on Perf Midpoint)
Marcellus Mapped Frac Treatments
fracTOP
perfTOP
Perf Midpoint
perfBTM
fracBTM
Microseismic data, plotted against deepest freshwater aquifer on a county by county basis.
Kell (2011): Both Ohio and Texas reported zero contamination incidents directly associated with hydraulic fracturing (221,092 wells total) over the time periods studied.
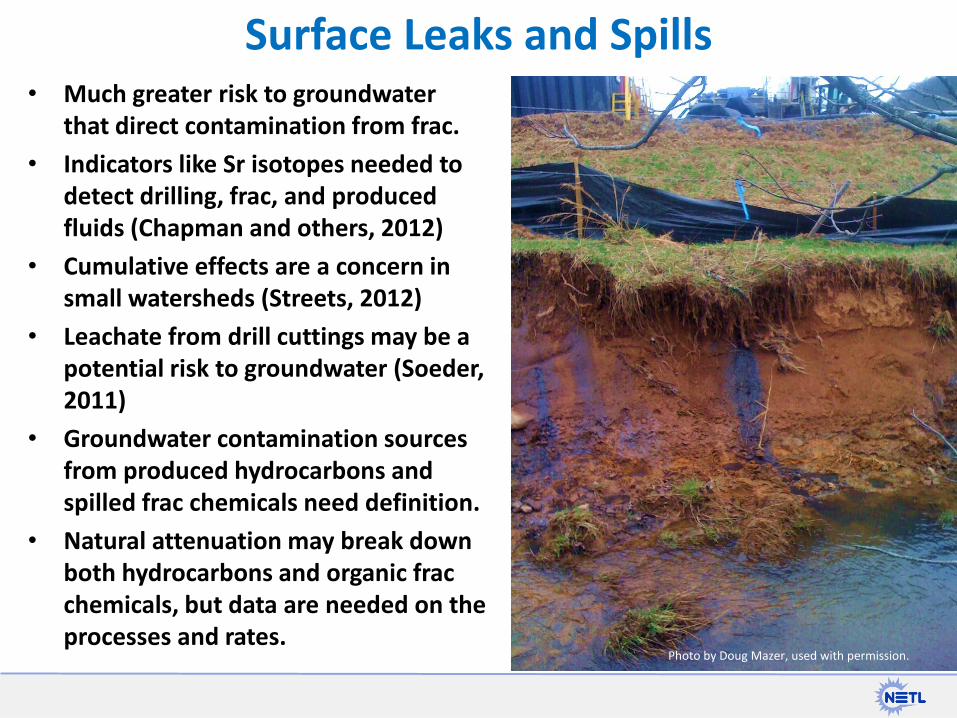
• Much greater risk to groundwater that direct contamination from frac.
• Indicators like Sr isotopes needed to detect drilling, frac, and produced fluids (Chapman and others, 2012)
• Cumulative effects are a concern in small watersheds (Streets, 2012)
• Leachate from drill cuttings may be a potential risk to groundwater (Soeder, 2011)
• Groundwater contamination sources from produced hydrocarbons and spilled frac chemicals need definition.
• Natural attenuation may break down both hydrocarbons and organic frac chemicals, but data are needed on the processes and rates.
Surface Leaks and Spills
Photo by Doug Mazer, used with permission.
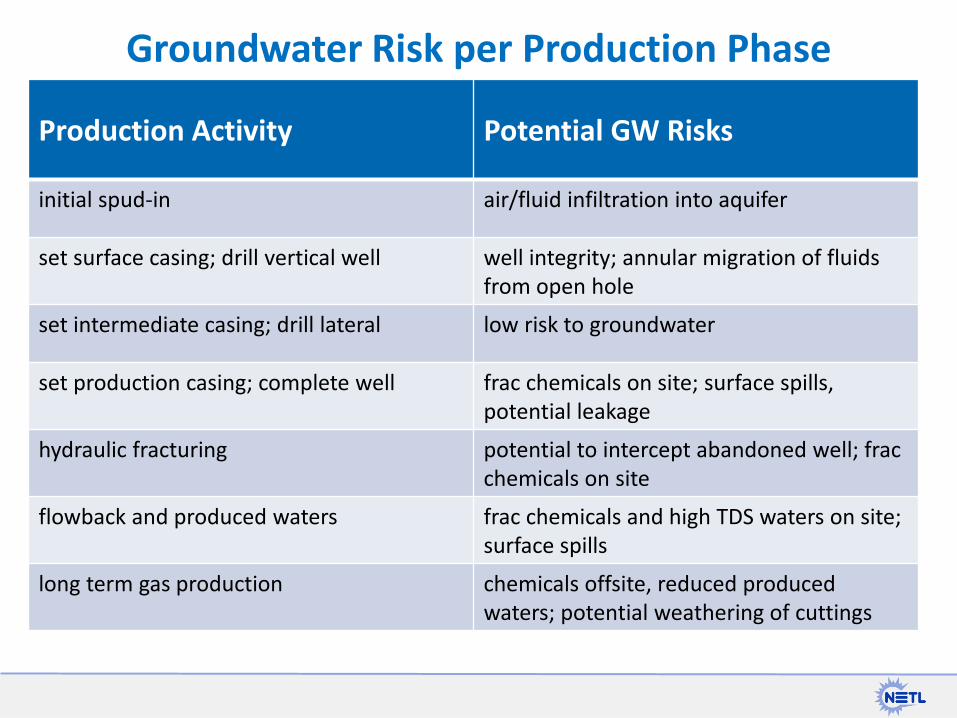
Production Activity Potential GW Risks
initial spud-in air/fluid infiltration into aquifer
set surface casing; drill vertical well well integrity; annular migration of fluids from open hole
set intermediate casing; drill lateral low risk to groundwater
set production casing; complete well frac chemicals on site; surface spills, potential leakage
hydraulic fracturing potential to intercept abandoned well; frac chemicals on site
flowback and produced waters frac chemicals and high TDS waters on site; surface spills
long term gas production chemicals offsite, reduced produced waters; potential weathering of cuttings
Groundwater Risk per Production Phase
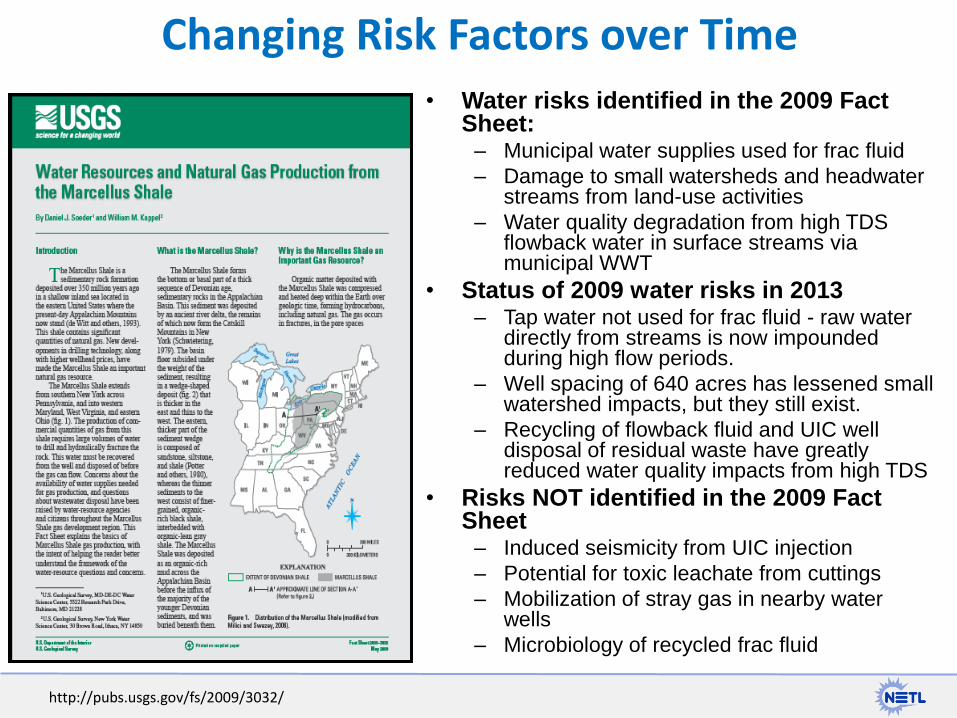
• Water risks identified in the 2009 Fact Sheet: – Municipal water supplies used for frac fluid
– Damage to small watersheds and headwater streams from land-use activities
– Water quality degradation from high TDS flowback water in surface streams via municipal WWT
• Status of 2009 water risks in 2013 – Tap water not used for frac fluid - raw water
directly from streams is now impounded during high flow periods.
– Well spacing of 640 acres has lessened small watershed impacts, but they still exist.
– Recycling of flowback fluid and UIC well disposal of residual waste have greatly reduced water quality impacts from high TDS
• Risks NOT identified in the 2009 Fact Sheet – Induced seismicity from UIC injection
– Potential for toxic leachate from cuttings
– Mobilization of stray gas in nearby water wells
– Microbiology of recycled frac fluid
Changing Risk Factors over Time
http://pubs.usgs.gov/fs/2009/3032/
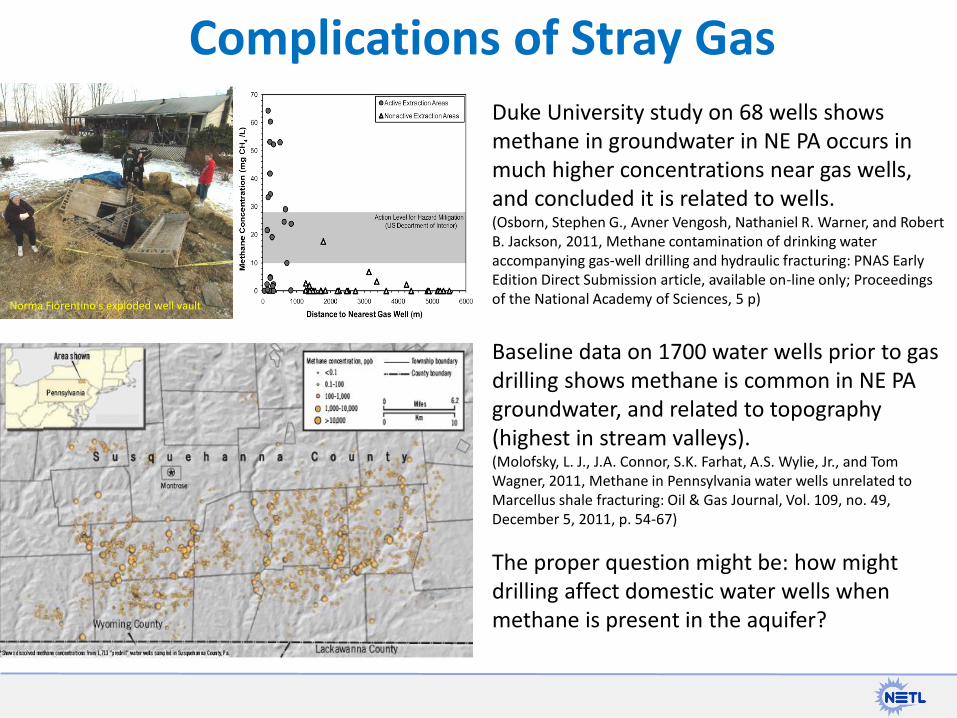
Complications of Stray Gas Duke University study on 68 wells shows methane in groundwater in NE PA occurs in much higher concentrations near gas wells, and concluded it is related to wells. (Osborn, Stephen G., Avner Vengosh, Nathaniel R. Warner, and Robert B. Jackson, 2011, Methane contamination of drinking water accompanying gas-well drilling and hydraulic fracturing: PNAS Early Edition Direct Submission article, available on-line only; Proceedings of the National Academy of Sciences, 5 p)
Baseline data on 1700 water wells prior to gas drilling shows methane is common in NE PA groundwater, and related to topography (highest in stream valleys). (Molofsky, L. J., J.A. Connor, S.K. Farhat, A.S. Wylie, Jr., and Tom Wagner, 2011, Methane in Pennsylvania water wells unrelated to Marcellus shale fracturing: Oil & Gas Journal, Vol. 109, no. 49, December 5, 2011, p. 54-67)
The proper question might be: how might drilling affect domestic water wells when methane is present in the aquifer?
Norma Fiorentino's exploded well vault
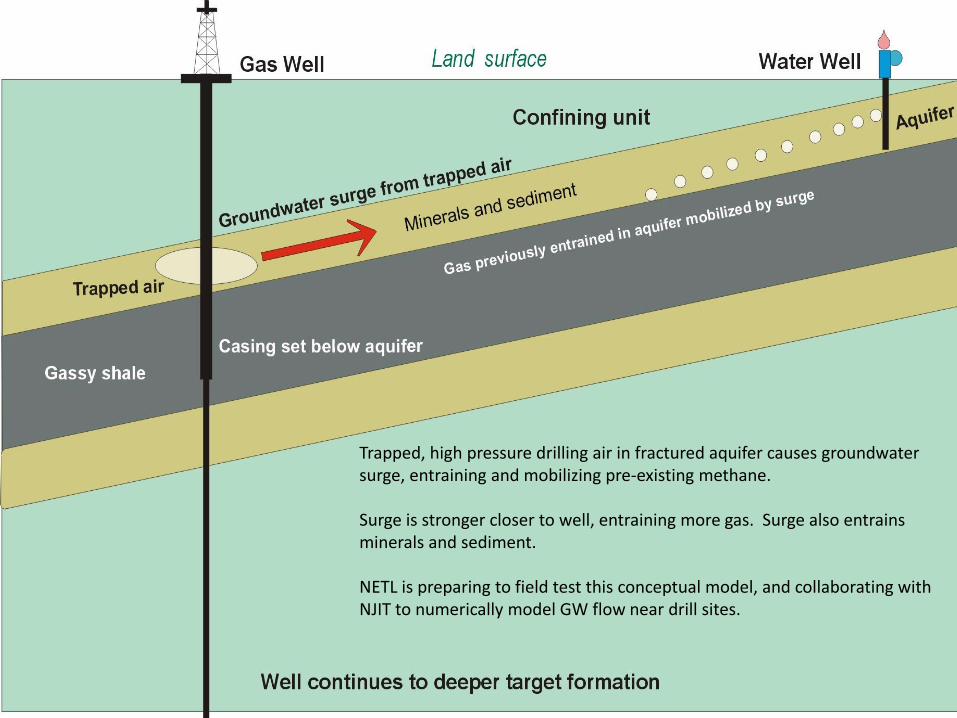
Trapped, high pressure drilling air in fractured aquifer causes groundwater surge, entraining and mobilizing pre-existing methane. Surge is stronger closer to well, entraining more gas. Surge also entrains minerals and sediment. NETL is preparing to field test this conceptual model, and collaborating with NJIT to numerically model GW flow near drill sites.
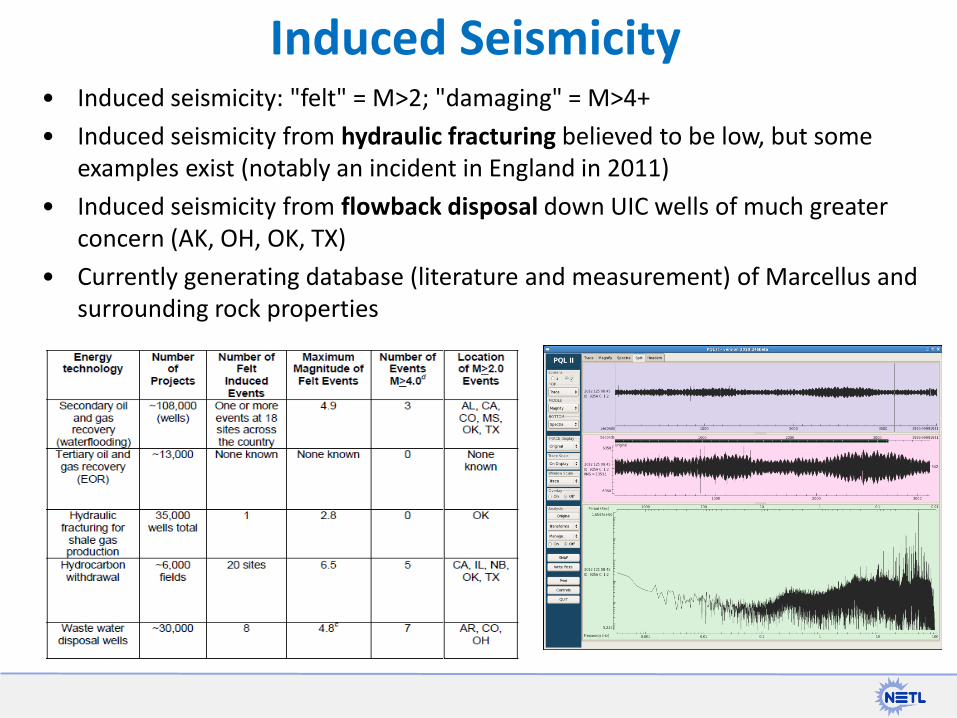
• Induced seismicity: "felt" = M>2; "damaging" = M>4+
• Induced seismicity from hydraulic fracturing believed to be low, but some examples exist (notably an incident in England in 2011)
• Induced seismicity from flowback disposal down UIC wells of much greater concern (AK, OH, OK, TX)
• Currently generating database (literature and measurement) of Marcellus and surrounding rock properties
Induced Seismicity
• DOE National Risk Assessment Partnership (NRAP) – Cooperative effort among NETL, LBNL, LLNL, LANL, and PNNL
– Scenario-based, site modeling for carbon dioxide storage in engineered geologic systems
• Integrated Assessment Models (IAM) – Probabilistic assessment of system risk (multi-site)
– Use feature-event-process (FEP) scenarios and probabilities
– Develop high fidelity, validated models of system components (Design Basis Document)
– Reduce uncertainty and develop reduced order models (ROMs)
– Integrate ROMs through IAM to predict total system performance, interactions, individual and cumulative risk
– Calibrate using field data, validate by monitoring
• Sometimes called a site performance assessment
• Adapt and modify for unconventional oil and gas
Integrated Risk Assessment
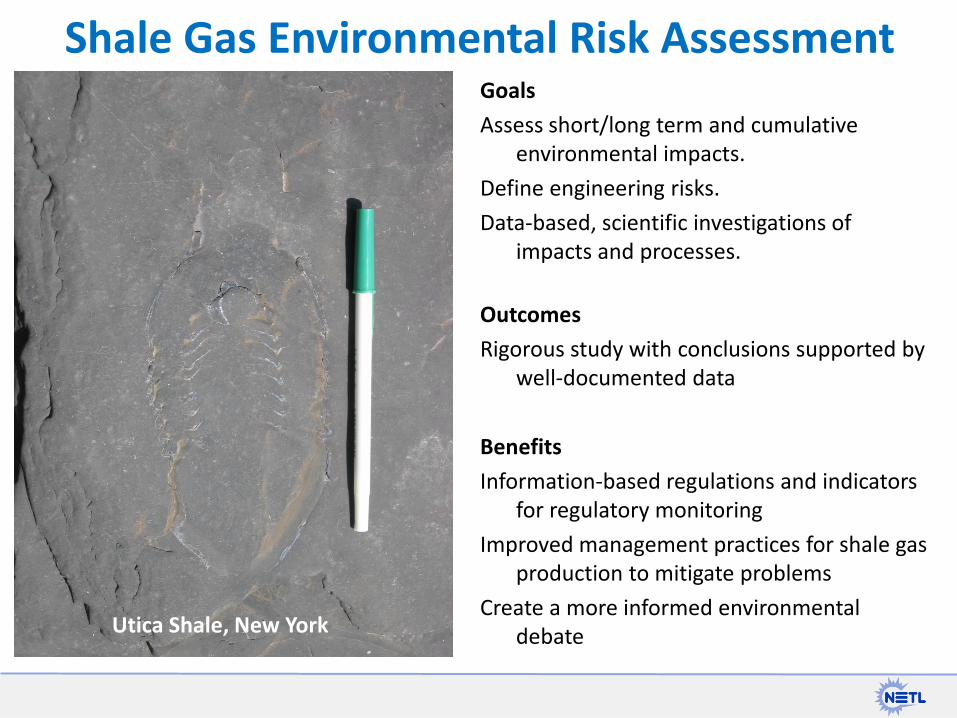
Goals
Assess short/long term and cumulative environmental impacts.
Define engineering risks.
Data-based, scientific investigations of impacts and processes.
Outcomes
Rigorous study with conclusions supported by well-documented data
Benefits
Information-based regulations and indicators for regulatory monitoring
Improved management practices for shale gas production to mitigate problems
Create a more informed environmental debate
Shale Gas Environmental Risk Assessment
Utica Shale, New York