the economic impact of potato production … · potato production and processing activities...
TRANSCRIPT

THE ECONOMIC IMPACT OF POTATO
PRODUCTION AND PROCESSING
IN WASHINGTON STATE
By
NICK JOHN BELEICIKS
A thesis submitted in partial fulfillment of the requirements for the
degree of
MASTERS OF ARTS IN AGRICULTURAL ECONOMICS
WASHINGTON STATE UNIVERSITY Department of Agricultural Economics
May 2005

ii
To the Faculty of Washington State University: The members of the Committee appointed to examine the thesis of NICK JOHN BELEICIKS find it satisfactory and recommend that it be accepted.
_________________________ Chair
_________________________
_________________________

iii
ACKNOWLEDGEMENTS
I wish to express gratitude to Dr. David Holland for introducing me to
IMPLAN, giving me this opportunity, and helping me with every aspect of this project. I
would also like to thank Dr. Tom Schotzko and Dr. Hayley Chouinard for giving me
helpful information and a heads-up whenever needed. To the faculty, staff, and students
in the Department of Agricultural Economics, thank you for always answering my
seemingly endless string of questions.
My thanks go out to Dennis Conley, 2004 Washington State Potato Industry
Honoree, who provided detailed information about the Washington State potato
processing industry. And thanks to Scott Steinback who provided the technical
knowledge necessary for modifying IMPLAN.
Special thanks to the Washington State Potato Commission for funding this
research.
My love goes out to my wife Mollie, and son Harvey, who inspired and
supported me throughout the M.A. program. If it were not for their patience while I was
away working, and their amazing tolerance for listening to potato facts, this thesis would
not have been possible. Thank you Mollie and Harvey.
Last, but not least, thank you to my parents and in-laws for their support and
encouragement throughout my schooling.

iv
THE ECONOMIC IMPACT OF POTATO
PRODUCTION AND PROCESSING
IN WASINGTON STATE
Abstract
by Nick John Beleiciks, M.A. Washington State University
May 2005
Chair: David W. Holland The potato industry is a large part of the agricultural base in Washington State and
the Columbia Basin area of Oregon. Potato production and processing activities purchase
some of their inputs from other local industries. The employees of potato farms and
processing plants spend part of their income on local goods and services. These
purchases magnify the total economic impact of potatoes on the regional economy. The
goal of this thesis is to accurately estimate the potato’s economic impacts on the
Washington economy.
Using IMPLAN Input-Output software, a customized model of the Washington-
CB area’s economy is constructed for the year 2003. The model focuses on the potato
industry in more detail than possible with an ordinary IMPLAN model. Instructions for
IMPLAN modification are included to explain the customization process.
Data from the model show that the 2003 Washington-CB potato crop, worth $577
million, is manufactured into $1,626 million of potato products. The potato producing

v
and processing industry employs 9,114 people in the study area, with 5,907 of them
employed in the frozen potato sector.
Results from the impact analysis show that the Washington-CB area exports
$1,402 million worth of potatoes and potato products in 2003. The regional effects of
these foreign and domestic exports are measured in terms of Output (Sales) at $3,480
million in sales; Value Added at $1,374 million; and Employment at 20,703 jobs. The
largest non-potato benefactor from exports is Motor Freight and Transportation at $286
million in sales and 2,359 in jobs.

vi
TABLE OF CONTENTS
Page
ACKNOWLEDGEMTNS ........................................................................................... iii
ABSTRACT................................................................................................................ iv
TABLE OF CONTENTS ............................................................................................ vi
LIST OF TABLES ...................................................................................................... viii
Chapter
1. INTRODUCTION ..................................................................................... 1
Overview of Local Potato Production................................................... 1 Overview of Local Potato Processing ................................................... 3 Washington-CB Model Objectives ....................................................... 4
2. INPUT-OUTPUT AND IMPLAN.............................................................. 6
Input-Output Economics ...................................................................... 6 IMPLAN Software ............................................................................... 10
3. PREVIOUS STUDIES............................................................................... 13 4. WASHINGTON-CB MODEL ................................................................... 16
Base Model .......................................................................................... 16 IMPLAN Modification......................................................................... 17 Industry Data........................................................................................ 18 Production Function Construction ........................................................ 20 Industry Balance Sheets ....................................................................... 22 Commodity Balance Sheets.................................................................. 31 Model Reconstruction .......................................................................... 32
5. IMPACT ANALYSIS................................................................................ 39
Final Demand....................................................................................... 39 Transportation and Marketing Margins................................................. 41 Potato Industry Impact Results ............................................................. 41

vii
6. SUMMARY AND ADDITIONAL RESEARCH ............................................. 51
Summary.............................................................................................. 51 Additional Research ............................................................................. 52
LITERATURE CITED................................................................................................ 53 APPENDIXES
A. IMPACT AGGREGATION....................................................................... 56
B. IMPLAN MODIFICATION ...................................................................... 59
Acknowledgements .............................................................................. 60 IMPLAN Modification Overview......................................................... 60 ACCESS Overview.............................................................................. 61 ACCESS Table Exportation ................................................................. 62 EXCEL File Importation ...................................................................... 63 Table Indexes ....................................................................................... 63 Potential Errors .................................................................................... 64
C. SCOTT STEINBACK’S FISHERIES APPENDICES................................ 66

viii
LIST OF TABLES
Table Page
1.1. Washington-CB and U.S. Potato Crop, 2003.................................................... 2
1.2. Regional Potato Processors, 2003 .................................................................... 5
2.1. Simple A Matrix .............................................................................................. 8
2.2. Simple (I-A) Inverse ........................................................................................ 9
4.1. New Potato Industry IMPLAN Equivalents...................................................... 17
4.2. Washington-CB Disposition and Prices, 2003 .................................................. 19
4.3. Potato Industry Estimated Employment and Average Wage, 2003 ................... 19
4.4. Potato Industry Balance Sheet.......................................................................... 24
4.5. Fresh Pack Potato Industry Balance Sheet........................................................ 25
4.6. Dehydrated Potato Industry Balance Sheet....................................................... 26
4.7. Frozen Potato Industry Balance Sheet .............................................................. 27
4.8. Potato Chip Industry Balance Sheet ................................................................. 28
4.9. Potato Commodity Balance Sheet .................................................................... 34
4.10. Fresh Pack Potato Commodity Balance Sheet .................................................. 35
4.11. Dehydrated Potato Commodity Balance Sheet ................................................. 36
4.12. Frozen Potato Commodity Balance Sheet ........................................................ 37
4.13. Potato Chip Commodity Balance Sheet............................................................ 38
5.1. Potato Industry Domestic Exports, 2003 .......................................................... 39
5.2. Washington and Oregon Foreign Potato Exports, 2003 .................................... 40
5.3. Marketing Margins .......................................................................................... 42

ix
5.4. Impact Final Demand Values ........................................................................... 43
5.5. Output (Sales) Impact ...................................................................................... 44
5.6. Value Added Impact ........................................................................................ 46
5.7. Employment Impact......................................................................................... 48
5.8. Fifteen Most Affected Non-Potato Industries, Jobs .......................................... 50
A.1. Aggregation Scheme........................................................................................ 57
B.1. Modified ACCESS Tables ............................................................................... 62
B.2. Index View for SACommodity Sales ACCESS Table ...................................... 64
C.1. IMPLAN Pro Tables ........................................................................................ 85
C.2. Summary of IMPLAN Modification Procedures .............................................. 86

1
CHAPTER 1
INTRODUCTION
Overview of Local Potato Production
One of the most productive potato producing areas in the world is the Central
Columbia Basin of the Pacific Northwest, consisting of Adams, Benton, Franklin, Grant
and Walla Walla Counties in Washington State, and Morrow and Umatilla Counties in
Oregon. Although the Columbia Basin counties straddle the Columbia River, which
separates them into two different states, the counties are agriculturally and industrially
similar. For the purposes of this thesis, these seven counties and the rest of Washington
State are referred to as the Washington-CB area.
The Columbia Basin’s agricultural environment is characterized by rich volcanic
soil, a long season, and semi-arid weather (Buteau 1986). Water availability increased
with improvements to the Columbia Basin Irrigation Project beginning in 1949 (USBR
1998). Large-scale production of the Russet Burbank potato in the area was made
possible by this near perfect combination of conditions.
Potato yields of 573 cwt an acre were average in Washington and Oregon for
2003, while the average yield for the rest of the United States was 367 cwt an acre
(USDA 2004). Morrow County and Umatilla County produced 7.17 million cwt and
6.115 million cwt of potatoes respectively, in 2003 (ODA 2004). Washington State
produced 93.15 million cwt of potatoes in 2003, making the total Washington-CB

2
production 106.435 million cwt, or 23 percent of the 2003 United States potato crop.
Table 1.1 details the 2003 potato crop at local county and national levels.
Table 1.1 Washington-CB and U.S. Potato Crop, 2003
County Acres
HarvestedYield
(cwt/acre)Production
(cwt) Benton 31,500 640 20,175,000Grant 34,500 580 20,025,000Adams 30,500 585 17,850,000Franklin 32,000 555 17,770,000Walla Walla 11,000 680 7,480,000Morrow 12,900 556 7,170,000Umatilla 10,900 561 6,115,000Skagit 10,000 370 3,695,000Lincoln 5,000 600 3,000,000Klickitat 1,500 560 840,000Yakima 2,000 395 790,000Whatcom 2,000 375 750,000Rest of WA 1,500 375 570,000Kittitas 500 410 205,000Rest of U.S. 1,062,800 331 351,379,000WA-CB Totals 185,800 573 106,435,000U.S. Totals 1,248,600 367 457,814,000
WA-CB Percent of U.S. Crop
15% 156% 23%
Source: USDA, Quick Stats: Agricultural Statistics Data Base,www.nass.usda.gov/QuickStats/
3
Overview of Local Potato Processing
The Washington-CB potato-processing industry in 2003 consisted of the
fourteen frozen potato processors, three dehydration processors, and potato chip
manufacturers listed in Table 1.2. as well as numerous fresh pack potato sheds
Frozen French fries are the main product manufactured by frozen potato
producers. Byproducts from French fries are typically frozen hash brown or puffs, which
are made from cuttings of potatoes to short to become fries. Unusable pieces are often
turned into potato slurry and used as cattle feed, leaving very little solid waste and
associated disposal costs (Conley 2005). Washington-CB French fry producers also
benefit from shorter shipping routes to Asia than their Idaho and Canadian competitors.
Dehydrated processors manufacture instant mashed potatoes, potato flour and
starch from potatoes that graded-out from fresh pack houses and frozen processors.
Much of these products are manufactured into other food products before final
consumption.
Potato chip manufacturing usually occurs in factories with the ability to
produce non-potato based snacks as well. As opposed to other potato processors, which
are often located in rural areas where potatoes are grown, chip producers are often
located near metropolitan areas to reduce the high costs of shipping packaged potatoes.
Fresh pack sheds are smaller in scale than other potato processors, and also
are located near where potatoes are produced. These sheds are where fresh potatoes are
graded and washed before being packaged for wholesale and retail sale.

4
Washington-CB Model Objectives
The goal of this thesis is to construct an accurate Input-Output model of the
Washington State and Oregon Columbia Basin potato production and processing
industry, while at the same time demonstrating how IMPLAN can be modified to provide
custom detail for industries of interest. An impact analysis is run with the model to
estimate how potato and potato product exports affect the overall Washington-CB
economy. The results are detailed with concern to Value Added, Output, and
Employment.

5
Table 1.2. Regional Potato Processors, 2003 Processor Plant Product Basic American Foods Moses Lake, WA Dehydrated
Frito-Lay, Inc. Vancouver, WA Chips
Jones Produce Dehy Quincy, WA Dehydrated
J.R. Simplot Co. Hermiston, OR* Frozen
Moses Lake, WA Frozen
Othello, WA Frozen
Pasco, WA Frozen
Lamb-Weston Boardman, OR Frozen
Connell, WA Frozen
Hermiston, OR Frozen
Pasco, WA Frozen
Quincy, WA Frozen
Richland, WA Frozen
Logan International Boardman, OR Frozen
McCain Foods, Inc. Othello, WA Frozen
Ochoa Foods Warden, WA Frozen
Oregon/Washington Potato Co. Boardman, OR Dehydrated
Reser’s Fine Foods Pasco, WA Frozen
Snakcorp, Inc. Hermiston, OR Chips
Tim’s Cascade Snacks Algona, WA Chips
Twin City Foods Prosser, WA Frozen
* Closed November, 2004

6
CHAPTER 2
INPUT-OUTPUT AND IMPLAN
Input-Output Economics
Input-Output (I/O) economic analysis was developed by Wassily Leontief, for
which he received the Nobel Prize in 1973 (Leontief 1986). Leontief’s model starts with
equations of supply and demand for the whole economy. Supply is assumed to meet
demand. Industry supply responds with a new level of output that meets the changes in
demand, and a new general equilibrium in the economy is reached. In this study, the
economic impact of potato production and processing final demand in Washington State
is found using I/O analysis. A model is built that reveals how the output of potato and
non-potato industries in the Washington-CB economy respond to meet the demand
generated by potato product exports.
An I/O model is a system simultaneous of simultaneous linear equations that
traces the supply of and demand for products at a point in time (year) for an economy.
The two basic types of I/O models are Type I models, where consumption by households
is considered exogenous, and Type SAM models, where household consumption is
considered endogenous (Holland and Yeo 2001). The exogenous variables in a Type
SAM model are capital investment, inventory additions and deletions, government
spending, and domestic and foreign trade. The Washington-CB model is Type SAM,
again with final demand for potato products being a result of exports to the rest of the
United States and foreign exports.

7
There are two important assumptions in Input-Output models that need to be
considered. First, I/O models are assumed to have fixed prices, where the price of an
input does not respond to a change in demand. This is because each industry uses a
combination of fixed inputs for the production of its commodity, a Leontief production
function. The second assumption is that industries in an I/O model experience constant
returns to scale, meaning a doubling of demand for a commodity necessitates an exact
doubling of all inputs to meet the increased demand. While these assumptions may not
accurately reflect all industries, they are necessary to provide the framework I/O analysis
uses.
Construction of an I/O model begins with the formation of a matrix of
technical coefficients, called the A matrix. The A matrix is a table of all the production
functions within an economy. The production functions are arranged so each is a column
in the A matrix. Each element in the A matrix is an input coefficient representing the
amount of the row industry needed to produce one unit of the column industry. The rows
then represent the supply from each industry needed to produce the column industry
output. These elements are called Gross Absorption Coefficients.
Table 2.1. is an overly simple example of an A matrix for a hypothetical
economy that consist of three industries, Agriculture, Ag-Related, and Other. In this
simple economy for example, the Agriculture sector produces agricultural output where
total production costs are a function of 5 percent Agricultural products (itself), 35 percent
Ag-Related products, and 30 percent Other products. The remaining 30 percent consists
of value added inputs such as labor and returns to capital, which are not included in the A

8
matrix. Units of output here are in dollar terms, so when inter-industry requirements are
not considered, $1 million of Agriculture output requires $50,000 of Agriculture inputs,
$350,000 of Ag-Related inputs, $300,000 of Other inputs, and $300,000 of Value Added
inputs.
Table 2.1. Simple A Matrix
into Agriculture
Industry
Ag-Related Industry
Other Industry
from 1 2 3
1 Agriculture Commodity
0.05 0.16 0.13
2 Ag-Related Commodity
0.35 0.12 0.25
3 Other Commodity
0.30 0.52 0.37
The column vector Y contains the final demands for each industry. For the
Washington-CB model, the exports of potato products and the marketing margins
required to export them are the elements that make up the Y vector, and are in dollar
measurements. The column vector X represents the output (sales) of each industry. For
the Washington-CB model, each element of the column vector X is the output of one of
the 472 industries in the study area, also measured in dollar terms. The I is an identity
matrix of the same dimensions as the A matrix. With these components, the Leontief
inverse is algebraically derived from the A matrix through these steps:

9
(1) X = AX + Y
(2) (I – A)X = Y
(3) X = (I-A) –1Y
The (I-A)-1 Leontief inverse can then be used to calculate changes in supply
due to changes in final demand. Table 2.2. is the (I-A)-1 matrix for the hypothetical
economy in Table 2.1. Multiplying the Leontief inverse by the column vector of final
demands Y, results in the solution output for each industry shown in the column vector
X.
Table 2.2. Simple (I-A) Inverse
into Agriculture
Industry
Ag-Related Industry
Other Industry
from 1 2 3
1 Agriculture Commodity
1.42 0.57 0.52
2 Ag-Related Commodity
0.99 1.88 0.95
3 Other Commodity
1.5 1.82 2.62
Equation (4) is the matrix representation of the impact from a $2 million
increase in agricultural final demand and a $1 million increase in agricultural related final
demand, when inter-industry requirements are considered. The change in output is the
left side of the equation, the X column vector.

10
X Ag. Ag. Related Other Y
3.41 1.42 .57 .52 2.00(4) 3.86 = .99 1.88 .95 x 1.00
4.81 1.5 1.82 2.62 0.00
Results from the hypothetical model show a $2 million increase in final
demand for agricultural and related products requires an increase of $3.41 million in the
Agriculture sector, a $3.86 million increase the in Ag-Related sector, and a $4.81 Million
increase in the Other sector.
The X vector output increases are driven from two sources, Direct and
Indirect effects. Direct effects are the changes to the industry in which the final demand
change occurs. Direct effects in equation (4) are the $2 million for Agriculture and $1
million for Ag-Related final demands, which are embedded in the X vector output
response. Indirect effects are output changes caused by inter-industry purchases of goods
in response to changes in final demand. In equation (4), Indirect effects are the $1.41
million for Agriculture, $2.86 million for Ag-Related, and $4.81 million for Other that
make up the remainder of the vector X output response.
IMPLAN Software
IMPLAN (Impact Analysis for PLANing) was developed in 1979 by the USDA
Forest Service to assist in land and resource management planning. In 1987, work on the
databases was transferred over to the University of Minnesota, and in 1993 the Minnesota
11
IMPLAN Group, Inc. (MIG) was formed to privatize development of IMPLAN. Version
2 was released in 1999 (MIG 2004).
IMPLAN is the most widely used Input-Output software. The commonality of
IMPLAN allows easy comparison between different impact models of the same year.
The database is combined from numerous government sources, such the Bureau of
Census and the Bureau of Labor Statistics, and closely follows the Bureau of Economic
Analysis I-O study of the U.S. Economy.
Through the year 2000 database there were 528 sectors organized according to the
Standard Industrial Classification. In 2001, the IMPLAN database was changed to 509
sectors organized according to the North American Industrial Classification System
(NAICS).
IMPLAN software can be used to construct balanced social accounts at the
national, state, county, and ZIP Code level. The software also allows for some
modification of the base model data to more accurately reflect local industries. IMPLAN
data can be used to provide a descriptive model of a regional economy by providing
social and industrial statistics, as well as listing inter-industry purchases and sales in a
regional economy. IMPLAN software can also be used as a predictive model of a
regional economy of the kind described in equation (4) on page 10.
IMPLAN reports effects to a regional economy in terms of changes to three
categories: Output (sales), Value Added, and Employment. Direct and Indirect effects
are reported for all models. In Type SAM models however, households are considered
endogenous and Induced effects are also reported. Induced effects are output changes in
12
response to changes in household income because of increases or decreases in final
demand.
The Washington-CB model is a Type SAM, year 2000 IMPLAN model with
472 industries, 5 of which are potato industries that have been added manually. The
model impact is run in the year 2003, and results are reported in 2003 dollars. The
impact is the value of potato industry exports and associated margins. These values are
the Y column vector of final demand. The Type SAM A matrix consists of the 472
industries plus the 2,301,436 households included in the Washington-CB model. The
impact results reported in Chapter 5 are the X column vector of outputs, which is the
economic impact of potato production and processing in Washington State.

13
CHAPTER 3
PREVIOUS STUDIES
Previous studies have shown that potato production provides an important part
of Washington State’s annual agricultural output. The potato processing industries
provide jobs in rural locales with limited employment opportunities. Processed potato
products are also one of the state’s largest foreign exports. Detailed studies of the entire
Washington State potato industry need to be conducted periodically to provide decision
makers with a complete understanding of the potato’s contribution to the State’s
economy.
The first comprehensive report on the Washington State processed potato
industry by Buteau and O’Rourke (1986) describes the major changes to the industry as
frozen potato production became the dominant processing form. The focus of the report
is Washington’s potato processing industry. Oregon and Idaho potato processing is
included for certain comparisons, and some data is presented as “Washington and Oregon
(except Malheur Co.)” (Buteau 1986, p.12). Providing French fries for the fast food
market and for export to Asia explained the growing demand for Washington’s frozen
potatoes in the years leading up to the study. The state has comparative advantage over
other potato processing areas in the country due to environmental conditions, economical
inputs, and close proximity to foreign markets. The authors predict that future demand
for frozen potato products may weaken as the U.S. population matures, but demand from
Pacific Rim countries should continue to grow.

14
An attempt to measure the socioeconomic impacts of the potato processing
industry by Bean and Runsten (1993) concentrates on the environmental, labor, and tax
issues that relate to potato processing in the Mid-Columbia Basin. The five Washington
counties and two Oregon counties that make up the Mid-Columbia Basin are included in
this study (Walla Walla County is included). The paper presents results from an
employee survey for processing plants in Connell and Othello, Washington. These
surveys show the average factory wage to be 82 percent above the current minimum
wage.
Holland and Yeo (2001) provide the only Input-Output model based analysis
that measures economic impacts of potatoes in Washington State. The model is
constructed using 1996 IMPLAN data with custom production functions provided for
five potato related industries. Washington State and Umatilla County, Oregon make up
the region included in this study. The flow of potatoes through the processing complex is
diagramed, and balance sheets are provided for each industry. Additional impacts are
generated due to potato processing waste providing feed for the State’s cattle feedlot
industries. Results show the Output Impact to be $3,014 million, and the Employment
Impact to be 27,583.
Globalwise, Inc. (2004) reports the economic impact of closing the J. R.
Simplot frozen French fry plant in Hermiston, Oregon. An IMPLAN model is
constructed with Umatilla County as the impact area, but acknowledges that impacts
from the closure will occur in Morrow County and Washington State as well. The study
mentions possible alternative uses for the building, and includes these uses in the impact.

15
This results in hypothetical, yet realistic impact scenarios that attempt not to overestimate
the closure impacts on the county. The results indicate a loss of between 945-1,080 jobs,
based on the building scenario used.
Other potato producing states report the economic impact of their respective
potato industries such as Maine’s report by Planning Decisions, Inc. (2003), and North
Dakota’s study by Coon and Leistritz (2001). When an I/O model is constructed to
estimate impacts, the potato’s relative importance in each state’s overall economy can be
compared.
Estimated impacts from other industries generated through I/O models can be
used to compare the relative importance of that industry to a state’s economy. Similar
studies in Washington have been carried out with other commodities, such as the tree
fruit industry by Jensen (2004).

16
CHAPTER 4
WASHINGTION-CB POTATO MODEL
Base Model
The Washington-CB model is created using 2000 IMPLAN data for
Washington State, plus Morrow County and Umatilla County, Oregon. Year 2000 is the
last year where IMPLAN’s sectoring scheme is organized according to the Standard
Industrial Classification (SIC). Beginning in 2001, IMPLAN is organized using the
North American Industrial Classification System (NAICS), which is not backward
compatible with SIC.
Although the 2001 IMPLAN database was the most current available when
work began on the Washington C-B model, using the year 2000 base model is justifiable
for three reasons. First, the 1996 production functions given in Holland and Yeo are
transferable into the 2000 sectoring scheme. Second, the SIC based IMPLAN structure
provides more detail for agricultural models with eight more farming sectors and three
more food manufacturing sectors than the NAICS based IMPLAN. And finally, most
coefficients do not vary much from year-to-year, and price changes specific to this model
have been adjusted manually. The impact results from the Washington-CB model should
be comparable to results from a future year 2003 base model.
A Social Accounting Matrix (SAM) is then built with IMPLAN using a total
of 533 sectors, 528 original IMPLAN sectors plus 5 new potato industry sectors. A Type
SAM model consists of industries and households, which are endogenous to the system.

17
Industry use of commodities provides the intermediate demand that drives the indirect
impact effects. Household use of commodities provides the final demand that drives the
induced impact effects. Domestic and foreign exports are exogenous to the system.
These exports provide the final demand that drives the direct impact effects.
IMPLAN Modification
Five new potato sectors are added to the IMPLAN Input-Output table
according to procedures outlined by Steinback (2005). The five new production
functions are added to IMPLAN’s base absorption table, along with industry values for
employment, foreign exports, total output, and the value added accounts. Each new
sector has an equivalent IMPLAN sector where the industry would ordinarily occur, as
shown in Table 4.1.
Table 4.1. New Potato Industry IMPLAN Equivalents
New IMPLAN
Sector Sector Description
Equivalent IMPLAN
Sector Sector Description 530 Potato 18 Vegetables 531 Fresh Pack Potato 18 Vegetables 532 Dehydrated Potato 68 Dehydrated Food Products 533 Frozen Potato 70 Frozen Fruits, Juices and Vegetables534 Potato Chips 100 Potato Chips and Similar Snacks
No downsizing adjustments are made to the original equivalent sectors where
IMPLAN would normally capture potato production and processing. These sectors are

18
left untouched in order to capture the indirect effects of purchases by other industries that
use potato based products, but are not linked with the added potato sectors in this model.
This approach at measuring indirect effects is necessary due to aggregation in the
IMPLAN sectors. An industry such as Eating & Drinking makes purchases of
Vegetables, but IMPLAN has no way to differentiate whether it actually is buying fresh
potatoes or some other type of vegetable. Therefore it is impossible to accurately
estimate the linkages between Eating & Drinking and the new sector, just Fresh Pack
Potato. The value of this intermediate purchase is still captured in Vegetables, and since
Fresh Pack Potato has no indirect effects, there is no danger of double counting.
Industry Data
Washington potato use at the state level for fresh pack, dehydrated, frozen, and
potato chips is monitored by the Washington State Potato Commision (WSPC 2004).
The disposition for Morrow and Umatilla counties is then estimated in the model using
the Washington potato use percentages. Table 4.2. illustrates the disposition of the 2003
crop using actual and estimated figures.
The Washington State Employment Security Division tracks the numbers of
employees and average wages for all industries, and publishes the information at the
6-digit NAICS level. The average annual wage for employees of the new potato sectors
is assumed the same as the wages for their equivalent NAICS sector. The number of jobs
in each new sector is estimated by dividing this average wage by the sector’s Employee
19
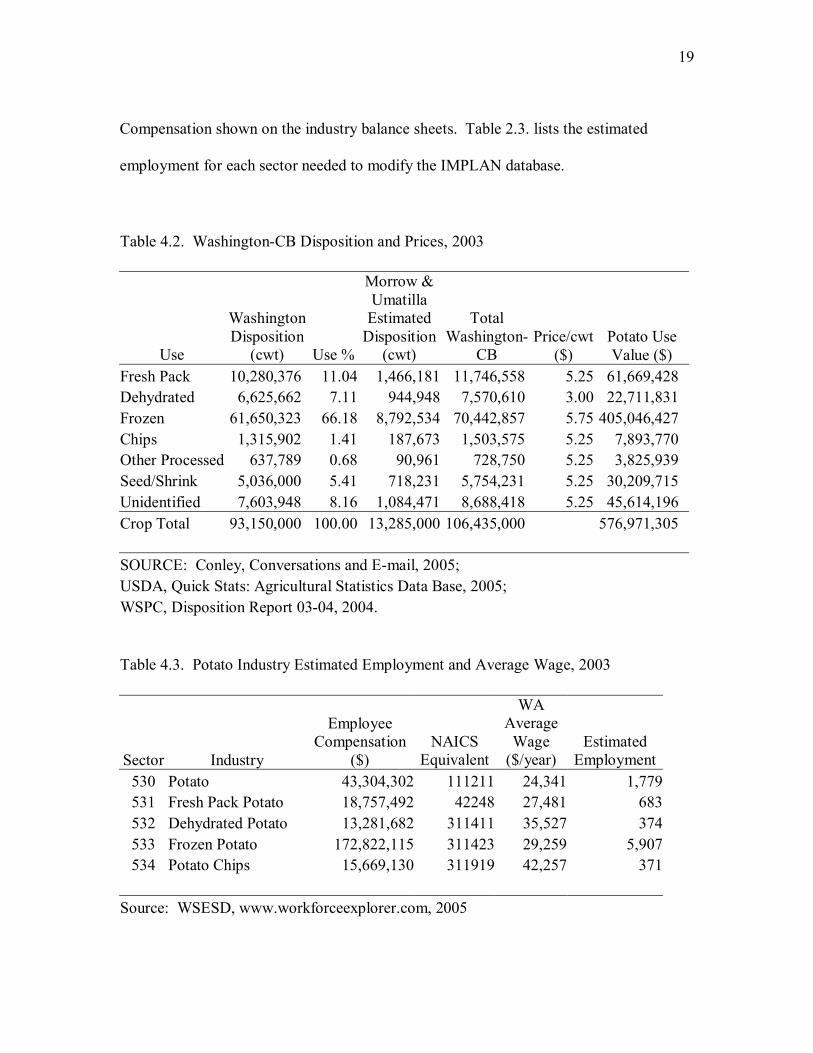
Compensation shown on the industry balance sheets. Table 2.3. lists the estimated
employment for each sector needed to modify the IMPLAN database.
Table 4.2. Washington-CB Disposition and Prices, 2003
Use
Washington Disposition
(cwt) Use %
Morrow & Umatilla
Estimated Disposition
(cwt)
Total Washington-
CB Price/cwt
($) Potato Use Value ($)
Fresh Pack 10,280,376 11.04 1,466,181 11,746,558 5.25 61,669,428 Dehydrated 6,625,662 7.11 944,948 7,570,610 3.00 22,711,831 Frozen 61,650,323 66.18 8,792,534 70,442,857 5.75 405,046,427 Chips 1,315,902 1.41 187,673 1,503,575 5.25 7,893,770 Other Processed 637,789 0.68 90,961 728,750 5.25 3,825,939 Seed/Shrink 5,036,000 5.41 718,231 5,754,231 5.25 30,209,715 Unidentified 7,603,948 8.16 1,084,471 8,688,418 5.25 45,614,196 Crop Total 93,150,000 100.00 13,285,000 106,435,000 576,971,305 SOURCE: Conley, Conversations and E-mail, 2005; USDA, Quick Stats: Agricultural Statistics Data Base, 2005; WSPC, Disposition Report 03-04, 2004.
Table 4.3. Potato Industry Estimated Employment and Average Wage, 2003
Sector Industry
Employee Compensation
($) NAICS
Equivalent
WA Average
Wage ($/year)
Estimated Employment
530 Potato 43,304,302 111211 24,341 1,779531 Fresh Pack Potato 18,757,492 42248 27,481 683532 Dehydrated Potato 13,281,682 311411 35,527 374533 Frozen Potato 172,822,115 311423 29,259 5,907534 Potato Chips 15,669,130 311919 42,257 371
Source: WSESD, www.workforceexplorer.com, 2005

20
Production Function Construction
Five new industries are added to provide more detail and accurately reflect the
local potato complex. Each industry is represented by a production function, or industry
balance sheet, which contains the use coefficients for each commodity the industry
requires. The coefficients for each new production function are derived from a variety of
sources.
Two new sector Input-Output accounts are based on enterprise budgets
prepared at Washington State University. The Potato’s industry production function
contains the coefficients for all the inputs that are involved with producing potatoes under
central pivot irrigation in the Columbia Basin. The coefficients are derived from
Hinman, et al.’s (2001) potato farm enterprise budget. The Fresh Pack industry
production function contains the coefficients for all the inputs involved with packaging
potatoes for the wholesale and retail fresh vegetable markets. These coefficients are
derived from Schotzko and Sund’s (2002) costs of packing potatoes.
These two enterprise budgets are transformed into an I/O accounting structure
that can be used in IMPLAN based on procedures set forth by Willis and Holland (1997).
Each enterprise budget item is mapped into a corresponding IMPLAN sector. Each
commodity is reported in purchaser prices and then converted to producer prices through
margining. The intermediate industries embedded in purchaser prices are allocated their
share of the purchaser price when the commodity is margined. IMPLAN provides the
State and Local Government marketing margins that are used to estimate margins
encountered by potato producers and packers. The input commodity Potato and is a new

21
sector unique to the Washington-CB model, so there are no IMPLAN provided margins.
To estimate Potato’s margins, it’s equivalent sector, Vegetables, margins are used.
The production functions for Dehydrated Potatoes and Frozen Potatoes are
modified from Holland and Yeo (2000). The production methods used in these sectors
are guarded heavily by the industry, so no enterprise budgets are available publicly.
However, a Washington potato industry veteran reviewed the input coefficients and the
recommended changes were made (Conley 2005). Gas and electric prices have increased
significantly between 1996 and 2003, so they are adjusted according to Bureau of Labor
Statistics (USDL 2005) commodity price indexes. Condensed and Evaporated Milk is
added to reflect powdered milk that is sometimes added to dehydrated potato products.
The Value Added Proprietary Income section is removed since there are no sole-
proprietarily owned potato dehydration facilities in the Columbia Basin.
The Frozen Potatoes production function is modified to reflect greater
efficiencies in manufacturing. Since less of the Potato input now goes to waste, its
coefficient is reduced to reflect a smaller percentage of the final output cost. Gas and
electricity prices are inflated accordingly for Frozen Potatoes, just as they were in
Dehydrated Potatos.
The Potato Chips production function is used straight from Holland and Yeo.
This is the IMPLAN sector for Potato Chips & Similar Snacks, and represents a
generalized production function for all of Washington’s salty snack industry in 1996.
The new sector for Potato Chips is different from the year 1996 Potato Chips & Similar

22
Snacks IMPLAN sector only in that it is scaled to reflect the actual amount of potatoes
that are used for Potato Chips in 2003.
Industry Balance Sheets
Each IMPLAN sector’s social account is reported on the Industry Balance Sheets
in Tables 4.4. through 4.8., and the Commodity Balance Sheets in Tables 4.9. through
4.13. These balance sheets are used to describe industry data contained in the
Washington-CB model.
The Industry Balance Sheet provides a printout of the production function, Gross
Inputs, Regional Purchase Coefficients (RPC), Regional Absorption Coefficients, and
Regional Inputs. Also normally included on the Industry Balance Sheets are Byproducts
that the industry may produce, however the new potato industries are assumed to produce
only a single product, so no byproducts are listed.
The Industry Balance Sheet also lists the amount of Value Added by the
industry. Value Added includes Employee Compensation, Proprietary Income, Other
Property Income, and Indirect Business Taxes. The potato-complex businesses in the
Washington-CB area are all assumed to be corporations, so the Proprietary Income for
each industry is set at zero. Employee Compensation includes all income that employers
pay to employees, including all benefits. Proprietary Income is income received by
private business owners and for self-employed work. Other Property Income is profits
earned by corporations, as well as well as capital consumption allowances such as

23
depreciation. Indirect Business Taxes include sales and excise taxes incurred during
normal operation of business, but does not include taxes on profit or income (MIG 2004).
The total value of the 2003 Washington-CB crop is $577 million, which can be
found on Table 4.4. Potato Industry, IMPLAN Report. Total output from all potato
processing is found by summing the Production values on Tables 4.5. through 4.8., for a
total of $1,626 million dollars.

24
Table 4.4. Potato Industry, IMPLAN Report
INDUSTRY BALANCE SHEET
Commodity Production
Commodity Code Description Production*
Regional Market Shares
Byproducts Coefficient
530 Potato 576.971 1.00000 1.0000
TOTAL 576.971
Value Added
Description Value Added* Coefficients
Indirect Business Taxes 1.866 0.003
Other Property Income 35.083 0.061
Proprietary Income 0.000 0.000
Employee Compensation 43.304 0.075
TOTAL 80.253 0.139
Commodity Demand (Production Function)
TOTAL 0.861 496.719 0.531 306.241
Commodity Code Description
Gross Absorption Coefficient Gross Inputs* RPC
Reg Abs Coef
Regional Inputs*
26 Agricultural- Forestry- Fishery Services 0.04545 26.22597 0.80225 0.03647 21.03988
189 Inorganic Chemicals Nec. 0.03235 18.66348 0.05281 0.00171 0.98563
202 Nitrogenous and Phosphatic Fertilizers 0.07847 45.27580 0.15570 0.01222 7.04957
204 Agricultural Chemicals- N.E.C 0.14973 86.39202 0.12619 0.01890 10.90214
209 Chemical Preparations- N.E.C 0.00036 0.20981 0.33026 0.00012 0.06929
210 Petroleum Refining 0.00954 5.50199 0.77773 0.00742 4.27906
309 Farm Machinery and Equipment 0.01705 9.83884 0.51922 0.00885 5.10853
433 Railroads and Related Services 0.00592 3.41397 0.72100 0.00427 2.46147
435 Motor Freight Transport and Warehousing 0.08898 51.33783 0.87254 0.07764 44.79436
436 Water Transportation 0.00048 0.27565 1.00000 0.00048 0.27565
437 Air Transportation 0.00021 0.12254 0.46210 0.00010 0.05663
438 Pipe Lines- Except Natural Gas 0.00009 0.05359 0.09750 0.00001 0.00522
443 Electric Services 0.01880 10.84614 0.91630 0.01722 9.93832
445 Water Supply and Sewerage Systems 0.01429 8.24307 0.94429 0.01349 7.78381
447 Wholesale Trade 0.07606 43.88463 0.99567 0.07573 43.69458
451 Automotive Dealers & Service Stations 0.00002 0.01191 0.95000 0.00002 0.01131
456 Banking 0.04005 23.10662 0.60750 0.02433 14.03727
459 Insurance Carriers 0.00108 0.62257 0.63310 0.00068 0.39415
462 Real Estate 0.16919 97.61527 0.70000 0.11843 68.33069
473 Equipment Rental and Leasing 0.00038 0.21692 0.75600 0.00028 0.16399
530 Potato 0.11241 64.85992 1.00000 0.11241 64.85992
NOTE: * millions of dollars

25
Table 4.5. Fresh Pack Potato IMPLAN Report INDUSTRY BALANCE SHEET
Commodity Production
Commodity Code Description Production*
Regional Market Shares
Byproducts Coefficient
531 Fresh Pack Potato 113.056 1.00000 1.0000
TOTAL 113.056
Value Added
Description Value Added* Coefficients
Indirect Business Taxes 0.375 0.003
Other Property Income 8.965 0.079
Proprietary Income 0.000 0.000
Employee Compensation 18.757 0.166
TOTAL 28.097 0.249
Commodity Demand (Production Function)
TOTAL 0.751 84.959 0.640 72.358
Commodity Code Description
Gross Absorption Coefficient
Gross Inputs* RPC
Reg Abs Coef
Regional Inputs*
56 Maintenance and Repair Other Facilities 0.01575 1.78086 1.00000 0.01575 1.78086
122 Cordage and Twine 0.00557 0.62941 0.02640 0.00015 0.01661
164 Paperboard Containers and Boxes 0.05446 6.15650 0.61706 0.03360 3.79896
167 Bags- Plastic 0.03484 3.93931 0.00228 0.00008 0.00897
198 Surface Active Agents 0.03532 3.99368 0.13880 0.00490 0.55433
204 Agricultural Chemicals- N.E.C 0.00845 0.95540 0.12619 0.00107 0.12057
205 Adhesives and Sealants 0.00540 0.61023 0.33458 0.00181 0.20417
433 Railroads and Related Services 0.00035 0.03973 0.72100 0.00025 0.02865
435 Motor Freight Transport and Warehousing 0.00603 0.68148 0.87254 0.00526 0.59462
436 Water Transportation 0.00017 0.01916 1.00000 0.00017 0.01916
437 Air Transportation 0.00016 0.01808 0.46210 0.00007 0.00836
443 Electric Services 0.00457 0.51718 0.91630 0.00419 0.47389
444 Gas Production and Distribution 0.00163 0.18383 0.74140 0.00121 0.13629
445 Water Supply and Sewerage Systems 0.00163 0.18383 0.94429 0.00154 0.17359
447 Wholesale Trade 0.00894 1.01104 0.99567 0.00890 1.00666
456 Banking 0.00318 0.35899 0.60750 0.00193 0.21808
459 Insurance Carriers 0.00626 0.70721 0.63310 0.00396 0.44773
469 Advertising 0.00118 0.13322 0.75600 0.00089 0.10071
470 Other Business Services 0.00073 0.08294 0.61628 0.00045 0.05112
473 Equipment Rental and Leasing 0.00821 0.92866 0.75600 0.00621 0.70207
494 Legal Services 0.00028 0.03116 0.79270 0.00022 0.02470
503 Business Associations 0.00263 0.29690 0.65235 0.00171 0.19368
507 Accounting- Auditing and Bookkeeping 0.00028 0.03116 0.79270 0.00022 0.02470
530 Potato 0.54547 61.66943 1.00000 0.54547 61.66943
NOTE: * millions of dollars

26
Table 4.6. Dehydrated Potato IMPLAN Report
INDUSTRY BALANCE SHEET
Commodity Production
Commodity Code Description Production*
Regional Market Shares
Byproducts Coefficient
532 Dehydrated Potato 55.170 1.00000 1.0000
TOTAL 55.170
Value Added
Description Value Added* Coefficients
Indirect Business Taxes 0.425 0.008
Other Property Income 4.036 0.073
Proprietary Income 0.000 0.000
Employee Compensation 13.282 0.241
TOTAL 17.742 0.322
Commodity Demand (Production Function)
TOTAL 0.678 37.398 0.593 32.703
Commodity Code Description
Gross Absorption Coefficient
Gross Inputs* RPC
Reg Abs Coef
Regional Inputs*
56 Maintenance and Repair Other Facilities 0.03400 1.87583 1.00000 0.03400 1.87583
63 Condensed and Evaporated Milk 0.01750 0.96547 0.51787 0.00906 0.49999
122 Cordage and Twine 0.00210 0.11613 0.02640 0.00006 0.00307
164 Paperboard Containers and Boxes 0.00866 0.47766 0.61706 0.00534 0.29475
167 Bags- Plastic 0.00659 0.36379 0.00228 0.00002 0.00083
168 Bags- Paper 0.00848 0.46773 0.00257 0.00002 0.00120
198 Surface Active Agents 0.02034 1.12227 0.13880 0.00282 0.15577
205 Adhesives and Sealants 0.00207 0.11437 0.33458 0.00069 0.03827
433 Railroads and Related Services 0.00012 0.00673 0.72100 0.00009 0.00485
435 Motor Freight Transport and Warehousing 0.00142 0.07823 0.87254 0.00124 0.06826
436 Water Transportation 0.00006 0.00314 1.00000 0.00006 0.00314
437 Air Transportation 0.00007 0.00381 0.46210 0.00003 0.00176
443 Electric Services 0.00865 0.47702 0.91630 0.00792 0.43709
444 Gas Production and Distribution 0.10275 5.66892 0.74140 0.07618 4.20294
445 Water Supply and Sewerage Systems 0.02650 1.46206 0.94429 0.02502 1.38060
447 Wholesale Trade 0.00168 0.09291 0.99567 0.00168 0.09250
459 Insurance Carriers 0.00400 0.22068 0.63310 0.00253 0.13971
469 Advertising 0.00040 0.02207 0.75600 0.00030 0.01668
470 Other Business Services 0.01220 0.67307 0.61628 0.00752 0.41481
473 Equipment Rental and Leasing 0.00860 0.47446 0.75600 0.00650 0.35869
530 Potato 0.41167 22.71183 1.00000 0.41167 22.71183
NOTE: * millions of dollars

27
Table 4.7. Frozen Potato Industry, IMPLAN Report INDUSTRY BALANCE SHEET
Commodity Production
Commodity Code Description Production*
Regional Market Shares
Byproducts Coefficient
533 Frozen Potato 1350.155 1.00000 1.0000
TOTAL 1350.155
Value Added
Description Value Added* Coefficients
Indirect Business Taxes 19.548 0.014
Other Property Income 224.090 0.166
Proprietary Income 0.000 0.000
Employee Compensation 172.822 0.128
TOTAL 416.460 0.308
Commodity Demand (Production Function)
TOTAL 0.692 933.695 0.499 673.066
Commodity Code Description
Gross Absorption Coefficient
Gross Inputs* RPC
Reg Abs Coef
Regional Inputs*
72 Flour and Other Grain Mill Products 0.00782 10.55551 0.06146 0.00048 0.64870
81 Sugar 0.00817 11.02671 0.09132 0.00075 1.00698
90 Shortening and Cooking Oils 0.09560 129.07074 0.22608 0.02161 29.18038
122 Cordage and Twine 0.00464 6.26607 0.02640 0.00012 0.16540
130 Automotive and Apparel Trimmings 0.00570 7.70263 0.92899 0.00530 7.15564
164 Paperboard Containers and Boxes 0.04619 62.35690 0.61706 0.02850 38.47822
167 Bags- Plastic 0.02077 28.04136 0.00228 0.00005 0.06387
168 Bags- Paper 0.02596 35.05272 0.00257 0.00007 0.08995
189 Inorganic Chemicals Nec. 0.00789 10.65407 0.05281 0.00042 0.56265
205 Adhesives and Sealants 0.00457 6.16886 0.33458 0.00153 2.06398
209 Chemical Preparations- N.E.C 0.00573 7.74044 0.33026 0.00189 2.55636
433 Railroads and Related Services 0.00221 2.98384 0.72100 0.00159 2.15135
435 Motor Freight Transport and Warehousing 0.04413 59.57693 0.87254 0.03850 51.98331
436 Water Transportation 0.00032 0.42935 1.00000 0.00032 0.42935
437 Air Transportation 0.00015 0.20117 0.46210 0.00007 0.09296
443 Electric Services 0.04430 59.80745 0.91630 0.04059 54.80156
444 Gas Production and Distribution 0.03433 46.34791 0.74140 0.02545 34.36242
445 Water Supply and Sewerage Systems 0.01343 18.13911 0.94429 0.01269 17.12851
446 Sanitary Services and Steam Supply 0.00276 3.72103 1.00000 0.00276 3.72103
447 Wholesale Trade 0.01414 19.08444 0.99567 0.01407 19.00179
476 Detective and Protective Services 0.00276 3.72103 0.63842 0.00176 2.37560
530 Potato 0.30000 405.04644 1.00000 0.30000 405.04644
NOTE: * millions of dollars

28
Table 4.8. Potato Chips Industry, IMPLAN Report INDUSTRY BALANCE SHEET
Commodity Production
Commodity Code Description Production*
Regional Market Shares
Byproducts Coefficient
534 Potato Chips 107.942 1.00000 1.0000
TOTAL 107.942
Value Added
Description Value Added* Coefficients
Indirect Business Taxes 0.976 0.009
Other Property Income 25.115 0.233
Proprietary Income 0.000 0.000
Employee Compensation 15.669 0.145
TOTAL 41.760 0.387
Commodity Demand (Production Function)
TOTAL 0.613 66.182 0.313 33.779
Commodity Code Description
Gross Absorption Coefficient
Gross Inputs* RPC
Reg Abs Coef
Regional Inputs*
12 Feed Grains 0.00757 0.81690 0.10100 0.00076 0.08251
13 Hay and Pasture 0.00813 0.87810 0.10113 0.00082 0.08880
20 Miscellaneous Crops 0.01488 1.60660 0.21657 0.00322 0.34794
21 Oil Bearing Crops 0.00063 0.06833 0.01151 0.00001 0.00079
23 Greenhouse and Nursery Products 0.00572 0.61764 0.46169 0.00264 0.28516
27 Landscape and Horticultural Services 0.00026 0.02763 0.64366 0.00016 0.01779
37 Coal Mining 0.00139 0.15004 0.11983 0.00017 0.01798
56 Maintenance and Repair Other Facilities 0.00660 0.71252 1.00000 0.00660 0.71252
68 Dehydrated Food Products 0.01524 1.64470 0.08922 0.00136 0.14674
70 Frozen Fruits- Juices and Vegetables 0.00255 0.27547 0.12582 0.00032 0.03466
72 Flour and Other Grain Mill Products 0.01523 1.64362 0.06146 0.00094 0.10101
76 Wet Corn Milling 0.00804 0.86839 0.05576 0.00045 0.04842
81 Sugar 0.00028 0.03012 0.09132 0.00003 0.00275
86 Cottonseed Oil Mills 0.00114 0.12327 0.13305 0.00015 0.01640
87 Soybean Oil Mills 0.00538 0.58105 0.08874 0.00048 0.05156
88 Vegetable Oil Mills- N.E.C 0.01075 1.16015 0.30180 0.00324 0.35013
90 Shortening and Cooking Oils 0.01510 1.62981 0.22608 0.00341 0.36847
100 Potato Chips & Similar Snacks 0.00186 0.20066 0.76999 0.00143 0.15451
103 Food Preparations- N.E.C 0.00014 0.01490 0.62106 0.00009 0.00925
123 Textile Goods- N.E.C 0.00017 0.01878 0.00403 0.00000 0.00008
126 Housefurnishings- N.E.C 0.00013 0.01457 0.35130 0.00005 0.00512
162 Paper Mills- Except Building Paper 0.00010 0.01090 0.00203 0.00000 0.00002
163 Paperboard Mills 0.00005 0.00529 0.00263 0.00000 0.00001
164 Paperboard Containers and Boxes 0.03097 3.34305 0.61706 0.01911 2.06288
165 Paper Coated & Laminated Packaging 0.01710 1.84612 0.00031 0.00001 0.00057

29
166 Paper Coated & Laminated N.E.C. 0.03777 4.07695 0.00029 0.00001 0.00118
167 Bags- Plastic 0.01651 1.78201 0.00228 0.00004 0.00406
168 Bags- Paper 0.00708 0.76412 0.00257 0.00002 0.00196
170 Sanitary Paper Products 0.00109 0.11776 0.00061 0.00000 0.00007
179 Commercial Printing 0.00110 0.11830 0.23300 0.00026 0.02756
186 Alkalies & Chlorine 0.00000 0.00043 0.00000 0.00000 0.00000
187 Industrial Gases 0.00001 0.00119 0.52433 0.00001 0.00062
188 Inorganic Pigments 0.00001 0.00130 0.43669 0.00001 0.00057
189 Inorganic Chemicals Nec. 0.00006 0.00680 0.05281 0.00000 0.00036
190 Cyclic Crudes- Interm. & Indus. Organic Chem. 0.00024 0.02645 0.42862 0.00011 0.01134
196 Soap and Other Detergents 0.00207 0.22322 0.05478 0.00011 0.01223
197 Polishes and Sanitation Goods 0.00214 0.23099 0.20420 0.00044 0.04717
205 Adhesives and Sealants 0.00015 0.01652 0.33458 0.00005 0.00553
210 Petroleum Refining 0.00387 0.41817 0.77773 0.00301 0.32522
213 Lubricating Oils and Greases 0.00195 0.21081 0.56271 0.00110 0.11863
220 Miscellaneous Plastics Products 0.06479 6.99396 0.00110 0.00007 0.00768
273 Metal Cans 0.00379 0.40877 0.21525 0.00082 0.08799
293 Crowns and Closures 0.00020 0.02170 0.02122 0.00000 0.00046
305 Metal Foil and Leaf 0.00176 0.19008 0.03948 0.00007 0.00750
321 Special Dies and Tools and Accessories 0.00016 0.01727 0.20513 0.00003 0.00354
330 Food Products Machinery 0.00068 0.07329 0.73706 0.00050 0.05402
335 Packaging Machinery 0.00006 0.00702 0.58048 0.00004 0.00407
347 Refrigeration and Heating Equipment 0.00038 0.04145 0.12966 0.00005 0.00537
354 Industrial Machines N.E.C. 0.00081 0.08776 0.00000 0.00000 0.00000
355 Transformers 0.00044 0.04803 0.12559 0.00006 0.00603
367 Electric Lamps 0.00032 0.03465 0.00039 0.00000 0.00001
386 Motor Vehicle Parts and Accessories 0.00040 0.04274 0.10283 0.00004 0.00440
428 Brooms and Brushes 0.00020 0.02170 0.00393 0.00000 0.00009
433 Railroads and Related Services 0.00587 0.63318 0.72100 0.00423 0.45653
434 Local- Interurban Passenger Transit 0.00116 0.12521 0.74080 0.00086 0.09276
435 Motor Freight Transport and Warehousing 0.03876 4.18403 0.87254 0.03382 3.65073
436 Water Transportation 0.00292 0.31540 1.00000 0.00292 0.31540
437 Air Transportation 0.00437 0.47160 0.46210 0.00202 0.21792
441 Communications- Except Radio and TV 0.00140 0.15101 0.52760 0.00074 0.07967
443 Electric Services 0.00567 0.61257 0.91630 0.00520 0.56130
444 Gas Production and Distribution 0.00726 0.78355 0.74140 0.00538 0.58092
445 Water Supply and Sewerage Systems 0.00093 0.09995 0.94429 0.00087 0.09438
446 Sanitary Services and Steam Supply 0.00231 0.24967 1.00000 0.00231 0.24967
447 Wholesale Trade 0.06966 7.51877 0.99567 0.06935 7.48621
448 Building Materials & Gardening 0.00048 0.05160 0.94030 0.00045 0.04852
449 General Merchandise Stores 0.00104 0.11215 0.92700 0.00096 0.10396
450 Food Stores 0.00131 0.14140 0.95000 0.00124 0.13433
451 Automotive Dealers & Service Stations 0.00061 0.06541 0.95000 0.00058 0.06214
452 Apparel & Accessory Stores 0.00055 0.05991 0.94030 0.00052 0.05633
453 Furniture & Home Furnishings Stores 0.00056 0.06023 0.94030 0.00052 0.05664
454 Eating & Drinking 0.00255 0.27503 0.90000 0.00229 0.24753
455 Miscellaneous Retail 0.00150 0.16191 0.94030 0.00141 0.15225
456 Banking 0.01089 1.17527 0.60750 0.00661 0.71397

30
458 Security and Commodity Brokers 0.00023 0.02537 0.59898 0.00014 0.01519
459 Insurance Carriers 0.00259 0.27978 0.63310 0.00164 0.17713
462 Real Estate 0.00447 0.48282 0.70000 0.00313 0.33798
463 Hotels and Lodging Places 0.00668 0.72072 0.68879 0.00460 0.49643
464 Laundry- Cleaning and Shoe Repair 0.00022 0.02396 0.75010 0.00017 0.01797
469 Advertising 0.02307 2.49042 0.75600 0.01744 1.88276
470 Other Business Services 0.00326 0.35200 0.61628 0.00201 0.21693
472 Services To Buildings 0.00104 0.11247 0.65180 0.00068 0.07331
473 Equipment Rental and Leasing 0.00136 0.14669 0.75600 0.00103 0.11090
474 Personnel Supply Services 0.00406 0.43846 0.72724 0.00295 0.31886
475 Computer and Data Processing Services 0.00189 0.20433 0.75600 0.00143 0.15448
476 Detective and Protective Services 0.00073 0.07891 0.63842 0.00047 0.05038
477 Automobile Rental and Leasing 0.00176 0.18998 0.67388 0.00119 0.12802
479 Automobile Repair and Services 0.00142 0.15285 0.90000 0.00127 0.13756
480 Electrical Repair Service 0.00062 0.06703 0.90000 0.00056 0.06033
482 Miscellaneous Repair Shops 0.00160 0.17238 0.75600 0.00121 0.13032
483 Motion Pictures 0.00031 0.03379 0.61062 0.00019 0.02063
489 Membership Sports and Recreation Clubs 0.00044 0.04793 0.60161 0.00027 0.02883
494 Legal Services 0.00061 0.06595 0.79270 0.00048 0.05228
503 Business Associations 0.00056 0.06077 0.65235 0.00037 0.03964
506 Engineering- Architectural Services 0.00063 0.06822 0.79270 0.00050 0.05408
507 Accounting- Auditing and Bookkeeping 0.00040 0.04296 0.79270 0.00032 0.03405
508 Management and Consulting Services 0.00264 0.28551 0.60665 0.00160 0.17320
509 Research- Development & Testing Services 0.00050 0.05429 0.75600 0.00038 0.04105
512 Other State and Local Govt Enterprises 0.00063 0.06854 1.00000 0.00063 0.06854
513 U.S. Postal Service 0.00074 0.07988 0.74990 0.00055 0.05990
516 Noncomparable Imports 0.00021 0.02234 0.00000 0.00000 0.00000
530 Potato 0.07313 7.89376 1.00000 0.07313 7.89376
NOTE: * millions of dollars
SOURCE: Holland and Yeo, 2000

31
Commodity Balance Sheets
The Commodity Balance Sheet shows where an industry’s output is
consumed. Commodity consumption is separated into two categories in the Commodity
Balance Sheet: Industrial Demand and Institutional Demand. Potato is the only new
commodity that is consumed directly by other new industries, and this intermediate
demand is detailed under Industrial Demand.
In the Commodity Balance Sheets for the four new potato processing
industries, Industrial Demands are set to zero. This is necessary due to the difficulty of
estimating the values of potato commodities that other industries purchase. Results from
an impact scenario will show no indirect effects for the potato processing industries.
Instead the indirect effects from industries that are purchasing processed potato
commodities are captured in original equivalent IMPLAN sectors.
To clarify how these indirect linkages operate, consider that in the un-
aggregated 2003 Washington-CB model, potato product exports use $141,832,100 in
Motor Freight Transport and Warehousing services, which is counted as a direct effect.
The Motor Freight Transport and Warehousing sector in turns purchases $277,424 worth
of services from the local Eating and Drinking sector, which is counted as an indirect
effect. Eating and Drinking then purchases $172 worth of goods from the local Frozen
Fruits, Juices and Vegetable sector, also counted as an indirect effect. Undoubtedly,
some of Eating and Drinking’s purchases will be of frozen potato products. However,
since it is impossible to accurately separate frozen potatoes from the Frozen Fruit sector,
the indirect effect needs to be captured in the old Frozen Fruit sector instead of the new

32
Frozen Potato sector. Indirect effects on the potato processing industries are still fully
accounted for, but the results are reported in their old, equivalent IMPLAN sectors.
The Institutional Demand section contains the breakdown of household
consumption by income and consumption by governments, as well as the values for
Domestic and Foreign Trade of a commodity. In some cases, the sum of industrial and
institutional demand for a commodity can be greater than what is supplied by local
industry. When this happens, the commodity is imported into the region to make up the
difference.
For the added potato sectors, the household and government consumption
amounts are estimated based on percentages of consumption in the new potato sector’s
equivalent IMPLAN sectors. The Commodity Balance Sheets shown on Tables 4.9.
through 4.13. are unique to the Washington-CB model.
Because of sales to households, the commodity with the most Institutional
Demand is Frozen Potato with $108 million. Potato Chips have the highest proportion of
Institutional Demand to Production at 79 percent. This means that most Potato Chips
produced locally are consumed within the region, rather than exported.
Model Reconstruction
After all the desired adjustments have been made, the base model is
reconstructed with the additional sectors to create a more detailed I/O model of the
Washington potato economy. The Social Accounts and Type SAM Multipliers are

33
recreated by IMPLAN. Impact analysis can now be generated with this model to
estimate the effects of potato industry exports on the regional economy.

34
Table 4.9. Potato Commodity, IMPLAN Report COMMODITY BALANCE SHEET
Industrial Production
Industry Code IndDes Production*
Regional Market Shares
Byproducts Coefficient
530 Potato 576.9713 1.00000 1.0000
TOTAL 576.9713
Industrial Demand
TOTAL 562.1814 562.1814
Industry Code Description
Gross Absorption Coefficient Gross Inputs* RPC
Reg Abs Coef
Regional Inputs*
530 Potato 0.1124 64.8599 1.0000 0.1124 64.8599
531 Fresh Pack Potato 0.5455 61.6694 1.0000 0.5455 61.6694
532 Dehydrated Potato 0.4117 22.7118 1.0000 0.4117 22.7118
533 Frozen Potato 0.3000 405.0464 1.0000 0.3000 405.0464
534 Potato Chips 0.0731 7.8938 1.0000 0.0731 7.8938
Institutional Demand
TOTAL 14.7899 0.000
Type Code Description Gross Final Demand* Average RPC Reg Inputs*
10001 Households LT10k 0.00000 1.00000 0.00000
10002 Households 10-15k 0.00000 1.00000 0.00000
10003 Households 15-25k 0.00000 1.00000 0.00000
10004 Households 25-35k 0.00000 1.00000 0.00000
10005 Households 35-50k 0.00000 1.00000 0.00000
10006 Households 50-75k 0.00000 1.00000 0.00000
10007 Households 75-100k 0.00000 1.00000 0.00000
10008 Households 100-150k 0.00000 1.00000 0.00000
10009 Households 150k+ 0.00000 1.00000 0.00000
11001 Federal Government NonDefense 0.00000 1.00000 0.00000
11002 Federal Government Defense 0.00000 1.00000 0.00000
11003 Federal Government Investment 0.00000 1.00000 0.00000
12001 State/Local Govt NonEducation 0.00000 1.00000 0.00000
12002 State/Local Govt Education 0.00000 1.00000 0.00000
12003 State/Local Govt Investment 0.00000 1.00000 0.00000
14001 Capital 0.00000 1.00000 0.00000
14002 Inventory Additions/Deletions 0.00000 1.00000 0.00000
25001 Foreign Trade 4.935321
28001 Domestic Trade 9.854610
NOTE: * millions of dollars

35
Table 4.10. Fresh Pack Potato Commodity, IMPLAN Report COMMODITY BALANCE SHEET
Industrial Production
Industry Code IndDes Production*
Regional Market Shares
Byproducts Coefficient
531 Fresh Pack Potato 113.0564 1.00000 1.0000
TOTAL 113.0564
Industrial Demand
TOTAL 0.0000 0.0000
Industry Code Description
Gross Absorption Coefficient Gross Inputs* RPC
Reg Abs Coef
Regional Inputs*
Institutional Demand
TOTAL 113.0564 38.091
Type Code Description Gross Final Demand* Average RPC Reg Inputs*
10001 Households LT10k 1.40407 1.00000 1.40407
10002 Households 10-15k 1.25296 1.00000 1.25296
10003 Households 15-25k 3.68813 1.00000 3.68813
10004 Households 25-35k 4.05853 1.00000 4.05853
10005 Households 35-50k 6.56294 1.00000 6.56294
10006 Households 50-75k 8.27127 1.00000 8.27127
10007 Households 75-100k 5.00203 1.00000 5.00203
10008 Households 100-150k 4.31916 1.00000 4.31916
10009 Households 150k+ 2.70731 1.00000 2.70731
11001 Federal Government NonDefense 0.00000 1.00000 0.00000
11002 Federal Government Defense 0.00000 1.00000 0.00000
11003 Federal Government Investment 0.00000 1.00000 0.00000
12001 State/Local Govt NonEducation 0.37558 1.00000 0.37558
12002 State/Local Govt Education 0.44924 1.00000 0.44924
12003 State/Local Govt Investment 0.00000 1.00000 0.00000
14001 Capital 0.00000 1.00000 0.00000
14002 Inventory Additions/Deletions 0.00000 1.00000 0.00000
26001 Foreign Trade 23.474667
28001 Domestic Trade 51.490530
NOTE: * millions of dollars

36
Table 4.11. Dehydrated Potato Commodity, IMPLAN Reoprt COMMODITY BALANCE SHEET
Industrial Production
Industry Code IndDes Production*
Regional Market Shares
Byproducts Coefficient
532 Dehydrated Potato 55.1700 1.00000 1.0000
TOTAL 55.1700
Industrial Demand
TOTAL 0.0000 0.0000
Industry Code Description
Gross Absorption Coefficient Gross Inputs* RPC
Reg Abs Coef
Regional Inputs*
Institutional Demand
TOTAL 55.1700 7.413
Type Code Description Gross Final Demand* Average RPC Reg Inputs*
10001 Households LT10k 0.26653 1.00000 0.26653
10002 Households 10-15k 0.23802 1.00000 0.23802
10003 Households 15-25k 0.69988 1.00000 0.69988
10004 Households 25-35k 0.77096 1.00000 0.77096
10005 Households 35-50k 1.24461 1.00000 1.24461
10006 Households 50-75k 1.56549 1.00000 1.56549
10007 Households 75-100k 0.94786 1.00000 0.94786
10008 Households 100-150k 0.81846 1.00000 0.81846
10009 Households 150k+ 0.51302 1.00000 0.51302
11001 Federal Government NonDefense 0.00000 1.00000 0.00000
11002 Federal Government Defense 0.00000 1.00000 0.00000
11003 Federal Government Investment 0.00000 1.00000 0.00000
12001 State/Local Govt NonEducation 0.23270 1.00000 0.23270
12002 State/Local Govt Education 0.11585 1.00000 0.11585
12003 State/Local Govt Investment 0.00000 1.00000 0.00000
14001 Capital 0.00000 1.00000 0.00000
14002 Inventory Additions/Deletions 0.00000 1.00000 0.00000
26001 Foreign Trade 20.038542
28001 Domestic Trade 27.718080
NOTE: * millions of dollars

37
Table 4.12. Frozen Potato Commodity, IMPLAN Report
COMMODITY BALANCE SHEET
Industrial Production
Industry Code IndDes Production*
Regional Market Shares
Byproducts Coefficient
533 Frozen Potato 1350.1548 1.00000 1.0000
TOTAL 1350.1548
Industrial Demand
TOTAL 0.0000 0.0000
Industry Code Description
Gross Absorption Coefficient Gross Inputs* RPC
Reg Abs Coef
Regional Inputs*
Institutional Demand
TOTAL 1350.1548 108.284
Type Code Description Gross Final Demand* Average RPC Reg Inputs*
10001 Households LT10k 3.73480 1.00000 3.73480
10002 Households 10-15k 3.33403 1.00000 3.33403
10003 Households 15-25k 9.80879 1.00000 9.80879
10004 Households 25-35k 10.79932 1.00000 10.79932
10005 Households 35-50k 17.44905 1.00000 17.44905
10006 Households 50-75k 21.97001 1.00000 21.97001
10007 Households 75-100k 13.29404 1.00000 13.29404
10008 Households 100-150k 11.47916 1.00000 11.47916
10009 Households 150k+ 7.19528 1.00000 7.19528
11001 Federal Government NonDefense 6.71310 1.00000 6.71310
11002 Federal Government Defense 0.00000 1.00000 0.00000
11003 Federal Government Investment 0.00000 1.00000 0.00000
12001 State/Local Govt NonEducation 2.04656 1.00000 2.04656
12002 State/Local Govt Education 0.45995 1.00000 0.45995
12003 State/Local Govt Investment 0.00000 1.00000 0.00000
14001 Capital 0.00000 1.00000 0.00000
14002 Inventory Additions/Deletions 0.00000 1.00000 0.00000
26001 Foreign Trade 206.589054
28001 Domestic Trade 1035.281620
NOTE: * millions of dollars

38
Table 4.13. Potato Chip Commodity, IMPLAN Report COMMODITY BALANCE SHEET
Industrial Production
Industry Code IndDes Production*
Regional Market Shares
Byproducts Coefficient
534 Potato Chips 107.9416 1.00000 1.0000
TOTAL 107.9416
Industrial Demand
TOTAL 0.0000 0.0000
Industry Code Description
Gross Absorption Coefficient Gross Inputs* RPC
Reg Abs Coef
Regional Inputs*
Institutional Demand
TOTAL 107.9416 85.172
Type Code Description Gross Final Demand* Average RPC Reg Inputs*
10001 Households LT10k 3.15284 1.00000 3.15284
10002 Households 10-15k 2.81253 1.00000 2.81253
10003 Households 15-25k 8.28296 1.00000 8.28296
10004 Households 25-35k 9.11036 1.00000 9.11036
10005 Households 35-50k 14.74387 1.00000 14.74387
10006 Households 50-75k 18.59903 1.00000 18.59903
10007 Households 75-100k 11.24134 1.00000 11.24134
10008 Households 100-150k 9.70669 1.00000 9.70669
10009 Households 150k+ 6.08428 1.00000 6.08428
11001 Federal Government NonDefense 0.00000 1.00000 0.00000
11002 Federal Government Defense 0.00000 1.00000 0.00000
11003 Federal Government Investment 0.00000 1.00000 0.00000
12001 State/Local Govt NonEducation 0.00000 1.00000 0.00000
12002 State/Local Govt Education 0.00000 1.00000 0.00000
12003 State/Local Govt Investment 0.00000 1.00000 0.00000
14001 Capital 0.00000 1.00000 0.00000
14002 Inventory Additions/Deletions 1.43849 1.00000 1.43849
26001 Foreign Trade 3.252404
28001 Domestic Trade 19.517196
NOTE: * millions of dollars

39
CHAPTER 5
IMPACT ANALYSIS
Final Demand
Final demand, also called institutional demand, is the demand for goods
destined for final use in the study area, or exported from the study area. Institutional
demand is equal to the output of goods that is not consumed by other local industries.
Domestic exports are products manufactured or produced within the
Washington-CB geographic boundaries but consumed outside the model area, anywhere
else in the United States. The domestic exports are estimated by IMPLAN an in this
thesis as:
(5) Domestic Exports = Total Output - Intermediate Demand - Institutional
Demand - Foreign Exports
Table 5.1 lists the values of Domestic Exports for potatoes in the Washington-
CB model.
Table 5.1. Potato Industry Domestic Exports, 2003
Sector Commodity Domestic Exports 530 Potato Production $9,854,610 531 Fresh Pack Potato $51,490,530 532 Dehydrated Potato $27,718,080 533 Frozen Potato $1,035,281,620 534 Potato Chips $19,517,196

40
Foreign exports are produced inside the model area, but consumed outside the
United States. The United State Census Bureau reports foreign export commodity values
at the state level categorized under Schedule B Harmonized System (HS) codes (USCB
2005). The 2003 potato industry values are mapped into their proper IMPLAN sectors in
Table 5.2.
Table 5.2. Washington and Oregon Foreign Potato Exports, 2003
HS Code Description Value 701 Potatoes, fresh or chilled $23,474,667
70110 Potatoes, seed $4,842,901 71010 Potatoes, uncooked or cooked by steaming or
boiling, frozen $4,078,746
1105 Potatoes, flour, meal, powder, flakes, granules and pellets
$12,230,858
200410 Potatoes, prepared or preserved, frozen, French fries and other
$202,510,338
200520 Potatoes, prepared or preserved, not frozen, Potato chips, granules, and other
$11,060,088
IMPLAN
Code Sector Name Value 530 Potato $4,935,321 531 Fresh Pack Potato $23,474,667 532 Dehydrated Potato $20,038,542 533 Frozen Potato $206,589,054 534 Potato Chips $3,252,404
SOURCE: U.S. Census Bureau, Foreign Trade Statistics www.census.gov/foreign-trade/www/, 2003
41
Transportation and Marketing Margins
Part of what constitutes an impact analysis is the value added to a product
when shippers and wholesalers handle it after it leaves the factory or farm gate. These
marketing margins are provided by IMPLAN for commodities when appropriate. For the
Washington-CB model, transportation and marketing margins for the new commodities
are taken from their equivalent IMPLAN sectors. Because these margins cover an
aggregated sector and based on the entire United States, the Air Transportation margin
applied to the Vegetable sector seemed inappropriate for the Washington-CB area, and
was removed from the new Potato and Fresh Pack Potato industries. Table 5.3. is the
breakdown of margin values for the impact analysis.
The transportation and wholesale mark-up values are included with the
summed foreign and domestic export values to complete the impact analysis. The values
in Table 5.4. are then run through the IMPLAN SAM model, and the impact results are
given.
Potato Industry Impact Results
IMPLAN reports economic impact results in three main categories, Output,
Value Added, and Employment. The results reported in Tables 5.5 through 5.7. are in
2003 dollars, and are aggregated (AGG) for compact viewing. The aggregation scheme
is broken out into individual IMPLAN sectors in Appendix A.

42
Table 5.3. Marketing Margins, 2003 dollars Sector Description Margins Value ($) Potato:
530 Potato 0.654 14,790,000433 Railroads and Related Services 0.015 339,220435 Motor Freight Transport and Warehousing 0.164 3,708,807436 Water Transportation 0.004 90,459447 Wholesale Trade 0.161 3,640,963
Fresh Pack:
531 Fresh Pack Potato 0.654 74,966,000433 Railroads and Related Services 0.015 1,724,678435 Motor Freight Transport and Warehousing 0.164 18,856,479436 Water Transportation 0.004 459,914447 Wholesale Trade 0.161 18,511,543
Dehydrated Potato:
532 Dehydrated Potato 0.912 47,757,000433 Railroads and Related Services 0.009 471,286435 Motor Freight Transport and Warehousing 0.012 628,382447 Wholesale Trade 0.067 3,508,464
Frozen Potato:
533 Frozen Potato 0.812 1,241,817,000433 Railroads and Related Services 0.025 38,233,282435 Motor Freight Transport and Warehousing 0.077 117,758,509447 Wholesale Trade 0.086 131,522,490
Potato Chips:
534 Potato Chips 0.621 22,769,000433 Railroads and Related Services 0.039 1,429,937435 Motor Freight Transport and Warehousing 0.024 879,961436 Water Transportation 0.008 293,321447 Wholesale Trade 0.308 11,292,837
NOTE: Potato and Fresh Pack Potato Margins Sum To .98 Because 437: Air Transportation is Removed

43
It should be noted that an additional benefit from the potato-complex to the
Washington-CB economy is the use of potato waste as feed for local cattle producers.
This impact was included in Holland and Yeo’s (2000) study because the potato
processing and cattle industries form an important symbiotic relationship that lowers
waste removal costs for the processors and lowers feed costs to feedlots. However, the
cattle feedlot impact is purposely missing from the Washington-CB impact analysis as
not to distract from the economic impact of the potatoes themselves.
Table 5.4. Impact Final Demand (Sales) Values (millions of 2003 dollars)
Sector Number
Sector Name Value
433 Railroads and Related Services 42.198403
435 Motor Freight Transport and Warehousing 141.832137
436 Water Transportation .843693
447 Wholesale Trade 168.476298
530 Potato 14.790000
531 Fresh Pack Potato 74.966000
532 Dehydrated Potato 47.757000
533 Frozen Potato 1,241.871000
534 Potato Chips 22.769000
Total 1755.503531
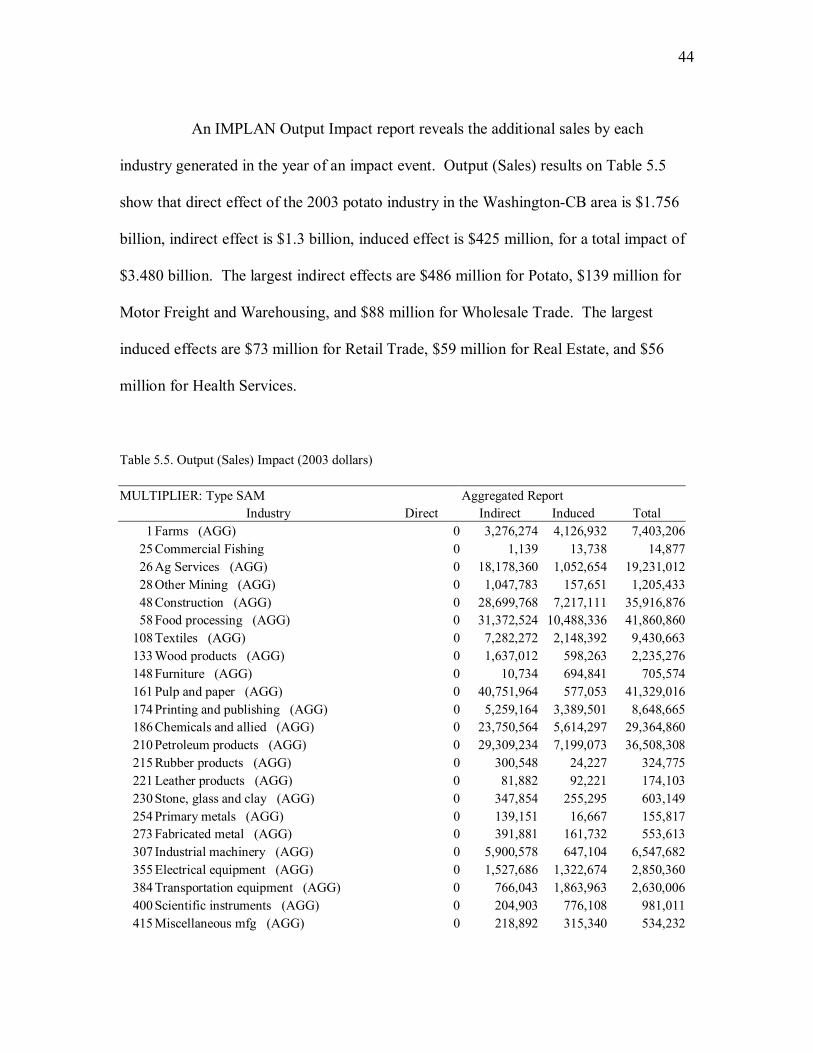
44
An IMPLAN Output Impact report reveals the additional sales by each
industry generated in the year of an impact event. Output (Sales) results on Table 5.5
show that direct effect of the 2003 potato industry in the Washington-CB area is $1.756
billion, indirect effect is $1.3 billion, induced effect is $425 million, for a total impact of
$3.480 billion. The largest indirect effects are $486 million for Potato, $139 million for
Motor Freight and Warehousing, and $88 million for Wholesale Trade. The largest
induced effects are $73 million for Retail Trade, $59 million for Real Estate, and $56
million for Health Services.
Table 5.5. Output (Sales) Impact (2003 dollars) MULTIPLIER: Type SAM Aggregated Report Industry Direct Indirect Induced Total
1 Farms (AGG) 0 3,276,274 4,126,932 7,403,20625 Commercial Fishing 0 1,139 13,738 14,87726 Ag Services (AGG) 0 18,178,360 1,052,654 19,231,01228 Other Mining (AGG) 0 1,047,783 157,651 1,205,43348 Construction (AGG) 0 28,699,768 7,217,111 35,916,87658 Food processing (AGG) 0 31,372,524 10,488,336 41,860,860
108 Textiles (AGG) 0 7,282,272 2,148,392 9,430,663133 Wood products (AGG) 0 1,637,012 598,263 2,235,276148 Furniture (AGG) 0 10,734 694,841 705,574161 Pulp and paper (AGG) 0 40,751,964 577,053 41,329,016174 Printing and publishing (AGG) 0 5,259,164 3,389,501 8,648,665186 Chemicals and allied (AGG) 0 23,750,564 5,614,297 29,364,860210 Petroleum products (AGG) 0 29,309,234 7,199,073 36,508,308215 Rubber products (AGG) 0 300,548 24,227 324,775221 Leather products (AGG) 0 81,882 92,221 174,103230 Stone, glass and clay (AGG) 0 347,854 255,295 603,149254 Primary metals (AGG) 0 139,151 16,667 155,817273 Fabricated metal (AGG) 0 391,881 161,732 553,613307 Industrial machinery (AGG) 0 5,900,578 647,104 6,547,682355 Electrical equipment (AGG) 0 1,527,686 1,322,674 2,850,360384 Transportation equipment (AGG) 0 766,043 1,863,963 2,630,006400 Scientific instruments (AGG) 0 204,903 776,108 981,011415 Miscellaneous mfg (AGG) 0 218,892 315,340 534,232

45
433 Railroads and Related Services 42,198,404 7,701,035 587,645 50,487,080434 Other Transportation (AGG) 843,693 4,794,205 4,249,293 9,887,190435 Motor Freight Transport and Warehousing 141,832,144 139,479,840 5,089,105 286,401,088439 Transportation Services (AGG) 0 9,028,665 760,126 9,788,791441 Communications (AGG) 0 12,523,269 9,881,044 22,404,312443 Utilities (AGG) 0 69,327,416 7,673,444 77,000,856447 Wholesale Trade 168,476,320 88,742,496 24,703,954 281,922,752448 Retail Trade (AGG) 0 4,381,238 73,283,800 77,665,032456 Banking and Insurance (AGG) 0 38,476,896 39,662,752 78,139,648461 Real estate (AGG) 0 72,910,160 59,082,036 131,992,192463 Hotels and Lodging Places 0 3,760,025 4,644,839 8,404,864464 Personal services (AGG) 0 1,285,887 6,056,017 7,341,904469 Business services (AGG) 0 62,568,660 30,194,490 92,763,152477 Automotive services (AGG) 0 11,297,715 6,488,435 17,786,150480 Repair services (AGG) 0 2,055,961 1,437,092 3,493,053483 Motion Pictures 0 775,577 1,809,577 2,585,153484 Recreation services (AGG) 0 940,204 6,986,717 7,926,921490 Health services (AGG) 0 58,788 55,660,628 55,719,416495 Education services (AGG) 0 185,436 4,988,230 5,173,666498 Social services (AGG) 0 261,477 9,537,220 9,798,697502 Non-profit organizations (AGG) 0 777,450 5,307,324 6,084,774510 Government (AGG) 0 82,607,352 16,240,087 98,847,432525 Domestic Services 0 0 752,626 752,626530 Potato 14,790,000 485,606,144 206,106 500,602,272531 Fresh Pack Potato 74,966,000 0 115,700 75,081,696532 Dehydrated Potato 47,757,000 0 22,162 47,779,160533 Frozen Potato 1,241,870,976 0 310,838 1,242,181,760534 Potato Chips 22,769,000 0 262,559 23,031,560
30001 Instutitions (AGG) 0 0 0 0 Totals 1,755,503,5371,300,002,102 424,747,015 3,480,252,570
An IMPLAN Value Added Impact report contains the sum of the additional
Employee Compensation, Proprietary Income, Other Property Income, and Indirect
Business Taxes that result from an impact event. Value Added results on Table 5.6. show
that the direct value added from the potato industry in Washington-CB area is $631
million, indirect effect is $481 million, induced effect is $262 million, for a total impact
of $1.374 billion. The largest indirect effects are $68 million for Potato, $62 million for

46
Motor Freight Transport and Warehousing, and $61 million for Wholesale Trade. The
largest induced effects are $54 million for Retail Trade, $44 million for Real Estate, and
$37 million for Health Services.
Table 5.6. Total Value Added Impact (2003 dollars) MULTIPLIER: Type SAM Aggregated Report
Industry Direct Indirect Induced Total 1 Farms (AGG) 0 1,195,420 1,433,679 2,629,099
25 Commercial Fishing 0 1,069 12,894 13,96326 Ag Services (AGG) 0 11,272,933 655,509 11,928,44228 Other Mining (AGG) 0 442,432 66,406 508,83848 Construction (AGG) 0 19,740,888 4,387,105 24,127,99458 Food processing (AGG) 0 5,036,311 2,431,086 7,467,397
108 Textiles (AGG) 0 1,556,866 585,138 2,142,004133 Wood products (AGG) 0 675,855 245,549 921,404148 Furniture (AGG) 0 3,146 248,378 251,524161 Pulp and paper (AGG) 0 11,877,047 169,789 12,046,837174 Printing and publishing (AGG) 0 2,462,499 1,560,844 4,023,343186 Chemicals and allied (AGG) 0 10,724,797 3,456,920 14,181,716210 Petroleum products (AGG) 0 3,677,365 906,266 4,583,632215 Rubber products (AGG) 0 92,078 7,463 99,541221 Leather products (AGG) 0 13,603 38,559 52,162230 Stone, glass and clay (AGG) 0 147,625 108,735 256,360254 Primary metals (AGG) 0 48,780 5,486 54,266273 Fabricated metal (AGG) 0 150,499 65,497 215,996307 Industrial machinery (AGG) 0 1,922,717 245,468 2,168,186355 Electrical equipment (AGG) 0 540,438 407,192 947,630384 Transportation equipment (AGG) 0 207,286 439,889 647,175400 Scientific instruments (AGG) 0 73,151 232,330 305,481415 Miscellaneous mfg (AGG) 0 106,682 153,098 259,781433 Railroads and Related Services 22,832,872 4,166,906 317,965 27,317,744434 Other Transportation (AGG) 315,233 2,364,846 2,371,278 5,051,358435 Motor Freight Transport and Warehousing 63,172,068 62,124,356 2,266,689 127,563,120439 Transportation Services (AGG) 0 6,749,969 556,369 7,306,338441 Communications (AGG) 0 6,987,058 5,572,483 12,559,541443 Utilities (AGG) 0 29,798,056 3,792,129 33,590,184447 Wholesale Trade 116,483,600 61,356,076 17,080,178 194,919,840448 Retail Trade (AGG) 0 3,045,452 53,751,984 56,797,436456 Banking and Insurance (AGG) 0 23,774,828 24,737,780 48,512,608461 Real estate (AGG) 0 51,863,272 43,789,668 95,652,936

47
463 Hotels and Lodging Places 0 2,317,806 2,863,235 5,181,041464 Personal services (AGG) 0 571,232 3,293,114 3,864,346469 Business services (AGG) 0 42,579,576 20,512,834 63,092,412477 Automotive services (AGG) 0 6,890,116 3,904,141 10,794,256480 Repair services (AGG) 0 1,000,784 679,635 1,680,419483 Motion Pictures 0 217,660 507,844 725,504484 Recreation services (AGG) 0 500,081 4,020,694 4,520,775490 Health services (AGG) 0 35,989 36,806,516 36,842,508495 Education services (AGG) 0 99,480 2,972,302 3,071,782498 Social services (AGG) 0 151,183 4,501,934 4,653,117502 Non-profit organizations (AGG) 0 556,165 2,810,038 3,366,203510 Government (AGG) 0 34,642,704 6,294,946 40,937,648525 Domestic Services 0 0 752,622 752,622530 Potato 2,057,188 67,544,496 28,668 69,630,352531 Fresh Pack Potato 18,630,710 0 28,754 18,659,464532 Dehydrated Potato 15,358,082 0 7,127 15,365,210533 Frozen Potato 383,059,552 0 95,879 383,155,424534 Potato Chips 8,808,734 0 101,577 8,910,312
30001 Instutitions (AGG) 0 0 0 0 Totals 630,718,039 481,307,581 262,281,660 1,374,307,268
An IMPLAN Employment Impact reports shows the additional number of
average annual jobs created in each industry due to an impact event. Employment is
measured in total number of wage, salary, and self-employed jobs, both full-time and
part-time. Employment results on Table 5.7. show the number of jobs in each industry
created to support the potato industry in the Washington-CB area. Direct jobs created are
8,763, indirect jobs are 7,301, and induced jobs are 4,639, for a total employment impact
of 20,703 jobs. The bulk of indirect job creation is 1,446 for Potatoes, 1,149 for Motor
Freight Transport and Warehousing, and 864 for Business Services. The largest impacted
sectors in terms of number of jobs supported by induced effects are 1,426 for Retail
Trade, 691 for Health Services, and 379 for Business Services.

48
Table 5.7. Employment Impact (number of jobs) MULTIPLIER: Type SAM Aggregated Report Industry Direct Indirect Induced Total
1 Farms (AGG) 0 41.5 44.7 86.225 Commercial Fishing 0 0 0.1 0.126 Ag Services (AGG) 0 666.6 30.2 696.828 Other Mining (AGG) 0 5.4 0.8 6.348 Construction (AGG) 0 350.4 78.6 428.958 Food processing (AGG) 0 55.9 39.1 94.9
108 Textiles (AGG) 0 50.6 18.6 69.2133 Wood products (AGG) 0 12.7 4.4 17.1148 Furniture (AGG) 0 0.1 6.6 6.7161 Pulp and paper (AGG) 0 171 2.4 173.4174 Printing and publishing (AGG) 0 42.7 26.4 69.1186 Chemicals and allied (AGG) 0 72 7.6 79.6210 Petroleum products (AGG) 0 11 2.8 13.8215 Rubber products (AGG) 0 1.6 0.1 1.8221 Leather products (AGG) 0 0.4 1 1.4230 Stone, glass and clay (AGG) 0 2.3 2 4.4254 Primary metals (AGG) 0 0.5 0.1 0.6273 Fabricated metal (AGG) 0 2.4 1 3.4307 Industrial machinery (AGG) 0 29 3 32355 Electrical equipment (AGG) 0 6.3 6.5 12.7384 Transportation equipment (AGG) 0 3.1 4 7.1400 Scientific instruments (AGG) 0 1 3.8 4.8415 Miscellaneous mfg (AGG) 0 2.3 2.7 5433 Railroads and Related Services 199.9 36.5 2.8 239.2434 Other Transportation (AGG) 2.9 32.6 41.9 77.4435 Motor Freight Transport and Warehousing 1,168.00 1,148.60 41.9 2,358.50439 Transportation Services (AGG) 0 117.3 10.3 127.6441 Communications (AGG) 0 35.6 27 62.6443 Utilities (AGG) 0 116.4 14.2 130.6447 Wholesale Trade 1,352.60 712.5 198.3 2,263.40448 Retail Trade (AGG) 0 82 1,425.70 1,507.70456 Banking and Insurance (AGG) 0 288.4 282.2 570.6461 Real estate (AGG) 0 390.6 111.9 502.5463 Hotels and Lodging Places 0 59.5 73.5 133464 Personal services (AGG) 0 25.1 146.8 171.9469 Business services (AGG) 0 863.8 379.2 1,243.00477 Automotive services (AGG) 0 110.2 70.4 180.6480 Repair services (AGG) 0 25.4 18.1 43.5483 Motion Pictures 0 10 23.2 33.2484 Recreation services (AGG) 0 12.3 179.6 191.9

49
490 Health services (AGG) 0 0.9 690.6 691.5495 Education services (AGG) 0 3.7 133.7 137.4498 Social services (AGG) 0 5.3 198.4 203.7502 Non-profit organizations (AGG) 0 17.4 140.6 158510 Government (AGG) 0 232.4 71.5 303.9525 Domestic Services 0 0 67.1 67.1530 Potato 44 1,445.90 0.6 1,490.50531 Fresh Pack Potato 436.2 0 0.7 436.8532 Dehydrated Potato 308.4 0 0.1 308.6533 Frozen Potato 5,175.90 0 1.3 5,177.20534 Potato Chips 74.6 0 0.9 75.5
30001 Instutitions (AGG) 0 0 0 0 Totals 8,762.50 7,301.20 4,638.80 20,702.60
Table 5.8. provides an un-aggregated detail of the non-potato industries that
are most affected by potato industry exports in terms of number of jobs created. For
industries with no direct impacts, Agricultural-Forestry-Fishery Services is affected the
most with 653 Indirect jobs and 665 Total. Eating & Drinking has the most Induced jobs
with 472.
There are a total of 3,631,683 jobs in the Washington-CB model area. The
exports from the potato industry support nearly .6 percent of these jobs. However,
because the industry is concentrated in the Columbia Basin area, most of the employment
impact is felt this six county area. There are 227,132 jobs in the Columbia Basin, making
support of the potato industry responsible, both directly and indirectly, for over 9 percent
of the workforce in those seven counties.

50
Table 5.8. Fifteen Most Affected Non-Potato Industries, Jobs Sector Industry Direct Indirect Induced Total
435 Motor Freight Transport and Warehousing 1,168 1,149 42 2,359447 Wholesale Trade 1,353 713 198 2,26326 Agricultural- Forestry- Fishery Services 0 653 12 665
454 Eating & Drinking 0 40 472 512462 Real Estate 0 391 112 50356 Maintenance and Repair Other Facilities 0 341 66 407
474 Personnel Supply Services 0 256 81 337455 Miscellaneous Retail 0 12 316 329490 Doctors and Dentists 0 0 272 272433 Railroads and Related Services 200 37 3 239457 Credit Agencies 0 148 87 235492 Hospitals 0 0 223 224450 Food Stores 0 4 178 181164 Paperboard Containers and Boxes 0 170 2 172512 Other State and Local Govt Enterprises 0 136 26 162

51
CHAMPTER 6
SUMMARY AND ADDITIONAL RESEARCH
Summary
Input-Output economics can be an effective way to measure economic
impacts of an industry on an economy. Using a packaged computer program such as
IMPLAN makes constructing an I/O model and analyzing impacts easy, but some
industry detail is lost in aggregation. Modifying IMPLAN allows the user to retain detail
by specifically adjusting the model to match local industries.
The Washington-CB model is a customized I/O model that is detailed around the
potato industry. The economic impact of potato production and processing in
Washington was estimated using the Washington-CB model. Results from the model
show that in 2003, $1,626 million of potato products are manufactured from the
Washington-CB potato crop, by itself worth $577 million. The potato producing and
processing industry directly employs 9,114 people.
The Washington-CB area exports $1,402 million worth of potatoes and potato
products in the year 2003. Results from the export base type impact analysis show the
total effect of potatoes and potato product exports on the Washington-CB economy is
$1,374 million in Value Added, and $3,480 billion in Output (Sales). The total number
of jobs needed to support the potato export industry is 20,703. The largest non-potato
benefactor from potato-complex exports is Motor Freight and Transportation at $286
million in Output (Sales), and 2,359 jobs.

52
Additional Research
The accuracy of any model is only as good as the information used to build it.
Additional research in the area of potato economics may benefit from knowledge of the
stumbling blocks encountered during the creation of this Washington-CB model.
The lack of published enterprise budgets for Dehydrated Potatoes, French
fries and Potato Chips hinders the development of their Industry Balance Sheets. This
Washington-CB study was fortunate to have a potato industry veteran review the
production functions for accuracy, but the ideal situation would be a comprehensive
enterprise budget produced with actual industry data. Due to the competitive nature of
these industries however, actual industry production functions will most likely never be
available publicly.
Since the processed potato market is relatively mature, future growth will
probably occur from the demand for new potato products, rather than in the traditional
industries represented in the Washington-CB model. Newer products where any growth
is more likely to occur, such as frozen potato skins or frozen mashed potatoes, likely have
different production functions than French fries. In this study, all frozen potato products
are aggregated into the Frozen Potato production function. Therefore, more detail is
needed on the Industry Balance Sheet for Frozen Potato. An ideal potato I/O model
would contain a unique Industry Balance Sheet for every type of potato product produced
in the study area.

53
LITURATURE CITED
Bean, William, and David Runsten. “Value Added and Subtracted: The Processed Potato
Industry in the Mid-Columbia Basin.” Portland, OR: Columbia Basin
Institute, 1993.
Buteau, Joanne, A.Desmond O’Rourke. “The Processed Potato Industry in Washington
State: Structure and Markets.” Information Series No. 10, Coll. of Agr. and
Home Econ. IMPACT Ctr., Wash. State U., Pullman, 1986.
Conley, Dennis, Personal conversations and e-mail correspondents, Jan-Apri 2005.
Coon, Richard C. and F. Larry Leistritz, “Economic Impact of Production and Processing
of Irrigated Potatoes in Central North Dakota,” Agri. Bus. And Applied Econ.
Report No. 452, Ag. Experiment Station, North Dakota State U., Fargo, 2001.
Cutter, Eric, “IMPLAN Balance Sheet Export,” 100th Meridian,
www.100thmeridian.com.
Globalwise, Inc. “The Economic Impacts of Food Plant Closure: Analysis of the J.R.
Simplot Company Plant in Hermiston, Oregon,” Portland, OR: Northwest Food
Processors Association, 2004.
Hinman, Herbert, Gary Pelter, and Erik Sorensen. “2001 Cost of Producing Processing
and Fresh Potatoes Under Center Pivot Irrigation Columbia Basin, Washington.”
EB1906, Coll. of Agr. and Home Econ., Wash. State U., Pullman, 2001.
Holland, David, and Jun Ho Yeo. “The Economic Impact of Potatoes in Washington
State.” EB1925, Coll. of Agr. and Home Econ., Wash. State U., Pullman, 2001.

54
Jensen, William S., “Economic Impact of The Tree Fruit Industry in Washington State
and the Northwest,” Wenatchee, Wash. State Hort. Assn., 2004.
Leontief, Wassily, Input-Output Economics, 2nd ed. New York: Oxford University Press,
1986
MIG, Inc. IMPLAN Pro. User’s Guide, 3rd ed. Stillwater, Minn: Minnesota IMPLAN
Group, Inc., 2004.
Planning Decisions, Inc. “A Study of the Maine Potato Industry: Its Economic Impact
2003,” Presque Isle, ME, Maine Potato Board, 2003.
Schotzko, R. Thomas, and Kevin W. Sund. “Potatoes for the Fresh Market: The Costs of
Growing and Packing.” AE 02-8, Coll. of Agr. and Home Econ., Wash. State U.,
Pullman, 2002
Steinback, Scott. “Northeast Region Commercial Fishing Input-Output Model,” National
Marine Fisheries Service, NOAA, Woods Hole, Mass, Forthcoming.
U.S. Bureau of Reclamation, “Columbia Basin Project History,” www.usbr.gov, 1998.
U.S. Census Bureau, Foreign Trade Statistics, www.census.gov/foreign-trade/www/,
2003
U.S. Census Bureau, Foreign Trade Statistics, “Schedule B Export Codes,”
www.census.gov/foreign-trade/schedules/b/index.html, 2005.
U.S. Department of Agriculture, “Washington Agri-Facts,” September 15, 2004,
www.nass.usda.gov/wa/agri1sep.pdf, Olympia, WA, 2004.
U.S. Department of Labor, Bureau of Labor Statistics, “Consumer Price Index,”
www.bls.gov/cpi/home.htm, 2005.

55
Willis, David and David Holland. “Translating Farm Enterprise Budgets into Input-
Output Accounts: Another Example from Washington State.” Staff Paper 97-1,
Coll. of Agr. and Home Econ., Wash. State U., Pullman, 1997.
WSESD, “Covered Employment and Wages,” Washington State Employment Security
Division, www.workforceexplorer.com, 2003.
WSPC, “Disposition Report 03-04,” Washington State Potato Commission, Moses Lake,
Wash., 2004.

56
APPENDIX A
IMPACT AGGREGATION

57
Table A.1. Aggregation Scheme
Number Aggregated Sector IMPLAN Sector
1 Farms 1 2 3 4 5 6 7 8 9 10 11 12 13 14 15 16 17 18 19 20 21 22 23 24
25 Commercial Fishing 25 26 Ag Services 26 27
28 Other Mining 28 29 30 31 32 33 34 35 36 37 38 39 40 41 42 43 44 45 46 47 57
48 Construction 48 49 50 51 52 53 54 55 56
58 Food Processing
58 59 60 61 62 63 64 65 66 67 68 69 70 71 72 73 74 75 76 77 78 79 80 81 82 83 84 85 86 87 88 89 90 91 92 93 94 95 96 97 98 99 100 101 102 103 104 105 106 107
108 Textiles 108 109 110 111 112 113 114 115 116 117 118 119 120 121 122 123 124 125 126 127 128 129 130 131 132
133 Wood Products 133 134 135 136 137 138 139 140 141 142 143 144 145 146 147
148 Furniture 148 149 150 151 152 153 154 155 156 157 158 159 160
161 Pulp and Paper 161 162 163 164 165 166 167 168 169 170 171 172 173
174 Printing and Publishing 174 175 176 177 178 179 180 181 182 183 184 185
186 Chemicals and Allied 186 187 188 189 190 191 192 193 194 195 196 197 198 199 200 201 202 203 204 205 207 208 209
210 Petroleum Products 210 211 212 213 214 215 Rubber Products 215 216 217 218 219 220 221 Leather Products 221 222 223 224 225 226 227 228 229
230 Stone, Glass, and Clay 230 231 232 233 234 235 236 237 238 239 240 241 242 243 244 245 246 247 248 249 250 251 252 253
254 Primary Metals 254 255 256 257 258 259 260 261 262 263 264 265 266 267 268 269 270 271 272
273 Fabricated Metal
273 274 275 276 277 278 279 280 281 282 283 284 285 286 287 288 289 290 291 292 293 294 295 296 297 298 299 300 301 302 303 304 305 306
307 Industrial Machinery (continued on page 57)
307 308 309 310 311 312 313 314 315 316 317 318 319 320 321 322 323 324 325 326 327 328 329 330 331 332 333 334 335 336 337 338 339

58
Industrial Machinery (continued)
340 341 342 343 344 345 346 347 348 349 350 351 352 353 354
355 Electrical Equipment 355 356 357 358 359 360 361 362 363 364 365 366 367 368 369 370 371 372 373 374 376 377 378 379 380 381 382 383
384 Transportation Equipment 384 385 386 387 388 389 390 391 392 393 394 395 396 397 398 399
400 Scientific Instruments 400 401 402 403 404 405 406 407 408 409 410 411 412 413 414
415 Miscellaneous Mfg. 415 416 417 418 419 420 421 422 423 424 425 426 427 428 429 430 431 432
433 Railroads and Related 433 434 Other Transportation 434 436 437 438
435 Motor Freight Transport and Warehousing 435
439 Transportation Services 439 440 441 Communications 441 442 443 Utilities 443 444 445 446 447 Wholesale Trade 447 448 Retail Trade 448 449 450 451 452 453 454 455 456 Banking and Insurance 456 457 458 459 460 461 Real Estate 461 462 463 Hotels and Lodging Places 463 464 Personal Services 464 465 466 467 468
469 Business Services 469 470 471 472 473 474 475 476 494 506 507 508 509
477 Automotive Services 477 478 479 480 Repair Services 480 481 482 483 Motion Pictures 483 484 Recreation Services 484 485 486 487 488 489 490 Health Services 490 491 492 493 495 Education Services 495 496 497 498 Social Services 498 499 500 501 502 Non-Profit Organizations 502 503 504 505
510 Government 510 511 512 513 514 515 516 517 518 519 520 521 522 523 524 526 527 528
525 Domestic Services 525 530 Potato 530 531 Fresh Pack Potato 531 532 Dehydrated Potato 532 533 Frozen Potato 533 534 Potato Chips 534

59
APPENDIX B
IMPLAN MODEL MODIFICATION

60
Acknowledgements
This appendix is a general form set of instructions based on procedures
created by Scott Steinback for his Northeast Region Commercial Fishing Input-Output
Model. Eric Cutter created the Balance Sheet Export macro that deals with the report
errors. Further technical help was provided by Doug Olson and Scott Lindall of
Minnesota IMPLAN Group, Inc.
IMPLAN Modification Overview
The 2000 IMPLAN database contains information for 528 sectors, which are
generalized aggregations of multiple industries. The IMPLAN Pro software allows for
adjustments to the database information, which allows the user to accurately reflect local
model industries. However, the software does not allow for disaggregating of a sector
when more industry specific detail is required. Disaggregating can be accomplished by
adding new sectors to an IMPLAN model with Microsoft ACCESS. This appendix
attempts to describe the procedures required for IMPLAN modification.
The 2001 and beyond IMPLAN databases have only 509 sectors, but the
procedures for modification are exactly the same.
Note that changes made in IMPLAN or ACCESS are instantaneous and
permanent. Make back up copies and save changes as you go under different file names
to prevent costly mistakes!

61
ACCESS Overview
An IMPLAN model consists of ACCESS tables and queries that can be
viewed by opening the .iap file in ACCESS 2000. All IMPLAN models have an .iap file
extension, so it is necessary to select Files Of Type >> All Files in order to view
available IMPLAN files when opening with ACCESS.
ACCESS may need to make automatic formatting changes if opening an older
IMPLAN model for the first time. Allow ACCESS to make the changes.
A file retrieved from a CD-ROM will automatically write protect itself. This
write protect needs to be removed to open in IMPLAN or be modified in ACCESS.
Copy the file onto the computer. Left-click on the file and select Properties, then uncheck
Read Only. This will allow IMPLAN to open the file and to write changes.
The sixteen IMPLAN tables that need to be modified are listed in Table B.1.
Appendix E in the IMPLAN User’s Guide provides a detailed description of the data
contained in each table. The Margins and Margin Codes tables can also be modified if
desired, but this is not necessary to make the model run correctly. The procedure for
changing each table is similar:
1. Export and save each file as a Microsoft EXCEL file.
2. Make the necessary additions or changes to the file.
3. Import the new file back into ACCESS as an ACCESS table.
4. Check the table for proper indexes.
Once all the tables are adjusted, the Social Accounts and Multipliers are
rebuilt in IMPLAN, and the new model is complete.

62
Table B.1. Modified ACCESS Tables
Deflators1 Industry/Commodity Codes →Observed RPCs
RPC Methods RptSAFinal Demands RptSAIndustry Data
SACommodity Sales SAEmployment SAFinal Demands
SAForeign Exports SAOutput SAValue Added
Type Codes →US Absorption Table →US Absorption Totals
→US Byproducts
→ Indicates Linked ACCESS Table
ACCESS Table Exportation
To export an ACCESS file into EXCEL, highlight the table and click File >>
Export. Save the table with it’s original file name as an EXCELL file by choosing Save
As Type >> Microsoft EXCEL. Save the tables in an easily accessible folder to make the
importation step easier.
Tables marked with an arrow in ACCESS are linked to other IMPLAN
models on the same computer. Do not alter these tables in ACCESS; doing so will affect
other IMPLAN models on the same computer. Export these tables into EXCEL, and then
delete the table in ACCESS to destroy the linkage. When the table is imported back into
ACCESS, the arrow should be gone.

63
EXCEL File Importation
When importing the adjusted EXCEL file back into ACCESS, a few details
need to be noted. Import the file by clicking File >> Get External Data >> Import.
Select Files of type: Microsoft Excel to allow the EXCEL files to appear. Select an
EXCEL file to import. When prompted by the Import Wizard, check First Row Contains
Column Headings. Also check No Primary Key when prompted by the Import Wizard.
Underscores are placed in place of spaces in the table name, remove the underscores and
replace with spaces so IMPLAN can find the proper tables. Be sure that table names are
written exactly the same as when IMPLAN named them.
Table Indexes
Each ACCESS table has an index that controls the layout of the table. These
indexes need to be correct for IMPLAN to function properly. View a table index by
highlighting a table and clicking Design. Then click View >> Indexes to see the current
index scheme. Sometimes importation of EXCEL files into ACCESS will change the
table’s index. All the indexes need to be formatted correctly, but the most important
index is SACommodity Sales. This contains the IMPLAN version code. It should read
something like Ver 2_0_1024 under the Index Name heading, where the numbers
represent the version of IMPLAN the model was built with. A proper SACommodity
Sales table is shown in Table B.2.

64
Table B.2. Index View For SACommodity Sales ACCESS Table Index Name Field Name Sort Order Ver 2_0_1024 Commodity Code Ascending Type Code Ascending
The best way to check for proper indexes is to compare the tables of the
modified model with the indexes of another IMPLAN model, making sure all the
adjusted table indexes are correct.
Potential Errors
IMPLAN .iap files cannot be opened from a CD-ROM. Copy the file onto the
computer, then right-click on the file, select Properties, and uncheck Attributes: Read-
only.
Error: 22002 Invalid procedure call or argument Code:5 – This error is
caused because there is no IMPLAN version code embedded in the SACommodity Sales
Index. Open the SACommodity Sales table in Design View and enter the correct
IMPLAN version number under Index Name.
filename.iap is not an IMPLAN database! – Most likely caused because the
.iap file was modified in ACCESS 97 or ACCESS XP instead of ACCESS 2000. Be sure
to use ACCESS 2000 for IMPLAN modifications.
IMPLAN will sometimes have problems displaying a Commodity or Industry
Balance Sheet. For example, the Gross Inputs might show up as zeros or absurdly large

65
numbers. This is due to a known bug in the exporting software. Eric Cutter has
developed an EXCEL macro, which overcomes this problem and is available for
download at www.100thmeridian.com. The macro requires that the Microsoft EXCEL
10.0 Object Library be installed to run. Cutter’s macro was used to export the Social
Account reports in this thesis.

66
APPENDIX C
SCOTT STEINBACK’S FISHERIES APPENDICES

67
Northeast Region Commercial Fishing Input-Output Model
Scott Steinback NOAA / National Marine Fisheries Service
166 Water Street Woods Hole, MA 02543
January 2005
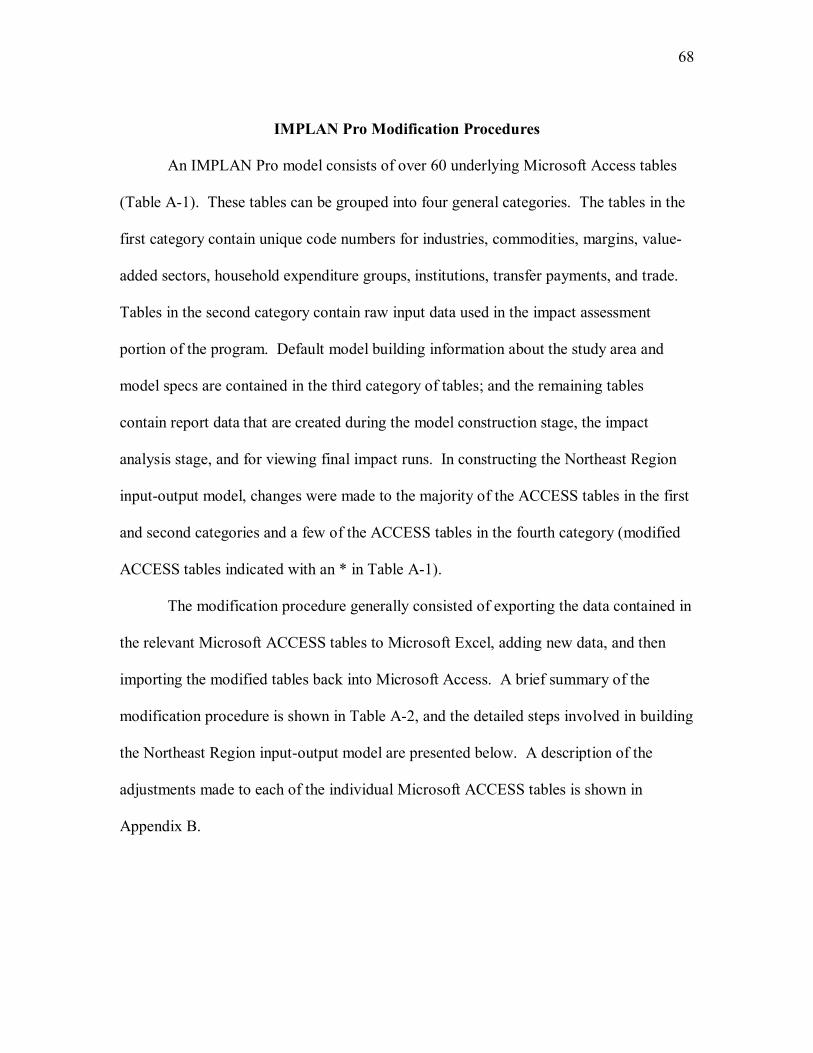
68
IMPLAN Pro Modification Procedures
An IMPLAN Pro model consists of over 60 underlying Microsoft Access tables
(Table A-1). These tables can be grouped into four general categories. The tables in the
first category contain unique code numbers for industries, commodities, margins, value-
added sectors, household expenditure groups, institutions, transfer payments, and trade.
Tables in the second category contain raw input data used in the impact assessment
portion of the program. Default model building information about the study area and
model specs are contained in the third category of tables; and the remaining tables
contain report data that are created during the model construction stage, the impact
analysis stage, and for viewing final impact runs. In constructing the Northeast Region
input-output model, changes were made to the majority of the ACCESS tables in the first
and second categories and a few of the ACCESS tables in the fourth category (modified
ACCESS tables indicated with an * in Table A-1).
The modification procedure generally consisted of exporting the data contained in
the relevant Microsoft ACCESS tables to Microsoft Excel, adding new data, and then
importing the modified tables back into Microsoft Access. A brief summary of the
modification procedure is shown in Table A-2, and the detailed steps involved in building
the Northeast Region input-output model are presented below. A description of the
adjustments made to each of the individual Microsoft ACCESS tables is shown in
Appendix B.
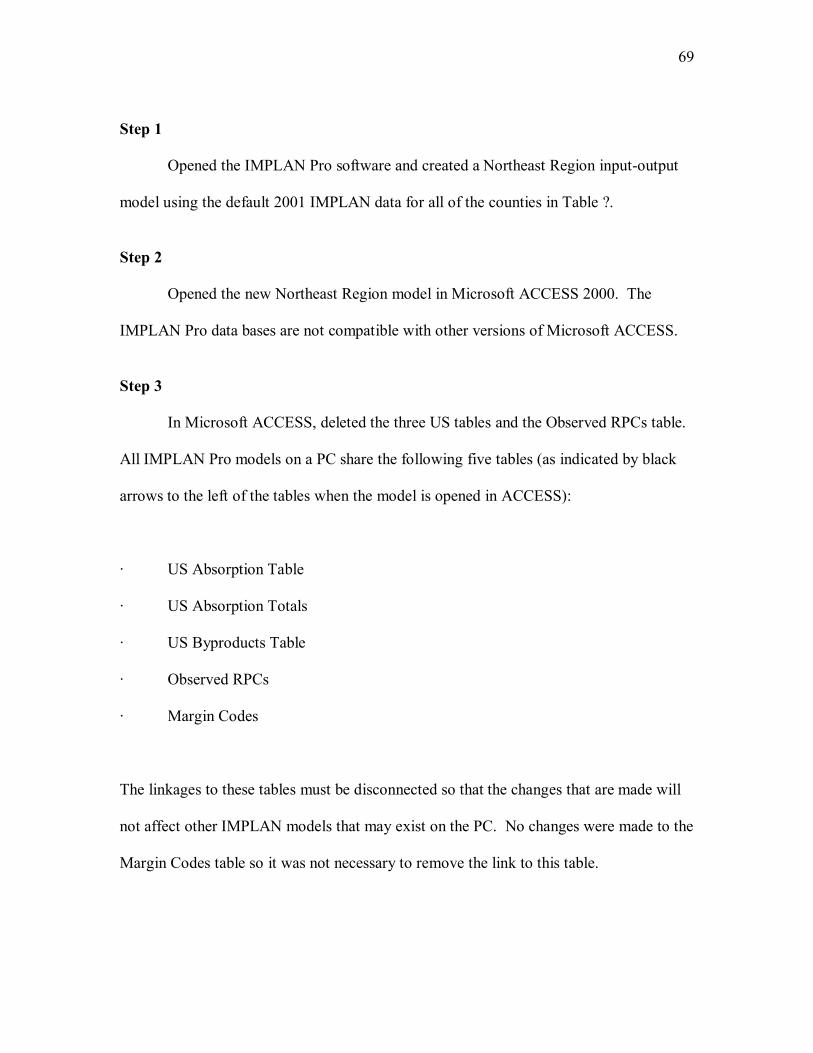
69
Step 1
Opened the IMPLAN Pro software and created a Northeast Region input-output
model using the default 2001 IMPLAN data for all of the counties in Table ?.
Step 2
Opened the new Northeast Region model in Microsoft ACCESS 2000. The
IMPLAN Pro data bases are not compatible with other versions of Microsoft ACCESS.
Step 3
In Microsoft ACCESS, deleted the three US tables and the Observed RPCs table.
All IMPLAN Pro models on a PC share the following five tables (as indicated by black
arrows to the left of the tables when the model is opened in ACCESS):
· US Absorption Table
· US Absorption Totals
· US Byproducts Table
· Observed RPCs
· Margin Codes
The linkages to these tables must be disconnected so that the changes that are made will
not affect other IMPLAN models that may exist on the PC. No changes were made to the
Margin Codes table so it was not necessary to remove the link to this table.

70
Step 4
In ACCESS, imported the three US tables and the Observed RPCs table from the
2001 IMPLAN Pro structural matrix file 01NAT509.IMS.
Step 5
In ACCESS, exported the default data in the 16 ACCESS tables that were going
to be modified to Excel. The US Absorption table consisted of over 80,000 rows of data,
however, so it was necessary to create two Excel tables to house this information since
Excel is limited to 65,536 rows.
Step 6
Deleted all of the default data in the 16 ACCESS tables, but kept the layout of the
tables and the table names the same so that the updated Excel data could be imported
back into the original ACCESS file structures.
Step 7
Modified the data in the 16 Excel tables to better reflect the sectoral linkages
among fisheries-related industries (see Appendix B). Maintained the default variable
names and record formats so that the files were compatible with the original ACCESS
file structures.

71
Step 8
Imported the seventeen updated Excel files into ACCESS. An append query in
ACCESS was used to combine the two US Absorption Excel files into one US
Absorption table.
Step 9
Opened the modified model in IMPLAN Pro and reconstructed the model and
multipliers. The IMPLAN Pro software is not capable of recognizing the direct changes
made to the underlying ACCESS tables, so the model must be reconstructed to load the
updated data.

72
IMPLAN Pro Table Adjustments Industry/Commodity Codes
This table contains unique code numbers for industries and commodities.
Industries and commodities share the same name and number in an IMPLAN Pro model.
Modifications began by removing the default commercial fishing sector (IMPLAN sector
number 16) and adding 394 new harvesting sectors to the model (Table B-1). These
industry sectors designate different commercial fishing gear and vessel length categories
in each of the subregions in the Northeast. However, no harvesting sectors were added
for the North Carolina north subregion or the North Carolina central inshore and offshore
lobster harvesting sectors. An IMPLAN Pro model is limited to 1,000 industry sectors
and this constraint would have been exceeded after adding all of the harvesting sectors
and the remaining fisheries-related sectors to be discussed below. Therefore, since there
were no recording landings in the North Carolina north subregion in 2001 or for the
North Carolina central inshore and offshore lobster harvesting sectors in 2001, these
industries were excluded from the model. Industry sectors were created for all of the
remaining harvesting sectors in all 23 subregions, even if there were no reported landings
in 2001.
Additional changes included adding 23 wholesale seafood dealer sectors (sector’s
904-926 in Table B-1), 4 fish exchange sectors (sector’s 927-930 in Table B-1), 23
midwater trawl bait supplying sectors, and 23 medium bottom trawl bait supplying
sectors (sectors’s 931-976 in Table B-1). Finally, removed the default seafood

73
processing sector (IMPLAN sector number 71) and added 23 subregional processing
sectors (sector’s 977 - 999 in Table B-1).
Type Codes
The Type Codes table contains coding information on all transaction types in the
data sets. For this table, we added the 490 industry/commodity code designations as
assigned above and the associated 490 SAM Commodity codes. Transaction codes
associated with Factors, Households, Institutions, Transfers, Employment, Output, and
Trade remained the same.
US Absorption
This table contains the United States absorption matrix, which in input-output
terminology is the coefficient form of the use table. The default 2001 table contains
80,285 rows of data that show the proportions of commodities each industry uses in its
production process (i.e., its production function). We removed the 213 rows of data
contained in the production functions for the default commercial fishing sector (sector
16) and the default seafood processing sector (sector 71), and then added 55,425 rows of
data that contained the production functions of each of the 490 fisheries-related sectors
that we added to the model.
Production function adjustments to sectors that purchase commodities from the
default commercial fishing sector (i.e., seafood) and the default seafood processing sector
were also required, since these sectors were removed from the Northeast Region input-
output model. Adjustments were made by first identifying the industries that purchase

74
seafood from these sectors. The commodity balance sheet report option in IMPLAN Pro
provides information on all industry sectors that purchase from a particular sector. Using
this option, we were able to identify the 11 industry sectors that purchase seafood from
the default commercial fishing sector, and the 27 industries that purchase from the default
seafood processing sector in the 2001 data (Table’s B-2 and B-3). However, our
Northeast Region model wholesale seafood dealers are assumed to purchase 100% of the
commercial fishing output. Thus, it was necessary to change the assignment of seafood
purchases for the 11 industry sectors that purchase commercial fishing output. We
assumed that 7 of the 11 sectors would purchase seafood from seafood processors and the
remaining 4 would purchase from wholesale seafood dealers (see Table B-2).
This reassignment strategy, however, entailed an additional step because the
Northeast Region model includes 23 subregional wholesale seafood dealer sectors and 23
subregional seafood processing sectors. A method had to be developed to determine
which of the subregional dealers and processors the industries in Table’s B-2 and B-3
would purchase their seafood from. At the suggestion of the software vendor, we decided
to allocate purchases according to output proportions in each subregion. In other words,
we used the subregional shares of total wholesale seafood dealer output and seafood
processing output in the Northeast Region to allocate purchases. These shares were then
multiplied by the default commercial fishing sector’s and/or the default seafood
processing sector’s gross absorption coefficient contained in the production functions of
each of the sectors shown in Table’s B-2 and B-3. The resulting vector of absorption
coefficients was then inserted into the US Absorption Table in place of the default values
75
for each of the sectors shown in Table’s B-2 and B-3. Note that the sum of the values
contained in the vector of absorption coefficients must sum exactly to the absorption
coefficient contained in the default data or the model will not build correctly.
US Absorption Totals The US Absorption Totals table contains the sum of the absorption coefficients for each
industry sector. We removed the default commercial fishing sector’s total absorption
coefficient and the default seafood processing sector’s total absorption coefficient, and
then added the appropriate absorption coefficients for the 490 new sectors in the
Northeast Region model. The sum of the coefficients from each sector in the US
Absorption table must match the coefficients in the US Absorption Totals table.
US Byproducts This table contains US estimates of the proportions of each commodity an industry
produces. In input-output terminology it is the coefficient form of the make table derived
by dividing each element by the make table row totals. Industries often produce more
than one commodity. Commodities other than primary commodities are called secondary
commodities or byproducts. For this table, we first examined if any of the 509 default
industry sectors produced commercial fishing seafood or processed seafood as a
byproduct. The commodity balance sheet report option in IMPLAN Pro provides
information on commodity production by all industries. From this report we found that
no other industries produced commercial fishing seafood as a byproduct in the 2001 data.
However, there were three industries (Frozen food manufacturing, Fruit and vegetable

76
canning and drying, and Meat processed from carcasses) that produced processed seafood
as a byproduct. If we allowed these sectors to produce processed seafood as a byproduct,
the model would not construct properly because the default seafood processing sector
was removed from the model. Therefore, we removed the proportion associated with
processed seafood for these three sectors and added it to their primary commodity share,
so that the sum of each sector’s byproducts remained equal to one. The byproducts
coefficients, which include the primary commodity share coefficient, must sum to one for
each sector in the model in order for the model to construct properly.
We also assumed that each of the 490 new sectors that were added to the model
would produce only primary commodities. Thus, we added a single record to the US
Byproducts table for each of the 490 new sectors and set each sector’s primary
commodity share coefficient to one.
SACommodity Sales
This table shows sales of commodities by households and institutions in the study
area. There were no sales of seafood by households in the default data so no changes
were made to the commodity sales rows for the nine household expenditure sectors (i.e.,
Type Codes 10001 - 10009). There were also no institutional sales of raw harvested
seafood or processed seafood. However, zeros are entered into the commodity sales field
when no sales are present so we had to remove the records that pointed to these
commodity codes in the default institutional sales data. In addition, since we’ve assumed
that there are no institutional sales of commodities produced by the 490 new industries

77
we added to the model, rows with zeros in the commodity sales field were inserted into
the table.
We also had to remove inventory additions (Type Code 14002) that existed in the
default data for the seafood processing sector (Sector 71) since we eliminated this sector
from the Northeast Region model. Subregional seafood processing sectors were added to
the model, however, so we simply reassigned the single Northeast Region default
inventory value to the 23 new subregional seafood processing sectors in the model. This
was done by constructing 23 separate subregional IMPLAN Pro models to obtain the
default inventory seafood processing values in each subregion. These default values
were then assigned to the 23 subregional seafood processing commodity codes in the SA
Commodity Sales table.
SAEmployment
The SA Employment table delineates average annual jobs for each industry in the
study area. Jobs are measured in terms of both full-time and part-time workers
combined. For this table, we removed the employment estimates for the default
commercial fishing sector (Sector 16) and the default seafood processing sector (Sector
71), and then inserted our employment estimates for the 490 new sectors.
SAFinal Demands
The final demand table consists of purchases of commodities for final
consumption by households and institutions. Several modifications were made to this

78
table. The first step entailed removing final demands associated with the default
commercial fishing sector and the default seafood processing for all nine of the
household expenditure type codes and for all of the institution type codes. We then used
these default values in combination with output data and the dealer transaction matrix
(see Section ?) to estimate final demands by type codes for the new harvesting sectors,
seafood dealer sectors, and seafood processing sectors.
Final demands for each of the 394 new harvesting sectors were estimated by first
calculating the proportion of a sector’s output to the total output across all 394 sectors,
and then multiplying this proportion by each default commercial fishing sector’s (Sector
16) final demand value contained in a Northeast Region-level model across type codes.
Final demands at the wholesale seafood dealer level were more difficult to
calculate because the wholesale seafood dealer sector is lumped into in an all
encompassing wholesale trade sector in an IMPLAN Pro model. Thus, there were no
default final demand values specifically for seafood purchased at the wholesale level to
use as a benchmark in our new model. However, using the average 2001 wholesale
seafood mark-up from Fulton fish market (40%) in combination with the dealer
transaction matrix we estimated final demands by type code for all 23 wholesale seafood
dealers in the model. Assuming all commercially landed seafood flows through
wholesale dealers, we first divided the commercial fishing final demand sales calculated
above by 0.4 to calculate the wholesale dealer final demand sales associated with each of
the 394 new harvesting sectors. We then multiplied these values by the proportions
contained in the dealer transaction matrix to determine final demand sales by wholesale

79
dealer and type code associated with each new harvesting sector. Lastly, we summed the
final demand sales across harvesting sectors for each wholesale dealer by type code. The
resulting final demand vector contained final demand sales for all 23 wholesale seafood
dealers by type code and was incorporated into the SA Final Demands table. These final
demands were also subtracted from the default wholesale trade final demand values since
they were reassigned to 23 new sectors in our model.
Finally, final demands for the 23 seafood processing sectors were calculated in
the same manner as the harvesting sector’s final demands. The proportion of a sector’s
output to the total output across all 23 sectors was multiplied by each default seafood
processing sector’s (Sector 71) final demand value contained in a Northeast Region-level
model across type codes.
SAForeign Exports
The SA Foreign Exports table shows demands made for goods and services by
consumers and industries outside the US. For this table, we removed the foreign export
estimates for the default commercial fishing sector (Sector 16), re-estimated foreign
exports for raw seafood from new data (see below), and assumed that foreign exports of
raw seafood occur at the wholesale level and not the harvesting level. Additionally,
foreign exports for the 23 new processing sectors added to the model were estimated by
constructing 23 separate subregional IMPLAN Pro models to obtain the default inventory
seafood processing export values in each subregion.
80
Foreign exports of seafood produced at the wholesale-level in the Northeast
Region were calculated according to the following six steps.
Step 1 - Northeast dealer reports were used to calculate the value of landings by species
for the top three to five species landed (by value) for each harvesting sector gear type in
the model.
Step 2 - Calculated the proportion of total value by species and product type that is
exported out of the US. New England and Mid-Atlantic foreign trade data by species and
product type is available from the Fisheries Statistics & Economics Division of the
National Marine Fisheries Service (NMFS) at
http://www.st.nmfs.gov/st1/trade/index.html. This data is purchased from the Foreign
Trade Division of the U.S. Census Bureau and provides information on trade ($’s and lbs)
through specific U.S. customs districts such as New England and the Mid-Atlantic
regions. We divided the value exported by species and product type, by the region-wide
export value of total landings (average export price multiplied by total landings) to obtain
the proportion of total sales exported out of the U.S. by product type.
Step 3 - Assumed fresh fillets and fresh and frozen whole fish would be exported by
wholesalers. The remaining product type categories (frozen fillets, salted, dried, minced
frozen, smoked, and an other product type category) were assumed to be exported by
seafood processors. We summed the export proportions from Step 2 across the three
wholesale product type categories to estimate total Northeast Region export proportions
(in terms of value) by species.

81
Step 4 - Calculated weighted average wholesaler export proportions derived from the
harvesting gear types. The export proportions from Step 3 were weighted by the
proportions of landed value by species (for the top three to five valued species) to total
landed value for each of the harvesting gear types. These species-level proportions for
each gear type were then summed across species to obtain the proportions of wholesaler
output that will be exported out of the U.S. originating from the 18 different gear types in
the model. Note that the export rates derived from each gear type are assumed to be the
same across the 23 subregions.
Step 5 - The wholesale export rates from Step 4 were then multiplied by the output values
contained in the dealer transaction matrix (adjusted upward assuming a margin of 40%)
to obtain the wholesale dealer export values across the 23 wholesale sectors associated
with each harvesting sector in the model.
Step 6 - We then summed the wholesale export values from Step 5 across harvesting
sectors for each of the 23 wholesalers and divided this value by the total sales from each
wholesale sector. The resulting values show the average proportion of total seafood sales
that is exported out of the U.S. by each wholesaler. These proportions were then
multiplied by the margined wholesale output values contained in the SAOutput table (the
wholesale sectors are treated as margin sectors in the model) to determine the value of
foreign exports for each of the 23 wholesale sectors in the model.
SAOutput
The SAOutput table is a vector of output values in millions of dollars that
represent an industries total production. There is a single value for each of the 997

82
sectors in the model. We removed the default commercial fishing sector’s output value
and the default seafood processing sector’s output value, and then added the appropriate
production values for the 490 new sectors in the Northeast Region model.
SAValue Added
This table details payments made/received by each industry to employee
compensation (wage and salary payments, insurance, retirement, etc.), proprietary income
(all income received), other property type income (payments from interest, rents,
royalties, dividends, corporate profits, etc.), and indirect business taxes (primarily excise
and sales taxes). The value added transactions associated with the default commercial
fishing and seafood processing sectors were removed, and the appropriate values for the
490 new sectors were added to the table.
Observed RPCs
The Observed RPCs table contains forced regional purchase coefficient values for
all states in the model. We removed the values associated with the default commercial
fishing and seafood processing sectors and added the appropriate RPC values by state
FIPS codes for the 490 new sectors added to the model. We used the average RPC option
in IMPLAN Pro so the same RPC value was applied across states for each of the 490 new
sectors. However, because of the way the model calculates impacts across sectors,
virtually all of the RPC values for the new sectors were set to zero - the RPCs for the bait
sectors were set to one.

83
RPC Methods
This table contains information for creation of the regional purchase coefficients.
Similar to the modifications made for to many of the other tables, we removed the
information associated with the default commercial fishing and seafood processing
sectors and then added the relevant information for the 490 new sectors to the table.
Deflator1
The Deflator1 table contains deflators that account for relative price changes
during different time periods. The IMPLAN Pro deflators are derived from the Bureau of
Labor Statistics Growth Model. The 2001 IMPLAN Pro data base contains deflators
from 1977 to 2010 for each commodity in the model. We eliminated the default
commercial fishing sector deflators and applied these same values to the 394 new
harvesting sectors in the table. We also removed the default seafood processing sector
and applied those deflators to the 23 new subregional seafood processing sectors that we
added to the table.
rptSAFinal Demands
This is a report table that is used by the IMPLAN Pro software to view final
demand purchases of industry outputs. Report tables are not used by the IMPLAN Pro
software for model construction or impact analysis; they simply provide a means to view
data from within the IMPLAN Pro system. Therefore, modifications to this table are not
absolutely necessary, but are required in order to use the IMPLAN Pro reporting feature.
To keep the software fully functional we modified the final demand values in this
table. We removed the final demand values associated with both the default commercial

84
fishing and seafood processing sectors, and added the appropriate data from the SAFinal
Demands and SAForeign Exports table. Note that modifications in ACCESS are not
acknowledged by the IMPLAN Pro software so the social accounts must be regenerated
after changes are made in order for the reporting features in IMPLAN Pro to work
properly.
rptSAIndustry Data
This is another report table that is used by the IMPLAN Pro software to view
industry output, employment, and value added information by sector. Changes to this
table will not effect model construction or impact analysis, but need to be made in order
to use the reporting feature in the IMPLAN Pro software. We eliminated the industry
data associated with the default commercial fishing and processing sectors, and added the
appropriate data from the SAOutput table, SAEmployment table, and the SAValue
Added table.

85
Table C-1 - IMPLAN Pro Tables Table Name
Description
Category
*Industry/Commodity Codes Codes (Modified)
*Type Codes Codes (Modified) Margins Codes
Codes
1
*US Absorption Table *US Absorption Totals *US Byproducts Table
Raw input data (Modified)
*SACommodity Sales *SAEmployment *SAFinal Demands *SAForeign Exports *SAOutput *SAValue Added
Raw input study area data (Modified)
SATransfers Raw input study area data *Observed RPCs
Raw input data (Modified)
*RPC Methods Raw input data (Modified) Margins
Raw input data
*Deflators Raw input data (Modified)
2
General Information Model-building information Model Specs Multiplier Specs
Model-building information
SARatios Ratios for impact and multiplier calculations
3
IMCommodity Transactions IMEvents IMFactor Transactions IMGroups IMIndustry Transactions IMInstitutions Transactions IMMargins IMProjects
Impact report data (Empty before impact analysis)
Regional Absorption Regional Byproducts Regional Commodity Balances Regional Direct Institutional Requirements Regional Factor Balances Regional Industry Balances Regional Institution Balances Regional Institution Demand Regional IxI Regional Market Shares Regional Multipliers Induced Regional Multipliers Type I Regional SAM Balances Regional SAM Balances Aggregated Regional SAM Balances Industry Detail Regional SAM Balances IxI Regional SAM Balances IxI Industry Detail Regional Sam Distribution Regional Value Added Coefficients
Output/report data for regional I-O model (Empty before ‘Construct Model’)
rptEC Multipliers rptEmployment Multipliers rptIBT Multipliers rptOPTI Multipliers rptOutput Multipliers rptPersonal Income Multipliers rptPropInc Multipliers rptTotal VA Multipliers
Output reports
*rptSAFinal Demands Data from SAFinal Demands and SAForeign Exports (Modified)
*rptSAIndustry Data Data from SAOutput, SAEmployment & SAValue Added (Modified)
SAM Rollup SAM report data
Tax Impacts Tax report data
Type Code Rollup Type code report data
CGE Account Output data for computable general equilibrium models
4

86
Table C-2 - Summary of IMPLAN Modification Procedure General Steps for
Model Construction
General Instruction
1 In IMPLAN, select new model, name the new model, locate the relevant regional data, build study area
2 Open the new model in ACCESS 3 Delete the three US tables and the Observed RPCs table 4 Import the three US tables and the Observed RPCs table from 01NAT509 5 Export the default data in the 16 ACCESS tables that will be modified to
EXCEL 6 Delete all default data in the 16 ACCESS tables 7 Create 16 new tables with modified data in Excel 8 Import the 16 updated tables from EXCEL into ACCESS 9 In IMPLAN, reconstruct the model and multipliers