the economics of ecmo, vad and transplant...
TRANSCRIPT
1
The Economics of ECMO, VAD and
Transplant 2015
Scott Silvestry MDFlorida Hospital Transplant Institute
Orlando, Florida
2
No Relevant disclosuresConsultant, Proctor- Thoratec , HeartWareResearch Support Thoratec (2012-3)
Acknowledge Michael Acker MD, for the gracious use of his slides
3
Focus on Economic/Finance
1. Review the evolving paradigm in Health Care Payments.
2. Review the changes in ECMO payment
3. Examine LVAD therapy cost/cost effectiveness.
4. What is your roadmap to quality and value?

ECMO Valuation Has Changed
Code Glob Short DescriptorRUC
RVWCMS RVW
33946 XXX ECMO: initiation, veno-venous 6.00 6.00
33947 XXX initiation, veno-arterial 6.63 6.63
33948 XXX daily management, each day, veno-venous 4.73 4.73
33949 XXXdaily management, each day veno-arterial
4.60 4.60
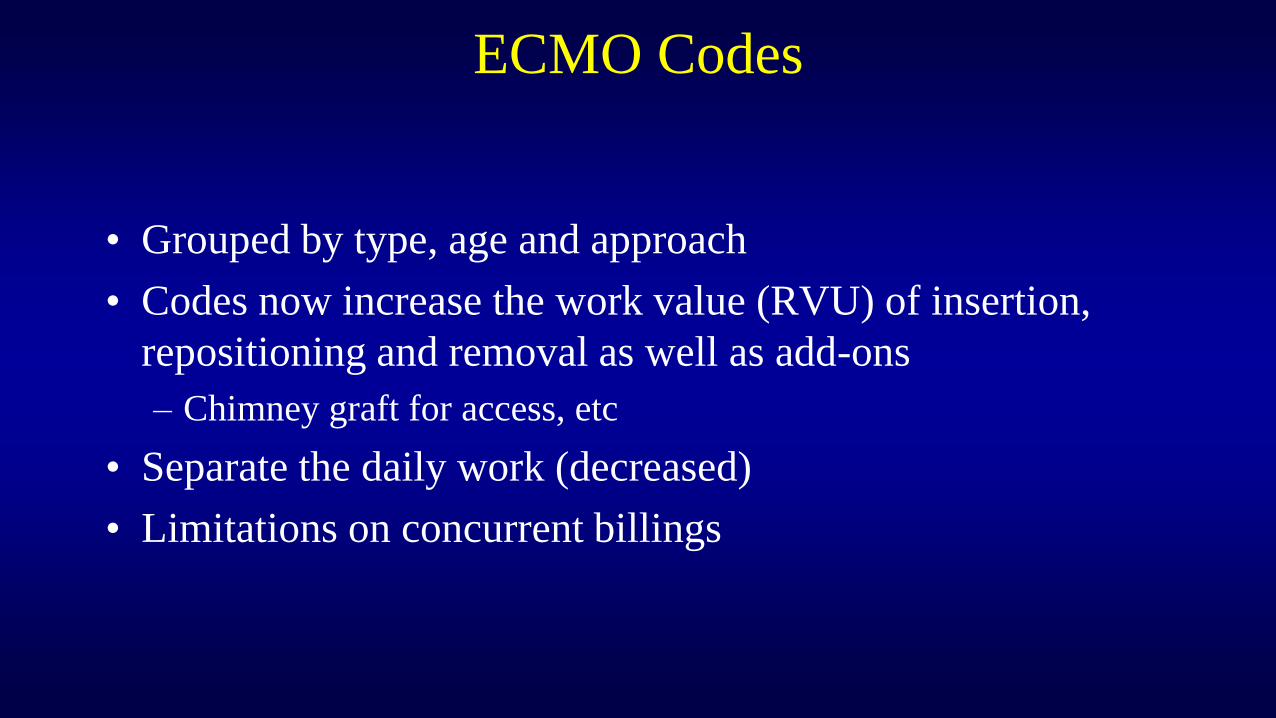
ECMO Codes
• Grouped by type, age and approach
• Codes now increase the work value (RVU) of insertion,
repositioning and removal as well as add-ons
– Chimney graft for access, etc
• Separate the daily work (decreased)
• Limitations on concurrent billings
The bad news-
CMS finalized its intention to abolish the
global period on October 31, 2014
More good news-
SGR is fixed!

90 Day GlobalThis is the most common designation for surgical procedures and
prohibits billing for related services 1 day before and 90 days after
the procedure since the global code for a procedure already
contains the RVU value of the “typical” physician services
provided during that period.
For example, this is a 90 day global:
33945 Heart Transplant
8
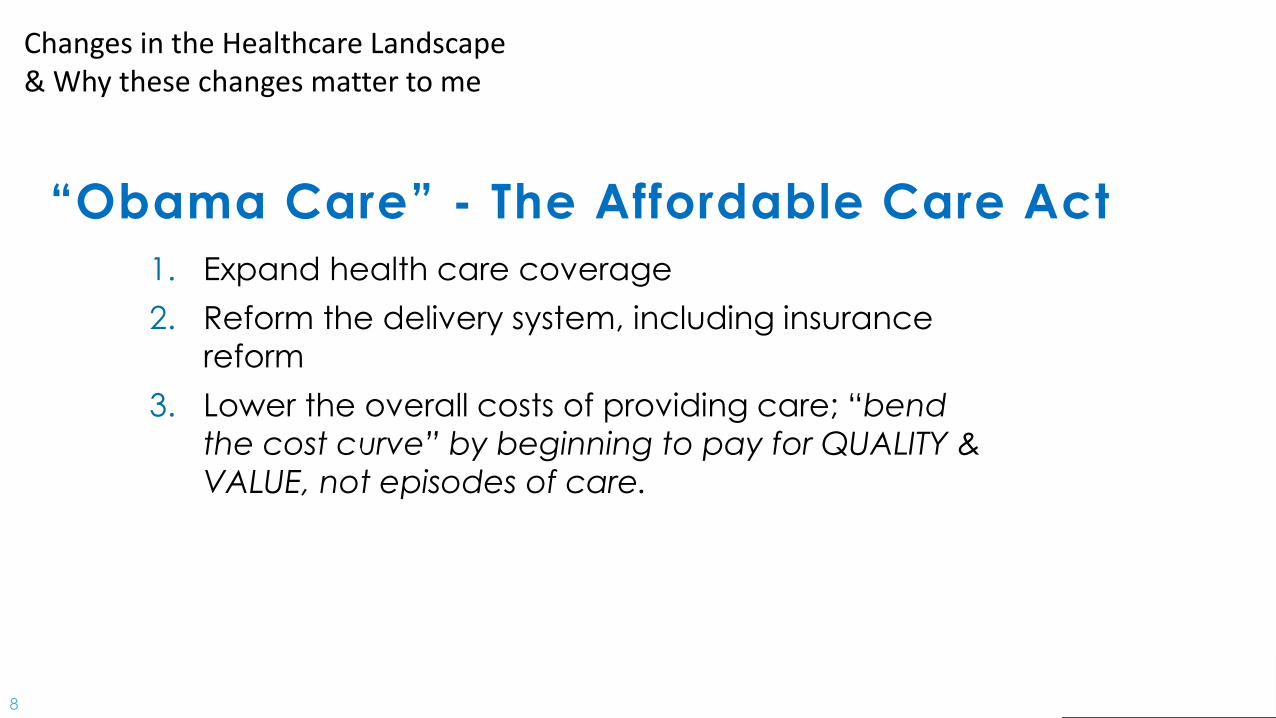
“Obama Care” - The Affordable Care Act
1. Expand health care coverage
2. Reform the delivery system, including insurance
reform
3. Lower the overall costs of providing care; “bend
the cost curve” by beginning to pay for QUALITY &
VALUE, not episodes of care.
Changes in the Healthcare Landscape& Why these changes matter to me

9
The Uninsured are decreasing
20142010

10
US Hospital & Insurer Earnings are Up
Source: Bloomberg

11
What is Value in Health Care?
11
“Achieving high value for patients must become the overarching goal of health care delivery, with value defined as the health outcomes achieved per dollar spent.” Michael
Porter NEJM

What is Quality?
Juran's Fitness for intended use.
Conformance:– the degree to which a product
characteristic meets preset standards.
• Reliability– that the product will function as expected
without failure;
Value for Price Paid?
• Features– the extras that are included beyond the
basic characteristics;
• Durability – expected operational life of the product;
and
• Serviceability
Deming states that the customer's definition of quality is the only one that matters. So,
who is the customer?

Recognize what we provideand what we will be paid to provide
Service
Process
Skill
Technology
Quality of Life
Alleviate suffering
Specific goals
Recognize limitations
Before
During
After Therapy
Patient Experience
13
We must be thoughtful in what we do, who we do it to and when we stop.

14
Changes in the healthcare landscape will
create a systematic focus on Heart Failure
There are a number of changes expected
in the macro healthcare delivery
landscape…
Increased number of covered lives, offset by
Increasing pressure on hospital margins given potential payor mix shift (e.g., Medicaid expansion)
Declining reimbursement and DSH payments
Payments models sifting from rewarding “volume” to rewarding “value’ with centers of excellence
Increasingly costs sensitive consumer
Need to operate at “Medicare breakeven”
Consolidation into larger systems and networks
Up to 70% of hospital payments could be tied to one of 150 largest systems
Increasing alignment and employment of physicians within systems and networks
. . . As well as changes specific to heart failure management
Hospital Readmissions Reduction Program1
Tracks Heart Failure, Acute Myocardial
Infarction, Hip/Knee, COPD and
Pneumonia 30-day readmissions
Charge capped at 3% of all DRG
payments per hospital in FY2015,
Hospital Value-Based Purchasing2
Incentive payments for providing high
quality care or improving care after
including AMI and HF Mortality
Funds for program collected by base
operating DRG percent reduction of
1.0% for FY ’13; Ramps up by FY’17 to
2%1. http://www.cms.gov/Medicare/Medicare-Fee-for-Service-Payment/AcuteInpatientPPS/Readmissions-Reduction-Program.html2. http://www.cms.gov/Outreach-and-Education/Medicare-Learning-Network-
MLN/MLNProducts/downloads/Hospital_VBPurchasing_Fact_Sheet_ICN907664.pdf
15
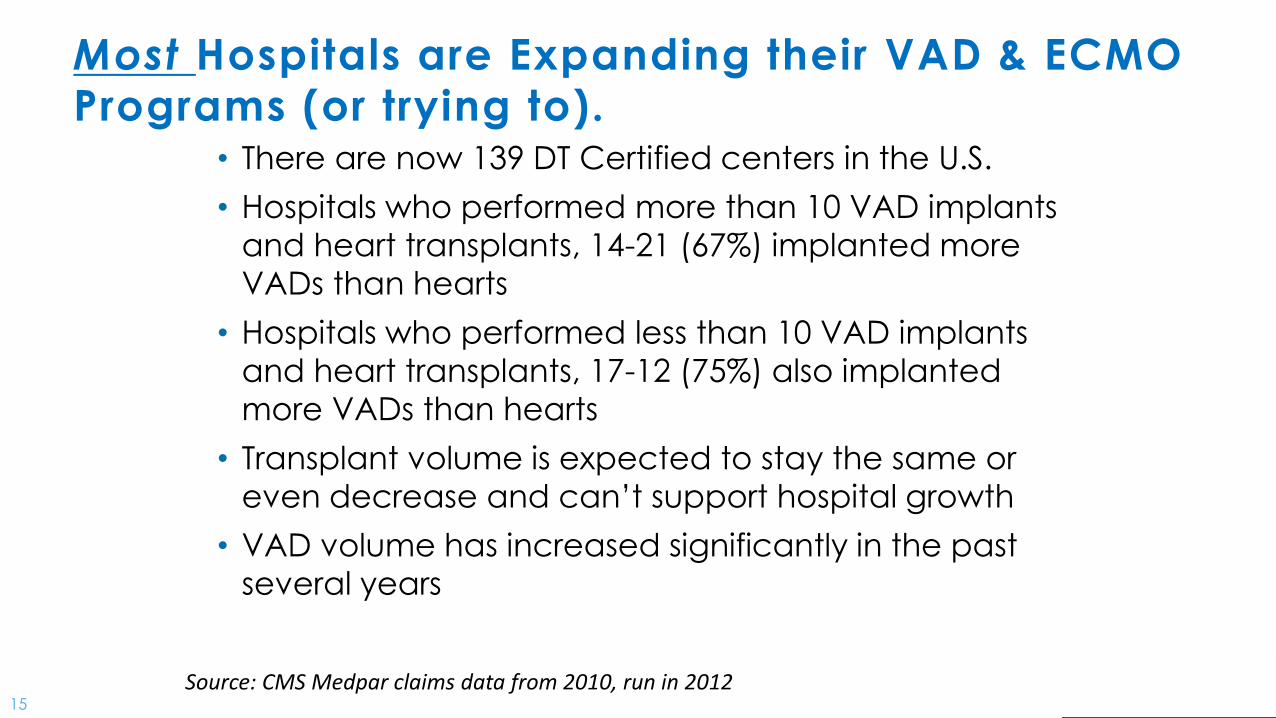
Most Hospitals are Expanding their VAD & ECMO
Programs (or trying to).• There are now 139 DT Certified centers in the U.S.
• Hospitals who performed more than 10 VAD implants
and heart transplants, 14-21 (67%) implanted more
VADs than hearts
• Hospitals who performed less than 10 VAD implants
and heart transplants, 17-12 (75%) also implanted
more VADs than hearts
• Transplant volume is expected to stay the same or
even decrease and can’t support hospital growth
• VAD volume has increased significantly in the past
several years
Source: CMS Medpar claims data from 2010, run in 2012

16
Review of Financials

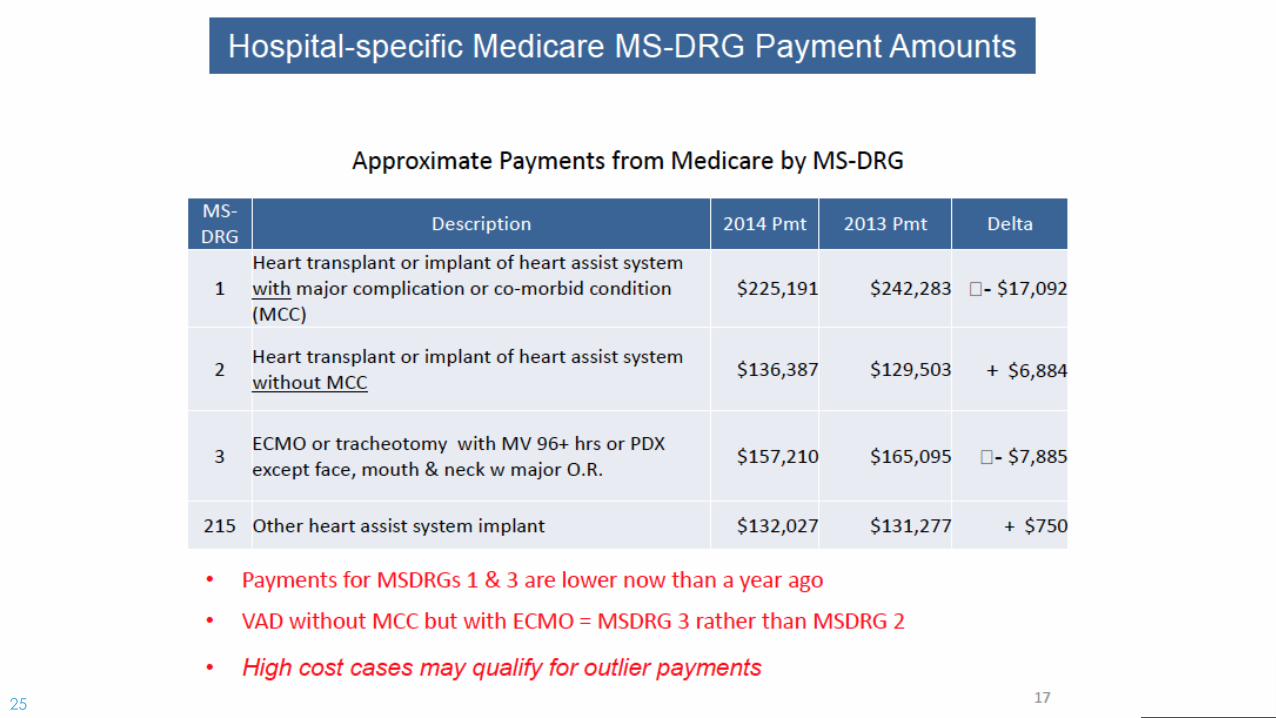
17
Payments =Cost to the other side of the money.

18
19

20

21

22

23

24
25
26

27
28
29
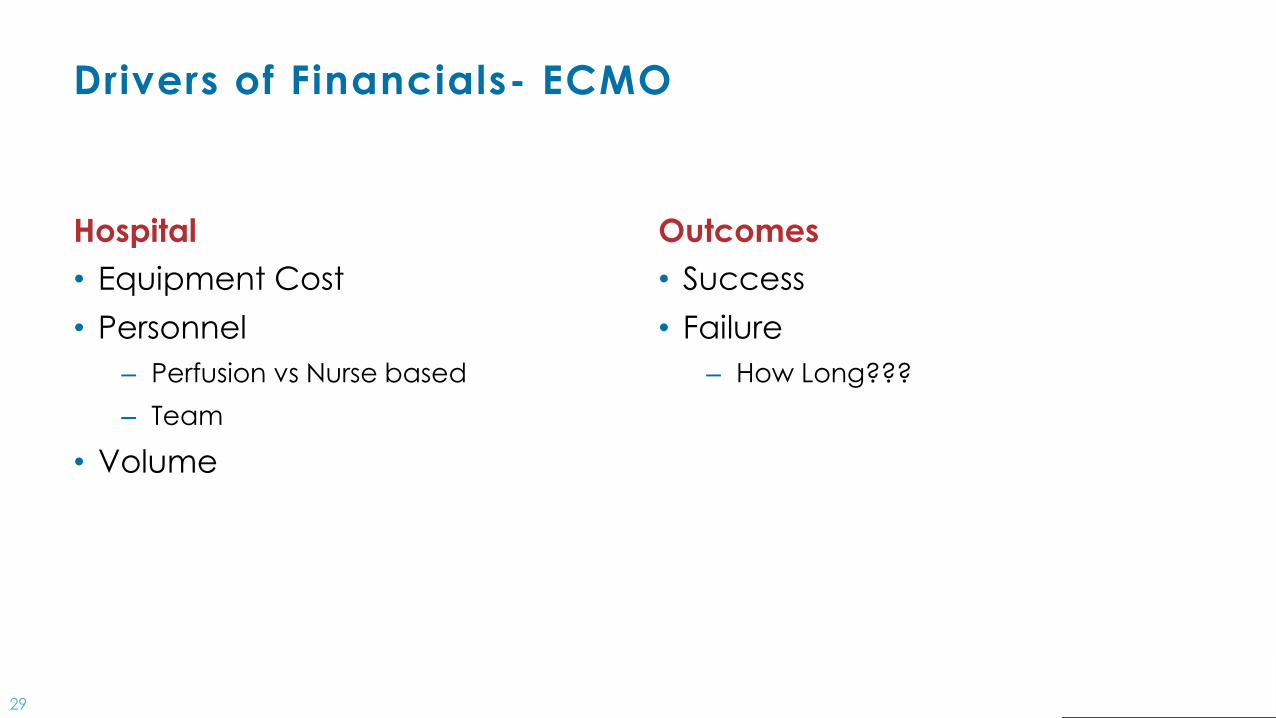
Drivers of Financials- ECMO
Hospital
• Equipment Cost
• Personnel
– Perfusion vs Nurse based
– Team
• Volume
Outcomes
• Success
• Failure
– How Long???
30
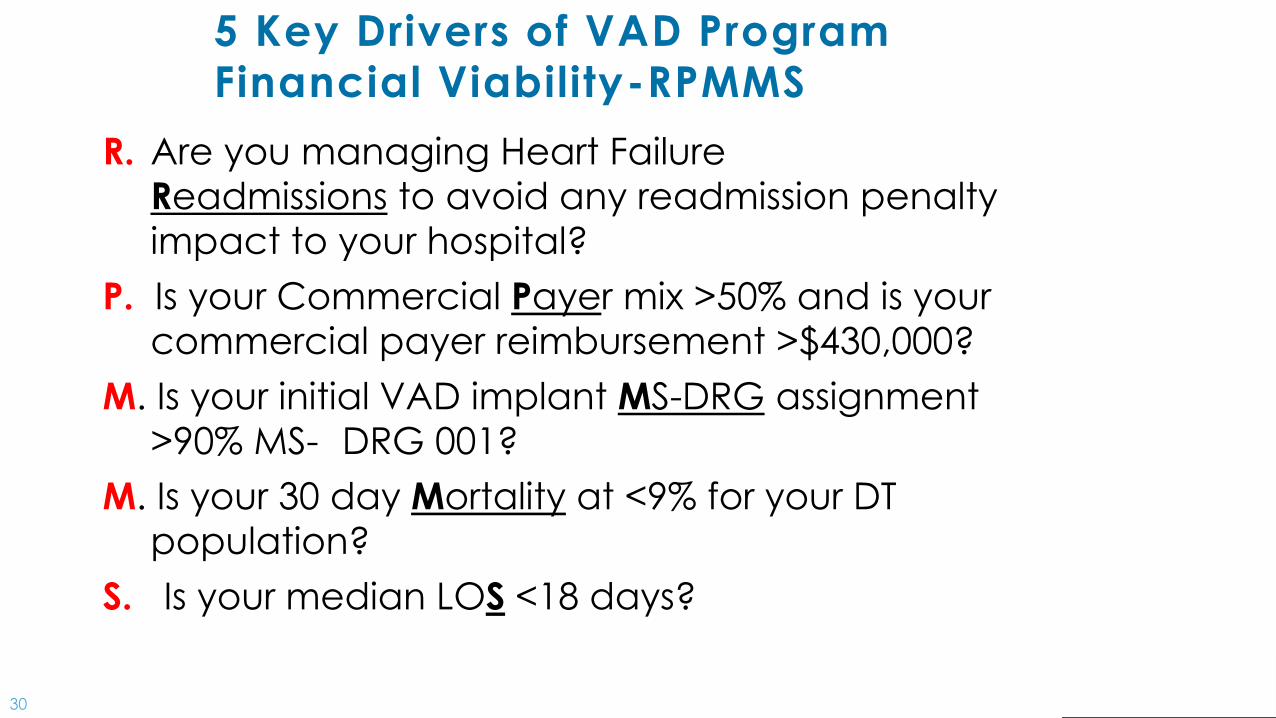
5 Key Drivers of VAD Program
Financial Viability-RPMMS
R. Are you managing Heart Failure
Readmissions to avoid any readmission penalty
impact to your hospital?
P. Is your Commercial Payer mix >50% and is your
commercial payer reimbursement >$430,000?
M. Is your initial VAD implant MS-DRG assignment
>90% MS- DRG 001?
M. Is your 30 day Mortality at <9% for your DT
population?
S. Is your median LOS <18 days?

31
#1: Is your median LOS <18 days?
The Advisory Board shows a break-even point for a
hospital with a $167k MS-DRG 1 payment at 17.5 days

32
Payor Mix is criticalIncreasing Commercial payer profit- for now.
Note: Data may not be statistically significant – applicable for trending
Tina Ivovic – Presented at the Economic Summit on VADs, October 2, 2014
33
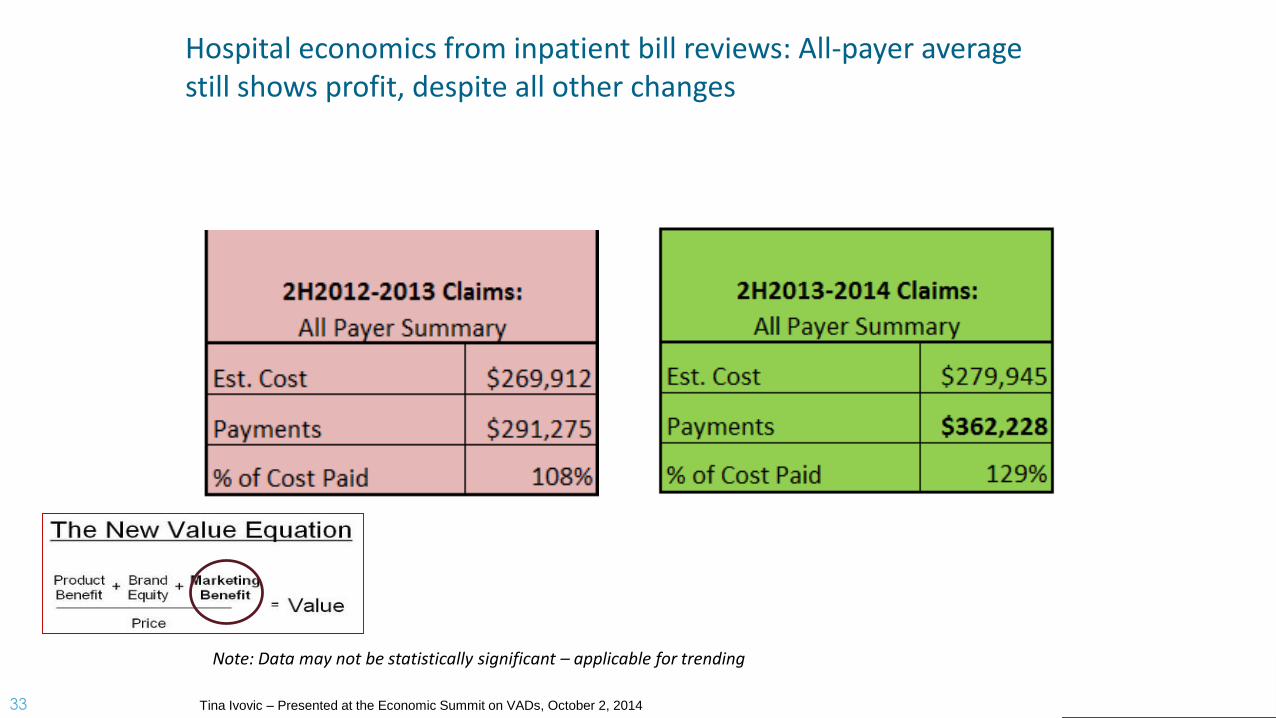
Hospital economics from inpatient bill reviews: All-payer average still shows profit, despite all other changes
Note: Data may not be statistically significant – applicable for trending
Tina Ivovic – Presented at the Economic Summit on VADs, October 2, 2014

34
Hospital Incentives
Readmission
HA Condition
VBP penalties
VBP Rewards
35
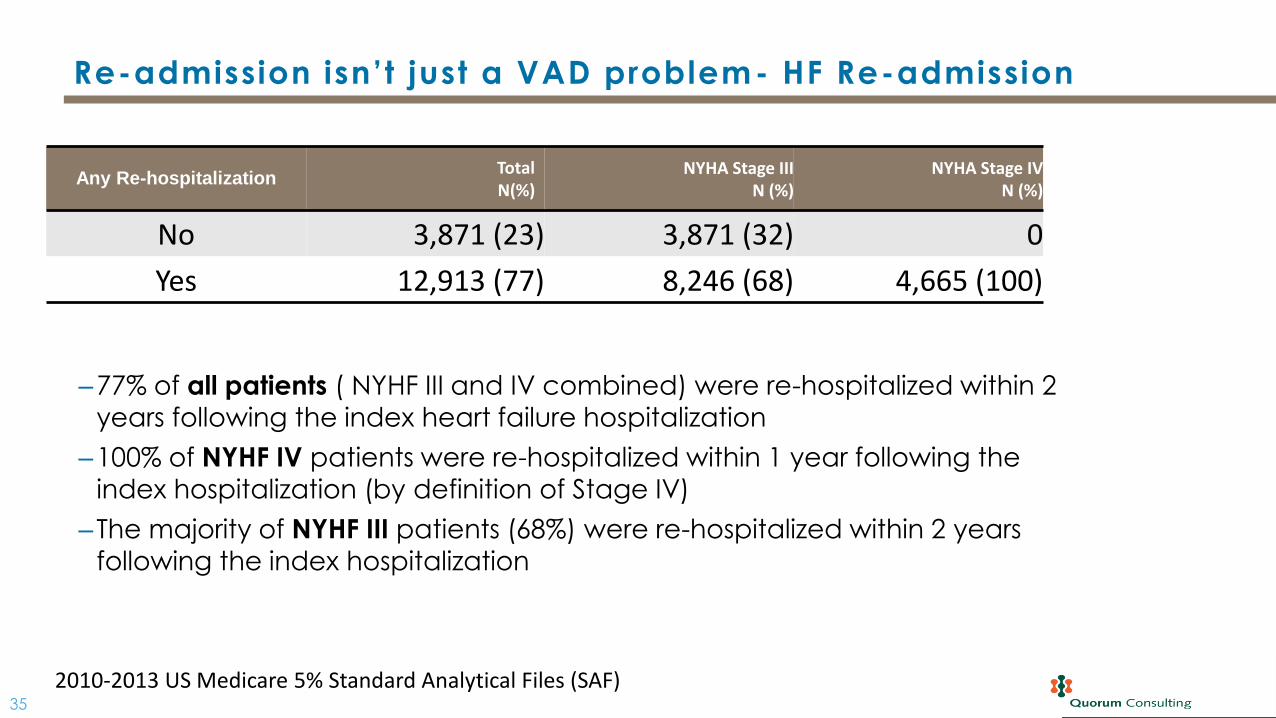
‒77% of all patients ( NYHF III and IV combined) were re-hospitalized within 2
years following the index heart failure hospitalization
‒100% of NYHF IV patients were re-hospitalized within 1 year following the
index hospitalization (by definition of Stage IV)
‒The majority of NYHF III patients (68%) were re-hospitalized within 2 years
following the index hospitalization
Re-admission isn’t just a VAD problem- HF Re-admission
Any Re-hospitalizationTotalN(%)
NYHA Stage IIIN (%)
NYHA Stage IVN (%)
No 3,871 (23) 3,871 (32) 0
Yes 12,913 (77) 8,246 (68) 4,665 (100)
2010-2013 US Medicare 5% Standard Analytical Files (SAF)

36
Value-based payments will have a significant
impact to providers’ revenue streams
Hospitals and health systems are facing 7% of their total MS-DRG based payments at risk within the next 2 years in addition to any commercial pay for performance revenues in play
FY2013 FY2014 FY2015 FY2016 FY2017
Value Based Purchasing
(At Risk)1.0% 1.25% 1.5% 1.75% 2.0%
Value Based Purchasing
(Bonus)1 0.8% 1.0% 1.2% 1.4% 1.6%
Readmission Payment
(At Risk)
1.0% 2.0% 3.0% 3.0% 3.0%
Hospital Acquired
Conditions
N/A N/A1.0% 1.0% 1.0%
Range of Impact22.8% 4.25% 6.7% 7.15% 7.60%

37
Value-based payments will have a significant
impact to providers’ revenue streams
FOR EXAMPLE: A 1,250 bed Midwest academic hospital, with $280M in Annual
Medicare Inpatient Payments has an estimated $79.8M risk/opportunity in the
5 years between 2013 and 2017 from PPACA quality related reimbursement
FY2013 FY2014 FY2015 FY2016 FY2017 5 Yr.
Value Based Purchasing (At Risk) 2.8M 3.5M 4.2M 4.9M 5.6M 21M
Value Based Purchasing (Bonus) 2.2M 2.8M 3.4M 3.9M 4.5M 16.8M
Readmission Payment (At Risk)2.8M 5.6M 8.4M 8.4M 8.4M 33.6M
Hospital Acquired ConditionsN/A N/A
2.8M 2.8M 2.8M 8.4M
Range of Impact7.8M 11.9M 18.7M 20M 21M 79.8M

38
Hospital Value Base Purchasing Program
39
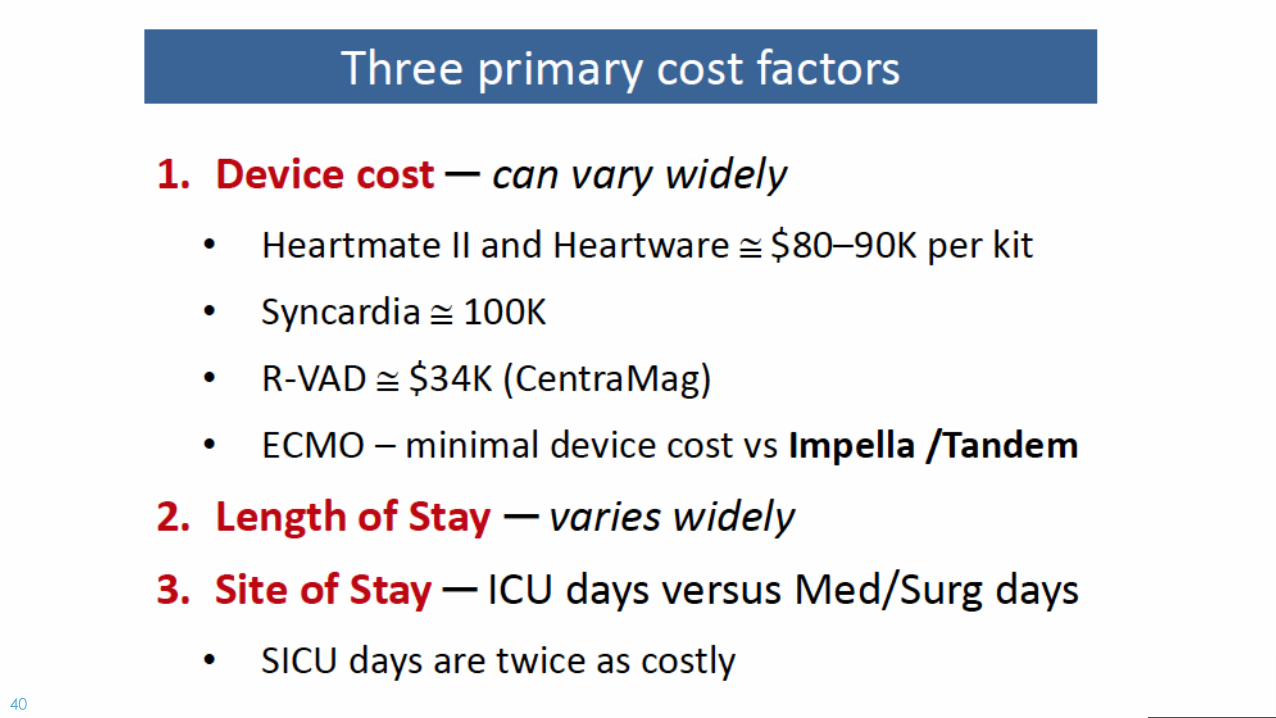
40
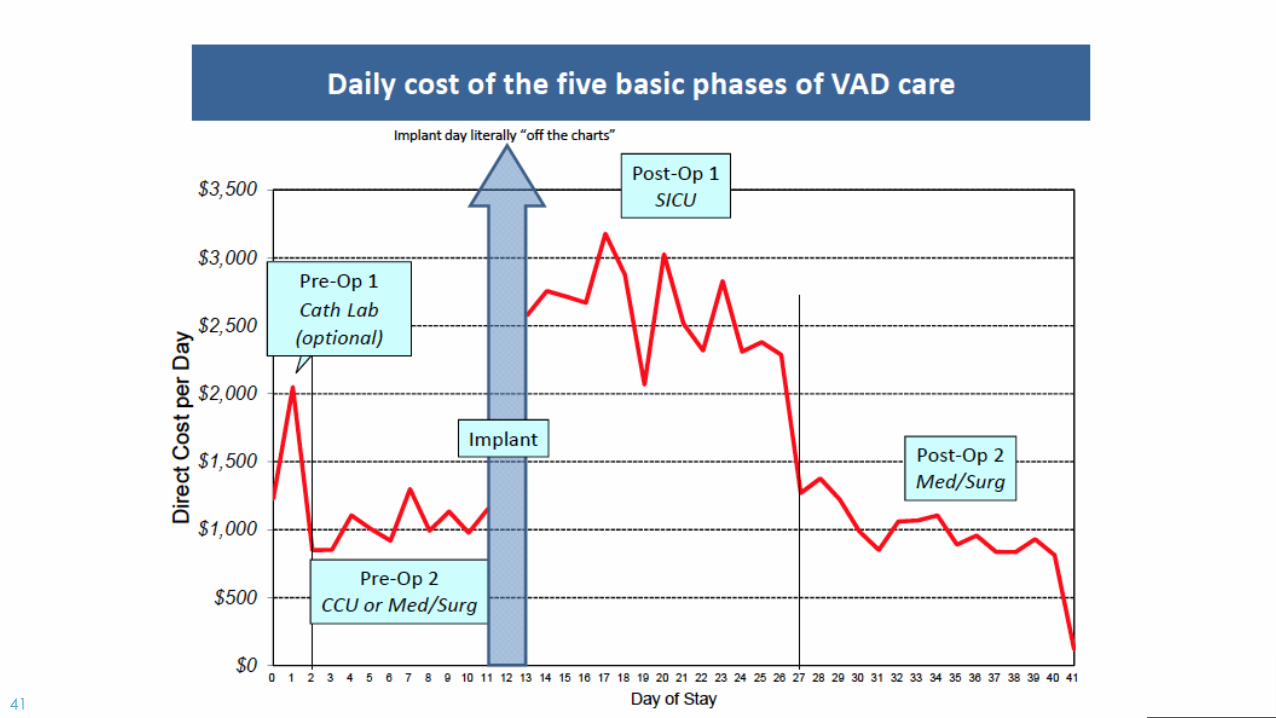
41

42
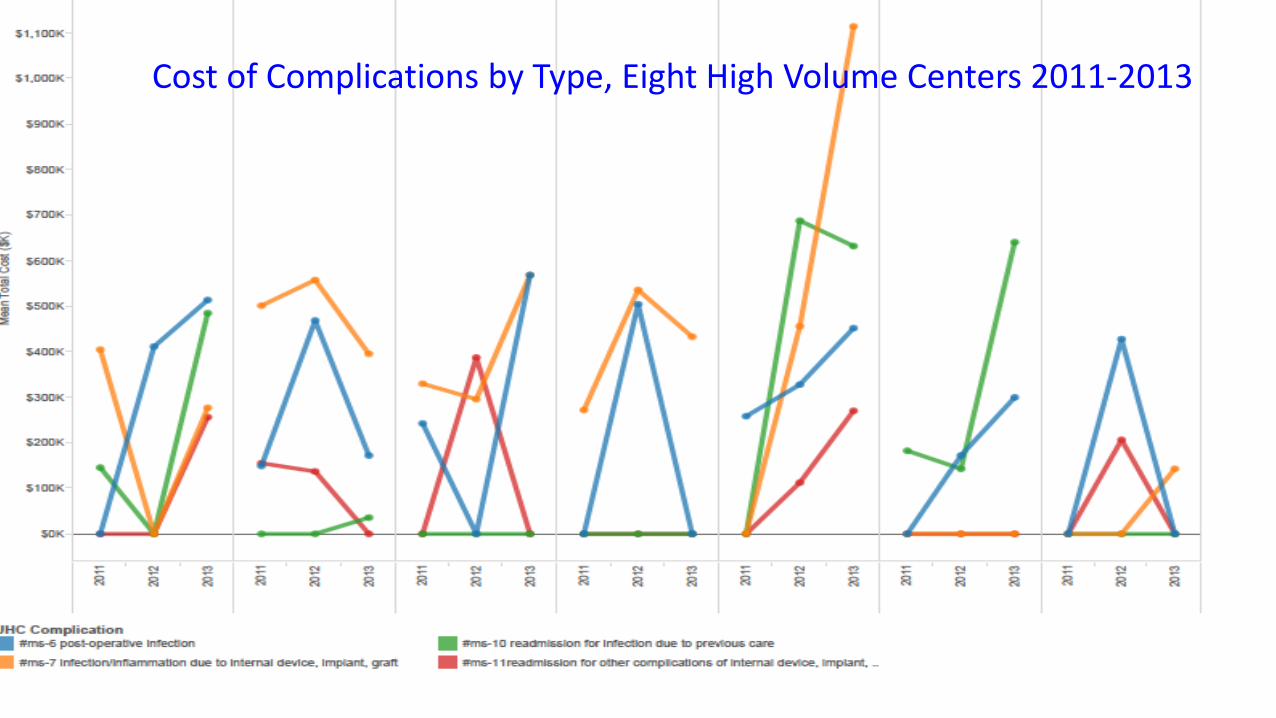
Cost of Complications by Type, Eight High Volume Centers 2011-2013
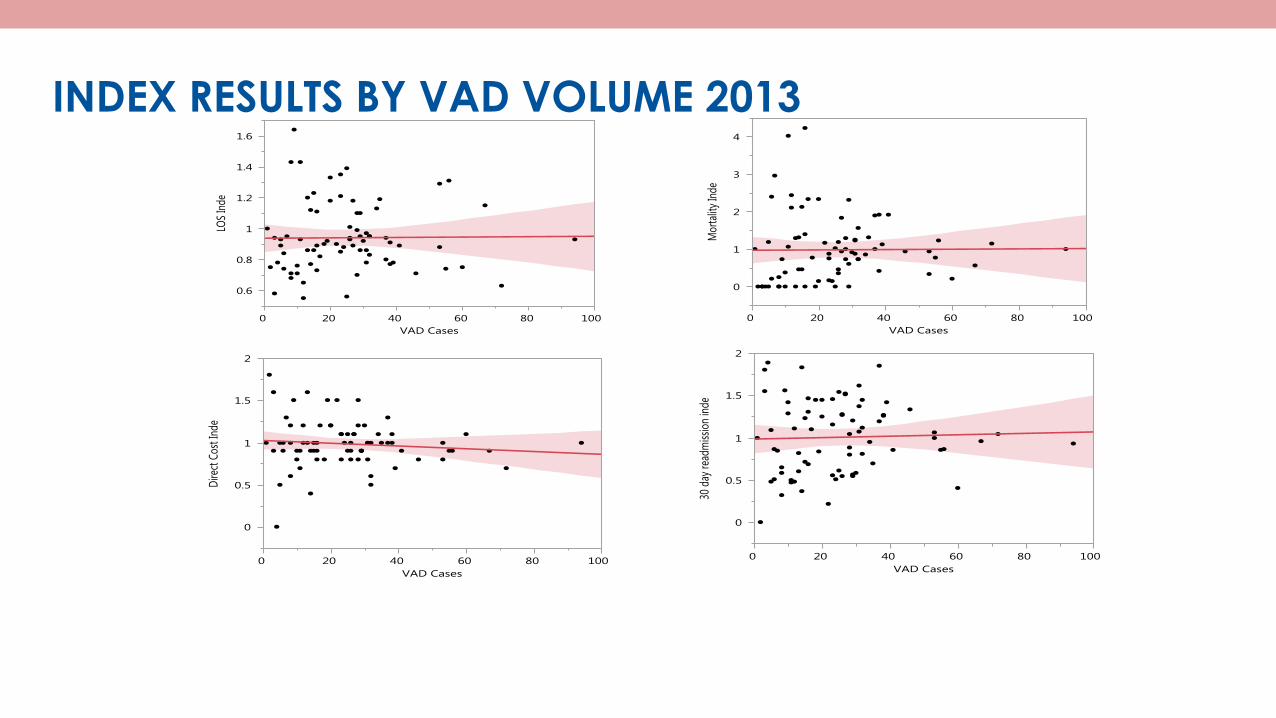
INDEX RESULTS BY VAD VOLUME 2013

45
We manage what we measure.

46

47
Thank You