the effect of micro-teaching laboratory
TRANSCRIPT

THE EFFECT OF MICRO-TEACHING LABORATORY EXPERIENCES
ON ATTITUDES AND VERBAL BEHAVIOR OF
PRE-SERV" ICE ELEMENTARY
SCHOOL TEACHERS
APPROVED:
Graduate Coramit1ee ?
Ma j o r P r of est; o r
Comraittee Member
*2-" /J
-
& ornm re tee M ember
_
Dean of the School of Eclucat5.Cn
Dean of the Graduate School

THE EFFECT OF MICRO-TEACHING LABORATORY EXPERIENCES
ON ATTITUDES AND VERBAL BEHAVIOR OF
PRE-SERVICE ELEMENTARY
SCHOOL TEACHERS
DISSERTATION
Presented to the Graduate Council of the
North Texas State University in Partial
Fulfillment of the Requirements
For the Degree of
DOCTOR OF EDUCATION
By
Rebecca L. Sparks, B. A., B. S., M. Ed.
Denton, Texas
August, 1969

TABLE OF CONTENTS
Page LIST OF TABLES v
Chapter
I. INTRODUCTION
Statement of the Problem Hypotheses Significance of the Study Definition of Terms Limitation of the Study Basic Assumptions Summary
II. REVIEW OF RELATED LITERATURE 12
Research Related to Attitudes and Attitude Change
Research Related to the Development of Micro-Teaching
The Use of the Discovery or Inquiry Approach in Teaching Science
Research Related to Interaction Analysis
Summary
III. PROCEDURES USED TO GATHER AND TREAT THE DATA 2k
Subjects Experimental Design Data Gathering Instruments Collection of Data Treatment of Data Summary
IV. STATISTICAL ANALYSIS AND DISCUSSION OF RESULTS MZ
!
Factor Analysis of the Semantic i Differential Data
Statistical Analysis of Data and <. Discussion Pertinent to Hypothesis One
4 4 4

Chapter Page
Statistical Analysis of Data and Discussion Pertinent to Hypothesis Two
Summary
V. SUMMARY, FINDINGS, CONCLUSIONS, AND RECOMMENDATIONS . . . . . . 5^
Summary Findings Conclusions Recommendations
APPENDIX 61
BIBLIOGRAPHY 7^

LIST OF TABLES
Table Page
I. Factor Representation of Scales Selected for Concept Rating . . . . . . 3^
II. Pretest and Post-Test Means and Standard Deviations for Scale Ratings of the Concept Summed Over All Subjects ^3
III. Post-Test Coefficients of Correlations Among Scale Ratings for the Concept— Teaching Elementary School Science • • • • . ^5
IV. Rotated Factor Matrix of the Scales on the Post-Test ^6
V. Pretest and Post-Test Group Attitude Mean and Standard Deviation for all Groups • . . ^7
VI. Summary of the Analysis of Covariance Contrasting Control Group II with the Experimental Group 4-9
VII. Summary of the Analysis of Covariance. Contrasting Control Group II and the Experimental G Group with Control Group I 50
VIII. Data Used to Calculate Reliability by Scott's Method . . . . . . . 51
IX. Mean Change in Indirect/Direct Ratio for the Experimental Group 52

CHAPTER I
INTRODUCTION
Science education in the elementary school is undergoing
many changes. Large sums of money have "been allocated through
the federal funding of the National Science Foundation for
research and experimentation in the field of science curricula
and methods. Leaders in science education stress the impor-
tance of concepts, generalizations, scientific methods, and
attitudes. As science and technology advance, there is a
greater demand for better science education. Today there is
a need for an adequate general orientation in science for all
students. For this to occur, it is necessary for the elemen-
tary school teacher to have positive science attitudes and a
better understanding of science concepts.
The meeting of the Association for the Education of
Teachers in Science in 196^ was devoted to the consideration
of model programs for the education of teachers in science.
The group recognized that additional research is needed in all
areas of elementary school science, especially in the area of
teacher preparation (1, 17).
New techniques have been developed to aid in the prepa-
ration of pre-service teachers. One of the techniques which
is designed to bridge the gap between college and the field

is micro-teaching. This technique is intended to help the
pre-service teacher become aware of his teaching performance
(1). Purpel (9) wrote that an important function of student
teaching is to provide a better focus for the development of
the student teacher's individual autonomous teaching style.
The pre-service elementary school teacher should be cognizant
of the teaching skills and have the ability to analyze the
way these skills are used.
Experiences appropriate for the beginner can be provided
in the micro-teaching laboratory. Lessons can be designed for
the prospective teacher to encounter situations he might not
encounter throughout a semester of student teaching. A wide
variety of subjects, methods of teaching a topic, and types
of pupils can be provided in the micro-teaching laboratory.
Also, reteaching a lesson is facilitated in this situation (8).
Statement of the Problem
The problem of this study was to determine the effect
of a micro-teaching laboratory experience on the attitudes
of pre-service elementary school teachers toward the teaching
of elementary school science and to determine the effect of a
micro-teaching laboratory experience on the indirect verbal
behavior of pre-service elementary school teachers.
The groups used to determine the effect of a micro-
teaching experience on attitudes were (1) a group of pre-service
elementary school teachers not enrolled in a science class nor
a science methods class, (2) a group of pre-service elementary
school teachers enrolled in a science methods class which was
taught in the regular manner, and (3) a group of pre-service
elementary school teachers enrolled in a science methods
course receiving a micro-teaching experience.
The attitude change of these groups toward the teaching
of elementary school science was assessed by a pretest and
post-test semantic differential technique.
The group receiving the micro-teaching experience was
used to determine the effect of this experience on indirect
verbal behavior. Prior to and after the micro-teaching ex-
perience, categories one, two, three, six, and seven of
Flanders' system of interaction analysis were used to determine
any change.
Hypotheses
The hypotheses tested in this study were as followsi
1. Pre-service elementary school teachers enrolled in
a science methods course will achieve a more favorable atti-
tude, which is statistically significant, toward the teaching
of elementary school science by participating in a micro-
teaching laboratory experience than pre-service elementary
school teachers enrolled in a traditional science methods
course. Pre-service elementary school teachers enrolled in I i
both of the science methods courses will achieve a more favor-
able attitude, which is statistically significant, toward' the

teaching of elementary school science than pre-service ele-
mentary school teachers not enrolled in a science methods
course.
2. Pre-service elementary school teachers enrolled in a
science methods course and participating in a micro-teaching
laboratory experience will show a statistically significant
increase in indirect teacher influence from onset to the end
of a micro-teaching laboratory experience.
Significance of the Study
A review of the literature revealed that one of the main
problems in science education involves the education of the
science teacher (2, 3» 5* 13$ 1^* 15)• Rosen (12) stated that
in the elementary school the problem of preparing adequate
teachers of science is staggering. In a recent study by
Lerner (6), the inadequacy of preparation was found to be one
reason for the teacher's not being desirous of teaching science
in the elementary school.
In a study reported by Washton (15)» the following was
determined through interviews with elementary school teacherst
1. Most elementary school teachers dislike science because they did not achieve high scores on tests in high school or college. They felt their elementary school teachers disliked science, and so it was contagious to dislike science. As a result, they were afraid to teach science to their pupils«
2. To promote the learning of science by elementary school teachers, it is essential that fears be minimized or removed. Self-achievement is an effective weapon against negative attitudes or fears of teaching science.
3. Elementary school teachers need confidence in handling and manipulating materials that are used in scientific experiments and demonstrations. When the teachers were given such opportunities to develop these skills in the course, they acquired confidence and improved techniques (15» p» 3^)*
Lindsey (7) felt that criticisms force teacher educators
to intensify their search for answers to questions about the
kinds of professional experiences that should be part of pre-
service education and what may be accomplished by them.
Teacher educators are concerned with the problem of describing
behavior of effective teachers. It seems entirely reasonable
to assume that if professional education programs are to be
evaluated adequately, techniques for recording descriptions
of teacher behavior and for making valid interpretation of
such records need to be developed. Kirk (^) ascertained that
verbal behavior of pre-service teachers could be determined
by careful observation.
Reynard (11) reported that professional laboratory ex-
perience seems to be the area least challenged in teacher
education. Williams, Deever, and Flynn (16) concluded from
their study that professional laboratory experiences in pro-
grams of teacher education are regarded as a singularly im-
portant area for research.
This study was proposed in order to determine the effec-
tiveness of a micro-teaching laboratory experience in changing
attitudes of pre-service elementary school teachers toward
the teaching of elementary school science and to determine

the effectiveness of the micro-teaching laboratory experience
with regard to the increase of indirect verbal "behavior of the
pre-service elementary school teachers#
Definition of Terms
Micro-teaching. as denoted in this study, is a scaled-
down teaching encounter in which the pre-service elementary
school teacher taught a selected science topic from five to
ten minutes to a group of two to five elementary school
students•
Micro-team denotes from two to four pre-service elemen-
tary school teachers who taught consecutively in a micro-
teaching session.
Micro-laboratory denotes the physical facility used in
this study for micro-teaching purposes. This facility was
especially designed for micro-teaching. (For a description
of the micro-laboratory, see Appendix B, page 65.)
Attitudes. as used in this study, denote "feelings" of
subjects toward the teaching of elementary school science.
Critique. as used in this study, denotes the previewing
of video tape by the micro-team, the professor and his assist-
ant, plus self-analysis and consideration of peers* judgments
as recorded on a specific critiquing instrument.
Student observer, as used in this study, denotes students,
in the micro-teams assigned to a certain micro-laboratory, who
were not engaged in micro-teaching. When not so engaged,

these students observed the other teams and filled out a cri-
tiquing instrument designed for evaluating a certain teaching
technique.
Verbal behavior denotes any verbal communication in the
micro-laboratory in which the teacher or pupil, or both, was
involved.
Indirect verbal behavior denotes that behavior which
maximizes the freedom of the student to respond. The words,
indirect verbal behavior and indirect teacher influence, were
used interchangeably in this study.
Observer denotes the person who recorded the verbal be-
havior of the teacher and pupils.
Flanders' System of Interaction Analysis denotes the ob-
servation method used to classify the verbal behavior of
teachers and students into categories.
Matrix, as used in this study, denotes the tool on which
the observed verbal behaviors were recorded to facilitate
understanding of the relationships among categories.
Limitation of the Study
A specific limitation of this study is that the experiment
was limited to three groups of elementary education students
enrolled at a university in the Southwest during the Spring
semester of 1969.

8
Basic Assumptions
The following assumptions were made?
1. Certain assumptions were made in order to measure
attitudes. Remmers (10) listed them as the following!, that
they vary along a linear continuum, that measurable attitudes
are common to the group, and that they are held by many people.
2. It was also assumed that the pertinent categories of
Flanders* system of interaction analysis included all of the
important verbal responses between the students and the
teacher in the micro-teaching laboratory experience.
3. This study was based on the assumption that it is
possible to practice the teaching act in parts (or segments)
with these parts ultimately being assimilated into the whole
teaching act.
Summary
Chapter I has revealed the basic plan of this study which
was to measure (1) the attitudes of pre-service elementary
school teachers toward elementary school science as assessed
by the semantic differential and (2) the increase of indirect
verbal influence of pre-service elementary teachers as assessed
by categories one, two, three, six, and seven of Flanders*
system of interaction analysis following a micro-teaching ex-
perience. Important terms have been defined, a limitation was
established, and assumptions were declared. Some readings in
current education literature revealed the need for further study
in the preparation of elementary school teacheirs in science.

9
Chapter II consists of a review of the literature re-
lated to the different facets of this study.
Chapter III contains a description of the subjects, the
experimental design, a discussion of the instruments employed,
and the method used in collecting and treating the data.
Chapter IV includes an analysis of the data and a dis-
cussion of the results.
Chapter V presents the summary, findings, conclusions,
and recommendations for further research.

CHAPTER BIBLIOGRAPHY
1. Fortune, Jim C., "Toward, a Research Strategy to Investi-gate Attributes of Teacher Behavior," The High School Journal, 51 (November, 1967)» 93-95*
2. Gibb, E. Glenadine and Dorothy C. Matala, "Study on the Use of Special Teachers of Science and Mathematics in Grades 5 and 6," Change and Innovation in Elementary School Organization, edited by Maurie Hillson, New York, Holt, Rinehart and Winston, 1965*
3. Hines, Sallylee Hughes, "A Study of Certain Factors Which Affect the Opinions of Elementary School Teachers in the Teaching of Science," unpublished doctoral dissertation, Oklahoma State University, Stillwater, Oklahoma, 1966.
Kirk, Jeffrey, "Effects of Teaching the Minnesota System of Interaction Analysis to Intermediate Grade Student Teachers," unpublished doctoral dissertation, Temple University, Philadelphia, Pennsylvania, 1964.
5. Kuslan, Louis I. and A, Harris Stone, Teaching Children Sciences An Inquiry Approach, Belmont, California, Wadsworth Publishing Company, Inc., 1968.
6. Lerner, Marjorie Sabbath, "An Investigation of the Status of the Methods Course in Elementary School Science in Selected Teacher-Training Institutes," unpublished doctoral dissertation, Northwestern University, Chicago, Illinois, 1964#
7. Lindsey, Margaret, Leslie Mauth, and Edith Grotberg, Improving Laboratory Experiences in Teachers * Education, New York, Bureau of Publications, Teachers College, Columbia University, 1959*
8. Lowrey, William C., "Some Innovations in the Professional Preparation of Teachers," Arithmetic Teacher. 15 (December, 1968), 727-73^.
9* Purpel, David E., "Student Teaching," The Journal of Teacher Education. XVIII (Spring, 1967)» 20-23.
10. Remmers, H. H., Introduction to Opinion and Attitude Measurement. New York, Harper and Brothers, 195^*
i n

11
11. Reynard, Harold E., "Pre-Service and In-Service Education of Teachers," Review of Educational Research, XXXIII (October, 19&3)» 369-380.
12. Rosen, Sidney, "Innovations in Teaching Science—-A Historical View," School Science and Mathematics, LXIII (April, 1963), 313-323.
13. Soy, Eloise Mariane, "Attitudes of Prospective Elementary Teachers Toward Science as a Field of Specialty," School Science and Mathematicst LXIII (June, 19o7)» 507-517.
1^. Victor, Edward, "Why Are Our Elementary School Teachers Reluctant to Teach Science?" Science Education. 4-6 (March, 1962), 185-192.
15. Washton, Nathan S., "Improving Elementary Teacher Education in Science," Science Education, 5 (February, 1961), 33-3^.
16. Williams, Chester S., R. Merwin Deever, and Edward B. Flynn, Jr., "Professional Laboratory Experiences in Oklahoma," The Journal of Teacher Education. VXI (December, I9^oTT W - 5 0 5 .
17. Winter, Stephen S., "Model Programs for the Education of Teachers in Science," Journal of Research in Science Teaching. 3 (1965)# 99-1037

CHAPTER II
REVIEW OF RELATED LITERATURE
This review of related literature is concerned with the
following areasi
1. Research related to attitudes and attitude change
2. Research related to the development of micro-
teaching
3. The use of the discovery or inquiry approach in
teaching science
k. Research related to interaction analysis.
Research Related to Attitudes and Attitude Change
Enthusiasm for science does not come from a person who
feels inadequate. As Hott and Sonstegard stated, "... . effec-
tive teaching must acknowledge matters other than the mental
process of learning and the subject matter to he taught."
(26, p. 3^8) Others concur with their opinion (20, 21, 22).
Hoffman (25)» in summarizing research concerning the
classroom, reported that teacher behavior has been shown to
be enormously potent—affecting the socio-emotional climate
of the classroom, the status relationships among the children,
individual behaviors, moral orientations, and intellectual
performance. He further stated that the elementary school
12

13
teacher influences not only the target of her action but the
witnesses as well. In regard to teacher behavior, Baumel (10)
felt that success in developing scientific attitudes depends
ultimately on the teacher and that the teacher through his
actions must be able to convince the students that scientific
attitudes are an integral part of his behavior.
Travers stated that education is commonly based on the
assumption that attitudes can be changed by communications (38).
According to Blanc (12), science educators have long rec-
ognized that scientific attitudes are among the most important
outcomes which should result from science teaching. Levine
and Murphy (30) found in their study that learning was affected
by attitudes held. Building positive attitudes is well rec-
ognized as being a major objective of science teaching (9, 14,
23). The Fifty-Ninth Yearbook of the National Society for the
Study of Education stated that much experimentation has been
carried on in the field of measuring attitudes and opinions.
Literally thousands of articles and many books have been
written on the subject. Most of the literature deals with
the measurement of attitudes on social questions. Science
teachers are aware of the need of some valid and reliable
test of scientific attitudes (24).
Washton (40) reported that, although some educators have
recognized scientific attitudes as the by-products of con-
comitant forms of learning, there has been a growing tendency
to view these attitudes as equal to, or superior to, the

14
knowledge of objectives of science instruction. Neidt and
Hedlund (33) and Zim (41), in their writings, also stressed
the importance of attitudes. Sweatman identified the com-
plexity of the problem when he said, "» . .it takes a strong
effort to change the behavior and attitudes of any individual."
(37* P* 68) A study conducted by Flanders (17) showed that
students whose teachers used more indirect influence in the
classroom perceived the total classroom in a more favorable
light as measured by attitudes than those students whose
teachers used more direct influence in the classroom.
Osgood wrote that most authorities are agreed that atti-
tudes are learned and.implicit—they are inferred states of
the organism that are presumably acquired in much the same
manner that other such internal learned activity is acquired.
Further, they are predispositions to respond but are distin-
guished from other such states of readiness in that they
predispose toward an evaluative response (3*0*
Research Related to the Development of Micro-Teaching
There has been much research done on micro-teaching since
it was introduced at Stanford University in 19&3• majority
of studies have been done at the secondary level (2, 3, 4, 8,
11, 14, 16, 18, 19, 27, 31* 32, 36), Wayne State University,
Colorado State University, University of Michigan, and Brighaia
Young University have incorporated the micro-teaching technique
into their teacher education programs (14). Experiments with
15
micro-teaching performance and performance in a full sized
classroom have demonstrated that a high correlation exists
between the two (1). Results of research where micro-teaching
was introduced experimentally seemed to indicate that students
trained under those conditions performed more effectively than
those trained under traditional conditions. By teaching,
observing, and reteaching, trainees made significant changes
in their teaching techniques (19)*
Through micro-teaching, the pre-service elementary school
teacher becomes aware of the acts he will perform and acquires
the ability to analyze these acts, thus enabling him to per-
form them in a better way. Successful teaching viewed on
video tape has a desirable influence on the development of a
positive self-concept (8).
Some micro-teaching studies have shown (1) that self
feedback is not highly effective in behavior change with pre-
service teachers; (2) that the supervisor's pointing out
salient cues in teaching and positive reinforcement during
the video playback proved a most effective training method|
and (3) that perceptual modeling excels over symbolic
modeling (27).
The Use of the Discovery or Inquiry Approach in Teaching Science
One of the newest approaches in science teaching is |
called the discovery or inquiry approach. This approach jis
modeled after the investigative processes of scientists. It

16
is a strategy for learning that science educators believe to
be particularly appropriate from both a psychological and a
scientific point of view (29).
The discovery method as used in science teaching gives
the children a chance to discover the true structure of the
discipline. After the problem of the science lesson has been
identified and the materials gathered, the children are the
ones to carry on the investigation (25). The teacher then
becomes the leader who listens to, observes, and offers
leadership to the children.
The above mentioned desirable teacher functions for the
discovery method of teaching science coincide with those des-
ignated as lending themselves toward indirect teacher influence
as gauged by certain categories in Flanders' system of inter-
action analysis. In his description of the teacher—leader in
science, Karplus stated the following: ". . .in general,
encouraging the children to probe further and think about the
observations made and . . . encouraging the children to ex-
periment and to find answers to their questions," which is
synonymous with category three; " . . . employs questions as
a means to open new possibilities, enlarging upon discussed
ideas . . . ," which is synonymous with category four? and
"• • • praises the children when they are successful, knowing
this gives them increased confidence in their ability to jihink
and strength to be independent," which is synonymous with |
category two (28, p. 93).

17
The success of the discovery method of teaching science
may well be influenced "by teacher-pupil verbal interaction (or
classroom talk). Many educators recognize the importance of
talk in teaching, and many consider teaching to be an inter-
active process (5). Flanders* system of interaction analysis
takes into account each interaction in the classroom and
appears to be the appropriate way to measure the increase of
teacher indirect influence which is deemed necessary for suc-
cessful teaching of the discovery method of science in the
elementary grades•
Research Related to Interaction Analysis
Since most of the newer science curricula stress inquiry
into natural phenomena rather than the mere acquisition of the
findings of others through lecture and drill, the calculation
of the indirect-direct ratio becomes particularly important
since it assists one in determining the relationship between
what is learned and the learner's degree of freedom to decide
on a course of action. It is generally felt that direct in-
fluence tends to restrict the student's freedom of action,
while indirect influence tends to expand freedom of action
(15).
In Flanders* study (16), it was found that an indirect
approach stimulates verbal participation by students and dis-
closes to the teacher students' perceptions of the situation#
Such an approach not only provides the teacher with more '

18
information about studentsf understanding of a particular
problem but also often encourages students to develop more
responsibility for diagnosing their difficulties and for sug-
gesting a plan of action. It was also found that the major
difference between the teachers whose students learned the
most and those whose students learned the least is illustrated
by actions classified as indirect. The student-response elic-
ited from the indirect approach used by the teachers in
Flanders' study (16) are the responses desired in the dis-
covery method of teaching science in the elementary school.
The Flanders system of interaction analysis was developed
and refined by Flanders in the early 1950*s. The first re-
search related children's attitudes to patterns of teacher
behavior. Results of the research indicated that pupils of
teachers who were observed to be indirect had more positive
attitudes toward the school, the teachers, and other pupils
than did the pupils of those teachers who were identified by
observers as direct (7, 39) •
Researchers using interaction analysis have found (1)
that observers using the system perceived teacher influence
in essentially the same way as did the pupils of teachers under
observations (2) that dependent-prone eighth grade students
who were taught geometry by indirect teaching methods learned 1
more than dependent-prone children taught by direct meansji
and (3) that in a study of junior high teachers results in-|
dicated that all types of students learned more working with

19
teachers using a more indirect teaching style than with
teachers using a more direct teaching style (6).
Summary
The review of related literature was organized into the
following four categories! (1) the possibility of attitude
change, (2) the practicality of using micro-teaching in pre-
service teacher education, (3) the reasons for using the
discovery or inquiry approach in teaching science, and (4)
the feasibility of applying Flanders* system of interation
analysis to measure the indirect-direct ratio of pre-service
teacher influence.

CHAPTER BIBLIOGRAPHY
1. Allen, Dwight W., "A New Design for Teacher Education^ The Teacher Interne Program at Stanford University, The Journal of Teacher Education, 17 (Fall, 1966), 2f5-300.
2 . and Richard J. Clark, Jr., "Micro-Teaching t Its Rationale," The High School Journal, 51 (November, 1967), 75-79•
3. and Richard E. Gross, "Micro-Teaching— A New Beginning for Beginners," NEA Journal, 55 (December, 1965), 25-26.
h,. , Fred J. McDonald, and Michael E. J. Orme, "Effects of Feedback and Practice Conditions on the Acquisition of a Teaching Strategy," ERIC ED 013 79^. 1967.
5. Amidon, Edmund J., Improving Teaching, the Analysis of Classroom Verbal Interation, New York, Holt, Rinehart, and Winston, Inc., 1966.
6. and Ned A. Flanders, The Role of the Teacher in the Classroom, Association for Productive Teaching, Inc., Minneapolis, Minnesota, 1967*
7. . Kathleen M. Kies, and Anthony T. Pal is i., "Group Supervisions A Technique for Improving Teaching Behavior," The National Elementary Principal, XLV (April, 1966), 55^58.
8. Baird, J. Hugh and others, "Micro-Teaching at Brigham Young University," ERIC ED Oil 260, 1967.
9. Banks, William Henry, "Practices inthe Preparation of Elementary Teacher for the Teaching of Science," unpublished doctoral dissertation, The Ohio State University, Columbus, Ohio, 1965*
10. Baumel, Howard B. and J. Joel Berger, "An Attempt to Measure Scientific Attitudes," Science Education, k9 (April, 1965)t 267-269.
11. Belt, W. DeWayne, "Micro-Teaching—Observed and Critiqued by a Group of Trainees," ERIC ED Oil 890, 1967.
20

21
12, Blanc, Sam S«, "Review of General Goals in Science Teaching," cited in Baumel and Berger, Science Education, 49 (April, 19^5)» 267-269.
13# Charen, George, "Laboratory Methods Build Attitudes," Science Education, 50 (February, 1 9 6 6 ) , 5^-64.
14. Cooke, Fred S. and Daniel P. Brown, "Does Micro-Teaching Have a Place in Business?" Business Education World, 48 (April, 1968), 7-9.
15. Cunningham, John D., "Interaction Analysis: A Useful Technique for Research and Science Supervision," Science Education, 51 (February, 1967) , 27-32,
16. Eggers, Jerry R., "Videotape Micro-Teaching in I-A Teacher Education," School Shop, 47 (April, 1 9 6 8 ) , 96-97.
17• Flanders, Ned A., "Teacher Influence, Pupil Attitudes, and Achievement," Cooperative Research Monograph No. 12, United States Department of Health, Education, and Welfare, Office of Education, United States Government Printing Office, Washington, 1965*
18, Fortune, Jim C., "Toward a Research Strategy to Investi-gate Attributes of Teacher Behavior," The High School Journal, §1 (November, 1967)» 93-95.
19* Foster, F, Gordon, "Micro-Teaching," Arizona Teacher, 55 (May, 1967) , 12-13.
20. Fricke, B. G., "Prediction, Selection, Mortality, and Quality Control," College and University, 56 (1956), 34-52,
21, Garrett, H. F., "A Review and Interpretation of Investi-gations of Factors Related to Scholastic Success in Colleges of Arts and Sciences and Teachers Colleges," Journal of Experimental Education. 18 (1949), 91-138.
22, Garverick, C. M., "Retention of School Learning as Influenced by Selective Affective Tone Variables," Journal of Educational Psychiatry, 55 (1964), 31~34.
23. Hardin, Henry Normal, "An Analysis of Selected Aspects of the Science Preparation of Prospective Elementary Teachers at the University of Miami," unpublished doctoral dissertation, University of Miami, Miami;, Florida, 1965.

22
24-, Henry, Nelson B., editor, Rethinking Science, Fifty-Ninth Yearbook of the National Society for the Study of Education, Part I, Chicago, Illinois, The University of Chicago Press, 19o0.
25 . Hoffman, Martin Leon, Review of Child Development Research, Vol# II, New York, Russell Sage Foundation, —
26. Hott, Leland and Manford Sonstegard, "Relating Self-Conception to Curriculum Development," Journal of Educational Research. 58 (April, 1965)»3^8-351*
27. Kallenback, Warren, "Microteaching as a Teaching Methodology," ERIC ED 013 791, 1968.
28. Karplus, Robert and Herbert D. Thier, A New Look at Elementary School Science, Chicago, Rand, McNally and Company, 1967#
29. Kuslan, Louis I. and A, Harris Stone, Teaching Children Science: An Inquiry Approach, Belmont, California, Wadsworth Publishing Company, Inc., 19o8,
30. Levine, Jerome M. and Gardner Murphy, "The Learning and Forgetting of Controversial Material," Journal of Abnormal and Social Psychology. 38 (October, 19^3)» 507-51?.
31• Mayhugh, Samuel L., "Micro-Teaching—A Major Component of the Pre-Service Program," Contemporary Education. 39 (March, 1968) , 206-210.
32. Meier, John H., "Rationale for and Application of Micro-Training to Improve Teaching," The Journal of Teacher Education, XIX (Summer, 1968) , 155-157*
33. Neidt, Charles 0. and Dalva E. Hedlund, "The Relationship between Changes in Attitude Toward a Course and Final Achievement," Journal of Educational Research. 6l (October, 1967) . 56-58.
3^. Osgood, Charles E., George J. Suci, and Percy H. Tannenbaum, The Measurement of Meaning, Urbana, Illinois, University of Illinois Press, 1957•
35* Renner, John Wilson, Teaching Science in the Elementary School, New York, Harper and Row, 1958.

23
36. Schaefer, Martin and Marian H. Stromquist, "Micro-Teaching at Eastern Illinois University," Audiovisual Instruction, 12 (December, 1967), 61-64.
37. Sweatman, Charles, "Operation: New Outlook of a Self-Assessment Method for Helping Teachers Change Their Behavior," The Clearing House, XLI (October, 1966), 67-73.
38. Travers, Robert M. W., Essentials of Learning, New York, Macmillan Company, 1964.
39« Waetjen, Walter B., "Recent Analyses of Teaching," The Bulletin of the National Association of Secondary School Principals. 50 (December. 1966TT 17-29.
40. Washton, Nathan S., "Improving Elementary Teacher Education in Science," Science Education. 45 (February, 1961), 33-34.
41. Zim, Herbert S,, Science for Child and Teacher, Washington, D. C., Association for Childhood International, 1953*
CHAPTER III
PROCEDURES USED TO GATHER AND TREAT THE DATA
The purpose of this chapter is (1) to describe the sub-
jects participating in this study, (2) to point out the ex-
perimental design used, (3) to explain and substantiate the
choice of instruments, (k) to present the methods of collecting
data, and (5) to specify the statistical treatment given the
data.
Subjects
The subjects for this study included one group of pre-
service elementary school teachers enrolled in an elementary
education curriculum course at a university in the Southwest
during the Spring semester of 1969* This group was designated
as control group I. The remaining subjects were composed of
three classes of elementary education majors enrolled in a
science methods course in the same university during the same
period. Two of these classes were designated control group
II, and the remaining class was designated the experimental
group.
The subjects used in this study were students of junior
or senior classification who were accepted in the elementary
education program at the university.
24
25
Experimental Design
The basic design of this study was the nonequivalent
group design (4), Intact science methods classes were arbi-
trarily assigned to the experimental group and control group
II. The group taking an elementary education course, but not
enrolled in a science methods course, was designated group I.
The science methods course consisted of an hour lecture
three days a week and a two-hour laboratory session once a
week. The lectures were given on Monday, Wednesday, and
Friday mornings at 9*00, 10s00, and lis00 o'clock. Students
from control group II and the experimental group were allowed
to choose any one laboratory session. These sessions were
held in the afternoons, Monday through Friday.
Two science methods lecture classes, designated as con-
trol group II, were taught in the regular manner by the pro-
fessor and his assistant. For an outline of this course, see
page 70 in Appendix B.
Students in control group I who were enrolled in a science
or science methods course were not included in the instruc-
tional aspects of this study.
One science methods lecture class was assigned to the
experimental group. This class received the micro-teaching
laboratory treatment. This treatment was given over an eight-
week period. The micro-teaching model consisted of !
1. Plan.—During this period the pre-service teachers
organized themselves into micro-teams and planned their

26
micro-lesson. The professor and his assistant supervised
and assisted the students.
2* Instruction in specified teaching skill.—At this
time instructions were given, based upon the skills desired
for a successful micro-teaching experience in the micro-
laboratory. Also, instructions for the use of the critiquing
instrument were presented. The critiquing instruments for
this study were based upon the evaluation techniques for
micro-teaching as used by Stanford University. They were
adapted to the needs of this study by the researcher. A copy
of these instruments may be found in Appendix B, pages 68 and
69# Techniques for obtaining teacher-pupil interaction were
presented. Special emphasis was given to the techniques de-
scribed in Flanders* categories for interaction analysis which
foster indirect teaching behavior.
3» Teach.—The micro-team taught the micro-lesson in
the micro-laboratory. The micro-team was made up of from two
to four pre-service elementary school teachers. The five- to
ten-minute encounter was with from two to five children from
the elementary school grades. The students observing the
presentation completed the critiquing instrument on each of
the micro-team participants immediately following the micro-
lessoni Each session was video taped.
Critique.—The video tape was replayed for each
micro-team. Using the critiquing instrument results and self-
analysis, the professor and his assistant helped the students

27
evaluate their teaching session. After the critique, the
students prepared for the reteach session.
5* Reteach.—The micro-team taught the same five- to
ten-minute lesson to a different group of two to five ele-
mentary school children in order to improve their teaching
technique. The session was video taped. The student observ-
ers completed the critiquing instrument on each micro-teacher
immediately following the micro-lesson.
6* Critique.—The second video tape was replayed for
each micro-team. Using the results from the critiquing in-
strument and self-analysis, the professor and his assistant
helped the students evaluate their reteach session.
For a day by day schedule of the micro-laboratory treat-
ment, see page 66 in Appendix B.
The plan and the critique parts of the micro-teaching
treatment were conducted by the professor and his assistnat.
There were two micro-laboratories in which sessions were video
taped at the same time during the teach and reteach parts of
the micro-treatment. The professor of the science methods
courses supervised one laboratory while the assistant super-
vised the second laboratory. These micro-laboratories were
located in two different classrooms. No critiquing was done
during the taping session.
The lectures for all three science methods classes were
given by the same professor and his assistant. The science
laboratory sessions for all participating subjects of the

28
experimental group were taught "by the assistant. The pre-
and post-tests for all groups were given by the professor
or his assistant. Approximately three months elapsed between
the pre- and post-test administrations.
Prior to and following the micro-teaching treatment, each
student in the experimental group taught a ten- to twelve-
minute lesson in the micro-laboratory to from two to five
elementary school students. Each pre-service elementary school
teacher taught the same lesson to different students. These
sessions were video taped. Two observers who were trained in
recording verbal behavior served as observers for each pre-
service elementary school teacher during a video tape replay
to determine the effect of the micro-teaching laboratory
treatment upon indirect verbal behavior.
Most lessons used in micro-teaching in this study were
selected from American Association for the Advancement of
Science teaching materials. The indirect/direct ratio of
teacher influence as determined in this study took into account
categories one, two, three, six, and seven of Flander's cate-
gories for interaction analysis. With this technique, the
indirect/direct ratio is considered to be less influenced by
the nature of the content being taught (6).

29
Data Gathering Instruments
Semantic Differential
Osgood's semantic differential was used to measure sub-
jects* attitudes toward the teaching of elementary school
science. Osgood states that the semantic differential is
not a test but is a technique of measurement (11).
To quote Osgood,
^The^semantic differential is essentially a combination of controlled association and scaling procedures. The subject is provided with a concept to be differentiated and a set of bipolar adjecti-val scales against which to do it, his only task being to indicate for each item (pairing of a con-cept with a scale), the direction of an association and its intensity on a seven-step scale (11, p. 20).
The semantic differential is a method of observing and
measuring the psychological meaning of things, usually concepts,
Osgood developed the semantic differential to measure the con-
notative meanings of concepts as points in what has been
called "semantic space,"
Kerlinger (8) illustrates the notion of semantic space
with this example. In the room where one is sitting, assume
there are three sticks at right angles to each other, meeting
in the center of the room, and touching the walls, floor, and
the ceiling. Label these sticks X, Y, and Z and call them
axes or coordinates. Now imagine there are points scattered
throughout the three-dimensional space with some of the points
in any order with small letterst a, b, . . , n. If the axes
have been marked off in an equal-interval system, then any

30
point in the space can "be unambiguously identified or "defined"
"by using the numbers on the three axes. If, through research,
some general "meaning" for the axes X, Y, and Z has been de-
termined, then the "meaning" of each point would be the com-
bination of the meanings of X, Y, and Z.
The semantic differential was designed to be a general
measurement instrument that can be used in a wide variety of
research problems.
Application of the semantic differential to empirical re-
search in mass communication was well exemplified in the work
of Tannenbaum, Greenberg, and Silverman (1962), who studied
images of Kennedy and Nixon in the i960 presidential debate,
and by Kraus and Smith (1962), who investigated semantic re-
actions to both the candidates and the issues that they treated
in the debates. Other typical applications of semantic differ-
entiation to communication research have been reported by
Evans, Wieland, and Moore (I96I), as well as Kerrick and
McMillan (1961), who studied attitude variables, and in studies
by Kjeldergaard (1961) and Williams (1963), who investigated
semantic reaction to broadcasters (5)*
Staats and Staats* (13) attitude-conditioning study
showed the semantic differential to be a fairly sensitive
measure of attitude change.
Even though this instrument is considered experimental#
Moss states that, "the results of the studies do testify to
the fact that the semantic differential is measuring 'something*

31
consistently and in meaningful fashion, and that in this
respect, it is already a useful instrument,," (10, p. 53)«
Kerlinger (8) reports that educators have made little
use of the semantic differential, while psychologists have
been enthusiastic in the use of the instrument.
Anatasi writes that "the semantic differential repre-
sents a standardized and quantified procedure for measuring
the connotations of any given concept for the individual "
(3 > p• 626)«
From the Bopp and Osgood studies, the following was con-
cluded by Osgoods
The average errors of measurement of the semantic differential scales are always less than a single scale unit (approximately three-quarters of a scale unit) and for evaluative scales about a half of a scale unit. This means that we can expect subjects, on the average, to be accurate within a single unit of the scale, which for practical purposes is satisfactory.
A chance of greater than two units on the average scale by the average subject would be ex-pected to occur less than five per cent of the time by change (or as a result of random errors of measurement) (11, pp. 131-132).
With attitude measurement test-retest, reliability has
been obtained by Tannenbaum. Each of six concepts was judged
against six evaluative scales on two occasions, separated by
six weeks. The test-retest coefficients ranged from .87 to
.93. with a mean r (computed by z-transformation) of .91 (18).
Osgood and Tannenbaum (19) report that in available data the
reliability of the semantic differential as an attitude meas-
urement runs in the .80*s and .90's.
32
Face validity has had to be used to ascertain the valid-
ity of the semantic differential as there is no independent
criterion available# Osgood (11) defines "face validity" as
the extent that the distinctions a measurement provides cor-
responds with those which would be made by most observers
without the aid of the instrument. A study of the effects
of mixing or combining words (a set of eight adjectives) was
differentiated by two hundred subjects, and mean factors were
computed. Osgood reported that "reasonable" characterizations
of these adjectives were found. Further, Osgood says,
"throughout our work with the semantic differential we have
found no reason to question the validity of the instrument on
the basis of its correspondence with the results to be expected
from common sense." (11, p. 141) In a thesis by Reeves (11),
the evaluative locations of the Thematic Apperception Test
pictures judged by subjects against the differential were
found to correlate significantly with the clinical judgments
of stories told about the pictures by the same subjects.
The 1952 election study used actual voting behavior as
a criterion. At each sampling period the subjects indicated
how they would vote. Three-and-a-half months before election
day, thirty-seven subjects "expressed" themselves as certain
of how they would vote (Eisenhower or Stevenson), and eighteen
subjects "didn't know," Comparison was made on the semantic
differential and the predictions made. Of the eighteen "don't
knows" fourteen voted as predicted by the semantic differential
evaluative scale (11).
33
The validity of the semantic differential as. an attitude
measure was tested by Osgood. The correlations "between scores
on the evaluative scales of the semantic differential:and £
scores on the Thurstone scales on attitude tpward The Church,
Negro* and Capital Punishment are .7^» .82,^§.nd .81i:-r§spec-
tively. "It is apparent, then, that whatever the Thurstone
scales measure, the evaluative factor of th§ semantic differ-
ential measures just about as well," according-.tofQggoo^ vers
(11 f P« 193) • . :.e"u : i ~" r i.? ~.s
Osgood (11), in another study, compare$3Yl;h§iey-^u^^ve
factor|;.of;the semantic differentialiJojaffyttm^nrtyp§
as a measure of attitude. The rank orderc.correlation between
the two instruments was highly significant:(rho =~.78} p .01)*
The construction of the semantic differential used in"this
study was based on the criteria outlined by Osgood -<(11)..
concept familiar to the subjects and considered significant
to the research problem was chosen. This concept was Teaching !
Elementary School Science. :
In the selection of scales two main sources were usedi
Osgood (11) and Gulo (7). The selection of bipolar adjectives
was also based upon their relevance to the concept and to their
factorial composition. These scales are primarily evaluative,
although there are included representative scales of the
potency and activity factors in order to obscure somewhat
purpose of the measurement. : —
the

34
Table I shows the scales used in the study with the
factors around which the pairs tended to cluster in previous
factor analyses. The adjective pairs are listed in tlfe order
they appear on the semantic differential used in this study.
TABLE I
FACTOR REPRESENTATION OP SCALES SELECTED FOR CONCEPT RATING
Adjective Pair Factor Represented
Clear—Hazy Potency Good—Bad Undetermined Cold—Hot Undetermined Interesting—Boring Evaluative Meaningful—Meaningless Evaluative Nice—Awful Undetermined Light—Heavy Potency Pleasant—Unpleasant Evaluative Deep—Shallow Activity Colorful—Colorless Evaluative High—Low Activity Fair—Unfair Evaluative Fresh—Stale Evaluative Stimulating—Dull Evaluative Valuable—Worthless Evaluative Active—Passive Undetermined Strong—Weak Activity Fast—Slgw Activity Optimistic—Pessimistic Potency Positive—Negative Potency
In this instrument there is a seven-step scale between
the bi-polar adjectives. The bi-polar adjectives appear on
the instrument in random order, and five pairs are reversed
to guard against response set bias. The seven steps are given
ratings of one through seven. One designates the unfavorable,

35
and seven designates the favorable end of the continuum.
There are twenty scales included in this instrument. Instruc-
tions for taking the semantic differential are the one's sug-
gested by Osgood (11). Copies of the instructions and the
instrument may be found in Appendix A on pages 62 and 63 •
Flanders' System of Interaction Analysis
Flanders stated that
Interaction analysis provides an explicit procedure for quantifying direct and indirect influence that is closely related to teacher behaviors. Direct influence consists of those verbal statements of the teacher that restrict freedom of action, by focusing attention on a problem, interjecting teacher authority, or both. These statements include lecturing, giving direc-tion, criticizing, and justifying his own use of authority. Indirect influence consists of these verbal statements of the teacher that expand a student's freedom of action by encouraging his verbal participation and initiative. These in-clude asking questions, accepting and clarifying the ideas or feelings of students, and praising or encouraging students' responses (6, p. 9)»
The Flanders system is an observational method used to
classify the verbal behavior of teachers and pupils as they
interact in the classroom. There are seven categories for
teacher behavior, two categories for pupil talk, and one
category for silence or confusion (1). A summary of these
categories may be found in Appendix C on page 73*
The observer writes down the appropriate category number
every three seconds, or whenever behavior shifts. The data
are then entered on a matrix which depicts the interaction

36
patterns. From this matrix may "be found specific aspects
concerning the teaching behavior*
Flanders.(2) stated that a three-member observer*tearn
achieved correlation coefficients from 0.64 to 0.76 in six
to ten hours of practice, as judged by Scott*s reliability
coefficient. Scott's method is unaffected by low frequencies,
can be adapted to per cent figures, can be estimated more
rapidly, and is sensitive at a high level of reliability (6).
Trained observers were used in collecting data on Flanders*
categories for interaction analysis for this study.
Personal Data Sheet
Subjects were asked to complete a personal information
sheet which included the following items: (1) sex, (2) clas-
sification, (3) whether training in interaction analysis or
not, (4) whether student teaching or not, (5) whether taking
a science course or not, and (6) a list of college courses
completed in the field of science.
Knowledge of the subject's classification and of whether
the student was currently enrolled In student teaching or a
science course was necessary to delete subjects from the
study. A copy of this Instrument may be viewed on page 64
in Appendix A.
Collection of Data
At the beginning of the Spring semester, the professor
or his assistant administered the semantic differential for

37
measuring initial student attitudes toward the concept
(Teaching Elementary School Science) to both control and
experimental groups. Also, the Personal Data Sheets vfere
completed at this time.
Prior to the micro-teaching laboratory experience, each
student in the experimental group taught the same ten- to
twelve-minute lesson in the micro-laboratory. This lesson
was video taped. The recording of verbal behavior of each
pre-service elementary school teacher was tallied by two
trained observers during a video tape replay. Matrices for
Flander^ system of interaction analysis were completed for
each student.
The micro-laboratory experiences extended over a six-
week period. At the end of this time the experimental group
again taught the same ten- to twelve-minute lesson in the
micro-laboratory. The lesson was video taped. Verbal be-
havior was recorded by two trained observers, and matrices
for Flanders* system of interaction analysis were completed
for each student.
Approximately three months after the pretest, the pro-
fessor or his assistant administered the semantic differential
for measuring attitudes toward the concept (Teaching Elementary
School Science) to both control and experimental groups.
Treatment of Data
Examination and treatment of the data were conducted in
the following manner*

38
1. Each scale position of the semantic differential
was assigned a number. The unfavorable pole was arbitrarily
assigned a "1".| the favorable pole was assigned a M7wr*"and
the neutral position (middle scale position) was assigned nb»n
2. Raw scores were summed over subjects (N = 98), and a
Pearson product-moment correlation was calculated, yielding a
20 x 20 intercorrelation matrix of every scale with every
other scale.
3. The intercorrelation matrix was subjected to a
principle axis factor analysis followed by a varimax rotation,
thereby revealing the factor composition of the semantic dif-
ferential.
4. Those scales having a high loading on the post-test
evaluative factor and minimal loadings on the other factors
were taken as a measure of attitude. The mean of the scales
meeting this criteria on the pretest constituted the subjects*
original attitude score. The mean of the same scales on the
post-test was taken as the subjects* post-test attitude score.
5. Hypothesis one was tested statistically by subjecting
the mean attitude change score for the subjects in the three
groups to a one-way analysis of covariance treatment.
6. Hypothesis two was tested statistically using a t,
test for correlated groups to ascertain the difference between
means of the first to last verbal behavior observations for
the revised indirect/direct ratio of the experimental group.

39
Summary
The semantic differential instrument was designed accord-
ing to the criteria espoused by Osgood. The purpose cff this
instrument was to detect any attitude change of the subjects
in this study.
Flanders' system of interaction analysis was used to
detect any increase of indirect verbal behavior of subjects
in the experimental group.
The basic idea of this study was to measure the change
of attitude toward teaching elementary school science and the
increase of indirect verbal behavior of the experimental group
after a micro-laboratory teaching experience.
Means for collecting data and treating the data statisti-
cally were described in this chapter.

CHAPTER BIBLIOGRAPHY C
1. Amidon, Edmund J,, "Interaction Analysis Applied to Teaching," The Bulletin of the National Association of Secondary School Principals. 50 (December, 1966), 93-97.
2. and Ned A, Flanders, The Role of the Teacher in the Classroom, Association for Productive Teaching, Inc., Minneapolis, Minnesota, 1967*
3. Anastasi, Anne, Psychological Testing, New York. McMillan Company, 1961.
Campbell, Donald T. and Julian C.Stanley, Experimental and Quasi-Expe rimenta1 Designs for Research, Chicago, Rand, McNally and Co., 1963#
5. Dickens, Milton and Frederick Williams, "Mass Communica-tions," Review of Educational Research, XXXIV (April, 1964), 213-215,
6. Flanders, Ned A,, "Teacher Influence, Pupil Attitudes, and Achievement," Cooperative Research Monograph No. 12, United States Department of Health, Education, and Welfare, Office of Education, United States Government Printing Office, Washington, 1965«
7. Gulo, E. Vaugh, "University Students* Attitudes as Measured by the Semantic Differential," Journal of Educational Research, 60 (December, 1966), 31-3^*
8. Kerlinger, Fred N., Foundations of Behavioral Research, New York, Holt, Rinehart, and Winston, 1964,
9. Kuslan, Louis I. and A. Harris Stone, Teaching Children Science8 An Inquiry Approach. Belmont, California, Wadsworth Publishing Company, Inc., 1968.
10. Moss, C. Scott, "Current and Projected Status of the Semantic Differential," The Psychological Record, X (January, i960), 47-53,
11. Osgood, Charles E., George J. Suci, and Percy H. Tannenbaum, The Measurement of Meaning, Urbana, Illinois, University of Illinois Press, 1957«
40

41
12. Osgood. C. E. and Percy H. Tannenbaum, "The Principle of Congruity in the Prediction of Attitude Change, Psychological Review, 62 (1955)# ^3-55 •
13. Staats, A. and C. Staats, "Attitudes Established*by Classical Conditioning," Journal of Abnormal and Social Psychology, LVII (1958)* 37-2*0•

CHAPTER IV <T
STATISTICAL ANALYSIS AND DISCUSSION OF RESULTS
The purpose of this chapter was to analyze the compiled
data in order to determine if a micro-teaching laboratory
experience (1) influenced the attitudes of pre-service ele-
mentary teachers toward teaching elementary school science
and (2) supported the increase of indirect verbal "behavior of
pre-service elementary school teachers.
The chapter is divided into the following sectionsi
1, An analysis of the results of the factor analysis
of the semantic differential data
2. An analysis of statistical data and discussion of
the results with regard to hypothesis one
3« An analysis of statistical data and discussion of
the results with regard to hypothesis two.
The data assembled from the one-concept, twenty-scale
semantic differential were subject to a principal-axis factor
analysis followed by a varimax rotation in order to obtain
the factor composition of the semantic differential. The
. 0 5 level of confidence was selected as an acceptable cri-
terion for statistical validity.
kZ

43
Factor Analysis of the Semantic Differential Data
Table II shows the means and standard deviations for all €
the pretest and post-test semantic differential scale ratings
for the concept—Teaching Elementary School Science.
TABLE II
PRETEST AND POST-TEST MEANS AND STANDARD DEVIATIONS FOR SCALE RATINGS OF THE CONCEPT SUMMED
OVER ALL SUBJECTS
Standard Mean Deviation
5.51 1.42 6.18 1.04 4.86 1.36 6.54 .89 6,66 .68 5.66 1.32 4.22 1.40 6.00 1.46 4.95 1.29 6.07 1.19 5.23 1.43 5.86 1.25 5.87 1.23 6.47 1.02 6.71 .59 6.09 1.33 5.76 1.30 5.09 1.29 6.14 1.29 6.26 1.15
Scale Mean Standard Deviation
Clear—Hazy Good—Bad Cold—Hot Interesting—Boring Meaningful—Meaningless Nice—Awful Light—Heavy Pleasant—Unpleasant Deep—Shallow Colorful—Colorless High—Low Fair—Unfair Fresh—Stale Stimulating—Dull Valuable—Worthless Active—Passive Strong—Weak Fast—Slow Optimistic—Pessimistic Positive—Negative
4.77 4.68 5.49 5.55 5.78 4.81 4.43 5.15 6.02 6.37 5.85 6.16 6.53 5.70 5*62 6.35 4.07 6.68 5.89 5.93
1.67 1.38 1.38 1.36 1.18 1.17 1.29 1.29 1.11 1.04 1.26 1.00
.75 1.32 1.12 1.07 1.23
.60 1.11 1.19
Raw scores were summed over subjects, and a Pearson
product-moment correlation was calculated, yielding a 20 x 20
intercorrelation matrix of every other scale for the post-test.
The post-test semantic differential data were used for the

44
factor analysis to identify the evaluative scales. Previous
studies conducted by Dr. Earl McCallon, North Texas State
University, Denton, Texas, had indicated that, in general,
post-test data for this concept tended to produce more stable
and reliable factors. To check this pretest, data for this (
study were subjected to a principle axis factor analysis.
Two factors emerged. One factor seemed to be evaluative in
that all the evaluative scales identified by the post-test
factor analysis loaded on this factor. Consequently, the
researcher felt reasonably confident in using the scales that
were selected for the attitude measurement in this study.
Table III shows the intercorrelation matrix. The bi-
polar adjective scales are ordered in the matrix as they are
on the concept measurement instrument.
Table IV shows the rotated factor matrix of the scales
for the post-test. These scales are listed from the highest
to the lowest factor loadings for each successive factor.
Nine of the twenty scales on the post-test loaded on
factor I. This factor was considered evaluative because of
the semantic nature of the scales showing the highest loadings
on itj positive—negative, clear—hazy, stimulating—dull,
optimistic—pessimistic, good—bad, active—passive, strong-
weak, interesting—boring, and pleasant.
The second factor was identified as the potency variable!
deep—shallow, fair—unfair, and high—low.

H M
a PQ < &H
20
o ca xacavacain-caco ano o cacvoo cm c -h cm 00 C-vr*vO v>\0 HMD CM A ACM U O-r C -C -O CO • • • • • • • • • • • • • • • • • • f t
ON iH
C*-ON-3" O CM P^HOO o\ t (AO CANO OoOOONO O-VT^ \Q VTjXACM -j- CM -3" VACM -4" NO-3" VT\\0 Cvl • • • • • • • • • • • • • • • * • •
18 (A*A ON-3" H H CANO H -3" -3- VAOO CM vr\c*—3"
CMOCACA<M-3--3-CM(ACM VNCACM c ^ H ^ 17 AC -CM (AC^-OHHVAHOH ON -NO C-\
vo vn*A W3-VO CMMD CA ANG CACAVO CANO • • • • • • • • • • • • • • a *
16 ONCJ vo tS-NO ONVO H CV3" *A|>-CACA*A
VT\VAXAV>u3- Jt CM NO CM VY3- H-3- C*-CA • • • • • • • • • • • • • • a
rH CAOO NO (AC*- O -d" o CACA0O CACA (A (A V>-3* H CACM CA<A CA(ACA • • • • • • • • • • • • • •
H -d- ON CM *ANO O CM 00 >ACO Ovri VO xnvntN-WO CAMD H WMOO VT\ • • • • • • • • • • • • a
13
NO CACM CO O CM c-vo O H r l n -3- *nr>,cM ca-4- h cacaca v\cm • • • • • • • • • • • •
12
O ONJ" OHC^NCN]^ C-00 CM CM CO H cm cno cm cncvi -4" • • • • • • • • • • •
II -3" O-O O-H-3" P--3* v>0
va - VV3- \r\CM -4- -4" *A • • • • • • • • • •
10
00 CAOO VOC -CTVOO CA*A (A ACACA- -4" CM >ACA • • • • • • • • •
ON Ov-3- U-\\T\cO 00 CM ON CM (ACM O H (AO CM • • • • • • • •
CO H VA AVO H (ACM VA*A-d" *AXA-3" CA • • • • • • •
O-ONCO CAOMAOO O O CM CM CM H • • • • • •
NO VOVAOO VV VA ACA VA- -• • • • •
0\CA*ANO Wfrvo • • • •
& (AMD O NO-3" XA • • •
<T\ 00 ON -3" (A • •
CM -3-O-•
Scale
Adjec-
tives
i
H CM CA-3" vr>\0 I>-00 ON O H CM CA-3" *ANO C-00 ON H H H H H H H H H H
46
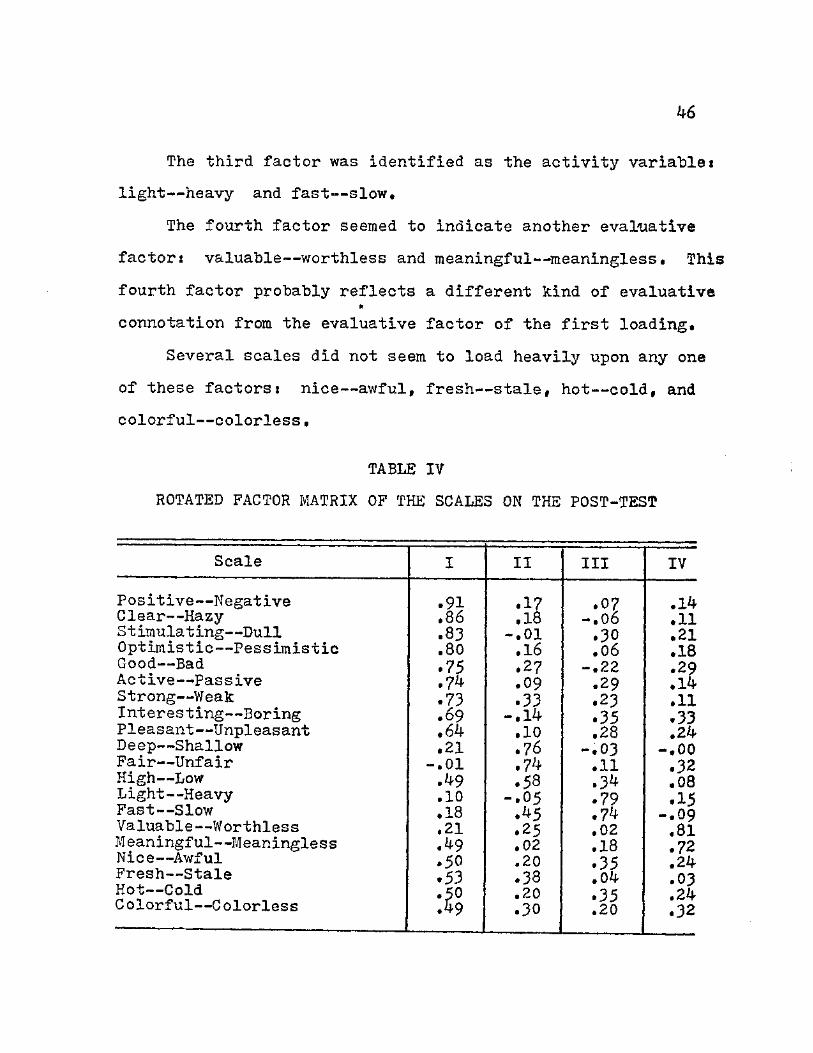
The third factor was identified as the activity variablei
light—heavy and fast—slow.
The fourth factor seemed to indicate another evaluative
factor: valuable—worthless and meaningful—meaningless. This
fourth factor probably reflects a different kind of evaluative
connotation from the evaluative factor of the first loading.
Several scales did not seem to load heavily upon any one
of these factors: nice—awful, fresh—stale, hot—cold, and
colorful—colorless.
TABLE IV
ROTATED FACTOR MATRIX OF THE SCALES ON THE POST-TEST
Scale I I I I I I IV
.17 .07 .14 .86 .18 - . 0 6 .11 .83 - . 0 1 .30 .21 .80 .16 .06 .18 .75 . 2 7 - . 2 2 .29 .74 .09 .29 .14 .73 .33 .23 .11 .69 - . 1 4 .35 .33 .64 .10 .28 .24 .21 .76 - . 0 3 - . 0 0 .01 .74 .11 .32 .49 .58 .34 .08 .10 - . 0 5 .79 .15 .18 .45 .74 - . 0 9 .21 .25 .02 .81 .49 .02 .18 .72 .50 .20 .35 .24 .53 .38 .04 .03 .50 .20 .35 .24 .49 .30 .20 .32
Posit ive—Negat ive Clear—Hazy Stimulating—Dull Optimistic—Pessimistic Good—Bad Active—Passive Strong—Weak Interesting—Boring Pleasant—Unpleasant Deep—Shallow Fair—Unfair High—Low Light—Heavy Fast—Slow Valuable—Worthless Meaningful—Meaningless Nice—Awful Fresh—Stale Hot—Cold C olorf ul—C olorless

^7
Statistical Analysis of Data and Discussion Pertinent to Hypothesis One
The eleven scales having a high loading on the evaluative
factor of the post-test semantic differential instrument were
selected as a measure of attitude. The mean of these scales
on the pretest constituted the subjects* original attitude
score. The mean of these scales on the post-test were taken
as the subjects' post-test attitude score. A group attitude
score was indicated by the mean of all group subjects' atti-
tude scores.
Table V shows the mean and standard deviation of the
attitude scores of all the groups between the pretest and
post-test for the concept—Teaching Elementary School Science.
TABLE V
PRETEST AND POST-TEST GROUP ATTITUDE MEAN AND STANDARD DEVIATION FOR ALL GROUPS
Groups N Pretest Post-test
Groups N
Mean Standard Deviation Mean
Standard Deviation
Control Group I 26 5.58 .9^ 5.36 1.13
Control Group II 46 6.12 .61 6.58 .41
Experimental Group 26 6.12 .70 6.41 .62
The data in Table V suggest the following; (1) control
group I which was not enrolled in a science methods course
^8
tended to show a less favorable attitude toward teaching ele-
mentary school science at the end of the experiment! (2) it
was noted that the two science methods groups had the same
initial mean; however, control group II which was engaged in
a regular science methods course developed a more positive
attitude toward teaching elementary school science than did
the group having a micro-teaching laboratory experiencei and
(3) the experimental group which was enrolled in a science
methods course and was having a micro-teaching laboratory
experience did show a post-test increase in positive attitude
toward teaching elementary school science, although not as
great a change as the group participating in a regular science
methods course.
Hypothesis one of this study stated (1) that pre-service
elementary school teachers enrolled in a science methods course
would achieve a more favorable attitude, which would be sta-
tistically significant, toward the teaching of elementary
school science by participating in a micro-teaching laboratory
experience than pre-service elementary school teachers en-
rolled in a traditional science methods course; and (2) that
pre-service elementary school teachers enrolled in one of the
science methods courses would achieve a more favorable atti-
tude, which would be statistically significant, toward the
teaching of elementary school science than pre-service ele-
mentary school teachers not enrolled in a science methods
course.

49
Analyses of covariance were performed in order to con-
trast (1) those having a science methods course with a micro-
teaching laboratory experience with those having a science
methods course "but no micro-teaching laboratory experience
and (2) those having a science methods course with those not
having a science methods course.
A summary of the analysis of covariance contrasting
control group II with the experimental group can "be seen in
Table VI. Because the P ratio failed to reach the required
level for the .05 level of confidence, the first part of re-
search hypothesis one, stating that the experimental group
(science methods group having a micro-teaching experience)
would achieve a more favorable attitude, which would be sta-
tistically significant, toward teaching elementary school
science than control group II (science methods group with no
micro-teaching laboratory experience) was rejected.
TABLE VI
SUMMARY OF THE ANALYSIS OP COVARIANCE CONTRASTING CONTROL GROUP II Y/ITH THE EXPERIMENTAL GROUP
Source of Variation SS df MS F
Between Groups • 45 1 .45 2.26
Within Groups 13-75. 6£ .20 -
Total 14.20 70

50
A comparison of an increase in favorable attitude toward
teaching elementary school science between control group II
and the experimental group (groups taking a science methods
course) and control group I (group not taking a science
methods course) as set forth in the second part of hypothesis
one is divulged in Table VII.
TABLE VII
SUMMARY OP THE ANALYSIS OP COVARIANCE CONTRASTING CONTROL GROUP II AND THE EXPERIMENTAL G
GROUP WITH CONTROL GROUP I
Source of Variation SS df MS P
Between Groups 12.16 1 12.16 35.25
Within Groups ?2.78 21 .35 -
Total 44.9^ 96
The F ratio is significant above the .001 level of con-
fidence. Therefore, the second part of research hypothesis
one, which states that pre-service elementary school teachers
enrolled in one of the science methods courses would achieve
a more favorable attitude, which would be statistically sig-
nificant, toward the teaching of elementary school science
than pre-service elementary school teachers not enrolled in
a science methods course is rejected.

5 1
Statistical Analysis of Data and Discussion Pertinent to Hypothesis Two
Hypothesis two stated that pre-ser-vice elementary school C
teachers enrolled in a science methods course and partici-
pating in a micro-teaching laboratory experience would show
a statistically significant increase in indirect teacher in-
fluence from onset to the end of a micro-teaching experience.
Before measuring the indirect teacher influence, it was
necessary to establish observer reliability. Table VIII shows
the data used to calculate the reliability by using the Scott
Coefficient of Observer Reliability.
TABLE VIII
DATA USED TO CALCULATE RELIABILITY BY SCOTT'S METHOD
Category Observer A
Observer B
% A % B % Diff. (A v,fo)Z
1 0 0 0 . 0 0 . 0 0 . 0 . 0 0 0 2 18 2 0 8 . 7 9.9 1 . 2 .865 3 10 9 4 . 8 4.5 . 3 . 2 1 6 4 4 3 4 8 20.8 23.8 3 . 0 4 . 9 7 3 5 3 5 3 1 1 6 . 9 15.3 1 . 6 2 . 5 9 2 0 3 2 1 . 4 l i o . 4 . 0 1 4 7 0 0 0 . 0 0 . 0 0 . 0 . 0 0 0 8 8 9 3 . 9 4.5 . 6 . 7 6 9 75 66 3 6 . 2 32.7 3 . 5 1 1 . 8 6 8
10 1 5 1 7 7 . 2 8 . 4 1 . 2 . 6 0 8
Totals 207 2 0 2 9 9 . 9 1 0 0 . 1 1 1 . 8 2 1 . 3 1 2
The Scott Coefficient of Observer Reliability between
the two observers was .85, which met the need for a reliability
level sufficient to make inferences from the data.

52
With Fisher's t, the difference of means between the
first and last observation was obtained for the indirect/
direct ratio for the experimental group. Table IX shdws the
mean change in verbal behavior of the experimental group.
The data for hypothesis two yielded mean scores indi-
cating an increase in indirect verbal behavior after a micro-
teaching experience. However, the mean change from the first
to the last observation of the experimental group was not
statistically significant; therefore, research hypothesis
two was rejected.
TABLE IX
MEAN CHANGE IN INDIRECT/DIRECT RATIO FOR THE EXPERIMENTAL GROUP
Means t
First Last Observation Observation
55.^6153 58.57692 -.875^8
The data recorded by observers of the indirect/direct
verbal behavior show pre-service elementary school teachers
as not being significantly influenced by a micro-teaching
laboratory experience carried out under the program designed
for this study. It was noted, however, that the change in
verbal behavior was in the direction anticipated in hypoth-
esis two.

53
Summary
The purpose of this chapter was to analyze and discuss
the data as described in Chapter III. The presentaticfn was
organized into the following three parts»
1. Factor analysis of the semantic differential data
2• Statistical analysis of data and discussion re-
garding hypothesis one
3. Statistical analysis of data and discussion re-
garding hypothesis two.
Chapter V will be composed of the summary, findings,
conclusions, and recommendations for further research.

CHAPTER V C
SUMMARY, FINDINGS, CONCLUSIONS, AND RECOMMENDATIONS
Summary
This study was proposed in order to determine if a micro-
laboratory experience could be effectively used to (1) influ-
ence attitudes toward teaching elementary school science and
(2) support indirect verbal behavior of pre-service elementary
school teachers. A semantic differential instrument was de-
signed to use as a pre- and post-test attitude measurement in
order to determine the attitude of all subjects toward teaching
elementary school science. Flanders* system of interaction
analysis was used to determine the change in indirect verbal
behavior of the experimental group. Observations for deter-
mining this change were made by trained observers prior to
and following the micro-laboratory experiences.
The ninety-eight subjects participating in this study
consisted of three groups of junior or senior elementary edu-
cation majors enrolled in a university in the Southwest
during the Spring semester of 19&9-
The micro-teaching laboratory experience was directed
and critiqued by the professor and his assistant.
The hypotheses of this study were the following*
1. Pre-service elementary school teachers enrolled in
a science methods course would achieve a more favorable
triL

55
attitude, which would be statistically significant, toward
the teaching of elementary school science "by participating
in a micro-teaching laboratory experience than pre-service
elementary school teachers enrolled in a traditional science
methods course; and pre-service elementary school teachers
enrolled in both of the science methods courses would achieve
a more favorable attitude, which would be statistically sig-
nificant, toward the teaching of elementary school science
than pre-service elementary school teachers not enrolled in
a science methods course.
2. Pre-service elementary school teachers enrolled in
a science methods course and participating in a micro-teaching
laboratory experience would show a statistically significant
increase in indirect teacher influence from onset to the end
of the micro-teaching laboratory experience.
Hypothesis one was statistically tested by subjecting
the mean attitude score (derived from the administration of
the pre- and post-test semantic differential instrument) for
the subjects in the three groups to an analysis of covariance
treatment.
Hypothesis two was statistically tested by the t test
to determine the difference of the means between the first
and last observations (as measured according to Flanders*
system) for indirect verbal behavior of the experimental group.
The level of statistical significance was arbitrarily
set at the .05 level of confidence.
56
Findings
The following findings were formulated from an analysis
of the data collected in this study* *
1. An increase in favorable attitudes toward the
teaching of elementary school science by pre-service elemen-
tary school teachers, as measured by the pre- and post-test
semantic differential, occurred in the group enrolled in the
traditional science methods course (control group II).
Also, an increase in favorable attitudes toward the
teaching of elementary school science by pre-service elemen-
tary school teachers, as measured by the pre- and post-test
semantic differential, occurred in the group enrolled in a
science methods course and having a micro-teaching laboratory
experience (experimental group). The greatest attitude change
was noted in the group enrolled in the traditional science
course (control group II).
A decrease in favorable attitudes toward the teaching of
elementary school science by pre-service elementary school
teachers, as measured by the pre- and post-test semantic
differential, occurred in the group not enrolled in a science
methods course (control group I).
Significant differences, regarding an increase in favor-
able attitudes toward the teaching of elementary school science,
were not found when comparing the group enrolled in a science
methods course and having a micro-teaching laboratory ex-
perience (experimental group) with the group enrolled in a
57
science methods course and not having a micro-teaching ex-
perience (control group II).
The groups having the science methods course (control
group II and the experimental group), when compared with the
group not having the science methods course (control group I),
showed a greater increase in more favorable attitudes toward
teaching elementary school science. This was statistically
significant at the .001 level.
2. The group enrolled in a science methods course and
having a micro-laboratory experience (experiemental group) did
show an increase in indirect teacher influence from first ob-
servation to last observation. However, this increase was
not statistically significant.
Conclusions
Prom the data studied the following conclusions were
made:
1. This study, as designed and carried out, showed that
pre-service elementary school teachers enrolled in a science
methods course and having a micro-teaching laboratory experience
did not develop any more favorable attitudes toward teaching
elementary school science than did other pre-service elementary
school teachers enrolled in a science methods course and not
having a micro-teaching laboratory experience. In fact, while
not statistically significant, the results showed that there
was a trend in the direction of more favorable attitudes for

58
those students enrolled in a science methods course and not
having micro-teaching laboratory experiences.
2. Pre-service elementary school teachers enrolled in
a science methods course did develop more favorable attitudes
toward the teaching of elementary school science than pre-
service elementary school teachers not enrolled in a science
methods course.
3. Pre-service elementary school teachers enrolled in
a science methods course and having a micro-teaching labora-
tory experience did not significantly increase in indirect
teacher influence.
In the light of the findings of this study, assumption
number three, stating that this study is based on the assump-
tion that it is possible to practice the teaching act in parts
ultimately being assimilated into the whole teaching act, may
need to be rejected. Since no statistically significant dif-
ference was found in either the measure of attitudes or teacher
influence, it may well be that this assumption is incorrect.
Recommendations
The following recommendations are made on the basis of
the conclusion of this studyi
1. It is recommended that a science methods course be
included in the pre-service elementary school teacher program
to further positive attitudes toward teaching elementary
school science. It is recommended that teachers of science

59
methods courses continue to strive to find means to further
improve the attitudes of students toward the teaching of
elementary school science. , *
2. Research in the area of attitudes toward science
should be concerned with methods and content used in the tra-
ditional science methods course in order to determine which
aspects of the instruction provide more favorable attitudes.
3# Research in the area of attitude change as the result
of methods courses such as the one described in this study-
should consider the duration of favorable attitudes toward
the teaching of elementary school science by pre-service ele-
mentary school teacher by follow-up testing at a later date.
4. It is recommended that a study be designed using a
micro-teaching experience focusing on an increase in indirect
verbal behavior, while a separate study be designed with the
use of micro-teaching focusing on the increase of favorable
attitudes toward the teaching of elementary school science.
It appeared that the combination of these two factors tended
to work at cross-purposes. It is deemed necessary to have
several micro-laboratory teaching and reteaching sessions to
obtain an increase in indirect verbal behaviorj however, the
time spent in such sessions in this study seemed to be dis-
proportionate to the time allotted for the entire course. A
lack of enthusiasm noted in students toward the end of the
micro-teaching laboratory experience might have been due to
too many micro-teaching encounters in the micro-laboratory.

60
This might account for the insignificant increase of favorable
attitudes toward the teaching of elementary school science in
the experimental group.

APPENDIX
61

62
APPENDIX A
INSTRUCTIONS: In completing the attached rating scale, please make your judgments on the basis of what these things mean to you. You are to rate the concept on each of these scales in order.
Here is how you are to use these scales s
If you feel that the concept at the top of the page is very closely related to one end of the scale, you should place your check-mark as follows s
fair x i i : s : : » unfair
or
fair i i i i t i x i unfair
If you feel that the concept is quite closely related to one or the other end of the scale ("but not extremely), you should place your check-mark as follows:
strong t x i : : i : t weak
or
strong i : t t > t : weak
If you consider the concept to "be neutral on the scale, both sides of the scale equally associated with the concept, or if the scale is completely irrelevant, unrelated to the concept, then you should place your check-mark in the middle space.
safe • t i x : : : i dangerous
IMPORTANT: 1. Place your check-marks in the middle of spaces, not on the "boundaries.
2. Be sure you check every scale for every concept—do not omit any.
3. Never put more than one check-mark on a * single scale.
Make each item a separate and independent judgment. It is your first impressions, the immediate "feelings" about the items, that we want. On the other hand, do not be careless because we want your true impressions.

63
HOW DO YOU FEEL ABOUT TEACHING ELEMENTARY SCIENCE?
Clear
Good
Cold
Interesting
Meaningful
Nice
Light
Unpleasant
Deep
Colorful
High
Unfair
Fresh
Stimulating
Valuable
Passive
Strong
Fast
Optimistic
Negative
Hazy
Bad
Hot
Boring
Meaningless
Awful
Heavy
Pleasant
Shallow
Colorless
Low
Fair
Stale
Dull
Worthless
Active
Weak
Slow
Pessimistic
Positive

6k
PERSONAL DATA SHEET
NAME DATE
Please place an X in the appropriate box,
SEXi CLASSIFICATION:
Male P Junior [ I
Female P Senior P
Other ( 1
Please circle Yes or No in answer to the following question*
Have you had Interaction Analysis in a college course?
Yes No
Please circle the appropriate answers
This semester I will be
Junior Student Teaching Neither
Senior Student Teaching
This semester I am am not taking a science course.
Please list below college courses you have completed in the field of science.
PHYSICS CHEMISTRY BIOLOGY GEOLOGY OTHER

65
APPENDIX B
MICRO-TEACHING LABORATORY
The micro-laboratory is a self-contained unit which has
been designed by Drs. Louise Allen and Howard Smith, North
Texas State University, Denton, Texas, for micro-teaching in
the pre-service education program in elementary education.
The expanded laboratory is approximately seven feet in width
by ten feet in length and seven feet high. The front wall
has four panels of one-way glass to facilitate observation.
There is a porthole with a Plexiglas covering and a foldable
mount to support a television camera. In the back there is
a door permitting easy entrance and exit. The micro-teaching
laboratory has a built-in ventilation, lighting, and sound
system.
The micro-laboratory provides a controlled environment
where the video system is concealed and where the audience
can observe unseen.

66
Experimental Group
MICRO-TEACHING LABORATORY EXPERIENCE
The class was divided into teams numbering from two to
four pre-service elementary school teachers. The size of the
team was dependent upon the size of the class. Each team was
assigned a day to teach and a certain micro-laboratory in which
to teach. The students assigned to teach in a certain labora-
tory became the student observers on the days they were not
scheduled to micro-teach. The student observers completed the
critiquing instrument immediately following the micro-teaching.
The replay session was scheduled for later the same day.
OUTLINE FOR THE MICRO-TEACHING
LABORATORY EXPERIENCE
First Dayj
1. The researcher explained the following: (1) the meaning of micro-teaching, (2) the benefits of micro-teaching, (3) make-up of the micro-lesson, and (4) where to obtain micro-lesson materials. Selection of team members and teaching time was made.
Second Days
1. The experimenter instructed the group in skills that vary the stimulus situation. The use of the critiquing instrument was discussed. Questions concerning all phases of the micro-teaching presentation were answered.
Third, Fourth, and Fifth Dayss
•* 1. Teach (Varying the Stimulus Situation) phase video taped in micro-laboratories.
Mio?oli!bo?tto?y 2 0 n e t e a m i n e a o h laboratory each day.

6? 1
2. Critiquing instrument (Varying the Stimulus Situation) was completed "by student observers immediately following micro-teaching.
3« Critique—Replays for each team were scheduled for later the same day. Self-analysis and results of the evaluation by student observers were considered at that time by the team under the guidance of the pro-fessor and his assistant.
Sixth, Seventh, and Eighth Dayss
1. Reteach (Varying the Stimulus Situation) phase video taped in the micro-laboratories.
Micro-laboratory 2 0 n e t e a m i n e a o h lab°ratory each day.
2. Critiguing instrument (Varying the Stimulus Situation) was completed by student observers immediately following the micro-teaching.
3 . Critique—Replay for each team will be scheduled for later the same day. Self-analysis and results of the evaluation by student observers were considered at that time by the team under the guidance of the pro-fessor and his assistant.
Ninth Day:
1» Instruction in the Reinforcement Skills were presented.
2. Students prepared new micro-lesson outside the class.
Tenth, Eleventh, and Twelfth Days:
1» Teach (Reinforcement) phase video taped in the micro-laboratories .
Micro-laboratory 2 0 n e t e a m i n e a c h laboratory each day.
2. Critiquing instrument (Reinforcement) was completed by student observers immediately following micro-
* teaching.
3 . Critique—Replays for each team were scheduled for later the same day. Self-analysis and results of the evaluation by student observers were considered at that time by the team under the guidance of the pro-fessor and his assistant.

68
Micro-teacher Team
Date Education kJJ
Critiquing Instrument
VARYING THE STIMULUS SITUATION
Inadequate Adequate Excessive
TEACHER GESTURES
1. The teacher used gestures of the body, hand, and head to enhance the pres-entation of the lesson. • •
FOCUSING
2. The teacher used gestural (as pointing) and verbal (as "listen," "look") focusing or a combination when making a specific point. • •
INTERACTION
3. The teacher varied the kinds of interaction (teacher-group, teacher-pupil, or pupil-pupil). •

69
Micro-teacher Team
Date Education ^33.
Critiquing Instrument
REINFORCEMENT
Inadequate Adequate Excessive
POSITIVE TEACHER COMMENTS
1. When the student performed well, the teacher rewarded him with such words as "good," "fine," "excellent," etc. • •
POSITIVE TEACHER GESTURES
2. The teacher encouraged the students1 participa-tion with nonverbal cues, such as nods, smiles, moving toward pupils, etc. • • •
ENTHUSIASM
The teacher responded to the students* questions and comments enthusias-tically. • • •

70
Control Group
OUTLINE FOR EDUCATION 433, SCIENCE FOR CHILDREN
First Day:
Second Days
Third Days
Fourth Days
Fifth Days
Sixth Days
Seventh Days
Eighth Day:
Ninth Days
Tenth Days
Eleventh Days
Twelfth Days
Thirteenth Day:
Fourteenth Day:
Fifteenth Days
Sixteenth Days
Seventeenth Days
Eighteenth Days j r
Nineteenth Days
Twentieth Day;
Twenty-first Days
General Overiew of Course
The Nature of Science
Elementary School Science—Past and Present
Objectives in Elementary School Science
Scope and Sequencing in Elementary School Science
The Development of Science Concepts
Characteristics of Children and the Teaching of Science
Films Motivation for Science Learning
Open Day, to be used as needed
Short Examination and In-Class Critique
Emphasizing Science Processes—Observing
Emphasizing Science Processes—Inferring
Emphasizing Science Processes—Sjace/Time Relations
Emphasizing Science Processes—Measuring
Emphasizing Science Processes—Classifying
Emphasizing Science Processes—Predicting
Open Day, to be used as needed
Short Examination and In-Class Critique
Specific Methods in Science Instructions Experiments
(continued)
Specific Methods in Science Instruction— Demonstrations

71
Twenty-second Days (continued)
Twenty-third Days Specific Methods in Science Instruction— Reading and Reports
Twenty-fourth Days Resource Person in Sciences Mr. Art Martins Regional Aerospace Education Director (guest speaker)
Twenty-fifth Days Specific Methods in Science Instruction—
Field Trips
Twenty-sixth Days Films Field Trips for Discovery
Twenty-seventh DaysPreparation for Class Field Trip (fossil hunt). Field Trip on Saturday.
Twenty-eight Days Specific Methods in Science Instruction— Films, Filmstrips, Models, and Specimens, etc.
Twenty-ninth Days (continued)
Thirtieth Days Films Teaching Techniques
Thirty-first Days Planning for Science Instruction— Determining Behavioral Objectives
Thirty-second Days Planning for Science Instruction— Curriculum Guides and Science Content
Thirty-third Days Planning for Science Instruction—Avail-ability of Curriculum Resource Materials
Thirty-fourth Days (continued)
Thirty-fifth Days Elements of a Good Science Lesson
Thirty-sixth Days Critique of a Science Lesson (Video Tape Replay)
Thirty-seventh DaysExamination of Some Newer Science Programss
AAAS and ESS
Thirty-ninth Days Short Examination and In-Class Critique
Fortieth Days Materials for Science Teaching—Obtaining Free and Inexpensive Materials
Forty-first Days Materials for Science Teaching—Ordering Science Equipment

72
Forty-second Day: Materials for Science Teaching—Mr. Earl Grabhorn: Texas MidContinent Oil and Gas Association (guest speaker)
Forty-third Day: Course Review
Forty-fourth Day: Final Examination.

73 APPENDIX C
SUMMARY OP CATEGORIES FOR INTERACTION ANALYSIS
h-l «! EH «
W K O <
W EH
W O z w s to z H B O w H p 3.
4.
ACCEPTS FEELING: accepts and clarifies the tone of the students in a nonthreatening manner. Feelings may be positive or negative. Predict-ing and recalling feelings are included.
PRAISES OR ENCOURAGES: praises or encourages student action or behavior. Jokes that release tension, not at the expense of another individ-ual, nodding head or saying "uh huh?" or "go on" are included.
ACCEPTS OR USES IDEAS OF STUDENT: clarifying, building, or developing ideas or suggestions by a student. As teacher brings more of his own into play, shift to category five.
ASKS QUESTIONS: asking a question about content or procedure with the intent that a student answer.
5. LECTURES: giving facts or opinions about con-tent or procedures} expressing his own idea} asking rhetorical questions.
6. GIVES DIRECTION: directions, commands, or orders with which a student is expected to comply.
7. CRITICIZES OR JUSTIFIES AUTHORITY: statements intended to change student behavior for non-acceptable to acceptable pattern} bawling some-one out j stating why the teacher is doing what he is doing, extreme self-reference.
a EH EH S25 W Q
W
8. STUDENT TALK-RESPONSE: talk by students in re-sponse to teacher's questions in which predeter-mined responses are expected.
9. STUDENT TALK-INITIATION: talk by students, which they initiate. If "calling on" student is only to indicate who may talk next, observer must de-cide whether student wanted to talk. If he did, use this category. In addition, student's re-sponse to open ended question such as "What is your opinion?", "What do you suggest?", etc., would go in this category.
10. SILENCE OR CONFUSION: pauses, short periods of silence, and periods of confusion in which com-munication cannot be understood by the observer.

BIBLIOGRAPHY
Books
Amidon, Edmund J., Improving Teaching, The Analysis of Class-room Verbal Interaction, New York, Holt, Rinehart and Winston, Inc., 1966.
. . and Ned A. Flanders, The Role of the Teacher in the Classroom, Association for Productive Teaching, Inc., Minneapolis, Minnesota, 1967.
Anastasi, Anne, Psychological Testing, New York, MacMillan C om pany, 1961.
Campbell, Donald T. and Julian C. Stanley, Experimental and Quasi-Experimental Designs for Research, Chicago, Rand, McNally and Company, Chicago, 1963•
Gibb, E. Glenadine and Dorothy C. Matala, "Study on the Use of Special Teachers of Science and the Mathematics in Grades 5 a^d 6," from Change and Innovation in Elementary School Organization, edited by Maurie Hillson, New York, Holt, Rinehart and Winston, 1965*
Hoffman, Martin Leon, Review of Child Development Research, Vol. II, New York, Russell Sage Foundation, 1964,
Karplus, Robert and Herbert D. Thier, A New Look at Elementary School Science. Chicago, Rand, McNally and Company, 1967*
Kerlinger, Fred N., Foundations of Behavioral Research, New York, Holt, Rinehart, and Winston, 1964,
Kuslan, Louis I. and A. Harris Stone, Teaching Children Science: An Inquiry Approach, Belmont," California, Wadsworth Publishing Company, Inc., 1968.
Lindsey, Margaret, Leslie Mauth, and Edith Grotberg, Improving Laboratory Experiences in Teachers' Education, New York,
* Bureau of Publications, Teachers College, Columbia University, 1959.
Osgood, Charles E., George J., Suci, and Percy H. Tannenbaum, The Measurement of Meaning. Urbana, Illinois, University of Illinois Press, 1957.
74
75
Remitters, H. H., Introduction to Opinion and Attitude Measure-ment . New York, Harper and Brothers, 195^.
Renner, John Wilson, Teaching Science in the Elementary School, New York, Harper and Row, 19^8,
Travers, Robert M. W., Essentials of Learning, New York, MacMillan C ompany, 1964.
Articles
Allen, Dwight W., "A New Design for Teacher Education: The Teacher Interne Program at Stanford University," The Journal of Teacher Education, 17 (Fall, 1966), 293-300.
and Richard J. Clark, Jr., "Micro-Teaching: Its Rationale," The High School Journal, 51 (November, 1967), 75-79.
and Richard E, Gross, "Micro-Teaching—A New Beginning for Beginners," NEA Journal, 55 (December, 1965), 25-26.
Amidon, Edmund J., "Interaction Analysis Applied to Teaching," The Bulletin of the National Association of Secondary School Principals. 50 (December, 1966), 93-97•
Kathleen M. Kies, and Anthony T. Palisi, "Group Supervisions A Technique for Improving Teaching Behavior," The National Elementary Principal, XLV (April, 1966), 5^-58.
Baumel, Howard B. and J. Joel Berger," An Attempt to Measure Scientific Attitudes," Science Education, 49 (April, 1965), 267-269.
Blanc, Sam S., "Review of General Goals in Science Teaching," cited in "An Attempt to Measure Scientific Attitudes," by Howard B. Baumel and J. Joel Berger, Science Education, 49 (April, 1965), 267-269.
Charen, George, "Laboratory Methods Build Attitudes," Science Education. 50 (February, 1966), 5^-64.
Cooke, Fred S. and Daniel P. Brown," Does Micro-Teaching Have a Place in Business?" Business Education World, 48 (April, 1968), 7-9.

76
Cunningham, John D., "Interaction Analysiss A Useful Technique for Research and Science Supervision," Science Education. 51 (February, 1967)# 27-32.
Dickens, Milton and Frederick Williams, "Mass Communications," Review of Educational Research, XXXIV (April. 196-4-). 213-215.
Eggers, Jerry R., "Videotape Micro-Teaching in I-A Teacher Education," School Shop, (April, 1968), 96-97.
Fortune, Jim C., "Toward a Research Strategy to Investigate Attributes of Teacher BehaviorThe High School Journal, 51 (November, 1967) , 93-95*
Foster, F. Gordon, "Micro-Teaching," Arizona Teacher, 55 (May, 1967), 12-13. "
Fricke, B. G., "Prediction, Selection, Mortality, and Quality Control," College and University. 56 (1956), 3^-52.
Garrett, H. F., "A Review and Interpretation of Investigations of Factors Related to Scholastic Success in College of Arts and Sciences and Teachers Colleges," Journal of Experimental Education. 18 (19^9), 91-138.
Garverick, C. M., "Retention of School Learning as Influenced by Selective Affective Tone Variables," Journal of Educational Psychiatry. 55 (196k)t 31-3^.
Gulo, E. Vaugh, "University Students* Attitudes as Measured by the Semantic Differential," Journal of Educational Research. 60 (December, 1966), 31-3^*
Holt, Leland and Manford Sonstegard, "Relating Self-Conception to Curriculum Development," Journal of Educational Research. 58 (April, 1965) , 3 -8-351.
Levine, Jerome M. and Gardner Murphy, "The Learning and Forgetting of Controversial Material," Journal of Abnormal and Social Psychology. 38 (October, 19^3), 507-517.
Lowrey, William C., "Some Innovations in the Professional * Preparation of Teacher," Arithmetic Teacher, 15 (December,
1968), 727-73^.
Mayhugh, Samuel L.,"Micro-Teaching—A Major Component of the Pre-Service Program," Contemporary Education, 39 (March. 1968), 206-210. "

77
Meier, John H.t "Rationale for and Application of Micro-Training to Improve Teaching," The Journal of Teacher Education, XIX (Summer, 1968), U+5-157.
Moss, C. Scott, "Current and Projected Status of the Semantic Differential," The Psychological Record, X (January, I960), 47-53.
Neidt, Charles 0, and Dalva E. Hedlund, "The Relationship between Changes in Attitudes toward a Course and Final Achievement," Journal of Educational Research, 61 (October, 1967)* 56-58.
Osgood, C. E. and Percy H. Tannenbaum, "The Principle of Congruity in the Prediction of Attitude Change," Psychological Review, 62 (1955)» 43-55*
Purpel, David E., "Student Teaching," The J ournal of Teacher Education, XVIII (Spring, 1967) , 20-23.
Reynard, Harold E., "Pre-Service and In-Service Education of Teachers," Review of Educational Research, XXXIII (October, 1963), 339-380.
Rosen, Sidney, "Innovations in Teaching Science—A Historical View," School Science and Mathematics, LX1II (April, 1963), 313-323.
Schaefer, Martin and Marian H. Stromquist, "Micro-Teaching at Eastern Illinois University," Audiovisual Instruction, 12 (December, 1967), 61-64,
Soy, Eloise Mariane, "Attitudes of Prospective Elementary Teachers toward Science as a Field of Specialty," School Science and Mathematics, LXIII (June, 1967)* 507-517.
Staats, A. and C. Staats, "Attitudes Established by Classical Conditioning," Journal of Abnormal and Social Psychology, LVII (1958), 37-56.
Sweatman, Charles, "Operation: New Outlook of a Self-Assess-ment Method for Helping Teachers Change Their Behavior," The Clearing House, XLI (October, i 9 6 0 ) , 67-73 .
Victor, Edward, "Why Are Our Elementary School Teachers Reluctant to Teach Science?" Science Education, 47 (March, 1962), 185-192.

78
Waetjen, Walter B., "Recent Analyses of Teaching," The Bulletin of the National Association of Secondary School Principals, 5° (December, 193^), 17-29.
Washton, Nathan S., "Improving Elementary Teacher Education in Science," Science Education, 5 (February, 1961), 33.3^.
Williams, Chester S.f R. Merwin Deever and Edward B. Flynn, Jr., "Professional Laboratory Experiences in Oklahoma," The Journal of Teacher Education. VXI (December, I960), ^ - 5 0 5 .
Winter, Stephen S., "Model Programs for the Education of Teachers in Science," Journal of Research in Science Teaching. 3 (1965). 99-106.
Microfiche?
Allen, Dwight W., Fred J. McDonald and Michael E. J.Orme, "Effects of Feedback and Practice Conditions on the Acquisition of a Teaching Strategy," ERIC ED 013 79^» 1967.
Baird, J. High and others, "Micro-Teaching at Brigham Young University," ERIC ED Oil 260, 1967.
Belt, W. DeWayne, "Micro-Teaching—Observed and Critiqued by a Group of Trainees," ERIC ED Oil 890, 1967.
Kallenback, Warren, "Microteaching as a Teaching Methodology," ERIC ED 013 791, 1968.
Unpublished Materials
Banks, William Henry, "Practices in the Preparation of Elementary Teacher for the Teaching of Science," unpub-lished doctoral dissertation, The Ohio State University, Columbus, Ohio, 1965.
Hardin, Henry Normal, "An Analysis of Selected Aspects of the Science Preparation, of Prospective Elementary Teachers
* at the University of Miami," unpublished doctoral dis-sertation, University of Miami, Miami, Florida, 1965.
Hines, Sallylee Hughes, "A Study of Certain Factors Which Affect the Opinions of Elementary School Teachers in the Teaching of Science," unpublished doctoral dissertation, Oklahoma State University, Stillwater, Oklahoma, 1966.

79
Kirk, Jeffrey, "Effects of Teaching the Minnesota System of Interaction Analysis to Intermediate Grade Student Teachers," unpublished doctoral dissertation, Temple University, Philadelphia, Pennsylvania, 1964.
Lerner, Marjorie Sabbath, "An Investigation of the Status of the Methods Course in Elementary School Science in Selected Teacher-Training Institutes," unpublished doctoral dissertation, Northwestern University, Chicago, Illinois, 1964.
Government Publications
Flandersj Ned A., "Teacher Influence, Pupil Attitudes, and Achievement," Cooperative Research Monograph No. 12. United States Department of Health, Education, and Welfare, Office of Education, United States Government Printing Office, Washington, 1965.
Publications of Learned Organizations
American Association for the Advancement of Science, Science i Process Approach. New York, Xerox, Educational Division, X967 •
Henry, Nelson B,, editor, Rethinking Science. Fifty-Ninth Yearbook of the National Society for the Study of Education, Part I, Chicago, Illinois, The University of Chicago Press, i960.
Zim, Herbert S., Science for Child and Teacher. Washington, D. C., Association for Childhood International, 1953.
Mimeographed Materials
Allen, Dwight W. and others, Microteaching} A Description. School of Education, Stanford, University, Stanford, California, 1967.