the electricity, gas and water supply industry, 2019
TRANSCRIPT

IMPROVING LIVES THROUGH DATA ECOSYSTEMS ELECTRICITY, GAS & WATER SUPPLY INDUSTRY, 2019
The electricity, gas and water supply industry, 2019An exploration of electricity production, employment, finances, and South Africa’s energy mix
Risenga MalulekeStatistician-General2 September 2021

IMPROVING LIVES THROUGH DATA ECOSYSTEMS ELECTRICITY, GAS & WATER SUPPLY INDUSTRY, 2019
What is this survey about?

IMPROVING LIVES THROUGH DATA ECOSYSTEMS ELECTRICITY, GAS & WATER SUPPLY INDUSTRY, 2019
The survey: Taking a look under the hood
Enterprises registered for VAT that are engaged in the following activities:• Generation,
transmission and distribution of electricity
• Manufacturing and distribution of gaseous fuels through mains
• Collection, purification and distribution of water
Who was included? What did it measure?
• Questionnaires were completed for the financial year ended on any date between 1 July 2018 and 30 June 2019
• Employment figures are for 30 June 2019
• The survey was also conducted in 2006, 2010, 2013 and 2016
• Finances (including capital expenditure)
• Details of purchases, employment and services rendered
• Provincial distribution of employment, salaries and wages, and sales of goods and services
• ICT usage
When was it conducted?

IMPROVING LIVES THROUGH DATA ECOSYSTEMS ELECTRICITY, GAS & WATER SUPPLY INDUSTRY, 2019
The survey: Taking a look under the hood
• General objective: To collect financial and quantitative information that is essential for planning and policy formulation
• For external users of Stats SA data: To generate information on the size, structure and nature of the industry
• For internal use: Mainly used for benchmarking the gross domestic product (GDP) and its components
Why was it conducted?

IMPROVING LIVES THROUGH DATA ECOSYSTEMS ELECTRICITY, GAS & WATER SUPPLY INDUSTRY, 2019
5key facts from
the survey
Fact #1
Fact #2
Fact #3
Fact #4
Fact #5

IMPROVING LIVES THROUGH DATA ECOSYSTEMS ELECTRICITY, GAS & WATER SUPPLY INDUSTRY, 2019
South Africa is producing less
electricity
Fact #1
Fact #2
Fact #3
Fact #4
Fact #5

IMPROVING LIVES THROUGH DATA ECOSYSTEMS ELECTRICITY, GAS & WATER SUPPLY INDUSTRY, 2019
0
50 000
100 000
150 000
200 000
250 000
300 000
2010 2013 2016 2019
Gig
awat
t-hou
rsFact #1: South Africa is producing less electricityThe country generated less electricity in 2019 than it did in 2010 and 2013Electricity generated
Source: Electricity, gas and water supply industry, Report No. 41-01-02 (2019). Table F

IMPROVING LIVES THROUGH DATA ECOSYSTEMS ELECTRICITY, GAS & WATER SUPPLY INDUSTRY, 2019
Fact #1: South Africa is producing less electricityIn 2020, the country generated less electricity that it did in 2004The decline in electricity production is confirmed by Stats SA’s monthly Electricity generated and available for distribution release
150 000
170 000
190 000
210 000
230 000
250 000
270 000
290 000
2000 2001 2002 2003 2004 2005 2006 2007 2008 2009 2010 2011 2012 2013 2014 2015 2016 2017 2018 2019 2020
Ggi
gaw
att-h
ours
244 605 GWh 239 459 GWh
Source: Electricity generated and available for distribution, June 2021. Based on Table 7

IMPROVING LIVES THROUGH DATA ECOSYSTEMS ELECTRICITY, GAS & WATER SUPPLY INDUSTRY, 2019
The industry is employing fewer
people
Fact #1
Fact #2
Fact #3
Fact #4
Fact #5

IMPROVING LIVES THROUGH DATA ECOSYSTEMS ELECTRICITY, GAS & WATER SUPPLY INDUSTRY, 2019
Fact #2: The industry is employing fewer peopleThe 2016 and 2019 surveys recorded a decline in the number of employees Number of employees in the electricity, gas & water supply industry
42 117
51 237
58 485 57 784 55 796
2006 2010 2013 2016 2019
Source: Electricity, gas and water supply industry, Report No. 41-01-02 (2019). Table C and Electricity, gas and water supply industry, Report No. 41-01-02 (2006). Table 8

IMPROVING LIVES THROUGH DATA ECOSYSTEMS ELECTRICITY, GAS & WATER SUPPLY INDUSTRY, 2019
Fact #2: The industry is employing fewer peopleThe decline in jobs occurred in the electricity generation sectorBreakdown of the number of employees in the electricity, gas & water supply industry by type of service, 2016 and 2019
Source: Electricity, gas and water supply industry, Report No. 41-01-02 (2019). Table C

IMPROVING LIVES THROUGH DATA ECOSYSTEMS ELECTRICITY, GAS & WATER SUPPLY INDUSTRY, 2019
Fact #2: The industry is employing fewer peopleSix provinces recorded a fall in the number of employeesBreakdown of the number of employees in the electricity, gas & water supply industry by province
Source: Electricity, gas and water supply industry, Report No. 41-01-02 (2019). Table 20 and Table 21
0
5 000
10 000
15 000
20 000
25 000
GP MP WC KZN FS LP EC NW NC
2016 2019

IMPROVING LIVES THROUGH DATA ECOSYSTEMS ELECTRICITY, GAS & WATER SUPPLY INDUSTRY, 2019
Fact #2: The industry is employing fewer peopleConstruction is the only other industry that recorded a decrease in employment over this periodNet gain or loss in the number of employees as reported by Stats SA’s Quarterly Employment Statistics survey, Q2: 2019 compared with Q2: 2016
Source: Quarterly Employment Statistics (QES). ‘QES Details_BreakDown_200909_202103’ Excel file

IMPROVING LIVES THROUGH DATA ECOSYSTEMS ELECTRICITY, GAS & WATER SUPPLY INDUSTRY, 2019
Fact #2: The industry is employing fewer peopleMales still dominate the industry, although the share of male employees has declined over the yearsPercentage breakdown of the workforce by male and female, 2010‒2016
Source: Electricity, gas and water supply industry, Report No. 41-01-02 (2019). Table 10
71% (36 205)
70% (40 845)
68% (39 045)
67% (37 105)
29% (15 032)
30% (17 640)
32% (18 739)
33% (18 691)
2010
2013
2016
2019

IMPROVING LIVES THROUGH DATA ECOSYSTEMS ELECTRICITY, GAS & WATER SUPPLY INDUSTRY, 2019
South Africa’s energy mix is shifting away
from coal
Fact #1
Fact #2
Fact #3
Fact #4
Fact #5
IMPROVING LIVES THROUGH DATA ECOSYSTEMS ELECTRICITY, GAS & WATER SUPPLY INDUSTRY, 2019
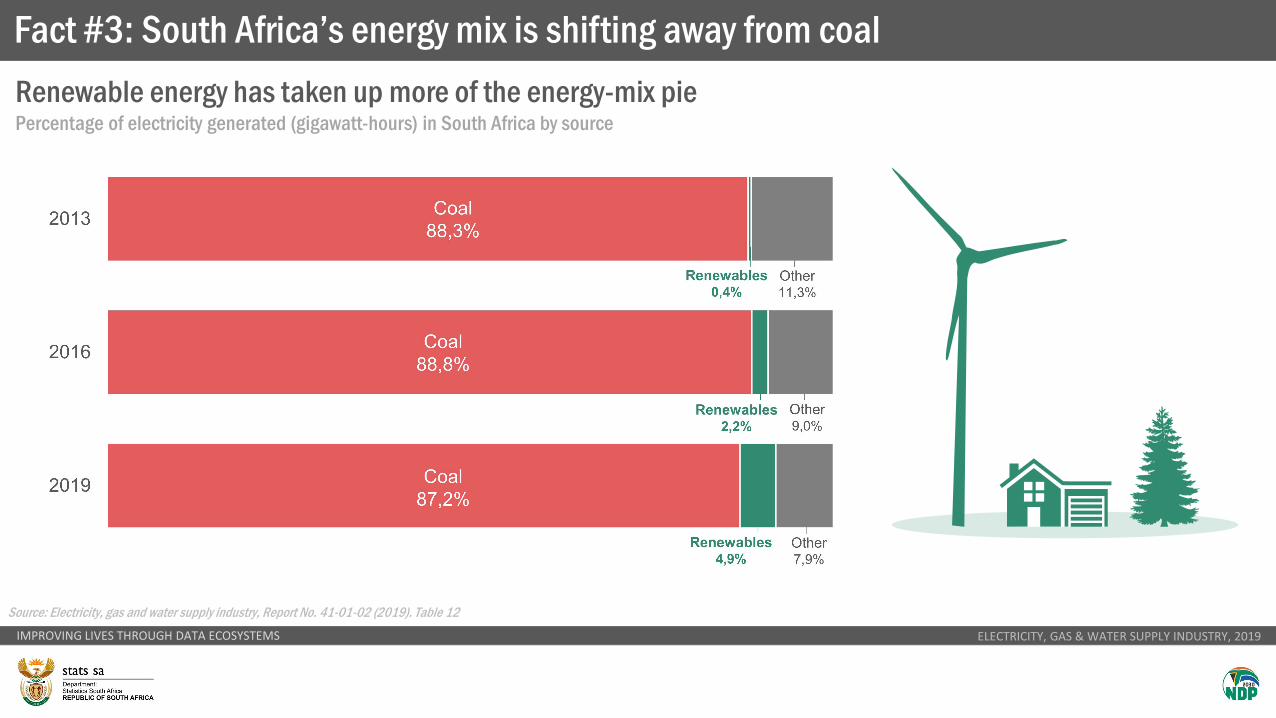
Fact #3: South Africa’s energy mix is shifting away from coalRenewable energy has taken up more of the energy-mix piePercentage of electricity generated (gigawatt-hours) in South Africa by source
Source: Electricity, gas and water supply industry, Report No. 41-01-02 (2019). Table 12

IMPROVING LIVES THROUGH DATA ECOSYSTEMS ELECTRICITY, GAS & WATER SUPPLY INDUSTRY, 2019
Fact #3: South Africa’s energy mix is shifting away from coalThere has been a significant decline in the use of dieselSouth Africa consumed the equivalent of 212 Olympic-size pools of diesel in 2019 to generate electricity, down from 534 in 2016
2013 2016 2019
596 million litres
238Olympic-size pools
1 336 million litres
534Olympic-size pools
531 million litres
212Olympic-size pools
Source: Electricity, gas and water supply industry, Report No. 41-01-02 (2019). Table 14

IMPROVING LIVES THROUGH DATA ECOSYSTEMS ELECTRICITY, GAS & WATER SUPPLY INDUSTRY, 2019
Fact #3: South Africa’s energy mix is shifting away from coalNatural gas dominates piped gas Percentage breakdown of gas distribution (in terajoules) in South Africa, 2019
Source: Electricity, gas and water supply industry, Report No. 41-01-02 (2019). Table 16
Natural gas88%
Methane-rich gas12%
Synthetic gas0,1%
185 380terajoules

IMPROVING LIVES THROUGH DATA ECOSYSTEMS ELECTRICITY, GAS & WATER SUPPLY INDUSTRY, 2019
Municipalities are the biggest
customers
Fact #1
Fact #2
Fact #3
Fact #4
Fact #5

IMPROVING LIVES THROUGH DATA ECOSYSTEMS ELECTRICITY, GAS & WATER SUPPLY INDUSTRY, 2019
Fact #4: Municipalities are the biggest customersJust over two-fifths of electricity sales are to redistributors (mainly municipalities)Percentage breakdown of electricity sales by type of customer, 2019 (Total: R230,8 billion)
Source: Electricity, gas and water supply industry, Report No. 41-01-02 (2019). Table 13
Redistributors (mainly municipalities)
42%
Industrial20%
Mining12%
Residential9%
Commercial8%
Agri-culture
4%
Expor-ted4%
Other 2%

IMPROVING LIVES THROUGH DATA ECOSYSTEMS ELECTRICITY, GAS & WATER SUPPLY INDUSTRY, 2019
Fact #4: Municipalities are the biggest customersOver two-thirds of water sales are to redistributors (mainly municipalities)Percentage breakdown of water sales by type of customer, 2019 (Total: R31,6 billion)
Source: Electricity, gas and water supply industry, Report No. 41-01-02 (2019). Table 18
Redistributors (mainly municipalities)
68%
Households14%
Commer-cial7%
Other5%
Mining3%
Agriculture2%
Industry1%
IMPROVING LIVES THROUGH DATA ECOSYSTEMS ELECTRICITY, GAS & WATER SUPPLY INDUSTRY, 2019
Industry profits have declined
Fact #1
Fact #2
Fact #3
Fact #4
Fact #5

IMPROVING LIVES THROUGH DATA ECOSYSTEMS ELECTRICITY, GAS & WATER SUPPLY INDUSTRY, 2019
Fact #5: Industry profits have declined
The industry made a loss in 2019Dragged lower by a loss recorded by electricity generation
-15
-5
5
15
25
35
Electricity generation Gas supply Water supply Entire industry
Prof
it m
argi
n (%
)
2010 2013 2016 2019
Source: Electricity, gas and water supply industry, Report No. 41-01-02 (2019). Table B

IMPROVING LIVES THROUGH DATA ECOSYSTEMS ELECTRICITY, GAS & WATER SUPPLY INDUSTRY, 2019
Fact #5: Industry profits have declined
Income and spending has gone up, but capital expenditure has fallen
0
50 000
100 000
150 000
200 000
250 000
300 000
350 000
2010 2013 2016 2019
R m
illion
Income Expenditure Capital expenditureSource: Electricity, gas and water supply industry, Report No. 41-01-02 (2019)

IMPROVING LIVES THROUGH DATA ECOSYSTEMS ELECTRICITY, GAS & WATER SUPPLY INDUSTRY, 2019
Overview

IMPROVING LIVES THROUGH DATA ECOSYSTEMS ELECTRICITY, GAS & WATER SUPPLY INDUSTRY, 2019
Fact #1: South Africa is producing less electricity
Fact #2: The industry is employing fewer people
Fact #3: South Africa’s energy mix is shifting away from coal
Fact #4: Municipalities are the biggest customers
Fact #5: Industry profits have declined

IMPROVING LIVES THROUGH DATA ECOSYSTEMS ELECTRICITY, GAS & WATER SUPPLY INDUSTRY, 2019
Electricity, gas and water supply industry
2019